Article

Deep Learning- and Multi-Point Analysis-Based Systematic Deformation Warning for Arch Dams

1
SPIC Dam Management and Pumped Storage Development Center, Xi’an 716000, China
2
Large Dam Safety Supervision Center, National Energy Administration, Hangzhou 311122, China
*
Author to whom correspondence should be addressed.
Infrastructures 2025, 10(7), 170; https://doi.org/10.3390/infrastructures10070170
Submission received: 15 May 2025 / Revised: 27 June 2025 / Accepted: 1 July 2025 / Published: 3 July 2025
(This article belongs to the Topic Disaster Risk Management and Resilience)

Abstract

Deformation is a direct manifestation of structural changes that occur during the operation of arch dams, and the development of reliable deformation early warning indicators allows for their timely study. Considering that an arch dam is a systematic overall structure, it is necessary to systematically analyze the formulation of deformation early warning indicators and general early warning methods for this dam type. To this end, this study innovatively proposes a systematic early warning method for arch dams based on deep learning and a multi-measurement point analysis strategy. Firstly, the causal model (HST) is utilized to extract the environmental factors as convolutional neural network (CNN) array samples, and the absolute deformation residual sequences of multiple points are obtained by HST-MultiCNN. Secondly, combining this with principal component analysis, a systematic deformation residual index with multiple points is established. Then, the kernel function is used to simulate the distribution of the abovementioned indicators, and is combined with the idea of small probability to formulate the overall warning indicator. Finally, the Re-CNN strategy is used to train the mapping relationship between the multi-objective residuals and the system indicators, and the mapping relationship outlined above is then used to obtain the system indicators corresponding to real-time prediction values, which in turn determine the overall deformation state of arch dams. Analysis shows that the RMSE of the deformation output of the proposed monitoring method uses a value between 0.2284 and 0.2942, with satisfactory accuracy, and the overall deformation warning accuracy reaches 100%, which is significantly better than the comparison method, and effectively solves the primary defect of the traditional single-point analysis—failure to reflect the overall deformation condition.

1. Introduction

A reasonable evaluation of the structural state of arch dams can help the operational status of a project to be timely judged, e.g., to establish appropriate structural monitoring, structural diagnosis, or inverse analysis models [1,2]. As the most intuitive physical expression of the structural state of arch dams [3], changes in dam structures can be directly assessed through deformation. Therefore, effective analysis of deformation can allow the operating condition of the dam at a specific time to be grasped [4], providing managers with a reliable decision-making reference. At present, the deformation analysis of arch dams is mainly gathered in the deformation prediction through the construction of prediction models applicable to different dam types to analyze the deformation and then the development trend in the future. On the basis of an accurate deformation predictive analysis, if a systematic deformation early warning method for arch dams can be developed, the overall real-time study of the project operation status can improve the efficiency of early warning systems.
With the rapid development of computer technology and various algorithms [5], the methods used for dam deformation analysis have been updated. The deformation prediction model has gradually become a precondition for the formulation of monitoring indicators, and the three major categories of statistical models, traditional machine learning algorithms, and deep learning algorithms have gradually been formed [6,7,8]. Among them, the core idea of a statistical model is to construct a deterministic function model between hydraulic pressure, temperature, aging, and deformation [9], and to determine the parameters of each factor of the model through the concept of least squares. This statistical model has a long history of development, but its key defect is that it cannot reflect the nonlinear functional relationship between the influencing factors and the deformation; while it may be able to maintain a certain degree of accuracy in the fitting stage, its predictive performance for new data is not well realized, and the resulting early warning results are unreliable [10].
In order to solve the significant defects of the traditional statistical models, many scholars have attempted to apply machine learning algorithms to the field of dam deformation analysis; for example, Wen et al. [11] combined the support vector machine and the AdaBoost ensemble algorithm to predict the deformation behaviors of concrete-faced rockfill dams, which improved the accuracy of deformation prediction. Gu and Li et al. [12,13] utilized an improved Random Forest algorithm to establish the complex functional relationship between factors and deformation, and output a higher accuracy of deformation prediction. Gu et al. [14] utilized an improved extreme machine learning algorithm to establish a combined dam deformation prediction performance and achieved a better output accuracy. Su and Xing et al. [15,16] used different methods to improve the SVM and establish a dam deformation prediction model, respectively, and verified the effectiveness and superiority of the proposed methods. Meng et al. [17] used K-Means to achieve deformation clustering and then proposed an effective deformation prediction model using the Fractional-Order Gray model optimized using PSO. It can be seen that the application of machine learning in the field of dam deformation analysis greatly improves the efficiency and effectiveness of deformation monitoring and analysis.
As deep learning methods such as LSTM and CNN have emerged, various deep learning algorithms and their corresponding improved models have been gradually applied to modeling dam deformation analysis. For example, Sun et al. [18,19,20,21] improved and optimized the LSTM deep learning algorithm using the Gray Wolf algorithm, the CEEMDAN signal decomposition algorithm combined with a self-attention mechanism, the variable screening–DenseNet method, and improvements to the network architecture, achieving satisfactory deformation prediction results. Pan et al. [22,23,24] developed deformation prediction models based on deep learning algorithms such as CNN, MVMD-3D-CNN, and STL-CNN-GRU and on the principle of a convolutional neural network, further combining the deformation change characteristics, which significantly improved the deformation prediction accuracy. The application of deep learning expands the depth of dam deformation analysis from the traditional single modeling of the environmental factor–deformation nonlinear relationship toward the direction of deformation time series information mining, multi-measurement point deformation information mining, and deformation significant features adaptive mining. The application of deep learning algorithms can not only maximize the mining of various useful information embedded in these factors, but its powerful nonlinear learning ability also guarantees the accuracy of the deformation analysis.
However, predicting the future development trends of deformation does not determine whether real-time deformation is potentially risky; therefore, it is necessary to also set a threshold for the deformation amplitude of arch dams to realize effective early warnings for arch dam deformation, so that the deformation pattern can be investigated in advance and in time to avoid the occurrence of disasters. Traditional dam deformation early warning methods usually only analyze the deformation data for a single measurement point and then formulate single-point measurement deformation warning indicators; for example, Zhou et al. [25] proposed a hybrid warning interval (PI) construction method using the Kalman filter-based Kernel Extreme Learning Machine (KELM). Chen et al. [26,27] combined the parametric inversion analysis method and finite element simulation to obtain a better dam deformation warning indicator. Although a single-point measurement warning solves the deformation threshold setting problem to an extent, the following problems still exist: considering that an arch dam is a whole system structure, the coupling relationship between each part is complex, and a single-point measurement deformation warning does not consider the influence relationship between multiple measurement points, while the single-point analysis strategy cannot warn about the deformation state of the arch dam as a whole, and the analysis efficiency will be greatly reduced.
In summary, there is an urgent need to develop a systematic and holistic early warning model that can comprehensively consider the effects of coupling between the multiple measurement points of arch dams. To this end, this paper innovatively proposes a systematic deformation early warning method for arch dams based on deep learning and multi-measurement point analysis strategy. Firstly, the factors affecting the deformation are extracted according to the HST theory [28], and a CNN model is established for multiple measurement points [29,30], in which the factors are arranged in a two-dimensional array as the input sample set of the CNN. Then, the fitted values of the CNN model corresponding to each measurement point are compared with the real values to obtain the absolute deformation residuals of multiple measurement points. Utilizing the concept of principal components [31], the multi-measurement point deformation residuals are converted into the system deformation residual index (SDSI), and then combined with the kernel method [32,33] to formulate the distribution law of the system index, and utilize the concept of small probability to formulate the system deformation warning index. Finally, the nonlinear mapping relationship between the multi-measurement point residuals and the system residuals is learned through the RE-CNN method, the predicted value of the multi-measurement point deformation in the real-time phase is obtained through the HST-multiCNN algorithm to obtain the corresponding absolute deformation residuals, the index value is obtained through the trained mapping relationship, and the overall deformation of the arch dam is judged through a comparison with the warning indexes.
The remaining chapters of this paper are organized as follows: Section 2 shows the relevant theories involved in the proposed method, Section 3 shows the technical strategy used throughout the paper, Section 4 shows the engineering case studies, and Section 5 summarizes the proposed method.

2. Relevant Theories for the Proposed Methodology

2.1. Extraction of Arch Dam Deformation Influencing Factors Based on Causality Model

Dam deformation is mainly affected by three factors, namely, hydraulic pressure, temperature, and aging, in which the hydraulic pressure is determined by upstream water inflow, reservoir level, reservoir water specific gravity, etc., and temperature is determined by seasonal variations, meteorological conditions, and other factors. In view of this, it becomes necessary for mathematical modeling of dam deformation to refine a small number of factors that can reflect the dam deformation information among many influencing factors. Usually, the deformation Y of the observation point located on the dam can be composed of the above three deformation components, which are expressed as follows [34]:
Y = y h + y t + y θ
where y h , y t , and y θ are the displacements due to hydrostatic pressure, temperature change, and aging, respectively.
As an important factor in deformation, hydrostatic pressure can be expressed as a polynomial function of the reservoir level H above the dam base as follows:
y h = a 0 + i = 1 n a i H i
where a 0 and a i are regression parameters, which are obtained by the regression analysis method, and n denotes the number of hydraulic pressure factors, of which the corresponding values for gravity dams are generally 3, and those for arch dams are generally 4.
In the actual project, too many thermometers will lead to the deformation caused by this factor to be too complex to analyze, and the choice of thermometer is not performed on a clear basis, so the equivalent temperature is often used to indicate the temperature environment of the dam. The expression of the temperature component δ T is as follows:
δ T = i = 1 m b 1 i sin 2 π i t 365 + b 2 i cos 2 π i t 365
where i = 1 denotes the annual cycle, i = 2 denotes the semi-annual cycle, and the value of m is generally taken as 1 or 2.
During the normal operation of the arch dam, the deformation caused by aging is mainly manifested in the initial change in the dam, which follows a fast and gradually stabilized trend. The aging-induced deformation of the arch dam can be considered through different functional forms; in the present study, the following form is used to express the aging deformation δ θ .
δ θ = c 1 θ + c 2 ln θ
In summary, the complete expression of the dam deformation under environmental loading can be obtained as follows:
δ = i = 1 n a i H i + j = 1 2 b 1 j sin 2 π j t 365 + b 2 j cos 2 π j t 365 + c 1 θ + c 2 ln θ + χ
According to Equation (5), the environmental factors can be extracted as H ,   H 2 ,   H 3 ,   H 4 ,   sin 2 π t 365 ,   cos 2 π t 365 ,   sin 4 π t 365 ,   cos 4 π t 365 ,   θ ,   ln θ .

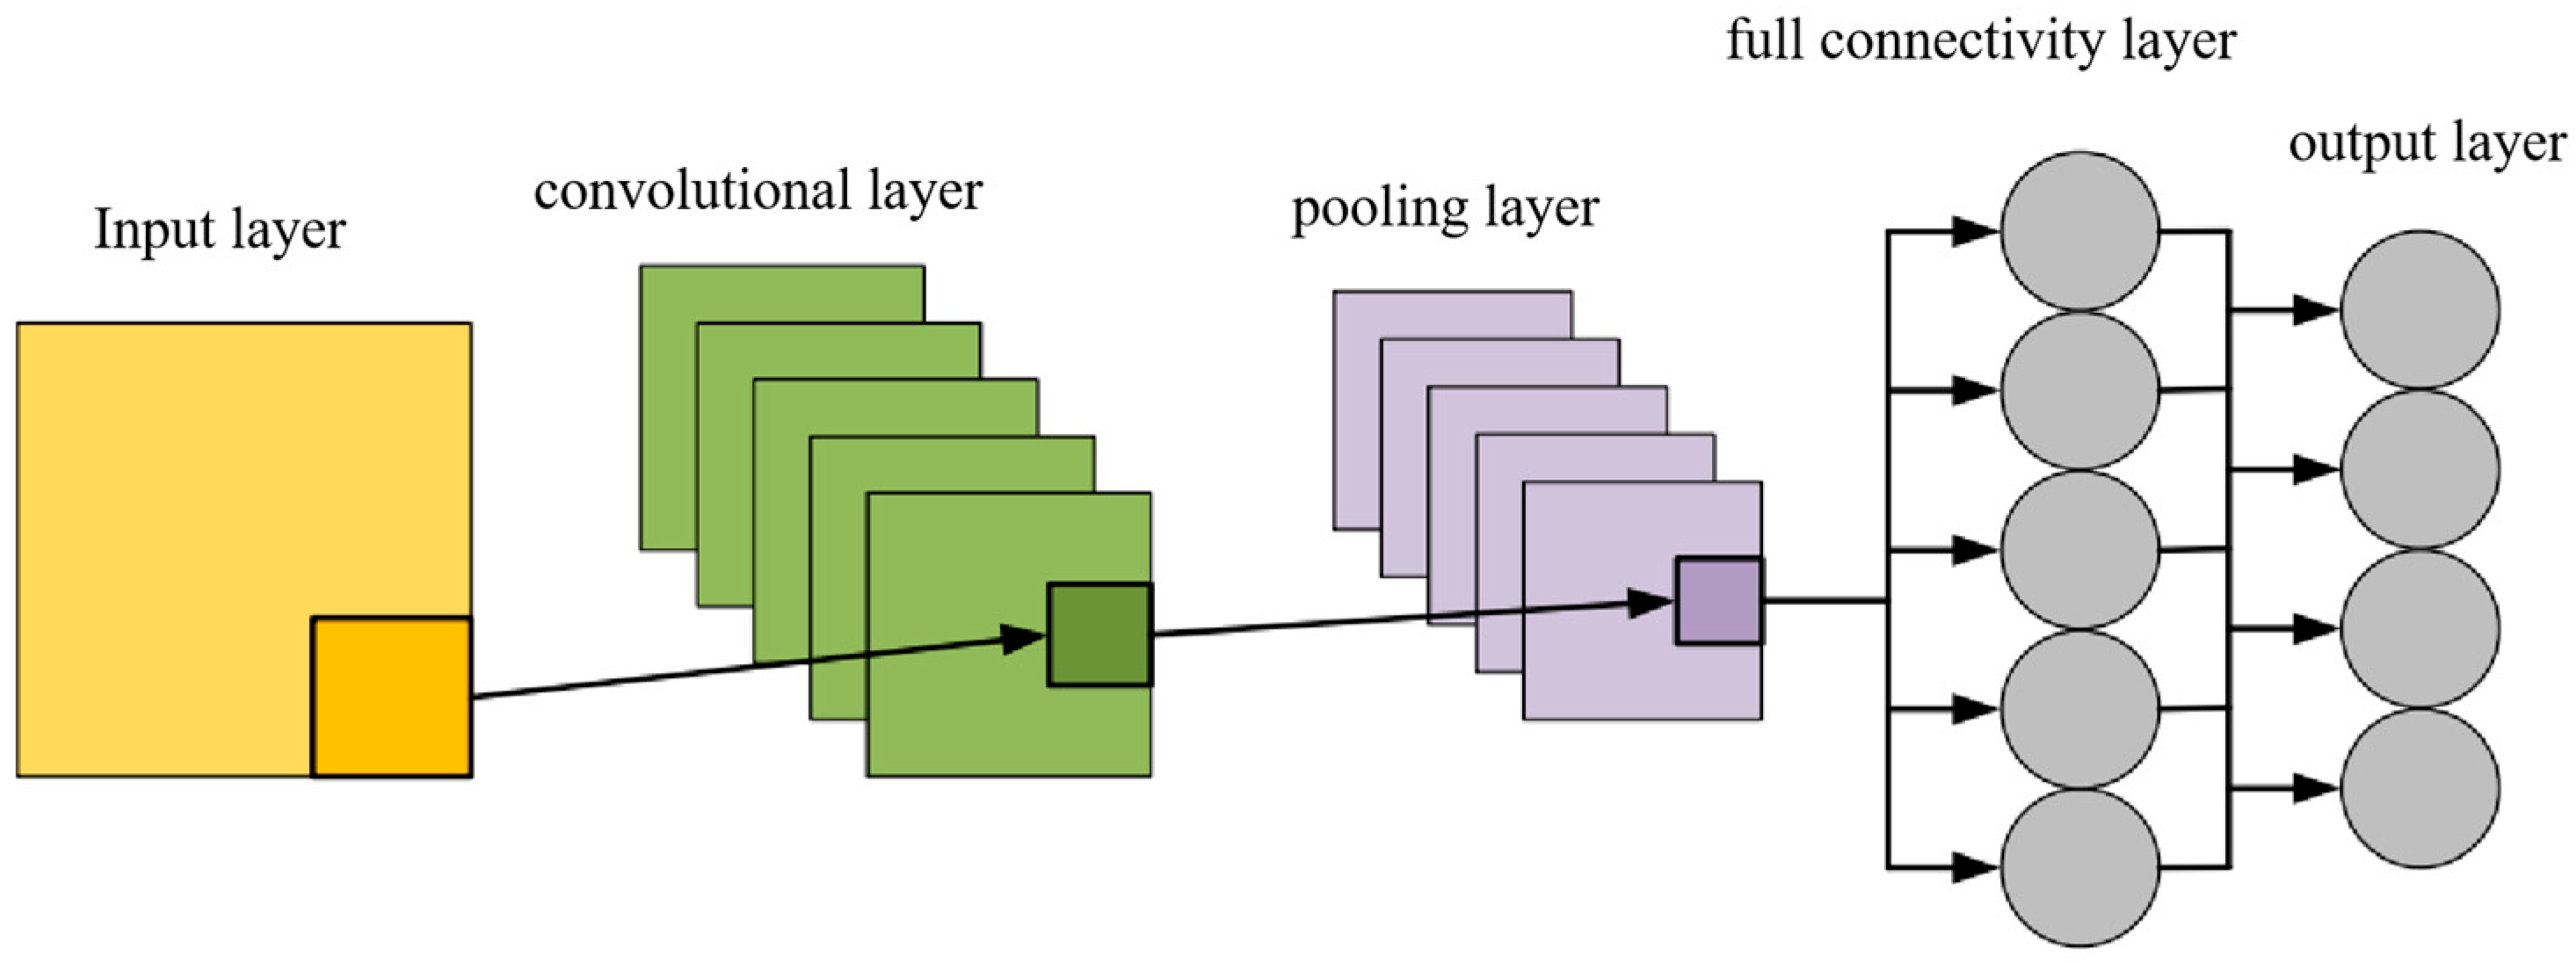
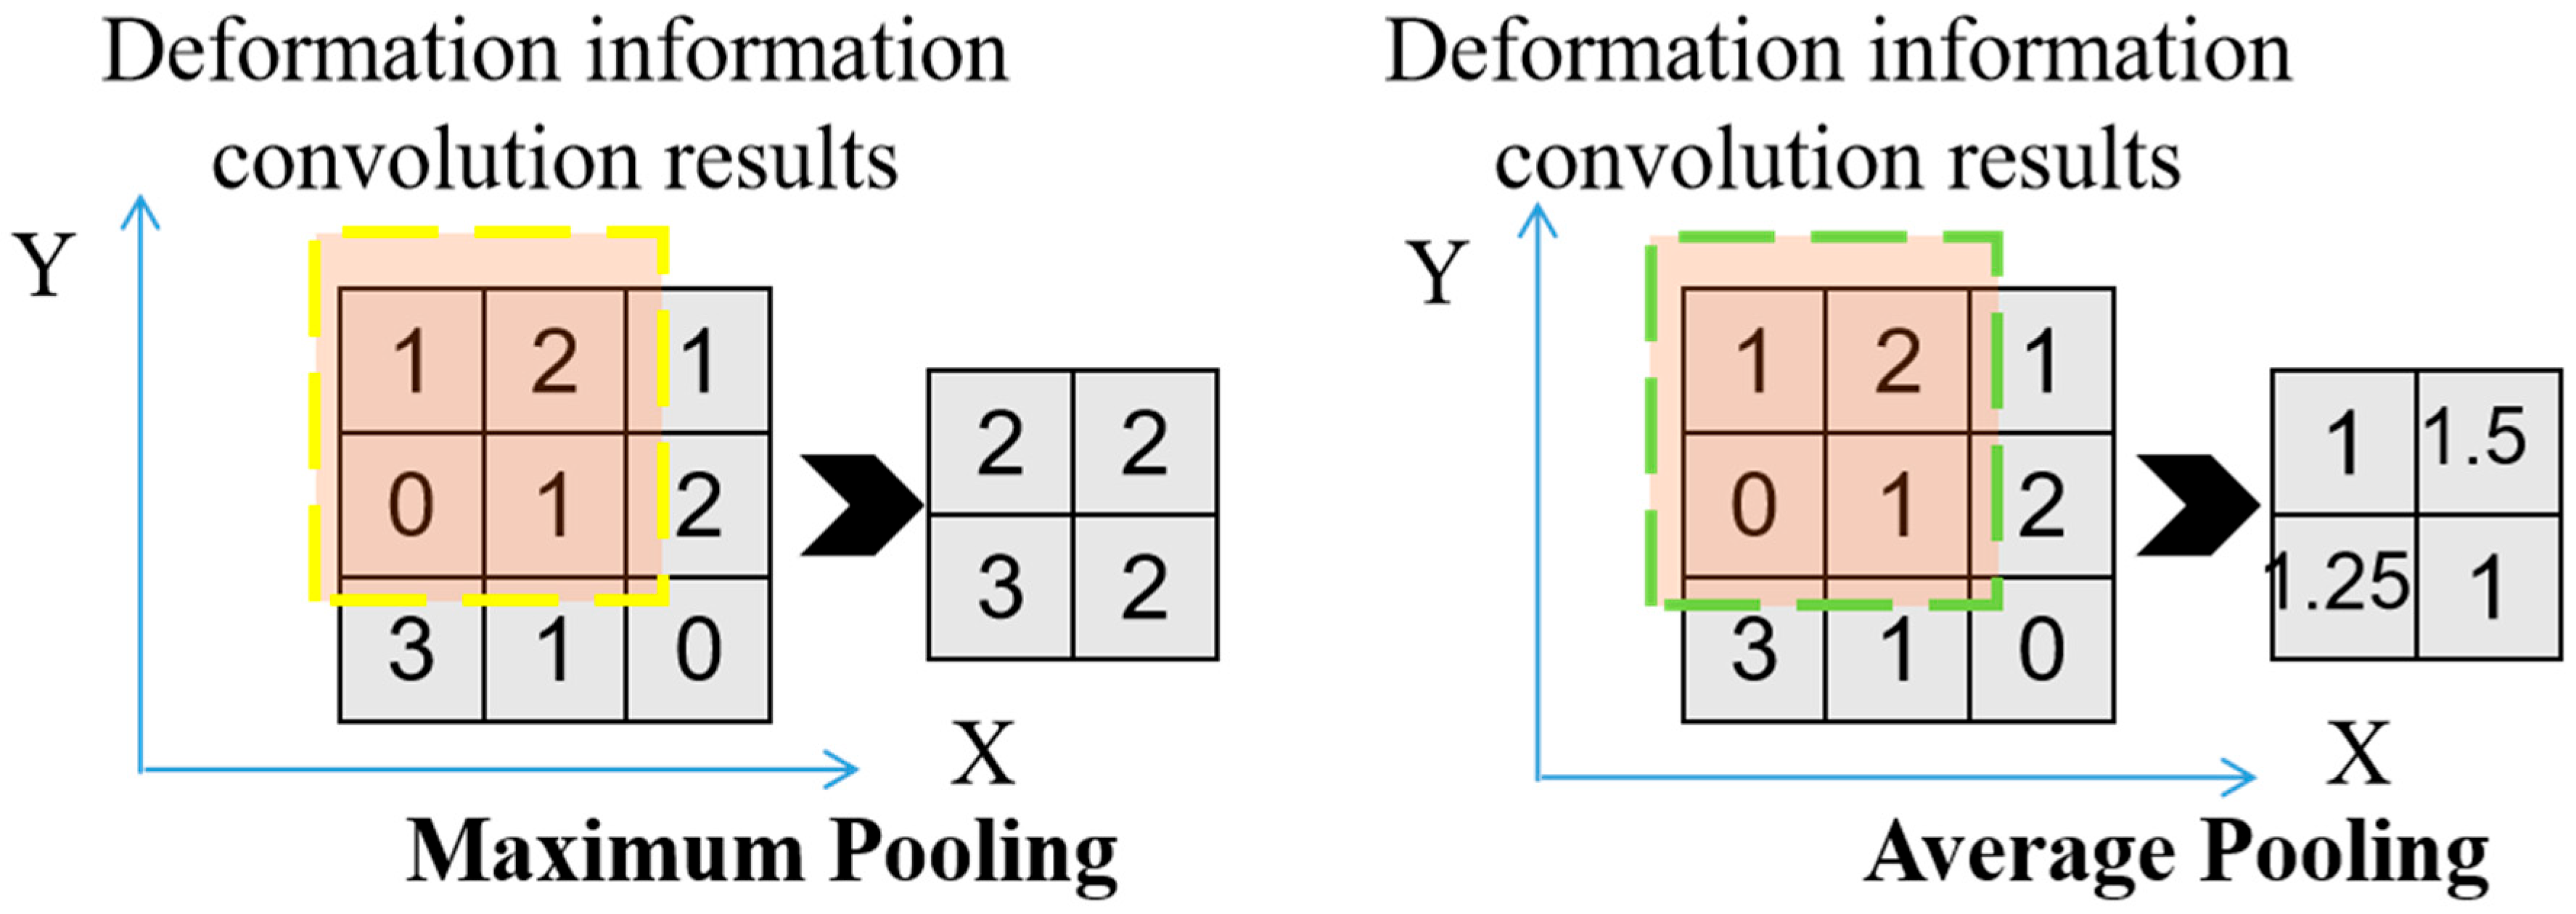
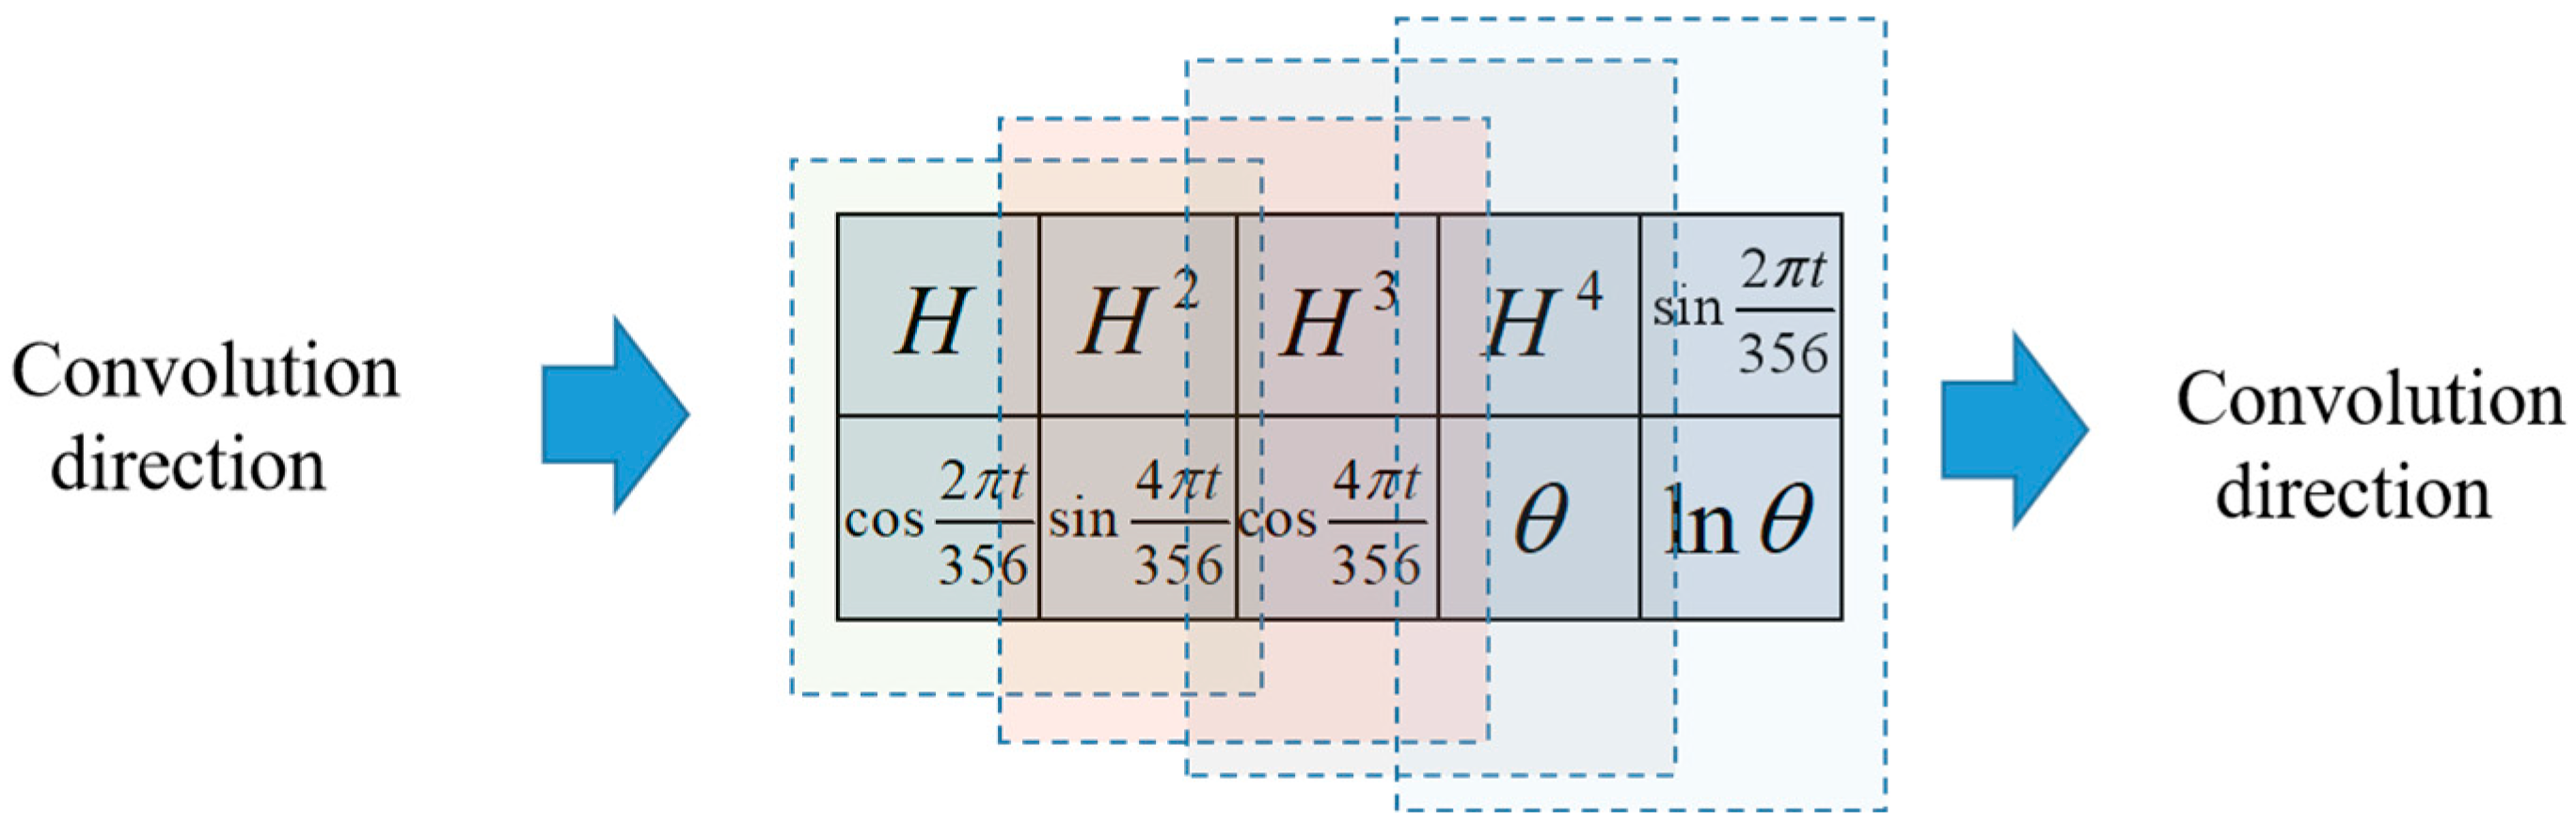
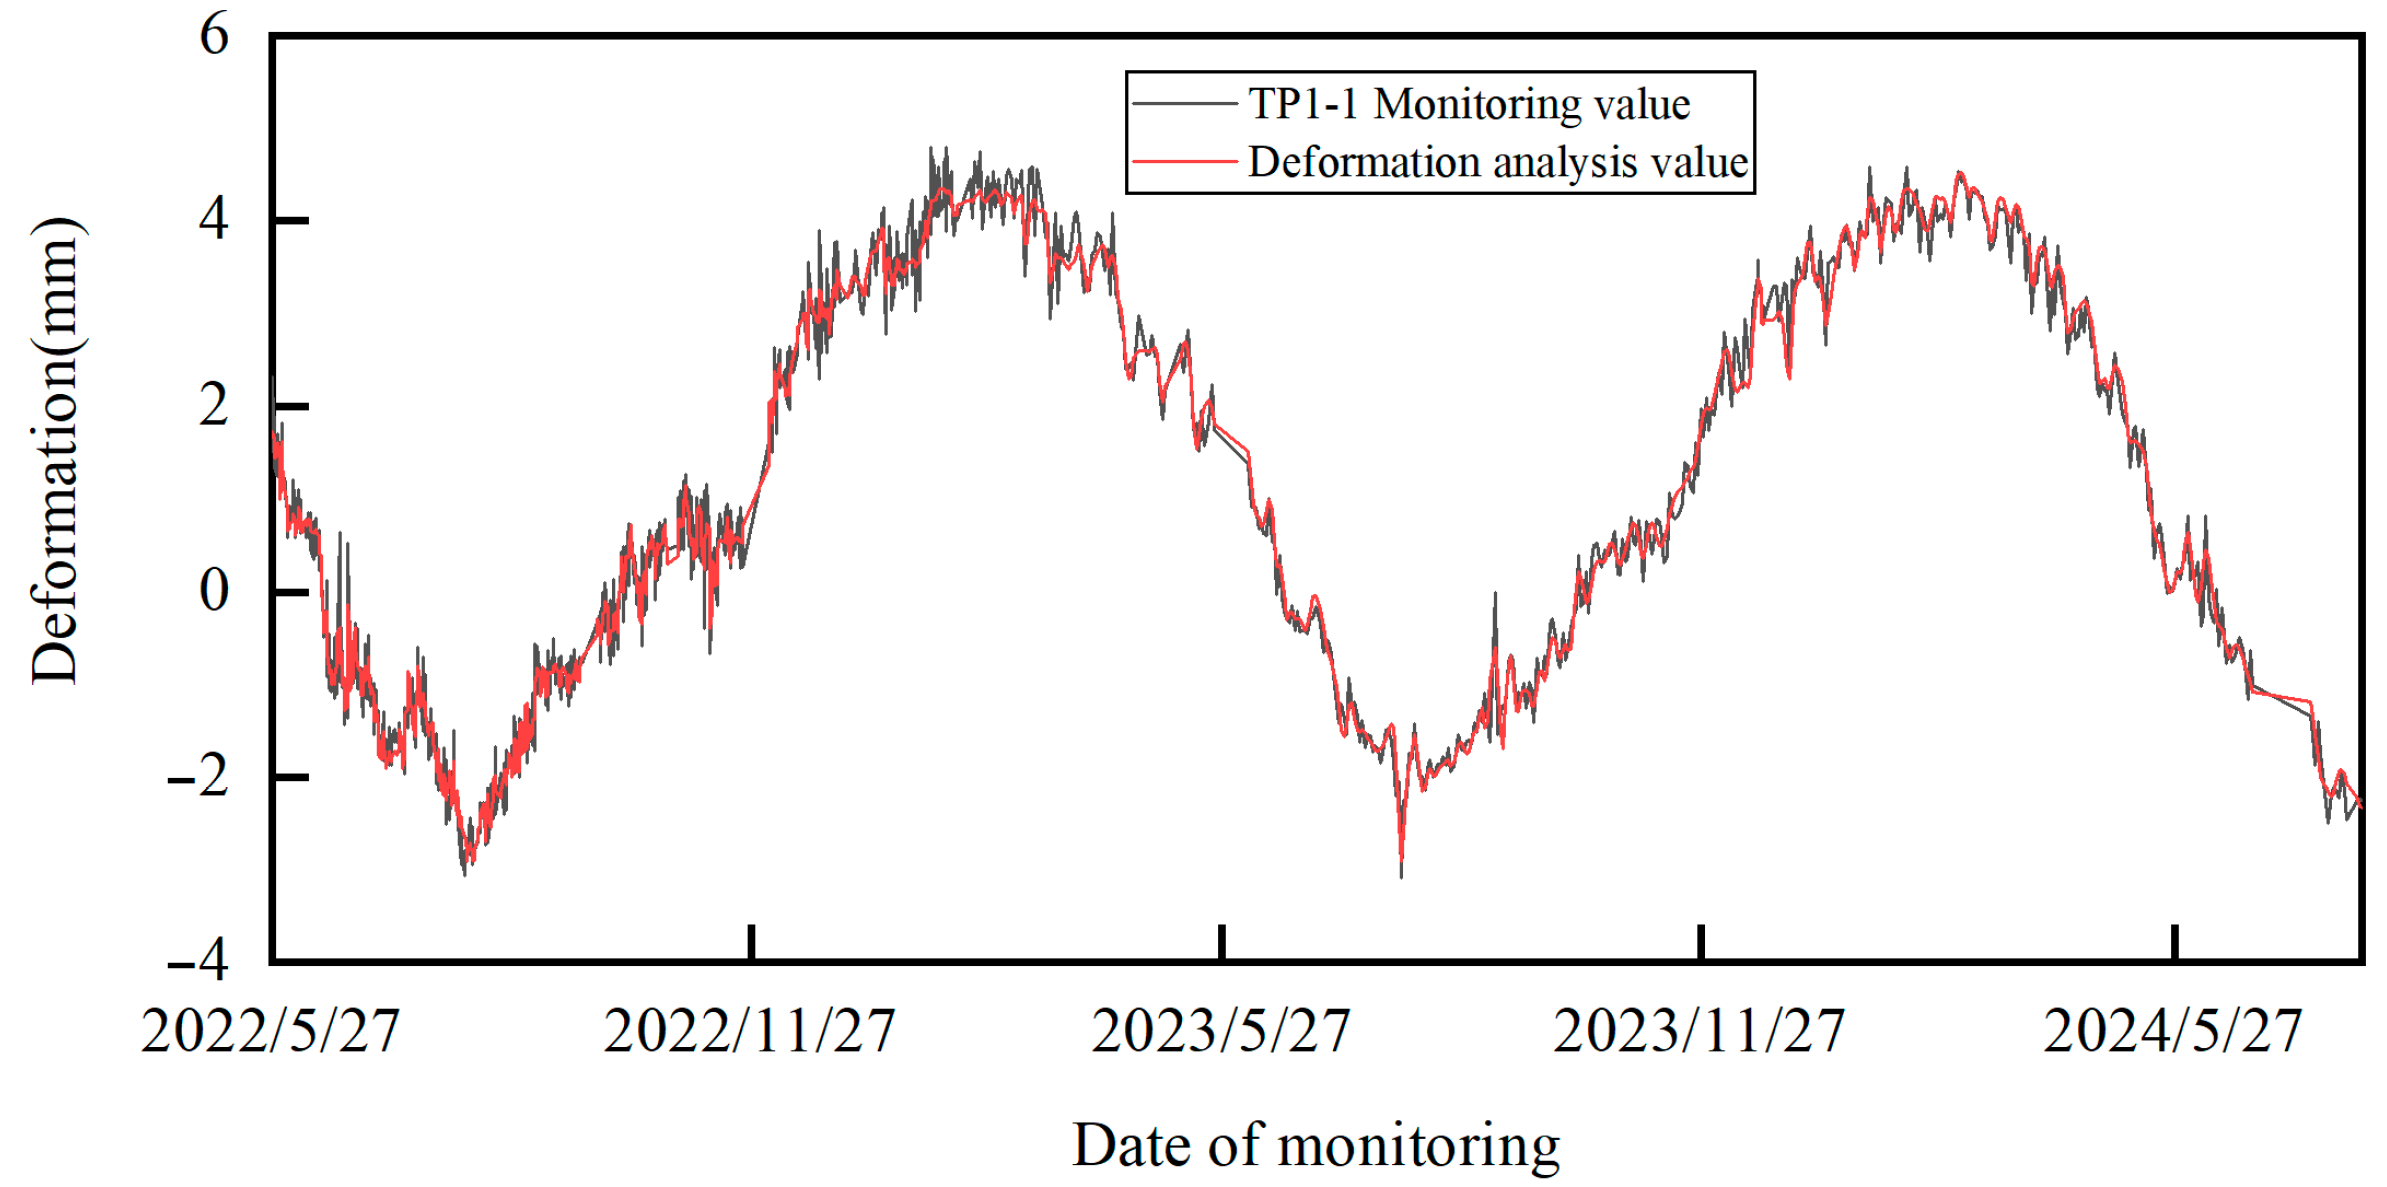
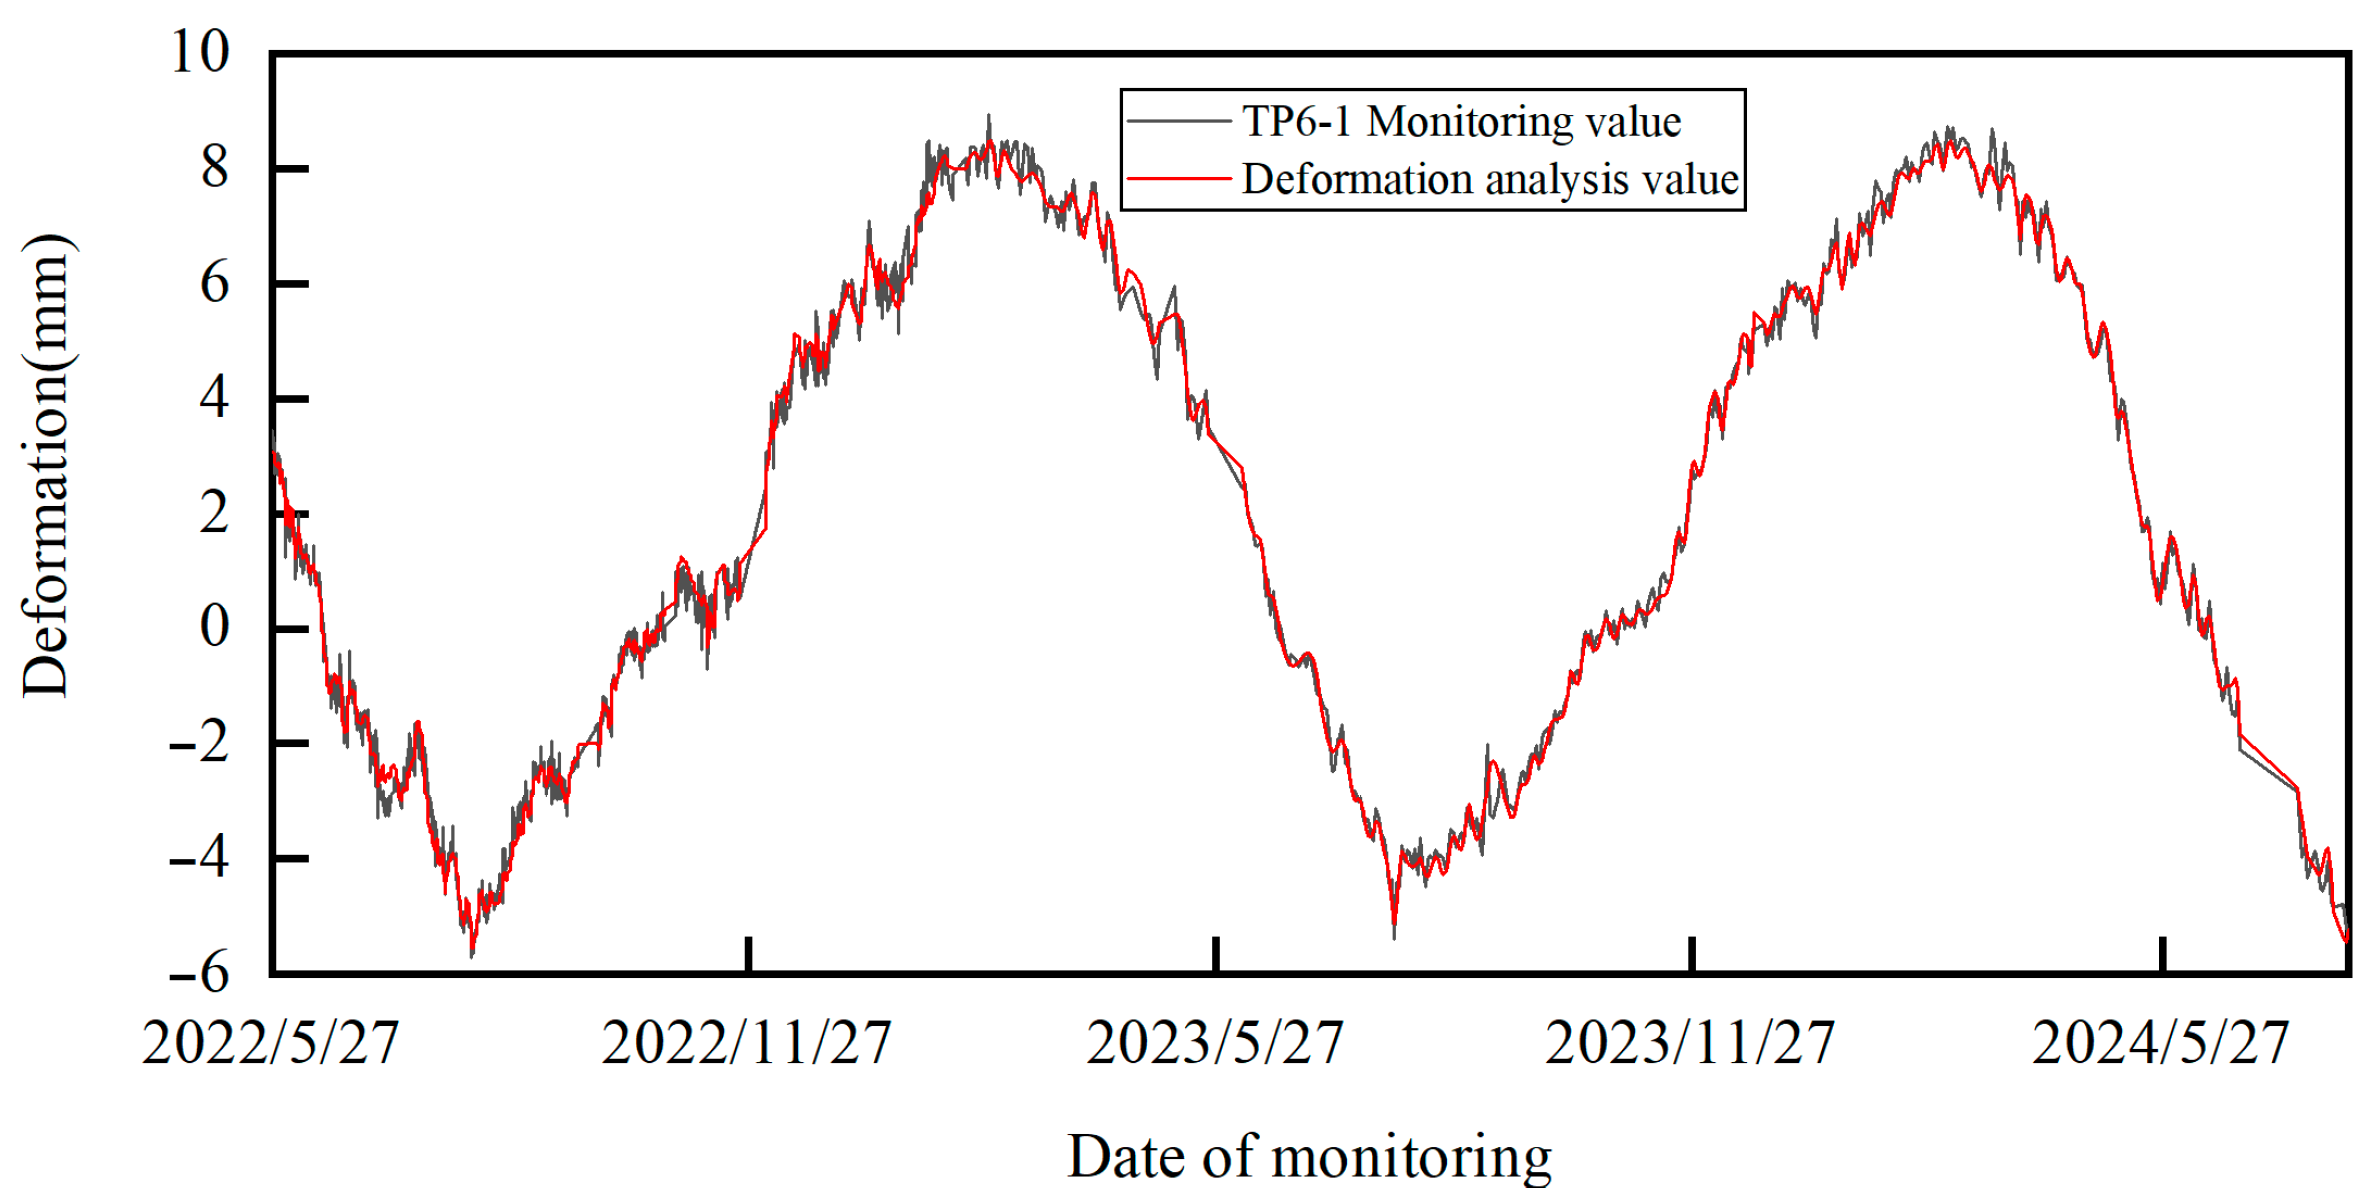
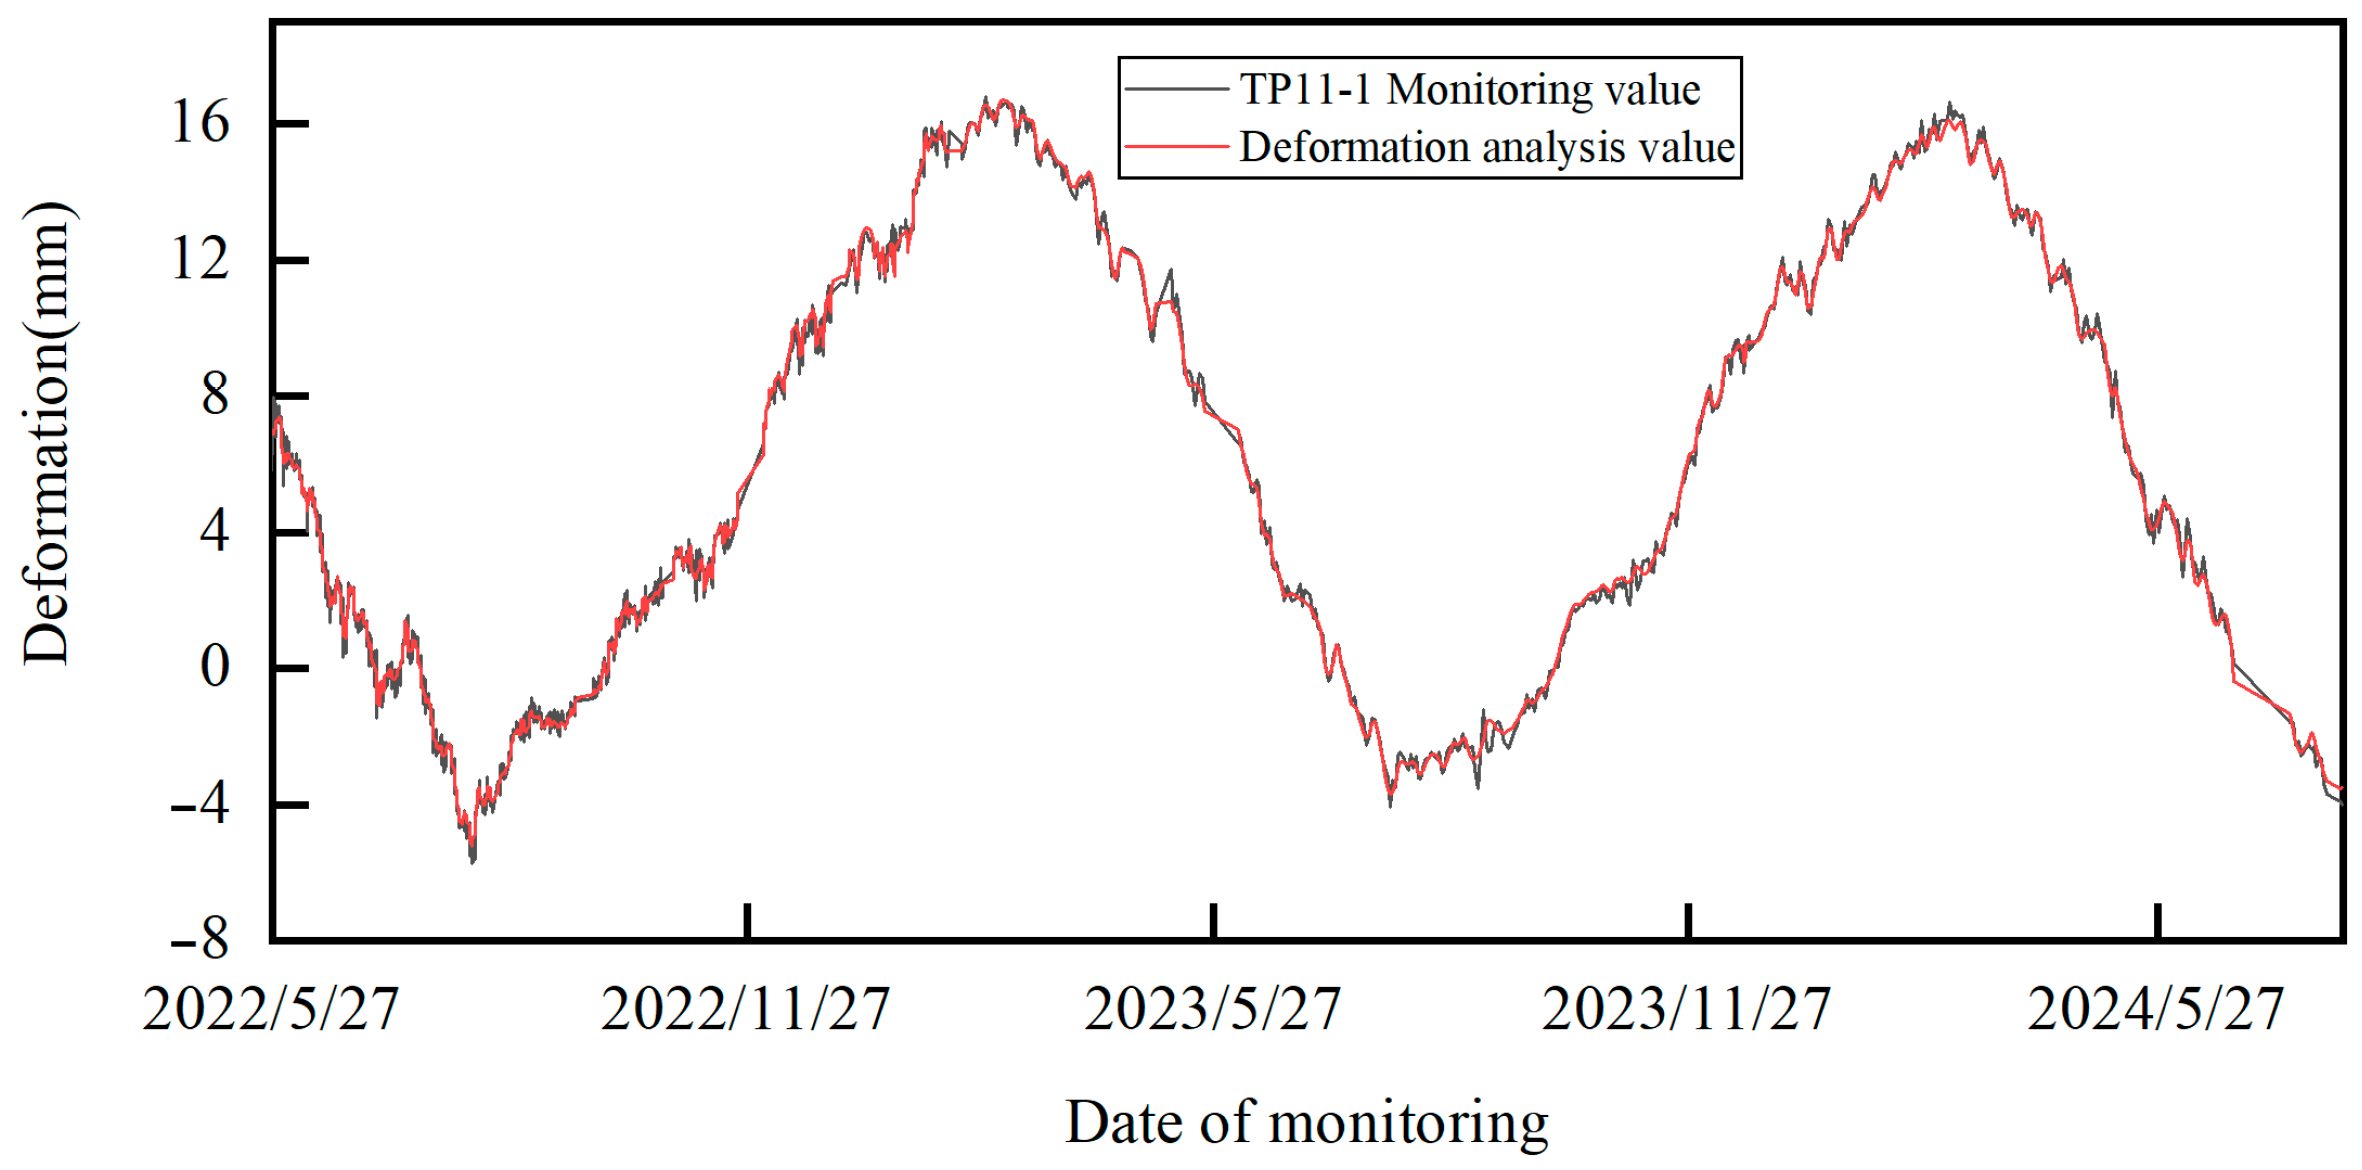
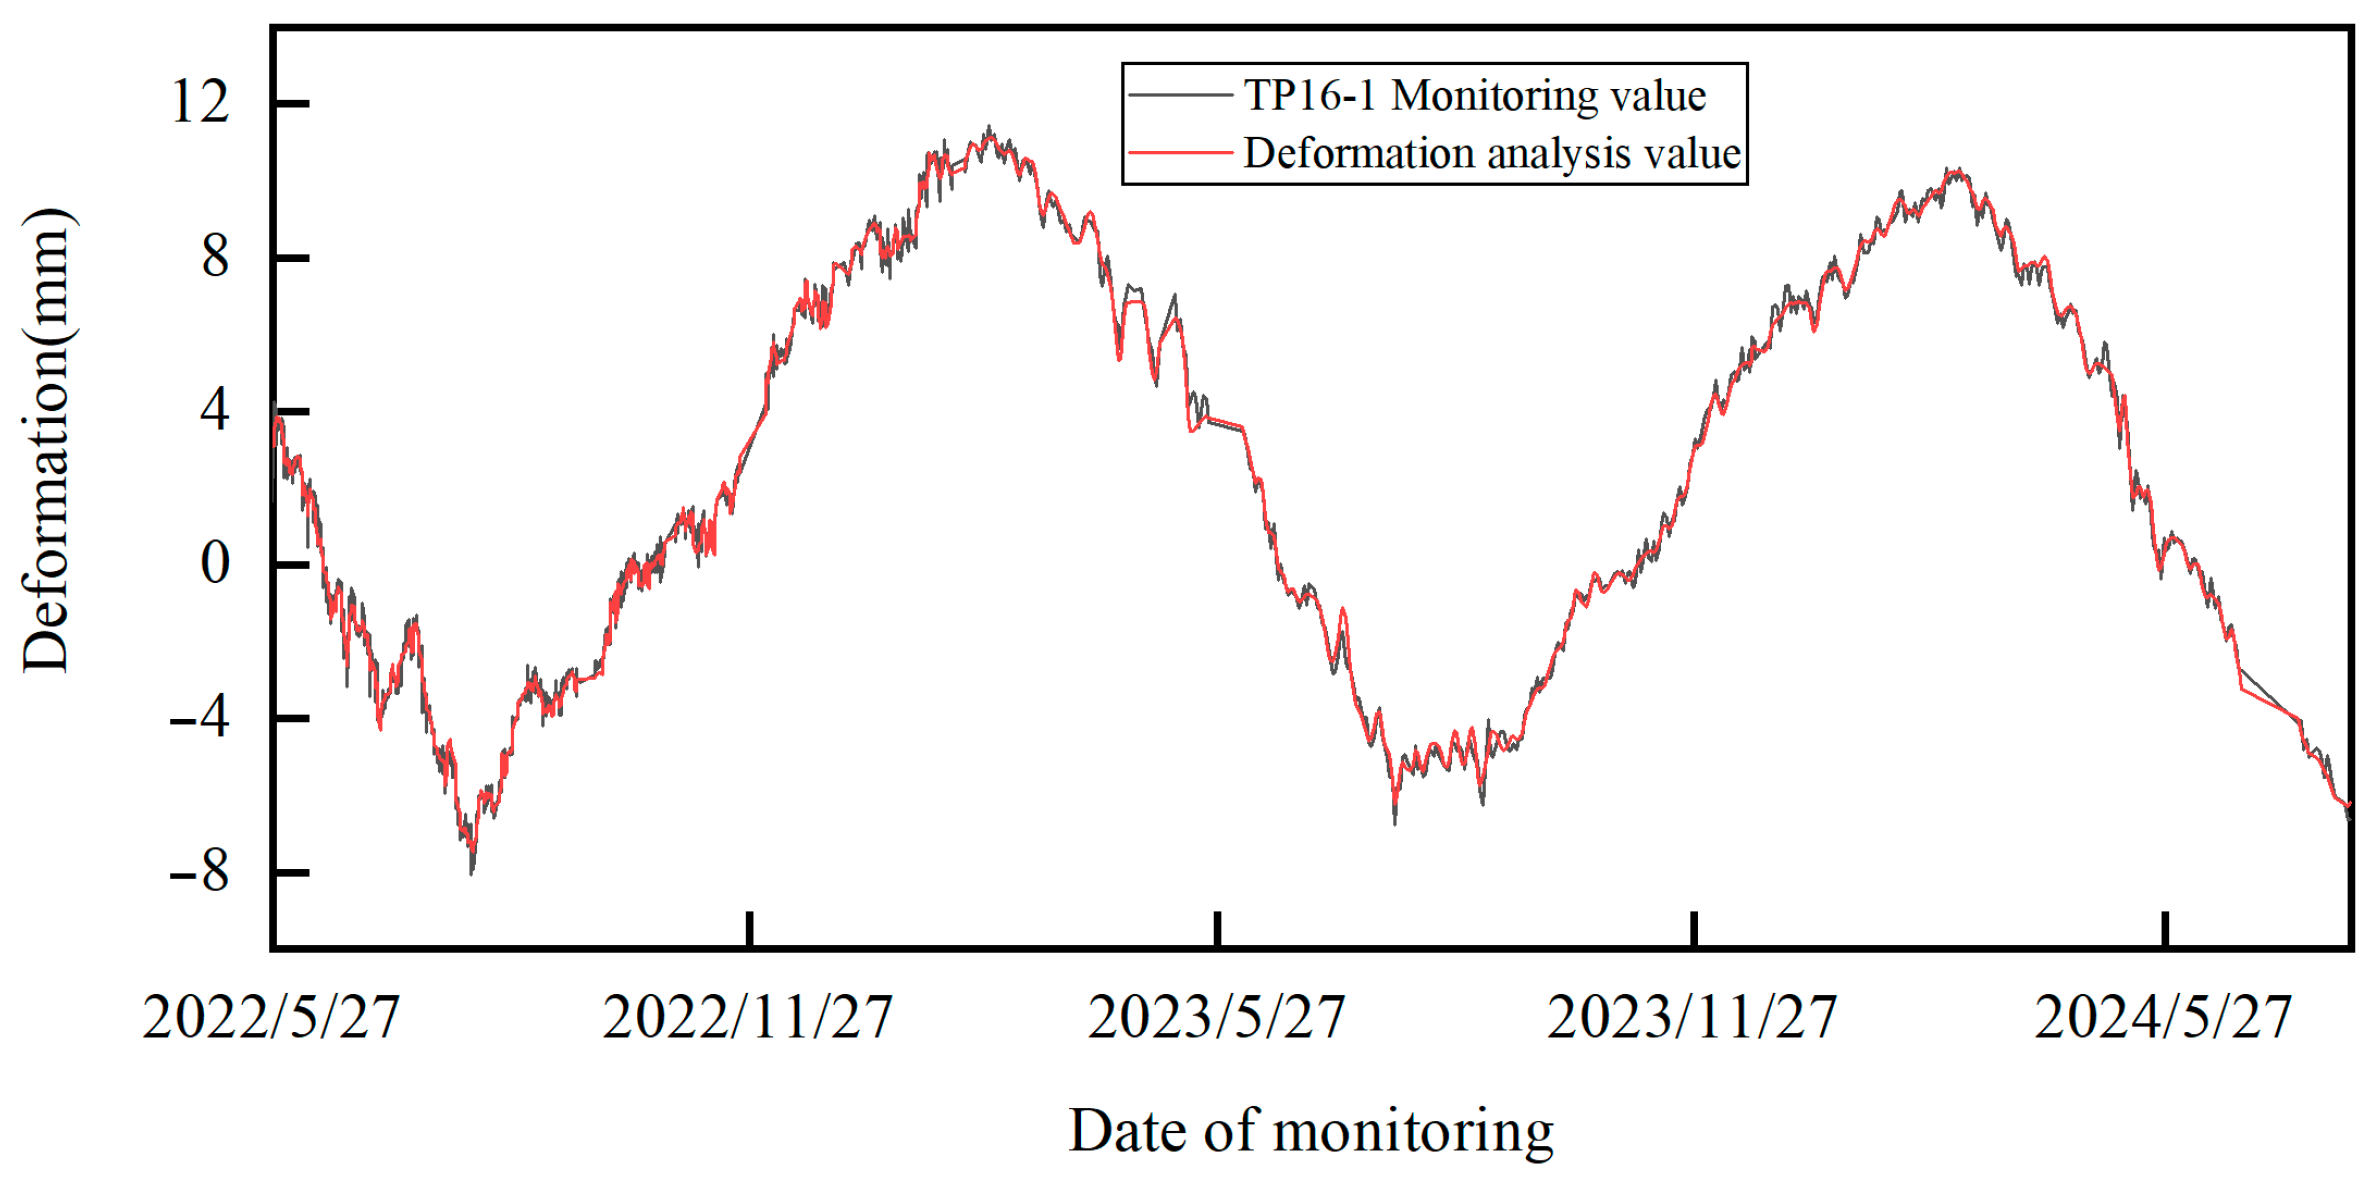
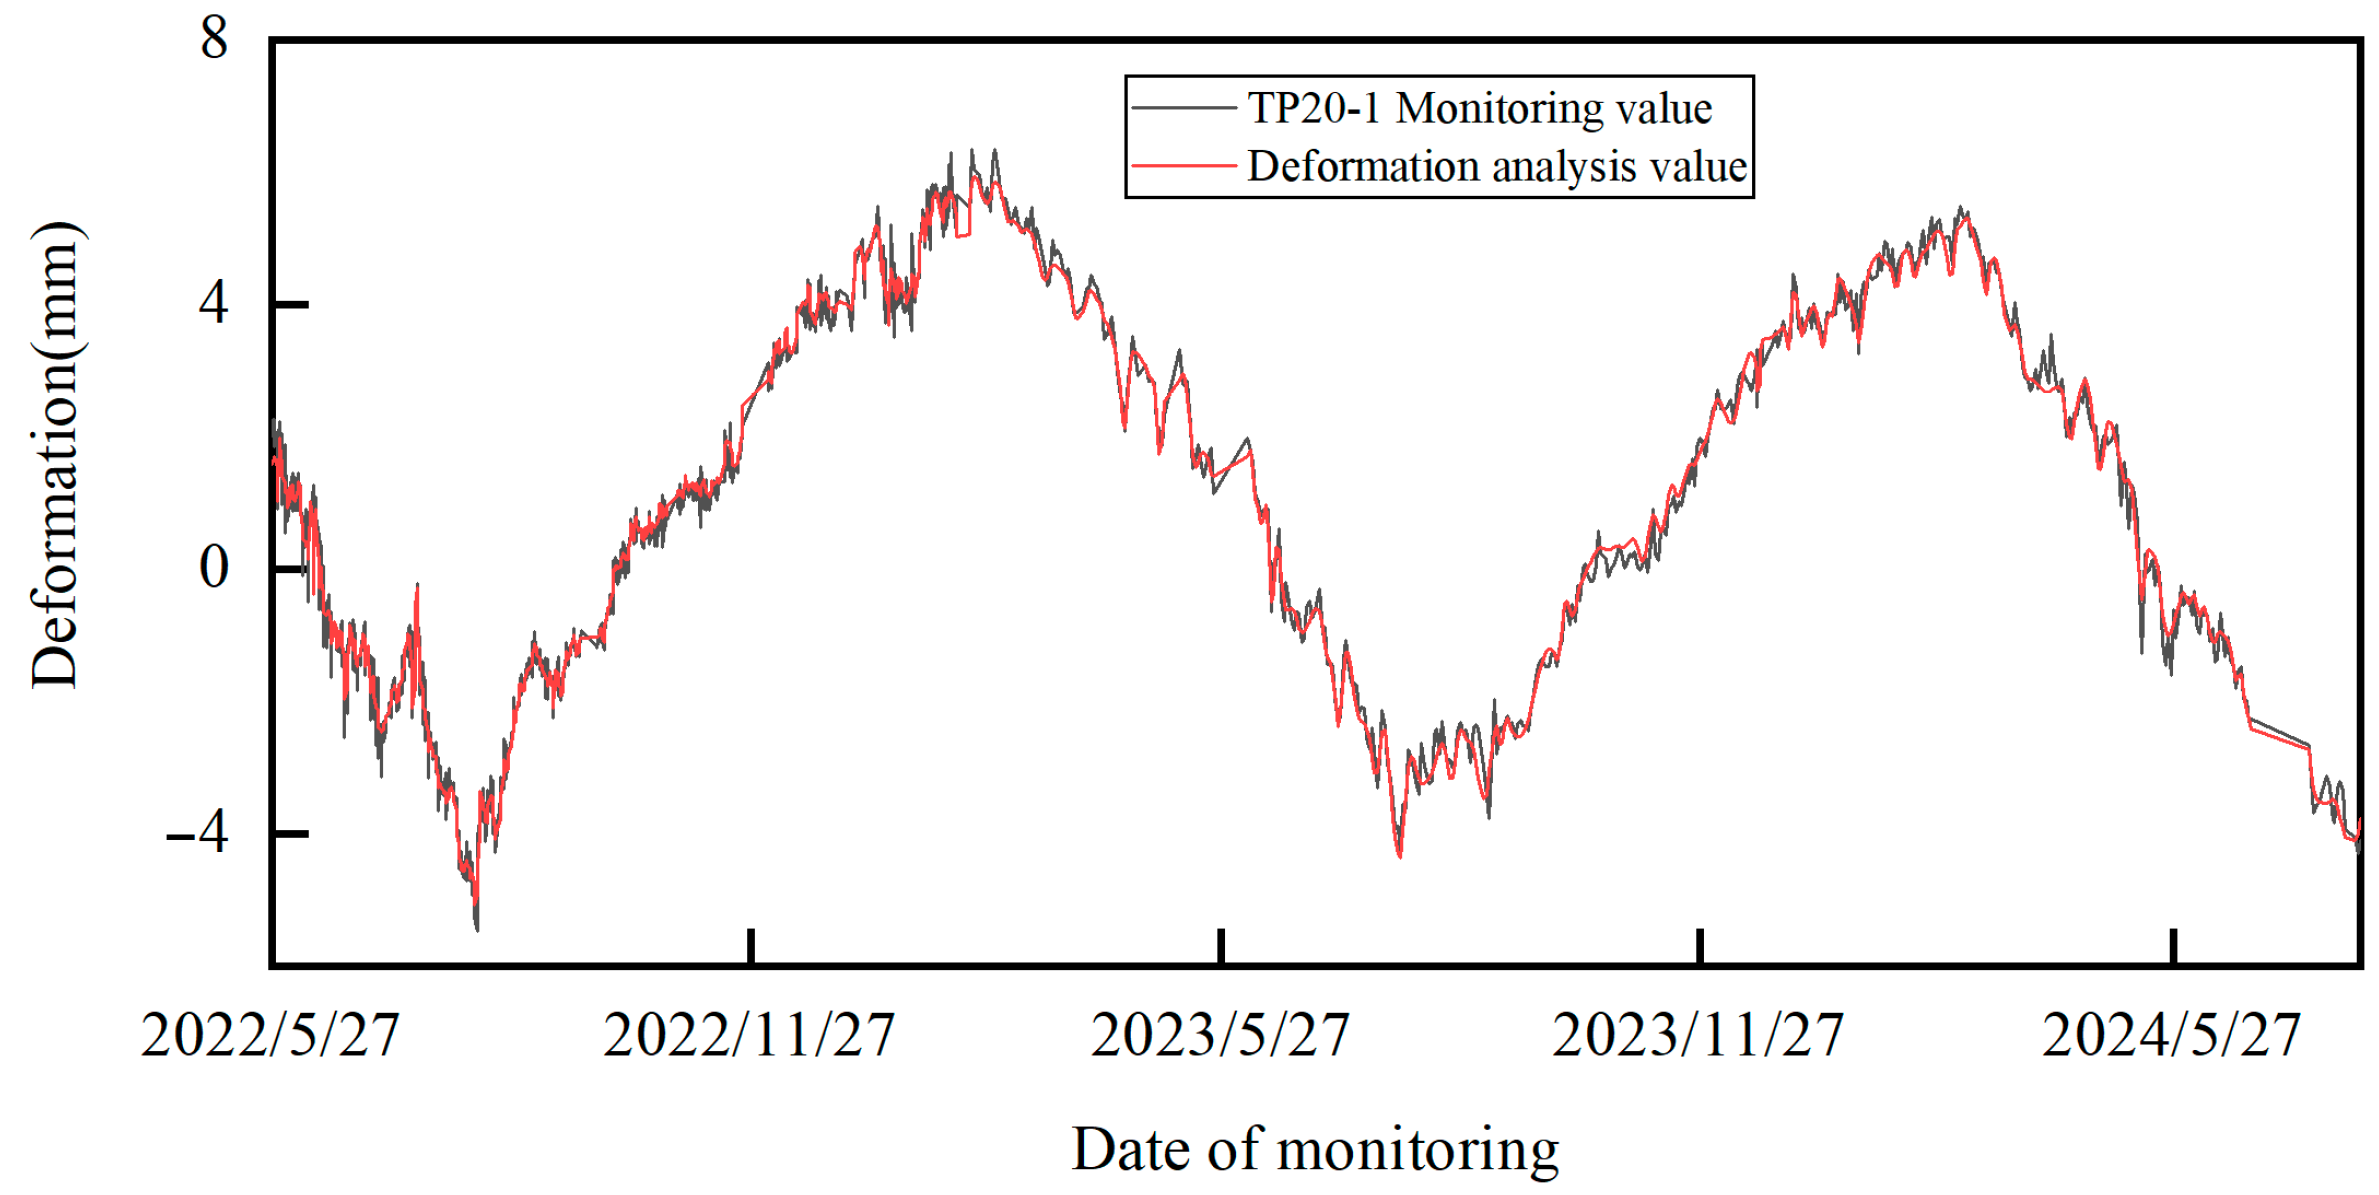
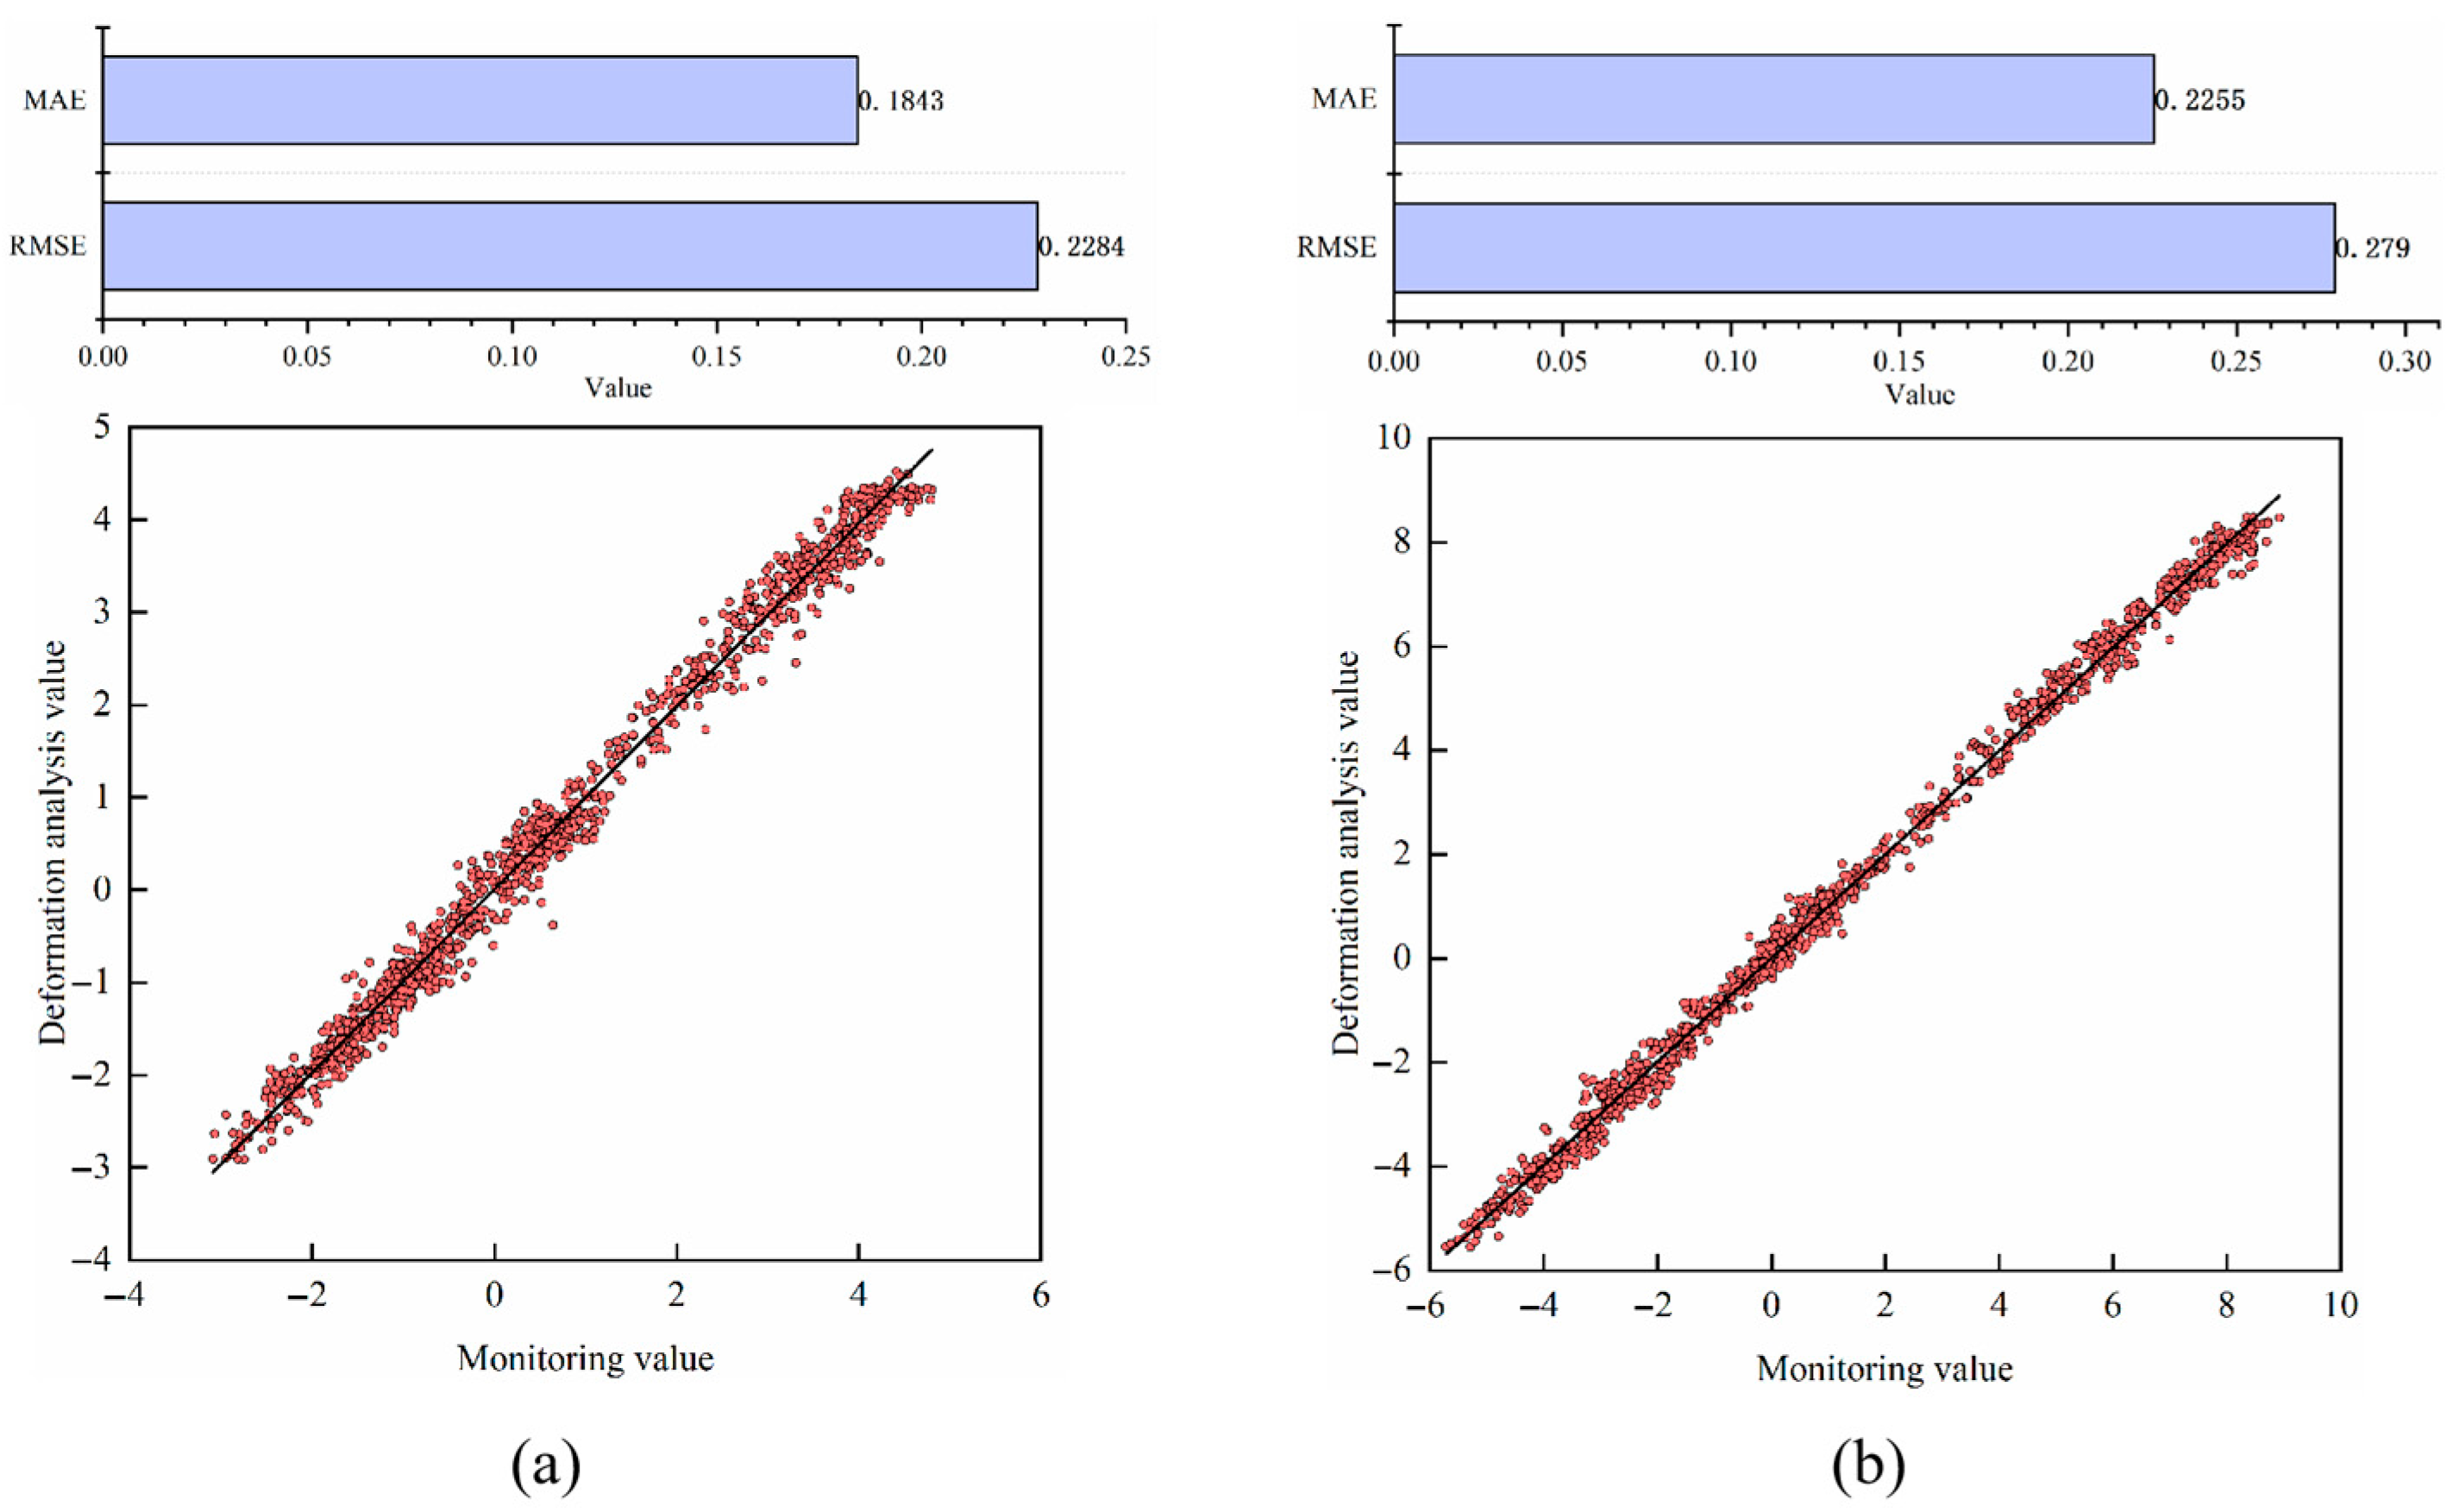
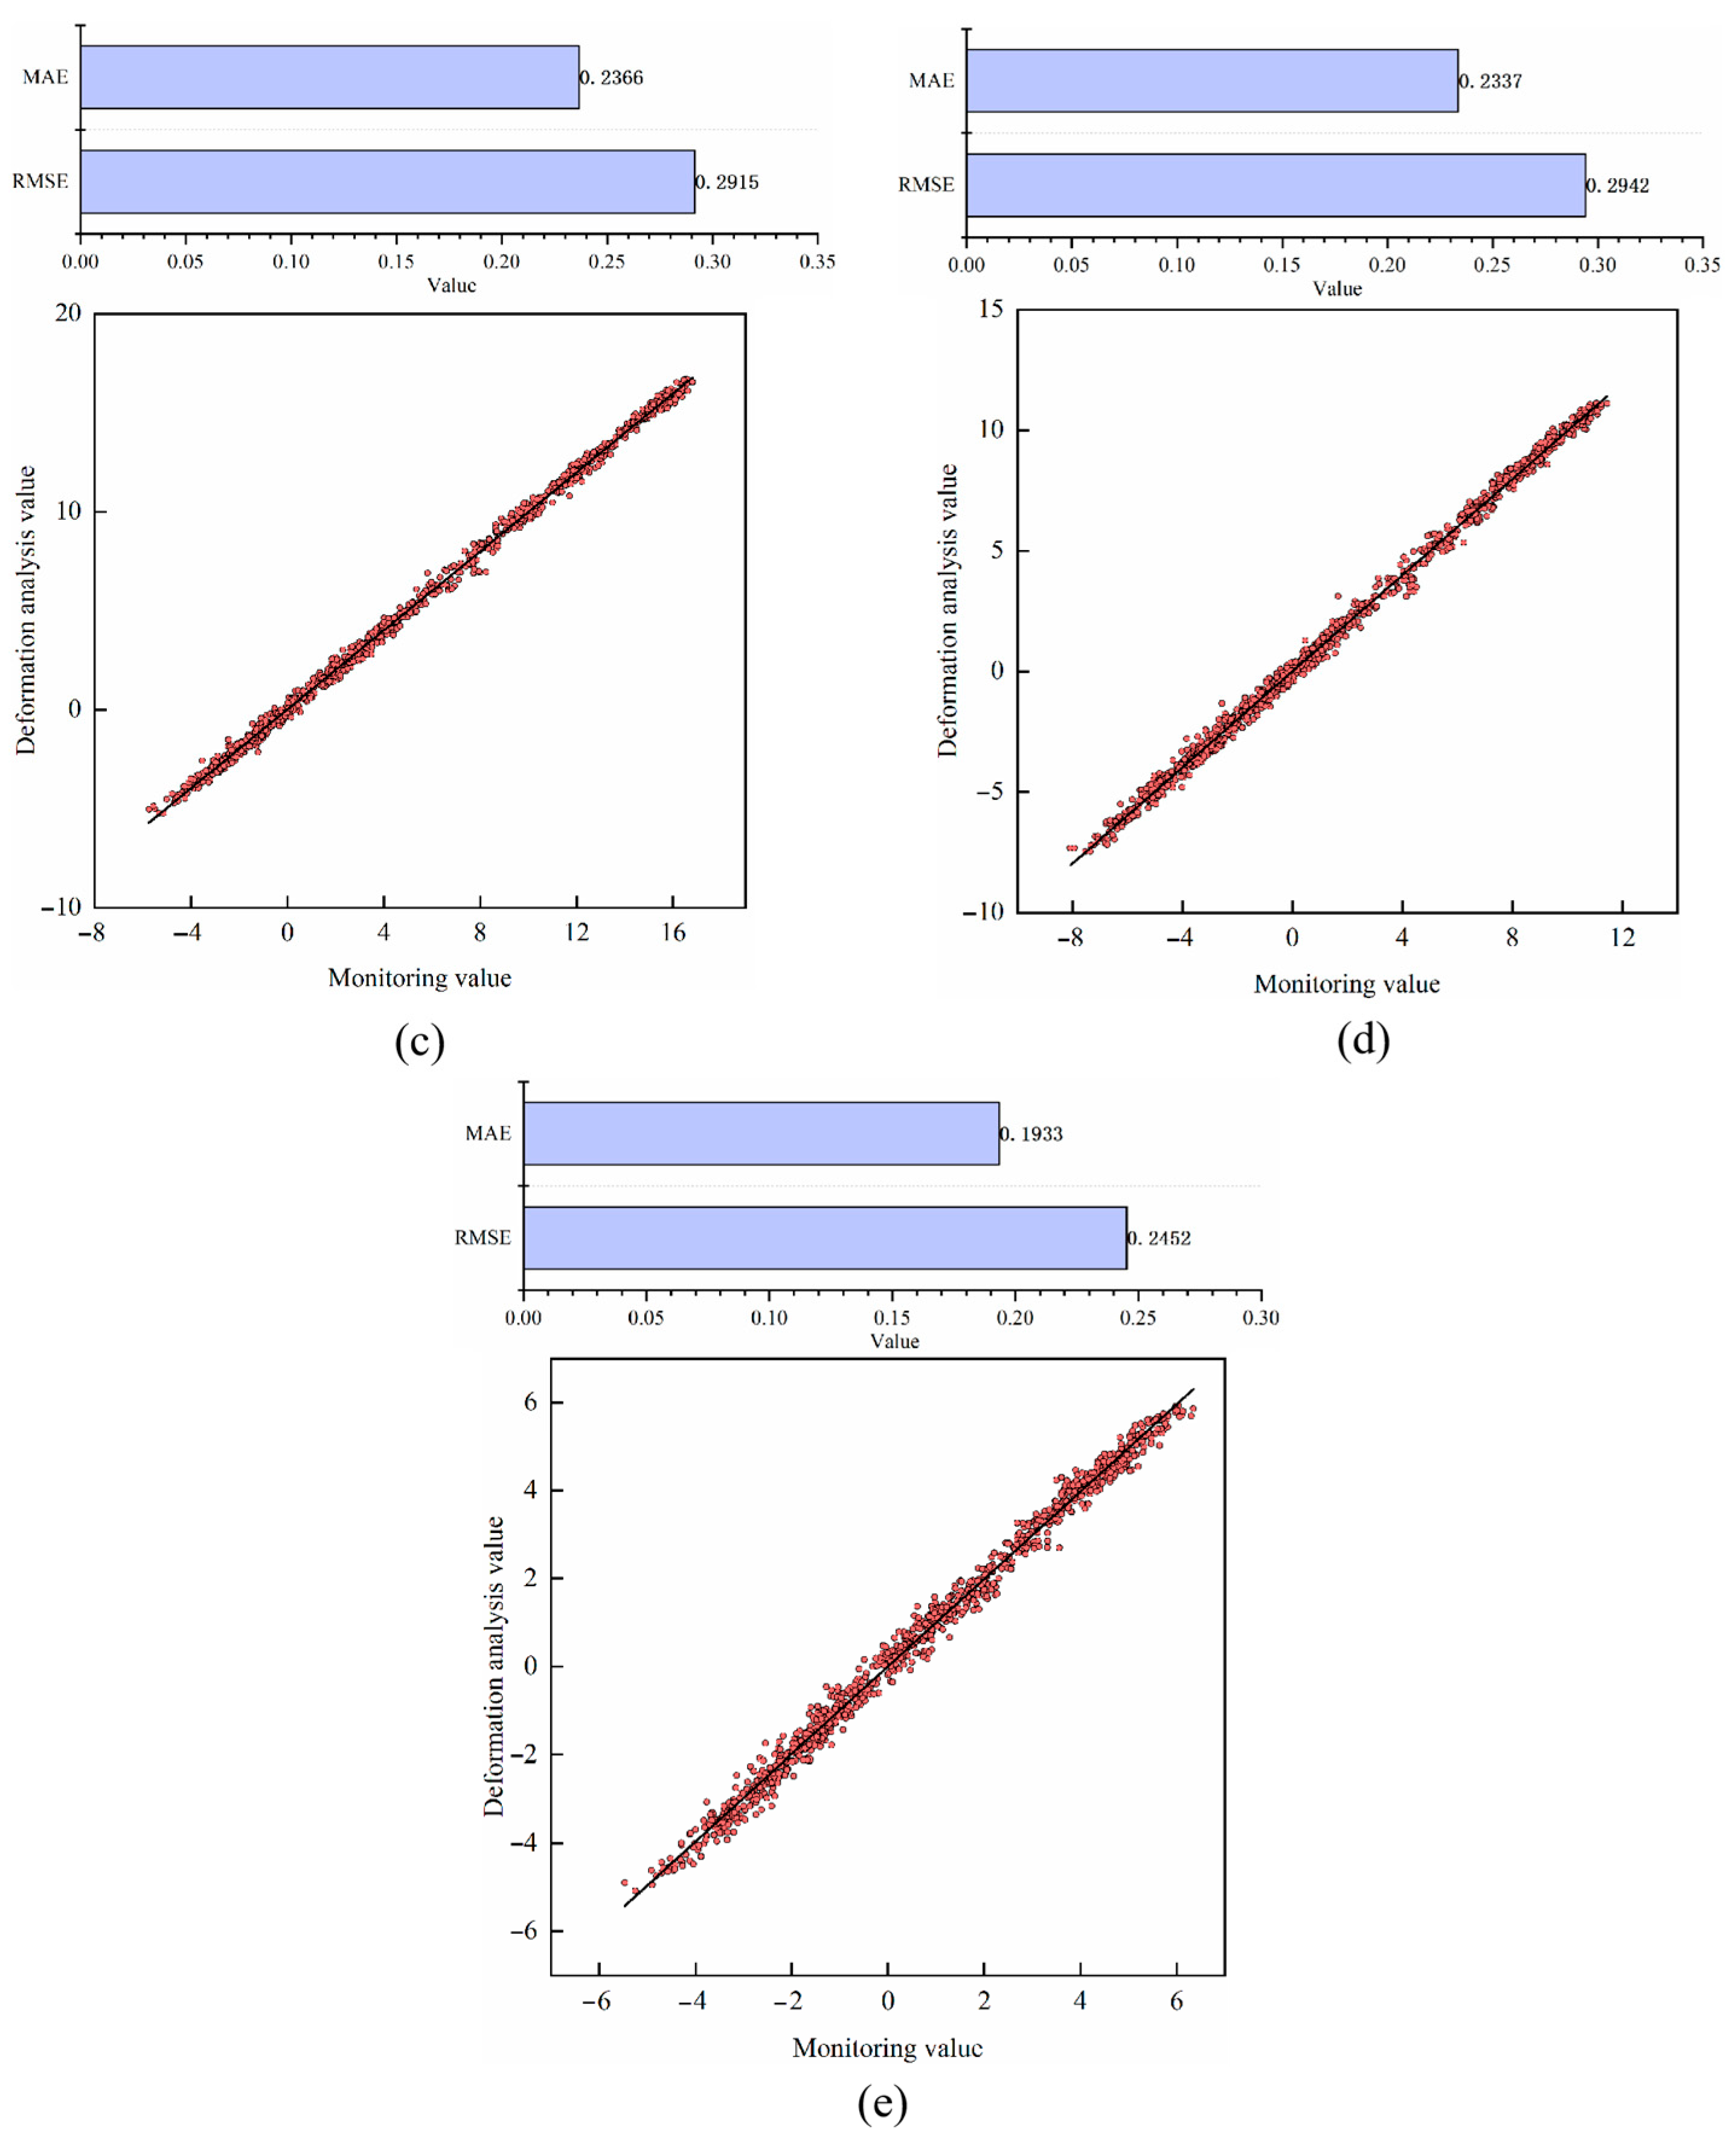
2.2. Deformation Prediction Model Based on 2D Array-CNN

In the previous section, the set of factors affecting the deformation of the arch dam was extracted, and the traditional deformation multivariate monitoring model was shown to demonstrate more synchronous modeling and analysis of each factor; in this way, it cannot highlight the deformation information of the deformation of the factors with a large deformation impact to be extracted. For this reason, this paper proposes a two-dimensional array-oriented deep learning algorithm of CNN for modeling and predicting deformation. In this, the 10 deformation factors extracted in the previous section are arranged in a two-dimensional way, which will be described in the engineering case. The CNN has a unique convolution kernel structure, which can realize the traversal of the two-dimensional array factors through the sliding of the convolution kernel, and the features of the factors that have a large influence on the deformation in the process will be highlighted by the convolution operation and the subsequent pooling operation. The structure of the convolutional neural network is shown in Figure 1, which consists of convolutional layer, pooling layer, and fully connected layer.
The convolution layer realizes the feature extraction of deformation through the form of convolution, and realizes the local perception characteristics by setting the size of the convolution kernel, e.g., to 2 × 2 or 3 × 3, and uses the convolution kernel to perform convolution operation on the environment factors. The formula of the convolution operation is as follows:
o ( i , j ) = L ( m , n ) z ( i + m , j + n )
where z is the input vector, L denotes the size of the convolution kernel, and o is the output feature vector after mapping.
The input matrix of the upper layer network is in the corresponding region of the cell and the channel convolution kernel for the inner product, and with the channel bias added to the channel, that is, the corresponding cell in the output matrix of the channel of the value of the cell. Taking the input 2D array size as 3 × 3, the convolution kernel size as 2 × 2, and the sliding step of convolution kernel as 1 as an example, the convolution process is shown in Figure 2, where each element in the convolution kernel is multiplied with the corresponding factor in the 2D array and then summed. At the same time, the convolution kernel is moved in the horizontal and vertical directions of the 2D array.
The pooling layer mainly serves to further reduce the dimension of deformation features, which reduces the number of parameters to a certain extent, prevents the risk of overfitting the network, and improves the learning ability of the model. To put it bluntly, the pooling operation process functions by replacing a certain region of the input deformation information with a value. The most common pooling operations are maximum pooling and mean pooling. Taking the convolution process shown in Figure 2 as an example, the pooling operation results are shown in Figure 3. Maximum pooling employs the maximum value to characterize the local deformation information, as shown in Equation (7). Mean pooling uses the mean value to characterize the corresponding information, as shown in Equation (8).
o k = max x i
o k = 1 n i = 1 n x i
The fully connected layer is usually located after the convolution layer and pooling layer, and its flat layer recombines the deformation features output from convolution and pooling into a one-dimensional array, and takes the obtained array as the input of the fully connected layer, thus outputting the deformation analysis results. In the actual multi-measurement point deformation analysis of arch dams, CNN deep learning neural networks are established for each research measurement point, and the deformation fitting results of the known time periods are obtained through the learning of the CNN model, so as to obtain the residuals of the multi-measurement point deformation analysis. Further, it is involved in the formulation of systematic deformation warning indicators and early warning.

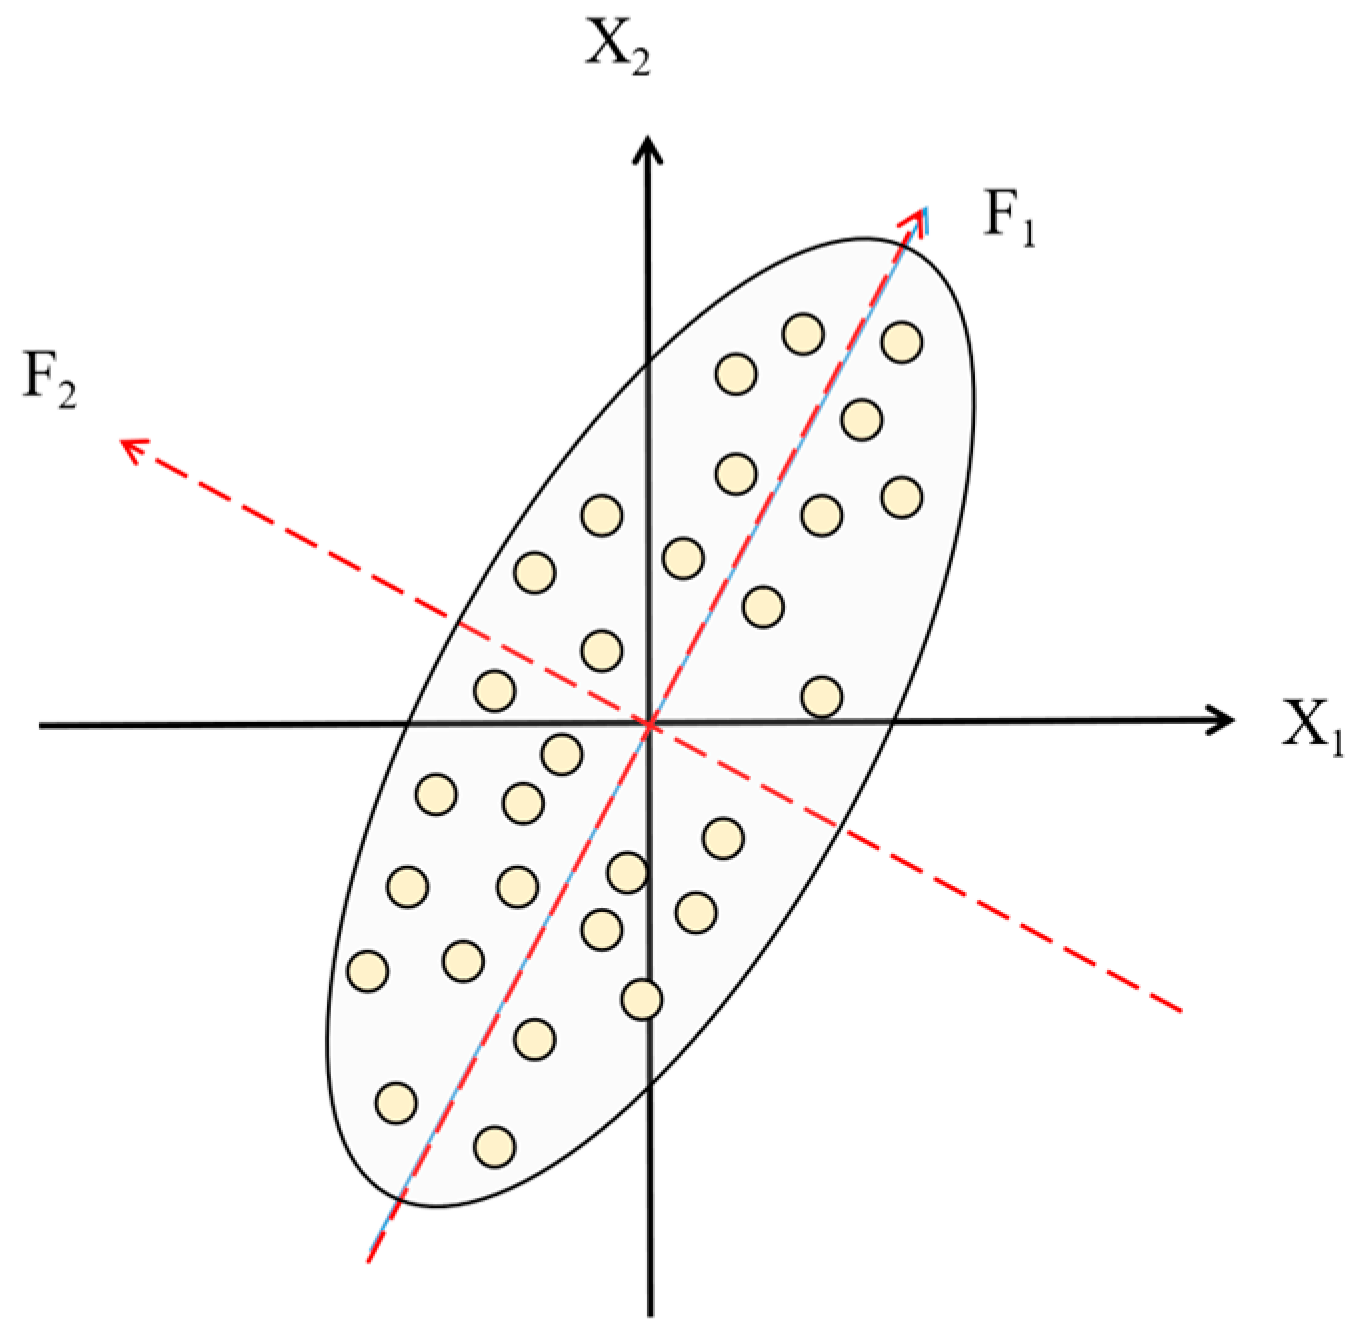
2.3. Overall Deformation Early Warning Indicator Development

It is assumed that the total number of measurement points involved in CNN modeling is n , denoted as M 1 , M 2 , , M n , and the deformation raw data δ of each measurement point is denoted as δ M 1 , δ M 2 , , δ M n . The specific deformation elements can be expressed as follows:
δ M 1 1 δ M 1 2 δ M 1 p δ M 2 1 δ M 2 2 δ M 2 p δ M n 1 δ M n 2 δ M n p
The deformation output result δ ( c n n ) of multiple measurement points can be obtained by the aforementioned HST-multiCNN method, and then the corresponding deformation output result of n measurement points can be specifically expressed as follows:
δ M 1 1 ( c n n ) δ M 1 2 ( c n n ) δ M 1 p ( c n n ) δ M 2 1 ( c n n ) δ M 2 2 ( c n n ) δ M 2 p ( c n n ) δ M n 1 ( c n n ) δ M n 2 ( c n n ) δ M n p ( c n n )
The deformation residuals R e s of multiple measurement points can be calculated by δ and δ ( c n n ) . Through the formulated arch dam deformation monitoring indicator, deformation residuals can be monitored in real time if they are larger than the formulated early warning value to judge the deformation state. Therefore, in this study, δ δ c n n is taken as the basis for the formulation of early warning indicators, and δ δ c n n can be expressed as follows:
δ δ c n n = δ M 1 1 δ M 1 1 ( c n n ) δ M 1 2 δ M 1 2 ( c n n ) δ M 1 p δ M 1 p ( c n n ) δ M 2 1 δ M 2 1 ( c n n ) δ M 2 2 δ M 2 2 ( c n n ) δ M 2 p δ M 2 p ( c n n ) δ M n 1 δ M n 1 ( c n n ) δ M n 2 δ M n 2 ( c n n ) δ M n p δ M n p ( c n n )
Based on the above equation, the absolute value of multi-point deformation residuals can be obtained. If the independent monitoring indicators are established for each measurement point, not only is the workload large, but the coupling relationship between various parts of the arch dam is also not taken into account, so it is not possible to investigate and warn the operational behavior of the arch dam from the module as a whole. Therefore, this paper proposes the concept of the systematic deformation residual index (SDSI), which converts the multi-point deformation residual to SDSI, and thus further formulates the systematic deformation early warning indicator. The specific theory is as follows.
According to the previous description, it is assumed that there are a total of n arch dam deformation measurement points, corresponding to n absolute deformation residual sequences. If these complex residual sequences can be analyzed integrally, and representative and effective hidden deformation information can be extracted from multiple complex sequences, it is expected that the operational state of the overall structure of arch dams can be visually depicted. Principal component analysis (PCA) is an effective statistical method for data integration analysis, feature extraction, and data compression. It is a process of linear combination of the original data. In a geometric sense, the linear combination of data involves performing a coordinate rotation and translation of the original coordinate axis where the original data are located, so as to obtain a new, mutually orthogonal coordinate axis. This is shown in Figure 4.
The original coordinates are composed of horizontal coordinates X 1 and vertical coordinates X 2 . The origin point inside the ellipse in the figure represents the original data, and it can be seen that regardless of whether these original data are projected to horizontal or vertical coordinates, representing them with single-dimensional data will result in a large amount of deformation information being lost. If the original coordinate axis is rotated by an angle α counterclockwise, a new coordinate axis will be obtained, defining this new coordinate axis in horizontal coordinates F 1 and vertical coordinates F 2 . It can be seen that along the direction of F 1 , the degree of data discretization is the largest, and it can be assumed, at this time, that the projection of these data on the F 1 -axis can maximize the preservation of the information of the original data. In this way, the original two-dimensional data can be represented by one-dimensional data, realizing the effect of dimensionality reduction. PCA identifies a direction in which the distribution of the original data is most highly dispersed by rotating the original coordinates. Also, the variance can reflect the discreteness of the data. Therefore, the purpose of rotating the original axes is to maximize the variance of the original data in the direction of the new axes.
The relationship between the new and original coordinates can be expressed by the following equation:
F 1 F 2 = cos α sin α sin α cos α X 1 X 2
In the integrated analysis of multi-point deformation residuals of arch dams, there are n-dimensional data, whose feature vector is expressed as, i.e., the base coordinate system of the spatial distribution of the original data. The principal component analysis rotates and translates the original coordinate system to obtain the new coordinate system F 1 , F 2 , , F n T . The focus of the sample point set of the original data is the origin of the coordinates for the new coordinate system. The new axes obtained by rotation are orthogonal to each other, and the direction of the first principal axis F 1 obtained by the first translation rotation transformation is the direction of the largest variance of the sample as a whole, while the second principal axis F 2 is the direction of the second largest variance of the sample as a whole after F 1 . In accordance with the above process, F 3 F n can be obtained. The original deformation residuals form a new set of data points by projecting the points onto F 1 . The new variable Z 1 formed by these points is called the first principal component, and Z 1 , Z 2 , , Z n , corresponding to the deformation residuals of multi-measurement points, can be discovered sequentially by combining the above steps, and from them, the principal axes that can reflect the deformation residuals of the multi-measurement points can then be found out as the new data for representing the multi-dimensional data, which is defined as SDSI.
In summary, the main idea of PCA of multi-point deformation residuals for arch dams is to combine numerous raw data series R e s 1 , R e s 2 , , R e s n into a set of systematic indexes F m . This assumes that F 1 is the first principal component generated by PCA, i.e.,
F 1 = a 11 R e s 1 + a 21 R e s 2 + + a n 1 R e s n
By mathematical knowledge, principal component analysis applies the theory of maximum variance, the amount of information extracted from each principal component can be measured by its variance, and the larger its variance V a r F 1 is, the more information about the deformation residuals F 1 contains. It is usually desired that F 1 contains the largest amount of information, so the n selected among all linear combinations should be the one with the largest variance among all linear combinations of R e s 1 , R e s 2 , , R e s n , so F 1 is the first principal component. If F 1 is not enough to represent the information of the original n indicators, then consider the selection of the second principal component indicator F 2 , effectively reflecting the information of the deformation residuals of the multi-measurement point, the information already in F 1 will no longer appear in F 2 , that is, F 2 and F 1 remain independent and unrelated to each other, i.e., C o v F 1 , F 2 = 0 . In this way, the first, second, …, m th principal components of the multi-measurement point deformation residual R e s 1 , R e s 2 , , R e s n , denoted as F 1 , F 2 , , F m , can be constructed, resulting in the following equation.
F 1 = a 11 R e s 1 + a 21 R e s 2 + + a n 1 R e s n F 2 = a 12 R e s 1 + a 22 R e s 2 + + a n 2 R e s n F m = a 1 m R e s 1 + a 2 m R e s 2 + + a n m R e s n
Generally, the first few principal components whose superposition contribution rate reaches 90% are selected to replace the original multi-measurement point deformation residuals, which are able to represent the feature information contained in the original data, and the deformation residual principal components thus extracted are defined as the arch dam SDSI, denoted as r = r 1 , r 2 , , r p .
According to the strategy of formulating monitoring indicators with small probability, if the distribution law can be accurately modeled, the magnitude threshold of absolute residuals can be formulated using the concept of small probability. Existing methods can formulate early warning indicators by presetting the distribution of data,; however, this does not take into account the real distribution of data, and the reliability of the warning indicators formulated is doubtful. The kernel density function is a method of estimating a single probability density function curve using the original data samples, which has the advantage of retaining the distribution pattern of the original deformation response sequence without assuming the distribution characteristics of the data in advance. The process of formulating the overall deformation monitoring index of arch dams based on the kernel density function is as follows.
The exponential sequence obtained according to the above method is r = r 1 , r 2 , , r p . The expression of the kernel density function corresponding to this sequence can be expressed as f r = 1 p h i = 1 p K r i h , where K , h denote the type of kernel function and the window size, respectively, and f r denotes the probability density function corresponding to the exponential sequence. Typically, the Gaussian kernel function K δ i h = 1 2 π exp r i 2 2 h 2 is often used to denote the type of K . In summary, after determining f r , the cumulative distribution function of the exponential sequence, denoted as F δ , can be obtained by integrating f r . It is now assumed that r m is the early warning indicator of the overall deformation of the arch dam, and the overall deformation of the arch dam is considered to be abnormal when the systematic deformation residual index in the real-time stage r r m . Combined with the law of small probability calculation, r m can be calculated by the abnormal probability, the abnormal probability of the value of the interval is usually located from 1% to 5%, and the specific value needs to be combined with the study of engineering cases for specific analysis. This will be introduced when assessing the strength of the analysis.

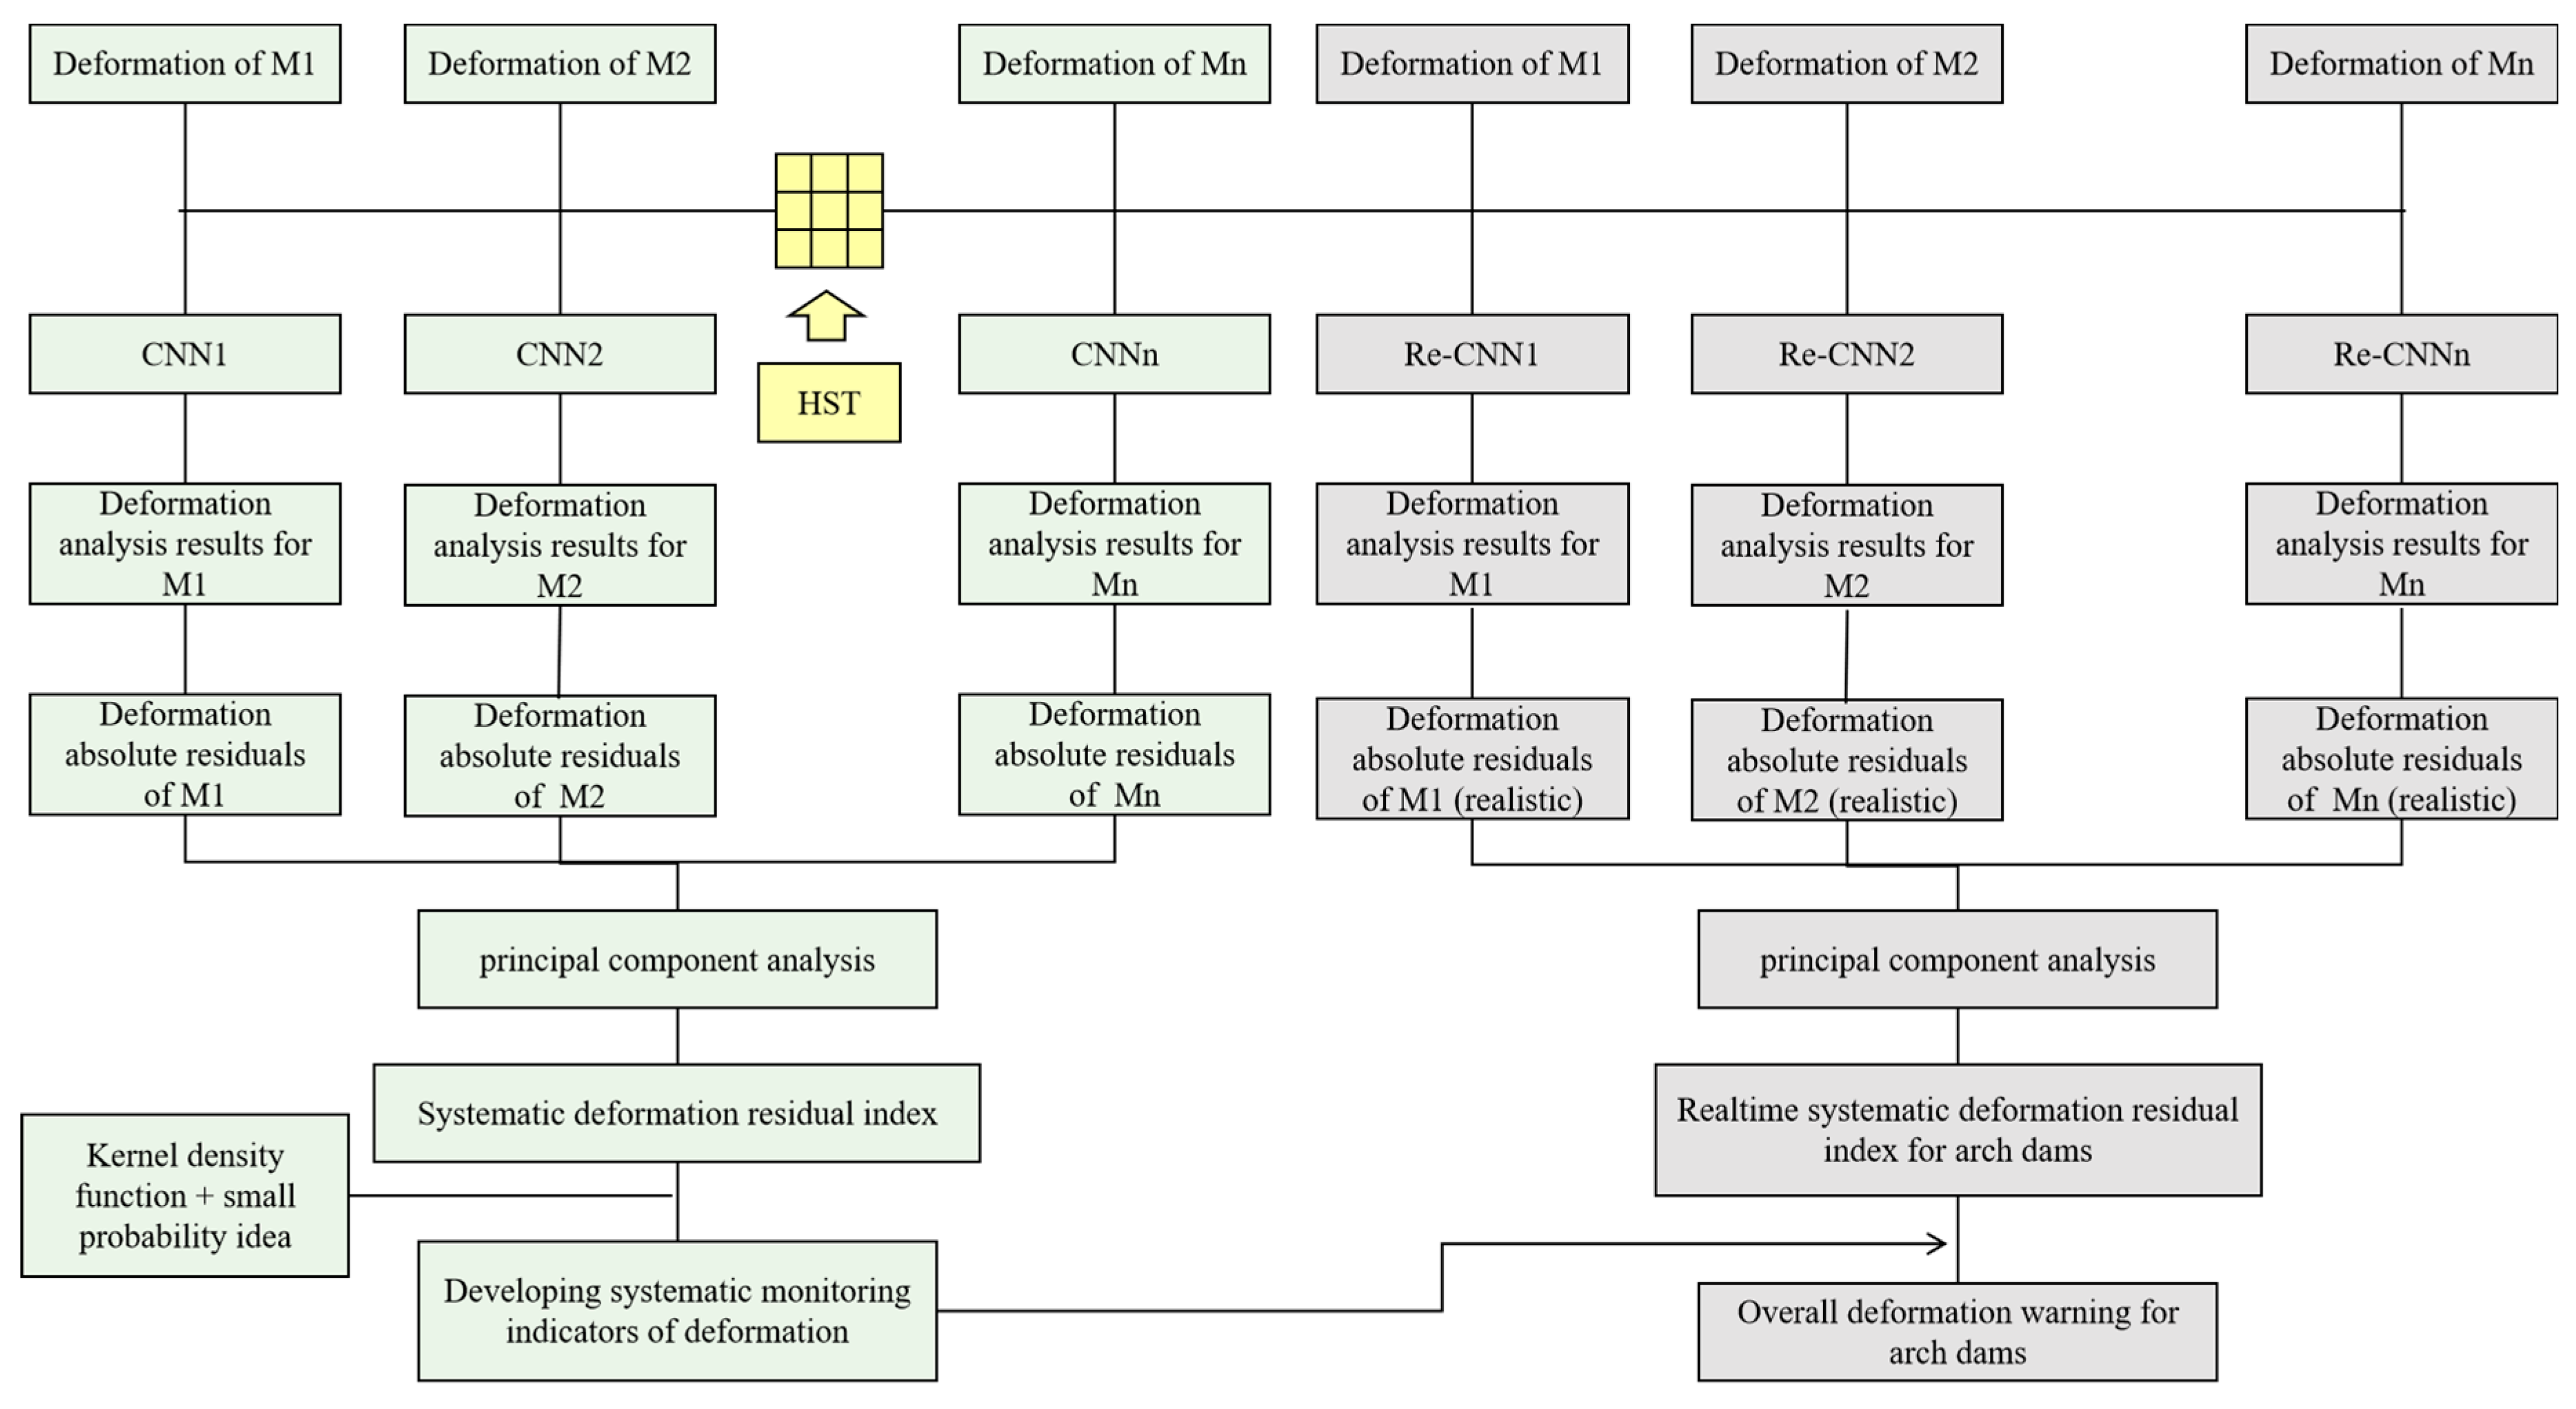
2.4. Systematic Early Warning Method for Arch Dams

Based on the previous analysis, this section innovatively proposes the establishment of a complex mapping relationship between multi-point deformation residuals and SDSI, and uses quadratic CNN (Re-CNN) modeling to realize the abovementioned process. For the real-time monitored deformation data, the corresponding deformation residuals are obtained by combining the deformation analysis methods proposed in Section 2.1 and Section 2.2. Then, they are brought into the trained Re-CNN to obtain the real-time SDSI and compared with the early warning indicator formulated in Section 2.3 to judge the overall deformation condition of the arch dam and realize the effective early warning of the overall deformation. The relevant theories are expressed as follows.
The set R e s of multi-point deformation residuals can first be obtained from the information outlined in previous section, which can be expressed as follows:
R e s = R e s 1 1 R e s 1 2 R e s 1 p R e s 2 1 R e s 2 2 R e s 2 p R e s n 1 R e s n 2 R e s n p
The systematic deformation residual index corresponding to the above multi-measurement point deformation residuals is denoted as r = r 1 , r 2 , , r p . It is now necessary to establish a Re-CNN model to mine the mapping relationship between each variable in R e s and r . The Re-CNN model can be used as the input to the 2D array of Re-CNN models. Similarly to what is described in Section 2.3, the n deformation residual factors are used as inputs to the two-dimensional array of Re-CNN models to establish the mapping relationship R e s Re C N N r , and the Re-CNN model at this point is saved as Re C N N .
Assume again that the real-time deformation monitoring data for the next t days at the multi-measurement point is δ t = δ ( t ) M 1 , δ ( t ) M 2 , , δ ( t ) M n , which is denoted as
δ M 1 p + 1 δ M 1 p + 2 δ M 1 p + t δ M 2 p + 1 δ M 2 p + 2 δ M 2 p + t δ M n p + 1 δ M n p + 2 δ M n p + t
The above measurement points are predicted by HST-multiCNN to obtain the following deformation prediction value δ ( c n n ) t , which is expressed as follows:
δ M 1 p + 1 ( c n n ) δ M 1 p + 2 ( c n n ) δ M 1 p + t ( c n n ) δ M 2 p + 1 ( c n n ) δ M 2 p + 2 ( c n n ) δ M 2 p + t ( c n n ) δ M n p + 1 ( c n n ) δ M n p + 2 ( c n n ) δ M n p + t ( c n n )
The set R e s t of multi-measurement point deformation residuals corresponding to time period t can be obtained from δ t and δ ( c n n ) t , denoted as follows:
R e s t = R e s 1 p + 1 R e s 1 p + 2 R e s 1 p + t R e s 2 p + 1 R e s 2 p + 2 R e s 2 p + t R e s n p + 1 R e s n p + 2 R e s n p + t
The absolute residual combination of multiple measurement points corresponding to the deformation prediction results of the real-time monitoring phase can be obtained through the above analysis, and then the SDSI corresponding to the time period can be output by using the model Re C N N obtained from the abovementioned training, denoted as r t = r p + 1 , r p + 2 , , r p + t . Finally, the element r p + 1 , r p + 2 , , r p + t in r t can be compared with the overall warning indicator formulated in Section 2.3, respectively, to realize the overall early warning of arch dam deformation.

3. Technology Route

The comprehensive theoretical basis of the analysis, the proposed arch dam system deformation monitoring index formulation, and the overall early warning method are summarized in Figure 5.

4. Engineering Case Studies

4.1. Engineering and Data Profile

Lijiaxia Hydropower Station is mainly utilized for power generation and irrigation. The hub building consists of three-centered circular hyperbolic concrete arch dams, a left bank gravity pier, a left sub-dam, a water discharge building, a water diversion system, a post-dam plant, and other permanent buildings. The hydroelectric power plant has a hyperbolic concrete arch dam top axis length of 414 m, a dam top elevation of 2185 m, a maximum dam height of 155 m, a maximum bottom width of 45 m, a top width of 8 m, and a thickness-to-height ratio of 0.29. In order to monitor the displacement of the arch dam, a plumb line monitoring system is applied to the dam, and the layout for measuring points at the top of the dam and technical details of data measurement are shown in Figure 6.
In order to verify the effectiveness of the proposed early warning method, the arch dam roof measurement points TP1-1, TP6-1, TP11-1, TP16-1, and TP20-1 are selected as the multi-measurement point research objects, and the displacement change curves for each measurement point during the period from 27 May 2022 to 7 November 2024 are shown in Figure 7.

4.2. Development of System Deformation Monitoring Indexes

After obtaining the multi-point displacements, a HST statistical model is used to extract the water pressure, temperature and time-related factors affecting the displacements, and a CNN deep learning model is built for each measurement point. In this example, the factor arrangement of all measurement points is set as a 2 × 5 array. The arrangement of ten deformation factors and the convolution step and direction of the convolution kernel are shown in Figure 8.
Before the prediction of each measurement point, the displacement data of the collection period is first divided into a training phase and a validation phase, where the former corresponds to the period from 27 May 2022 to 7 August 2024, and the validation phase corresponds to the period from 8 August 2024 to 7 November 2024. The displacement output results of the training phase for each measurement point are shown in Figure 9, Figure 10, Figure 11, Figure 12 and Figure 13.
It can be seen that the proximity between the deformation analysis results based on HST-multiCNN and the real values is high. This indicates that the proposed deformation monitoring model reflects the deformation state of arch dams well, and has good deformation information mining capability. Figure 14 represents the performance evaluation indicator results (RMSE, MAE and R2) for the proposed method. Obviously, the deformation results outputted by HST-multiCNN are satisfactory, indicating that the method can effectively mine effective information in deformation, which provides a reliable precondition for the subsequent formulation of the overall warning indicator.
Based on the above analysis, the absolute deformation residuals corresponding to each point can be obtained, as shown in Figure 15, Figure 16, Figure 17, Figure 18 and Figure 19.
It can be preliminarily seen that the fluctuation amplitude and trend of the absolute deformation residuals at each point have similarities under the unified analysis framework of HST-multiCNN, which provides a prerequisite for extracting the deformation residuals of the multi-measurement point system of arch dams using PCA. According to the theoretical framework previously described, the PCA model is now constructed for the absolute deformation residuals of the five measurement points under study to obtain the SDSI, as shown in Figure 20.
In the next step, the kernel density function is used to simulate the distribution pattern of SDSI. The calculation results of the kernel density function and the corresponding cumulative distribution curve are shown in Figure 21. Meanwhile, in order to verify the validity of the kernel density function, the system residuals are simulated and the cumulative distribution curves are calculated with normal distribution simultaneously.
Considering that the available deformation data have not experienced the most unfavorable loading condition, 99% is selected as the calculation rate of the small probability method, and when the value of SDSI exceeds the critical index corresponding to 99%, attention should be paid to whether the operation of the arch dam is healthy or not. From this, the early warning indicator is 0.733 under the kernel density function and 0.503 under the normal distribution.

4.3. Overall Early Warning Method for Arch Dams Based on Systematic Deformation Monitoring Indexes

In the previous section, the overall deformation warning indicators for arch dams were formulated; the feasibility and effectiveness of the proposed warning method will be verified in this section. From the theoretical framework, it can be seen that obtaining the deformation prediction results in the real-time stage is the basis of real-time early warning. Also, based on HST-multiCNN, the deformation prediction results of each measurement point from 8 August 2024 to 7 November 2024 can be obtained, as shown in Figure 22, and the deformation prediction residuals can be obtained on the basis of real-time prediction, as shown in Figure 22.
According to the Re-CNN modeling strategy proposed in the theoretical part, the mapping relationship between the multi-point deformation residuals and SDSI in the fitting stage is established first. The above five measurement point deformation absolute residuals are sequentially arranged in the form of 1 × 5 as the input samples of Re-CNN. At the same time, the above factors are sequentially convolved with a convolution kernel of one row and two columns, so as to train the optimal mapping relationship model Re C N N .
Similarly, the real-time deformation absolute residuals of the prediction results are taken as inputs to Re C N N , and the corresponding SDSI can be obtained using the trained internal network framework, as shown in Figure 23. Meanwhile, the warning values based on kernel density function and normal distribution are given for comparison. It can be seen that all the SDSIs, based on the monitoring indicators formulated by the method proposed in this paper, are judged as normal, indicating that the overall deformation of the arch dam is stable at this stage. However, the monitoring indicators, based on the normal distribution, define the SDSIs numbered ①, ②, and ③ as abnormal, indicating that the overall deformation of the arch dam is unstable at this stage. Combined with the actual operation of the arch dam, the deformation patterns of the dam at the above three time points are stable. The above analysis shows that the method proposed in this paper can effectively warn about the overall deformation state of arch dams.

5. Conclusions

In this paper, a systematic deformation early warning method for arch dams is innovatively proposed, and the main innovations are summarized as follows.
First, HST is introduced to extract the environmental factors as 2D array samples of CNN, establish CNNs for multiple measurement points simultaneously, and obtain the corresponding absolute deformation residuals, so as to establish a unified analysis architecture for multiple points. Then, principal component analysis is used to construct a multi-point SDSI to provide effective preconditions for overall deformation warnings for arch dams. Simultaneously, in order to avoid the preset data distribution, the kernel density function method is used to fit the distribution of the SDSI, combined with the small probability concept to determine the overall deformation warning indicator. Finally, the Re-CNN strategy is used to learn the complex relationship between the multi-point residuals and SDSI, and combines the HST-MultiCNN prediction results and the above mapping relationship to determine the SDSI, and then compares them with the warning indictor to determine the overall deformation state.
The systematic and holistic early warning method for arch dam deformation proposed in this paper provides an efficient solution for detecting potential safety hazards. In the future, further analysis will be carried out to find out what causes (sudden changes in environmental factors, structural damage, etc.) are responsible for potential abnormal deformations.

Author Contributions

Conceptualization, methodology, and writing—original draft preparation, T.Z.; software, validation, and formal analysis, X.N.; resources and data curation, N.M.; writing—review and editing, visualization, and funding acquisition, F.S.; supervision and project administration, S.G. All authors have read and agreed to the published version of the manuscript.

Funding

This research was funded by [Technologies and Approaches for Predicting Damage and Catastrophic Failure in High Concrete Dams], grant number [2021YFC090102].

Data Availability Statement

Data will be made available on request.

Conflicts of Interest

The authors declare no conflicts of interest.

Abbreviations

CNNConvolutional neural network
HST-MultiCNNMulti-point CNN based on HST
Re-CNNRe-CNN modeling
SDSISystem deformation residual index
PCAPrincipal component analysis
RMSERoot mean square error
MAERoot mean square error
R2Determination coefficient
R e s Deformation residual
Re C N N Mapping   relationship   R e s Re C N N r

References

  1. Buljak, V.; Cocchetti, G.; Cornaggia, A.; Garbowski, T.; Maier, G.; Novati, G. Materials Mechanical Characterizations and Structural Diagnoses by Inverse Analyses. In Handbook of Damage Mechanics; Springer: New York, NY, USA, 2014; pp. 619–642. [Google Scholar]
  2. Fedele, R.; Maier, G.; Miller, B. Health Assessment of Concrete Dams by Overall Inverse Analyses and Neural Networks. Int. J. Fract. 2006, 137, 151–172. [Google Scholar] [CrossRef]
  3. Wang, M.; Wu, Z. A methodology for deformation monitoring of concrete dams based on approximate Bayesian computation with sequential Monte Carlo. Expert Syst. Appl. 2024, 255, 124829. [Google Scholar] [CrossRef]
  4. Tian, J.; Yu, R.; Chen, J.; Chen, C.; Li, Y.; Sun, X.; Huang, H. Digital twin model for analyzing deformation and seepage in high earth-rock dams. Autom. Constr. 2025, 173, 106079. [Google Scholar] [CrossRef]
  5. Jia, D.; Yang, J.; Sheng, G. Dam deformation prediction model based on the multiple decomposition and denoising methods. Measurement 2024, 238, 115268. [Google Scholar] [CrossRef]
  6. Liu, M.; Wen, Z.; Su, H. A multipoint prediction model for the deformation of concrete dams considering climatic features of high-altitude regions. Eng. Struct. 2024, 319, 118845. [Google Scholar] [CrossRef]
  7. Cao, E.; Bao, T.; Gu, C.; Li, H.; Liu, Y.; Hu, S. A Novel Hybrid Decomposition—Ensemble Prediction Model for Dam Deformation. Appl. Sci. 2020, 10, 5700. [Google Scholar] [CrossRef]
  8. Xu, G.; Lu, Y.; Jing, Z.; Wu, C.; Zhang, Q. IEALL: Dam Deformation Prediction Model Based on Combination Model Method. Appl. Sci. 2023, 13, 5160. [Google Scholar] [CrossRef]
  9. Li, Z.; Yin, C.; Chen, R.; Wu, Z.; Chen, J.; Lu, X. A novel deformation monitoring model for high arch dams using impulse response-based equivalent temperature and machine learning-aided separate modeling. Expert Syst. Appl. 2024, 238, 122328. [Google Scholar] [CrossRef]
  10. Cao, E.; Bao, T.; Yuan, R.; Hu, S. Hierarchical prediction of dam deformation based on hybrid temporal network and load-oriented residual correction. Eng. Struct. 2024, 308, 117949. [Google Scholar] [CrossRef]
  11. Wen, L.; Li, Y.; Zhao, W.; Cao, W.; Zhang, H. Predicting the deformation behaviour of concrete face rockfill dams by combining support vector machine and AdaBoost ensemble algorithm. Comput. Geotech. 2023, 161, 105611. [Google Scholar] [CrossRef]
  12. Gu, H.; Yang, M.; Gu, C.-S.; Huang, X.-F. A factor mining model with optimized random forest for concrete dam deformation monitoring. Water Sci. Eng. 2021, 14, 330–336. [Google Scholar] [CrossRef]
  13. Li, Y.-L.; Yin, Q.-G.; Zhang, Y.; Zhou, H. Deformation prediction model of concrete face rockfill dams based on an improved random forest model. Water Sci. Eng. 2023, 16, 390–398. [Google Scholar] [CrossRef]
  14. Gu, C.; Wang, Y.; Gu, H.; Hu, Y.; Yang, M.; Cao, W.; Fang, Z. A Combined Safety Monitoring Model for High Concrete Dams. Appl. Sci. 2022, 12, 12103. [Google Scholar] [CrossRef]
  15. Su, H.; Li, X.; Yang, B.; Wen, Z. Wavelet support vector machine-based prediction model of dam deformation. Mech. Syst. Signal Process. 2018, 110, 412–427. [Google Scholar] [CrossRef]
  16. Xing, Y.; Chen, Y.; Huang, S.; Wang, P.; Xiang, Y. Research on Dam Deformation Prediction Model Based on Optimized SVM. Processes 2022, 10, 1842. [Google Scholar] [CrossRef]
  17. Meng, Z.; Hu, Y.; Jiang, S.; Zheng, S.; Zhang, J.; Yuan, Z.; Yao, S. Slope Deformation Prediction Combining Particle Swarm Optimization-Based Fractional-Order Grey Model and K-Means Clustering. Fractal Fract. 2025, 9, 210. [Google Scholar] [CrossRef]
  18. Sun, X.; Lu, T.; Hu, S.; Wang, H.; Wang, Z.; He, X.; Ding, H.; Zhang, Y. A New Algorithm for Predicting Dam Deformation Using Grey Wolf-Optimized Variational Mode Long Short-Term Neural Network. Remote Sens. 2024, 16, 3978. [Google Scholar] [CrossRef]
  19. Cai, S.; Gao, H.; Zhang, J.; Peng, M. A self-attention-LSTM method for dam deformation prediction based on CEEMDAN optimization. Appl. Soft Comput. 2024, 159, 111615. [Google Scholar] [CrossRef]
  20. Zhang, Y.; Zhong, W.; Li, Y.; Wen, L. A deep learning prediction model of DenseNet-LSTM for concrete gravity dam deformation based on feature selection. Eng. Struct. 2023, 295, 116827. [Google Scholar] [CrossRef]
  21. Su, Y.; Fu, J.; Lin, W.; Lin, C.; Lai, X.; Xie, X. Dam Deformation Monitoring Model Based on Deep Learning and Split Conformal Quantile Prediction. Appl. Sci. 2025, 15, 1960. [Google Scholar] [CrossRef]
  22. Pan, J.; Liu, W.; Liu, C.; Wang, J. Convolutional neural network-based spatiotemporal prediction for deformation behavior of arch dams. Expert Syst. Appl. 2023, 232, 120835. [Google Scholar] [CrossRef]
  23. Luo, S.; Wei, B.; Chen, L. Multi-point deformation monitoring model of concrete arch dam based on MVMD and 3D-CNN. Appl. Math. Model. 2024, 125, 812–826. [Google Scholar] [CrossRef]
  24. Lin, C.; Weng, K.; Lin, Y.; Zhang, T.; He, Q.; Su, Y. Time Series Prediction of Dam Deformation Using a Hybrid STL–CNN–GRU Model Based on Sparrow Search Algorithm Optimization. Appl. Sci. 2022, 12, 11951. [Google Scholar] [CrossRef]
  25. Zhou, T.; Wei, Y.; Jie, Y.; Zhang, Y. Prediction intervals for concrete face sandy gravel dam settlement using Kalman filter-based kernel extreme learning machine. Measurement 2024, 236, 115094. [Google Scholar] [CrossRef]
  26. Chen, B.; Huang, Z.-S.; Bao, T.-F.; Zhu, Z. Deformation early-warning index for heightened gravity dam during impoundment period. Water Sci. Eng. 2021, 14, 54–64. [Google Scholar] [CrossRef]
  27. Zhan, M.; Chen, B.; Wu, Z. Deformation warning index for reinforced concrete dam based on structural health monitoring data and numerical simulation. Water Sci. Eng. 2023, 16, 408–418. [Google Scholar] [CrossRef]
  28. Chen, X.; Sun, W.; Liu, Y.; Fan, X.; Gu, C.; Guo, J.; Li, B.; Hu, S. Considering integrated information on environmental features and neighborhood deformation: A missing value filling framework for arch dam deformation sequence. Adv. Eng. Inform. 2025, 63, 102959. [Google Scholar] [CrossRef]
  29. Banerjee, S.; Ghorai, S.; Dhara, M.; Naskar, H.; Ali, S.B.; Das, N.; Saha, P.; Tudu, B.; Chatterjee, A.; Bandyopadhyay, R.; et al. Accurate prediction of piperine content in black pepper using combined CNN and regression modelling with PDMAM@G electrode and cyclic voltammetry. J. Food Compos. Anal. 2025, 141, 107355. [Google Scholar] [CrossRef]
  30. Li, M.; Zhou, Q.; Han, X.; Lv, P. Prediction of reference crop evapotranspiration based on improved convolutional neural network (CNN) and long short-term memory network (LSTM) models in Northeast China. J. Hydrol. 2024, 645, 132223. [Google Scholar] [CrossRef]
  31. Kang, X.; Li, Y.; Zhang, Y.; Wen, L.; Sun, X.; Wang, J. PCA-IEM-DARNN: An enhanced dual-stage deep learning prediction model for concrete dam deformation based on feature decomposition. Measurement 2025, 242, 115664. [Google Scholar] [CrossRef]
  32. Mi, X.; Yu, L.; Zhang, J.; Liu, R.; Hu, B.; Qiu, S. Analysis of fracture spatial distributions and fast reconstruction of discrete fracture networks model based on non-parametric kernel density estimation method. Eng. Geol. 2025, 351, 108034. [Google Scholar] [CrossRef]
  33. Zhou, J.; Zhou, L.; Zhao, Y.; Wu, K. Significant wave height prediction based on improved fuzzy C-means clustering and bivariate kernel density estimation. Renew. Energy 2025, 245, 122787. [Google Scholar] [CrossRef]
  34. Jia, D.; Yang, J.; Ma, C.; Cheng, L.; Xiao, S.; Gong, X. Research on arch dam deformation prediction method based on interpretability clustering and panel data model. Eng. Struct. 2025, 329, 119794. [Google Scholar] [CrossRef]
Figure 1. CNN structure.
Infrastructures 10 00170 g001
Figure 2. Visualization of the convolution process.
Infrastructures 10 00170 g002
Figure 3. Visualization of the pooling process.
Infrastructures 10 00170 g003
Figure 4. Geometric significance of principal component analysis.
Infrastructures 10 00170 g004
Figure 5. Technology route.
Infrastructures 10 00170 g005
Figure 6. Layout of measuring points at the top of the dam and technical details of data measurement. (a) Point layout, (b) data measurement technical details.
Infrastructures 10 00170 g006
Figure 7. Displacement change curves of each measurement point.
Infrastructures 10 00170 g007
Figure 8. Two-dimensional array of factors and convolutional manner.
Infrastructures 10 00170 g008
Figure 9. Displacement output results for TP1-1.
Infrastructures 10 00170 g009
Figure 10. Displacement output results for TP6-1.
Infrastructures 10 00170 g010
Figure 11. Displacement output results for TP11-1.
Infrastructures 10 00170 g011
Figure 12. Displacement output results for TP16-1.
Infrastructures 10 00170 g012
Figure 13. Displacement output results for TP20-1.
Infrastructures 10 00170 g013
Figure 14. Results of deformation performance evaluation indexes for each measurement point: (a) TP1-1, (b) TP6-1, (c) TP11-1, (d) TP16-1, and (e) TP20-1.
Infrastructures 10 00170 g014aInfrastructures 10 00170 g014b
Figure 15. Absolute displacement residuals for TP1-1.
Infrastructures 10 00170 g015
Figure 16. Absolute displacement residuals for TP6-1.
Infrastructures 10 00170 g016
Figure 17. Absolute displacement residuals for TP11-1.
Infrastructures 10 00170 g017
Figure 18. Absolute displacement residuals for TP16-1.
Infrastructures 10 00170 g018
Figure 19. Absolute displacement residuals for TP20-1.
Infrastructures 10 00170 g019
Figure 20. Systematic displacement residual index for TP20-1.
Infrastructures 10 00170 g020
Figure 21. Kernel density function curves and cumulative distribution curves. (a) Results of the kernel density function. (b) Results of the corresponding cumulative distribution curve.
Infrastructures 10 00170 g021
Figure 22. Predicted results and absolute displacement residuals at each measurement point.
Infrastructures 10 00170 g022
Figure 23. Real-time early warning results of overall deformation of the arch dam.
Infrastructures 10 00170 g023
Disclaimer/Publisher’s Note: The statements, opinions and data contained in all publications are solely those of the individual author(s) and contributor(s) and not of MDPI and/or the editor(s). MDPI and/or the editor(s) disclaim responsibility for any injury to people or property resulting from any ideas, methods, instructions or products referred to in the content.

