
Concrete Bridge Crack Detection Using Unmanned Aerial Vehicles and Image Segmentation

Abstract
1. Introduction
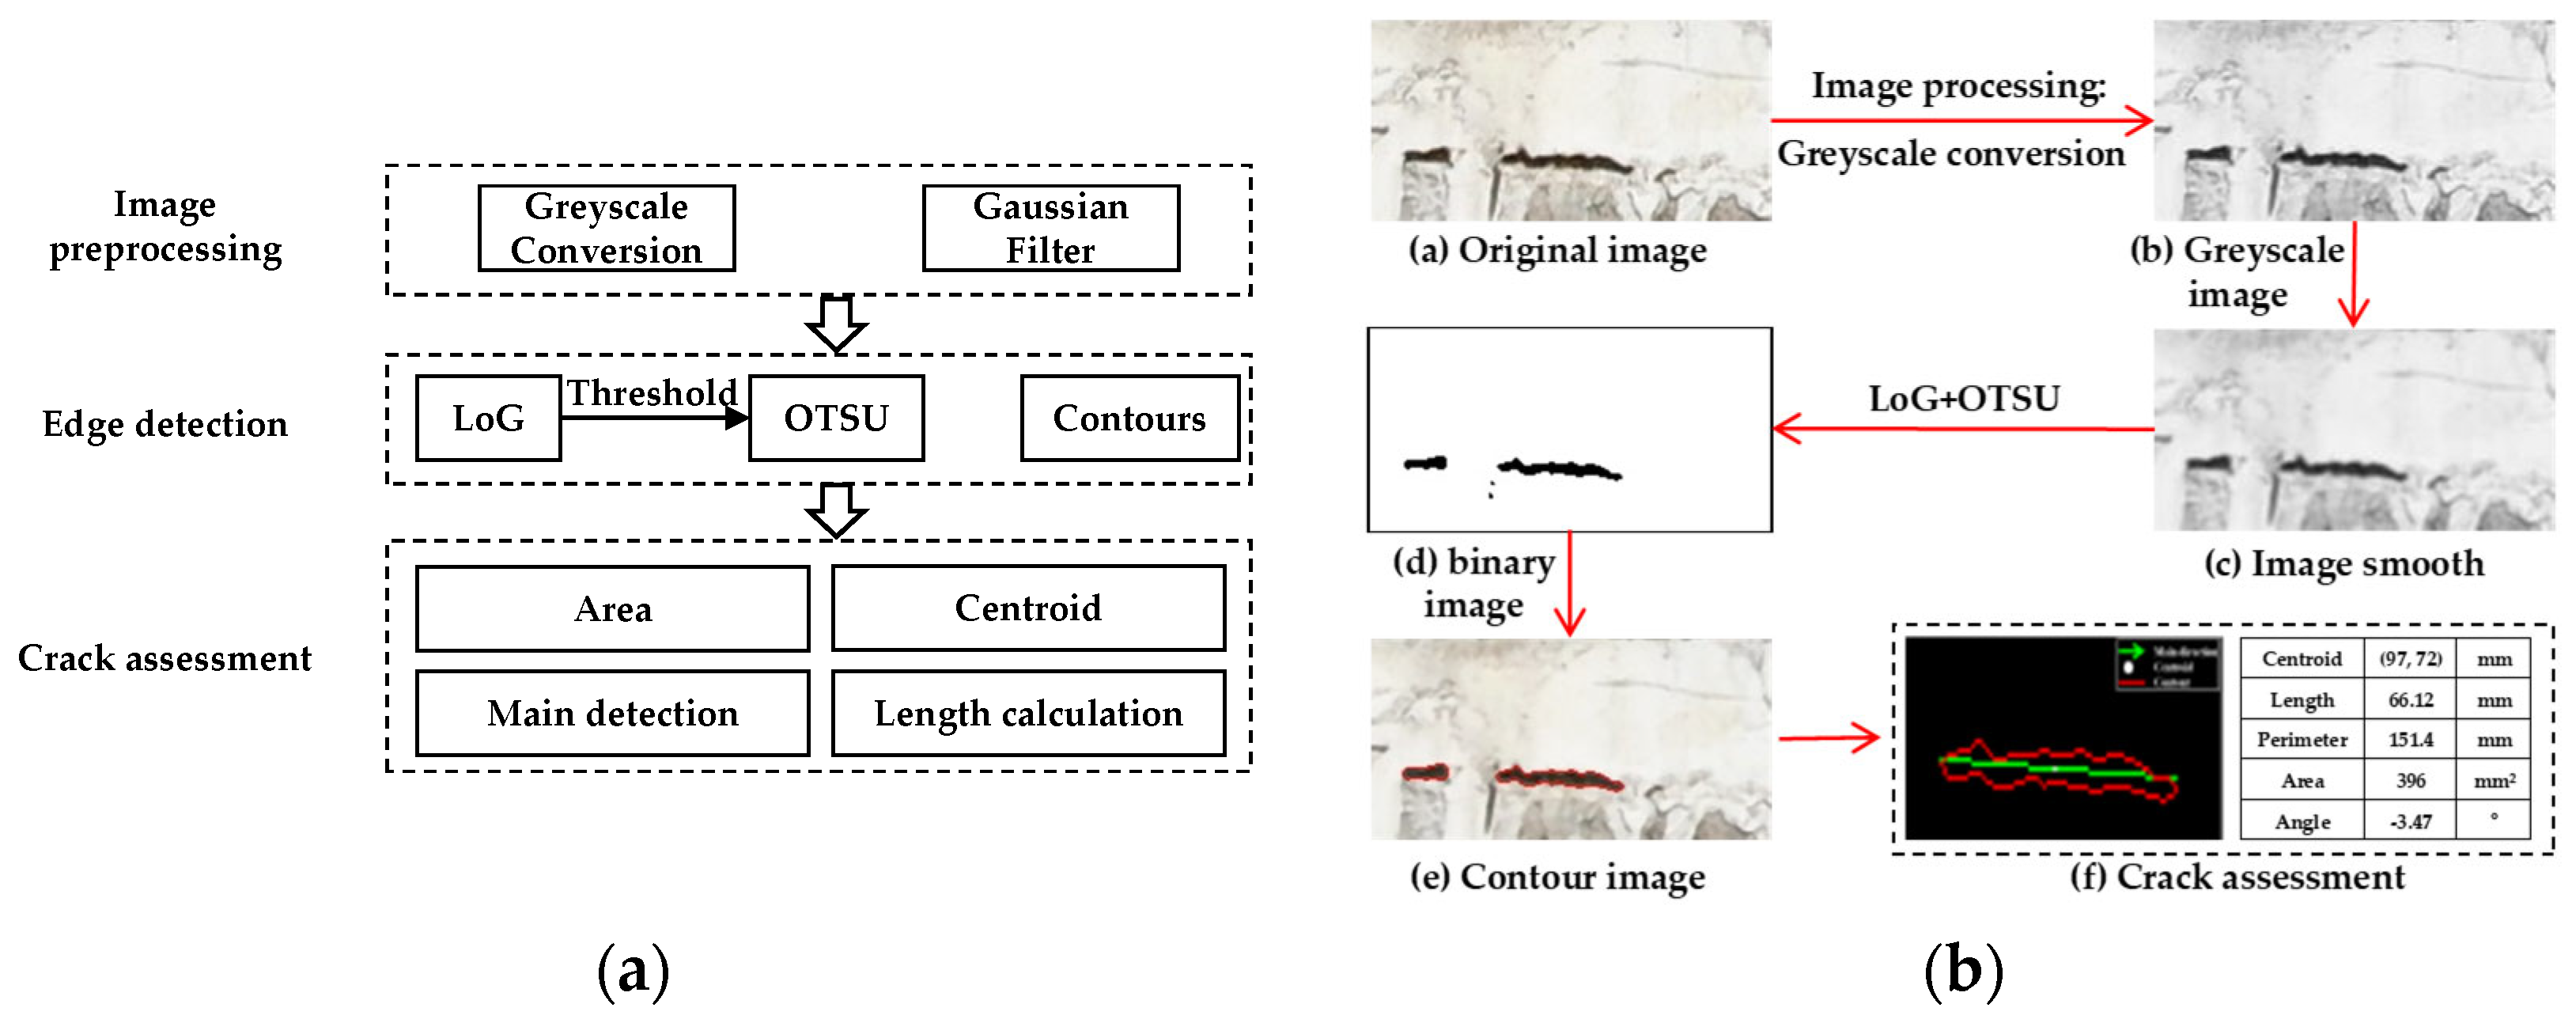
2. Methodology
2.1. Workflow
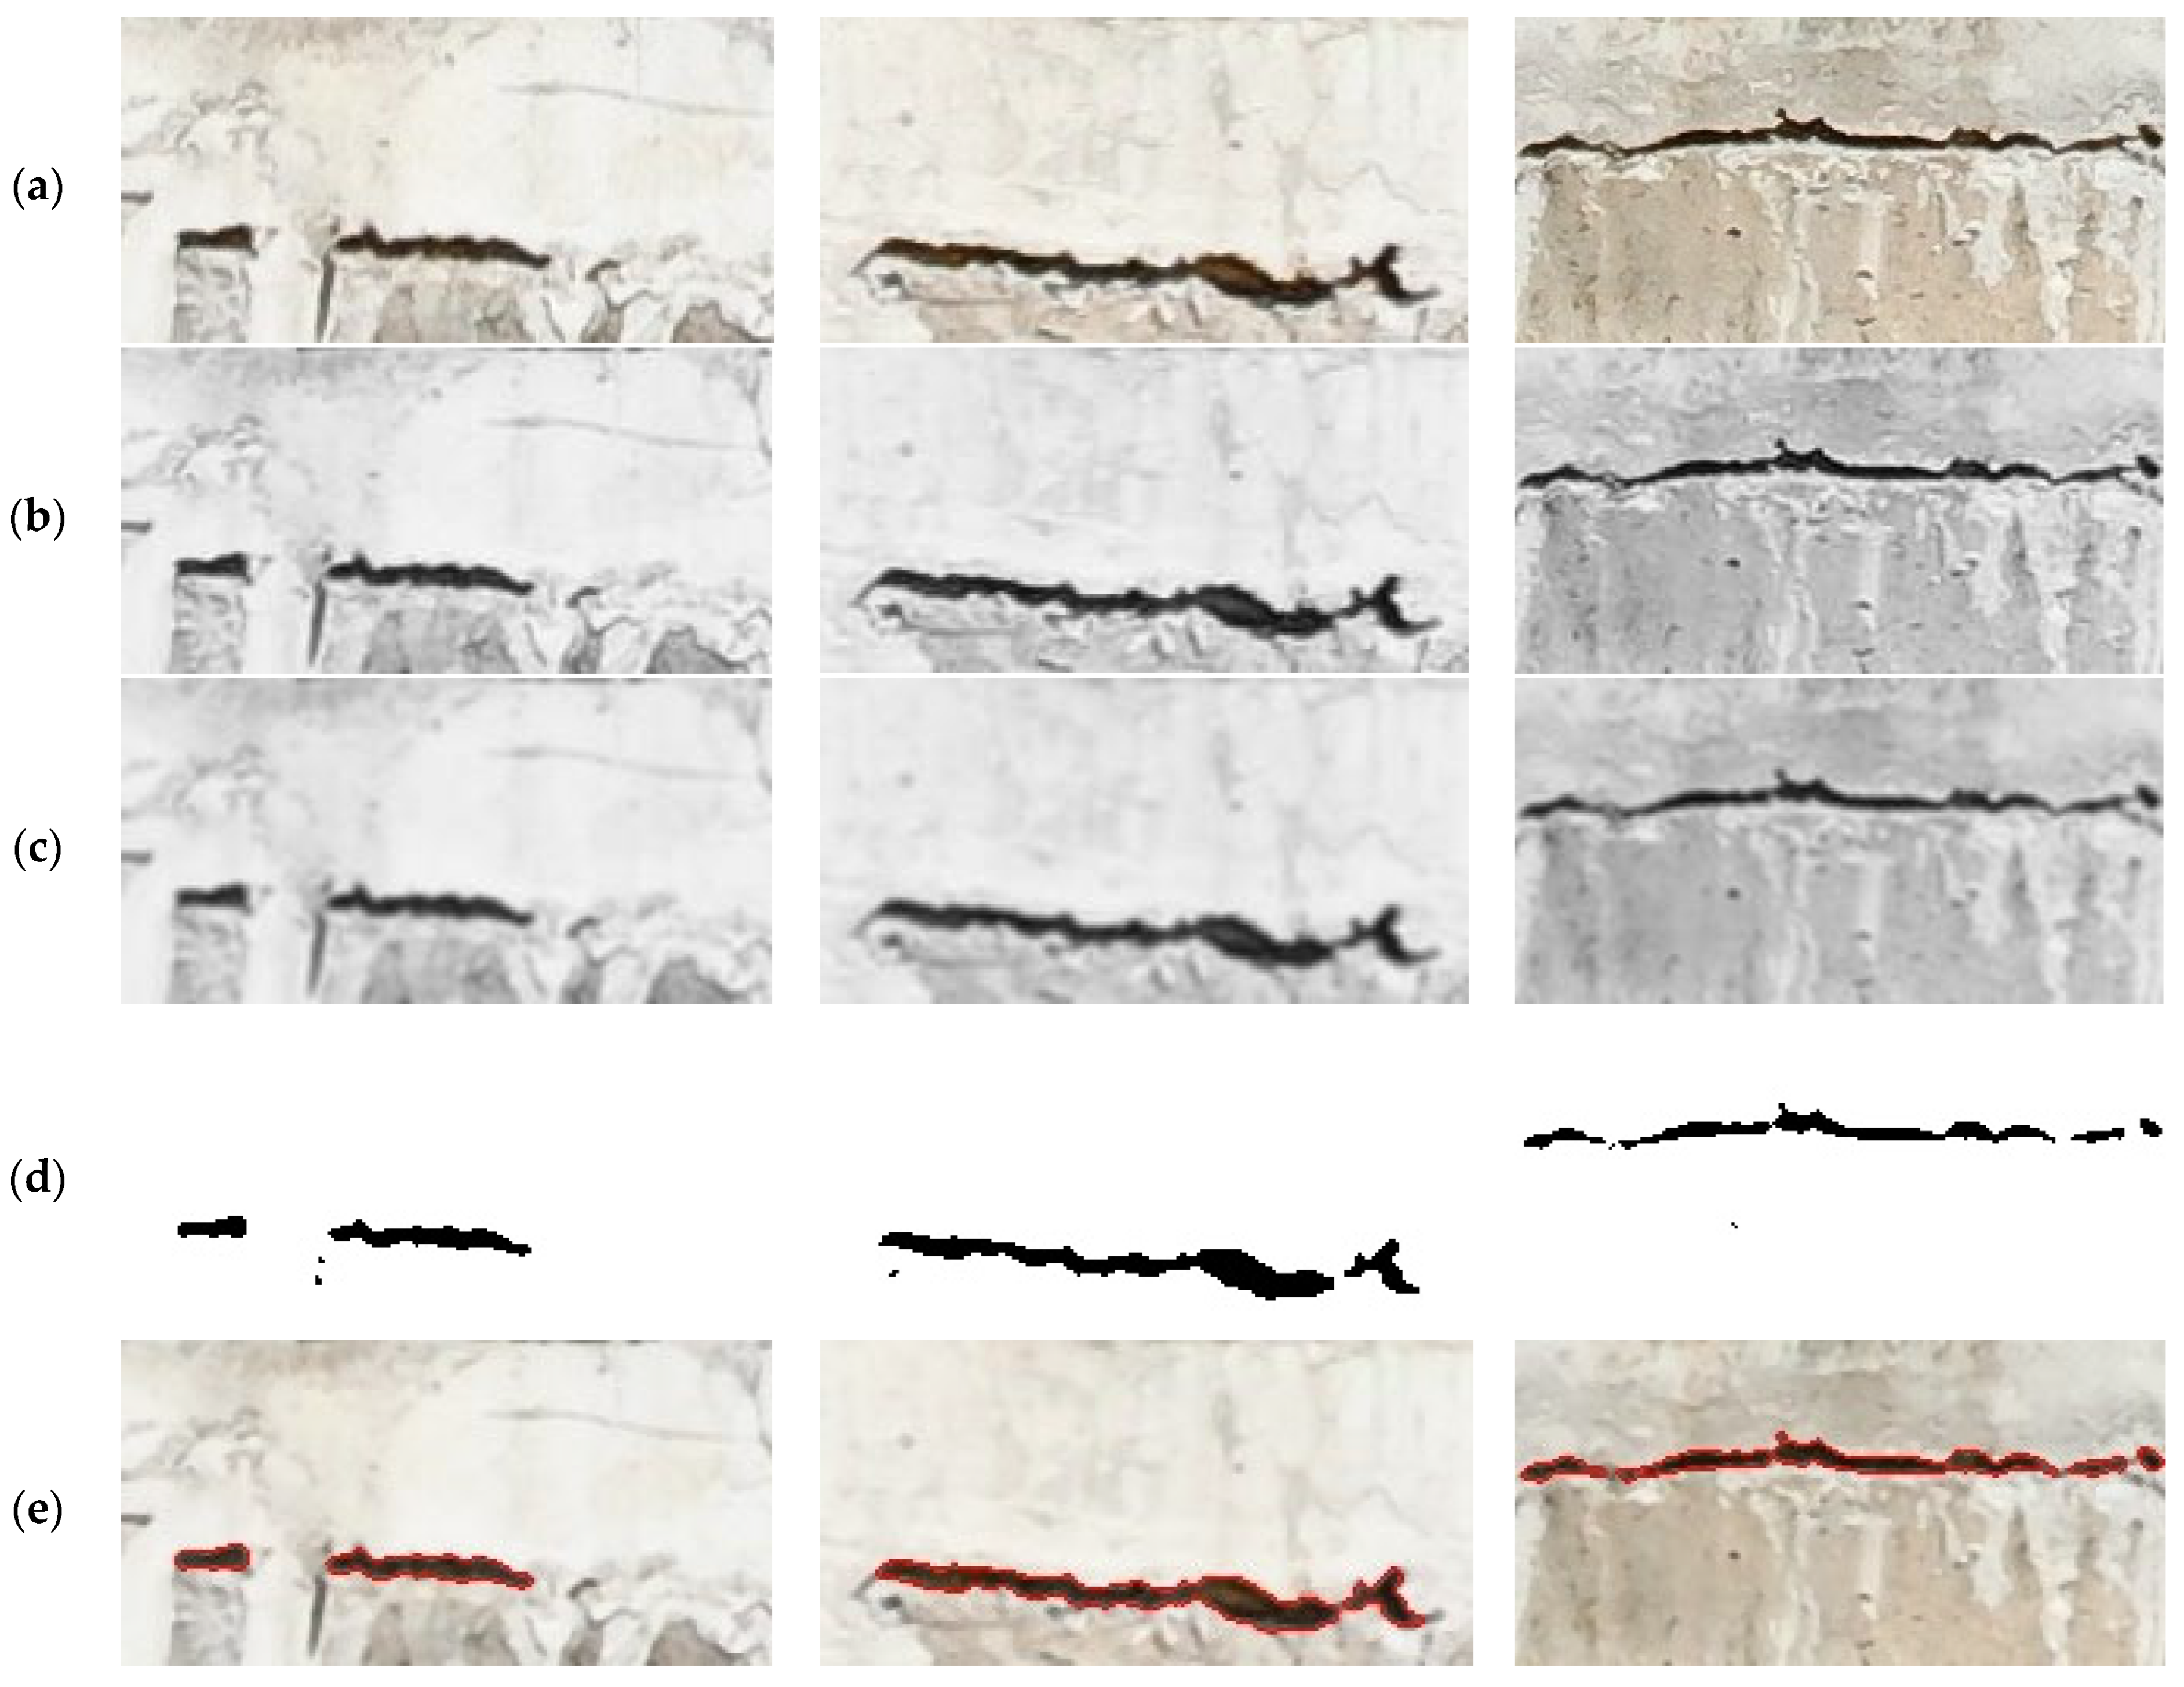
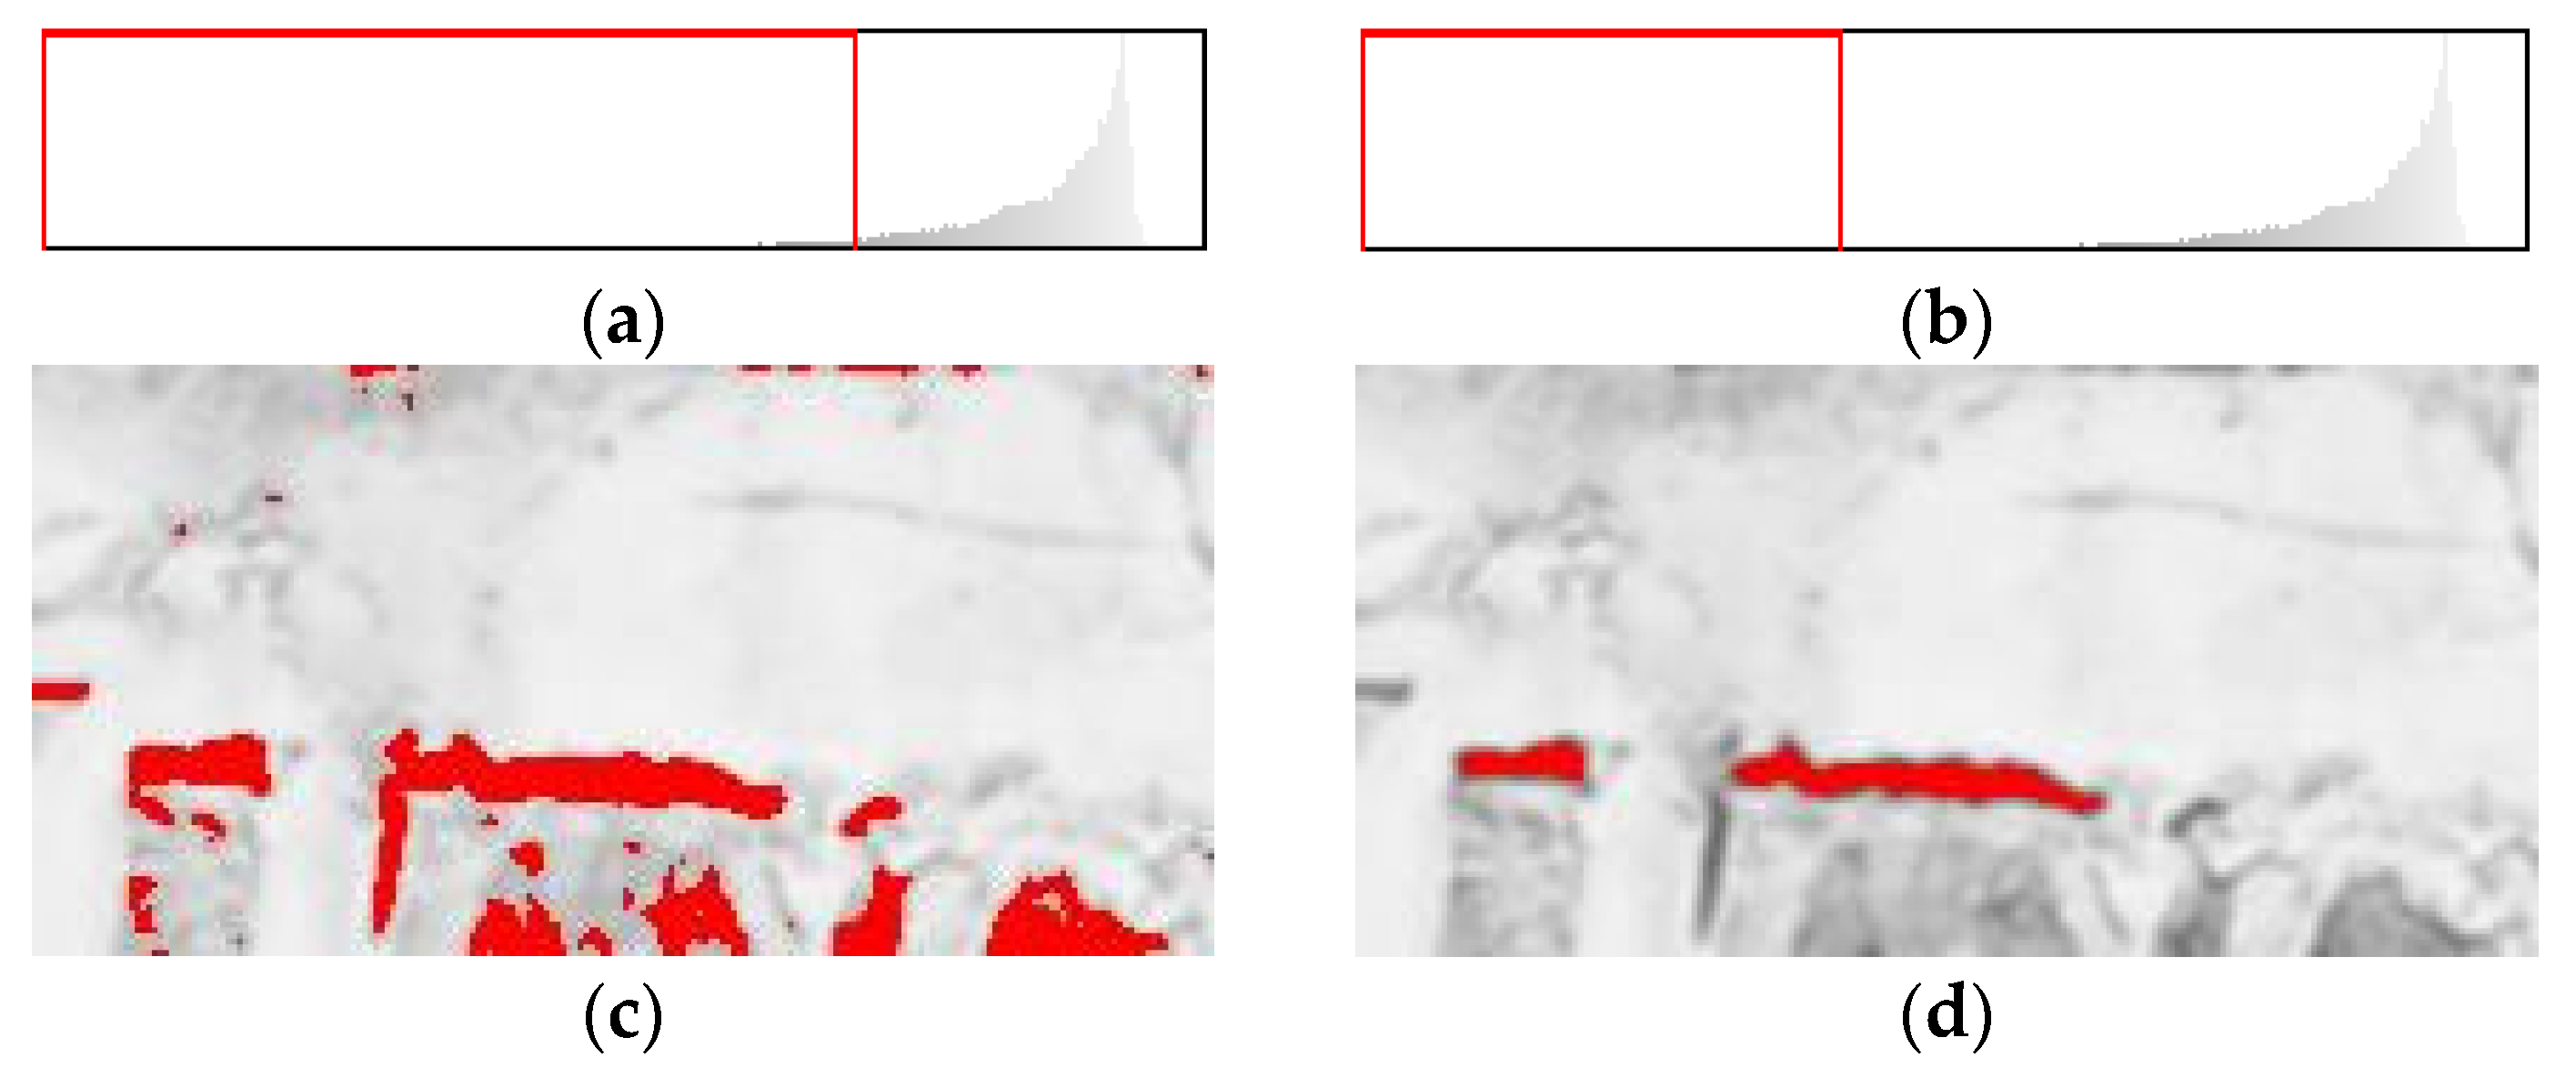
2.2. Image Preprocessing
2.3. Laplacian of Gaussian (LoG)
2.4. Crack Contour Detection
- If a candidate pixel’s value (Pv) is less than the threshold value, the pixel was identified as undamaged area and the pixel value in I(x, y) was set to 0.
- On the contrary, if a candidate pixel’s value (Pv) is equal or greater than the threshold value, the pixel was identified as damaged area and the pixel value in I(x, y) was set to 1.
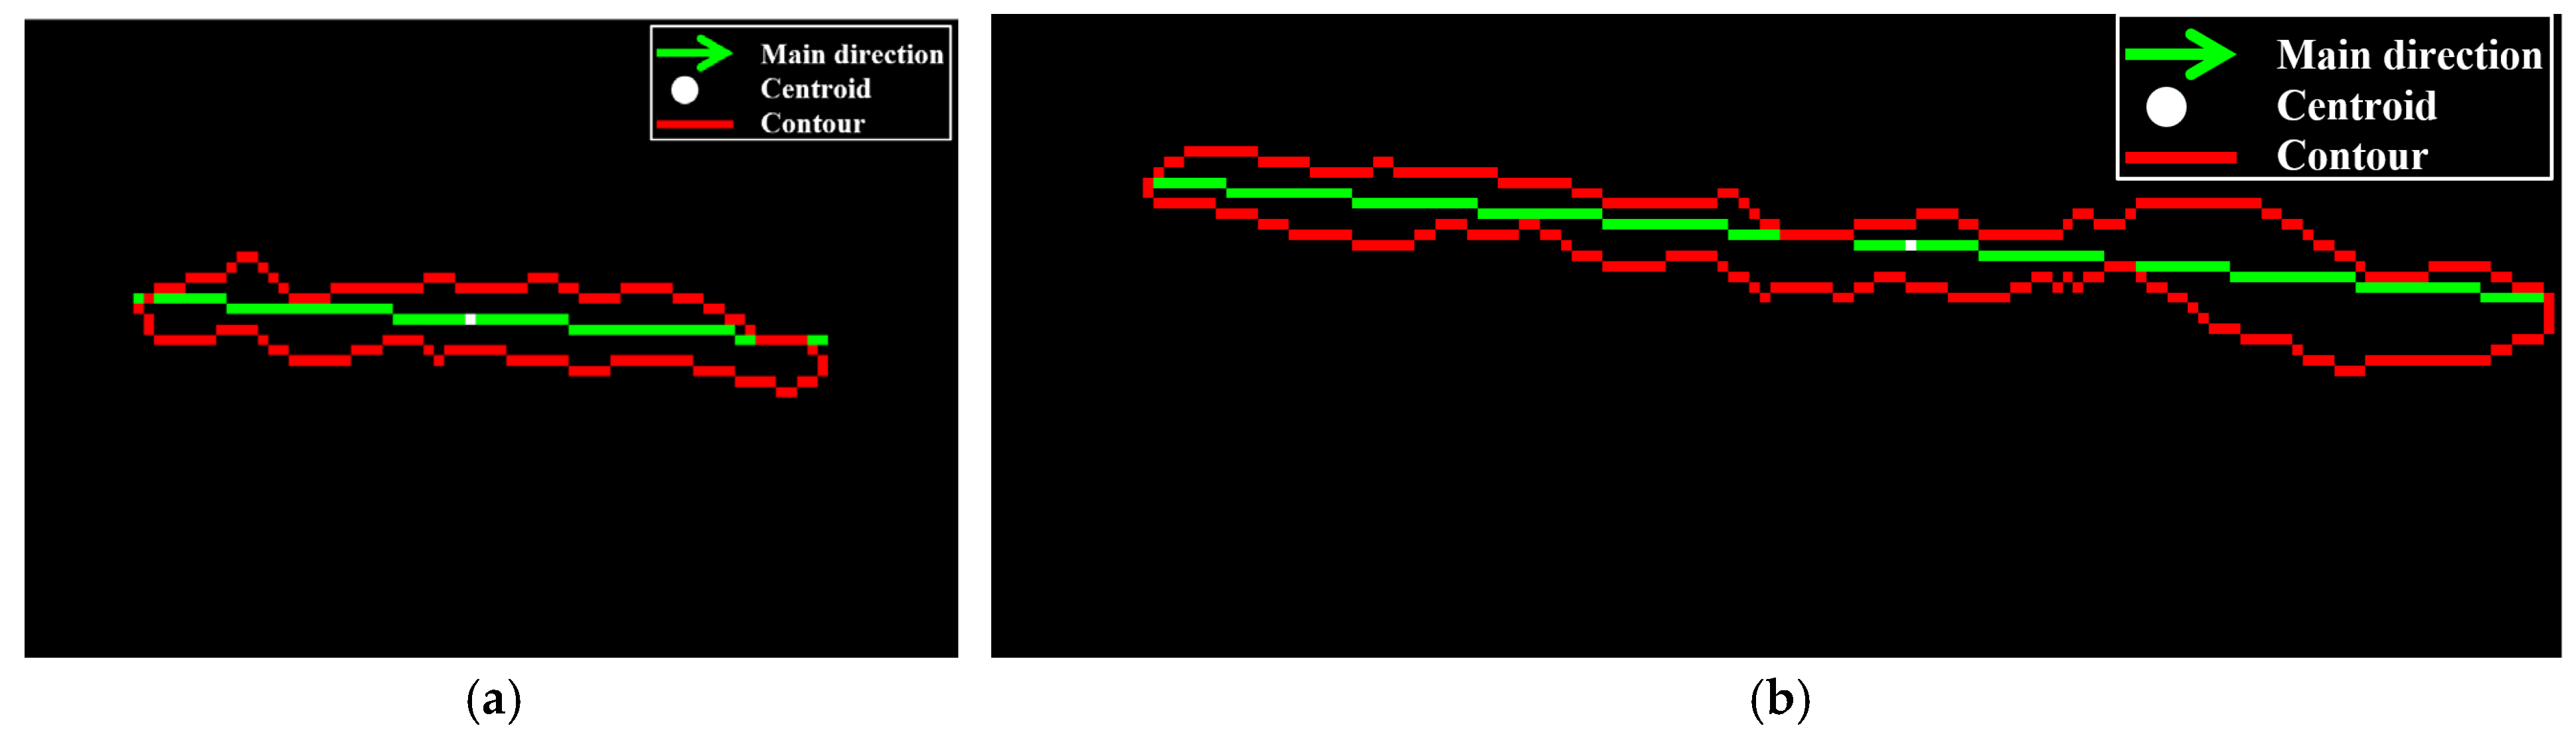
2.5. Crack Feature Calculation
2.5.1. Area Calculation
2.5.2. Centroid Location
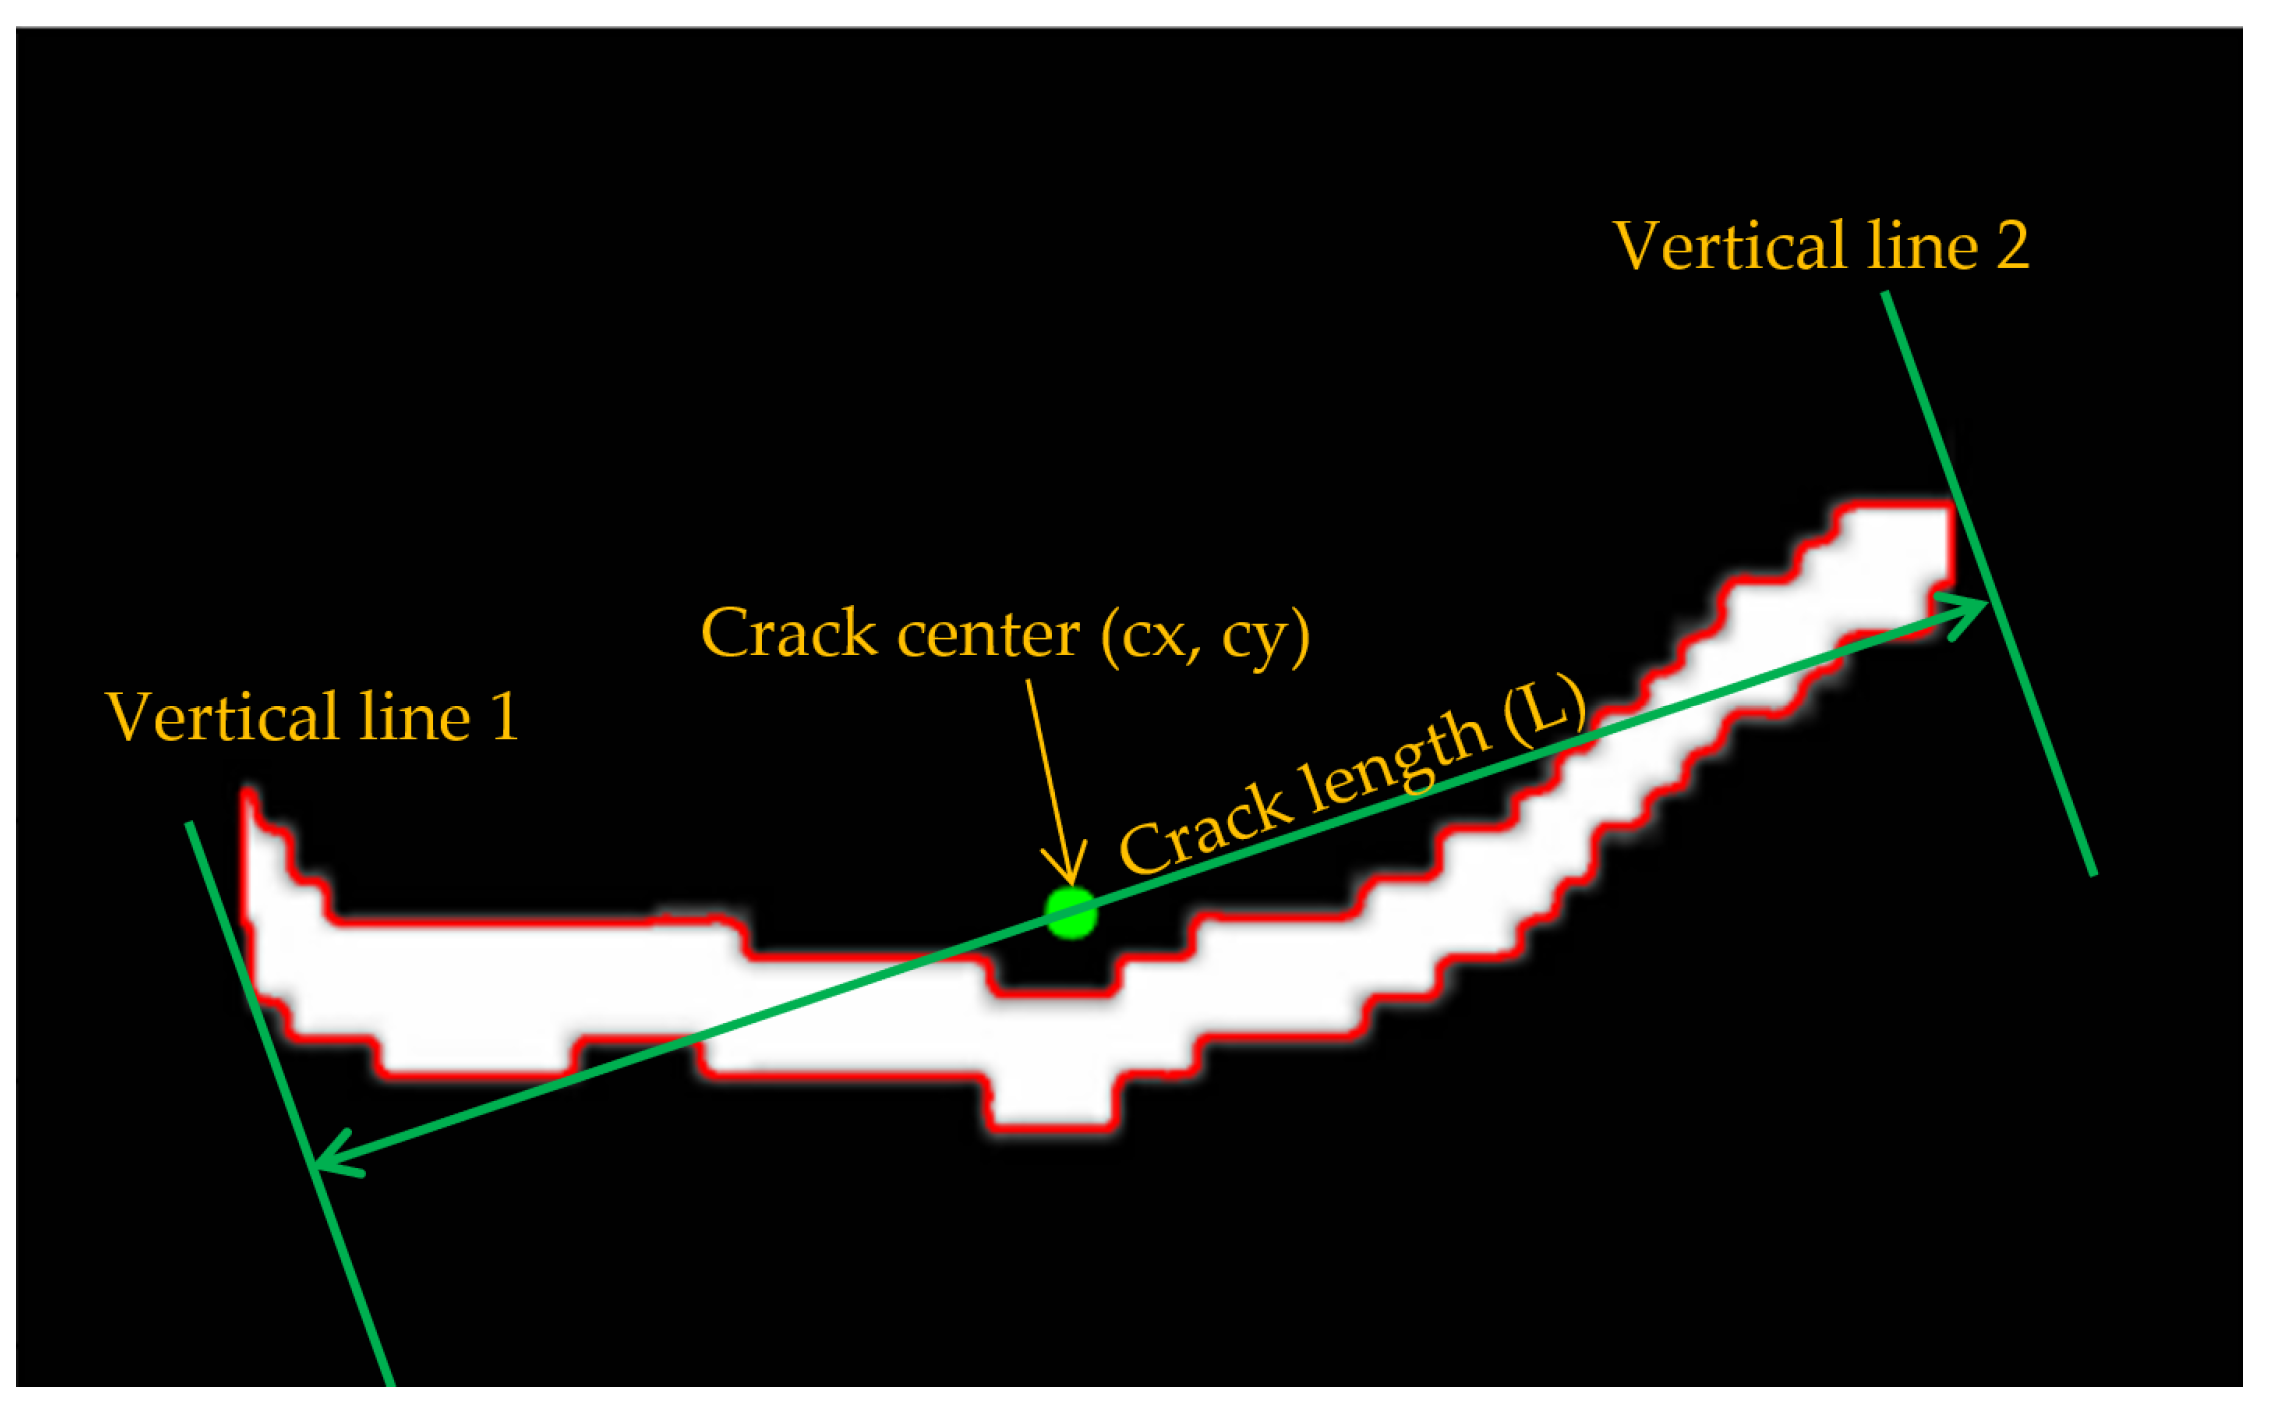
2.5.3. Main Direction
2.5.4. Length Calculation
3. Results
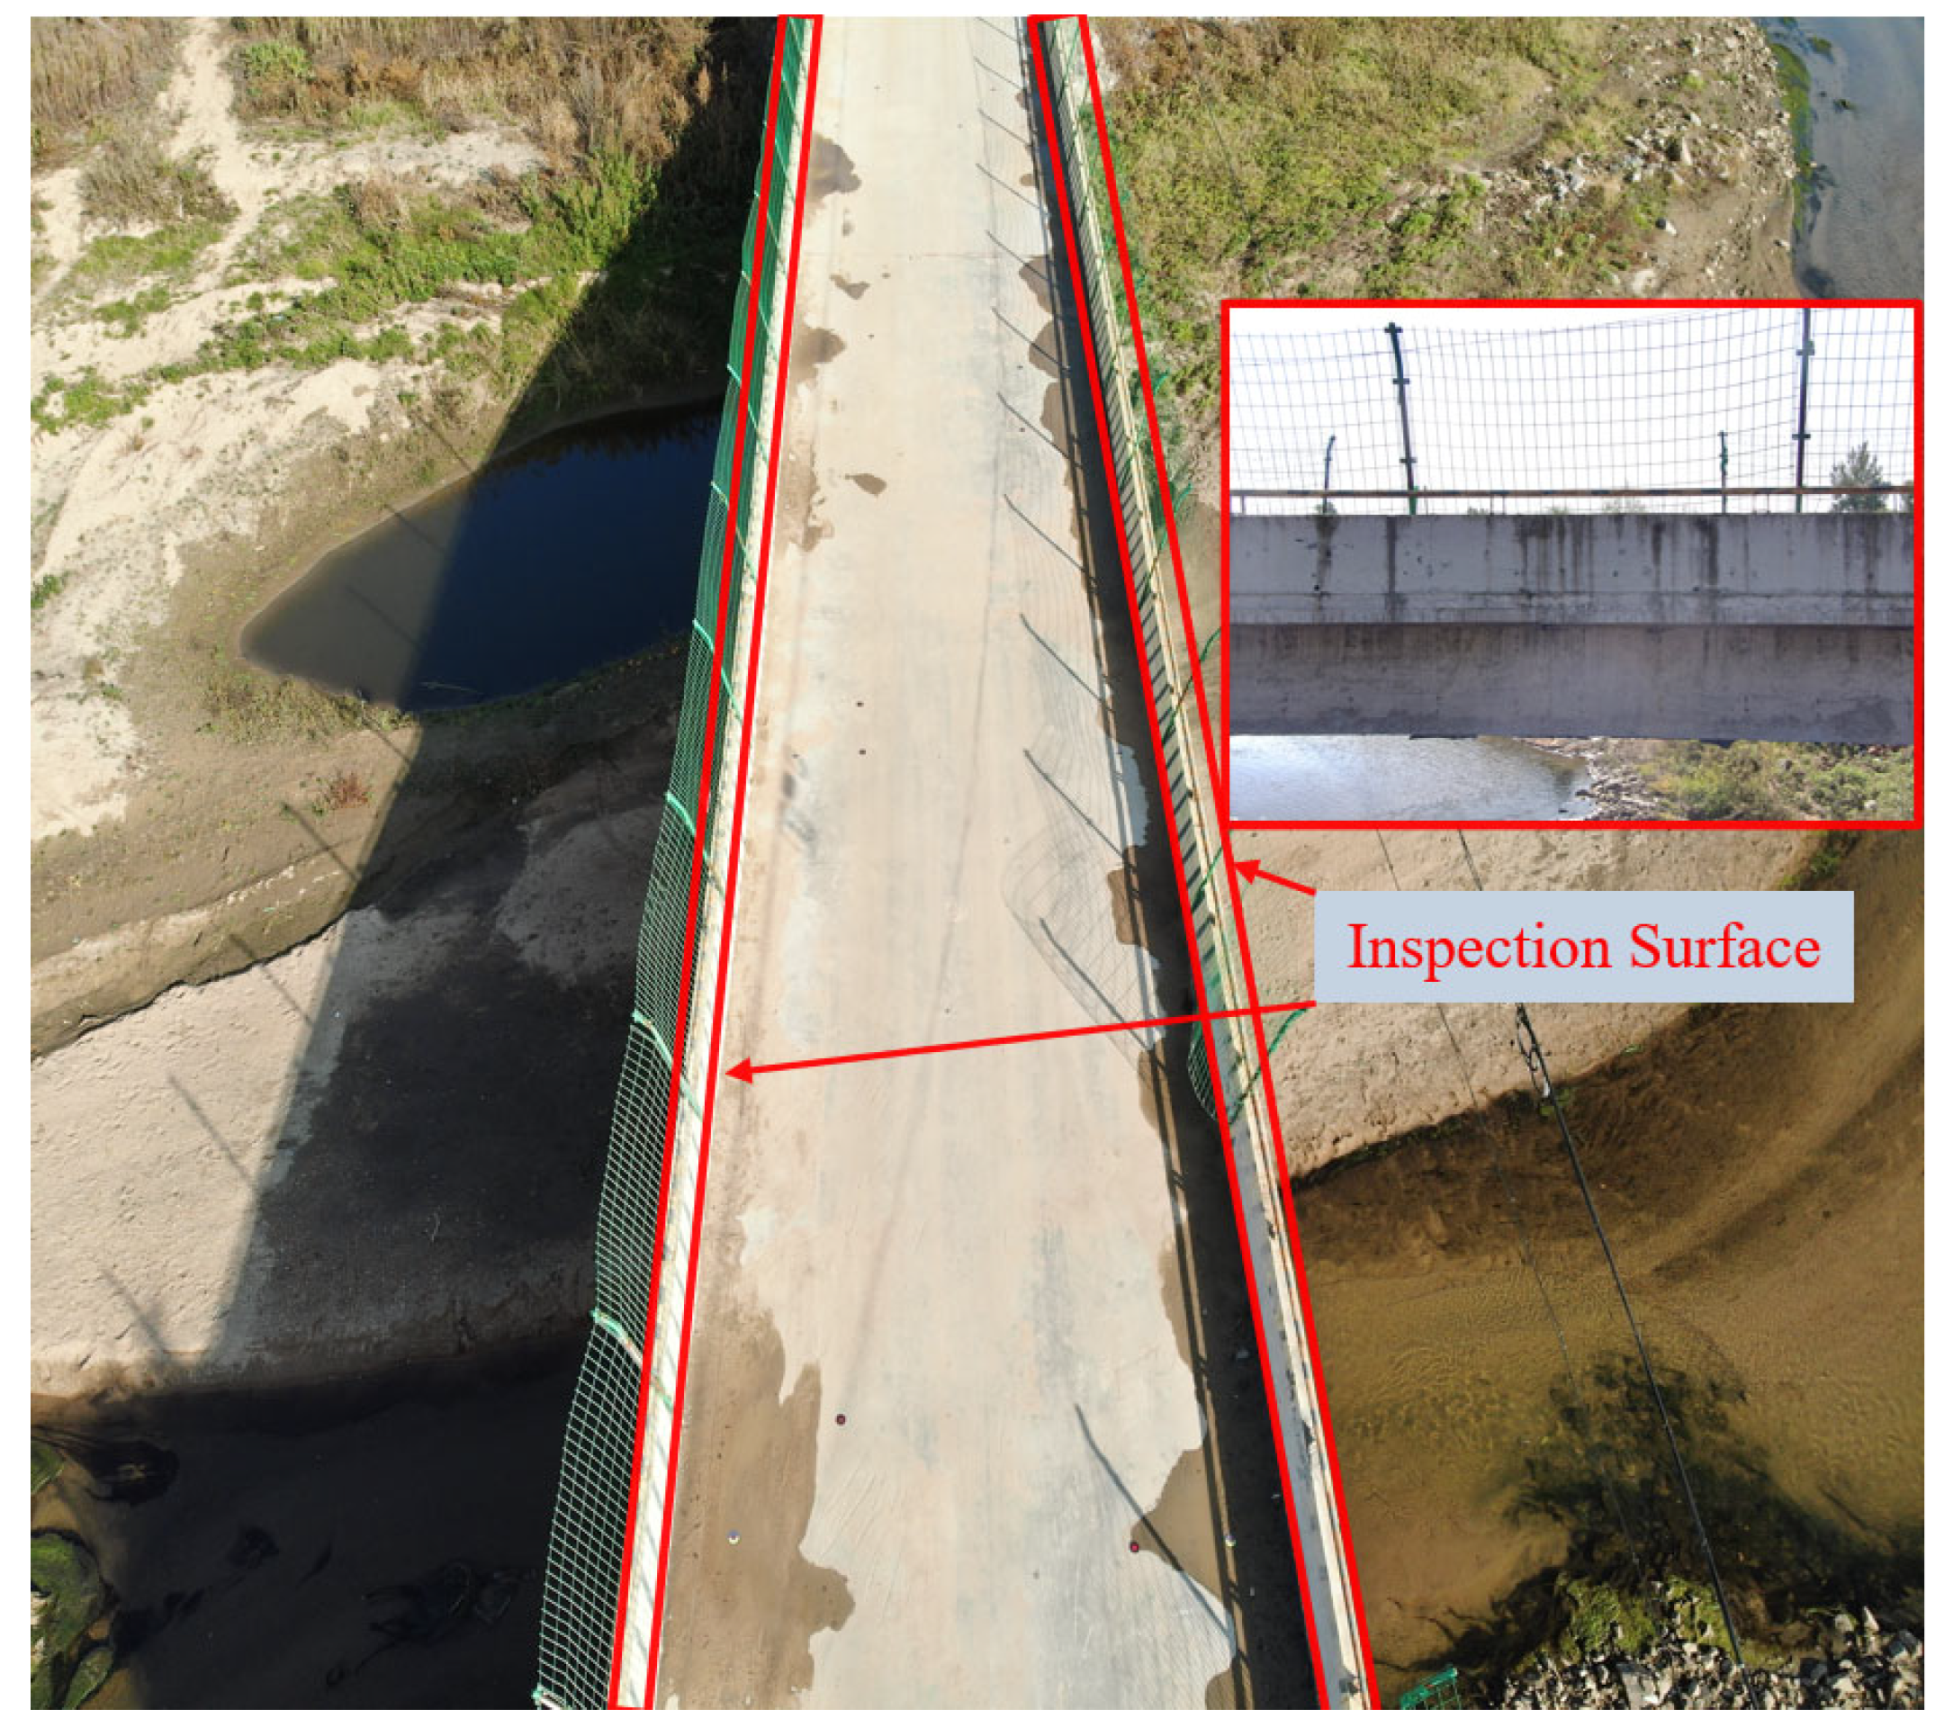
3.1. Experimental Environment
- Logistics: A village is located nearby, and it was easy to transport and recharge equipment;
- Security considerations: Travel was conducted discreetly, and the number of operators was minimized. This research did not attract a crowd, which would have been unsafe. Also, drones often attract audiences who want to talk and ask questions, thereby distracting the operators;
- Legal issues: The bridge is in open country distant from airports and no-fly zones.
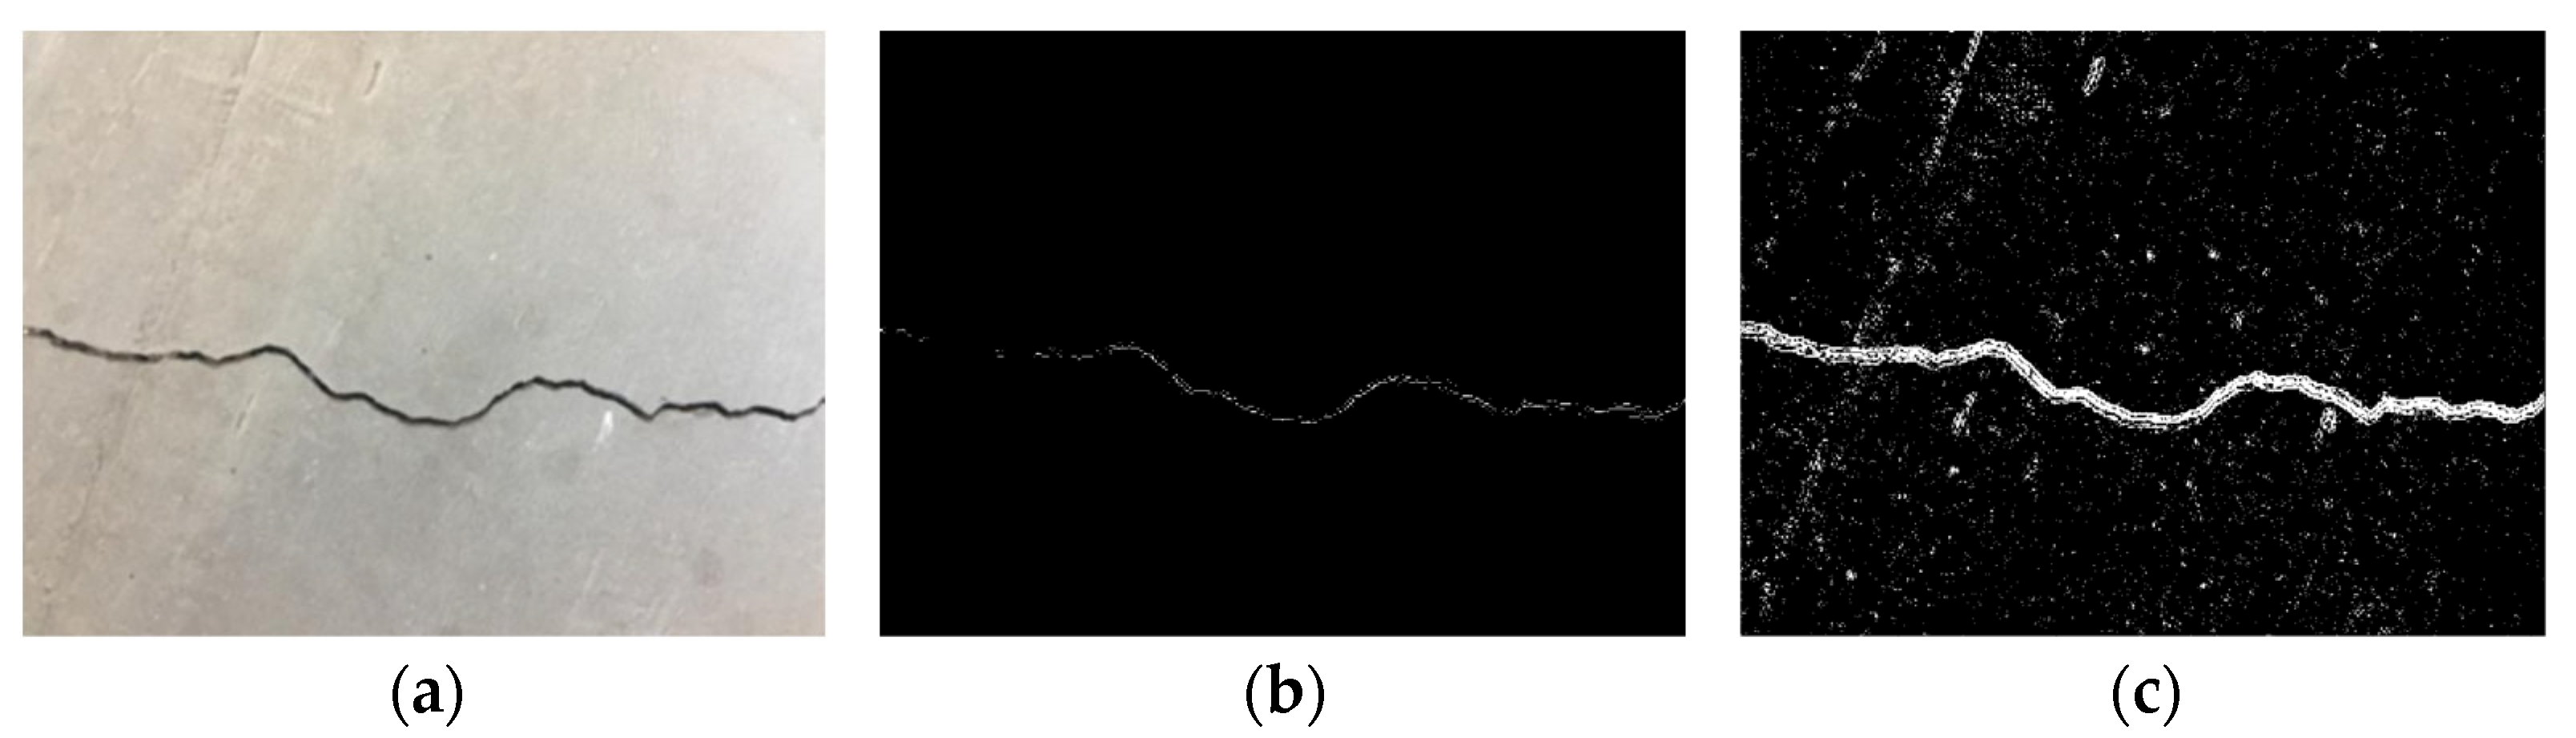
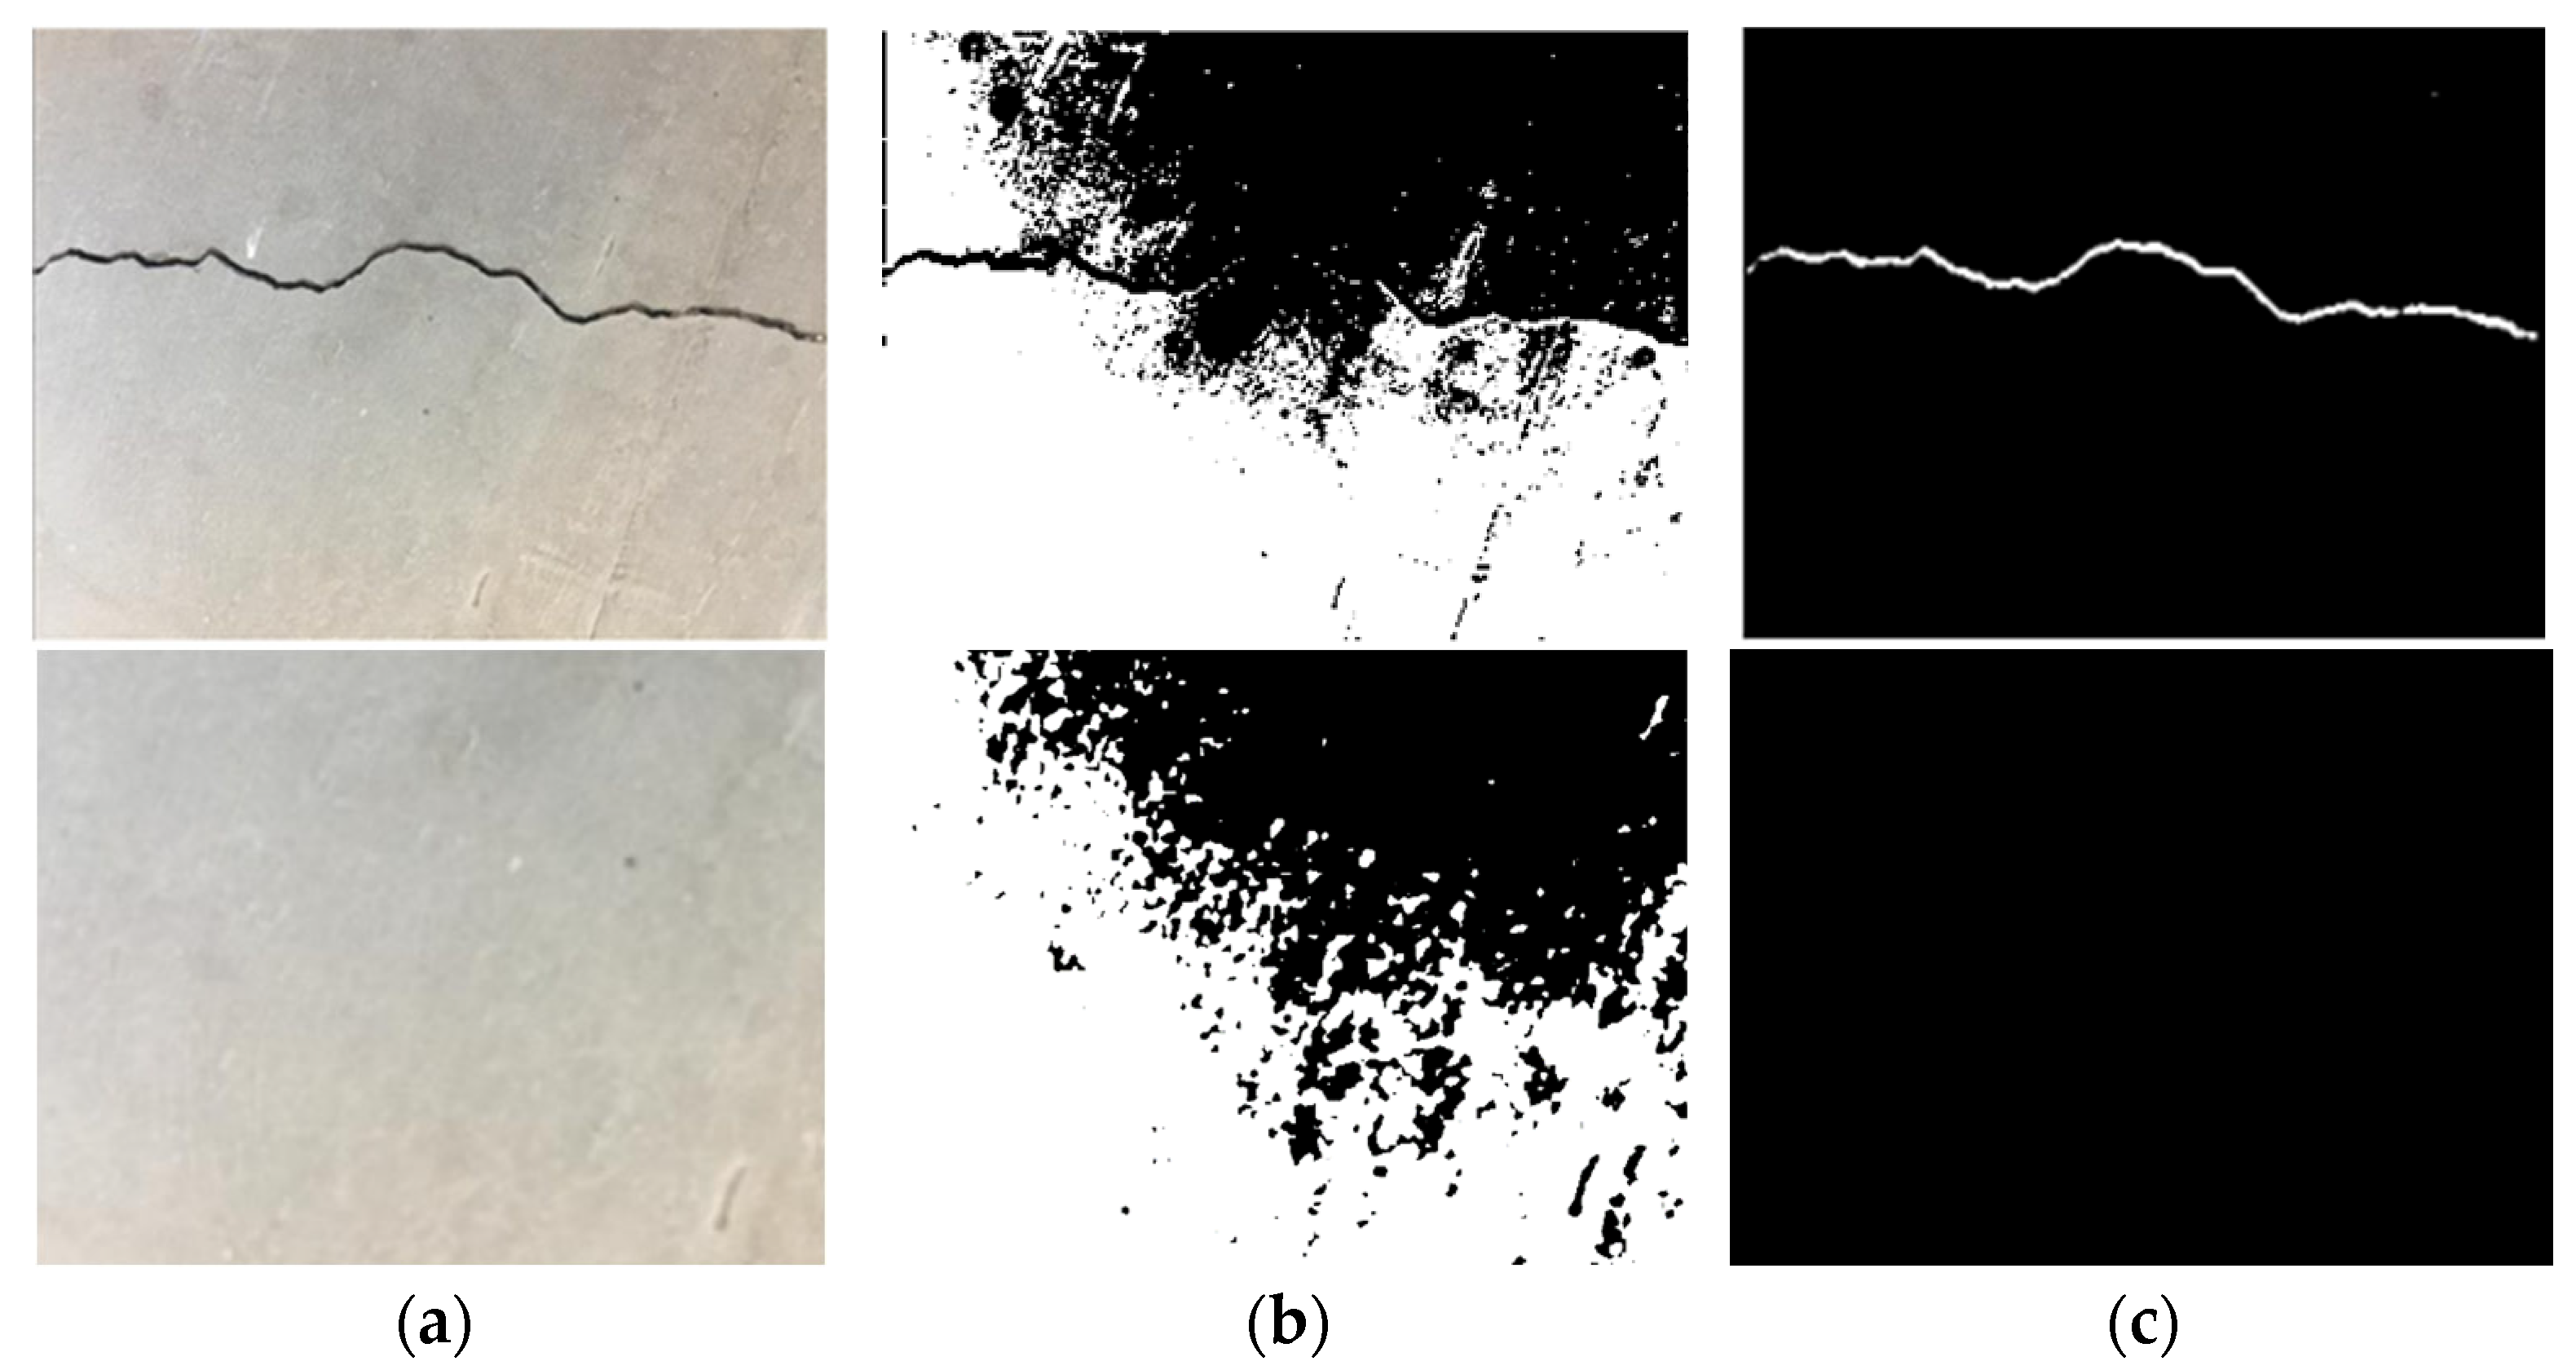
3.2. Damage Detection
3.3. Damage Assessment
3.4. Comparative Analysis of Different Detectors for Crack Detection
- True Positive (TP): The edge detector correctly identifies cracks in images containing cracks.
- True Negative (TN): The edge detector correctly detects no cracks in crack-free images.
- False Negative (FN): The edge detector fails to detect cracks in images that actually contain cracks.
- False Positive (FP): The edge detector incorrectly detects cracks in crack-free images.
4. Discussion
5. Conclusions
Author Contributions
Funding
Data Availability Statement
Acknowledgments
Conflicts of Interest
References
- Liang, H.; Lee, S.C.; Seo, S. UAV-based low altitude remote sensing for concrete bridge multi-category damage automatic detection system. Drones 2023, 7, 386. [Google Scholar] [CrossRef]
- Ren, M.; Zhang, X.F.; Chen, X.; Zhou, B.; Feng, Z.Y. YOLOv5s-M: A deep learning network model for road pavement damage detection from urban street-view imagery. Int. J. Appl. Earth Obs. Geoinf. 2023, 120, 103335. [Google Scholar] [CrossRef]
- Kim, S.Y.; Mukhiddinov, M. Data anomaly detection for structural health monitoring based on a convolutional neural network. Sensors 2023, 23, 8525. [Google Scholar] [CrossRef] [PubMed]
- Cai, C.; Chen, S.; Liu, L. Detection of fatigue cracks for concrete structures by using carbon ink-based conductive skin and electrical resistance tomography. Sensors 2023, 23, 8382. [Google Scholar] [CrossRef]
- Munawar, H.S.; Ullah, F.; Heravi, A.; Thaheem, M.J.; Maqsoom, A. Inspecting buildings using drones and computer vision: A machine learning approach to detect cracks and damages. Drones 2022, 6, 5. [Google Scholar] [CrossRef]
- Wu, W.J.; Veljkovic, M.; Kolstein, H.; Pijpers, R.; Maljaars, J. Fatigue behaviour of root crack in stiffener-to-deck plate weld at crossbeam of orthotropic bridge decks. Eng. Struct. 2024, 306, 117710. [Google Scholar] [CrossRef]
- Zhang, N.; Alipour, A. A stochastic programming approach to enhance the resilience of infrastructure under weather-related risk. Comput.-Aided Civ. Infrastruct. Eng. 2022, 38, 411–432. [Google Scholar] [CrossRef]
- Li, J.; Yu, Z.; Wu, J.; Ding, Q.; Xu, W.; Huang, S. The application of heat-shrinkable fibers and internal curing aggregates in the field of crack resistance of high-strength marine structural mass concrete: A review and prospects. Polymers 2023, 15, 3884. [Google Scholar] [CrossRef]
- Filizadeh, R.; Hernandez, E.M.; Rosowsky, D.V. Risk-based framework for post-earthquake monitoring and evaluation of reinforced concrete bridges subject to multiple hazards. Reliab. Eng. Syst. Saf. 2024, 245, 109992. [Google Scholar] [CrossRef]
- Song, F.; Liu, B.; Yuan, G.X. Pixel-level crack identification for bridge concrete structures using unmanned aerial vehicle photography and deep learning. Struct. Control Health Monit. 2024, 2024, 1299095. [Google Scholar] [CrossRef]
- Chen, Z.W.; Shi, Y.; Chen, J.F.; Zhang, Y. Effect of cracks on the influence lines of a smart concrete girder bridge based on the element size–independent FE model. Struct. Control Health Monit. 2024, 2024, 9980733. [Google Scholar] [CrossRef]
- Rehman, S.K.U.; Ibrahim, Z.; Memon, S.A.; Jameel, M. Nondestructive test methods for concrete bridges: A review. Constr. Build. Mater. 2016, 107, 58–86. [Google Scholar] [CrossRef]
- Machorro-Lopez, J.M.; Valtierra-Rodriguez, M.; Amezquita-Sanchez, J.P.; Carrion-Viramontes, F.J.; Quintana-Rodriguez, J.A. A shannon entropy-based methodology to detect and locate cables loss in a cable-stayed bridge. Int. J. Appl. Mech. 2021, 13, 2150063. [Google Scholar] [CrossRef]
- Machorro-Lopez, J.M.; Valtierra-Rodriguez, M.; Perez-Quiroz, J.T.; Amezquita-Sanchez, J.P. Comparative analysis of fractals-homogeneity-entropy algorithms applied on a FEM bridge model to identify damage. Infrastructures 2025, 10, 36. [Google Scholar] [CrossRef]
- Xiao, F.; Mao, Y.X.; Tian, G.; Chen, G.S. Partial-model-based damage identification of long-span steel truss bridge based on stiffness separation method. Struct. Control Health Monit. 2024, 2024, 5530300. [Google Scholar] [CrossRef]
- Xiao, F.; Mao, Y.X.; Sun, H.M.; Chen, G.S.; Tian, G. Stiffness separation method for reducing calculation time of truss structure damage identification. Struct. Control Health Monit. 2024, 2024, 5171542. [Google Scholar] [CrossRef]
- Kong, X.; Cai, C.S.; Hu, J. The state-of-the-art on framework of vibration-based structural damage identification for decision making. Appl. Sci. 2017, 7, 497. [Google Scholar] [CrossRef]
- Nhamage, I.A.; Horas, C.S.; Dang, N.S.; Campos e Matos, J.A.; Poças Martins, J. Strategies for maximising the value of digital twins for bridge management and structural monitoring: A systematic review. Arch. Computat. Methods Eng. 2025, 1–32. [Google Scholar] [CrossRef]
- Zoubir, H.; Rguig, M.; Mohamed, E.A.; Saadane, R.; Chehri, A. Pixel-level concrete bridge crack detection using Convolutional Neural Networks, Gabor filters, and attention mechanisms. Eng. Struct. 2024, 314, 118343. [Google Scholar] [CrossRef]
- Li, H.; Chen, Y.; Liu, J.; Zhang, Z.; Zhu, H. Unmanned aircraft system applications in damage detection and service life prediction for bridges: A review. Remote Sens. 2022, 14, 4210. [Google Scholar] [CrossRef]
- Dorafshan, S.; Thomas, R.J.; Maguire, M. SDNET2018: An annotated image dataset for non-contact concrete crack detection using deep convolutional neural networks. Data Brief 2018, 21, 1664–1668. [Google Scholar] [CrossRef] [PubMed]
- Jeong, E.; Seo, J.; Wacker, J. Literature review and technical survey on bridge inspection using unmanned aerial vehicles. J. Perform. Constr. Facil. 2020, 34, 04020113. [Google Scholar] [CrossRef]
- Fan, C.C.; Ding, Y.L.; Liu, X.J.; Yang, K. A review of crack research in concrete structures based on data-driven and intelligent algorithms. Structures 2025, 75, 108800. [Google Scholar] [CrossRef]
- Cabaleiro, M.; Lindenbergh, R.; Gard, W.; Arias, P.; van de Kuilen, J.W. Algorithm for automatic detection and analysis of cracks in timber beams from LiDAR data. Constr. Build. Mater. 2017, 130, 41–53. [Google Scholar] [CrossRef]
- Lee, D.E.; Choi, Y.; Hong, G.; Maruthi, M.; Yi, C.Y.; Park, Y.J. Parametric image-based concrete defect assessment method. Case Stud. Constr. Mater. 2024, 20, e02962. [Google Scholar] [CrossRef]
- Dorafshan, S.; Thomas, R.J.; Maguire, M. Comparison of deep convolutional neural networks and edge detectors for image-based crack detection in concrete. Constr. Build. Mater. 2018, 186, 1031–1045. [Google Scholar] [CrossRef]
- Cha, Y.J.; Choi, W.; Büyüköztürk, O. Deep learning-based crack damage detection using convolutional neural networks. Comput. Civ. Infrastruct. Eng. 2017, 32, 361–378. [Google Scholar] [CrossRef]
- Dorafshan, S.; Thomas, R.; Coopmans, C.; Maguire, M. Deep learning neural networks for UASs-assisted structural inspections: Feasibility and application. In Proceedings of the 2018 International Conference on Unmanned Aircraft Systems (ICUAS), Dallas, TX, USA, 12–15 June 2018; pp. 874–882. [Google Scholar]
- Choudhary, G.; Dey, S. Crack detection in concrete surfaces using image processing, fuzzy logic, and neural networks. In Proceedings of the 2012 IEEE Fifth International Conference on Advanced Computational Intelligence (ICACI), Nanjing, China, 18–20 October 2012; pp. 404–411. [Google Scholar]
- Chai, C.Z.; Gao, Y.; Xiong, G.Y.; Liu, J.C.; Li, H.J. Domain knowledge-driven image captioning for bridge damage description generation. Automat. Constr. 2025, 174, 106116. [Google Scholar] [CrossRef]
- Jang, K.; Song, T.; Kim, D.; Kim, J.; Koo, B.; Nam, M.; Kwak, K.; Lee, J.; Chung, M. Analytical Method for Bridge Damage Using Deep Learning-Based Image Analysis Technology. Appl. Sci. 2023, 13, 11800. [Google Scholar] [CrossRef]
- Rahman, A.U.; Hoskere, V. Instance segmentation of reinforced concrete bridge point clouds with transformers trained exclusively on synthetic data. Automat. Constr. 2025, 173, 106067. [Google Scholar] [CrossRef]
- Dorafshan, S.; Thomas, R.J.; Maguire, M. Benchmarking Image Processing Algorithms for Unmanned Aerial System-Assisted Crack Detection in Concrete Structures. Infrastructures 2019, 4, 19. [Google Scholar] [CrossRef]
- Cha, Y.J.; Choi, W.; Suh, G.; Mahmoudkhani, S.; Buyukozturk, O. Autonomous Structural Visual Inspection Using Region-Based Deep Learning for Detecting Multiple Damage Types. Comput.-Aided Civ. Infrastruct. Eng. 2017, 33, 731–747. [Google Scholar] [CrossRef]
- Oh, D.; Jeong, S.; Bae, S.K.; Kim, B.; Cho, S. Training deep learning segmentation models using super-resolution crack images for detection of thin concrete cracks. J. Comput. Civ. Eng. 2025, 39, 04025035. [Google Scholar] [CrossRef]
- Mohan, A.; Poobal, S. Crack detection using image processing: A critical review and analysis. Alex. Eng. J. 2018, 57, 787–798. [Google Scholar] [CrossRef]
- Li, H.-Y.; Huang, C.-Y.; Wang, C.-Y. Measurement of Cracks in Concrete Bridges by Using Unmanned Aerial Vehicles and Image Registration. Drones 2023, 7, 342. [Google Scholar] [CrossRef]
- Woo, H.-J.; Hong, W.-H.; Oh, J.; Baek, S.-C. Defining Structural Cracks in Exterior Walls of Concrete Buildings Using an Unmanned Aerial Vehicle. Drones 2023, 7, 149. [Google Scholar] [CrossRef]
- Tian, Y.; Zhang, X.; Chen, H.; Wang, Y.; Wu, H. A Bridge Damage Visualization Technique Based on Image Processing Technology and the IFC Standard. Sustainability 2023, 15, 8769. [Google Scholar] [CrossRef]
- Khan, M.A.-M.; Kee, S.-H.; Pathan, A.-S.K.; Nahid, A.-A. Image Processing Techniques for Concrete Crack Detection: A Scientometrics Literature Review. Remote Sens. 2023, 15, 2400. [Google Scholar] [CrossRef]
- Sutton, M.A.; Hild, F. Recent advances and perspectives in digital image correlation. Exp. Mech. 2015, 55, 1–8. [Google Scholar] [CrossRef]
- Bhardwaj, M.; Khan, N.U.; Baghel, V. Fuzzy C-Means clustering based selective edge enhancement scheme for improved road crack detection. Eng. Appl. Artif. Intell. 2024, 136, 108955. [Google Scholar] [CrossRef]
- Hoang, N.D.; Nguyen, Q.L. Metaheuristic optimized edge detection for recognition of concrete wall cracks: A comparative study on the performances of roberts, prewitt, canny, and sobel algorithms. Adv. Civ. Eng. 2018, 2018, 7163580. [Google Scholar] [CrossRef]

| Crack | Number of Cracks | Centroid (mm) | Length (mm) | Perimeter (mm) | Area (mm2) | Angle (°) |
|---|---|---|---|---|---|---|
| Crack A | 1 | (97, 72) | 66.12 | 151.4 | 396 | −3.47 |
| Crack B | 1 | (89, 73) | 133.45 | 305.14 | 910 | −4.73 |
| Detector | TPR | TNR | ACC | PPV | NPV |
|---|---|---|---|---|---|
| Roberts | 0.45 | 0.96 | 0.82 | 0.79 | 0.83 |
| Sobel | 0.69 | 0.97 | 0.89 | 0.89 | 0.89 |
| LoG | 0.78 | 0.97 | 0.92 | 0.91 | 0.92 |
| Otsu + LoG | 0.93 | 0.98 | 0.96 | 0.94 | 0.97 |
Disclaimer/Publisher’s Note: The statements, opinions and data contained in all publications are solely those of the individual author(s) and contributor(s) and not of MDPI and/or the editor(s). MDPI and/or the editor(s) disclaim responsibility for any injury to people or property resulting from any ideas, methods, instructions or products referred to in the content. |
© 2025 by the authors. Licensee MDPI, Basel, Switzerland. This article is an open access article distributed under the terms and conditions of the Creative Commons Attribution (CC BY) license (https://creativecommons.org/licenses/by/4.0/).
Share and Cite
Chen, Y.; Li, H.; Zhu, H.; Ren, T.; Cao, Z. Concrete Bridge Crack Detection Using Unmanned Aerial Vehicles and Image Segmentation. Infrastructures 2025, 10, 161. https://doi.org/10.3390/infrastructures10070161
Chen Y, Li H, Zhu H, Ren T, Cao Z. Concrete Bridge Crack Detection Using Unmanned Aerial Vehicles and Image Segmentation. Infrastructures. 2025; 10(7):161. https://doi.org/10.3390/infrastructures10070161
Chicago/Turabian StyleChen, Yanli, Hongze Li, Hang Zhu, Tianlong Ren, and Zhe Cao. 2025. "Concrete Bridge Crack Detection Using Unmanned Aerial Vehicles and Image Segmentation" Infrastructures 10, no. 7: 161. https://doi.org/10.3390/infrastructures10070161
APA StyleChen, Y., Li, H., Zhu, H., Ren, T., & Cao, Z. (2025). Concrete Bridge Crack Detection Using Unmanned Aerial Vehicles and Image Segmentation. Infrastructures, 10(7), 161. https://doi.org/10.3390/infrastructures10070161