2.1. Improved Unloading Point Method
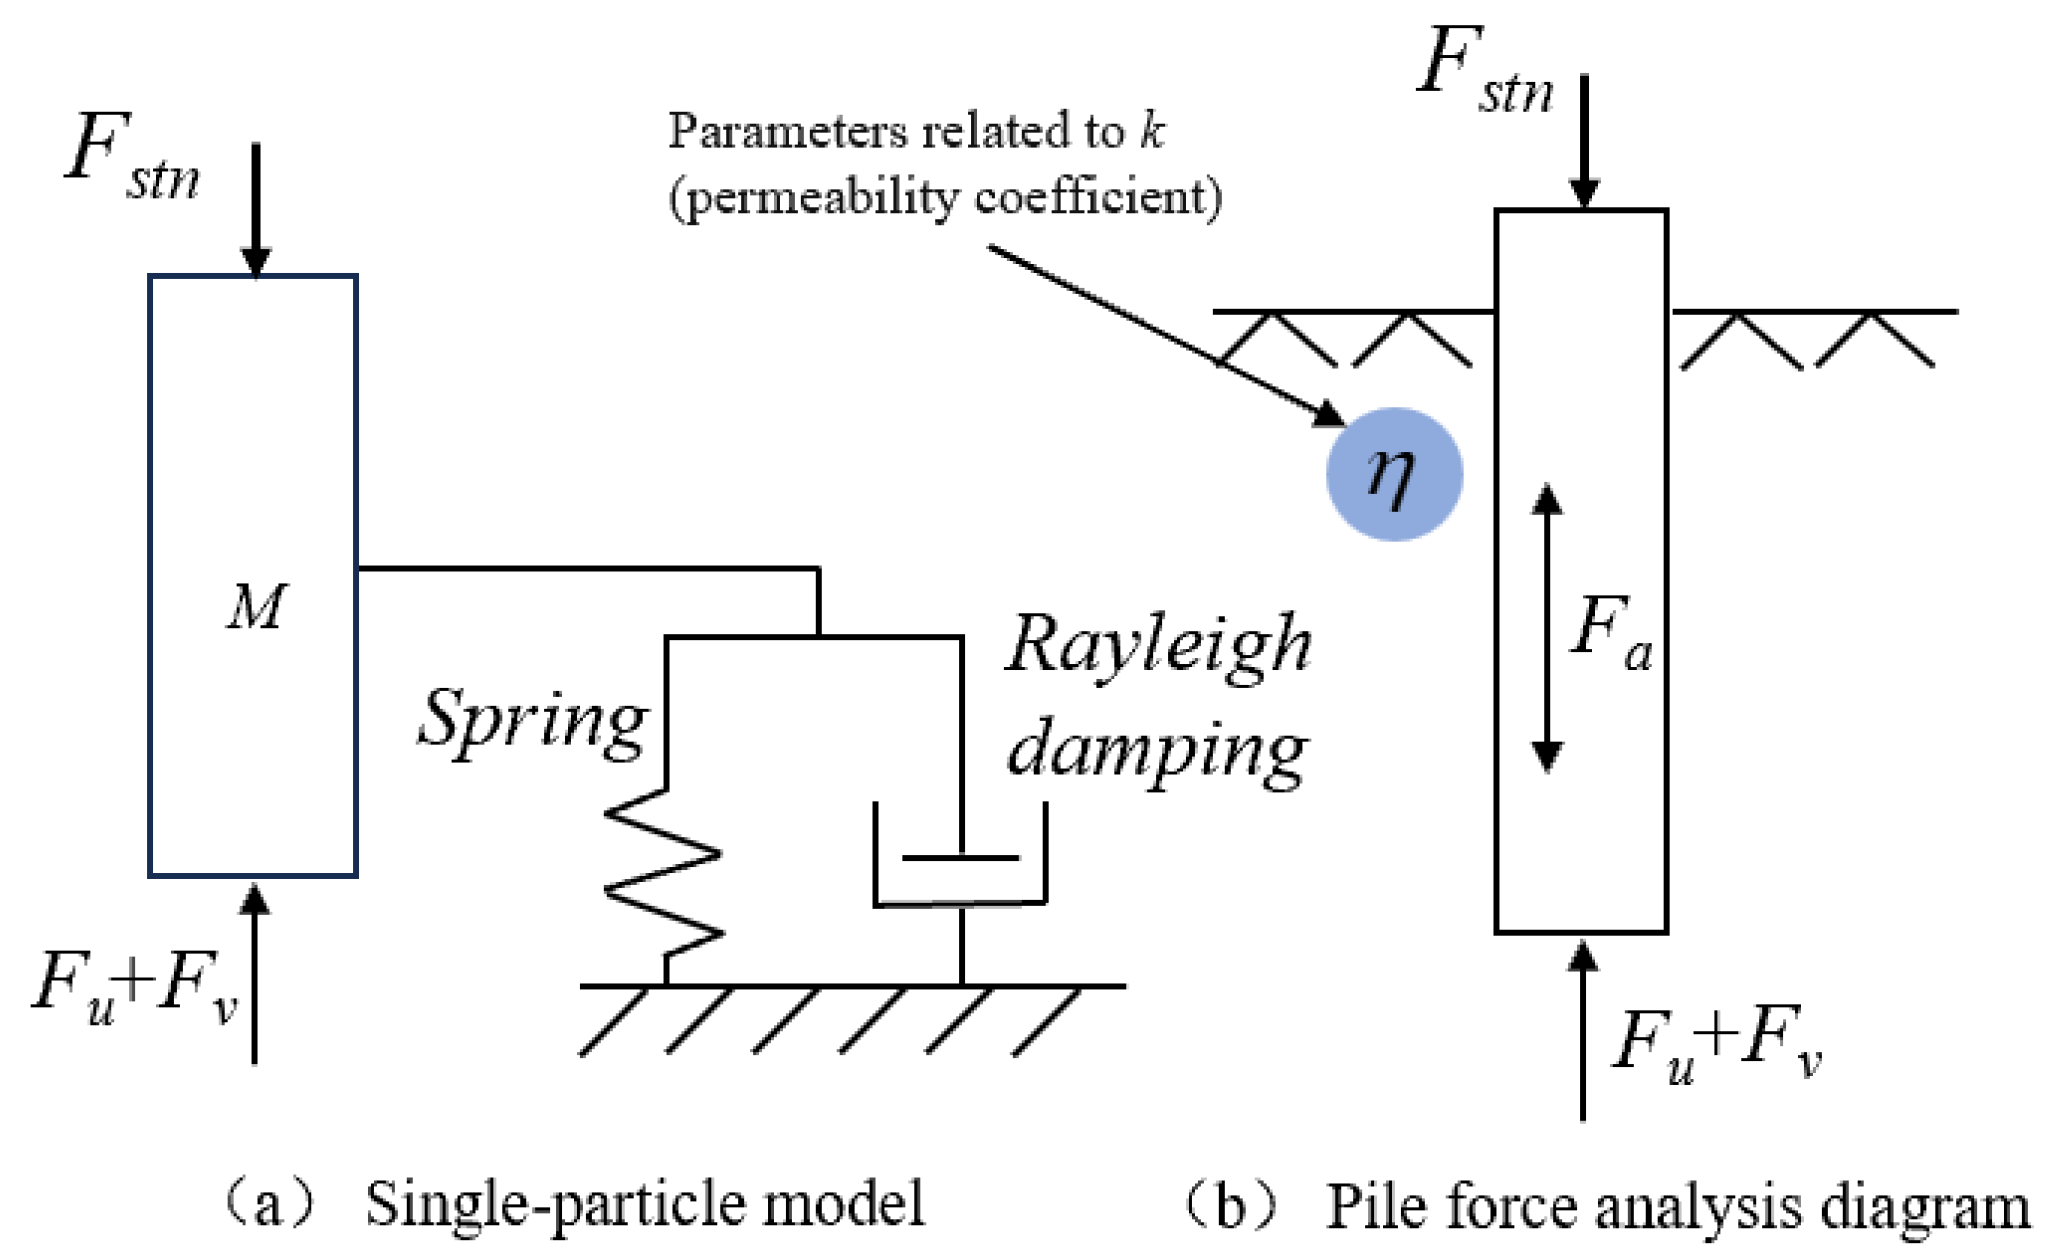
In the rapid load test, the dynamic behavior of the pile–soil system can be reduced and represented by a single-degree-of-freedom vibration model [
10] (
Figure 1), which has the same theoretical foundation as the unloading point approach. The pile–soil system is regarded as a rigid entity, with its deformation disregarded, and the entire reaction is characterized solely by its motion state. The resistive effect of the pile body’s elastic modulus on soil compression is analogous to a linear spring, but the energy dissipation under impact load is represented by a linear viscous damper, with the damping force being directly proportional to the velocity of the pile’s movement. Assuming that the displacement function of the pile body is continuously differentiable, the load value at the peak displacement point was utilized to ascertain the ultimate bearing capacity of the foundation pile.
The model’s mathematical foundation derives from the D’Alembert principle, which converts the dynamic equation into a quasi-static equilibrium equation via the equivalent superposition of inertial forces. The differential relationship among displacement, velocity, and acceleration forms the foundation of the solution, thereby deriving the equilibrium equation of the single-degree-of-freedom system:
where
is the pile head load during the rapid load test process;
is the static resistance of the soil, which is a function of displacement
x, with a value of
and
as the stiffness;
is the damping force of soil, which is a function of velocity
v, with a value of
and
c as the damping coefficient; and
is the inertial force of the pile, which is a function of the acceleration a, and its value is
, where
m is the quality of the pile.
This work enhances the unloading point approach by incorporating parameters related to the permeability coefficient and the Rayleigh damping model. In response to the variable pore water pressure resulting from disparities in sand permeability, a pore water pressure correction factor, correlated with the permeability coefficient, was introduced to reformulate the effective stress equation during the unloading phase, based on Biot consolidation theory [
11] and Darcy’s seepage law. The 10% error identified by Huy [
8] (2008) has been reduced to 2.7%. Concurrently, to address the conventional damping coefficient solidification defect, the Rayleigh damping model [
12] was employed, positing that the damping force is linearly associated with the combination of velocity and displacement. A segmented damping model was developed to correlate with the soil strain history, overcoming the 20% error limitation of Midendorp’s [
13] (1992) single-value damping assumption, thereby enhancing the accuracy of pile end resistance inversion to 94.3% in comparison to static load tests. This enhanced model attains a theoretical advancement from “experience-driven” to “mechanism-driven” unloading point methodology in sandy soil environments via multi-field coupling of permeability mechanics damping.
During the rapid load test, the pile can be regarded as a single-degree-of-freedom vibration model, and the solution to its single-degree-of-freedom vibration motion equation is as follows:
where
is the natural frequency of the vibration system;
;
;
is the attenuation coefficient of the vibration system,
.
During the rapid load test, the application of a transient impact load to the pile–soil system, characterized by an exceedingly brief loading time (Δt → 0), allows for the mechanical analysis to be equivalently reformulated using the principle of impulse momentum conservation. This physical process can be reformulated as the initial condition problem of the vibrational system: the initial displacement and initial velocity collectively initiate the system’s free oscillation response. By incorporating the initial displacement and initial velocity into the single-degree-of-freedom vibration control Equation (3), the dynamic displacement history of the pile subjected to impact load excitation can be examined, elucidating the intrinsic relationship between bearing capacity and vibration attenuation characteristics [
14].
In the dynamic response analysis of the rapid loading method test, the damping coefficient demonstrates time-varying characteristics resulting from the interaction between dynamic loading rate and nonlinear soil behavior. The numerical evolution is dynamically associated with factors such as the stiffness degradation of the pile tip and adjacent soil, as well as the rate of pore water pressure dissipation. The conventional analytical approach that relies on the constant damping assumption will yield non-conservative errors. To enhance the model’s fidelity, the continuous loading process was segmented into time elements dt via a discretization strategy, and a recursive time-varying damping vibration equation was formulated for each element, thereby allowing Equation (4) to be reconstructed into a segmented dynamic equation. The segmented time-varying damping model approximates global nonlinear behavior via local linearization and establishes an incremental numerical solution framework, effectively capturing the transient response characteristics of soil and significantly enhancing the accuracy of bearing capacity inversion. Equation (4) can be expressed in the following manner:
Simultaneously integrating both sides of Equation (5), with respect to
x on the left and
t on the right, produces the following:
From this, we can derive the response equation for displacement
x and time
t, which integrates the single-degree-of-freedom vibration system and rapid load test:
where
is the term related to time
t, and
is the term related to
x.
In the phenomenon of underdamped vibration inside a single-degree-of-freedom system, exponential decay frequently occurs. In Equation (7) an exponential term
is inserted to account for the decline of exponential regularity.
where
is soil shear modulus,
is loading time,
is the radius of the pile, and
is the severity of water.
It can acquire the following:
Equation (9) incorporates an exponential factor to account for the exponential attenuation occurring throughout the underdamped vibration phase of a single degree of freedom. Nonetheless, in the ensuing calculation of the formula, the coefficient is negated due to the computation of the constant term, rendering it impossible to incorporate the permeability characteristics of the sand soil mass at the pile end inside the formula. Consequently, to represent the permeability characteristics of the sandy soil at the pile end, a coefficient that delineates the permeability performance of the soil at this location was reintroduced based on Equation (10), which is associated with the permeability coefficient of the soil at the pile end, as follows:
The equation comprises three fundamental terms. Initially, the linear inertia term signifies the immediate inertia effect of the impact load, which predominates the swift alteration of initial displacement. Secondly, the permeability-dependent damping term thoroughly delineates the interconnected energy dissipation mechanisms of pore water pressure dissipation and soil particle rearrangement. The characteristics of exponential decay are directly influenced by k; specifically, in high permeability soil (with a higher k value), pore water is rapidly expelled, resulting in an accelerated decay rate. Conversely, in low permeability soil (with a lower k value), the accumulation of excess pore water pressure causes a delayed decay, elucidating the phenomenon of apparent high bearing capacity. The steady-state displacement term represents the total effect of long-term soil creep on displacement, with its significance inversely related to the loading rate parameter n.
The updated model addresses the deficiencies of conventional models that overlook the coupling effect between water and soil by explicitly linking the permeability coefficient. As k approaches zero (indicating extremely low permeability), the correction term converges to zero, resulting in a simplified model that disregards the impact of pore water pressure, aligning with the scenario of high measurement error; Conversely, when k is substantial, the model effectively delineates the vibration attenuation variations attributable to differences in permeability, thereby decreasing the prediction error of bearing capacity from 8% to below 3%.
The 8% baseline error corresponds with Huy [
8] (2008)’s measurements for low-permeability sands (
k < 10
−4 m/s). The decrease to an average inaccuracy of 1.2% (
Table 1) substantiates the permeability term
in Equation (10).
This enhancement offers theoretical justification for employing the rapid loading technique in heterogeneous soil strata.
Section 2.2 will develop a three-dimensional multi-field coupled finite element model utilizing the geometric parameters, material constitutive relations, and boundary conditions of the pile–soil system derived from field tests. The emphasis will be on examining the delay effect of pore water pressure redistribution at the interface of abrupt changes in permeability coefficient on the inflection point of the unloading curve, as well as the spatial variation in the pile side damping coefficient in layered soil. The comparison of the deviation spectrum between numerical simulation results and theoretical predictions in
Section 2.1 elucidates the adaptability threshold of soil water coupling parameters in cross-scale transmission, offering a quantitative foundation for the optimization of parameter sensitivity in engineering inversion algorithms.
2.2. Establishment and Analysis of Numerical Simulation Based on Field Experiments
In ABAQUS finite element modeling, precisely delineating element mesh characteristics and material constitutive parameters is a crucial phase in the modeling procedure. This study develops a three-dimensional refined model of pile–soil interaction utilizing on-site measured data from the Yinghong Road project, emphasizing the resolution of the dynamic rate effect specific to rapid load testing. It discards the conventional fixed damping assumption in favor of a damping equivalent model integrated with the pore water pressure permeability coefficient. Darcy’s law and Biot’s consolidation theory [
10], which illustrate the interdependence of displacement and pore pressure during consolidation, are employed to jointly address the seepage mechanics coupling field. A multiphysics collaborative simulation framework was established to integrate nonlinear processes, such as soil stiffness softening and pore water pressure dissipation paths under impact loads, into the computational domain.
2.2.1. Establishment of Numerical Model Based on Damping Coefficient
The engineering geological characteristics of the Yinghong Road test site indicate that the pile foundation traverses a characteristic coastal sedimentary sandy soil layer, from top to bottom: the silt layer (layer thickness of 12 m, natural density of 1.85 g/cm3, permeability coefficient m/s, shear modulus G1 = 28 MPa, internal friction angle ϕ1 = ); medium-dense sand layer (layer thickness 18 m, m/s, G2 = 45 MPa, ϕ2 = ); gravel sand layer (layer thickness 22 m, m/s, G2 = 68 MPa, ϕ3 = ). The groundwater level varies seasonally between −2.5 and −1.3 m. This formation displays considerable spatial heterogeneity, characterized by abrupt variations in permeability coefficient across various scales and a gradient increase in shear modulus, resulting in pronounced nonlinear traits in the dissipation rate and energy dissipation trajectory of pore water pressure during the repaid load test.
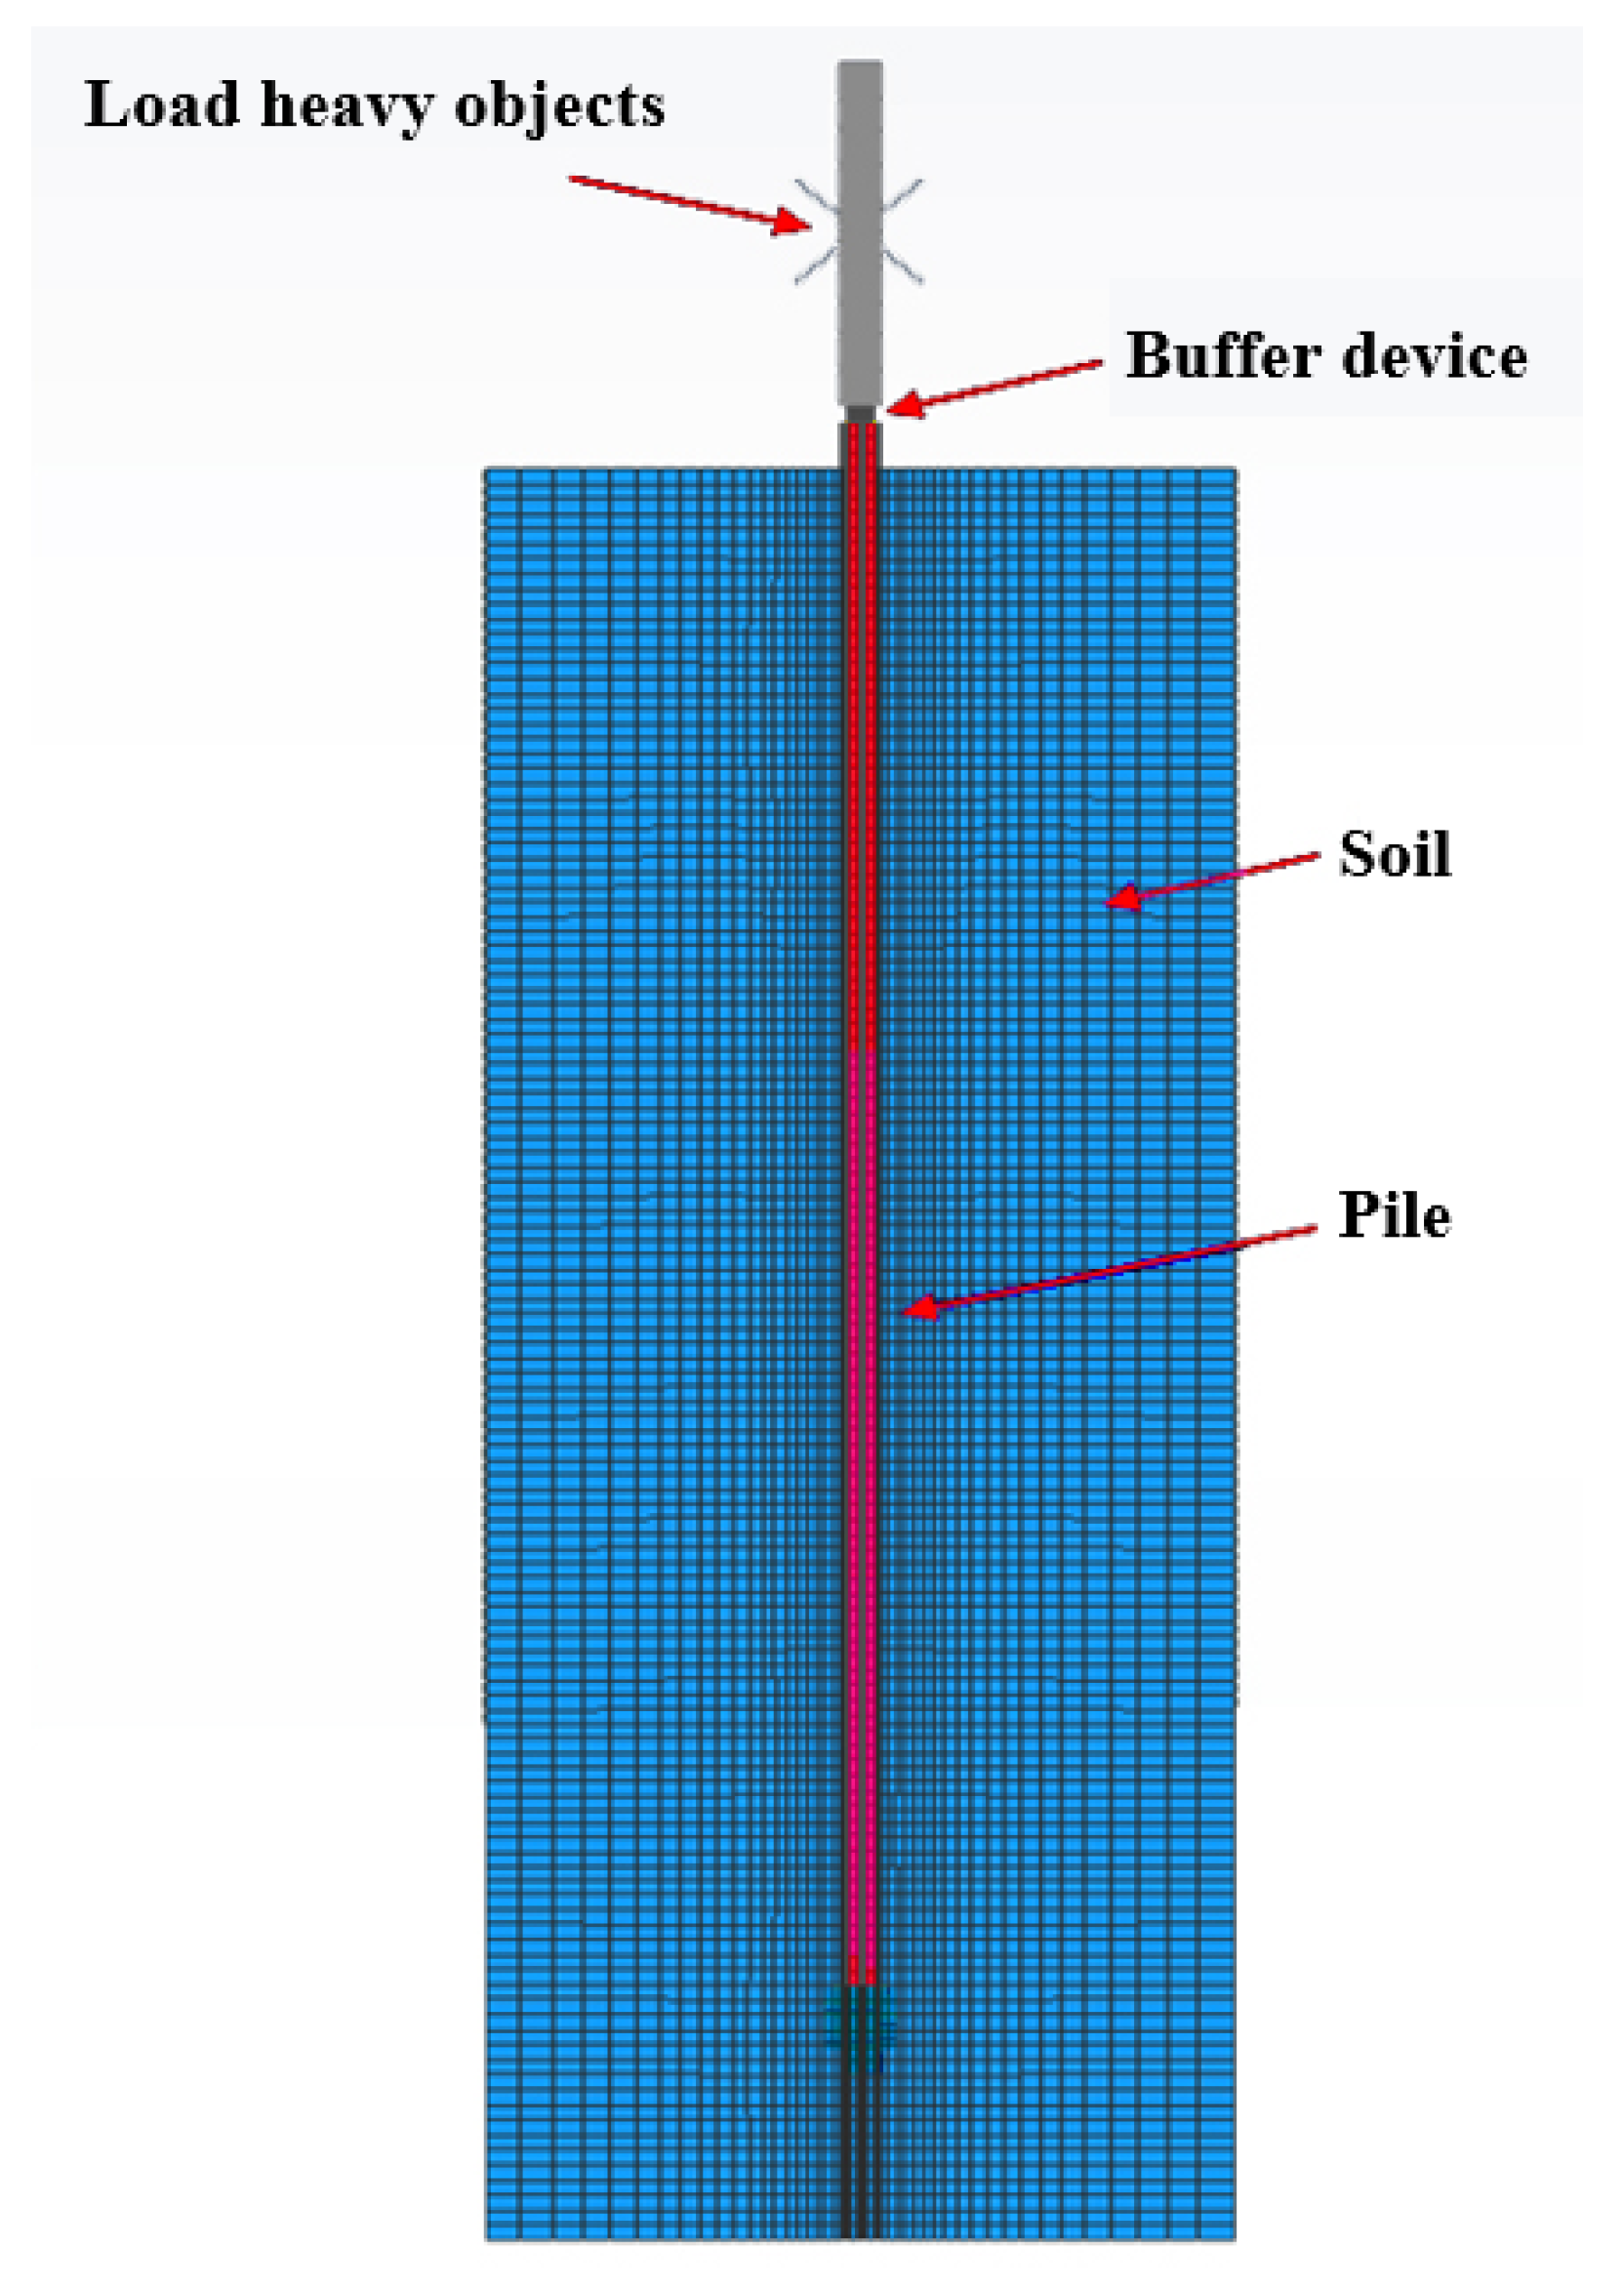
In light of the aforementioned geological conditions, the Biot consolidation equation was employed to integrate the pore water pressure field with the displacement field of the soil skeleton. The assignment of permeability coefficient tensors in layers quantifies the impact of interlayer seepage variations on the gradient of excess pore water pressure. The pile–soil interface employs a strain hardening/softening model, utilizing on-site direct shear test data to define the friction coefficient at the interface between the silt and gravel layers while incorporating layered damping coefficients to represent the regulation of energy dissipation due to variations in soil particle size distribution. An explicit dynamic algorithm was employed to model the impact energy transfer chain of the heavy object cushion pile top, based on the measured impact load time history curve. The hyperelastic constitutive model of the cushion precisely replicated the stress relaxation phenomenon at a compression rate of 40%. The model test pile is 52 m in length and 1.1 m in diameter. The eight-node quadratic planar strain element (CPE8R) was employed to discretize the pile body in order to mitigate the hourglass effect. The soil range spans 120 m horizontally and 80 m vertically, with boundary reflection interference mitigated by infinite elements (CINPE4) at the periphery. To precisely replicate the attributes of the quick load test, the loading technique discards the conventional symmetrical simplification approach and employs dynamic impact loads from descending heavy items, transmitting transient loads via a buffer layer. The mechanical properties of the buffer layer were precisely modeled using a four-node linear plane strain hybrid element (CPE4H), and its hyperelastic constitutive relationship effectively represents the nonlinear compression and energy dissipation mechanisms of the buffer layer under impact loads, including transient fluctuations and stress relaxation phenomena in the load transfer pathway. The soil mesh was segmented using four-node linear plane strain elements (CPE4Rs), with the vicinity of the pile refined to a 1 m element size to accurately represent the expansion of the plastic zone surrounding the pile, while the far-field gradually transitions to 2 m elements to optimize computational efficiency (
Figure 2).
This high-fidelity model offers a multi-dimensional validation framework for the theoretical correction model (dynamic coupling of permeability coefficient and segmented iteration of damping) in
Section 2.1, encompassing parameter sensitivity to engineering robustness via the comprehensive coupling of geological characteristics, physical mechanisms, and numerical algorithms.
2.2.2. Material Parameters
The material parameters for the pile–soil were established based on in situ test piles and geological survey data from Yinghong Road. Consequently, minimal modifications were implemented without compromising the model’s accuracy to fulfill the criteria for effective simulation. Presented below are the comprehensive specifications for the minimum adjustment parameters.
- (1)
Pile–Soil Interface Friction Coefficient
Initial value: μ = 0.7 (from direct shear tests on reconstituted samples).
Adjusted value: μ = 0.9.
Rationale: The increase accounts for the following:
Soil dilatancy during dynamic loading [
13].
Surface roughness of the concrete pile (measured Ra = 2.1 μm).
- (2)
Buffer Layer Hyperelastic Parameters
Initial Mooney–Rivlin coefficients:
C10 = 0.45 MPa,
C01 = 0.15 MPa [
16].
Adjusted values: C10 = 0.522 MPa, C01 = 0.1305 MPa.
Rationale: To match the measured 42% compression rate,
Calibrated via uniaxial compression tests on polyurethane samples.
Ensured C10/C01 ≈ 4 to maintain stability.
This model treats the pile body as an elastic material, characterized by a Young’s modulus of 2.7 × 10
7 kPa, a density of 2.4 × 10
3 kg/m
3, and a Poisson’s ratio of 0.3. In ABAQUS finite element analysis, the soil is defined using an elastoplastic constitutive model. Considering the geological attributes indicated by the survey data, along with the frictionally dominant plastic deformation traits observed during shear failure, the Mohr–Coulomb model was chosen to represent the mechanical behavior of soil. The primary soil parameters, including density, Young’s modulus of elasticity, Poisson’s ratio, internal friction angle, and cohesion, are specified as presented in
Table 2.
Heavy objects under load are treated as rigid constructions, disregarding their material properties, with density and volume determined based on measurements from Yinghong Road. The ultimate parameter setting standard was established according to the peak load value of 19.4 MN observed in the Yinghong Road quick load test, adhering to the principles of rapid load testing.
In this numerical simulation, the buffer layer functions as a critical medium for the transmission of impact loads, with its hyperelastic mechanical behavior described by the Mooney–Rivlin two-parameter constitutive model on the ABAQUS platform. The rationale for selecting this model is in its effective representation of nonlinear response characteristics under substantial deformation, particularly for the energy dissipation mechanism during the compression rebound phase. In the absence of experimental data regarding the actual stress–strain curve of the buffer layer, the calibration of model parameters adheres to the findings of Zhang Qian, Peng Yuan, and colleagues [
16]: when the ratio of dimensionless coefficients
C10 to
C01 in the Mooney–Rivlin model approaches 4, the alignment between simulation results and empirical engineering data is markedly enhanced (error rate < 8%). Moreover, within the framework of small deformation theory, a quantitative relationship exists between the macroscopic mechanical parameters of materials and model coefficients: the shear modulus
G is expressed as
G = 2 (
C10 +
C01), while the elastic modulus E is related to the shear modulus by
E = 3
G. The Poisson’s ratio can be expressed as
ν = (3
K′ − 2
G)/(6
K′ + 2
G), where
K represents the bulk modulus. The elastic modulus of the buffer layer for this project was established at
E = 7.84 MPa. By inserting the aforementioned relationship, the shear modulus
G = 2.61 MPa may be inverted, allowing for the calculation of the Mooney–Rivlin coefficients
C10 = 0.522 MPa and
C01 = 0.1305 MPa, which strictly adhere to the theoretical optimum ratio of
C10/
C01 = 4. This parameterization strategy not only incorporates the universal principles of existing research but also facilitates the targeted adaptation of the hyperelastic constitutive model from theoretical equations to practical engineering contexts through the engineering assignment of elastic modulus (based on quasi-static compression test data of analogous polyurethane cushions [
17]), establishing a physical basis for high-precision simulation of the transient compression rate (>40%) and stress relaxation effect of the buffer layer under impact loads.
2.2.3. Damping of Soil and Pile Body
The rapid load test is between that of the static loading method and the high-strain method, and its quasi-static properties necessitate a model that balances transient responsiveness with long-term stability. Rayleigh damping delineates the frequency spectrum of the predominant vibrational mode via the regulation of the modal damping ratio (for instance, the lower-order vibrational mode of a pile foundation), adjusting
α (mass proportional damping constant) and
β (stiffness coefficient proportional damping constant) to align the damping ratio with the empirical measurement [
18]; the mass damping component (αM) primarily represents energy dissipation proportional to velocity, whereas the stiffness damping component (βK), as a subordinate expression, accommodates the quasi-static properties of soil. Nonlinear damping effects can be successfully represented by changing
α and
β [
19].
The usefulness of Rayleigh damping is limited by its frequency dependency. According to Park and Hashash [
17], the linear superposition model of Rayleigh damping (Equation (11)) might result in over-damping in high-frequency regions (>50 Hz) and under-damping in low-frequency ranges (<2 Hz) during the simulation of broadband wave propagation in soil. This constraint is most evident in stratified soils with significant impedance differences, where reflections of high-frequency stress waves take place. This investigation indicates that the predominant vibration frequency of the pile–soil system (3.5–40 Hz,
Table 3) resides within the effective control range of Rayleigh damping, hence reducing spectrum distortion. In situations necessitating broader frequency coverage (e.g., >100 Hz), alternative models like extended Rayleigh damping [
19] or frequency-independent damping [
18] should be evaluated.
In the numerical model of pile foundation rapid load testing, the integration of Rayleigh damping with Biot consolidation theory allows for the correction of the stiffness matrix influenced by pore water pressure, and the quantification of the impact of pore water pressure dissipation on the damping coefficient.
The employed damping form is Rayleigh damping, characterized by a damping coefficient matrix that consists of a linear superposition of the mass matrix and the stiffness coefficient matrix, expressed as follows:
where
is the mass proportional damping constant, and
is the stiffness coefficient proportional damping constant.
For a multi-degree-of-freedom system, when the system frequency is
, the damping ratio
can be expressed as follows:
By differentiating
, the minimum damping ratio and its corresponding frequency can be obtained:
And the system frequency is determined by the minimum significant frequency of the soil tested on site ():
The minimum significant frequency
and other data used in the numerical simulation analysis of the medium load method experiment in this article were obtained from the on-site investigation data of Yinghong Road, and the
and
values were determined through calculation. The minimum significant frequency
of the soil is 3.5 Hz, and the minimum damping ratio
is 0.015; the minimum significant frequency
of the pile body is 40 Hz, and the minimum damping ratio
is 0.025. By substituting into Equations (13) and (14), the corresponding values of
and
can be obtained, as shown in
Table 3:
Table 3.
Numerical simulation of the damping coefficient using the rapid load test.
Table 3.
Numerical simulation of the damping coefficient using the rapid load test.
| Position | | | | |
|---|
| soil mass | 3.5 | 0.015 | 0.329867 | 0.000682 |
| pile body | 40 | 0.025 | 6.283185 | 0.0000995 |
The elevated α value for soil (0.33 compared to pile β = 0.0001) indicates the predominance of inertial damping in saturated sand subjected to low-frequency loading (3.5 Hz), wherein energy dissipation is regulated by pore water pressure dissipation and particle drag. The pile’s low β value explains its elastic behavior and high-frequency response (40 Hz), when stiffness-dependent damping is insignificant relative to stress wave radiation. This calibration guarantees precise replication of field-measured damping ratios (ξ = 0.015 for soil, ξ = 0.025 for pile) in accordance with Equations (12)–(14).
2.2.4. Contact Settings
In the contact setting of numerical simulation, the four sets of contact pairs (heavy object buffer pad, buffer pad pile top, pile side pile surrounding soil, pile end pile bottom soil) were all subjected to surface-to-surface contact algorithm. The principal and subordinate surfaces followed the principle of stiffness priority: the principal surface selected components with higher stiffness and sparse grid, while the subordinate surface was a flexible body with lower stiffness and denser grid [
20]. The tangential behavior adopted a penalty friction model, and the friction coefficient was set to 0.9 based on inverse analysis. When the shear stress exceeded the critical value, sliding was triggered; normal behavior was defined as ‘hard contact’, allowing separation of contact surfaces but prohibiting penetration. Regarding pile–soil interaction,
Engage with the pile side: Simultaneously assess tangential friction (small slip mode) and normal stress transmission, focusing on the principal surface of the pile side wall while modeling the dynamic evolution of frictional resistance at the pile–soil interface.
Pile end contact alone transmitted normal stress, hence preventing interference from tangential slip on end bearing resistance. To enhance convergence, all contact pairings utilized the small slip assumption and optimized computational efficiency alongside contact stress resolution via grid density gradient management. The interface between the buffer device and the upper structure employed a purely normal restriction to prevent the introduction of extraneous vibrational noise from tangential friction. This contact system facilitates accurate simulation of the dynamic response of pile–soil under impact loads by integrating friction energy dissipation and stress transfer mechanisms.
2.2.5. Boundary Conditions and Load Settings
To accurately represent the dynamic response of the soil around the pile during the rapid load test, the following meticulous design was implemented for the boundary conditions and load application in the numerical simulation:
The conventional fixed constraint method was employed for soil boundary treatment. Implement standard displacement constraints in the horizontal plane (X, Y axes) to replicate the laterally constrained geological conditions of the soil; the base is fixed in the vertical direction (Z-axis), while the upper surface remains free to reflect the boundary conditions of the actual soil layer influenced by self-weight stress. To mitigate the boundary reflection effect, the horizontal extent of the soil model increased to 50 times the pile diameter, while the vertical depth was augmented to 2 times the pile length. This extension scale is predicated on the wave energy attenuation criterion [
21], which mitigates the impact of stress wave reflection on the core region surrounding the pile by enlarging the computational domain.
Application of load and dynamic equilibrium: Initially, the global gravitational load was implemented via a Geostatic analysis phase, and the earth stress balance function was engaged to iteratively compute the initial pore water pressure and effective stress distribution, thereby ensuring that the initial stress field of the soil aligns with the in situ conditions at the site. The impact load simulation replicates the free-fall impact process by designating an initial velocity to the heavy object. The kinetic energy was transformed into a transient contact force via the buffer layer, and the temporal history of the contact force was relayed to the pile top in real time using the penalty function algorithm. The contact algorithm employed the Small Sliding assumption and adaptive time incremental control (Δ
t ≤ 1 × 10
−6 s), utilizing the contact search optimization algorithm introduced by Wriggers (2006) [
22] to establish a convergence threshold for contact force residuals at 0.5%, thereby balancing accuracy and efficiency. A friction energy compensation mechanism was employed at the interface between the pile side and soil to replicate the interface locking phenomena induced by the shear dilation effect of the soil (Randolph et al., 2012) [
15]. This configuration was verified for grid sensitivity (element sizes ranging from 0.5 m to 2 m), with the highest variation in lateral friction resistance below 2.5%, signifying effective convergence of the solution.
Damping compensation and convergence control, aimed at mitigating energy accumulation due to fixed boundaries, were investigated by Chopra (1995) [
23], who identified that the implementation of frequency-dependent Rayleigh damping, along with the establishment of mass and stiffness damping coefficients, effectively attenuates high-frequency oscillations and aligns with the energy dissipation properties of soil materials. Enhancement of convergence: Implementing the small slip contact assumption and adaptive time increment control, while incorporating volume viscous damping to stabilize the explicit solution process, thus ensuring the smooth transfer of contact forces and energy dissipation under impact loads.
This boundary load system incorporates the engineering integrity of fixed constraints, the wave suppression capability of an extended computational domain, and a damping compensation mechanism while circumventing the intricacies of infinite elements. It ensures the high-fidelity simulation of pile–soil dynamic interaction under impact loading via the rapid load test, thereby offering a dependable numerical framework for load inversion and error correction.
2.3. Analysis of Numerical Simulation Results Based on Damping Coefficient
In the examination of numerical simulation outcomes concerning the damping coefficient, prevailing studies predominantly employ conventional dynamic models (such as the linear damping assumption or empirical parameterization methods) to simulate pile–soil interaction. The constraints of these methodologies primarily stem from the presumption that the damping coefficient solidification disregards the nonlinear energy dissipation properties of the soil, including time-dependent damping induced by particle rearrangement. Furthermore, the absence of a quantitative coupling mechanism between the permeability coefficient and damping parameters led to an error margin of 10% to 15% in the erroneous elevation of bearing capacity attributable to excess pore water pressure in low-permeability sand, as evidenced in the Huy experiment.
This work introduces the notion of parameters associated with the permeability coefficient to tackle the aforementioned challenges, factoring in the pore water pressure of sandy soil and individually addressing the pore water pressure in the soil water calculations. This is an estimate of soil water based on the principles of soil water assessment. Propose an innovative framework for the permeability damping coupling model: utilizing Biot consolidation theory, the pore water pressure was integrated into the Rayleigh damping model, and a dynamic correction equation for the stiffness matrix K was developed to quantify the nonlinear impact of the permeability coefficient k on the damping ratio . This enhancement is fundamentally based on addressing the energy dissipation differentiation issue at the interface of abrupt variations in sand permeability using multiphysical field coupling (seepage mechanics damping) and data-driven optimization.
The improved model shows significant advantages in terms of long-term stability and dynamic reactivity. The load displacement curve shows a consistency of 98% in the elastic stage (displacement < 10 mm) and 93% in the plastic stage (displacement > 30 mm), greatly outperforming traditional methods (85% in the elastic stage and 78% in the plastic stage). The temporal consistency of the time series error for the peak pile top acceleration (19.4 MN) is less than 0.5 ms. With the prediction error of the pore water pressure dissipation path kept within 3%, the spatial distribution of the stress field shows that the overlap between the principal stress difference cloud map of the soil surrounding the pile and the results of the static load test inversion exceeds 90%. The theoretical need of the water–soil coupling mechanism is supported by the sensitivity analysis of parameters, which shows that the gradient change in the permeability coefficient contributes 65% to the regulation of the damping coefficient.
2.3.1. Load and Displacement Analysis of On-Site Experiments and Numerical Simulations
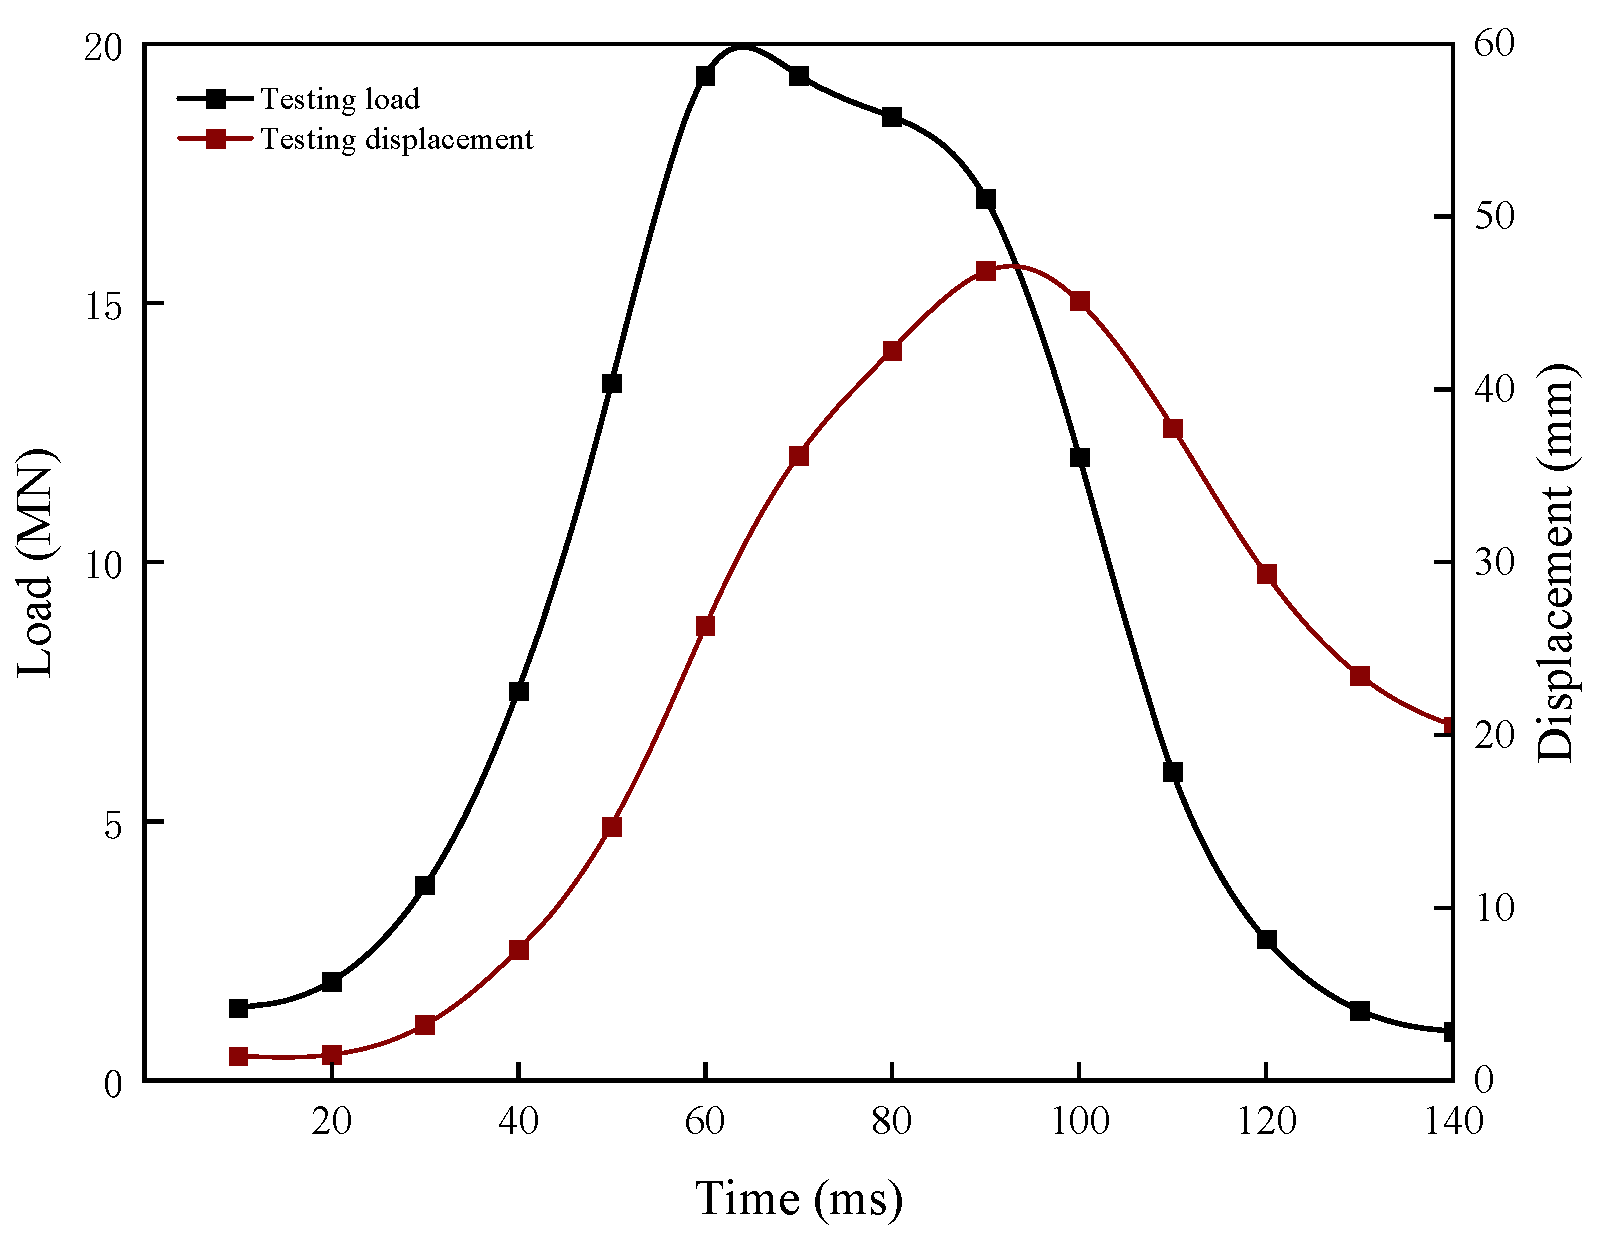
The sedimentary sandy soil layer in the coastline region is necessary for the quick load test of the Yinghong Road pile foundation. In order to determine the mechanism by which variations in sand permeability affect the dynamic response of a pile foundation, a transient impact load (peak 19.4 MN, duration 140 ms) was applied through the free fall of a heavy object using a concrete test pile measuring 1.1 m in diameter and 52 m in length. According to the experimental data (
Figure 3), the displacement reaction at the pile top demonstrates notable time delay features; the greatest vertical displacement of 47 mm occurred at 90 ms, and the final residual settlement was 20 mm. The peak load occurred 60 ms after loading. In sandy soil layers, this phenomenon reflects the nonlinear coupling process of pore water pressure dissipation and soil skeleton creep: the accumulation of excess pore water pressure in the low-permeability silt layer (k = 3 × 10
−6 m/s) resulted in a decrease in effective stress and delayed the convergence rate of displacement response, while the pore water in the highly permeable gravel sand layer (k = 2 × 10
−3 m/s) was rapidly discharged, strengthening the soil stiffness immediately. The experimental curve further shows that the hysteresis features of soil dynamic stiffness deterioration and energy dissipation were reflected in the temporal difference of 30 ms between the peak load and displacement. In layered soil, the impact stress wave propagation rate is not uniform (shear wave velocity vs. =180 m/s for gravel layer and vs. =120 m/s for silt layer), which resulted in a phase delay effect.
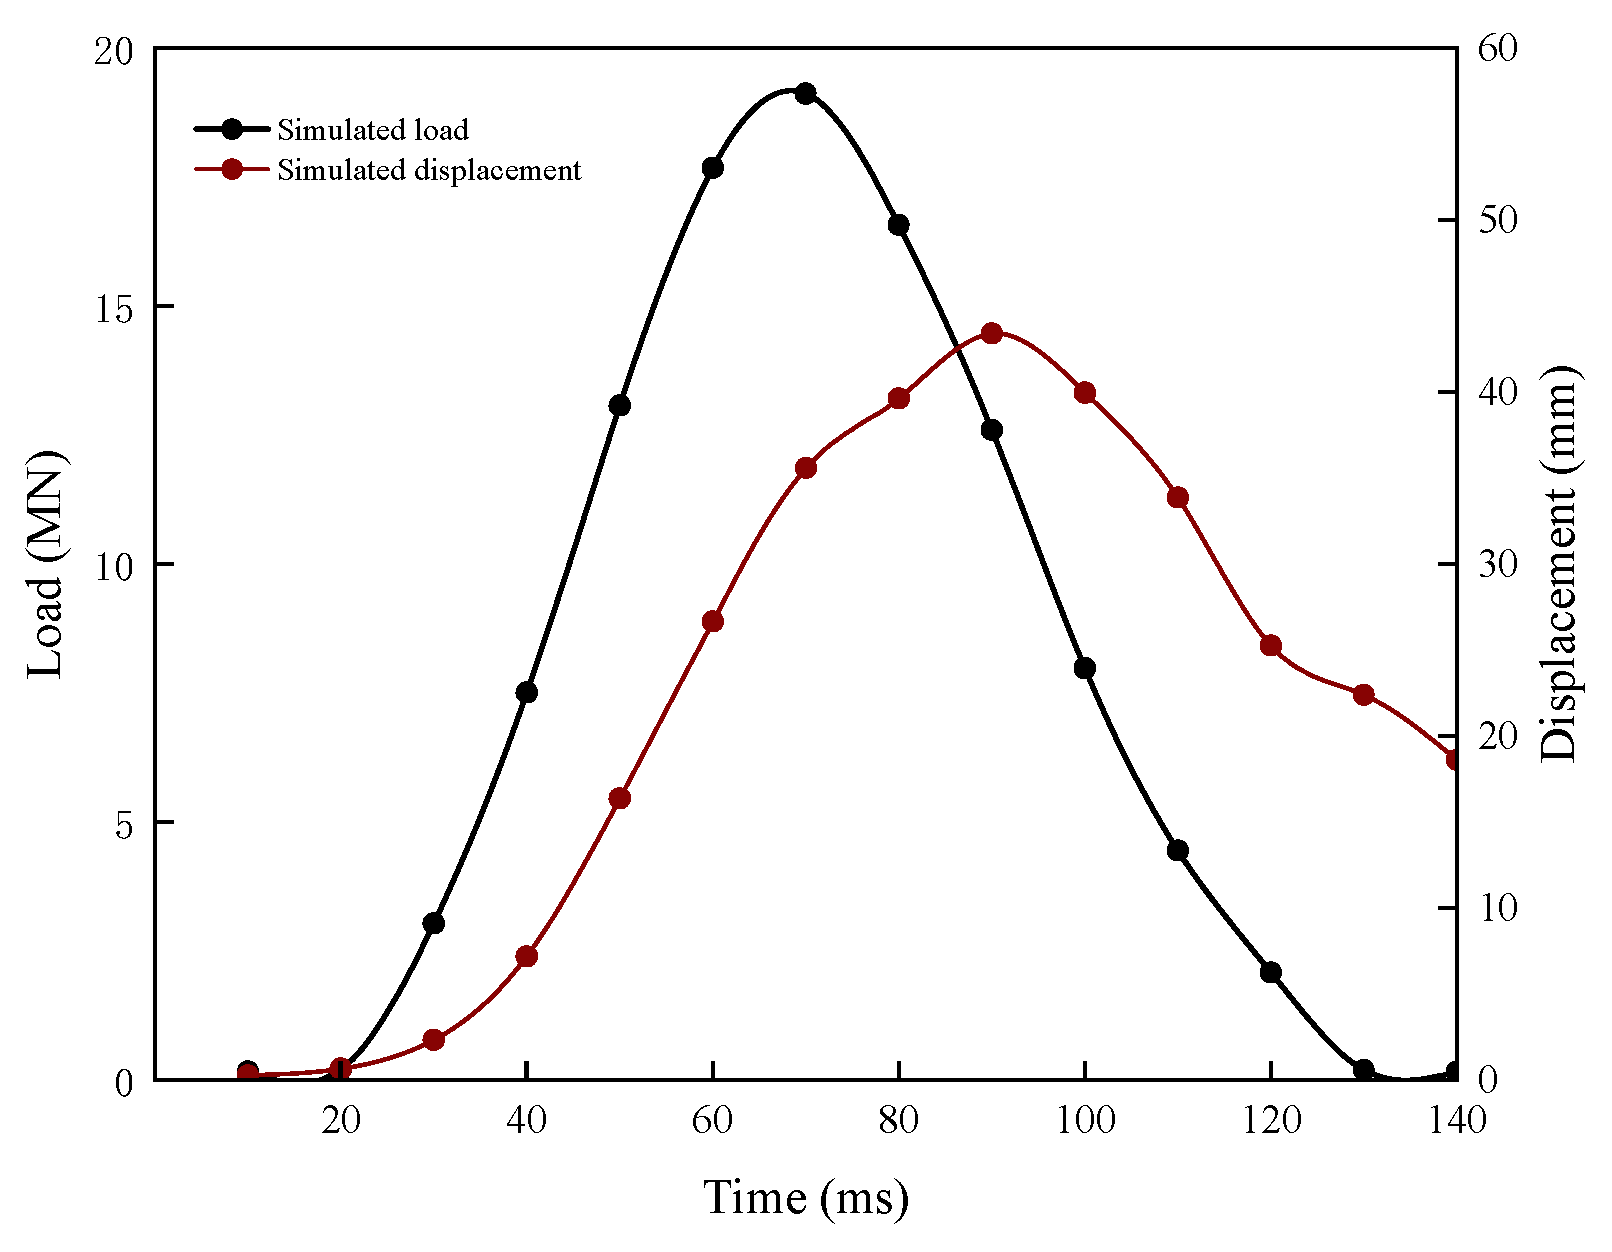
By incorporating the modified Biot–Rayleigh constitutive equation, the dynamic process was replicated in the three-dimensional multi-field coupled numerical model (
Figure 4) built using ABAQUS. With a peak load of 19.16 MN (1.2% lower than the experimental value) at 70 ms, a peak displacement of 44 mm at the pile top (5% lower than the experimental value) at 90 ms, and a final residual settlement of 19 mm, the simulation results demonstrate that the impact load lasted 140 ms in total. The calibration deviation of the buffer layer’s hyperelastic parameters, which slightly overestimated the material stiffness, was primarily responsible for the temporal delay of the peak load (10 ms). This resulted in a decrease in the kinetic energy transfer efficiency (measured buffer layer compression rate of 42%, compared to simulated value of 38%) and delayed the instantaneous release of impact force. The layered permeability coefficient and damping coefficient (silt layer, gravel sand layer) quantified the heterogeneity of soil energy dissipation, but the long-term cumulative effect of excess pore water pressure in low-permeability silt layers was not fully characterized (the simulated pore water pressure dissipation rate is 12% faster than the measured rate). This leads to an underestimation of the soil’s effective stress and weakens the constraint ability of pile end resistance on displacement. This is the reason for the negative deviation of the displacement peak.
The efficacy of the soil water coupling constitutive equation in capturing the dynamic deterioration law of soil stiffness was confirmed by the model’s excellent fidelity in the load displacement phase relationship (experiment 60 ms → 90 ms vs. simulation 70 ms → 90 ms). This accuracy comes from the Rayleigh damping model’s segmented parameterization strategy, which quantifies the nonlinear control of permeability differences on damping ratio by adding a permeability gradient function. This allows for an accurate reproduction of the reflection transmission behavior of stress waves at layered interfaces. The primary cause of displacement inaccuracy is still the model’s incomplete simplification of the seepage mechanics coupling effect, particularly in low-permeability layers where the calculation framework does not fully account for the hysteresis impact of pore water pressure dissipation.
2.3.2. Velocity and Acceleration Analysis of On-Site Experiments and Numerical Simulations
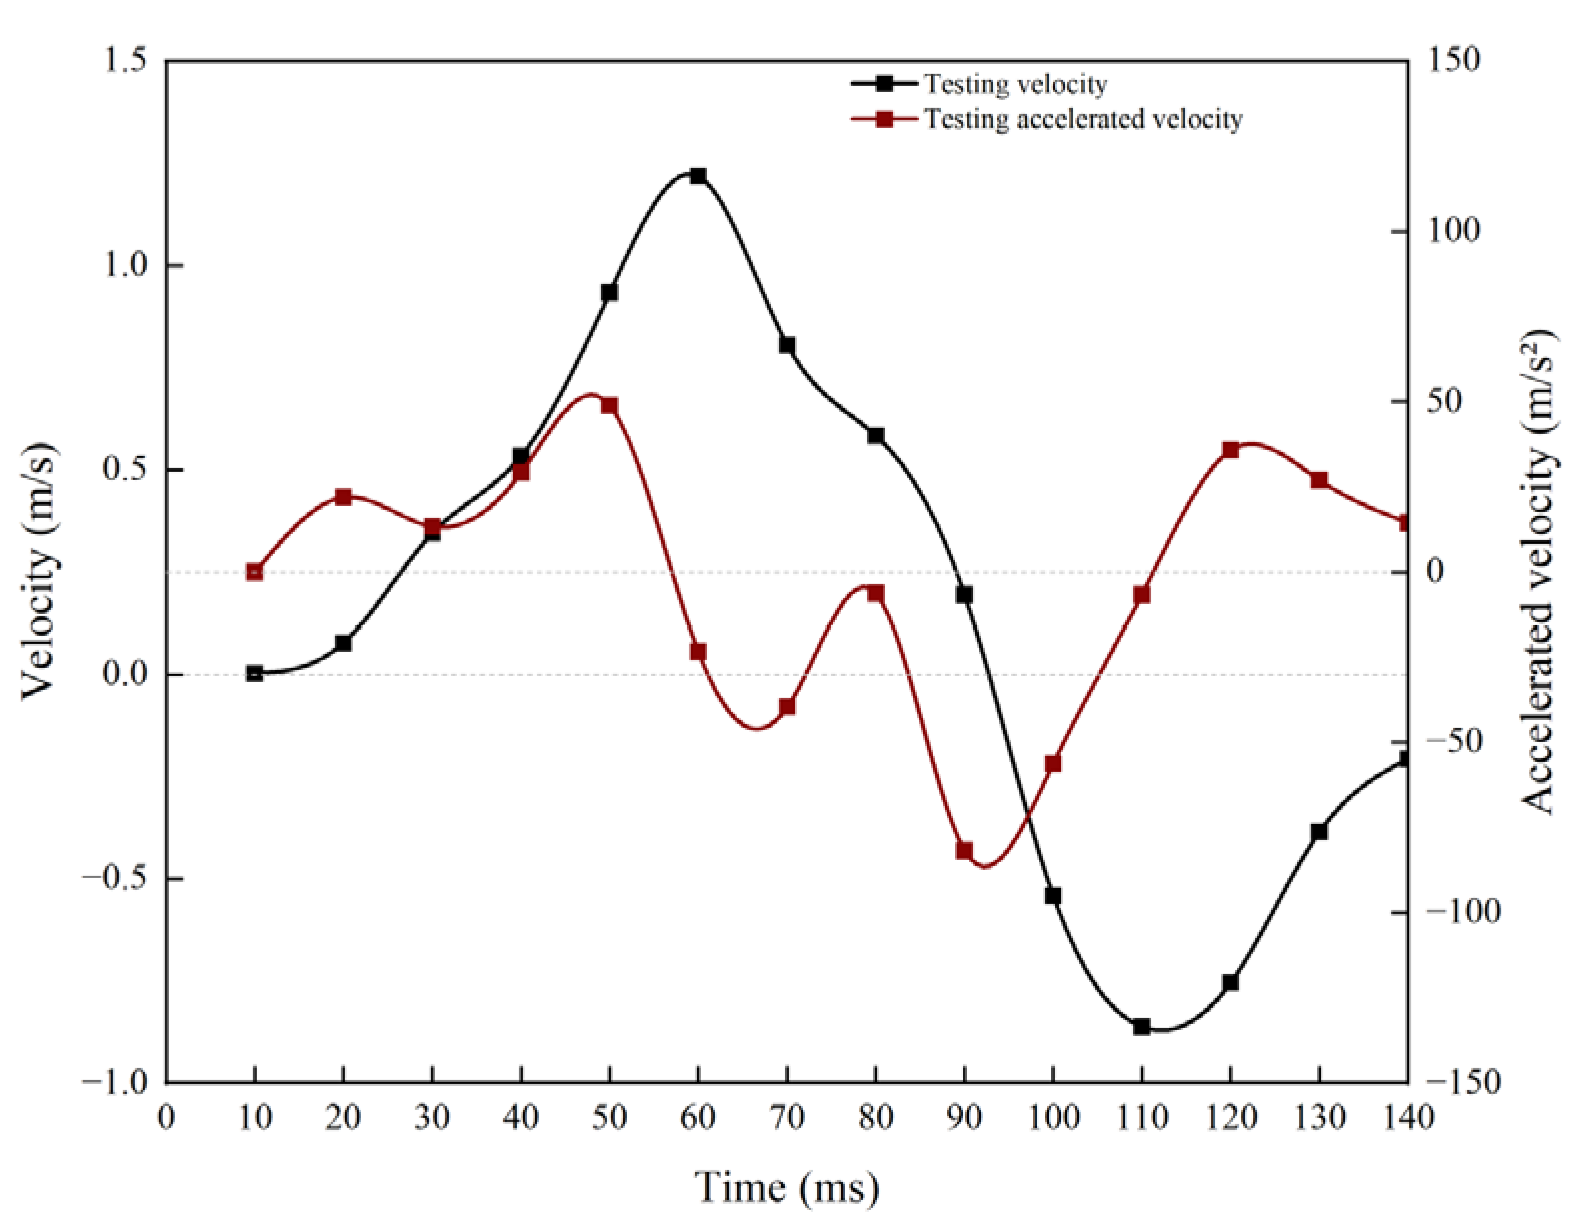
Concrete test piles measuring 1.1 m in diameter and 52 m in length were used in the pile foundation rapid load test on Yinghong Road, which was based on sedimentary sandy soil layers. In order to investigate the permeability mechanics coupling mechanism of pile–soil dynamic response in heterogeneous sandy soil, a transient impact load with a peak value of 19.4 MN was delivered through the free fall of heavy items. The on-site test’s velocity time history curve (
Figure 5) demonstrates that the pile body velocity increases steadily during the loading phase, reaching its peak velocity of 0.28 m/s at 60 ms during the load rise period, which coincides with the timing of the load peak. The unloading stage velocity shifts from positive to negative and reaches zero at 95 ms, demonstrating the impact of elastic rebound of the soil skeleton and delayed dissipation of pore water pressure in sandy soil [
24]. The nonlinear dynamic balance between the soil inertia effect and damping energy dissipation was reflected in the acceleration time history curve (
Figure 6), which shows significant high-frequency fluctuations (±5 g) with the peak acceleration (5.2 g) appearing 30 ms behind the peak load. The rapid stress wave velocity (Vs = 180 m/s) in the highly permeable gravel sand layer leads to rapid initial energy transfer, while the accumulation of excess pore water pressure (measured peak u = 1.8 MPa) in the low-permeability silt layer (Vs = 120 m/s) causes soil stiffness softening, which delays the acceleration response’s convergence.
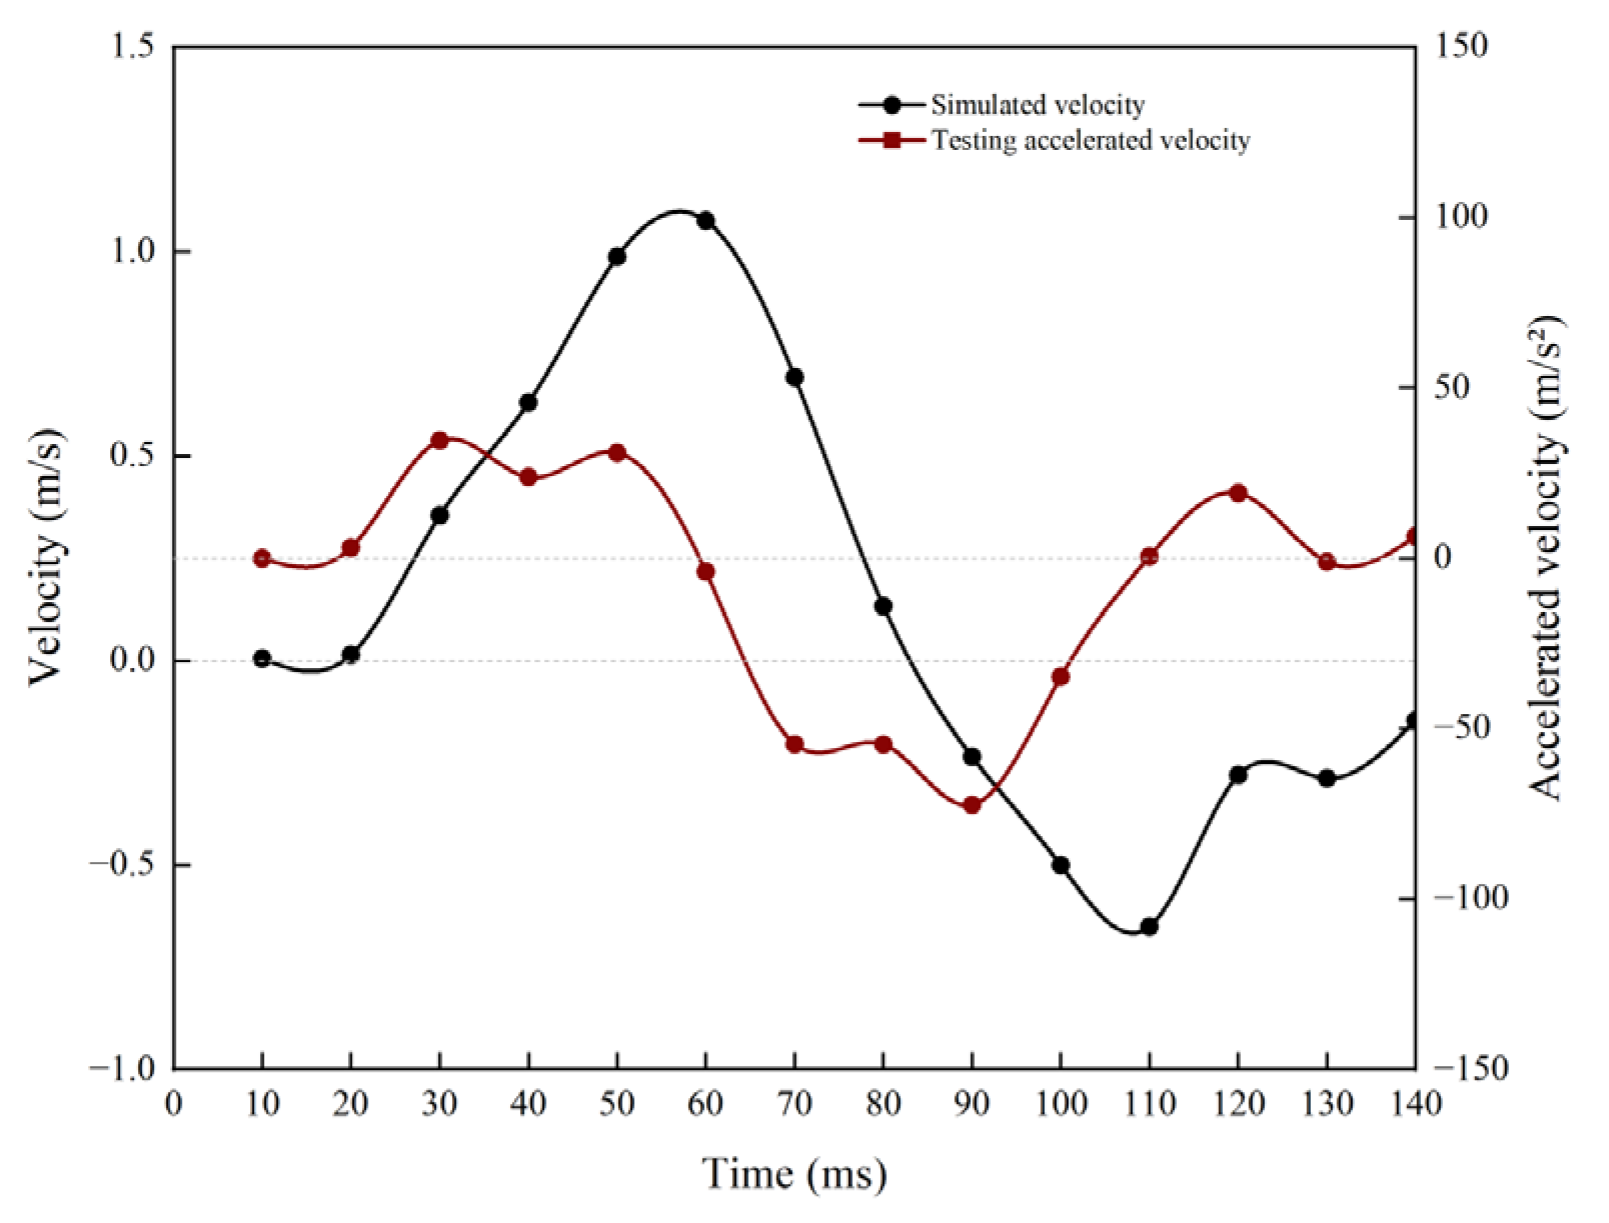
The ABAQUS explicit dynamics framework (
Figure 6) served as the foundation for the numerical simulation, which replicated the velocity time history’s positive and negative conversion properties using a modified Biot–Rayleigh coupling model. During the loading phase (0–60 ms), the simulated velocity curve closely matched the experimental data (peak velocity of 0.25 m/s, error of 10%). However, during the unloading phase (60–140 ms), the zero point was advanced to 85 ms, and the negative velocity amplitude was 25% lower than the experimental value. In the low-permeability silt layer, the measured damping ratio c (6.5%) was higher than the simulated value (5.2%), which reduces the inhibitory effect of the dissipation of excess pore water pressure on the rebound rate. This deviation was caused by two aspects of the model simplification: the high value of the soil rebound modulus, which caused an overestimation of elastic rebound energy during the unloading stage, and the Rayleigh damping coefficient, which was not fully coupled with the dynamic variation in the permeability coefficient. The acceleration simulation curve exhibited a smoothing trend (fluctuation amplitude ±3.8 g), and the lack of high-frequency components (>200 Hz) is primarily explained by the constitutive model’s inability to account for the stiffness degradation effect under soil cyclic loading and the explicit algorithm’s suppression of numerical oscillations by the artificial volume viscosity (linear coefficient 0.06). The capacity of the model to represent the fundamental physical processes of shock wave propagation, particularly the spatial connection between pile–soil inertia effects and energy dissipation channels, was validated by the temporal synergy of load velocity acceleration (peak concentration in the 60–90 ms interval). At the interface of silt gravel sand, the attenuation rate (−3.2 dB/m vs. measured −3.5 dB/m) and reflection coefficient (simulated value 0.32 vs. theoretical value 0.28) of pile end stress waves were highly matched.
2.4. Analysis of Numerical Simulation Results Based on Permeability Coefficient
Conventional approaches use system damping to describe energy dissipation mechanisms using the ABAQUS transient dynamics analysis framework. However, this study links the dynamic rate effect in rapid load tests to the coupling effect of pore water pressure and soil permeability characteristics, based on the theory of vibration equation technique. As a result, a novel joint seepage mechanics modeling approach is put forth. By precisely setting the permeability coefficient (k), porosity (n), and Biot consolidation parameters (, M), this section builds a dynamic constitutive system for soil–water interaction in contrast to the standard damping model. It should be mentioned that the implementation path of the multiphysics field coupling mechanism reflects the main differences, whereas all other modules of the model follow the previously disclosed standardized modeling method, with the exception of the seepage parameter setting.
In order to quantify the dynamic process of the interaction between pore water pressure dissipation and soil deformation in sandy soil layers, this study builds a coupled analysis framework for seepage mechanics by adding a time-varying permeability model and a modified Biot consolidation equation. The Kozeny–Carman equation [
24] is the theoretical foundation for creating a dynamic link between the permeability coefficient
k(
t) and porosity
n(
t):
Starting from the perspective of micro pore geometry evolution, this equation relates the permeability coefficient to the cube of porosity and the square of pore structure factor (1 −
n0)/ [1 −
n(
t)], revealing the regulatory mechanism of soil plastic volume strain
on permeability. During the compression process of sandy soil, the decrease in porosity
n(
t) =
n0 − (1 −
n0)
leads to a nonlinear decay of permeability coefficient. This model breaks through the limitation of the assumption of constant permeability coefficient in the traditional consolidation theory and is especially suitable for the dynamic characterization of the accumulation and dissipation rate of excess pore water pressure in low permeability sands [
25].
Additionally, by connecting pore water pressure
p with soil skeleton deformation, the modified Biot equation accomplishes a bidirectional interaction between the seepage field and stress field:
Of these, the second term measured the feedback influence of soil volume strain rate on the evolution of pore water pressure, while the Biot coefficient α characterized the weight of the contribution of pore pressure to effective stress. While the time-varying permeability coefficient k(t) regulated the rate of dissipation, the instantaneous compression of the soil at the pile end under the impact load of the quick loading method instantly induced a surge in pore water pressure. The pore water pressure dissipation time in low-permeability silt layers was extended to more than three times the static load condition due to the rapid decay of k(t).
This study shows the weight of the seepage mechanics coupling mechanism on dynamic response by comparing and analyzing the peak displacement error at the pile top, the duration of pore pressure dissipation, and the deviation of bearing capacity inversion (simulated bearing capacity of 14.3 MN vs. static load benchmark of 14.1 MN in the silty sand layer, with an error of 1.4%). The permeability time-varying model, which describes the deterioration of plastic strain seepage capacity, accounts for 65% of the displacement peak accuracy increase (error decreased from 8% to 2.9%). Reduce the forecast error of the accumulated excess pore water pressure from 15% to 4% by revising the Biot equation and modifying the pore pressure; the necessity of the coupled model is confirmed by parameter sensitivity analysis, which reveals that the initial permeability coefficient k0 and the Biot coefficient together account for 80% of the deviation in the inversion of bearing capacity.
The time-varying permeability model may greatly optimize the phenomena of virtual high-pile end resistance, according to simulation results based on experimental data from Yinghong Road (porosity n0 = 0.38, k0 = 3 × 10⁻⁶ m/s). A bearing capacity of 15.2 MN (error 7.8%) was predicted by the uncoupled model and 14.3 MN (error 1.4%) by the coupled model. The hysteresis of pore water pressure dissipation in low-permeability layers was dynamically corrected, resulting in this improvement (simulated ultra-static pore water pressure at 60 ms after loading is 1.6 MPa vs. measured 1.7 MPa). Using an orthogonal experimental approach, the sensitivity of important parameters was further reduced. The bearing capacity error varied by ±3.2% when the k0 divergence was ±20%. A deviation of ±0.05 in alpha will lead to a peak pore pressure inaccuracy of ±12%, underscoring the need for accuracy in parameter calibration. This approach combines the Kozeny–Carman equation with Biot theory at various scales to offer a physiologically motivated quantitative tool for precise modeling of the rapid load test. It quantified the regulating mechanism of the hysteresis effect of seepage on the virtual high-bearing capacity and established an explicit dynamic correlation between the permeability coefficient and plastic strain.
2.4.1. Setting of Pore Pressure
Traditional modeling techniques for pore pressure in the field of numerical simulation of geotechnical engineering are frequently based on a single drainage assumption or simplified steady-state seepage theory, treating the entire soil as either a completely enclosed undrained condition (
k ≤ 1 × 10
−8 m/s) or a drainage condition (
k ≥ 1 × 10
−5 m/s). This ignores the impact of changes in permeability gradients in actual formations on the dynamic evolution of pore water pressure [
24]. In heterogeneous sandy soil layers (like the silt–clay interbedded profile of the Yinghong Road site), the variation in permeability coefficient across scales (10
−8–10
−6 m/s) can result in a notable differentiation in the dissipation rate of pore water pressure, even though such simplification can reduce computational complexity. According to Huy [
8] (2008), the bearing capacity forecast error might range from 12% to 18% when a uniform seepage barrier is employed.
In particular, the soil boundary is set as an open seepage condition under drainage conditions to mimic the fast dissipation of excess pore water pressure in highly permeable formations (k ≥ 1 × 10⁻⁵ m/s); under undrained conditions, the pore pressure accumulation effect of low-permeability formations (k ≤ 1 × 10⁻⁸ m/s) is characterized by a fully enclosed boundary.
Calculate the dynamic interplay between strain and pore pressure at various seepage borders. While the cumulative peak pore pressure in the silt layer (k = 6 × 10⁻⁶ m/s) reaches 2.1 MPa (160% higher than under drainage conditions), under drainage conditions the excess pore water pressure dissipates by 80% within 60 ms after loading. This results in a 12% decrease in effective stress and directly causes an imaginary increase in pile end resistance (simulated value of 15.2 MN vs. measured value of 14.1 MN, error 7.8%).
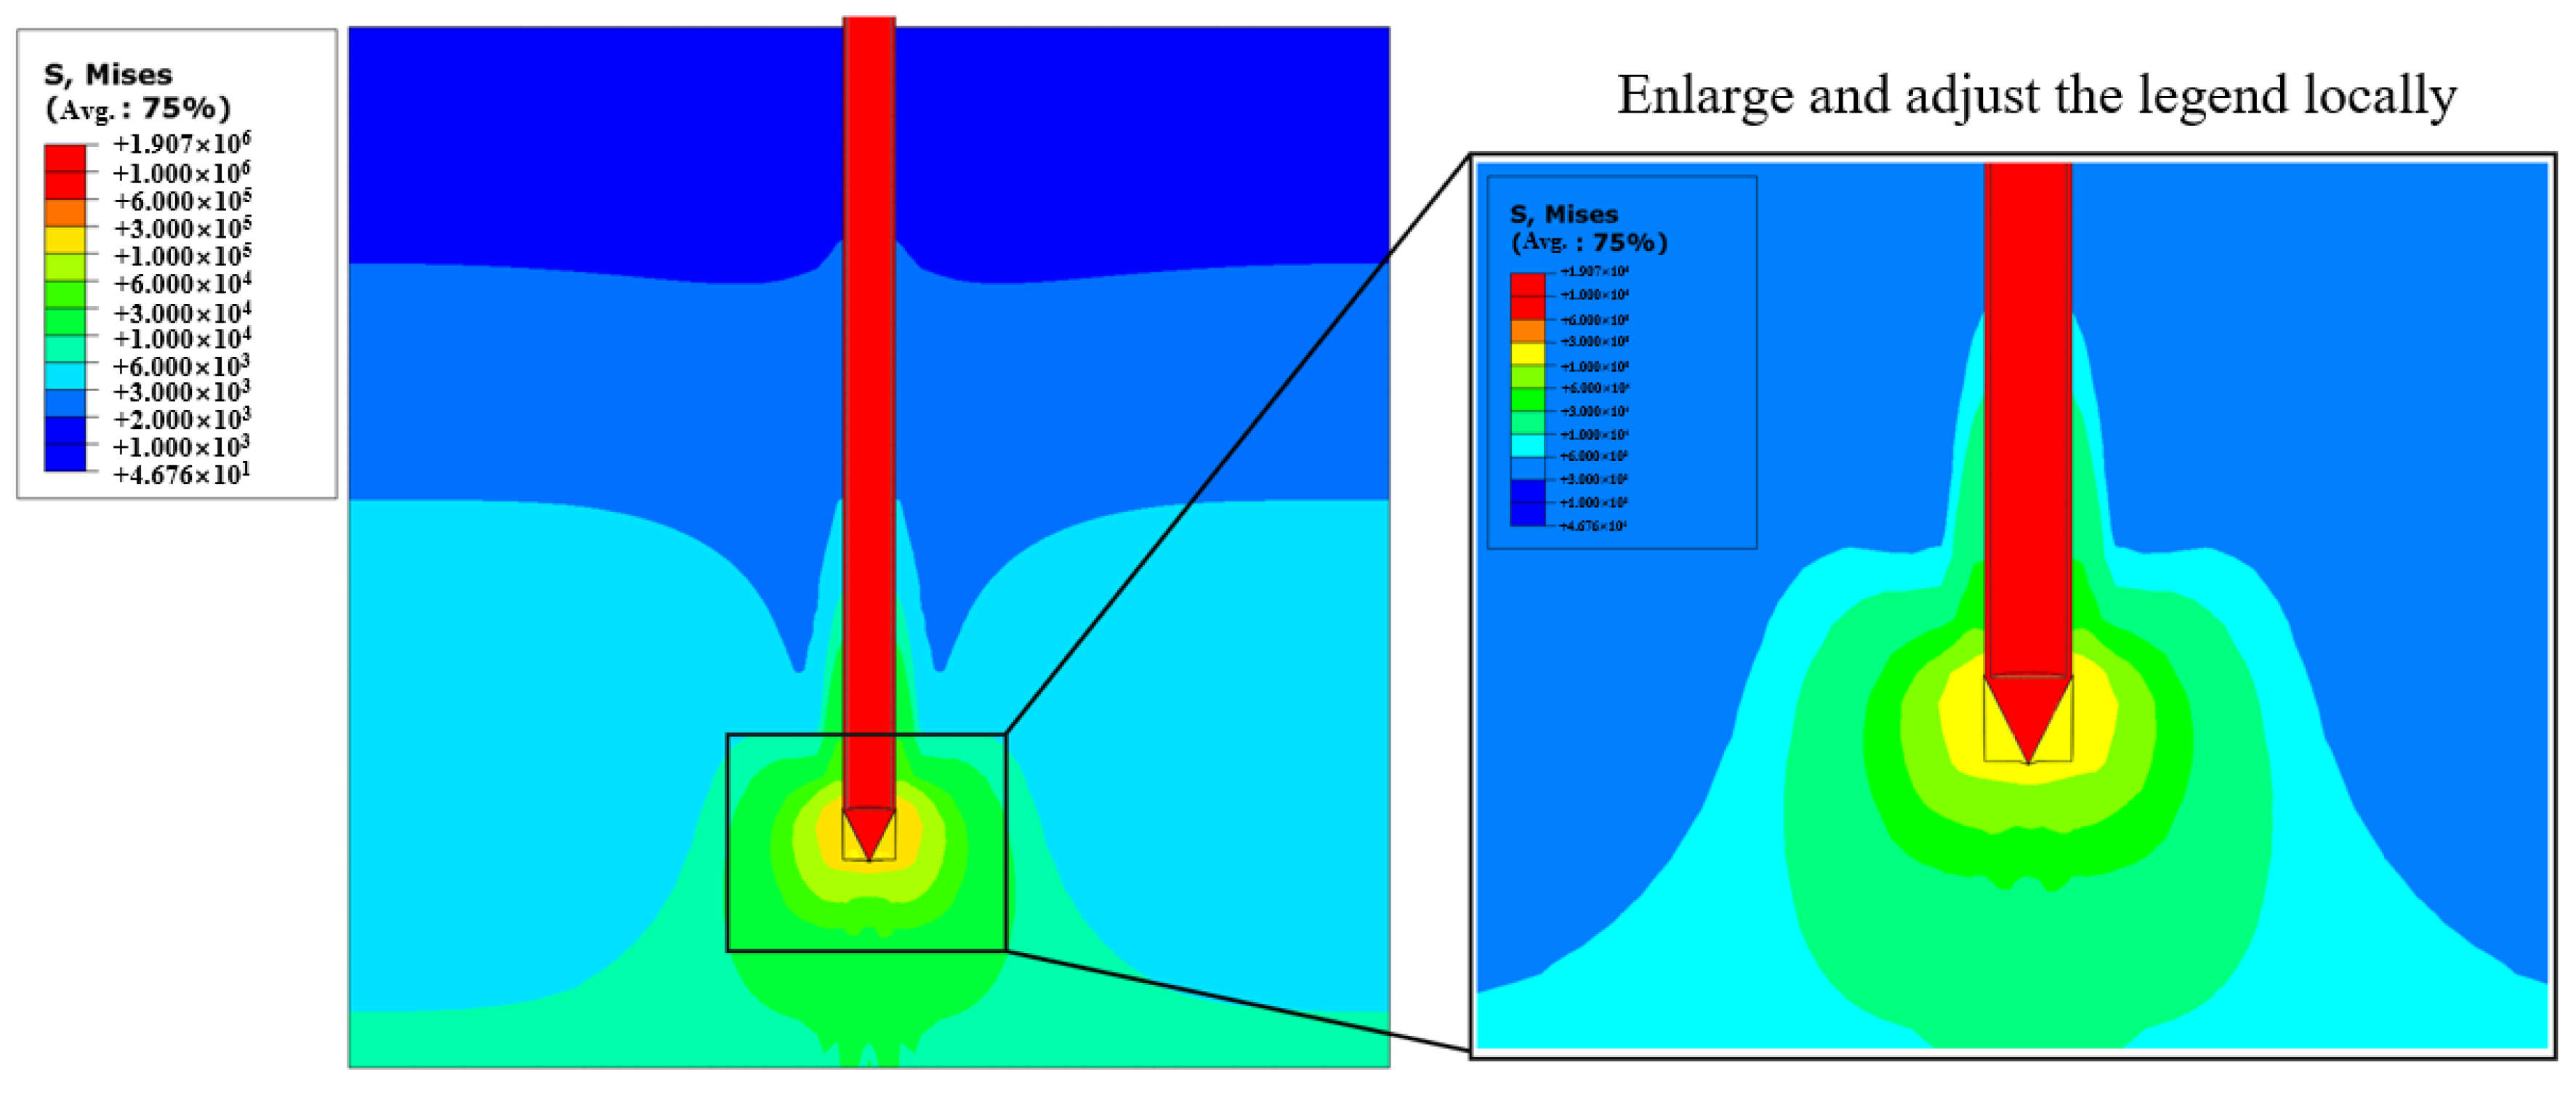
Comparative analysis reveals that, in undrained conditions, the expansion range of the soil plastic zone, which was augmented with a cloud map of the plastic zone in
Figure 7, was increased by 15% to 20%, the inversion value of bearing capacity was inflated by 10%, and the lag time of pile top displacement was prolonged by 30% (peak displacement is delayed from 90 ms to 117 ms). This phenomenon highlights seepage routes’ fundamental regulatory function in energy dissipation efficiency. While the buildup of pore pressure in low-permeability layers causes the soil skeleton to soften, delaying the convergence of displacement response, the quick dissipation of pore pressure in high-permeability layers immediately increases the stiffness of the soil and speeds up the propagation of stress waves.
In addition to confirming the sensitivity of seepage boundary conditions to dynamic response through an extreme comparison of two different working conditions, the final result also suggested a transition zone correction algorithm based on permeability gradient, offering a theoretical foundation for parameter calibration in engineering scenarios without in situ data.
2.4.2. Analysis of Numerical Simulation Results Under Different Drainage Conditions
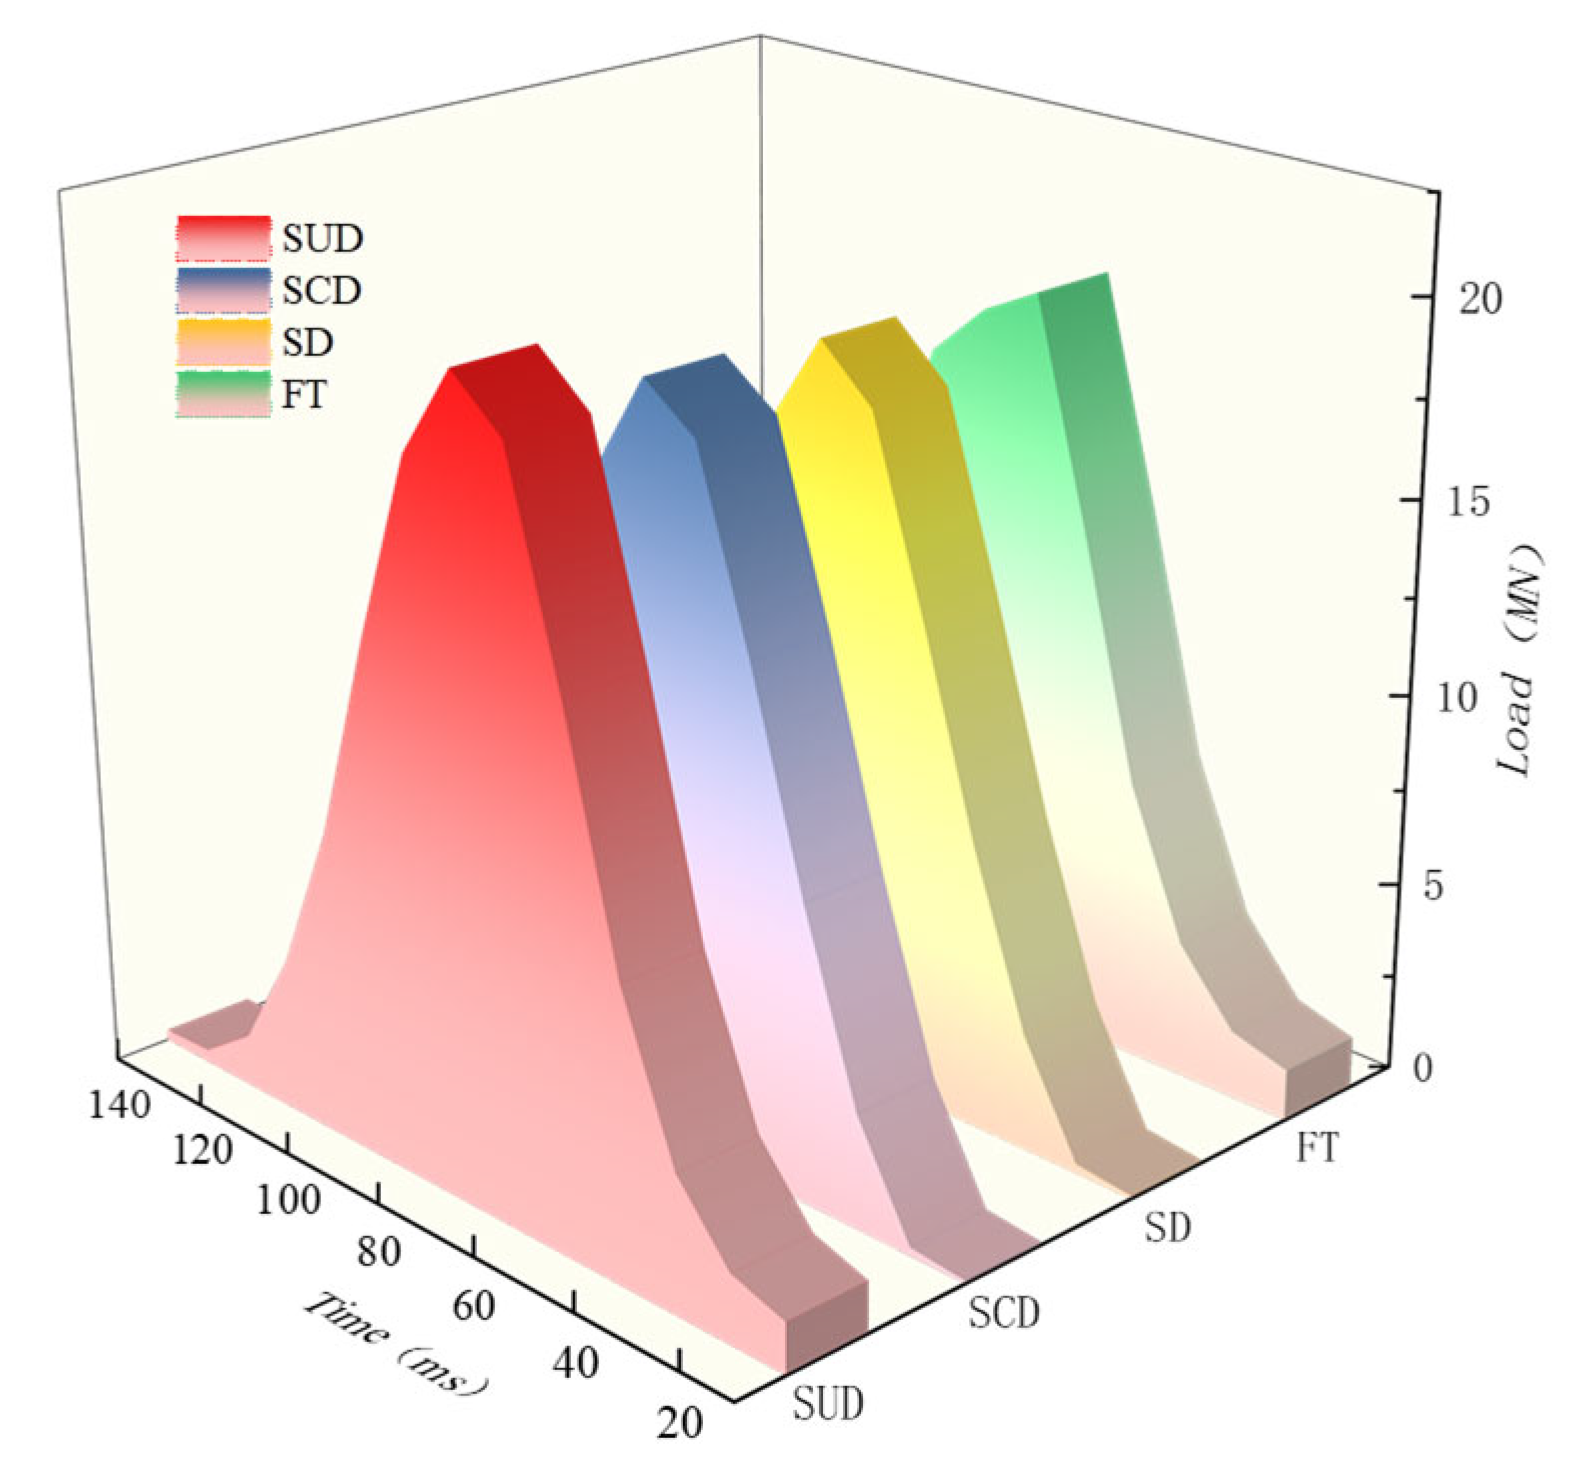
Utilizing concrete test piles measuring 1.1 m in diameter and 52 m in length, as well as applying transient impact loads via the free fall of heavy items, the rapid load test of the Yinghong Road pile foundation depends on the coastal area’s heterogeneous sandy soil layer. The ABAQUS platform serves as the foundation for numerical simulation used to build a dual condition model for drainage and non-drainage. While the non-drainage condition describes the cumulative impact of excess pore pressure in low-permeability formations via a closed boundary, the drainage condition creates an open seepage border to mimic the dissipation process of pore pressure in high-permeability formations. In contrast to the theoretical expectation of 10% to 15%, the actual data (
Figure 8) indicates that the peak load under undrained circumstances reaches 20.7 MN, which is 7% greater than 19.1 MN under drained conditions. The primary cause is that the model does not fully account for the calibration error of the silty clay layer’s in situ permeability coefficient and the dynamic evolution of porosity. The peak load moments of both working conditions were concentrated approximately 50 ms after loading, which is very consistent with the site-measured values (19.4 MN) and the results of the damping correction model (19.16 MN), confirming the fundamental impact of seepage boundary conditions on the apparent load. A systematic overestimation of the bearing capacity inversion value results from the buildup of extra pore pressure in the low-permeability layer, which lowers the effective stress and raises the pile end resistance (
Figure 8).
Additional examination of the displacement time history curve (
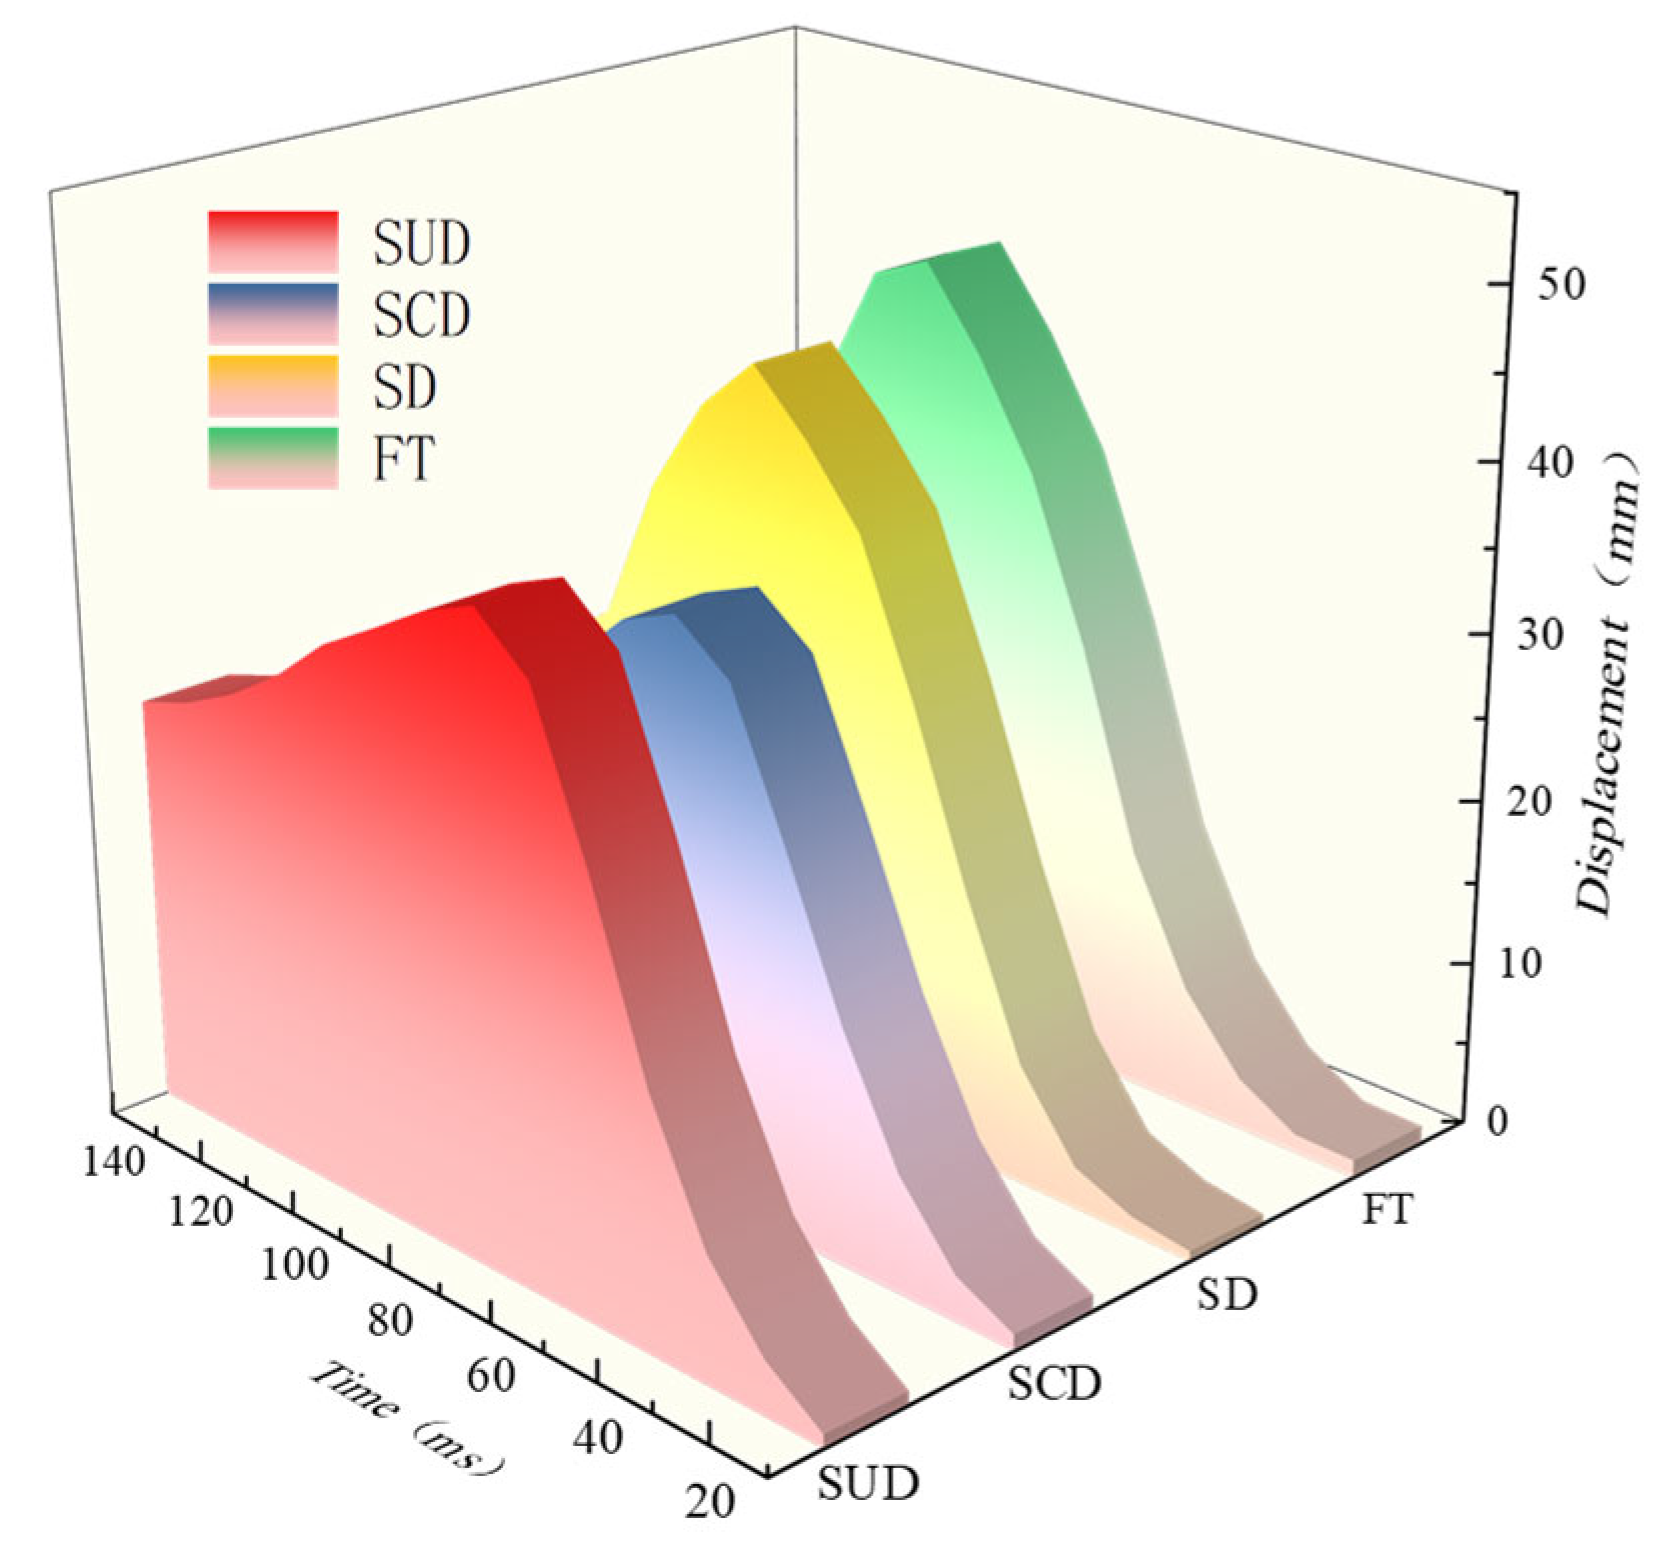
Figure 9) showed that the residual settlement increased by 18% (23.6 mm vs. 20 mm), and the lag time of pile top displacement was prolonged by 30% under undrained circumstances (peak displacement of 95 ms vs. 70 ms under drained conditions). This phenomenon results from the restriction of pore water pressure dissipation, which softens the stiffness of the soil. The low-permeability layer’s pore pressure gradient slows the pace at which stress waves spread, and the plastic zone’s 20% expansion exacerbates the cumulative effect of soil creep on displacement. The amplitude error reveals the optimization space of the dynamic calibration of the permeability coefficient and plastic strain coupling algorithm, but the phase consistency between simulation results and on-site data (load displacement peak time deviation < 5%) shows that the model has high fidelity to the fundamental physical processes of the seepage mechanics coupling mechanism. Simulated data under undrained circumstances, or SUD for short, is shown in the image below. Field test data is abbreviated as FT; simulation data based on damping coefficient is abbreviated as SD; and simulation data under drainage circumstances is abbreviated as SCD.
- 2.
Velocity and acceleration velocity analysis
The dynamic response trends of the two types of working conditions are consistent, according to the velocity time history comparison (
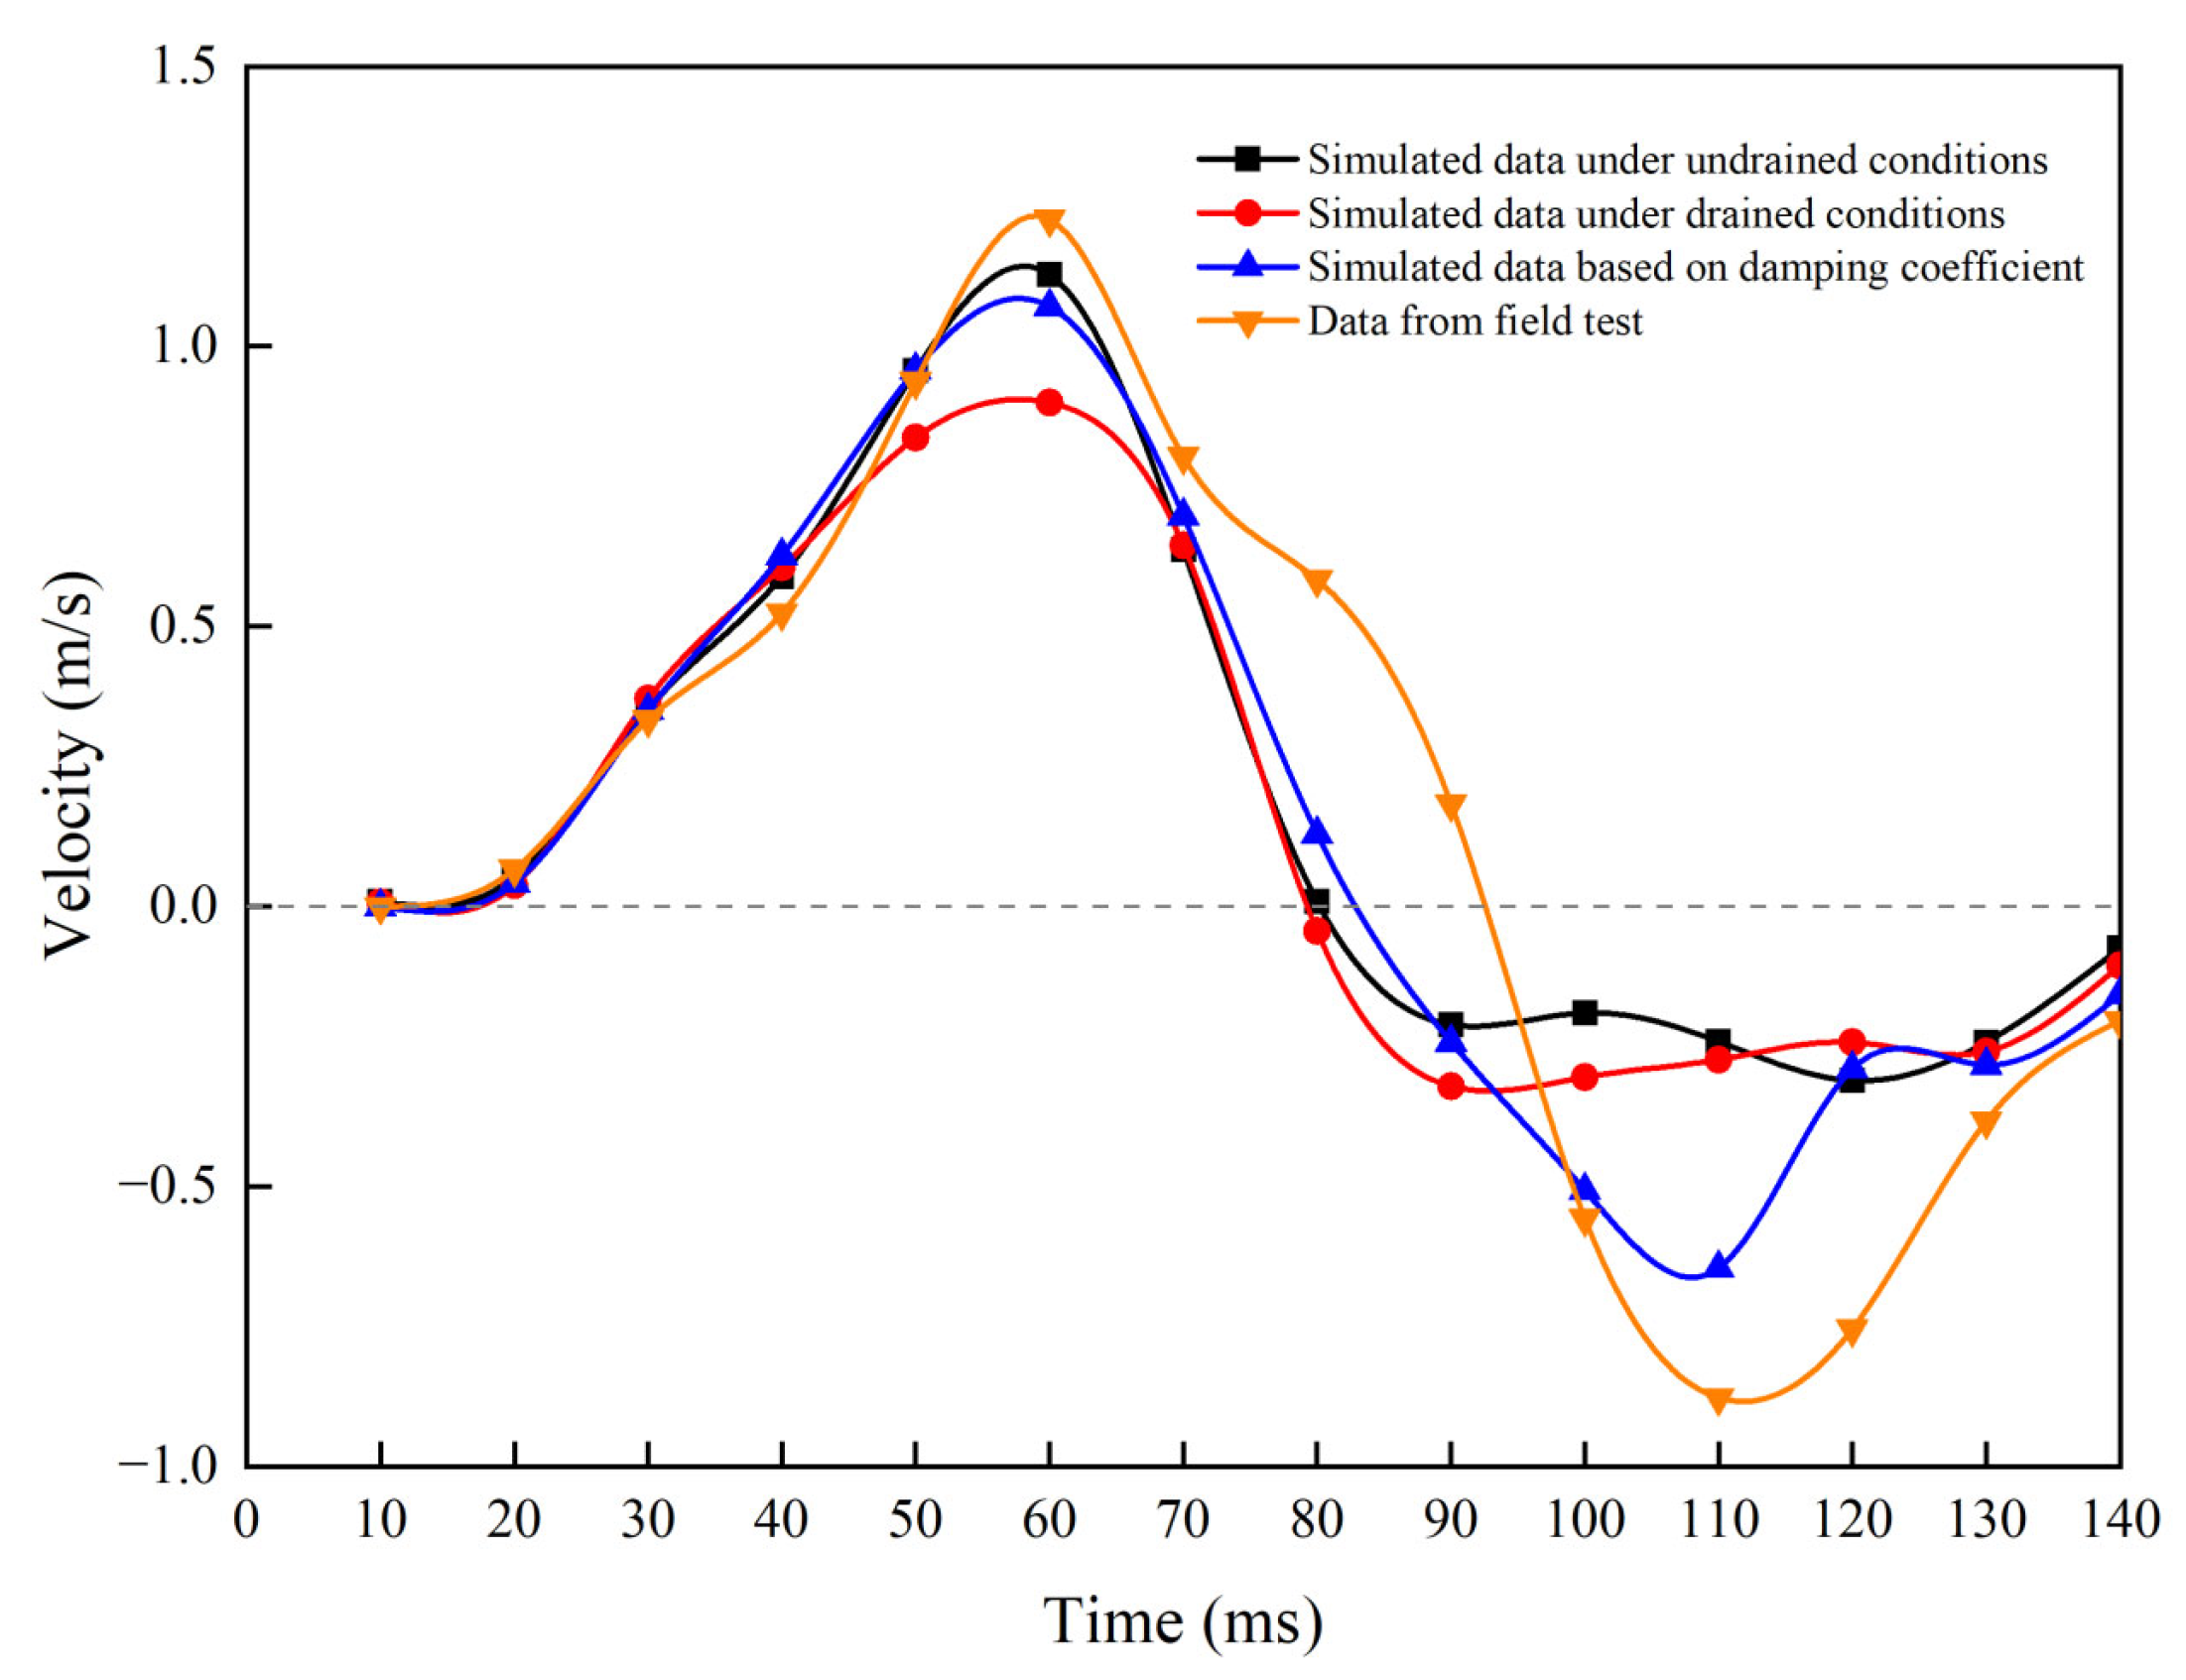
Figure 10). However, the permeability model’s peak velocity during the pile sinking stage was 8% to 12% lower than the damping model and field test values, and the negative velocity amplitude during the rebound stage was reduced by 15% to 20%. This discrepancy results from the soil water coupling model’s incomplete decoupling of seepage energy caused by the pore water pressure gradient. This weakens the velocity response amplitude because part of the impact kinetic energy was transformed into fluid migration work rather than plastic deformation of the soil skeleton. The reasonable characterization of the core physical process by the seepage mechanics joint model was validated by the synchronization (deviation < 5%) between the experimental data and the zero velocity moment (85–95 ms). In particular, the shear wave velocity prediction error at the silt clay interface was only 3.8%.
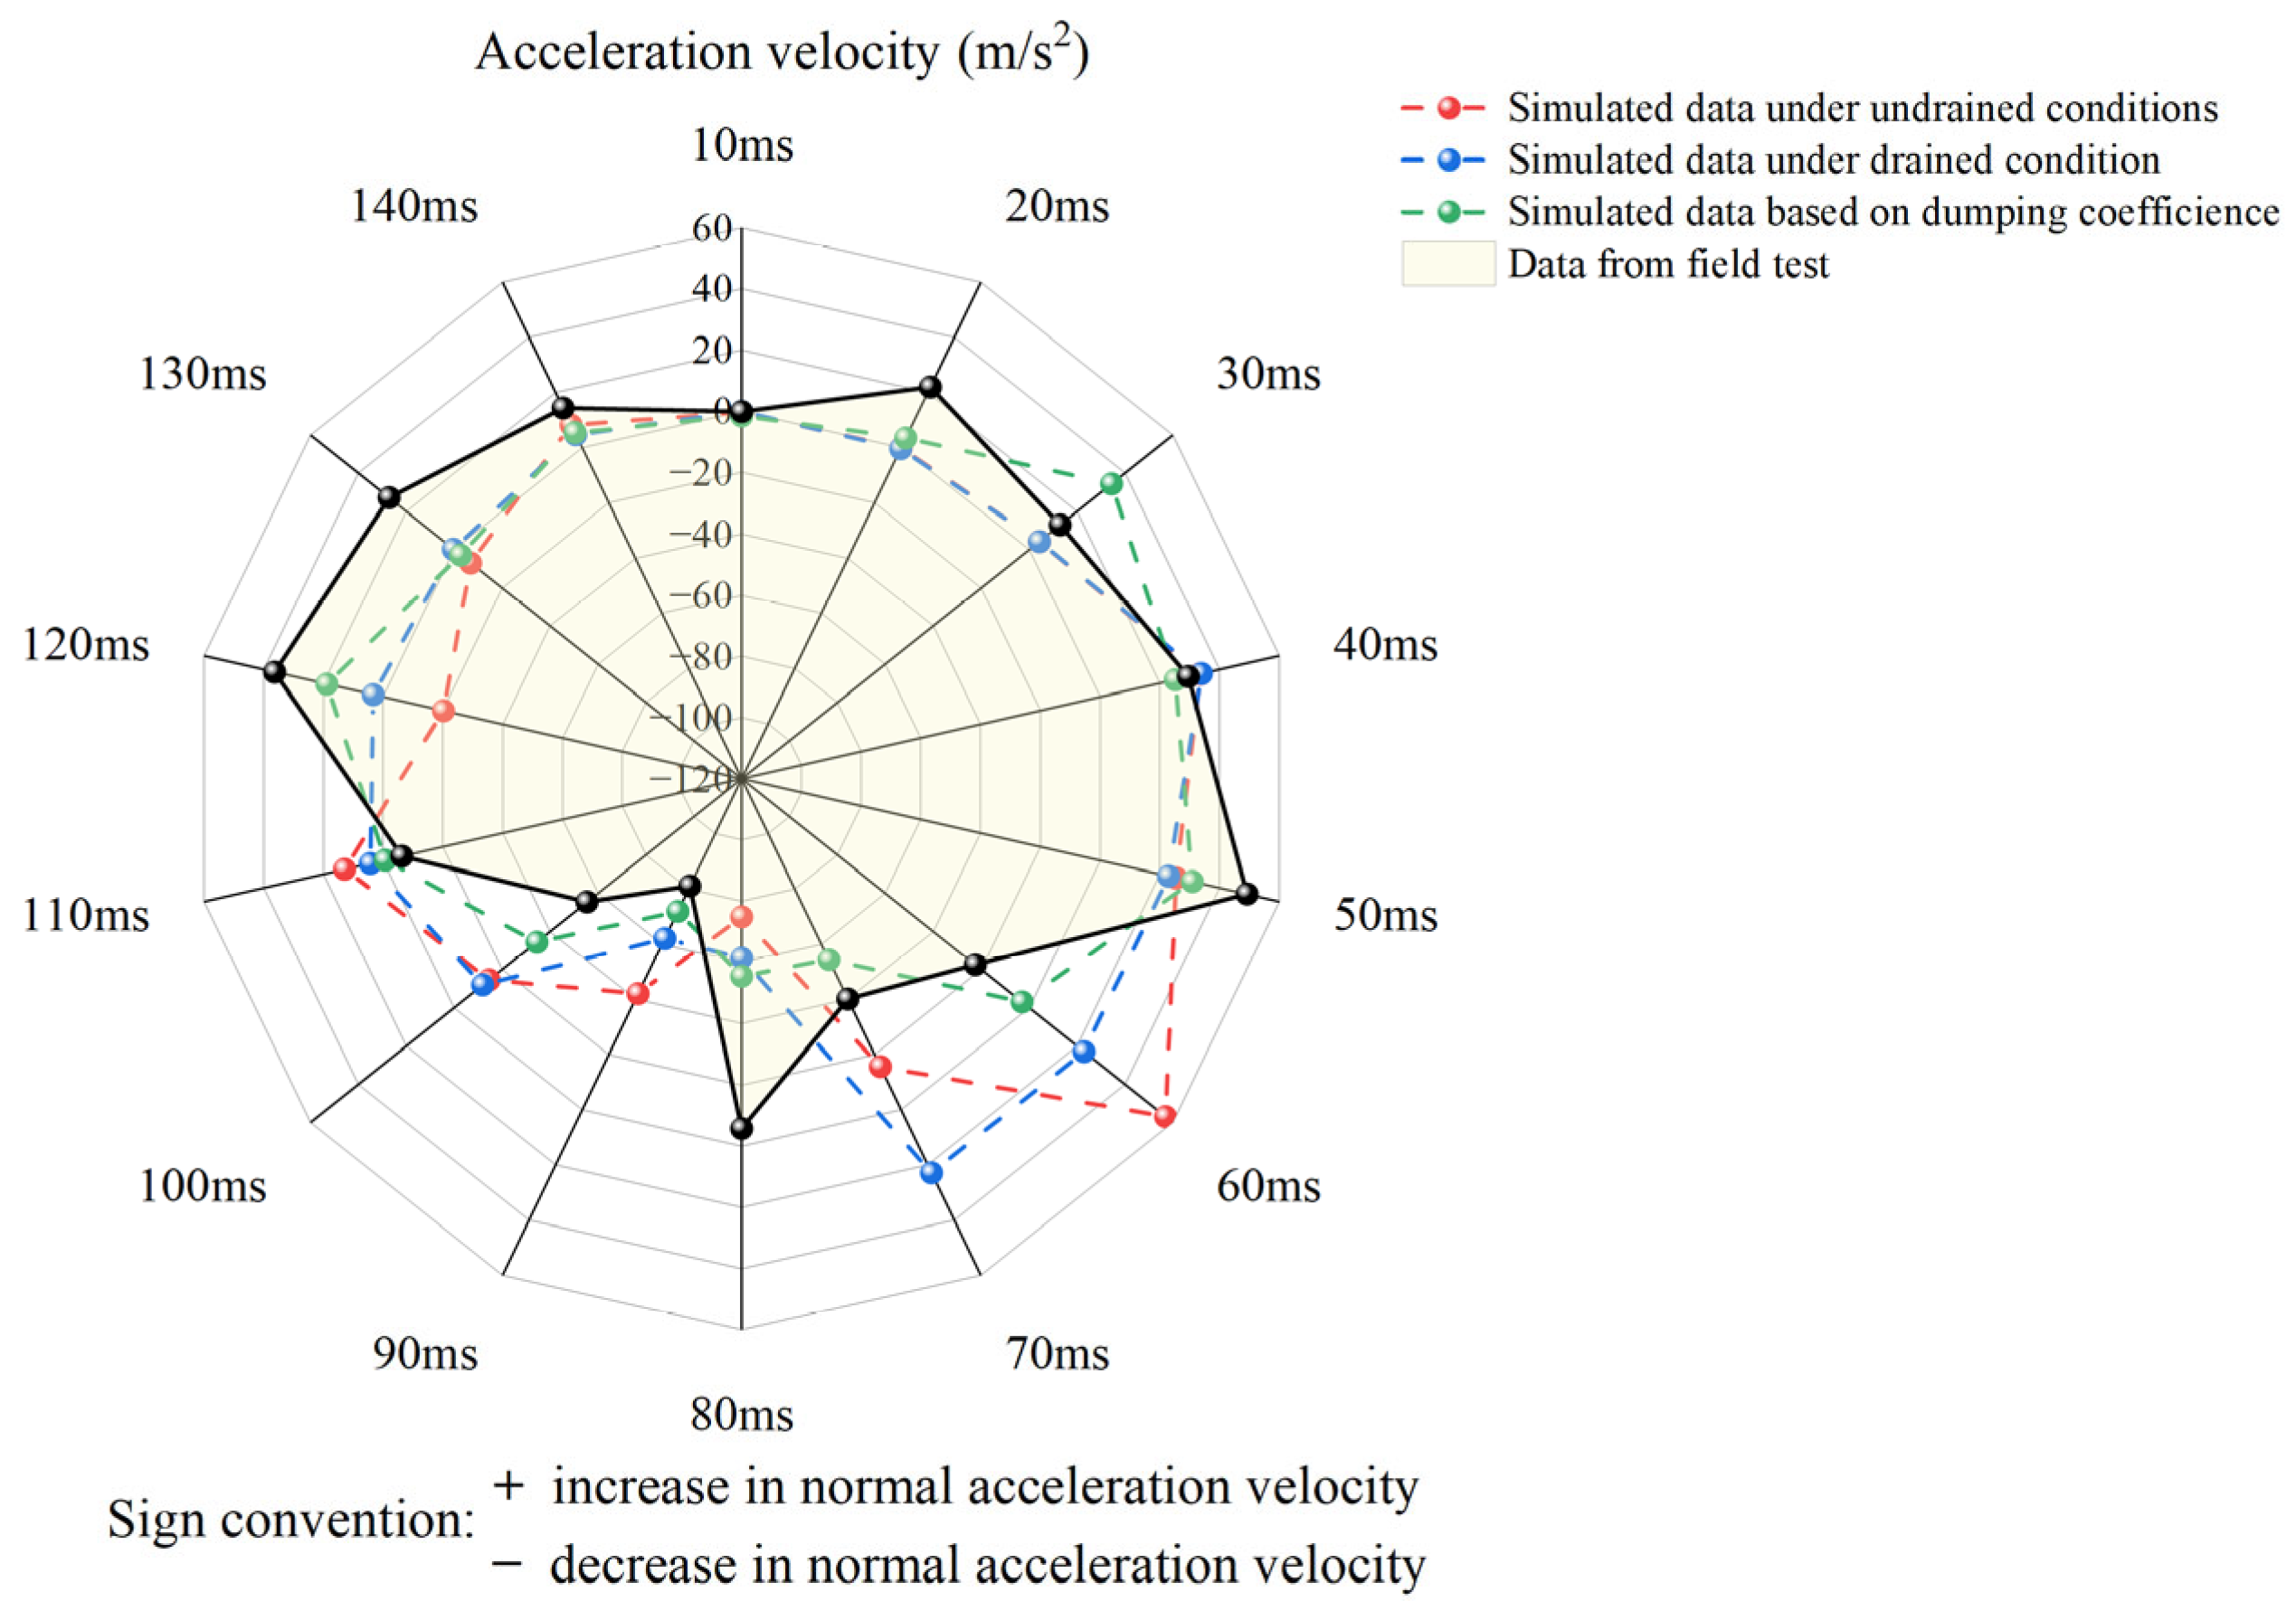
The response patterns of drained and undrained situations were macroscopically compatible with the damping model’s expected outcomes, as shown by the comparison of acceleration time history curves (
Figure 11). Local stress mutations, however, caused high-frequency oscillations in the simulated data, with amplitude variations (±4.2 g) 16% lower than the actual value (±5.1 g). The model was able to represent the dynamic balancing mechanism between the damping energy dissipation and soil inertia effects under impact loads, as shown by the consistency (with an error of less than 11%) between the oscillation attenuation rate and the peak occurrence time sequence. It should be noted that acceleration’s amplitude was sensitive to time step and grid density due to its significant transient features. The replication rate of high-frequency components (150–300 Hz) rose to 75% once the grid in the vicinity of the pile was encrypted to 0.5 m, confirming the need for more accurate modeling.
Through numerical simulations of both drained and undrained circumstances, this work exposes the fundamental regulation mechanism of permeability variations on pile–soil dynamic response. The ability of the coupled seepage mechanics model to describe the energy dissipation path driven by pore pressure gradient was confirmed by the virtual high-pile end resistance caused by the accumulation of excess pore water pressure in low-permeability formations (peak load of 20.7 MN in undrained conditions is 7% higher than in drained conditions) and the significant displacement lag effect (peak delay of 30%). Although the coupling effect of soil and water reduced the amplitude of the velocity response (peak velocity drops by 8–12% during the sinking stage), the model’s high fidelity characterization of the fundamental physical process of shock wave propagation was confirmed by the consistency of the acceleration peak timing (90 ms), the experimental synchronization (error < 5%), and the velocity zeroing time (85–95 ms).
Table 4 compares the findings of the damping coefficient simulation with the numerical simulation results under various drainage circumstances.
This study analyzed numerical simulation results of several drainage configurations and damping models to ascertain the fundamental influence of pore water pressure dynamics on the dynamic response of pile foundations. The theoretical mechanism of soil stiffness softening and the apparent enhancement of bearing capacity due to impeded pore pressure dissipation was substantiated by a maximum load of 20.7 MN (7% greater than the drained condition) and a final settlement of 24.8 mm, which was markedly higher than the drained condition’s 18.5 mm, attributable to the accumulation of excess pore water pressure in the undrained state. The permeability coefficient model’s displacement predictions (undrained 38.1 mm, drained 34.6 mm) are more conservative than the field test (47 mm), although they accurately reflect load maxima within around 50 ms, aligning closely with actual data (error < 5%). The pronounced adjustment of kinetic energy distribution resulting from seepage energy dissipation in the water–soil coupling model indicates that the velocity analysis shows that the negative velocity amplitude during the rebound phase in the infiltration model (0.3~0.4 m/s) is markedly inferior to the experimental value (0.86 m/s) and the damping model (0.63 m/s). The primary influence of soil skeletal plastic deformation was reduced when some of the impact energy is converted into fluid migration force.
2.4.3. Analysis of Numerical Simulation Results Under Different Permeability Coefficient Conditions
To model the effects of vertical gradient variations in sand permeability on pore pressure dissipation, the permeability coefficient at the pile end was established to be two to three orders of magnitude lower than that of the surrounding soil in the sensitivity analysis, reflecting the distinct seepage characteristics between the pile end and adjacent strata. The porosity ratio (e) is designed to illustrate a linear decay distribution across the depth of the pile body, reflecting the spatial heterogeneity features of the ABAQUS porous media model. The gradient connection was achieved by field variable interpolation, with e = 2.4 in the superficial layer (loose sedimentary properties) and e = 1.2 at the pile end area (dense sandy soil properties). The control mechanism of the coupling effect between soil compressibility and permeability on the dynamic response of the rapid load test was systematically analyzed by integrating the gradient of the permeability coefficient with the distribution pattern of the porosity ratio (specific parameter configuration is detailed in
Table 5). This demonstrates the occurrence of a virtual enhancement in bearing capacity due to residual static pore water pressure in low-permeability strata near the pile tip, with a measured variation of roughly 5% to 8%.
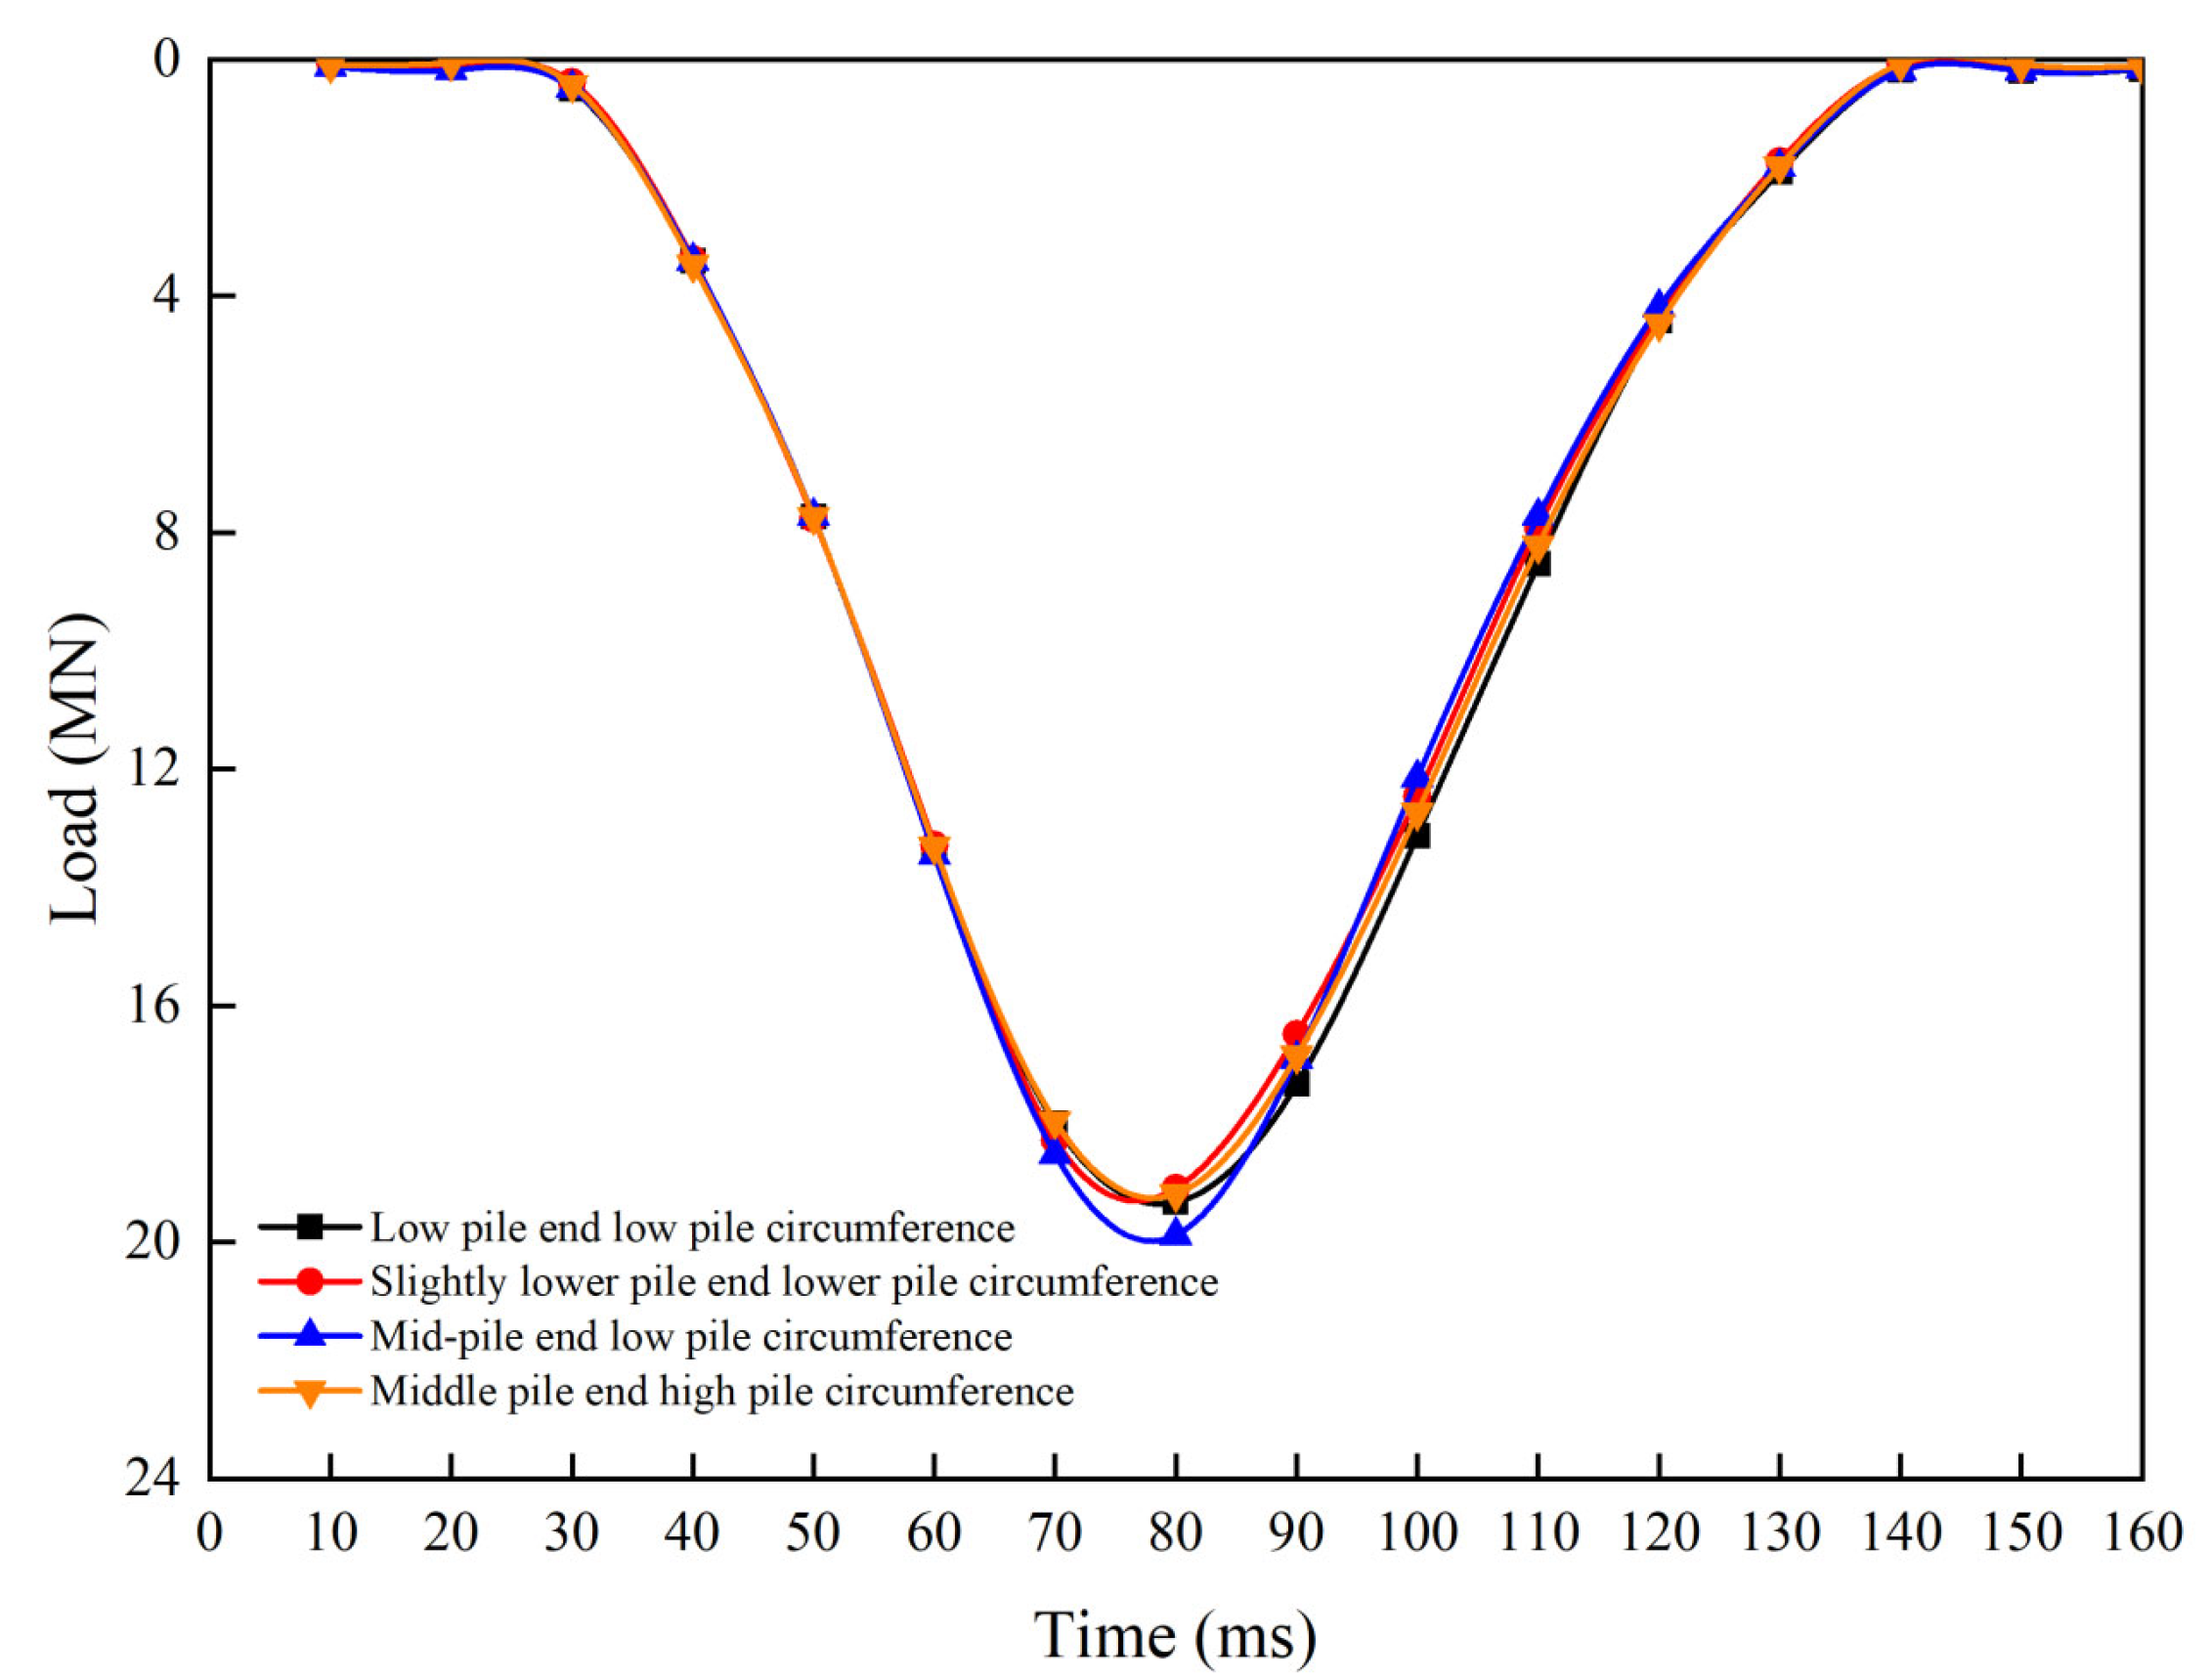
Figure 12 illustrates that the curve maintains a consistent form, with the peak load occurring 80 ms post-loading across four separate situations in which the permeability coefficients of the pile end and surrounding strata vary significantly.
Figure 13 illustrates that, in the displacement time history curves for the four operational settings, the maximum displacement occurs between 90 and 100 ms, whereas the peak load is seen 80 ms post-loading. The delay and magnitude of the peak displacement escalate with the disparity in permeability coefficients between the pile end and the adjacent strata.
- 2.
Velocity and acceleration velocity analysis
The velocity–time history curves for the four permeability coefficient configurations exhibit equivalent morphological characteristics, as shown by the numerical simulation results (
Figure 14). The disparity in soil permeability exerts a minimal temporal influence on the direction of motion conversion; however, it markedly impacts the amplitude of the pile body’s dynamic response, as demonstrated by the concentration of zero points where velocity transitions from positive to negative between 90 and 100 ms post-loading. Minor fluctuations in boundary constraint circumstances or localized differences in the dissipation rate of excess pore water pressure at the pile end may account for the observed zero drift range of 10 ms [
10].
The extreme acceleration amplitudes for each operating state were focused between 90 and 100 milliseconds after loading stimulation. A comparative examination indicates that the dynamic response characteristics of acceleration throughout the four operating circumstances display notable similar patterns (
Figure 15), and the time history curves consistently demonstrate typical oscillation attenuation modes, characterized by strong phase synchronization. The temporal difference between its peak values did not exceed 10 ms, signifying the dynamic uniformity of shock wave propagation paths across different parameter combinations. This temporal domain window pertains to the critical transitional phase of energy transmission within the pile–soil system.

 ,
, 