Article

Highway Rest Area Truck Parking Occupancy Prediction Using Machine Learning: A Case Study from Poland

1
Department of Product Packaging Science, Institute of Quality Sciences and Product Management, Krakow University of Economics, 27 Rakowicka St., 31-510 Krakow, Poland
2
Department of Transport Systems, Traffic Engineering and Logistics, Faculty of Transport and Aviation Engineering, Silesian University of Technology, 8 Krasińskiego St., 40-019 Katowice, Poland
*
Authors to whom correspondence should be addressed.
Infrastructures 2025, 10(7), 151; https://doi.org/10.3390/infrastructures10070151
Submission received: 12 May 2025 / Revised: 17 June 2025 / Accepted: 20 June 2025 / Published: 22 June 2025
(This article belongs to the Special Issue Smart Mobility and Transportation Infrastructure)

Abstract

Highway rest areas are relevant components of road infrastructure, providing drivers with essential opportunities to rest and mitigate fatigue-related crash risks. Despite their acknowledged importance, little is known about the factors that influence their actual utilization. This study addresses this gap by applying supervised machine learning algorithms to predict hourly occupancy levels of truck parking lots at highway rest areas using a dataset collected from digital monitoring systems in Poland. The dataset includes 10,740 observations and 33 features describing infrastructural, administrative, and locational characteristics of selected rest areas in Poland. Eight classification models—Gradient Boosting, XGBoost, Random Forest, k-NN, Decision Tree, Logistic Regression, SVM, and Naive Bayes—were implemented and compared using standard performance metrics. Gradient Boosting emerged as the best-performing model, achieving the highest prediction accuracy and identifying key features such as the presence of fuel stations, rest area category, and facility amenities as significant predictors of occupancy. The findings highlight the potential of interpretable machine learning methods for supporting infrastructure planning, particularly in identifying underutilized or overburdened facilities. This research demonstrates a data-driven approach for analyzing rest area usage and provides practical insights for optimizing facility distribution, enhancing road safety, and informing future investments in transport infrastructure.

1. Introduction

1.1. Background and Motivation

Highway rest areas (HRAs) are essential components of road infrastructure serving multiple functional, safety, environmental, and economic roles. Rest areas (RAs) support overall traffic efficiency by distributing stopping and resting behavior along highways in a controlled and predictable manner. They reduce the incidence of unsafe roadside parking, particularly by freight vehicles, which can otherwise obstruct emergency lanes and exit ramps [1]. Moreover, they serve as logistical hubs, sometimes integrated with weigh stations, fueling facilities, and freight management systems. The European Commission promotes “Safe and Secure Truck Parking Areas” (SSTPAs) across Trans-European Transport Networks (TEN-T), recognizing rest areas as strategic infrastructure assets [2]. These are designated areas outside the road lane that have been specially modified to accommodate the demands of drivers and travelers. They are equipped with parking spaces, sanitary, catering and accommodation infrastructure, as well as facilities for refueling and servicing the vehicle.
Motorway rest areas are providing drivers with opportunities to rest and mitigate fatigue, a significant factor contributing to road accidents. Fatigue, recognized as a critical factor in road crashes [3], impairs cognitive functions such as reaction time, attention, and decision-making, increasing the likelihood of collisions. Furthermore, research indicates that driver fatigue is insufficiently recognized and reported as a cause of road accidents [4]. The presence of well-maintained rest areas has been associated with a reduction in fatigue-related crashes, highlighting their role in enhancing road safety [5]. Therefore, understanding and improving the utilization of HRAs is crucial for developing strategies to combat driver fatigue and its associated risks.
Recent studies have further emphasized the importance of rest area availability. For instance, research indicates that fatigue-related commercial vehicle driver at-fault crashes occurred more frequently when RAs were more than 20 miles apart [6]. Segments nearer rest locations had less fatigue-related occurrences, according to [7]’s studies on the relationship between points proximity and fatigue-related incidents, indicating a beneficial safety impact. Additionally, a study examining the impact of limited RAs on truck driver crashes in Saskatchewan found a significant association between fatigue-related crashes and a lack of truck stops and RAs [8]. These findings underscore the need for strategically located and adequately equipped HRAs to support driver well-being and enhance overall road safety. The impact of work schedules and the availability of suitable resting areas should be taken into account in interventions aimed at reducing driver weariness, as examined in [9].
Despite the critical role of RAs in promoting road safety, there is a notable deficiency in research focusing on their utilization patterns and the factors influencing their use. While numerous studies have addressed the impact of driver fatigue on accident rates, few have examined how the availability, location, and amenities of RAs affect drivers’ decisions to utilize these facilities. However, comprehensive analyses of HRA utilization patterns remain scarce. Understanding these patterns is essential for developing targeted interventions aimed at enhancing RA usage and, consequently, reducing fatigue-related accidents.
Given the growing complexity of transport systems and the increasing availability of infrastructure-related data, data-driven approaches have gained traction as effective tools for understanding and optimizing HRAs usage. Traditional planning models often rely on aggregated traffic volumes and static facility inventories, offering limited insight into temporal and behavioral dynamics. In contrast, modern data analytics enable researchers to capture detailed usage patterns, identify peak demand periods, and evaluate the functional adequacy of existing RA infrastructure.
Machine learning methods are increasingly being applied in transportation research to address these analytical needs. Their ability to handle non-linear relationships and high-dimensional data makes them well-suited for predicting HRA occupancy, identifying underutilized or overburdened facilities, and supporting strategic planning decisions. Previous studies have demonstrated the utility of classifiers such as decision trees, Random Forests, and boosting algorithms in modeling spatiotemporal traffic dynamics and facility use [8,9]. These techniques not only improve prediction accuracy but also offer insights into the relative importance of various infrastructural and contextual factors affecting occupancy levels.
As highlighted by Cai et al. [10], the integration of electronic toll collection (ETC) data and facility-level records can facilitate the estimation of dwell times and occupancy trends in real-world conditions. Such approaches provide the foundation for evidence-based infrastructure planning, especially in regions with heterogeneous traffic flows or uneven facility distribution.
Given the increasing availability of real-time and infrastructure-related data, data-driven approaches have become essential for analyzing HRAs utilization and improving facility planning. Traditional models rarely capture temporal variation or behavioral aspects of HRAs usage. In contrast, modern predictive techniques, such as machine learning, allow for the short-term forecasting of parking availability and occupancy states [11,12]. For instance, Provoost et al. demonstrated that real-time vehicle detection data, when combined with gradient boosting models, significantly improves the prediction of HRAs states, providing valuable input for dynamic traffic and parking management systems [13]. Similarly, Koesdwiady et al. integrated weather information into deep learning models for traffic flow prediction, showing that external contextual factors can meaningfully enhance predictive accuracy in transportation datasets [14]. These methodological advances are highly relevant to HRAs modeling, where occupancy patterns depend on a complex interplay of infrastructure features, temporal demand, and driver behavior. As interest in intelligent transport systems continues to grow, predictive modeling of HRAs utilization offers a promising direction for improving road safety, optimizing investments, and enhancing user experience.

1.2. Research Gap

Although HRAs have been widely acknowledged as critical infrastructure for mitigating driver fatigue and enhancing road safety, their actual utilization patterns remain poorly understood. Prior studies have predominantly focused on macro-level metrics such as spatial distribution or total facility counts, often neglecting the temporal, behavioral, and functional aspects of RA use. Exploration of the spatial distribution of the service and RAs on the toll motorways in the European Union (EU) presented in [15] revealed a great variability due to different distribution policies. Detailed analysis of the infrastructure and facilities offered in HRAs and the distances between consecutive HRAs was described in many studies on the example of Spain [16], Poland [17], or Lithuania [18]. To determine the quality standards for RA selection, these studies concentrated on analyzing the current state of HRAs in each country. Also, users‘ preferences for planning parameters of HRAs were introduced in [19].
However, choosing a specific place to rest is not always possible due to the overcrowding of parking lots for truck drivers. In [20], a classification method was developed to categorize various types of authorized and unauthorized parking for heavy commercial vehicles (HCV) facing potential parking shortages to accommodate hours of service (HOS) rest requirements. The lack of enough parking spaces during the busiest periods in car parks results in illegal and dangerous parking on entrances and exits and in other unauthorized places, which may pose a risk to road safety. To address parking shortages, researchers have developed various models to predict parking utilization. The models can be based on econometric models when utilizing GPS data to forecast parking demand and identify utilization patterns [21,22]. Graph neural networks are used to employ spatio-temporal data to predict occupancy rates across multiple sites, enhancing the accuracy of forecasts [23]. Queuing theory models apply statistical methods to model arrival and departure rates, providing probabilistic real-time forecasts of parking occupancy [23].
Several studies have focused on estimating and predicting vehicle turn-in rates and occupancy patterns at highway service areas, employing both statistical and machine learning methods. An ADPC-GMM approach utilizing ETC gantry data to estimate vehicle turn-in rates, demonstrating the effectiveness of probabilistic clustering in capturing entry behavior at expressway rest areas, was proposed in [24]. In a related study [25], a Random Forest model to predict vehicle turn-in rates, highlighting the potential of ensemble learning techniques for handling non-linear traffic behavior. Earlier works [26] used BP neural networks to estimate the percentage of mainline traffic entering rest areas, while [27,28] extended this approach with a wavelet neural network combined with a genetic algorithm, showing improved prediction accuracy. These studies underscore the growing interest in data-driven approaches for rest area usage analysis [29,30]. Building on this foundation, our work contributes by integrating facility-level features with occupancy data, providing a more comprehensive understanding of the factors influencing service area utilization.
In the scientific literature, no research was found concerning the RA selection depending on its occupancy in connection with the attractiveness of facilities of these places. Even where HRAs are integrated into broader traffic models, their role is typically limited to static parameters or assumed usage rates, rather than empirically derived occupancy dynamics.
Furthermore, while the application of machine learning in transportation has expanded rapidly in recent years, few studies have employed these methods to model HRAs truck parking occupancy using infrastructure-level attributes. Existing work tends to concentrate on highway congestion prediction or traffic flow forecasting, with limited attention given to facility-specific demand modeling. To the best of our knowledge, no prior research has systematically evaluated and compared supervised classification algorithms for predicting HRAs truck parking occupancy on an hourly basis using a comprehensive dataset combining infrastructural, administrative, and locational features.
This gap is particularly relevant given the increasing availability of high-resolution data from digital monitoring systems and the growing pressure on infrastructure managers to allocate resources efficiently. Addressing this gap through data-driven, interpretable hourly prediction models offers both theoretical and practical contributions to the field of transport infrastructure planning.

1.3. Research Objectives

This study aims to develop and evaluate predictive models using machine learning of HRAs truck parking occupancy using a dataset collected from a digital monitoring system covering selected motorway facilities in Poland. The research also includes an overview of the multi-faceted importance of rest areas on motorways, supported by empirical research and international standards. On this basis it will be possible to determine the extent to which infrastructural, administrative, and locational features can be used to predict hourly occupancy levels with sufficient accuracy and interpretability.
Eight supervised machine learning algorithms—Gradient Boosting, XGBoost, Random Forest, k-NN, Decision Tree, Logistic Regression, SVM, and Naive Bayes—are implemented and compared in the research. The models are evaluated based on their hourly predictive performance as well as their ability to highlight key variables affecting occupancy patterns. This selection was made to cover a broad range of model families and complexities in compliance with best practices in machine learning methodology. Two simpler models from the linear and non-linear families are logistic regression and decision trees, respectively. Random Forest and Gradient Boosting are examples of ensemble techniques that typically provide increased accuracy through variance and bias reduction, whereas XGBoost is a complex gradient boosting implementation known for its regularization capabilities and strong empirical performance. Despite this strong assumption, it offers fast performance and can yield robust results in problems with categorical features. The addition of eight models allowed for a more complete and in-depth assessment of how well different modeling approaches performed on the given dataset. This approach also supports the generally recognized practice of starting with simpler models to guarantee a fair and systematic comparison across model types. Particular emphasis is placed on model explainability, with the goal of identifying which features (e.g., number of parking spaces, proximity to urban areas, presence of services) most strongly influence utilization levels.
By achieving these objectives, the study seeks to contribute to the development of data-driven approaches for transport infrastructure management. The findings are expected to support more informed decision-making in the design, upgrading, and spatial allocation of HRAs, ultimately contributing to safer and more efficient road transport systems.

1.4. Manuscript Structure

The remainder of this manuscript is organized as follows: Section 1 presents the introduction, outlining the background and motivation for the study, followed by a review of the relevant literature. It identifies existing research gaps and defines the main objectives of the study, concluding with a summary of the manuscript structure. Section 2 describes the materials and methods employed in the research. It includes a detailed description of the study area and elaborates on the research methodology, including data collection and machine learning techniques used for parking occupancy prediction. Section 3 presents the results of the study, showcasing the performance of the hourly predictive models and the key findings related to truck parking occupancy patterns. Section 4 provides a discussion of the results, placing them in the context of previous research, interpreting their implications, and highlighting both the strengths and limitations of the approach. Section 5 concludes the manuscript with a summary of the main findings, contributions of the research, and suggestions for future work. This structured approach ensures a clear and logical flow of information from problem definition to practical conclusions.

2. Materials and Methods
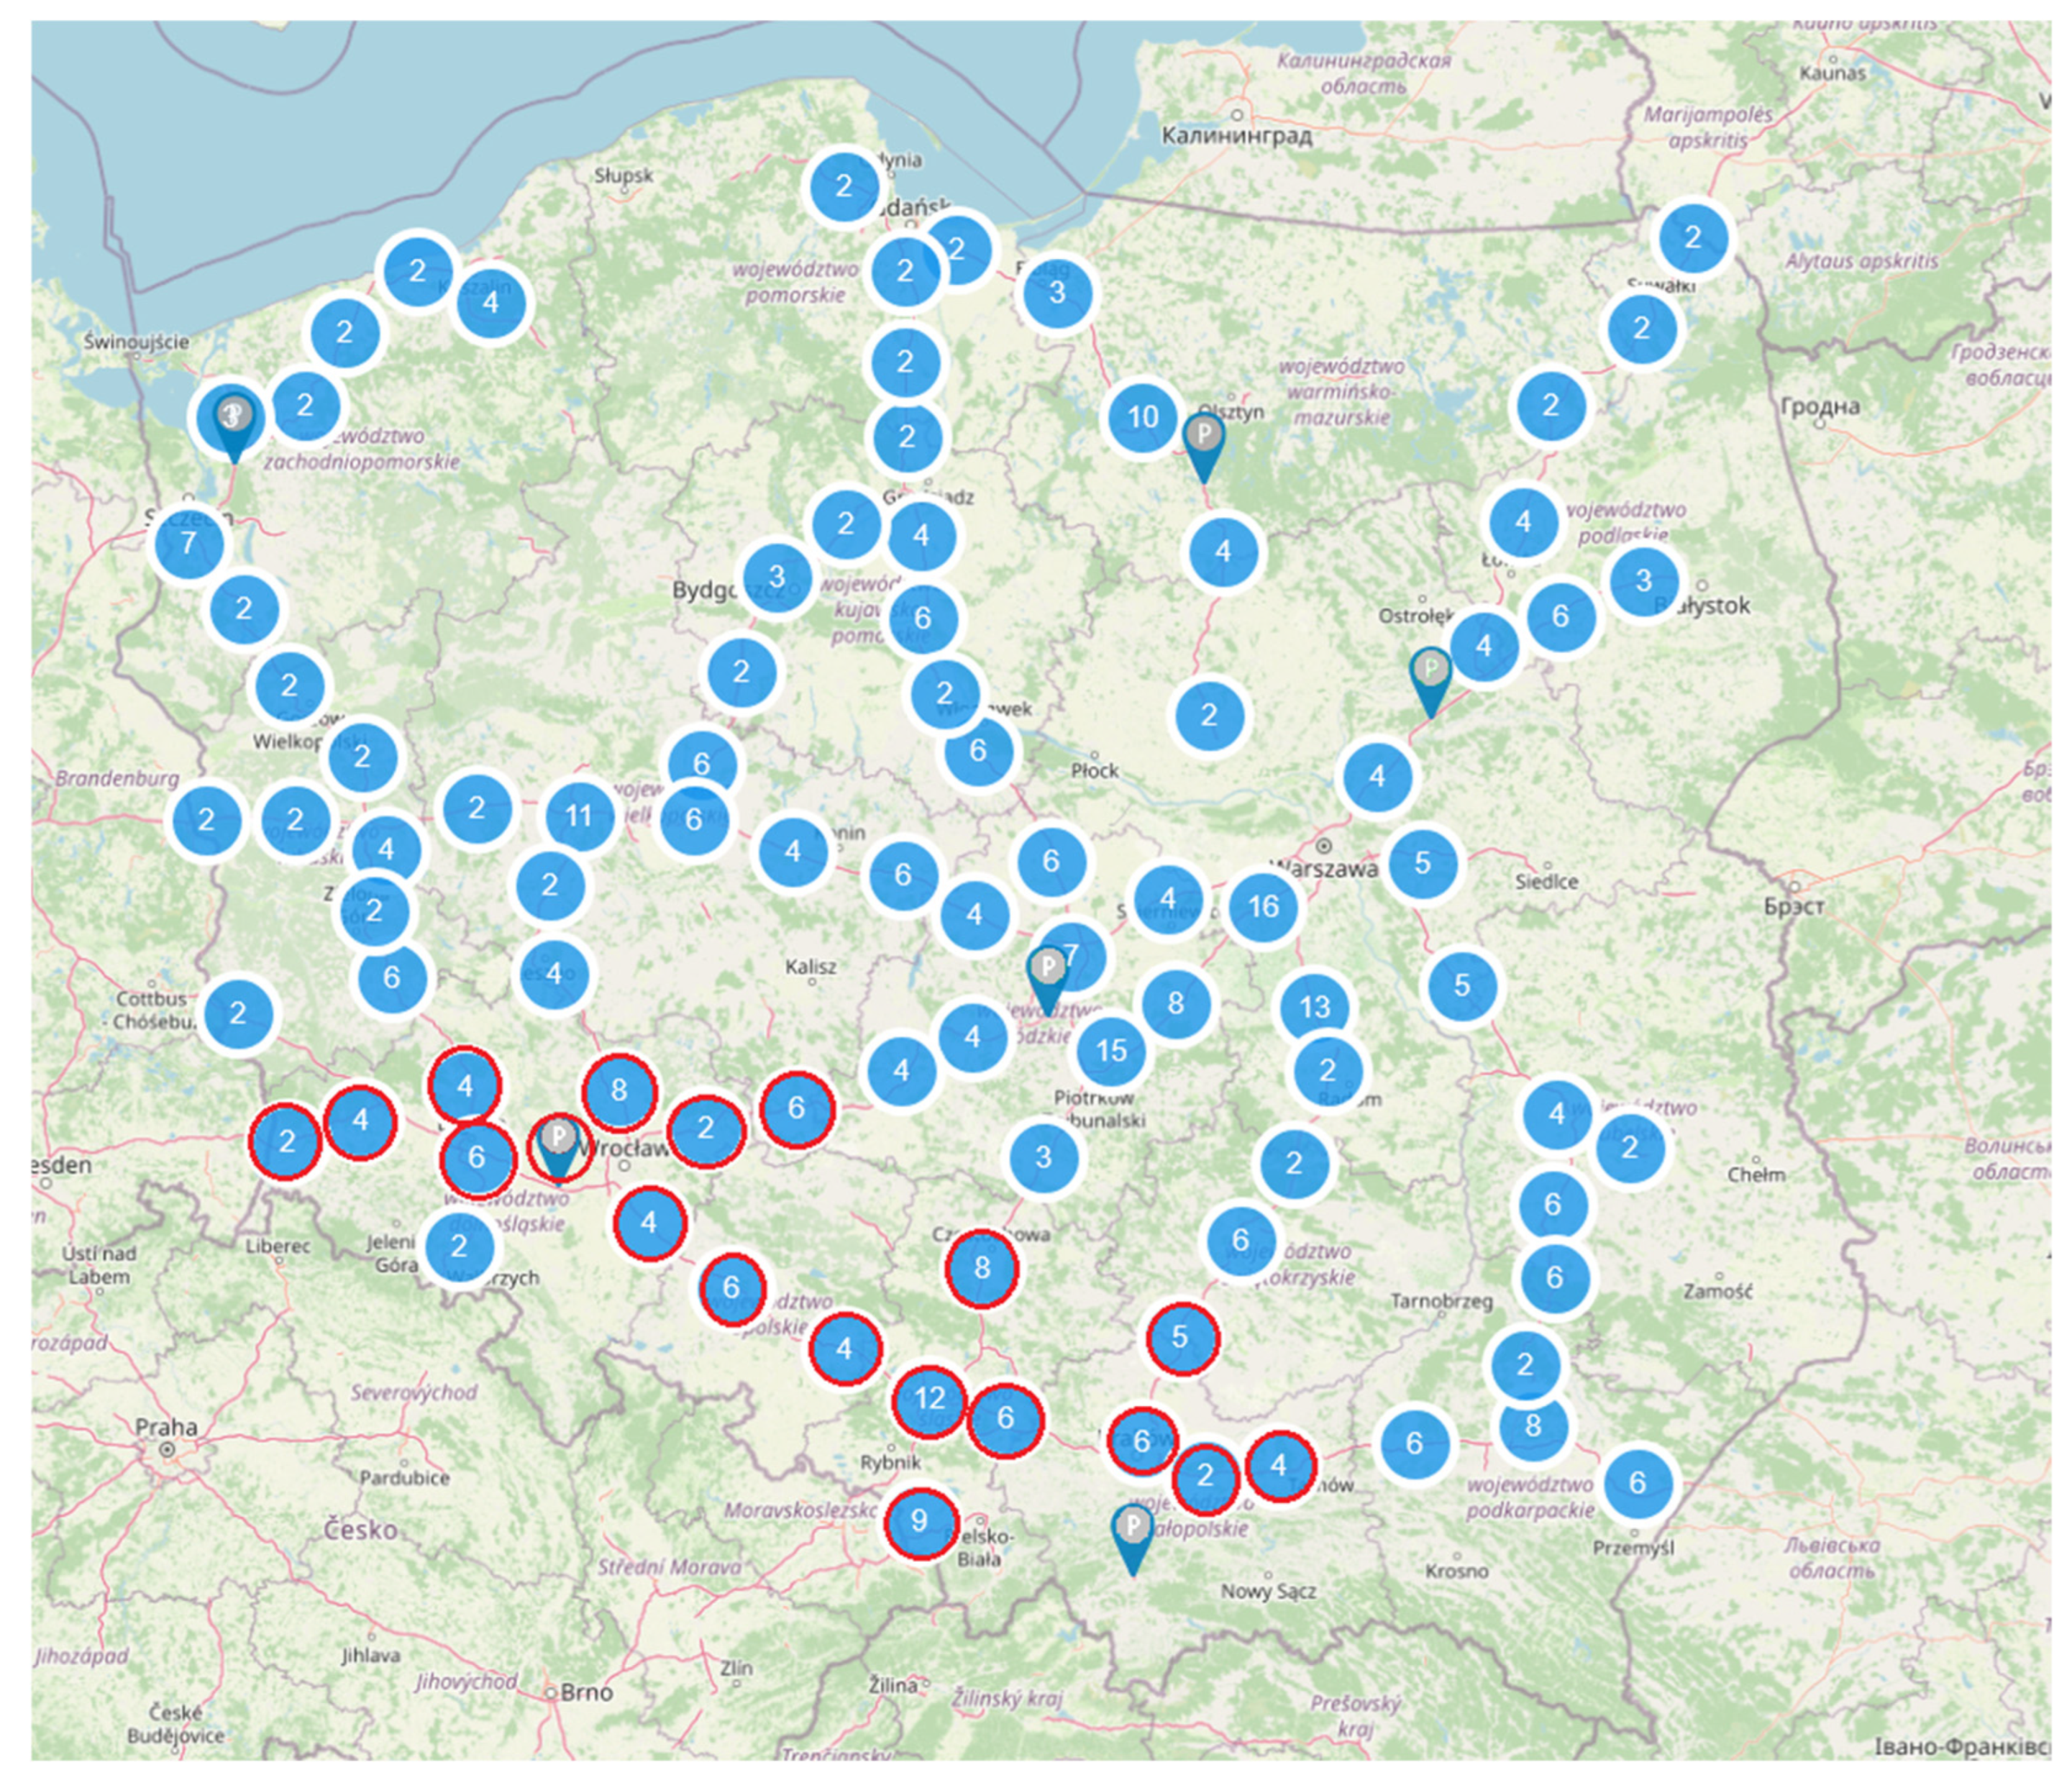
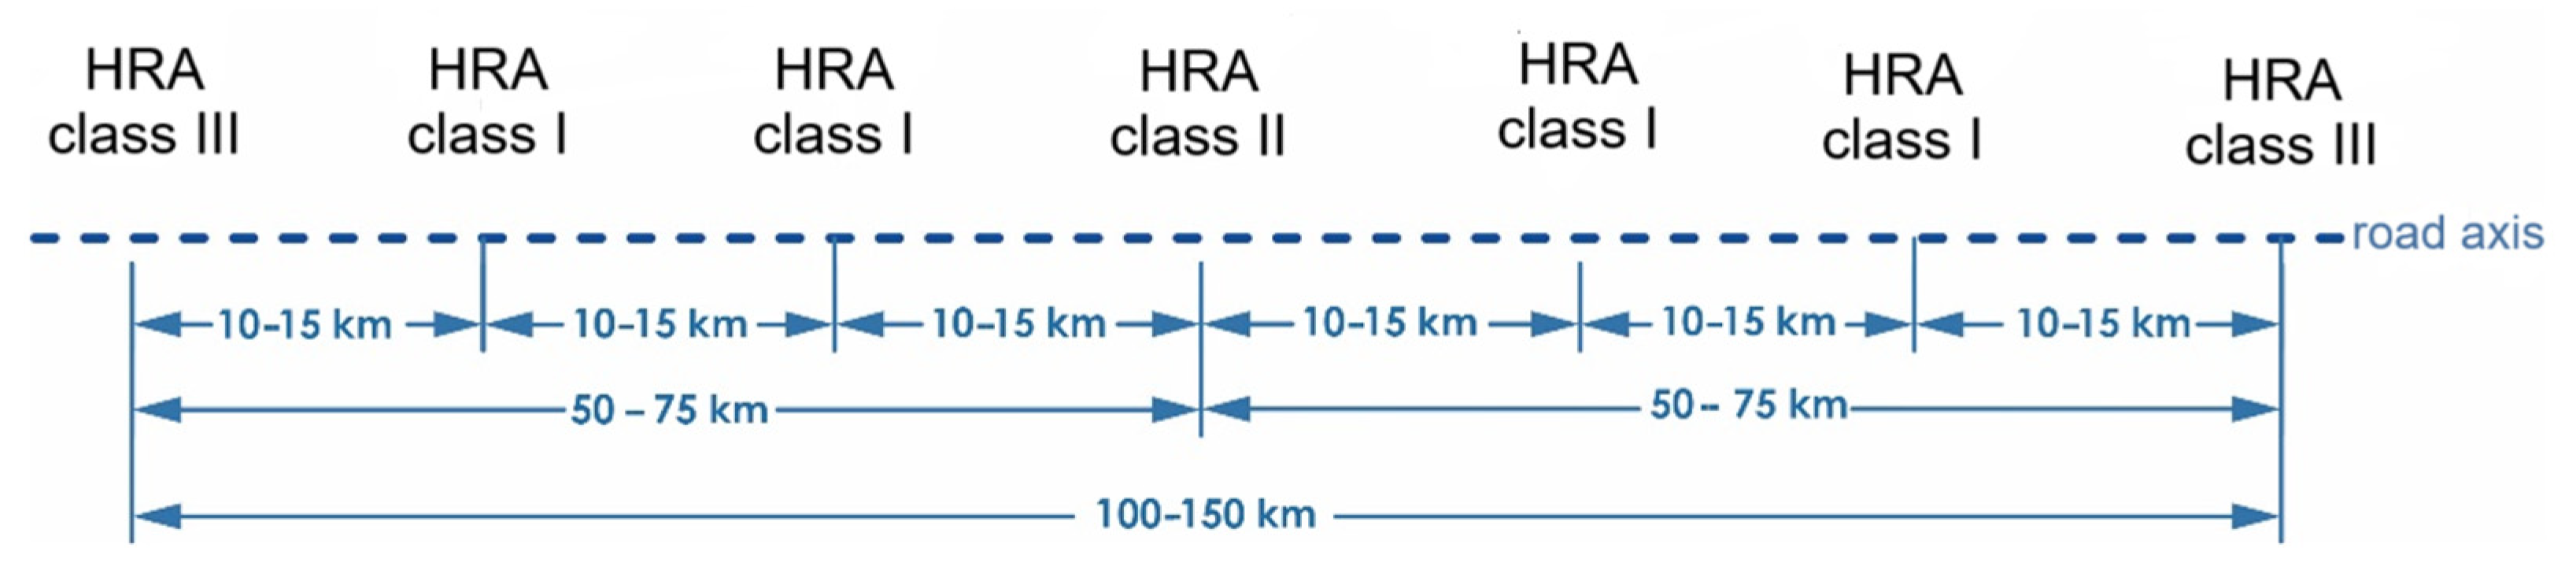
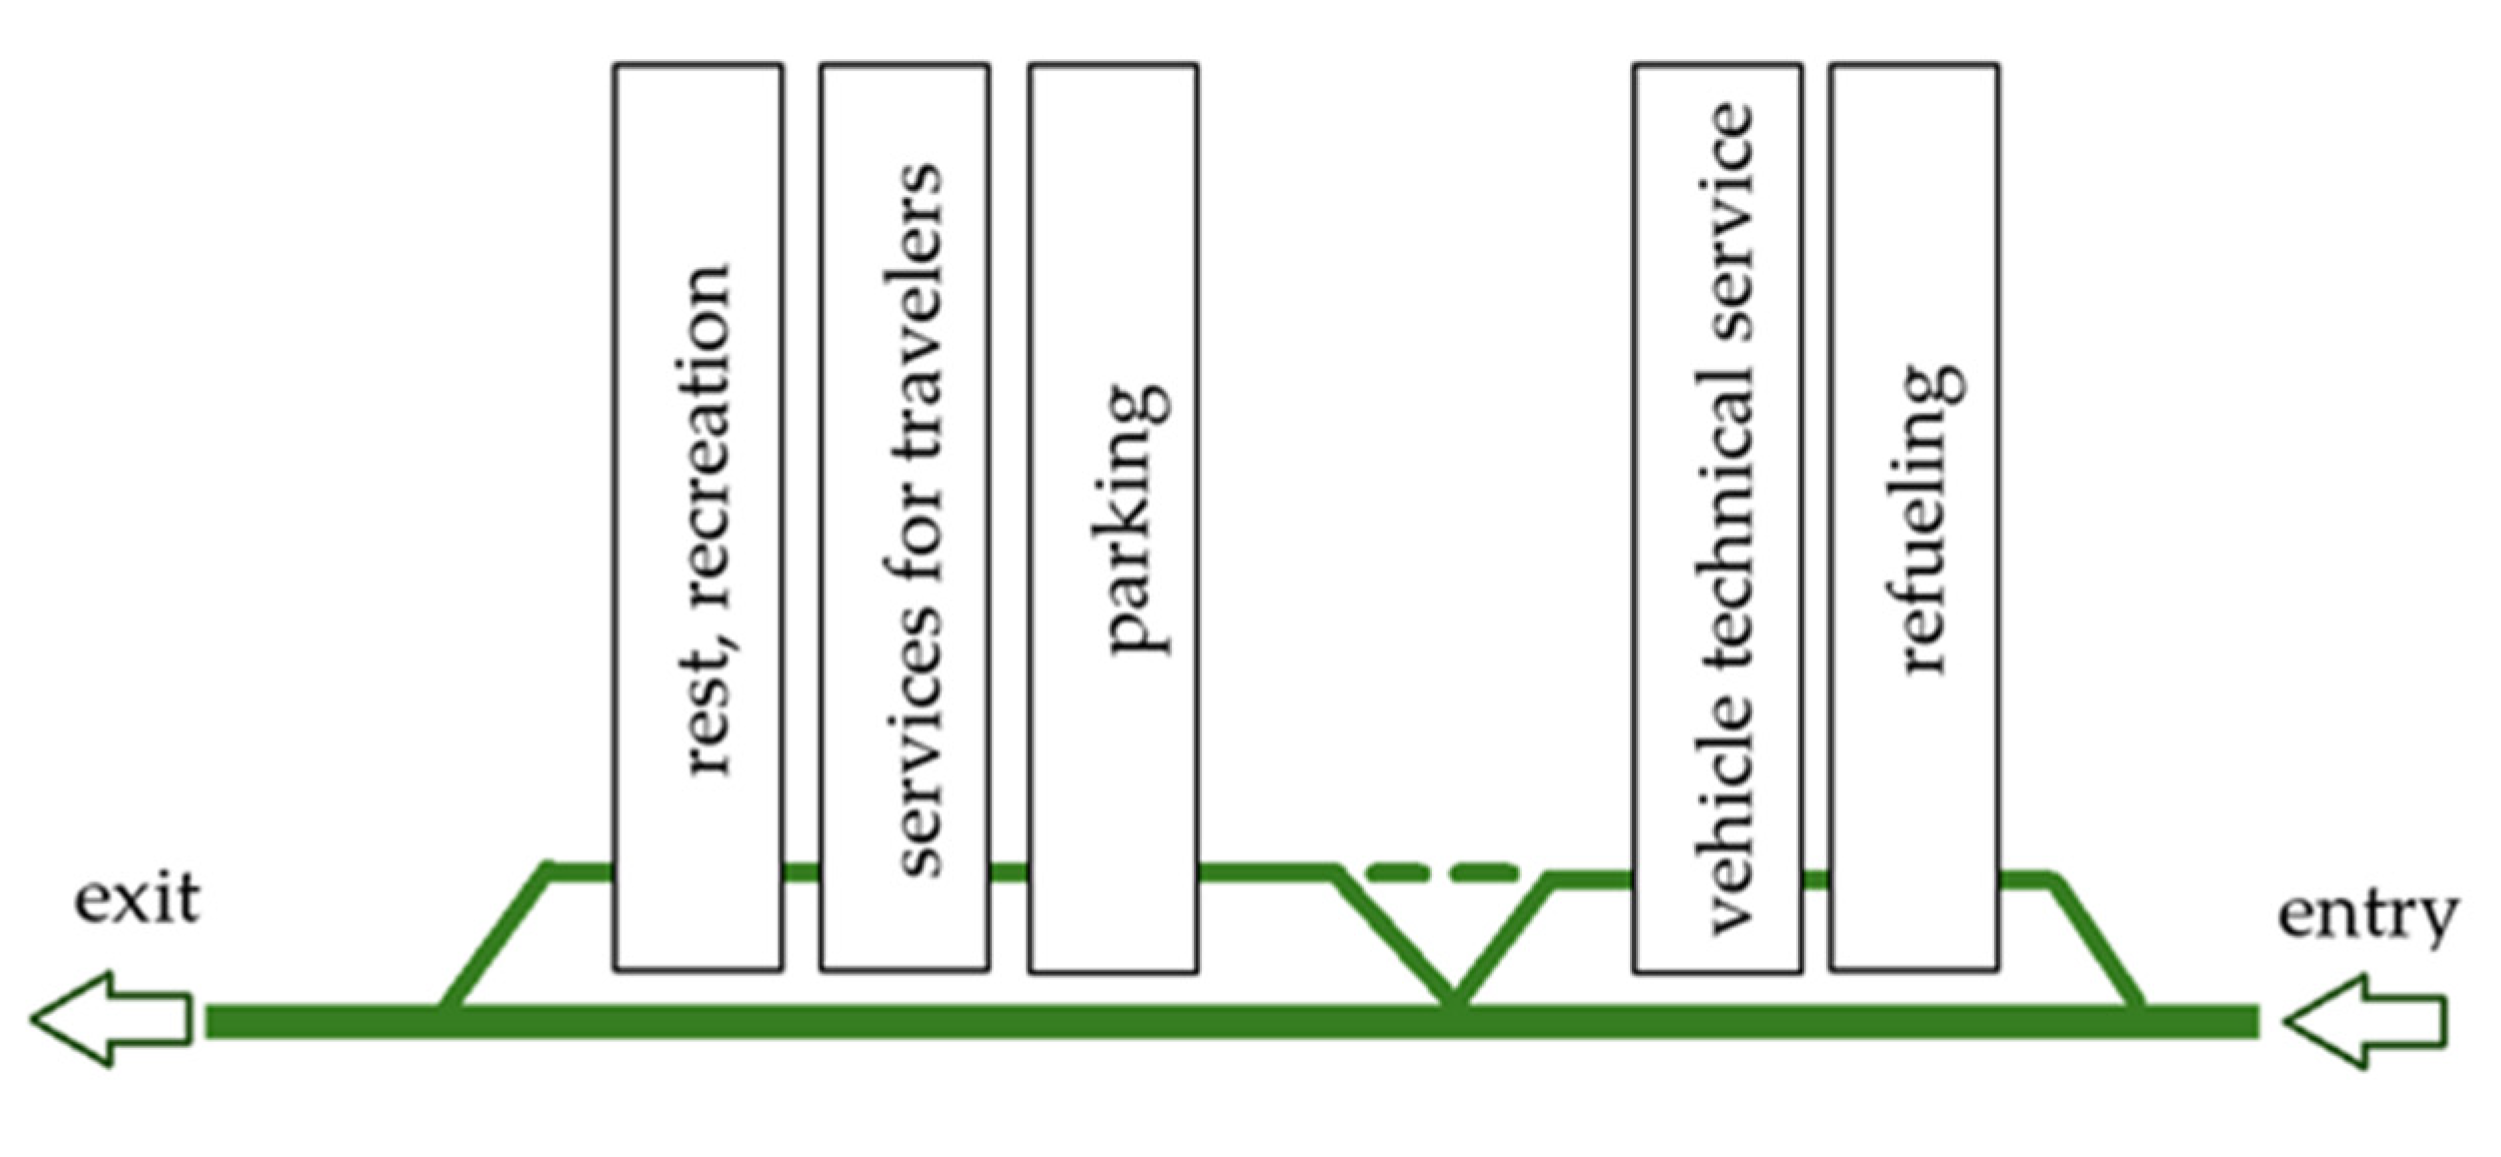
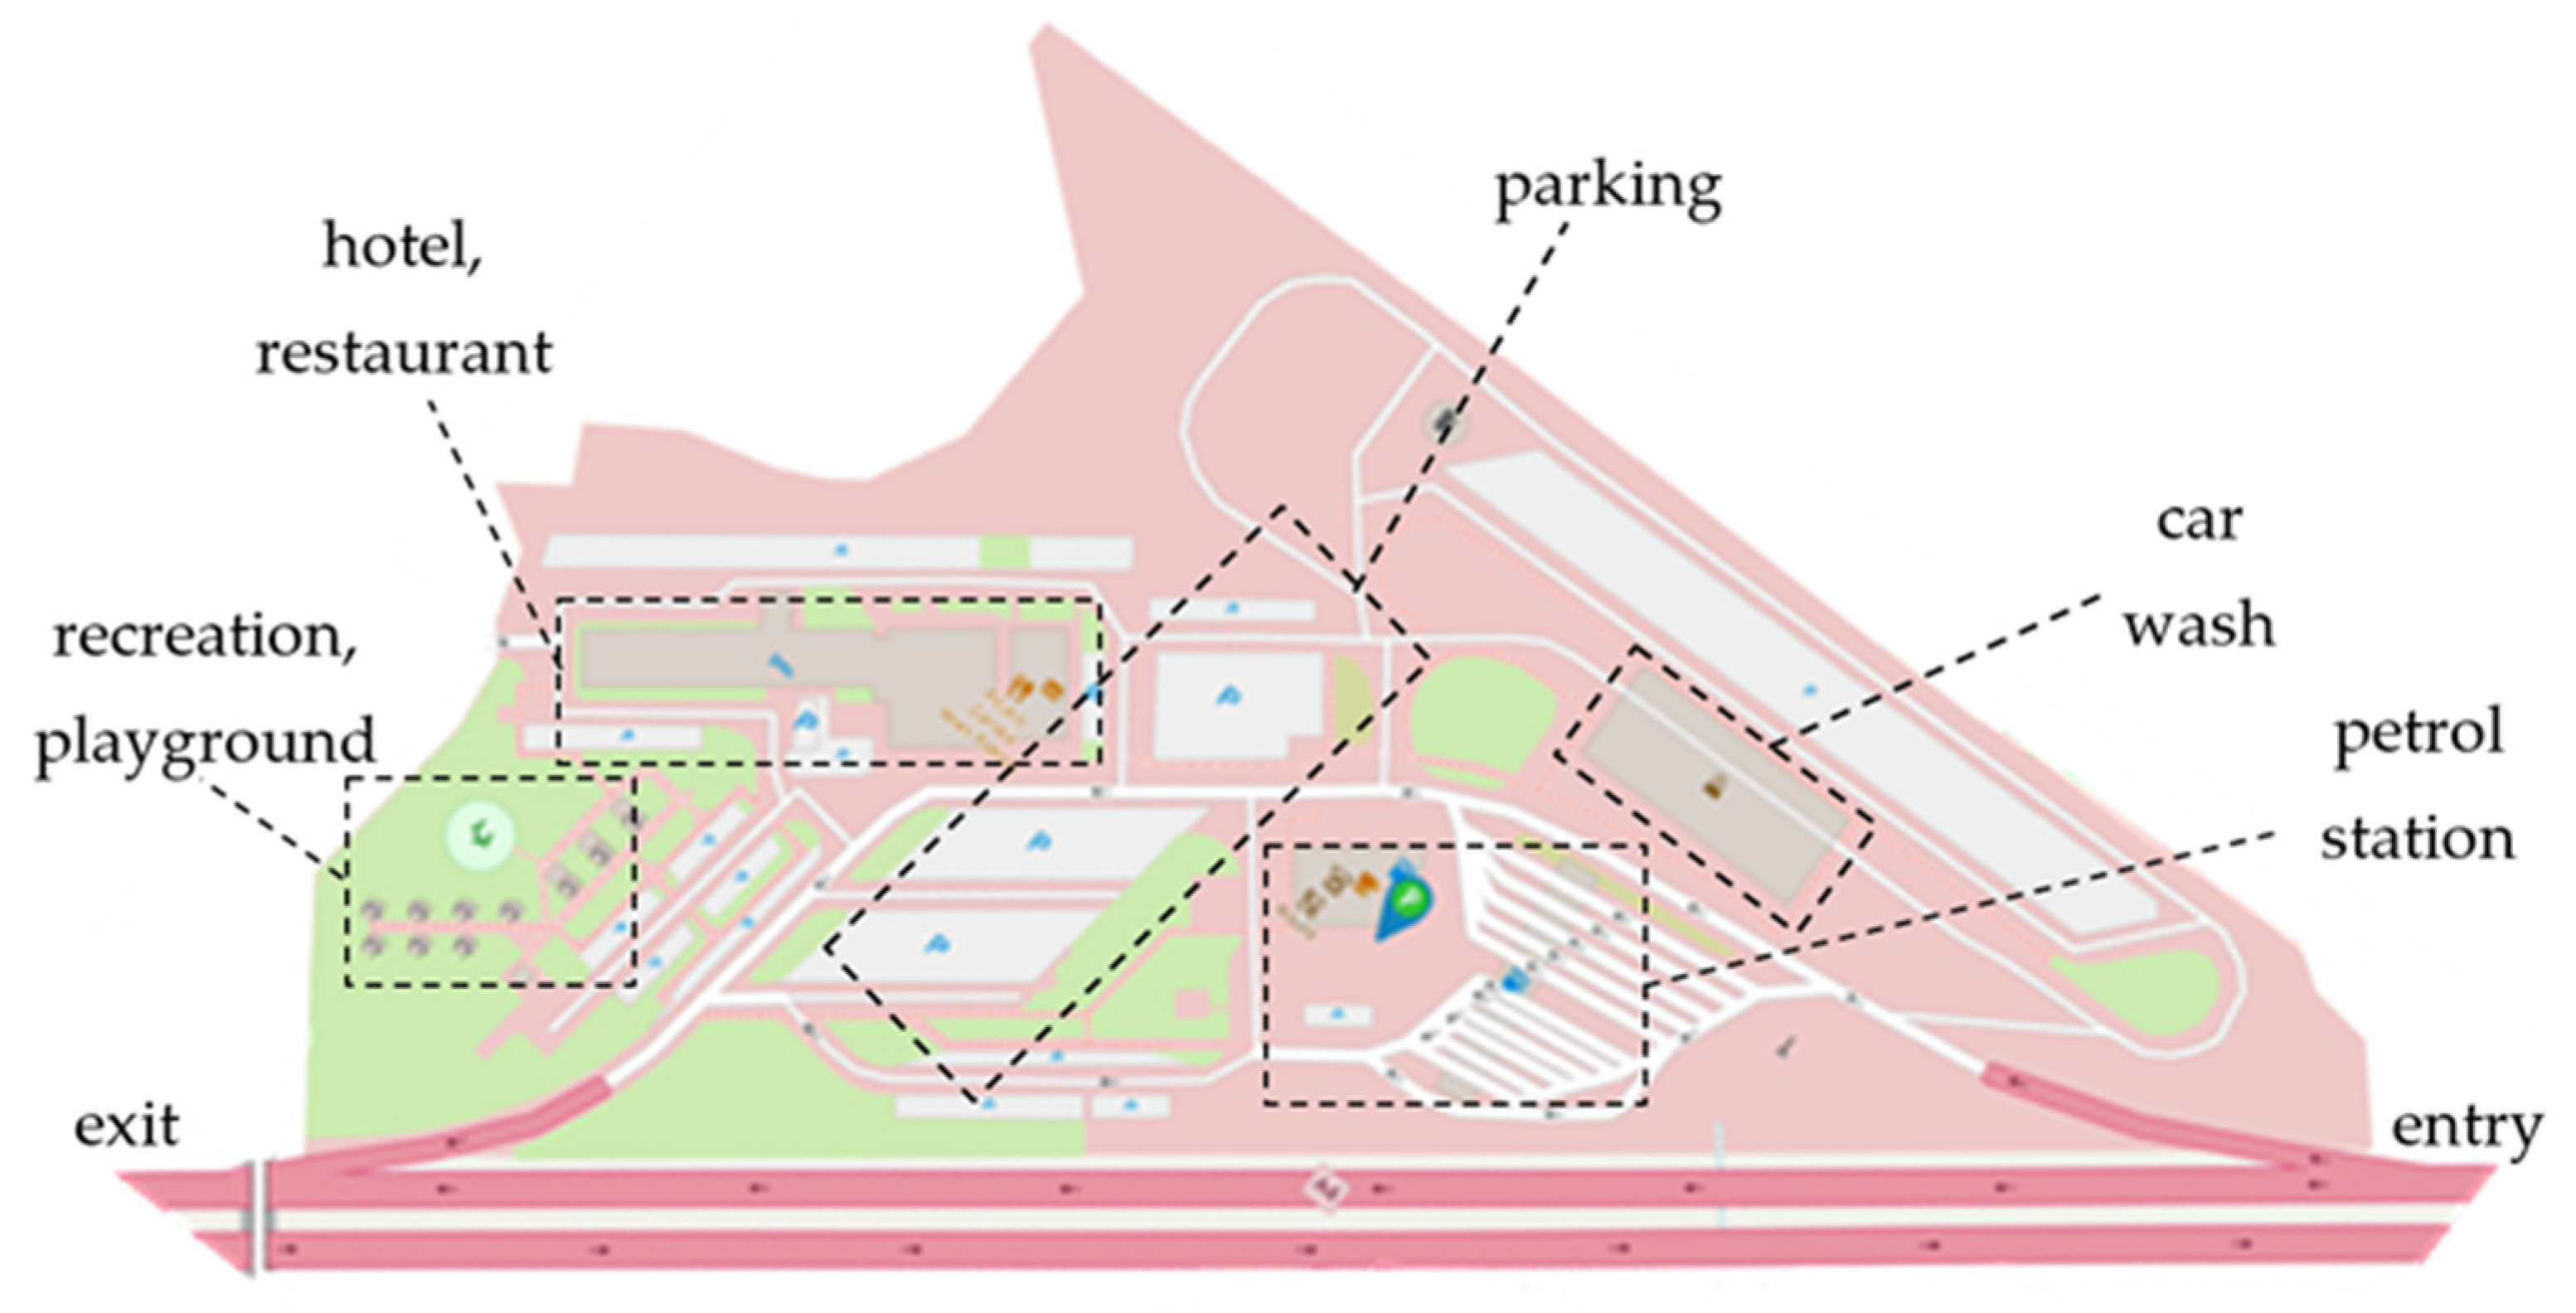
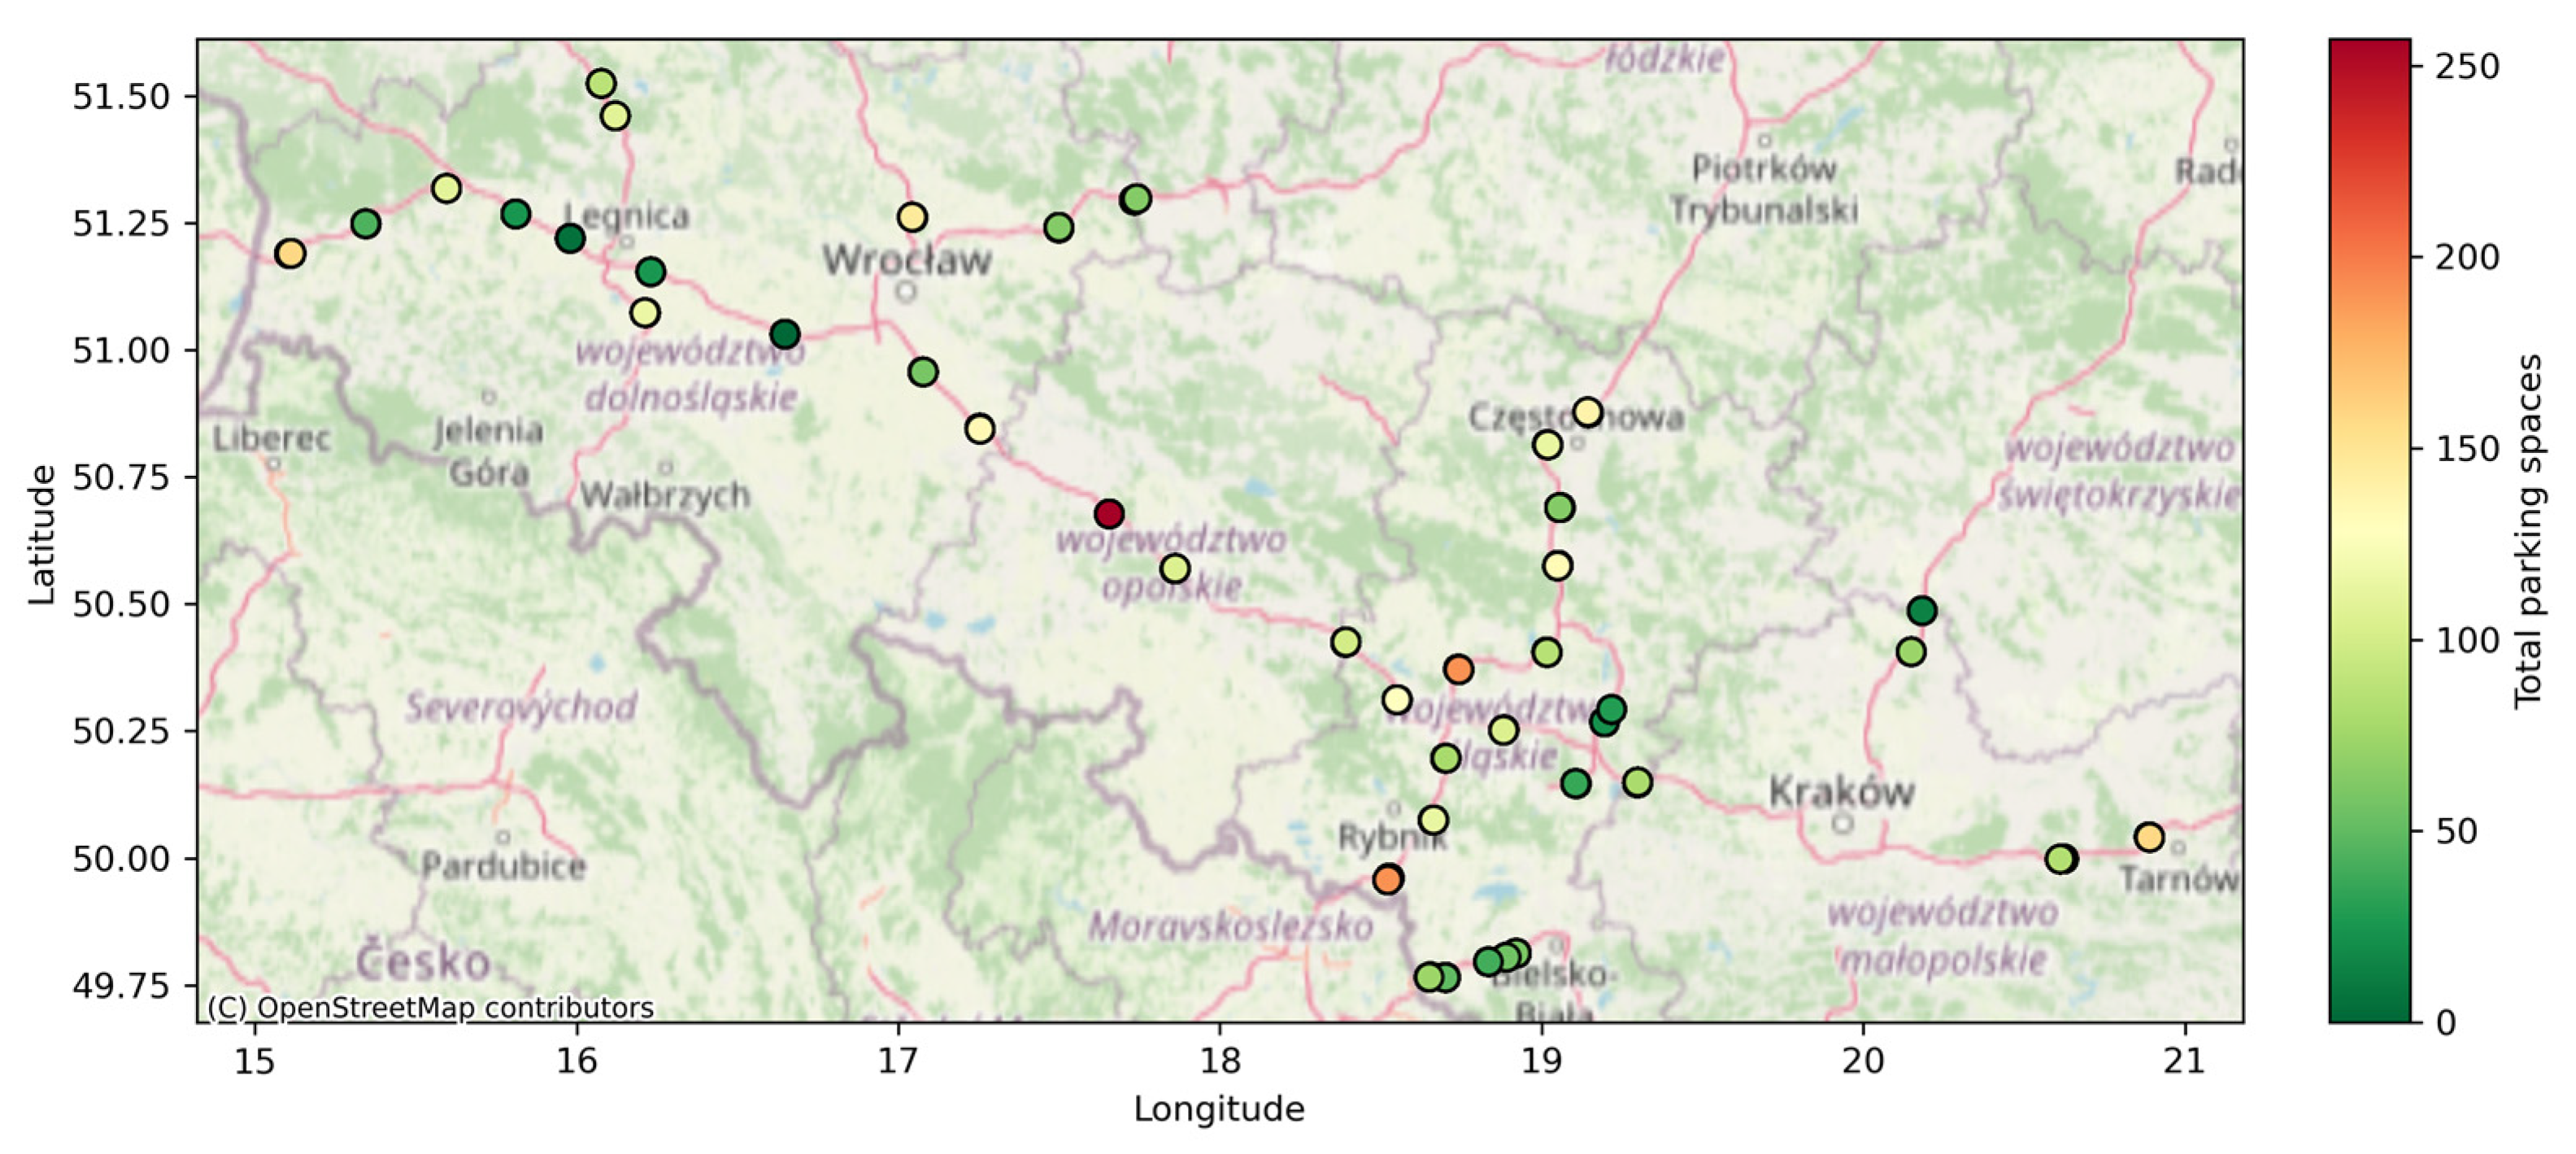
2.1. Research Area

The geographical area of the study covered the southern part of Poland (Figure 1). The analysis area is marked with a red circle; however, not all points visible as numbers in the blue circled locations were taken into account during the research. The analysis covered 69 HRAs located in 39 towns mainly along the A4 motorway section with access expressways in four voivodeships: Lower Silesia (22), Lesser Poland (12), Opole Voivodeship (6), and Silesia (29). The points analyzed included HRAs of classes I, II, and III managed by the Polish General Directorate for National Roads and Motorways, as well as the independent parking lots of companies that provide parking spaces for trucks.
There are over 410 HRAs in Poland, of which the General Directorate for National Roads and Motorways manages 157 points with a basic function and the remaining 112 areas with a commercial function. Polish HRAs are divided into classes of different sizes which is adapted to the average daily traffic in a year. When designing rest stations, they should be built alternately to guarantee passengers the best functionality, taking into account the facilities for each class, presented in Table 1.
Theoretical distances are specified to separate specific categories of HRAs. They should be a minimum of 15 km between adjacent HRAs, between HRA type II and III from 50 to 75 km, and HRA of the same type on the same side of the motorway should be separated by 100–150 km [32], as shown schematically in Figure 2.
For the HRA system to be as functional as possible, the high speed at which drivers travel on the motorway must also be taken into account. It is therefore necessary to enable them to safely break the vehicle and smoothly join the traffic when returning to the motorway. This is possible thanks to the use of an extended communication system. This type of system also allows drivers traveling on the motorway to notice the place more easily. The recommended scheme for shaping the HRA surface, taking into account the main functions of the facilities, is shown in Figure 3.
Spatial development plan of an exemplary Polish HRA (Żarska Wieś) including the layout of individual facilities is shown in Figure 4.
When analyzing the future route of the road and the location of HRAs by category in Poland, not only the requirements resulting from the regulations are taken into account, but also terrain conditions, traffic forecasts, the location of other places on the network or the distance from agglomerations or state borders. The location of HRAs together with the proposed route of the road are subject to public consultations.

2.2. Research Methodology

The first stage of the research was the analysis of 69 HRAs selected in the previous stage in terms of their type and services offered. Similarly, to the General Directorate for National Roads and Motorways, an analysis of existing 33 features describing infrastructural, administrative, and locational characteristics was made for each HRA. The features included: name, branch, voivodeship, manager type, location, category, geographical coordinates of road technical class and number, number of parking lots for cars, trucks, and buses, toilets, fuel station, food service point, accommodation, electric vehicle charging stations, hydrogen, CNG and LNG refueling stations, security, fence, video monitoring, lighting, wash, vehicle repair workshop, liquid waste discharge points, shower, and snow removal ramps.
In this study, data originating from a dedicated application that monitors highway rest area occupancy were used to create a single, standardized dataset. The selection of an application for tracking parking occupancy was preceded by interviews with truck drivers and a ranking of similar mobile applications in GooglePlay. The LKW.APP mobile application (version 1.19.12) was designed in 2022 by Aparkado UG company (Köln, Niemcy, Germany) to facilitate the work of drivers, to reduce their stress level, but also to reduce the cost of transport when planning a stopover and searching for a free space at a truck parking lot. The app allows you to check the availability of truck parking lots across 40 thousand European parking lots for free, using color coding, allowing you to plan the route in real time and up to 15 h in advance. In addition, it allows you to find a parking lot for trucks with special services, adapting the route to specific vehicle parameters (e.g., avoiding narrow roads). The LKW.APP application, available in 16 languages, is quite popular, with over 100 thousand downloads, users in 44 countries and a rating of 4.8 on Google Play. The dataset of 10,740 observations for the research comprised multiple worksheets, each capturing HRAs truck parking hourly occupancy information for random days of the week in 69 rest areas at the beginning of the year 2025. Less than 0.1% of missing data concerning characteristics was completed manually by the General Directorate for National Roads and Motorways. Data concerning occupancy was always complete. The problem of missing data was as not significant as in other projects due to the independent preparation of the dataset. After discarding any worksheets designated as templates, columns encoding the hourly measurements were distinguished from those containing metadata. The resulting data were transformed from a wide format—where each rest area was represented by multiple hour-specific columns—into a long format, wherein each row corresponded to a distinct rest area–hour pair. Invalid or missing entries were removed, and all columns were merged so that no features were lost, with unavailable fields marked as empty. Additionally, the original occupancy markers “L”, “M”, and “F” were standardized to three English descriptors—“low,” “moderate,” and “full”—mapping “L” to “low,” “M” to “moderate,” and “F” to “full”. LKW.APP informs truck drivers in real time of the availability of parking at different truck stops or parking facilities using a straightforward, color-coded or label-based system. A detailed explanation of the three occupancy categories, the exact thresholds of which may vary depending on the operator or location, is provided in Table 2. These categories are dynamic and may update in near real-time based on sensor data, user reports, or app integration with parking systems.
The dataset was further examined using basic descriptive statistics to provide an initial overview of variable distributions and frequencies. This was achieved with the describe() function from the pandas library, which provides summary measures tailored to the type of data being analyzed [33]. For numerical variables, the output includes the count of non-null values, mean, standard deviation, minimum, maximum, and quartile values (25%, 50%, and 75%), allowing for the identification of central tendency and variability [34]. In the case of categorical variables, the summary returns the number of valid entries, the number of unique categories, the most frequent category (mode), and its frequency, which is useful for detecting dominant labels and structural imbalance [35]. These descriptive outputs serve as a foundation for exploratory data analysis and guide further statistical modeling.
Python is increasingly regarded as a leading programming language for data analysis and scientific computing due to its readability, versatility, and wide array of specialized libraries [36]. In this study, Python (version 3.13) was used as the primary platform for the entire analytical workflow, encompassing data cleaning, transformation, visualization, and hourly predictive modeling. Key packages included pandas [37] for data manipulation, matplotlib [38] for visual representation, and scikit-learn [39] for implementing standard machine learning models. Additionally, xgboost [40] was employed for building high-performance gradient-boosted classifiers. The modularity of the Python environment and the interactivity of Jupyter Notebooks [41] enabled transparent and reproducible experimentation, making it especially suitable for research applications involving transportation data [42].
To predict HRAs truck parking occupancy levels, eight supervised classification algorithms were implemented using Python’s machine learning ecosystem. The models included: Gradient Boosting, XGBoost, Random Forest, k-NN, Decision Tree, Logistic Regression, SVM, and Naive Bayes classifiers. Decision Trees serve as a fundamental approach that recursively split data based on feature thresholds to minimize impurity in child nodes [43]. Random Forest expands on this concept by aggregating the predictions of multiple randomized trees to improve generalization and reduce overfitting [44]. Gradient Boosting constructs an ensemble in a sequential manner, where each tree is trained to correct the residual errors of its predecessor, often resulting in high predictive performance [45]. Logistic Regression, despite its simplicity, is a robust linear model commonly used in classification tasks [46]. XGBoost model is an advanced boosting technique known for its computational efficiency and regularization features, making it particularly effective for tabular data. K-Nearest Neighbors (k-NN) [28] is a simple, instance-based learner that classifies observations based on proximity to labeled training examples in the feature space. It is non-parametric and useful for capturing local patterns in well-clustered datasets. Support Vector Machine (SVM) [29] is a margin-based classifier effective in high-dimensional settings, particularly suited for finding optimal decision boundaries, although it may require careful parameter tuning in imbalanced datasets. Naive Bayes [30] is a probabilistic classifier based on Bayes’ theorem, assuming feature independence. All classifiers were evaluated using a consistent train-test split, with the same preprocessed dataset and encoded categorical variables. The performance of each model was assessed through standard classification metrics, including accuracy, precision, recall, and F1-score. Unless otherwise stated, all models were implemented with default hyperparameter settings provided by the scikit-learn library (version 1.2.2.). For Decision Tree, the maximal tree depth (max_depth) was left unrestricted (None), and for Random Forest, the number of trees (n_estimators) was set to the default value of 100. The k-nearest neighbors classifier used five neighbors, and for the support vector machine, a linear kernel and class balancing were applied. For logistic regression, the maximum number of iterations was increased to 3000 to ensure convergence. These settings are consistent with standard practice and promote the comparability and reproducibility of the results.
To assess the hourly predictive performance of the trained models, a set of widely accepted evaluation metrics for multi-class classification tasks was employed. These included accuracy, precision, recall, and F1-score, all computed using functions available in the scikit-learn environment. Accuracy provided a general measure of correct predictions across all classes, while precision and recall offered a more detailed view of model performance for each occupancy category—particularly important due to class imbalance. The F1-score, being the harmonic mean of precision and recall, served as a balanced metric accounting for both false positives and false negatives, and is especially suitable when the cost of misclassification differs across classes. Such metrics are standard practice in model evaluation for classification problems in transportation research and beyond [47]. For transparency, the results were reported separately for each class (low, medium, high), along with macro and weighted averages. Finally, models were ranked by their accuracy scores and visualized using a comparative bar chart to facilitate direct interpretation and model selection.
Additionally, model interpretability was assessed using two complementary approaches. First, feature importance analysis based on the feature_importances_ attribute of the trained XGBoost model identified variables contributing most to error reduction during boosting; features exceeding a threshold of 0.001 were visualized in a horizontal bar chart.
Second, following [48], SHAP (SHapley Additive exPlanations) values were computed for the XGBoost classifier and visualized using beeswarm plots for each occupancy class. This technique illustrates the magnitude and direction of individual feature contributions to the model’s predictions for low, medium, and high occupancy scenarios, providing actionable insights for infrastructure planning and policy development [49].
Comparative bar charts of weighted and per-class F1-scores were also generated for all classifiers, highlighting model robustness in the presence of class imbalance.
All analytical steps and code implementations are available in a public repository: https://github.com/BudzynskiA/rest-area-occupancy-ml (accessed on 15 April 2025).

3. Results

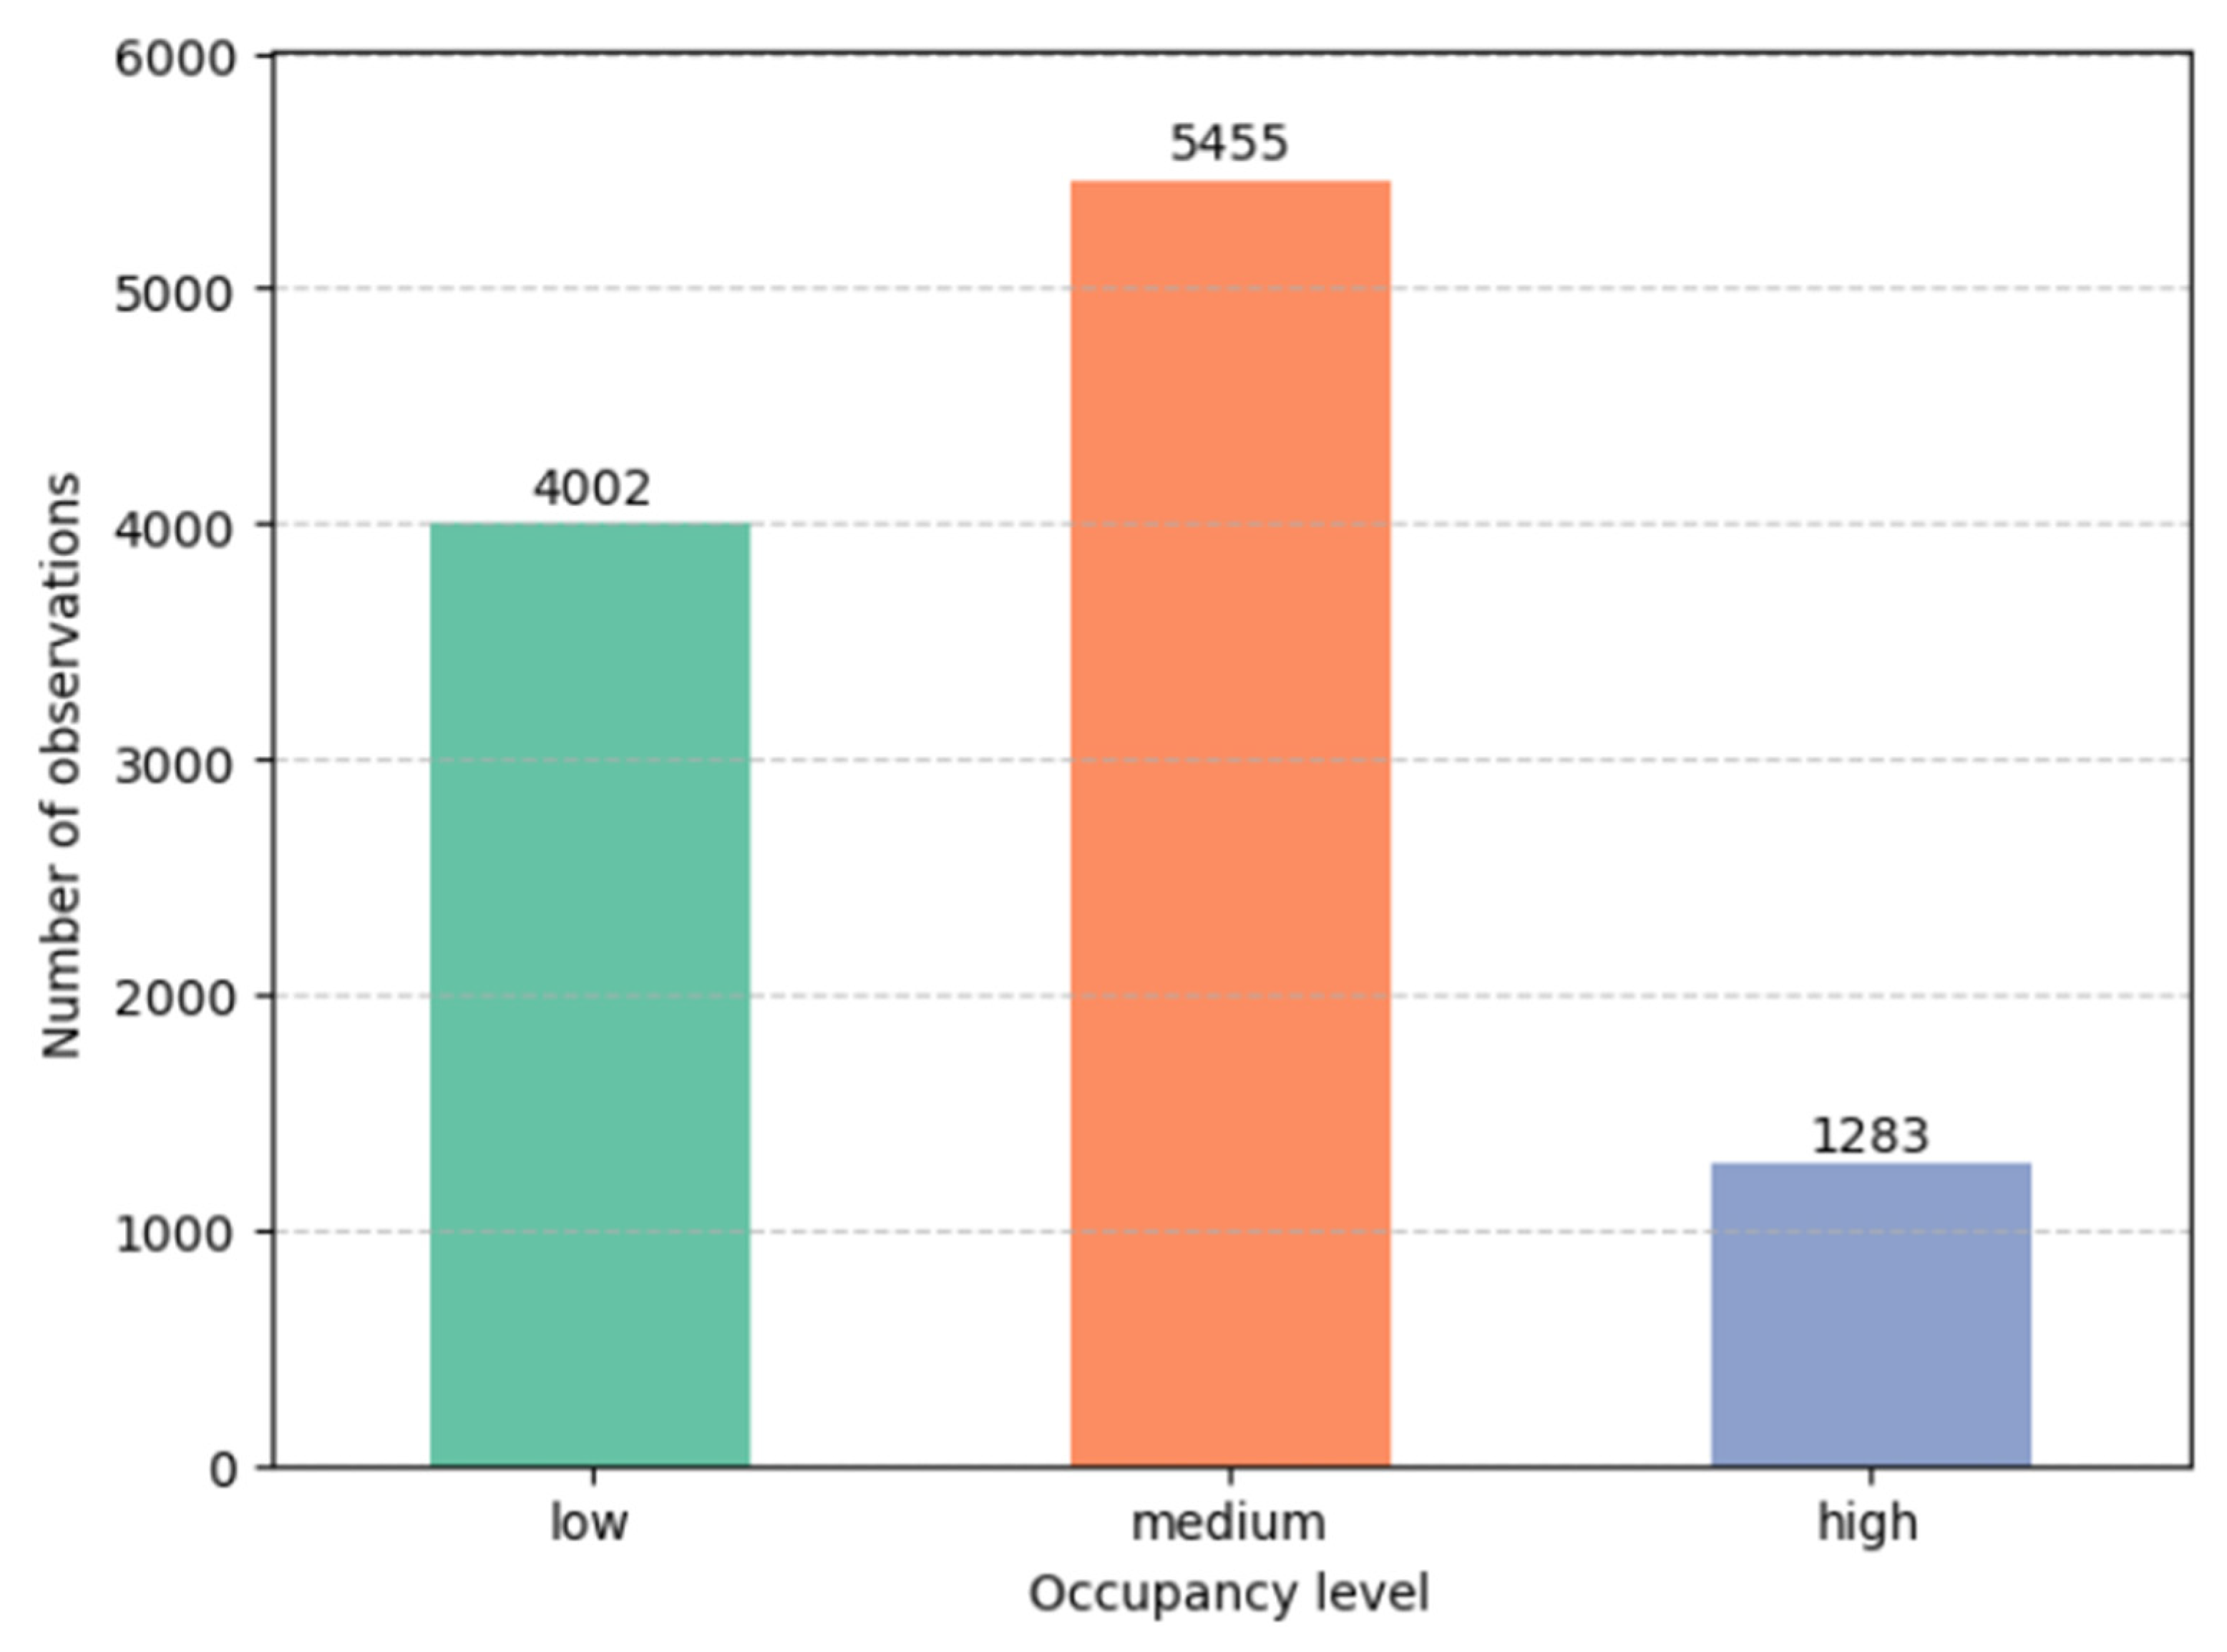
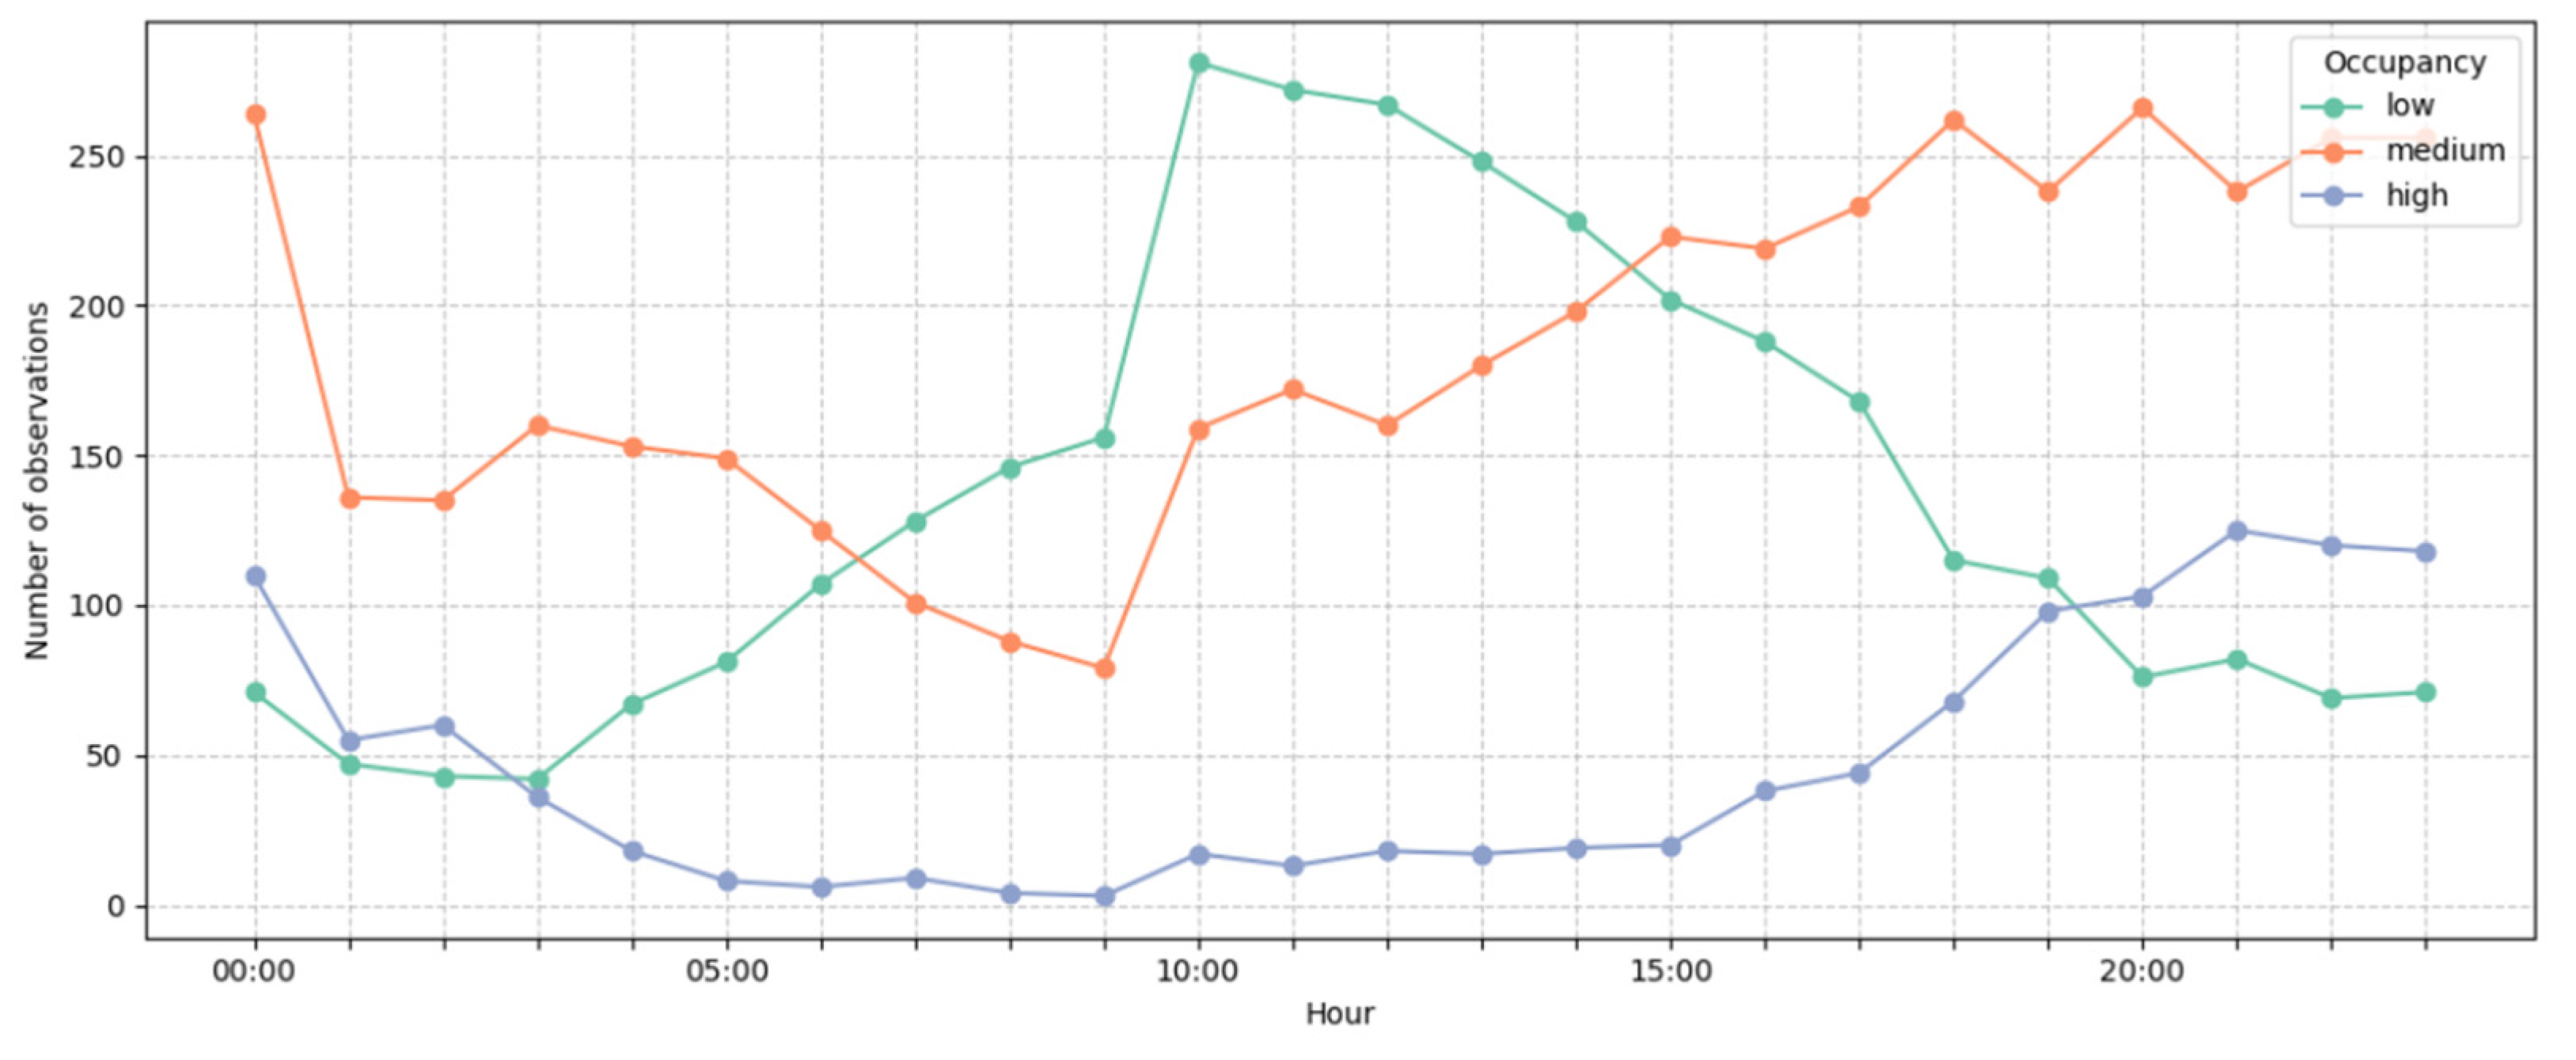
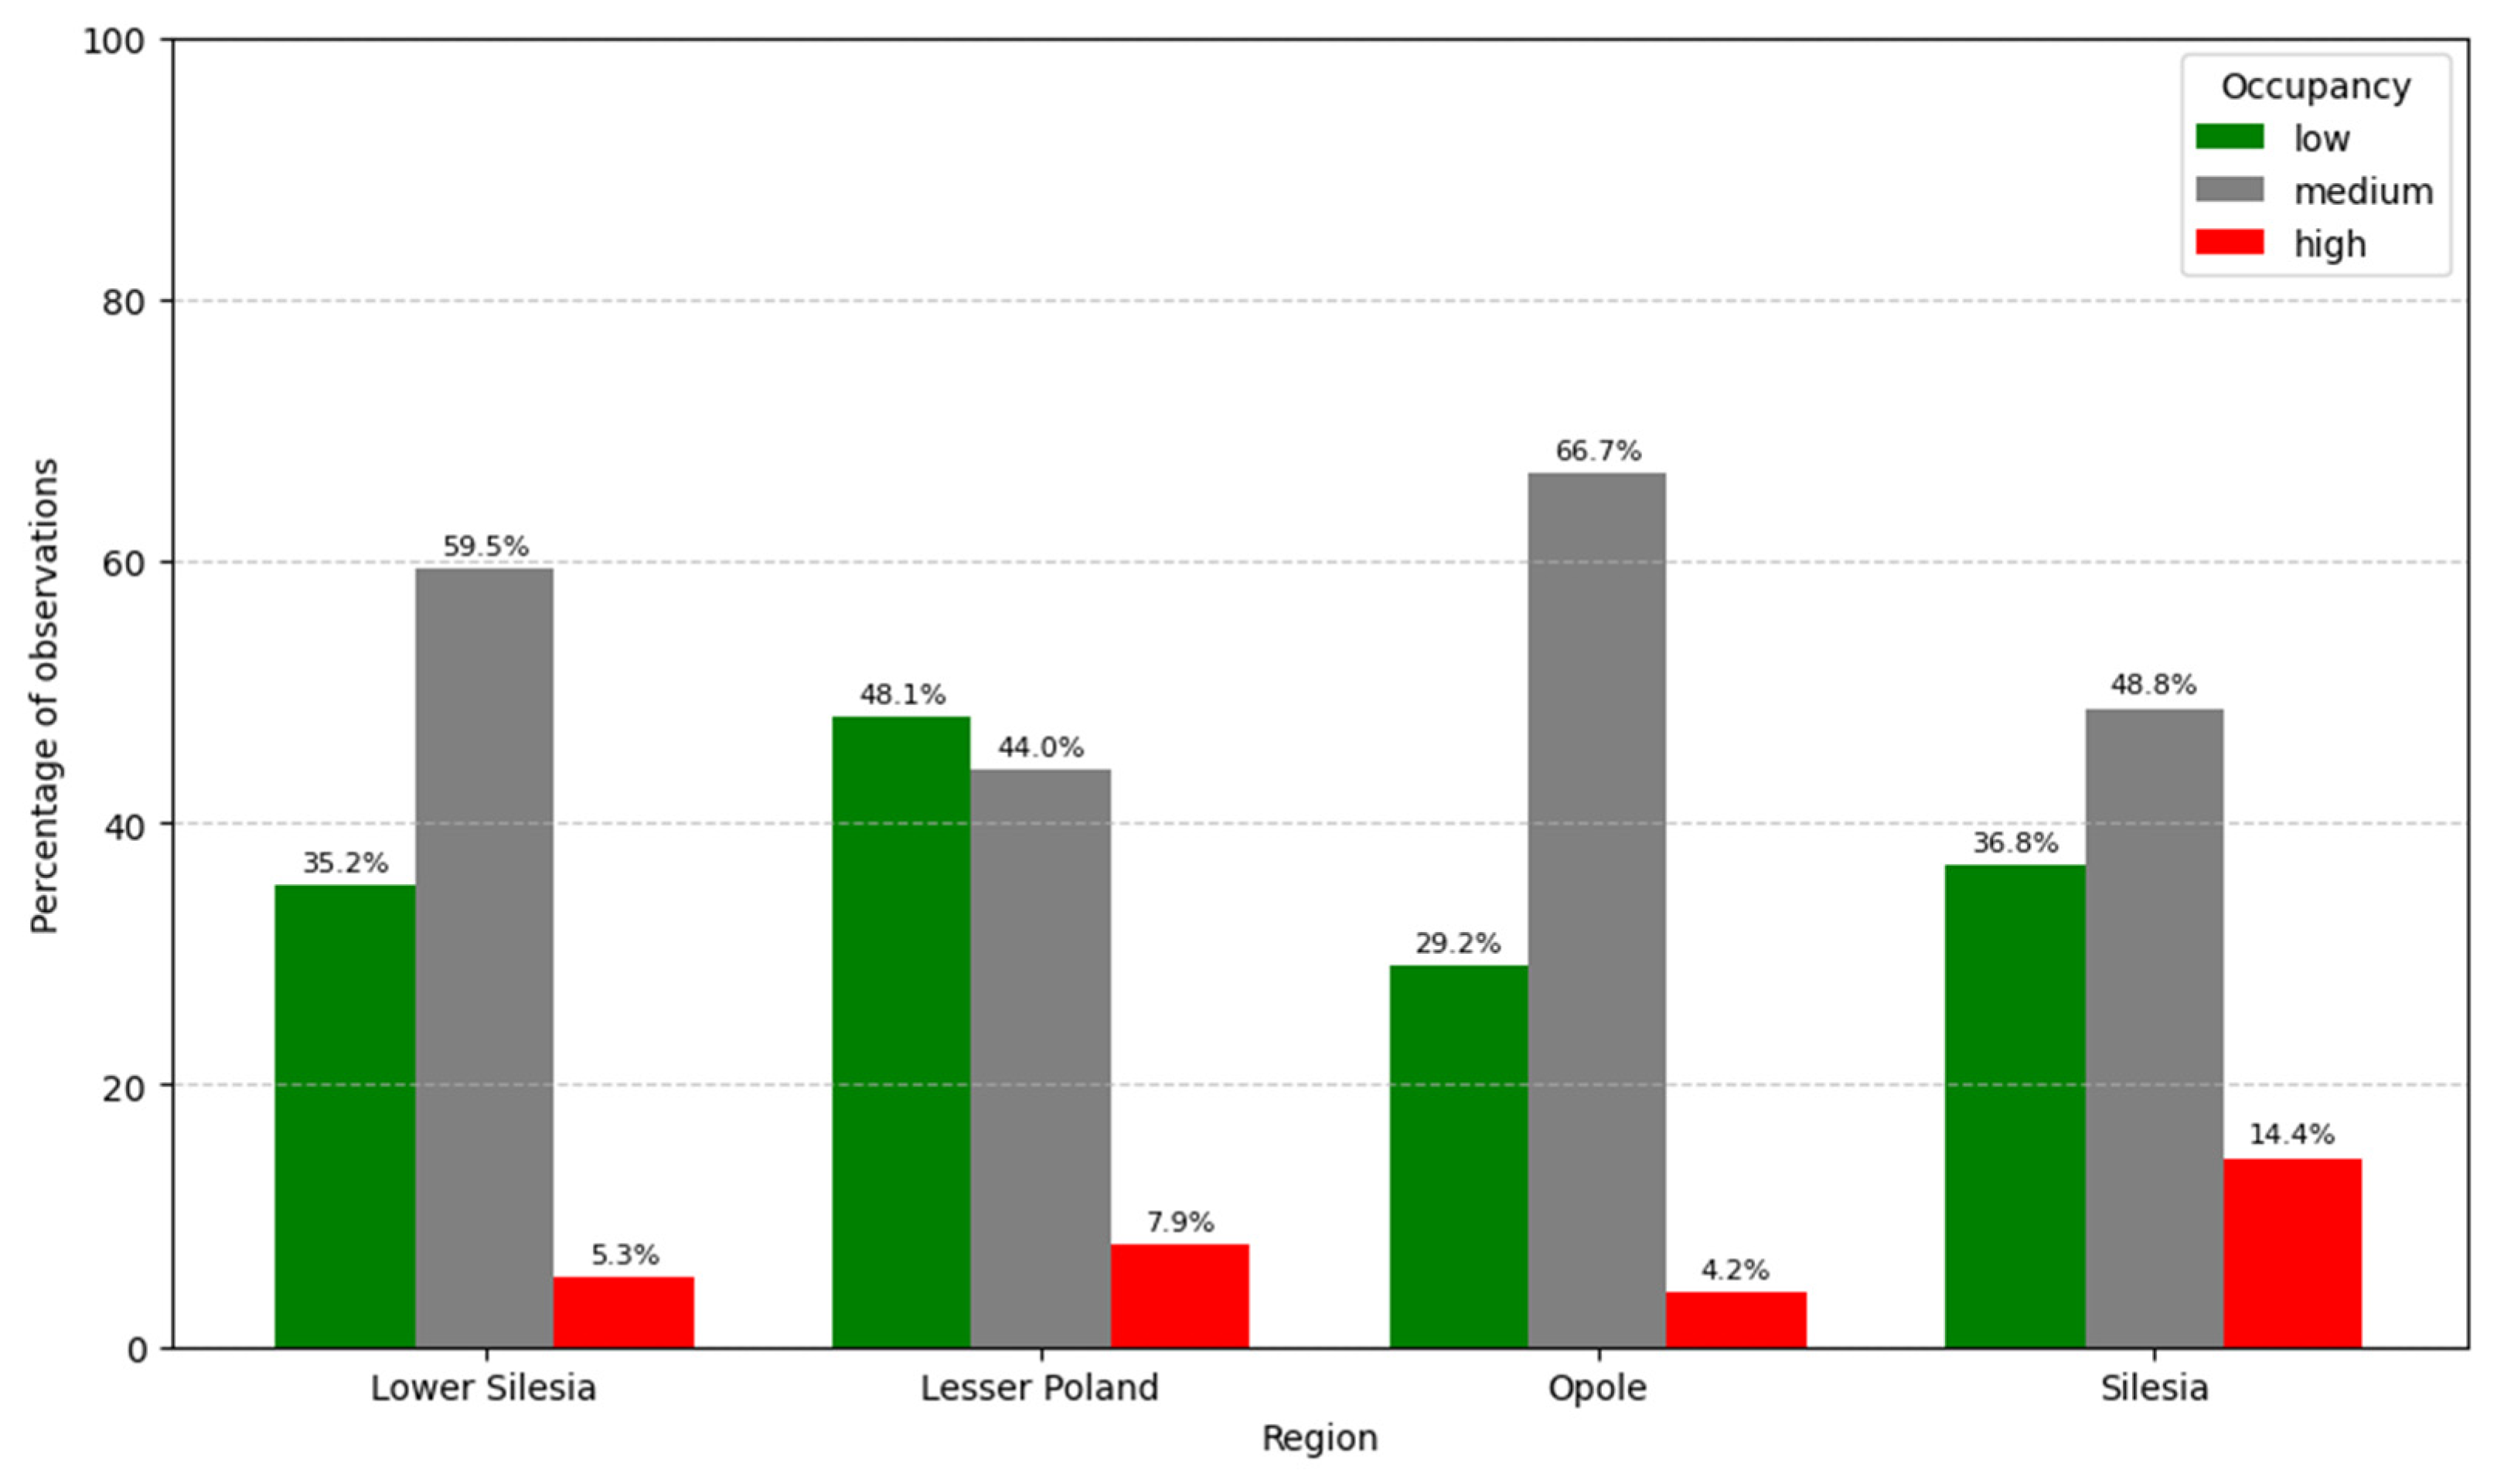
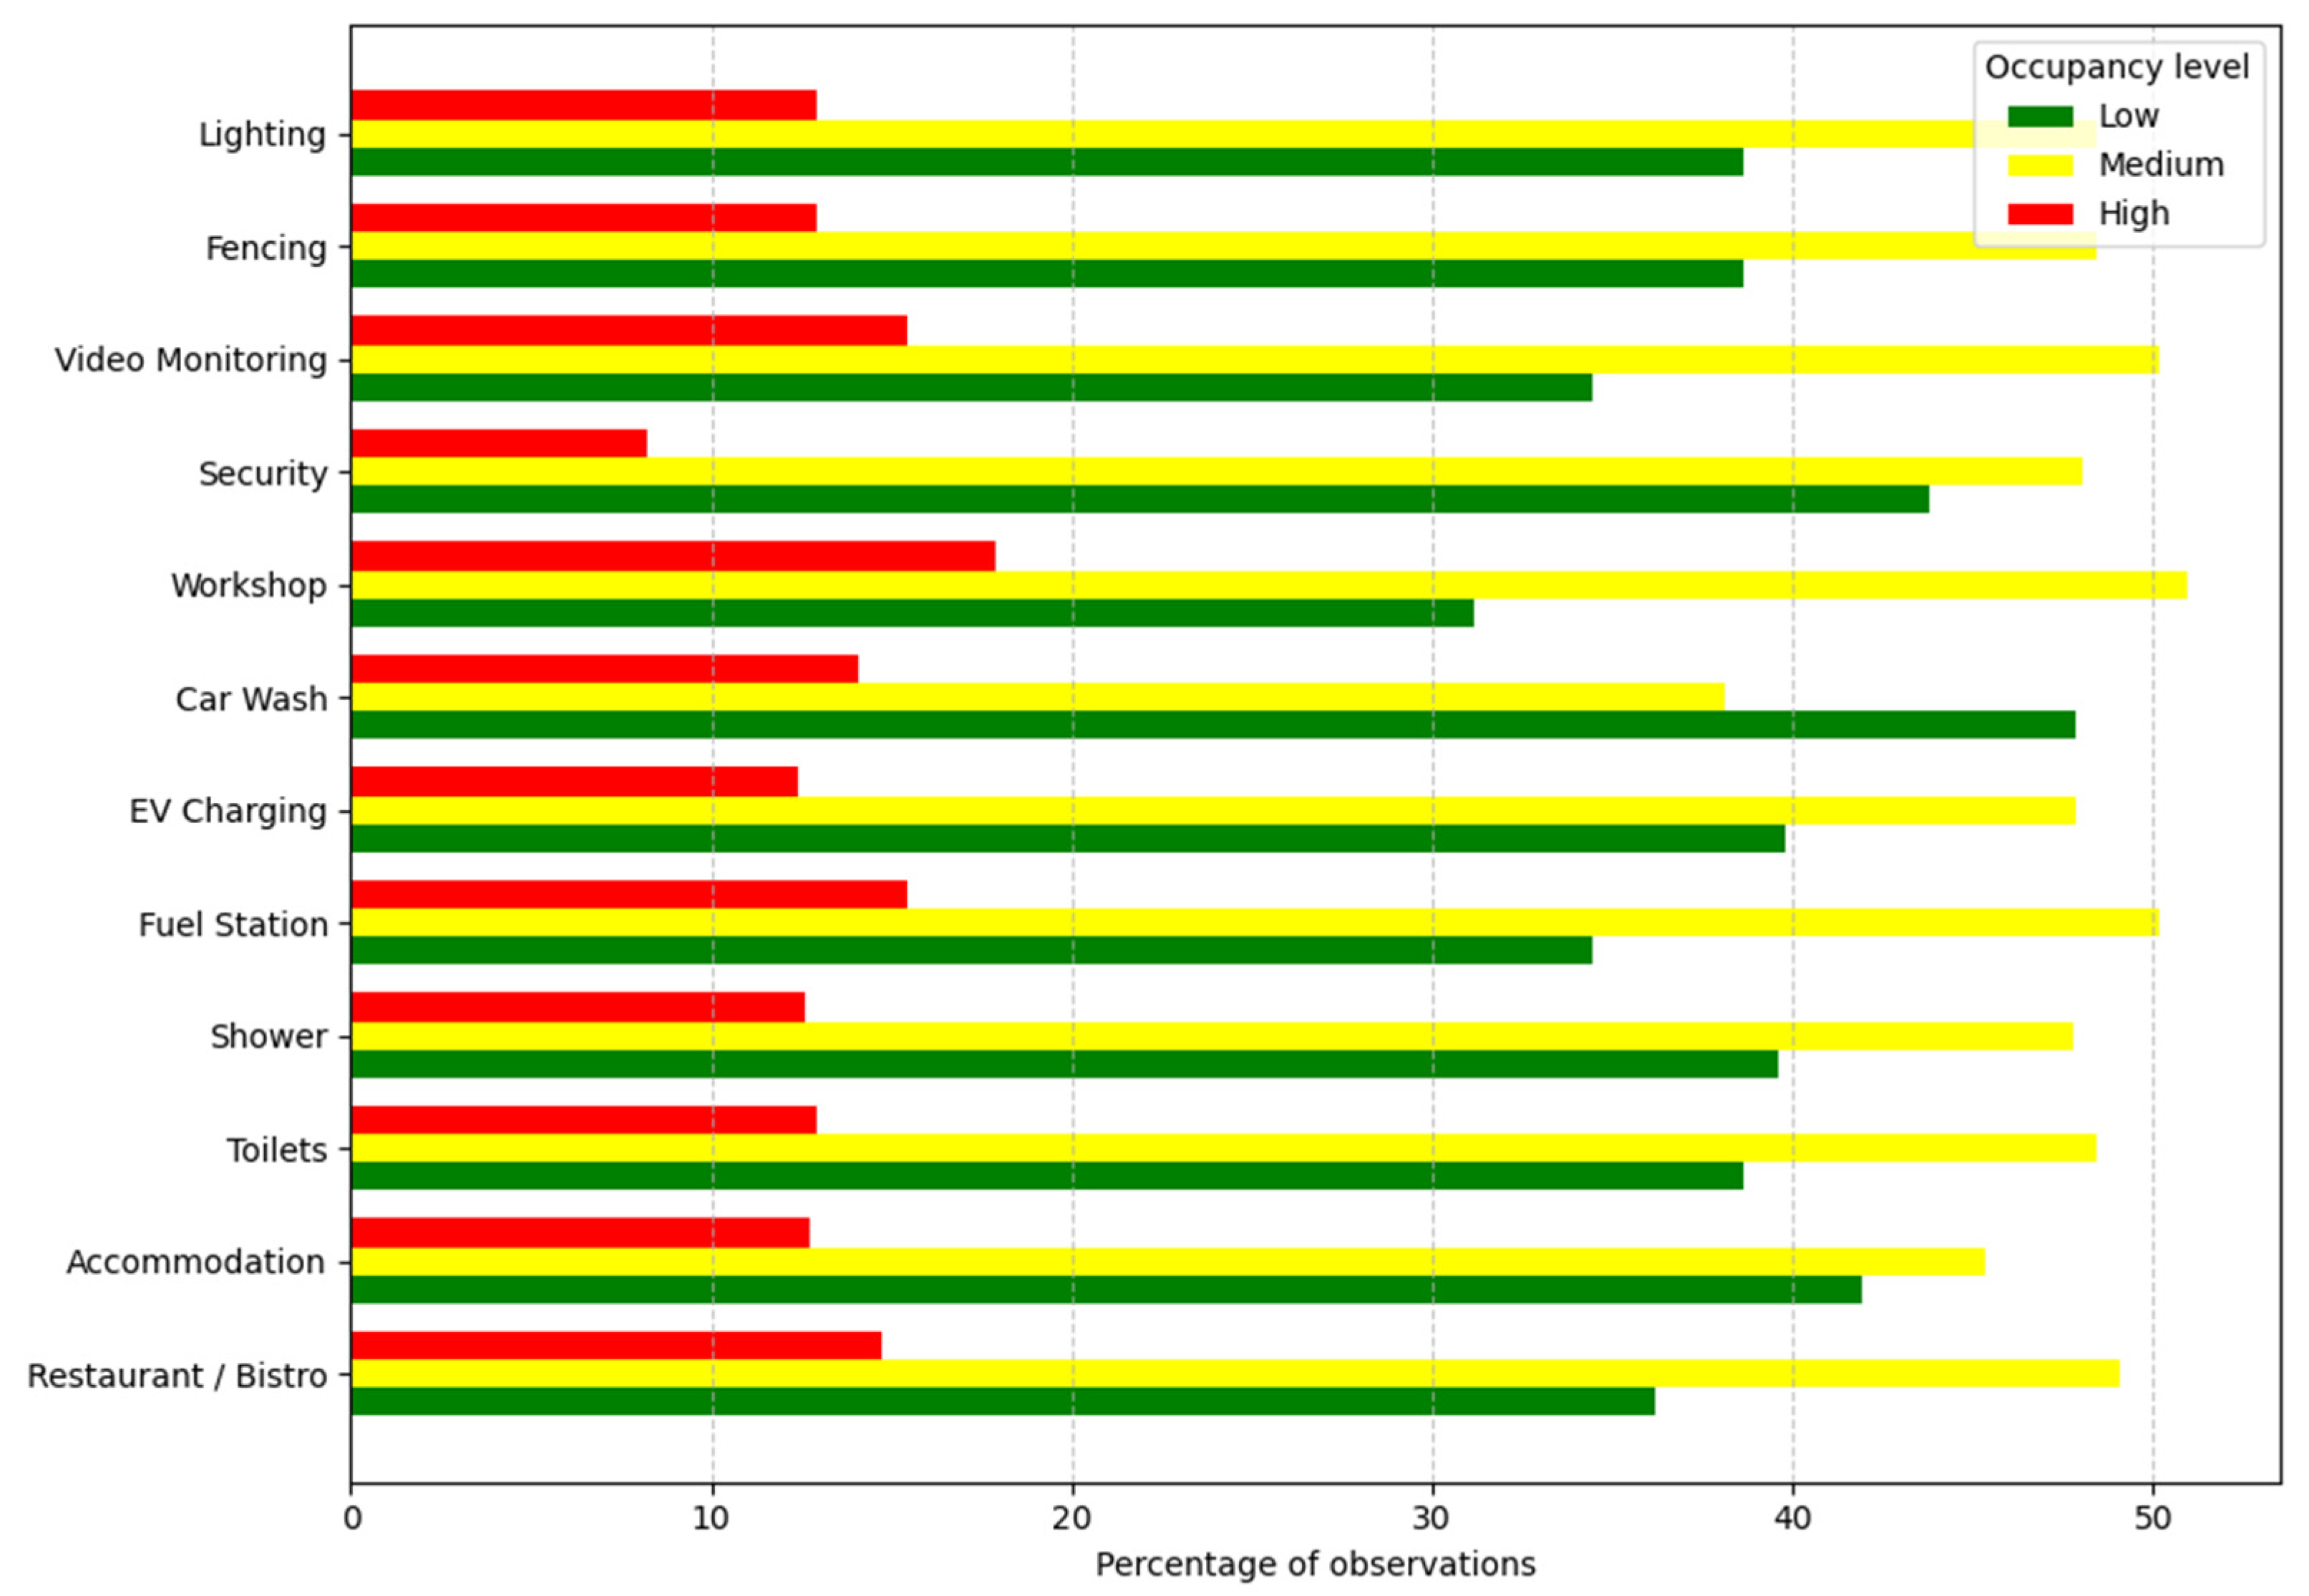
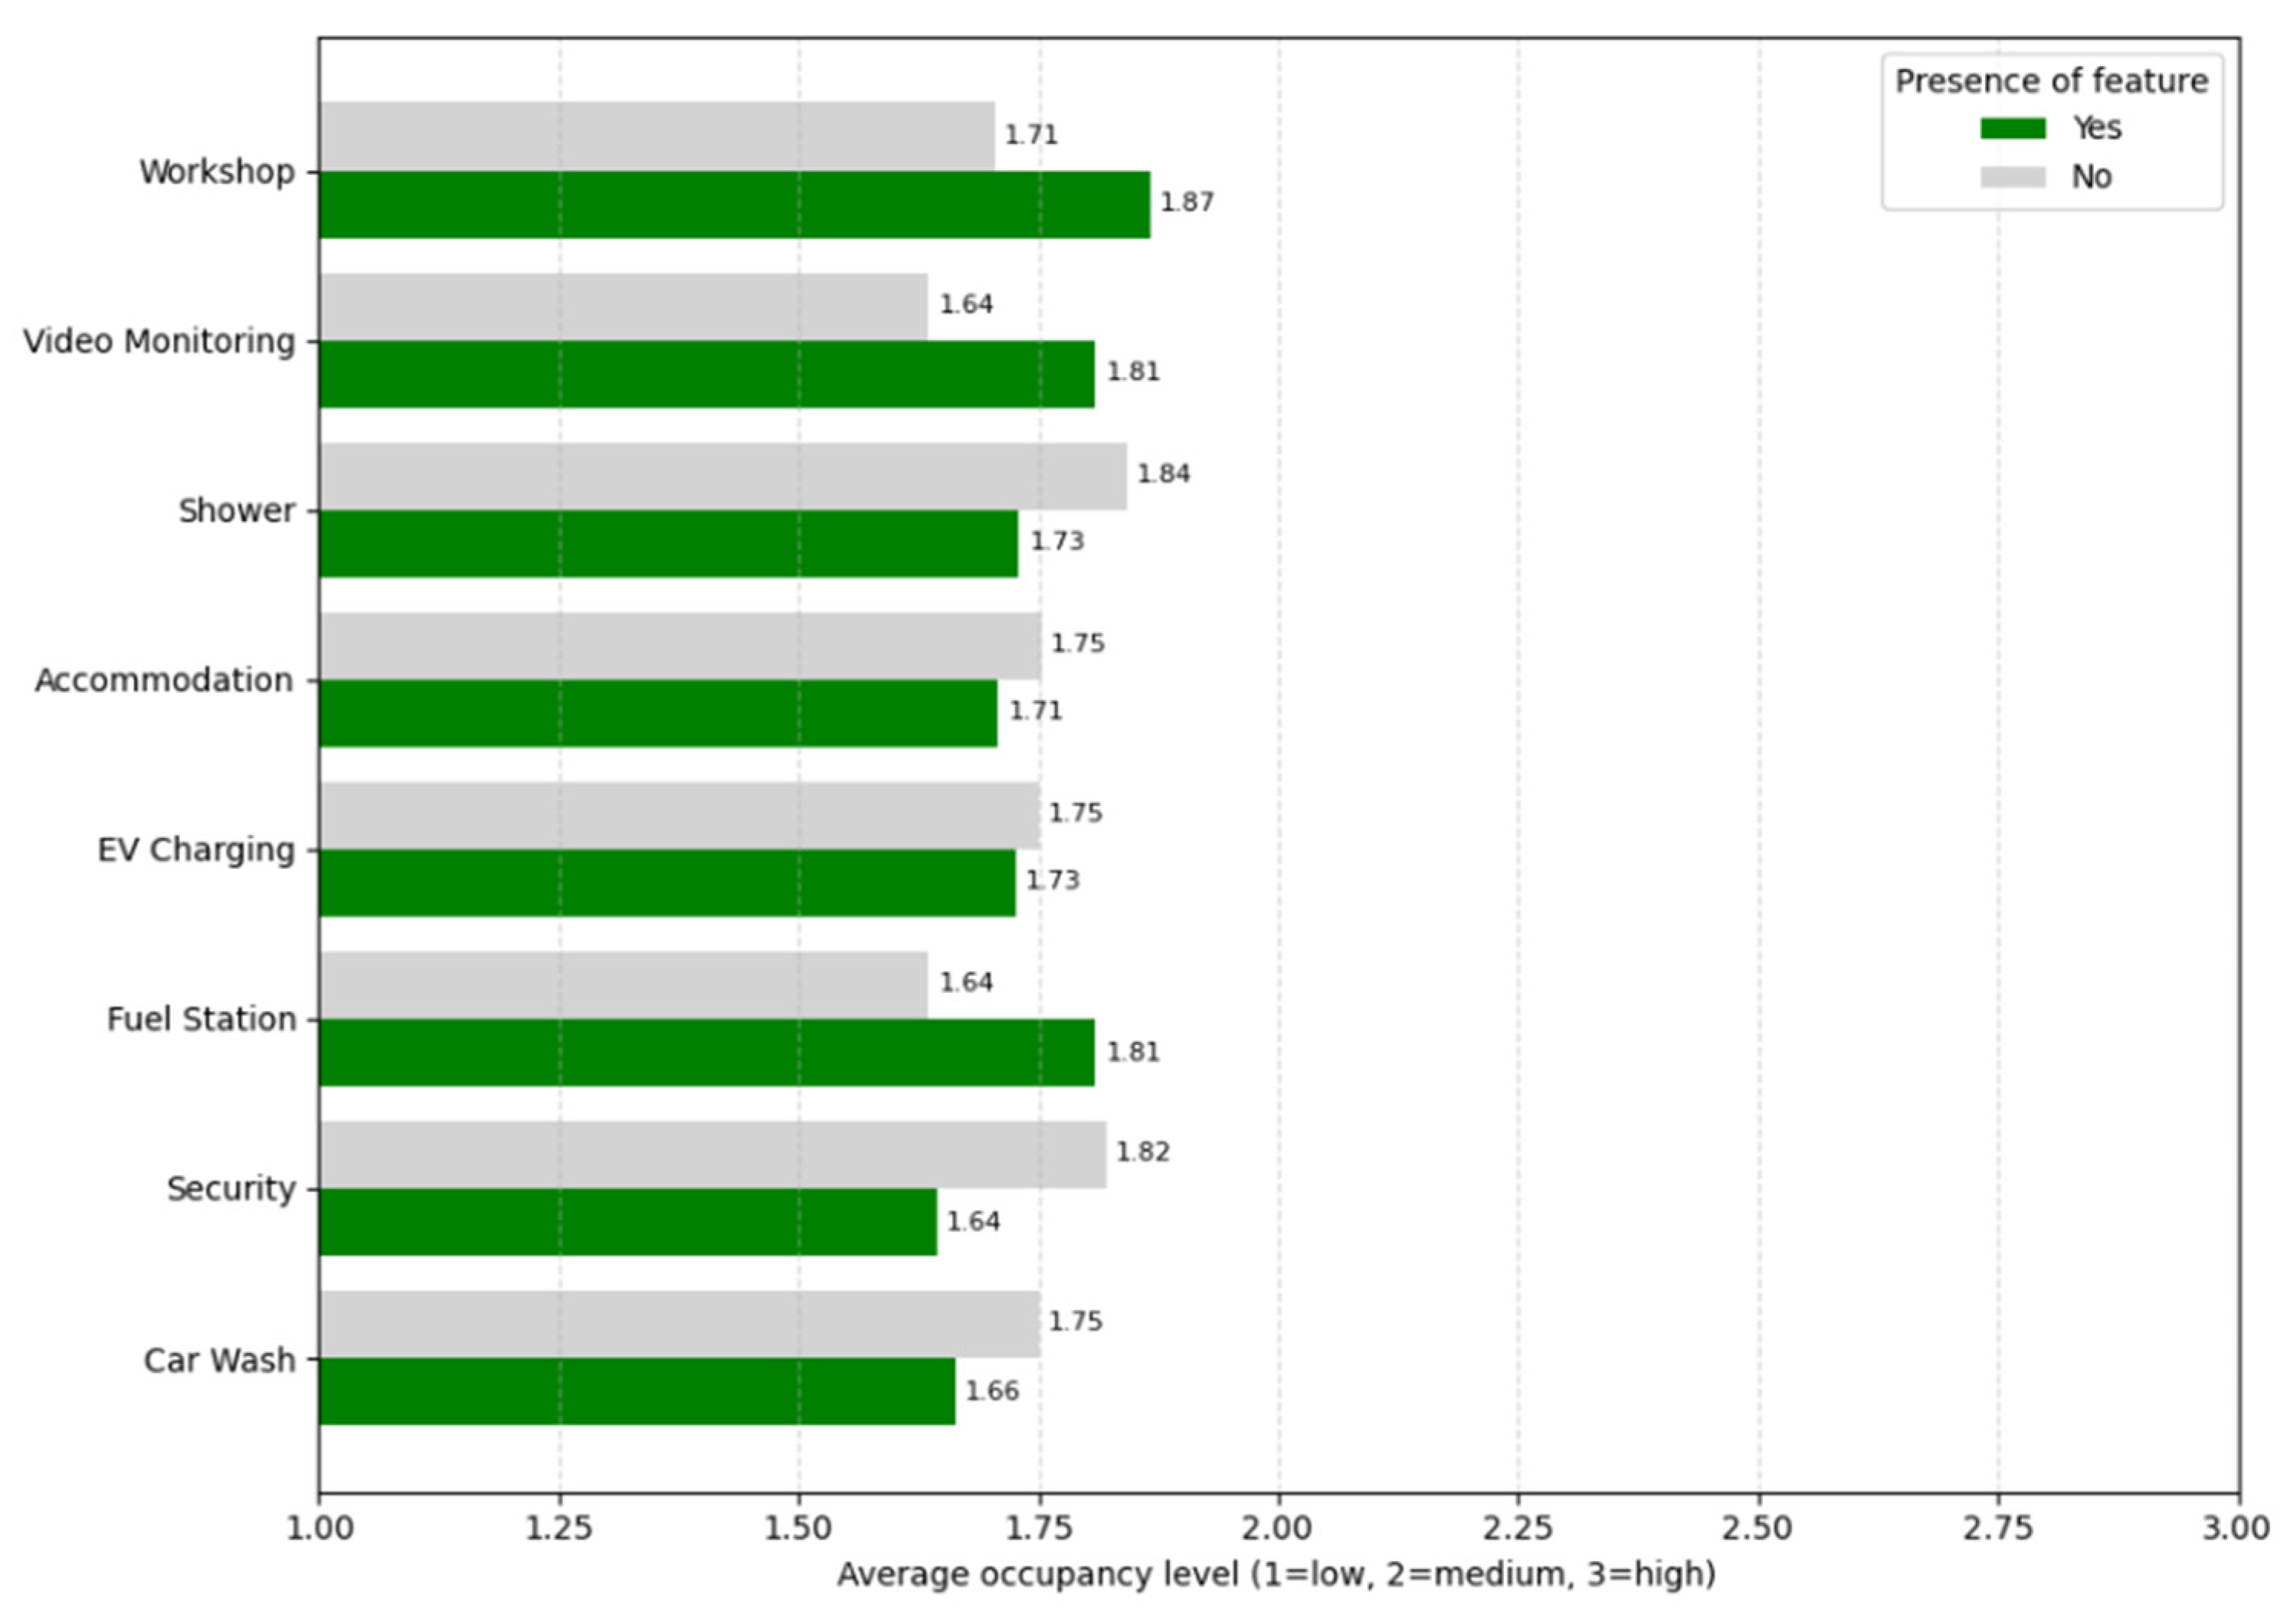
3.1. Exploratory Data Analysis

To investigate the usage of HRAs, a dataset of 10,740 observations and 33 variables was prepared. It included both numerical and categorical features, such as the number of parking spaces for passenger vehicles, buses, and trucks, as well as administrative and locational attributes like region, administrator, municipality, direction, and road classification. Additionally, the dataset covered the availability of various facilities and services, including restaurants or bistros, accommodation, toilets, showers, video surveillance, lighting, fencing, guarding, electric vehicle charging stations, hydrogen, CNG, and LNG refueling infrastructure, fuel stations, and workshops. Each row represented a unique rest area–hour combination, with occupancy classified into one of three standardized categories: low, medium, or high.
Figure 5 presents the overall distribution of truck parking lots occupancy levels recorded across all observations. Medium occupancy emerges as the most frequent category, with 5455 observations, followed by low occupancy (4002 cases), and high occupancy, which appears in only 1283 instances. This distribution suggests that moderate usage predominates among highway rest areas, while instances of high congestion are relatively rare.
Figure 6 presents the hourly distribution of rest area occupancy across all observations. A distinct temporal pattern emerges, with low occupancy levels dominating the early part of the day, peaking between 10:00 and 12:00, followed by a gradual decline during the afternoon and evening hours. Medium occupancy remains relatively stable throughout the day, with a slight upward trend from morning to evening. In contrast, high occupancy levels are consistently low during the morning but increase sharply after 17:00, reaching their highest values around 21:00. Because there are clear temporal variations, such as peak occupancy at certain times and low activity at others, the observed patterns suggest that the time of day is indeed a significant predictor of occupancy. However, these trends change throughout the day, indicating that the time of day alone is not sufficient for an accurate prediction. To achieve the full dynamics of occupancy behavior, it must be combined with other contextual elements, such as day of the week, weather, or historical usage.
Figure 7 presents the percentage distribution of occupancy levels across four southern regions of Poland. Medium occupancy is the dominant category in all voivodeships, ranging from 44.0% in Lesser Poland to 66.7% in Opole. Low occupancy is most prevalent in Lesser Poland (48.1%), while Silesia shows the highest proportion of high occupancy (14.4%). Regionally, the occupancy percentage changed a lot, which means that parking demand is influenced by location-specific factors. This situation of regional inequality also explains why the models to be used should be sensitive to the area in question so they can produce accurate results, not just the population density, to be very useful. Additionally, the level of occupation is a good indicator of the distribution of infrastructure, population density, and user behavior in that area.
Geographic coordinates in all voivodeships of HRAs in relation to their total parking lots are shown in Figure 8. Both HRAs and their related parking lots, when arranged according to their spatial distribution, show particular groups of high parking density that can be interconnected. This distribution of space is, in fact, essential for the determination of the parking behavior in the area and may be used as a reference source in designing control measures tied to geography or, in some cases, in the model adaptation of the system.
Figure 9 illustrates occupancy levels in relation to the presence of specific facilities at highway rest areas. The analysis shows that facilities such as fuel stations, restaurants, video monitoring, and lighting are associated with higher frequencies of medium to high occupancy. In particular, rest areas equipped with fuel stations and restaurants tend to exhibit elevated high occupancy rates. This suggests that such amenities play a significant role in attracting users. While toilets are a fundamental necessity and expected at all service areas, discrepancies in the data may account for their absence in some entries. The figure underscores the importance of comprehensive facility provision in promoting usage and user satisfaction.
To further explore how specific amenities may influence rest area usage, occupancy levels were encoded numerically (1 = low, 2 = medium, 3 = high), and the average was calculated for facilities with and without selected features. As shown in Figure 10, some elements, such as workshop, video monitoring, and fuel station, are associated with higher average occupancy, suggesting that the presence of these services might enhance the utility or attractiveness of the site. Conversely, sites with a car wash or security reported slightly lower average occupancy, which may reflect either operational characteristics or user preferences.

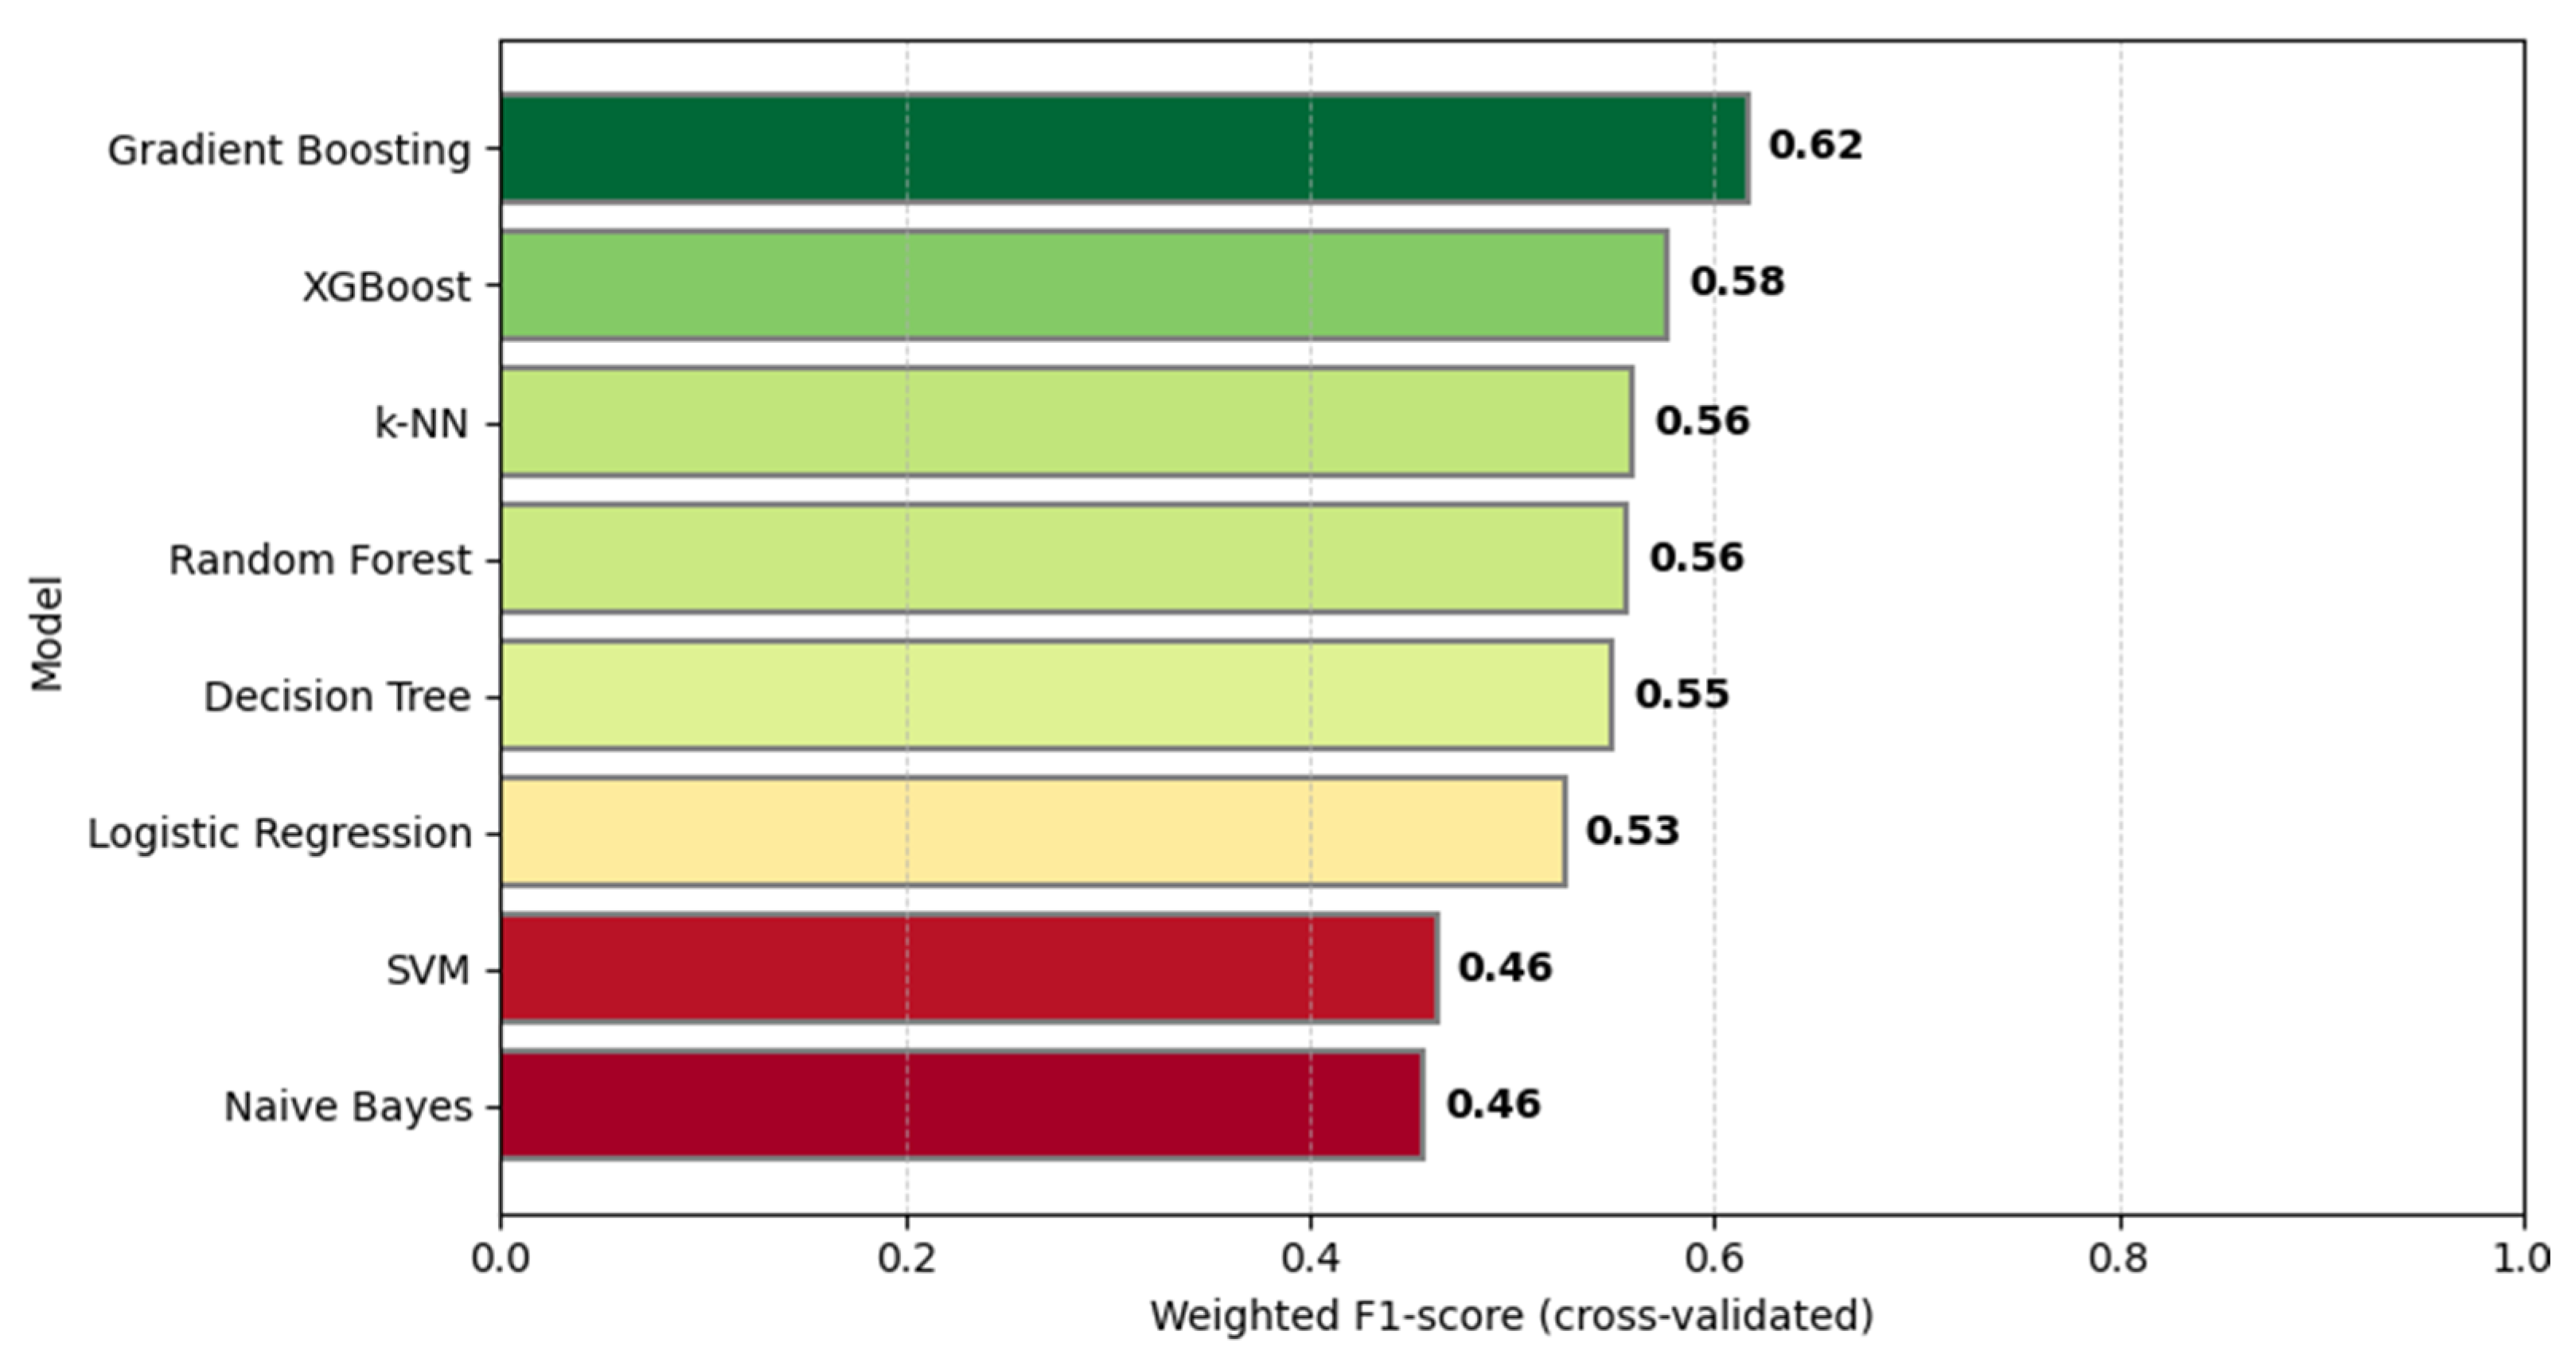
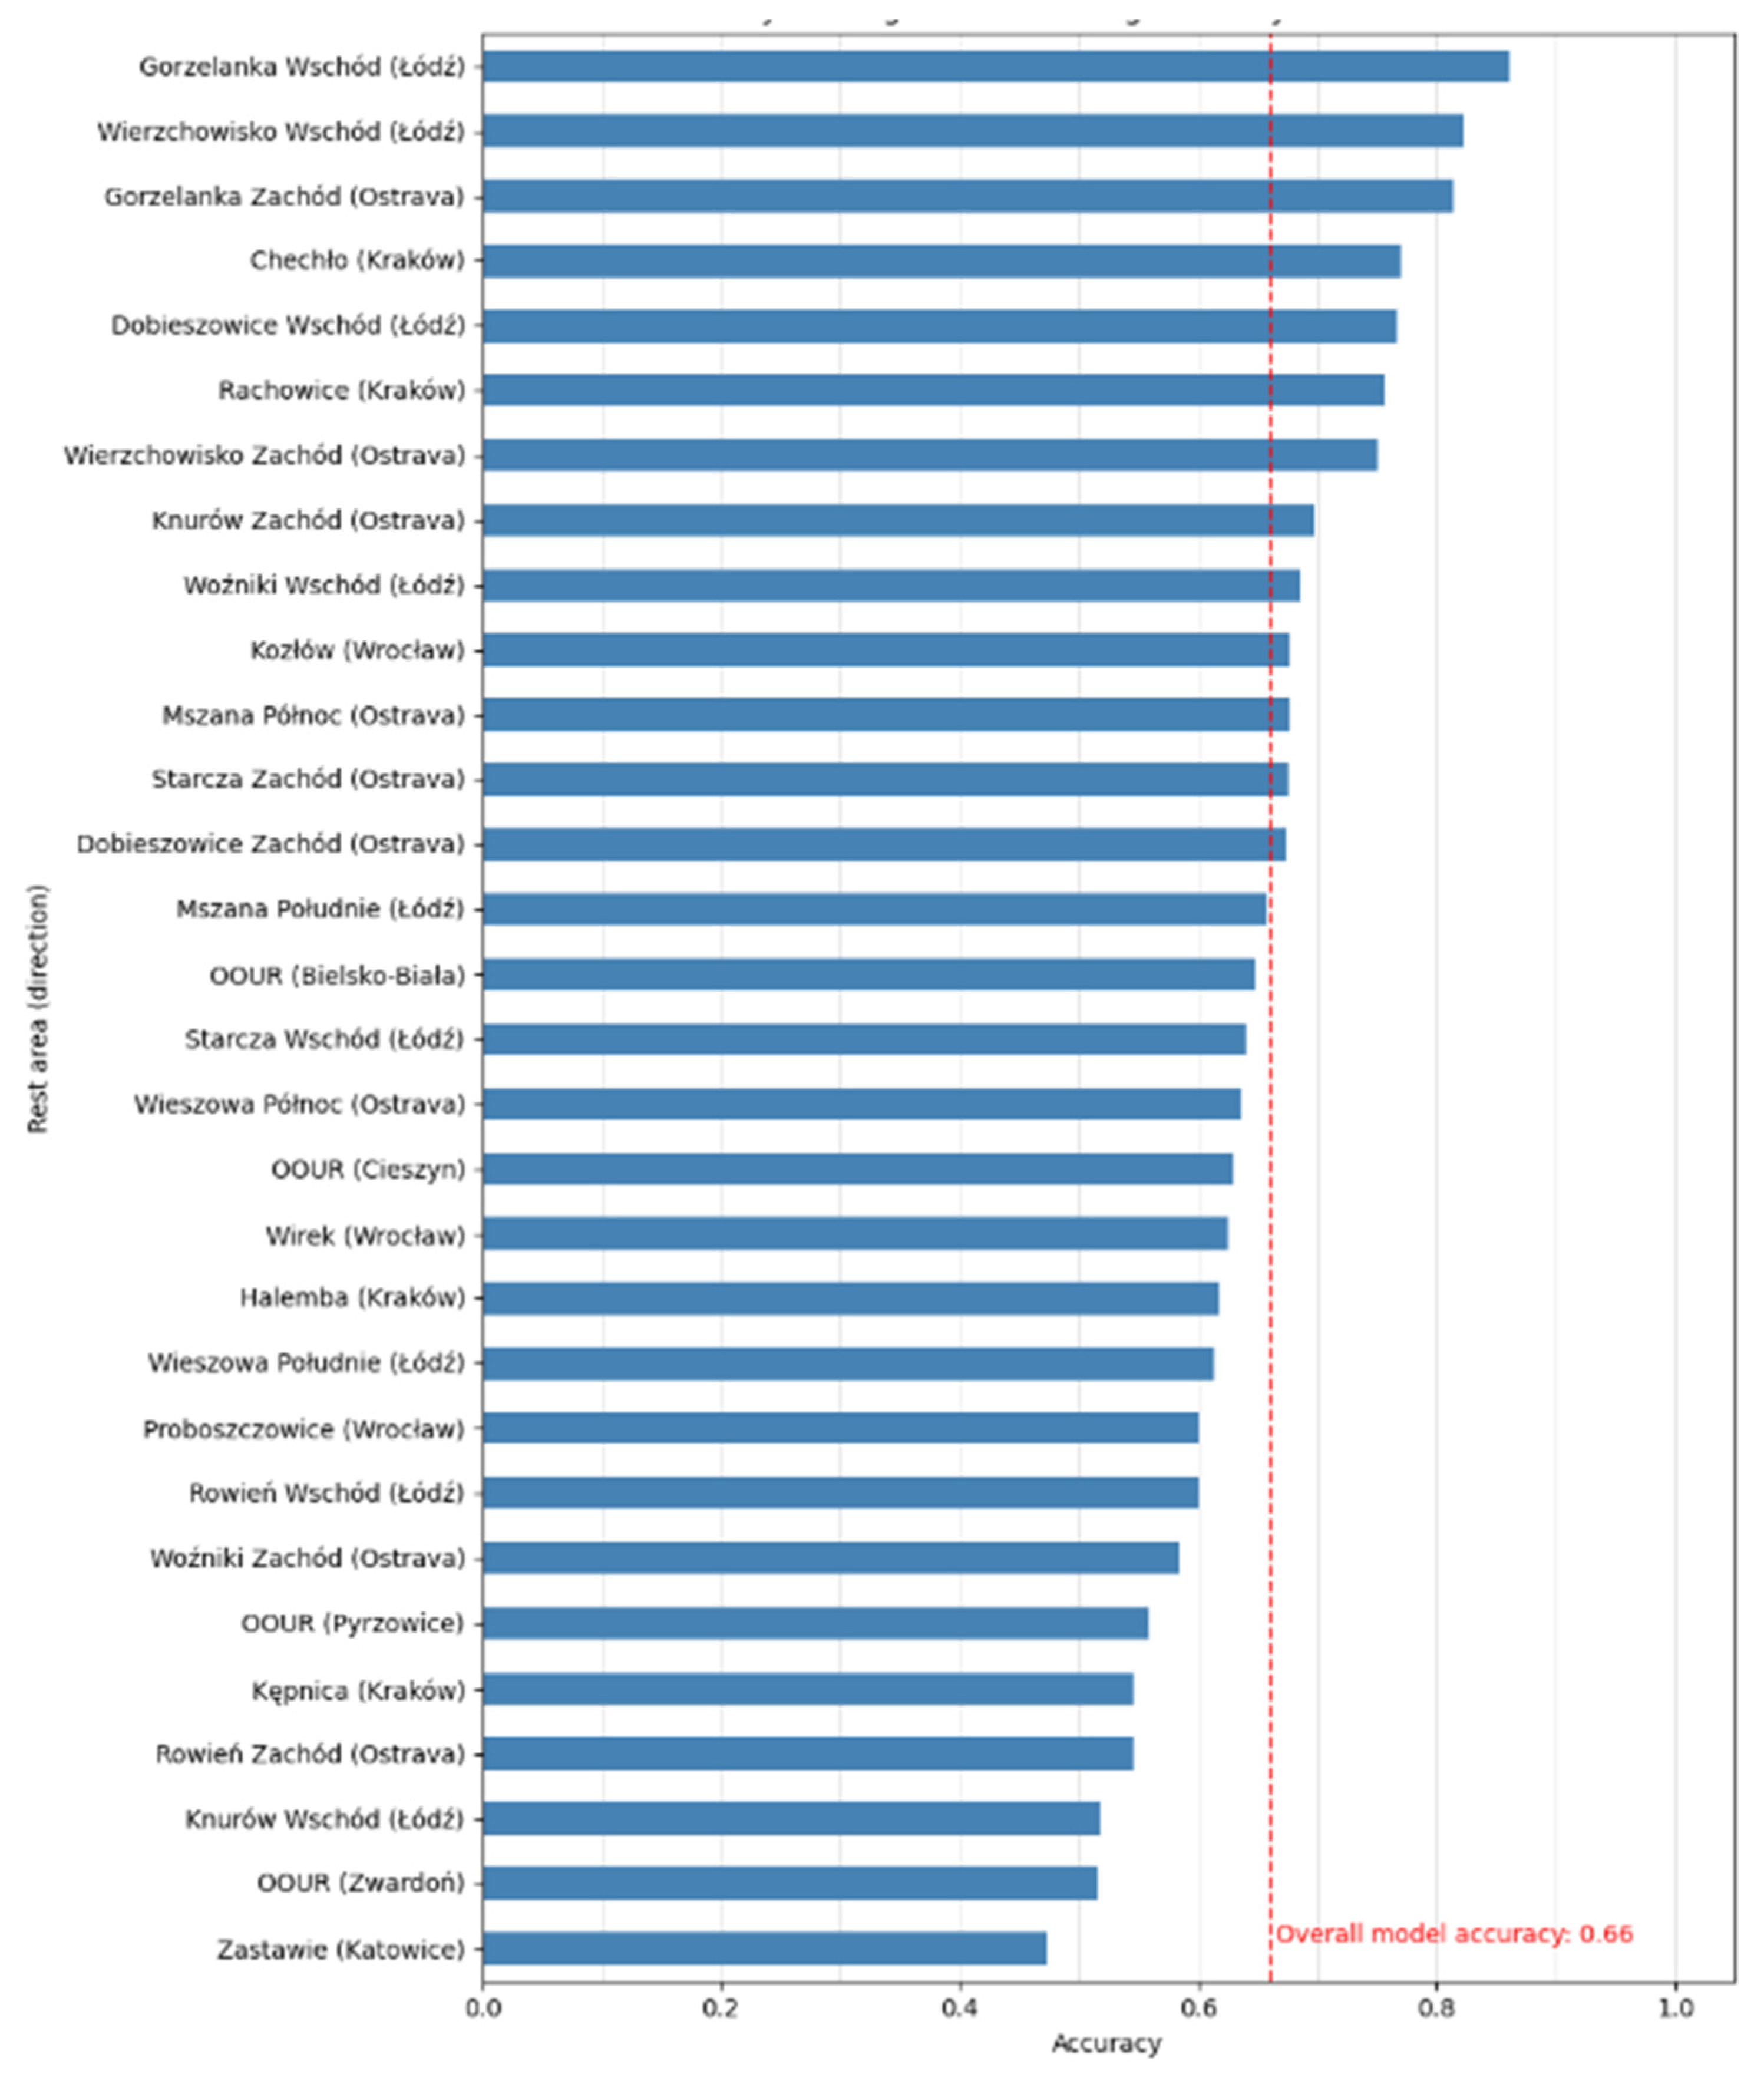
3.2. Results of Model Evaluation

The comparison of weighted F1-scores for all evaluated models, based on 5-fold cross-validation, is presented in Figure 11. Gradient Boosting achieved the highest performance, with a weighted F1-score of 0.62, followed by XGBoost (0.58), k-NN (0.56), Random Forest (0.56), and Decision Tree (0.55). Logistic Regression obtained a lower F1-score (0.53), while the SVM, and Naive Bayes classifiers reached only 0.46. These results clearly confirm the advantage of ensemble models—particularly Gradient Boosting and XGBoost—over classic linear and probabilistic approaches. The overall performance differences also demonstrate the importance of choosing advanced algorithms and robust validation methods for tasks involving imbalanced, multi-class occupancy prediction. The cross-validated F1-scores provide a reliable measure of model robustness, avoiding potential bias from a single train-test split.
To better understand the robustness of the model in practical deployment scenarios, an additional analysis was conducted to evaluate prediction accuracy at the individual rest area level. As shown in Figure 12, the accuracy of the gradient boosting classifier varies notably between locations, despite an overall performance of 0.66 (indicated by the red reference line). This variation may stem from local differences in infrastructure characteristics, traffic patterns, or data quality. Identifying rest areas with lower predictive performance is essential for targeting improvements in data collection, model calibration, or infrastructure monitoring. Such disaggregated evaluation helps assess whether the model performs consistently across the network or if location-specific adjustments are required. This contributes to a more reliable, context-aware application of machine learning models in transportation infrastructure planning.
The prediction accuracy of the Gradient Boosting model across different hours of the day is illustrated in Figure 13, providing further insight into its practical applicability and robustness. Evaluating temporal variability in model performance is crucial, as truck parking occupancy patterns inherently vary throughout the day due to fluctuating traffic volumes, operational schedules, and driver behavior. As indicated by the results, accuracy exceeds the overall average (0.66), primarily during early morning and midday hours, roughly from 5:00 to 15:00, suggesting more predictable occupancy patterns in this timeframe. In contrast, lower prediction performance occurs during late-night and early-morning periods (0:00–4:00), as well as during evening hours (18:00–23:00). This decline likely reflects irregular truck parking behavior or reduced data consistency during off-peak times. Identifying periods of reduced accuracy enables infrastructure planners and policymakers to prioritize improvements in data collection, refine predictive models, and design more effective time-sensitive management strategies for highway rest areas.
Figure 14 presents a comparative analysis of F1-scores for each occupancy class (low, medium, high) across all evaluated machine learning models, including both classical and ensemble approaches. The results indicate a clear performance gap between the classes, with consistently lower F1-scores for the minority “high occupancy” class across all models. This is a typical outcome in the context of imbalanced datasets, where the “high” occupancy state is underrepresented.
Among the tested algorithms, ensemble methods—particularly Gradient Boosting, Random Forest, and XGBoost—demonstrated the most balanced performance for both “low” and “medium” occupancy classes, with F1-scores typically exceeding 0.6. The Gradient Boosting model stands out as the most robust, achieving F1-scores above 0.6 for both “low” and “medium” classes, while also outperforming other models in the “high” occupancy category, although with a more modest score.
Classical models such as Decision Tree, Logistic Regression, and k-Nearest Neighbors (k-NN) also performed adequately for the majority classes but exhibited a significant drop in sensitivity to the “high” occupancy category. The Naive Bayes and Support Vector Machine (SVM) classifiers recorded the lowest F1-scores overall, particularly struggling with both the minority class and, in the case of SVM, the “low” occupancy class.
These findings confirm that while overall accuracy or macro-averaged scores might suggest good model performance, detailed class-level analysis reveals challenges in detecting the most critical “full occupancy” situations. The results underscore the importance of using advanced ensemble algorithms and class-balanced evaluation metrics when predicting rare but operationally significant events in transport infrastructure analytics.
Figure 15 presents the feature importance rankings derived from the Gradient Boosting model used to predict rest area occupancy levels. The analysis indicates that the presence of a fuel station is the most significant predictor, followed by factors such as administrator identity, current rest area category, security, showers, truck parking, and waste disposal facilities. These findings suggest that the availability of comprehensive amenities and effective management play a crucial role in attracting users to rest areas. Truck parking occupancy is still a crucial element in the larger context of freight transport and logistics efficiency, even if it was ranked sixth among the criteria considered in this study. Its relative position among the many contributing factors is all that the ranking represents; it does not necessarily indicate that it is not important. All evaluated criteria are frequently interrelated, and when considered in a practical context, even lower-ranked components might have significant ramifications. Higher-priority issues of HRAs amenities are related with truck parking. Insufficient parking spaces can result in risky roadside stops, infractions of driving time regulations, and increased driver weariness, all of which have a detrimental effect on the logistics chain. As a result, truck parking acts as a fundamental element supporting more obviously important facets of transportation operations. The industry’s identification of parking as a logistical and technological priority is demonstrated by contemporary solutions like LKW.APP and other digital platforms for real-time truck parking information. Even while the data could rank truck parking in the middle of importance, greater freight traffic and more enforcement of rest-time laws are predicted to make it more significant. This observation is consistent with the literature, which emphasizes that well-equipped rest areas significantly enhance traveler comfort and safety, thereby increasing their utilization.
To gain insight into the factors driving the model’s predictions for the low occupancy class, a SHAP summary plot was generated (Figure 16). The analysis reveals that “Hour” is by far the most influential variable, with higher values (late hours) markedly reducing the probability of a low occupancy prediction, as indicated by the concentration of red points on the left side of the axis. Conversely, lower hour values (early in the day, blue points) increase the likelihood of classifying an observation as low occupancy. Other features—such as the number of “Truck Parking” spaces, “Municipality”, and “Fuel Station”—also play a role, although their effects are generally less pronounced. Notably, high values of “Truck Parking” (more available spaces) are associated with a reduced chance of low occupancy, reflecting the practical intuition that larger facilities tend to experience higher usage. Overall, the results highlight the dominant impact of temporal factors, supplemented by infrastructure-related variables, in identifying periods and locations characterized by low rest area occupancy.
The SHAP summary plot for the medium occupancy class (Figure 17) reveals that “Hour” is again the most decisive feature, but with an opposite effect compared to the low occupancy class. Here, higher hour values (late in the day, red points) have a strong positive impact on predicting the medium class, while lower values (early hours, blue points) decrease this probability. “Truck Parking” and “Municipality” remain among the most influential variables, suggesting that both infrastructure and location continue to play key roles in determining periods of moderate rest area utilization. Notably, a higher number of truck parking spaces tends to increase the likelihood of a medium occupancy classification, indicating that larger rest areas are more likely to experience moderate, rather than low or high, utilization. The remaining features, such as “Car Parking”, “Direction”, and various facility indicators, exert more nuanced but still visible effects on model predictions. Collectively, these findings highlight the importance of both temporal and spatial factors in shaping the patterns of medium occupancy, underscoring the interplay between time of day and infrastructure scale in highway rest area demand dynamics.
For the high occupancy class (Figure 18), the SHAP analysis underscores that “Hour” remains the most prominent driver, with later times of day (high values) markedly elevating the likelihood of predicting high occupancy. The distinctive influence of “Security” and “Car Parking” is also evident: higher levels of security and more car parking spaces increase the model’s propensity to classify a rest area as highly occupied, potentially reflecting greater demand at larger, well-equipped sites during busy periods. The effects of features such as “Current Category”, “Waste Disposal”, and “Bus Parking” suggest that the presence of certain facilities further differentiates sites prone to reaching full capacity. These nuanced relationships highlight how a combination of temporal patterns and advanced amenities distinguish the highest utilization scenarios from more moderate or low-demand conditions.

4. Discussion

Current standards for the implementation of infrastructure investments in the scope of HRAs assume that the basic infrastructure of each of them should consist of a parking lot for passenger cars, trucks and buses, toilets, places to rest, a playground for children, and an outdoor gym. The development of this infrastructure in Poland aims to improve the comfort and safety of travelers, especially professional drivers, and to provide them with the necessary services during long journeys. Work is underway to modernize (especially in terms of increasing the number of snow removal points) and expand existing HRAs, and the construction of new ones is planned, in line with national and European requirements, including electric vehicle charging stations.
The results of this study confirm that machine learning models can be effectively applied to predict hourly occupancy levels at highway rest areas using structured, infrastructure-related data. Among the tested algorithms, the best-performing model demonstrated strong predictive capabilities, particularly in capturing complex interactions between facility characteristics and usage dynamics. Variables such as total parking capacity, proximity to urban centers, and the availability of essential services consistently emerged as the most influential features, suggesting that both spatial and functional factors contribute significantly to rest area demand.
Moreover, the observed predominance of medium occupancy levels and the relatively low occurrence of full capacity underscore temporal occupancy patterns and their implications for facility management, aligning with previous research indicating that rest area utilization rates typically range between 8.4% and 12.3% of mainline traffic, with peak usage around midday [50]. These findings suggest that most highway rest areas operate below maximum capacity, experiencing higher congestion only during specific time windows. This temporal pattern underscores the importance of effective facility management to address peak periods without incurring unnecessary expansion costs.
The influence of specific amenities on occupancy levels also supports findings from previous studies suggesting that enhanced rest area infrastructure significantly shapes driver preferences and usage patterns [51]. In particular, facilities offering fuel, food, or improved safety features tend to attract more users, indicating that investment in comprehensive services can yield measurable increases in rest area utilization. These insights are crucial for infrastructure planning strategies aiming to optimize not just capacity, but also functional attractiveness.
The regional variation in occupancy levels observed across voivodeships highlights critical implications for infrastructure planning and capacity management, particularly in Silesia and Lesser Poland. Lesser Poland exhibited relatively high proportions of low occupancy, potentially indicating the underutilization of available infrastructure, whereas Silesia showed elevated levels of high occupancy, suggesting localized capacity constraints. These disparities align with prior analyses emphasizing the importance of spatial dynamics in highway traffic management and infrastructure planning [52].
The diurnal occupancy cycle identified in this study, characterized by low usage in the morning and increased congestion in the evening, aligns with previous findings on rest area stop behavior [53]. Recent research also underscores the importance of incorporating temporal dynamics into predictive models of rest area usage, suggesting that hybrid approaches can effectively capture these cyclical patterns [54]. Studies have shown that short-term, low-density stops typically prevail in the morning, while congestion-related or long-duration stops are more common in the evening hours. These temporal dynamics emphasize the need to integrate time-of-day variations into predictive models of rest area usage, as hybrid approaches have demonstrated effectiveness in capturing such cyclical patterns. This pattern suggests that time-of-day dynamics should be integrated into the design and management of rest area facilities to address varying levels of demand effectively.
Furthermore, the comparative evaluation of eight machine learning algorithms introduces a clearer transition to the comparison, emphasizing the role of Gradient Boosting as the most effective model for capturing non-linear interactions in the dataset, and reaffirming the practical advantages of ensemble methods for infrastructure-related classification problems. The Gradient Boosting model outperformed other classifiers, achieving the highest accuracy and effectively capturing non-linear interactions among infrastructure features. This outcome aligns with existing studies demonstrating the robustness of boosting algorithms in transportation-related prediction tasks [11]. While feature importance derived from the Gradient Boosting model provides useful insights into the relative influence of individual variables, this approach offers only a global perspective on model behavior. More advanced interpretability methods, such as SHAP (SHapley Additive exPlanations) and LIME (Local Interpretable Model-Agnostic Explanations), can offer additional, instance-level explanations that are particularly valuable in infrastructure and policy decision-making contexts. Due to resource constraints, these methods were not applied in the current study, but we recognize their potential to improve transparency and stakeholder understanding. Incorporating such techniques represents an important avenue for future research to enhance the practical applicability of machine learning models in this domain. Random Forest and XGBoost also yielded competitive results, while Logistic Regression and Decision Tree models performed less effectively, consistent with prior reports highlighting their limited effectiveness in capturing nuanced behavioral patterns in transportation datasets.
The findings also emphasize the critical role of feature engineering and model interpretability within the predictive framework employed in this study, and model interpretability in infrastructure forecasting. Recent meta-analyses emphasize the value of combining regression, decision trees, and deep learning methods to manage the heterogeneous nature of rest area data [55]. Although the present study focused on interpretable classification algorithms, future research could explore hybrid models that integrate temporal learning architectures to capture more complex spatial and temporal dynamics.
Despite these promising outcomes, certain limitations should be acknowledged, particularly regarding data coverage, model generalizability, and the integration of external factors such as weather, seasonal variation, and real-time traffic conditions. The dataset was geographically limited to southern Poland and did not account for external factors such as weather or seasonal variation, potentially affecting model generalizability. Additionally, the occupancy data, while consistent, were derived from digital monitoring systems and may not fully capture nuanced behavioral patterns. Finally, while the feature importance analysis provides a degree of interpretability, further research is necessary to enhance transparency and build stakeholder trust in predictive tools employed for public infrastructure planning.

5. Conclusions

As traffic volumes increase and long-distance travel becomes more frequent, rest areas serve as crucial nodes for maintaining traffic safety, enhancing driver health and balance, and supporting logistical and environmental goals. They are strategic components of modern road infrastructure. Equipping them appropriately to user needs and evaluating predictive models of rest area occupancy is crucial for the development of sustainable and utilitarian transport networks based on SSTPAs program.
This study demonstrated the applicability of supervised machine learning models for predicting hourly occupancy levels at highway rest areas using structured data on facility characteristics and location. Among the tested algorithms, the best-performing model achieved high predictive accuracy and identified several key features—such as parking capacity, proximity to urban areas, and availability of services—as major determinants of rest area utilization.
While the dataset included 33 features describing infrastructural, administrative, and locational characteristics of highway rest areas, no feature reduction techniques were applied in this study. This decision was based on the fact that all variables were derived from official public authority databases and represent standardized criteria used for rest area assessment in Poland. As such, we prioritized maintaining the full scope of available information to align with institutional evaluation practices and ensure completeness of the analysis. Nevertheless, we acknowledge that some features may have limited predictive value, and that removing low-importance variables could potentially simplify the model and enhance interpretability. Future research could incorporate dimensionality reduction or feature selection methods—such as recursive feature elimination or principal component analysis—to further refine the model and evaluate the marginal contribution of each feature.
This study focuses on highway rest areas located in southern Poland, reflecting the availability of detailed data for this region. While this geographic limitation restricts the immediate generalizability of the model, the underlying machine learning framework and feature selection approach are adaptable to other regions and countries. To apply the model in different contexts, it would be necessary to incorporate region-specific infrastructural, administrative, and locational variables, and to retrain the model with local data to capture variations in traffic patterns, management practices, and regulatory environments. Future research could explore such adaptations, enabling broader applicability and validation of the approach in diverse geographic settings.
By integrating infrastructure-specific attributes into a classification framework, the study moves beyond traditional planning approaches that rely on static assumptions or aggregate demand estimates. The results provide a replicable methodology for transport agencies seeking to monitor, evaluate, or redesign rest area networks based on empirical usage patterns.
In addition to confirming the relevance of machine learning in infrastructure analytics, the study highlights the need for further research incorporating real-time data sources and external factors such as weather or seasonality. Expanding the geographic scope and testing model generalizability in other contexts would enhance the robustness and transferability of the findings.
Overall, the research contributes to a growing body of evidence supporting data-driven transport infrastructure planning and offers actionable insights for improving the efficiency, safety, and responsiveness of rest area provision.

Author Contributions

Conceptualization, A.B. and M.C.; methodology, A.B. and M.C.; formal analysis, A.B. and M.C.; investigation, A.B. and M.C.; data curation, M.C.; writing—original draft preparation, A.B. and M.C.; writing—review and editing, A.B. and M.C.; visualization, A.B. All authors have read and agreed to the published version of the manuscript.

Funding

This research received no external funding.

Data Availability Statement

Data are contained within the article. The full analytical pipeline, including data preprocessing and model implementation in Python, is available in a public repository: https://github.com/BudzynskiA/rest-area-occupancy-ml (accessed on 15 April 2025).

Acknowledgments

The authors would like to thank the reviewers for their valuable and perceptive comments, which have enhanced the paper’s quality and will assist the authors in advancing their study in this area.

Conflicts of Interest

The remaining authors declare that the research was conducted in the absence of any commercial or financial relationships that could be construed as a potential conflict of interest.

Abbreviations

ETCelectronic toll collection
HCVHeavy Commercial Vehicles
HoSHours of Service
HRAsHighway Rest Areas
RAsRest Areas
SSTPAsSafe and Secure Truck Parking Areas

References

  1. Cheng, G.; Cheng, R.; Pei, Y.; Han, J. Research on Highway Roadside Safety. J. Adv. Transp. 2021, 2021, 6622360. [Google Scholar] [CrossRef]
  2. EU. Commission Delegated Regulation (EU) 2022/1012 of 7 April 2022 Supplementing Regulation (EC) No 561/2006 of the European Parliament and of the Council with Regard to the Establishment of Standards Detailing the Level of Service and Security of Safe and Secure Parking Areas and to the Procedures for Their Certification. 2022. Available online: https://eur-lex.europa.eu/eli/reg_del/2022/1012/oj/eng (accessed on 14 April 2025).
  3. World Health Organization. Global Status Report on Road Safety 2018; World Health Organization: Geneva, Switzerland, 2018. Available online: https://iris.who.int/handle/10665/276462 (accessed on 14 April 2025).
  4. Brown, I.D. Driver Fatigue. Hum. Factors J. Hum. Factors Ergon. Soc. 1994, 36, 298–314. [Google Scholar] [CrossRef]
  5. McArthur, A.; Kay, J.; Savolainen, P.T.; Gates, T.J. Effects of Public Rest Areas on Fatigue-Related Crashes. Transp. Res. Rec. J. Transp. Res. Board 2013, 2386, 16–25. [Google Scholar] [CrossRef]
  6. Bunn, T.L.; Slavova, S.; Rock, P.J. Association between commercial vehicle driver at-fault crashes involving sleepiness/fatigue and proximity to rest areas and truck stops. Accid. Anal. Prev. 2019, 126, 3–9. [Google Scholar] [CrossRef]
  7. Alkhatni, F.; Ishak, S.Z.; Milad, A. Characteristics and Potential Impacts of Rest Areas Proximate to Roadways: A Review. Open Transp. J. 2021, 15, 260–271. [Google Scholar] [CrossRef]
  8. Crizzle, A.M.; Toxopeus, R.; Malkin, J. Impact of limited rest areas on truck driver crashes in Saskatchewan: A mixed-methods approach. BMC Public Health 2020, 20, 971. [Google Scholar] [CrossRef] [PubMed]
  9. Ren, X.; Pritchard, E.; Van Vreden, C.; Newnam, S.; Iles, R.; Xia, T. Factors Associated with Fatigued Driving among Australian Truck Drivers: A Cross-Sectional Study. Int. J. Environ. Res. Public. Health 2023, 20, 2732. [Google Scholar] [CrossRef]
  10. Cai, Q.; Yi, D.; Zou, F.; Zhou, Z.; Li, N.; Guo, F. Recognition of Vehicles Entering Expressway Service Areas and Estimation of Dwell Time Using ETC Data. Entropy 2022, 24, 1208. [Google Scholar] [CrossRef]
  11. Dai, G.; Tang, J.; Luo, W. Short-term traffic flow prediction: An ensemble machine learning approach. Alex. Eng. J. 2023, 74, 467–480. [Google Scholar] [CrossRef]
  12. Yu, Y.; Shang, Q.; Xie, T. A Hybrid Model for Short-Term Traffic Flow Prediction Based on Variational Mode Decomposition, Wavelet Threshold Denoising, and Long Short-Term Memory Neural Network. Complexity 2021, 2021, 7756299. [Google Scholar] [CrossRef]
  13. Provoost, J.; Wismans, L.; der Drift, S.V.; Kamilaris, A.; Keulen, M.V. Short Term Prediction of Parking Area states Using Real Time Data and Machine Learning Techniques. arXiv 2019, arXiv:1911.13178. [Google Scholar] [CrossRef]
  14. Koesdwiady, A.; Soua, R.; Karray, F. Improving Traffic Flow Prediction With Weather Information in Connected Cars: A Deep Learning Approach. IEEE Trans. Veh. Technol. 2016, 65, 9508–9517. [Google Scholar] [CrossRef]
  15. Pérez-Acebo, H.; Romo-Martín, A.; Findley, D.J. Spatial distribution and the facility evaluation of the service and rest areas in the toll motorway network of the European Union. Appl. Spat. Anal. Policy 2022, 15, 821–845. [Google Scholar] [CrossRef]
  16. Romo-Martín, A.; Pérez-Acebo, H. Analysis of the Location of Service and Rest Areas and their facilities in Spanish paying motorways. Transp. Res. Procedia 2018, 33, 4–11. [Google Scholar] [CrossRef]
  17. Pérez-Acebo, H.; Romo-Martín, A. SERVICE AND REST AREAS IN TOLL MOTORWAYS IN POLAND: STUDY OF DISTRIBUTION AND FACILITIES. Transp. Probl. 2019, 14, 155–164. [Google Scholar] [CrossRef]
  18. Kolodinskaja, J.; Bertulienė, L. Layout of Rest Areas and Their Infrastructure Development in the South-Eastern Region of Lithuania. Balt. J. Road Bridge Eng. 2020, 15, 130–145. [Google Scholar] [CrossRef]
  19. Hami, A.; Nojavan, A. Rest Areas Management; the Effect of Demographic Information into Users’ Preferences for Planning Parameters of Rest Areas. Int. J. Archit. Eng. Urban Plan. 2020, 30, 97–106. [Google Scholar] [CrossRef]
  20. ENevland, A.; Gingerich, K.; Park, P.Y. A data-driven systematic approach for identifying and classifying long-haul truck parking locations. Transp. Policy 2020, 96, 48–59. [Google Scholar] [CrossRef]
  21. Haque, K.; Mishra, S.; Paleti, R.; Golias, M.M.; Sarker, A.A.; Pujats, K. Truck Parking Utilization Analysis Using GPS Data. J. Transp. Eng. Part Syst. 2017, 143, 04017045. [Google Scholar] [CrossRef]
  22. Budzyński, A.; Cieśla, M. APPLICATION OF A MACHINE LEARNING MODEL FOR FORECASTING FREIGHT RATE IN ROAD TRANSPORT. Sci. J. Silesian Univ. Technol. Ser. Transp. 2025, 126, 23–48. [Google Scholar] [CrossRef]
  23. Tamaru, R.; Cheng, Y.; Parker, S.; Perry, E.; Ran, B.; Ahn, S. Truck Parking Usage Prediction with Decomposed Graph Neural Networks. arXiv 2024, arXiv:2401.12920. [Google Scholar] [CrossRef]
  24. Zheng, Y.; Cheng, C.; Zhang, Y.; Wang, L.; Li, Q.; Zhang, H. Estimating Vehicle Turn-In Rate of Expressway Rest Areas via ETC Gantry Data—An ADPC-GMM Approach. Prome-Traffic Transp. 2024, 36, 946–957. [Google Scholar] [CrossRef]
  25. Zheng, Y.; Cheng, C.; Yu, S.; Ye, X.; Li, X.; Wang, Z. Predicting the vehicle turn-in rates of highway service area: A random forest approach. In Proceedings of the 2023 IEEE 26th International Conference on Intelligent Transportation Systems (ITSC), Bilbao, Spain, 24–28 September 2023; pp. 1349–1354. [Google Scholar]
  26. Shen, X.; Wang, L.; Liu, H.; Yang, J. Estimation of the Percentage of Mainline Traffic Entering Rest Area Based on Bp Neural Network. J. Appl. Sci. 2013, 13, 2632–2638. [Google Scholar] [CrossRef]
  27. Shen, X.; Zhang, F.; Lv, H.; Liu, J.; Liu, H. Prediction of Entering Percentage into Expressway Service Areas Based on Wavelet Neural Networks and Genetic Algorithms. IEEE Access 2019, 7, 54562–54574. [Google Scholar] [CrossRef]
  28. Altman, N.S. An Introduction to Kernel and Nearest-Neighbor Nonparametric Regression. Am. Stat. 1992, 46, 175–185. [Google Scholar] [CrossRef]
  29. Cortes, C.; Vapnik, V. Support-vector networks. Mach. Learn. 1995, 20, 273–297. [Google Scholar] [CrossRef]
  30. Zhang, H. The optimality of naive Bayes. In Proceedings of the International Florida Artificial Intelligence Research Society Conference, FLAIRS, Sandestin Beach, FL, USA, 19 May 2024; pp. 562–567. [Google Scholar]
  31. OpenStreetMap Project. Available online: https://www.openstreetmap.org/ (accessed on 20 April 2025).
  32. Biedrońska, J. (Ed.) Projektowanie Obiektów Motoryzacyjnych; Wyd. 2. in Monografia/[Politechnika Śląska], no. 262; Wydawnictwo Politechniki Śląskiej: Gliwice, Poland, 2010. [Google Scholar]
  33. Moore, D.S.; McCabe, G.P.; Craig, B.A. Introduction to the Practice Of Statistics, 9th ed.; Freeman, W.H., Ed.; Macmillan Learning: New York, NY, USA, 2017. [Google Scholar]
  34. Field, A.P. Discovering Statistics Using IBM SPSS Statistics: And Sex and Drugs and Rock ‘n’ roll, 4th ed.; Sage: Los Angeles, CA, USA, 2013. [Google Scholar]
  35. McKinney, W. Python for Data Analysis: Data Wrangling with Pandas, NumPy, and Jupyter, 3rd ed.; O’Reilly: Beijing, China, 2022. [Google Scholar]
  36. Kelleher, J.D.; Tierney, B. Data science. In the MIT Press Essential Knowledge Series; The MIT Press: Cambridge, MA, USA; London, UK, 2018. [Google Scholar]
  37. McKinney, W. Data Structures for Statistical Computing in Python. In Proceedings of the 9th Python in Science Conference, Austin, TX, USA, 28 June–3 July 2010; pp. 56–61. [Google Scholar] [CrossRef]
  38. Hunter, J.D. Matplotlib: A 2D Graphics Environment. Comput. Sci. Eng. 2007, 9, 90–95. [Google Scholar] [CrossRef]
  39. Pedregosa, F.; Varoquaux, G.; Gramfort, A.; Michel, V.; Thirion, B.; Grisel, O.; Blondel, M.; Müller, A.; Nothman, J.; Louppe, G.; et al. Scikit-learn: Machine Learning in Python. arxiv 2011, arXiv:1201.0490. [Google Scholar] [CrossRef]
  40. Chen, T.; Guestrin, C. XGBoost: A Scalable Tree Boosting System. In Proceedings of the 22nd ACM SIGKDD International Conference on Knowledge Discovery and Data Mining, San Francisco, CA, USA, 13–17 August 2016; ACM: New York, NY, USA; pp. 785–794. [Google Scholar] [CrossRef]
  41. Thomas, K.; Benjain, R.-K.; Fernando, P.; Brian, G.; Matthias, B.; Jonathan, F.; Kyle, K.; Jessica, H.; Jason, G.; Sylvain, C.; et al. Jupyter Notebooks—A Publishing Format for Reproducible Computational Workflows; International Conference on Electronic Publishing: Göttingen, Germany, 2016; Available online: https://api.semanticscholar.org/CorpusID:36928206 (accessed on 14 April 2025).
  42. VanderPlas, J. Python Data Science Handbook: Essential Tools for Working with Data, 1st ed.; O’Reilly: Beijing, China; Boston, MA, USA; Farnham, UK; Sebastopol, CA, USA; Tokyo, Japan, 2016. [Google Scholar]
  43. Rokach, L.; Maimon, O. Data Mining with Decision Trees: Theory and Applications, 2nd ed.; In Series in Machine Perception and Artificial Intelligence; World Scientific: Singapore, 2014; Volume 81. [Google Scholar] [CrossRef]
  44. Breiman, L. Random Forests. Mach. Learn. 2001, 45, 5–32. [Google Scholar] [CrossRef]
  45. Friedman, J.H. Greedy function approximation: A gradient boosting machine. Ann. Stat. 2001, 29, 1189–1232. [Google Scholar] [CrossRef]
  46. Hosmer, D.W.; Lemeshow, S.; Sturdivant, R.X. Applied Logistic Regression, 1st ed.; In Wiley Series in Probability and Statistics; Wiley: Hoboken, NJ, USA, 2013. [Google Scholar] [CrossRef]
  47. Powers, D.M.W. Evaluation: From precision, recall and F-measure to ROC, informedness, markedness and correlation. arxiv 2020, arXiv:2010.16061. [Google Scholar] [CrossRef]
  48. Lundberg, S.M.; Lee, S.-I. A unified approach to interpreting model predictions. In Proceedings of the 31st International Conference on Neural Information Processing Systems, Long Beach, CA, USA, 4–9 December 2017; in NIPS’17. Curran Associates Inc.: Red Hook, NY, USA, 2017; pp. 4768–4777. [Google Scholar]
  49. Ribeiro, M.T.; Singh, S.; Guestrin, C. “Why Should I Trust You?”: Explaining the Predictions of Any Classifier. arXiv 2016, arXiv:1602.04938. [Google Scholar] [CrossRef]
  50. Al-Kaisy, A.; Kirkemo, Z.; Veneziano, D.; Dorrington, C. Traffic Use of Rest Areas on Rural Highways: Recent Empirical Study. Transp. Res. Rec. J. Transp. Res. Board 2011, 2255, 146–155. [Google Scholar] [CrossRef]
  51. Tanaka, S.; Ohno, S.; Nakamura, F. Analysis on drivers’ parking lot choice behaviors in expressway rest area. Transp. Res. Procedia 2017, 25, 1342–1351. [Google Scholar] [CrossRef]
  52. Zhang, Y.; Pan, Z.; Zhu, F.; Shi, C.; Yang, X. Quantitative Estimation and Analysis of Spatiotemporal Delay Effects in Expressway Traffic Accidents. ISPRS Int. J. Geo-Inf. 2024, 13, 407. [Google Scholar] [CrossRef]
  53. Ji, W.; Wang, Y.; Zhuang, D.; Song, D.; Shen, X.; Wang, W.; Li, G. Spatial and temporal distribution of expressway and its relationships to land cover and population: A case study of Beijing, China. Transp. Res. Part Transp. Environ. 2014, 32, 86–96. [Google Scholar] [CrossRef]
  54. Gutmann, S.; Maget, C.; Spangler, M.; Bogenberger, K. Truck Parking Occupancy Prediction: XGBoost-LSTM Model Fusion. Front. Future Transp. 2021, 2, 693708. [Google Scholar] [CrossRef]
  55. Channamallu, S.S.; Kermanshachi, S.; Rosenberger, J.M.; Pamidimukkala, A. Parking occupancy prediction and analysis—A comprehensive study. Transp. Res. Procedia 2023, 73, 297–304. [Google Scholar] [CrossRef]
Figure 1. Highway rest areas in Poland with geographical area of analysis in southern part (red circles). Source: own research based on [31].
Infrastructures 10 00151 g001
Figure 2. Recommended distances between individual categories of HRAs. Source: own research based on [32].
Infrastructures 10 00151 g002
Figure 3. Recommended scheme for shaping the communication system and the arrangement of facilities included in the HRA. Adapted from [32].
Infrastructures 10 00151 g003
Figure 4. Spatial development plan of an exemplary Polish HRA (Żarska Wieś), including the layout of individual facilities. Source: Adapted from [31].
Infrastructures 10 00151 g004
Figure 5. Overall occupancy level distribution of HRAs.
Infrastructures 10 00151 g005
Figure 6. Hourly occupancy trends.
Infrastructures 10 00151 g006
Figure 7. Percentage occupancy by region.
Infrastructures 10 00151 g007
Figure 8. Map showing the geographic coordinates of HRAs and the number of associated parking lots.
Infrastructures 10 00151 g008
Figure 9. Percentage distribution of occupancy levels by facility.
Infrastructures 10 00151 g009
Figure 10. Average occupancy level for rest areas with and without each feature.
Infrastructures 10 00151 g010
Figure 11. Weighted F1-score comparison across models (5-fold CV).
Infrastructures 10 00151 g011
Figure 12. Prediction accuracy of the gradient boosting model by rest area and traffic direction.
Infrastructures 10 00151 g012
Figure 13. Hourly prediction accuracy.
Infrastructures 10 00151 g013
Figure 14. F1-score per occupancy class by model.
Infrastructures 10 00151 g014
Figure 15. Feature importance.
Infrastructures 10 00151 g015
Figure 16. SHAP summary plot of feature impact for the low occupancy class.
Infrastructures 10 00151 g016
Figure 17. SHAP summary plot of feature impact for the medium occupancy class.
Infrastructures 10 00151 g017
Figure 18. SHAP summary plot of feature impact for the high occupancy class.
Infrastructures 10 00151 g018
Table 1. Characteristics of facilities for individual classes of HRAs (+ exists, - does not exist).
Type of FacilityHRA Class IHRA Class IIHRA Class II
Area Surfaceup to 1.5 ha1.5–3.0 ha3.0–4.5 ha
Parking spaces for passenger cars+++
Parking spaces for trucks+++
Sanitary facilities+++
Water collection point+++
Pedestrian bridge for car inspection+++
Fuel station-++
Catering services (fast-food)-++
Service station--+
Catering services (restaurant)--+
Accommodation services--+
Table 2. Characteristics of truck parking occupancy categories.
CharacteristicLow Occupancy (L)Moderate Occupancy (M)Full Occupancy (F)
DefinitionA small percentage of the parking spaces are currently occupiedA significant portion of the parking lot is in use, but spaces are still availableMost or all of the parking spaces are occupied
Estimated
occupancy
0–30% filled (approximate range, may vary slightly)31–70% filled71–100% filled
Driver
implication
  • High chance of finding available space
  • Ideal time to plan a rest or stop
  • Spaces are available, but may start to fill up
  • Suggestion to consider stopping soon, especially during peak hours
  • High risk of no available space
  • Drivers may need to seek alternative parking areas
App
visualization
Shown in green to indicate availabilityMarked in yellow or orange to signal cautionShown in red, indicating unavailability
Disclaimer/Publisher’s Note: The statements, opinions and data contained in all publications are solely those of the individual author(s) and contributor(s) and not of MDPI and/or the editor(s). MDPI and/or the editor(s) disclaim responsibility for any injury to people or property resulting from any ideas, methods, instructions or products referred to in the content.

