1. Introduction
1.1. Background
Inspections of concrete infrastructure are frequently carried out in low-light environments, such as the interior of containment tanks and underground facilities, or during night-time assessments of bridges and transportation structures. These lighting conditions are often not optional but are dictated by operational constraints. For example, bridge inspections are commonly scheduled at night to avoid disrupting daytime traffic and to reduce safety risks for both inspectors and road users. In such cases, inspectors rely on portable lighting devices such as handheld flashlights or temporary work lamps. However, these light sources often produce uneven illumination, glare, and shadows, which significantly hinder visibility and make reliable defect detection more difficult and time-consuming.
Even during daylight, ambient-illumination-source inspections, lighting conditions are rarely uniform. Shadows cast by structural elements, environmental glare, and variable ambient lighting can distort visual perception and affect human judgment. These inconsistencies increase the chance of missed or misidentified defects, especially when identifying small defects. Overall, variability in both natural and artificial lighting conditions makes reliable and repeatable visual inspections challenging.
Among the most critical defects to identify in such inspections is cracking, characterised by a physical separation in the concrete, typically visible from the surface. Cracking can form due to environmental or physical factors and often serves as an early signal for structural deterioration. Many design codes classify cracks wider than 0.1 mm as defects, highlighting the importance of thin crack identification to ensure structural safety [
1]. Visual inspections, where a human inspector manually looks for defects with their own eyes, are common due to their simplicity and ease of understanding. However, while effective, manual visual inspections can present a risk to human life and produce inconsistent results between inspectors [
2,
3].
1.2. Automated Crack Segmentation
Automated and remote visual inspection data capture can mitigate the safety issues associated with manual inspections. However, automated capture presents vast quantities of data for human review; computer vision analysis offers a solution by automatically detecting defects in images. This analysis broadly falls into two categories: conventional image processing (white-box) and neural network (black-box) techniques [
4]. White-box techniques directly apply mathematical operators such as edge detectors, thresholding, and morphological operations to images. These methods are transparent but often require human expertise to choose appropriate parameter values based on the specific data. In contrast, black-box techniques, such as deep learning models, learn complex patterns directly from large training datasets without explicit feature engineering. While offering defect detection capabilities on unseen data, their internal decision-making processes are often less interpretable.
Several white-box techniques have been proposed for the segmentation of cracks. Zhu et al. [
5] introduced a modified Otsu global thresholding method that considers surrounding pixel intensity to provide noise-resistant crack segmentation. Fujita and Hammanmoto [
6] proposed an adaptive thresholding approach for crack segmentation that utilises the local neighbouring pixels of images. While thresholding techniques are effective, these methods are better suited for thicker cracks. In contrast, thin cracks are often characterised by a sharp change in pixel intensity relative to the surrounding concrete surface, making white-box edge detectors well-suited to conduct segmentation. Dorafshan et al. [
7] compared multiple edge detectors and identified that a Laplacian of a Gaussian edge detector was most suitable for detecting thin cracks, as it was the only edge detector capable of segmenting cracks as thin as 0.1 mm. Simler et al. [
8] further noted that edge detection-based segmentation is more resilient to uneven lighting compared to thresholding. Additional white-box techniques, such as digital image correlation (DIC), have been applied for both crack identification and strain measurement, although these often require dedicated illumination setups [
9].
Black-box approaches have gained popularity for concrete crack segmentation. Liu et al. [
10] successfully applied U-Net to concrete imagery, demonstrating promising results with a relatively small training set of 57 images. However, they also observed performance degradation under challenging conditions such as variable image lighting and the presence of shadows. More recent works include the Dual-Encoder Crack Segmentation Network (DECS-Net) proposed by Zhang et al. [
11]. Black-box models may have a tendency to overestimate crack widths, producing segmentations that are broader than the actual defect [
12]. This issue is often compounded by blurry or inaccurate crack boundaries in the black-box segmentation output [
13]. Nyathi et al. [
14] highlighted this problem in their crack width measurement study, where U-Net overestimated widths by up to 0.47 mm.
Dorafshan et al. [
15] compared white- and black-box crack identification approaches and found white-box techniques to be more appropriate for pixel-level segmentation and black-box techniques to be superior for image classification. Based on these findings, they produced a hybrid grey-box technique that uses black-box classification and white-box segmentation to achieve high-performance, pixel-level concrete crack segmentation. Hui et al. [
16] demonstrated a grey-box crack detection method that uses white-box image pre-processing and adaptive thresholding to enhance images of cracks under poor illumination conditions. These white-box images were then used with a black-box MobileNetV2 network to detect cracked regions in an image. While black-box methods have shown strong promise in defect identification, it is clear that white-box methods still have a place to enhance the overall effectiveness and interpretability of hybrid grey-box methods.
1.3. Scene Illumination
Many automated concrete crack segmentation works note scene illumination as being a factor for poor model performance [
17]. As such, remote inspection systems are often fitted with external illumination systems, particularly for structures where illumination is poor, such as tunnels, pipes, and containment structures. For example, Hajjaj and Khalid [
18] employed Light-Emitting Diodes (LEDs) inside pipes in the oil and gas sector, where no ambient light is present. Similarly, Yangí et al. [
19] developed a wall-climbing robot for concrete inspection that includes LEDs to compensate when ambient light is insufficient. In both cases, the LEDs serve only to provide enough light for proper image exposure without any additional lighting strategies. This approach of using lighting purely to illuminate the scene and ensure well-exposed images is common among autonomous inspection systems in civil infrastructure, as also demonstrated in [
20,
21,
22].
Cho et al. [
23] demonstrated the significant impact of lighting on human-based crack measurement. Their outdoor study revealed that night-time illumination (13 lx) produced sharper crack boundaries compared to daytime sunlight (52,000 lx), with crack width measurements differing by an average of 1.24 mm. Indoors, they found that a lower lighting angle for scene illumination enhanced crack shadow contrast. This work underscores how varying lighting conditions can either improve or impede the visibility of concrete defects.
McAlorum et al. [
24] and Dow et al. [
25] showcased how “directional lighting” scene illumination could be used to enhance the automated detection of concrete defects. Directional lighting refers to the illumination of an image scene from one direction at an angle to cast shadows in present defects. However, the effect of scene illumination—specifically, directional lighting—on automated pixel-level concrete crack segmentation and whether it can improve the results have not been studied.
1.4. Overview and Research Contribution
Although prior research has explored the role of lighting conditions in surface inspection and defect-region identification, there remains a lack of investigation into how directional lighting compares to diffused lighting for pixel-level segmentation of concrete cracks. Most existing segmentation approaches rely on diffused illumination and do not assess or consider the benefits of directional lighting and its ability to enhance crack extremities.
This work directly addresses this gap through a comparison of diffused and directional lighting for concrete crack segmentation. Our key contributions are listed as follows:
A pixel-level crack segmentation algorithm that utilises multiple images of a concrete surface, each individually illuminated from different lighting directions;
A qualitative and quantitative comparison of directional lighting against diffused lighting, demonstrating that directional lighting can provide superior crack segmentation results.
Section 2 introduces the novel directional lighting crack segmentation method developed in this work.
Section 3 details the comparison made between the directional lighting approach and its diffused lighting counterparts. The results of this comparison are presented in
Section 4, followed by concluding remarks in
Section 6.
2. Directional Lighting Crack Segmentation Method
To compare directional and diffused lighting, a crack segmentation algorithm was developed using directional lighting images as inputs. Due to the lack of sufficient directional lighting images to form a training dataset, a white-box approach was chosen over a black-box deep learning model. This white-box technique prioritises interpretability and transparency, as the focus of this study is not to create a superior crack detection method but to investigate whether lighting conditions can enhance segmentation results. The proposed method, as illustrated in
Figure 1, uses multiple images of a concrete surface illuminated under different lighting conditions to highlight the extremities of any present cracks. A series of image processing techniques is used to extract the cracks in these images and combine findings.
Table 1 provides a summary of the image processing steps, with a comprehensive breakdown of each stage found in
Section 2.1,
Section 2.2,
Section 2.3,
Section 2.4,
Section 2.5,
Section 2.6 and
Section 2.7. The headings in
Table 1 correspond to the detailed descriptions to aid in reader cross-referencing.
2.1. Image Capture and Pre-Processing
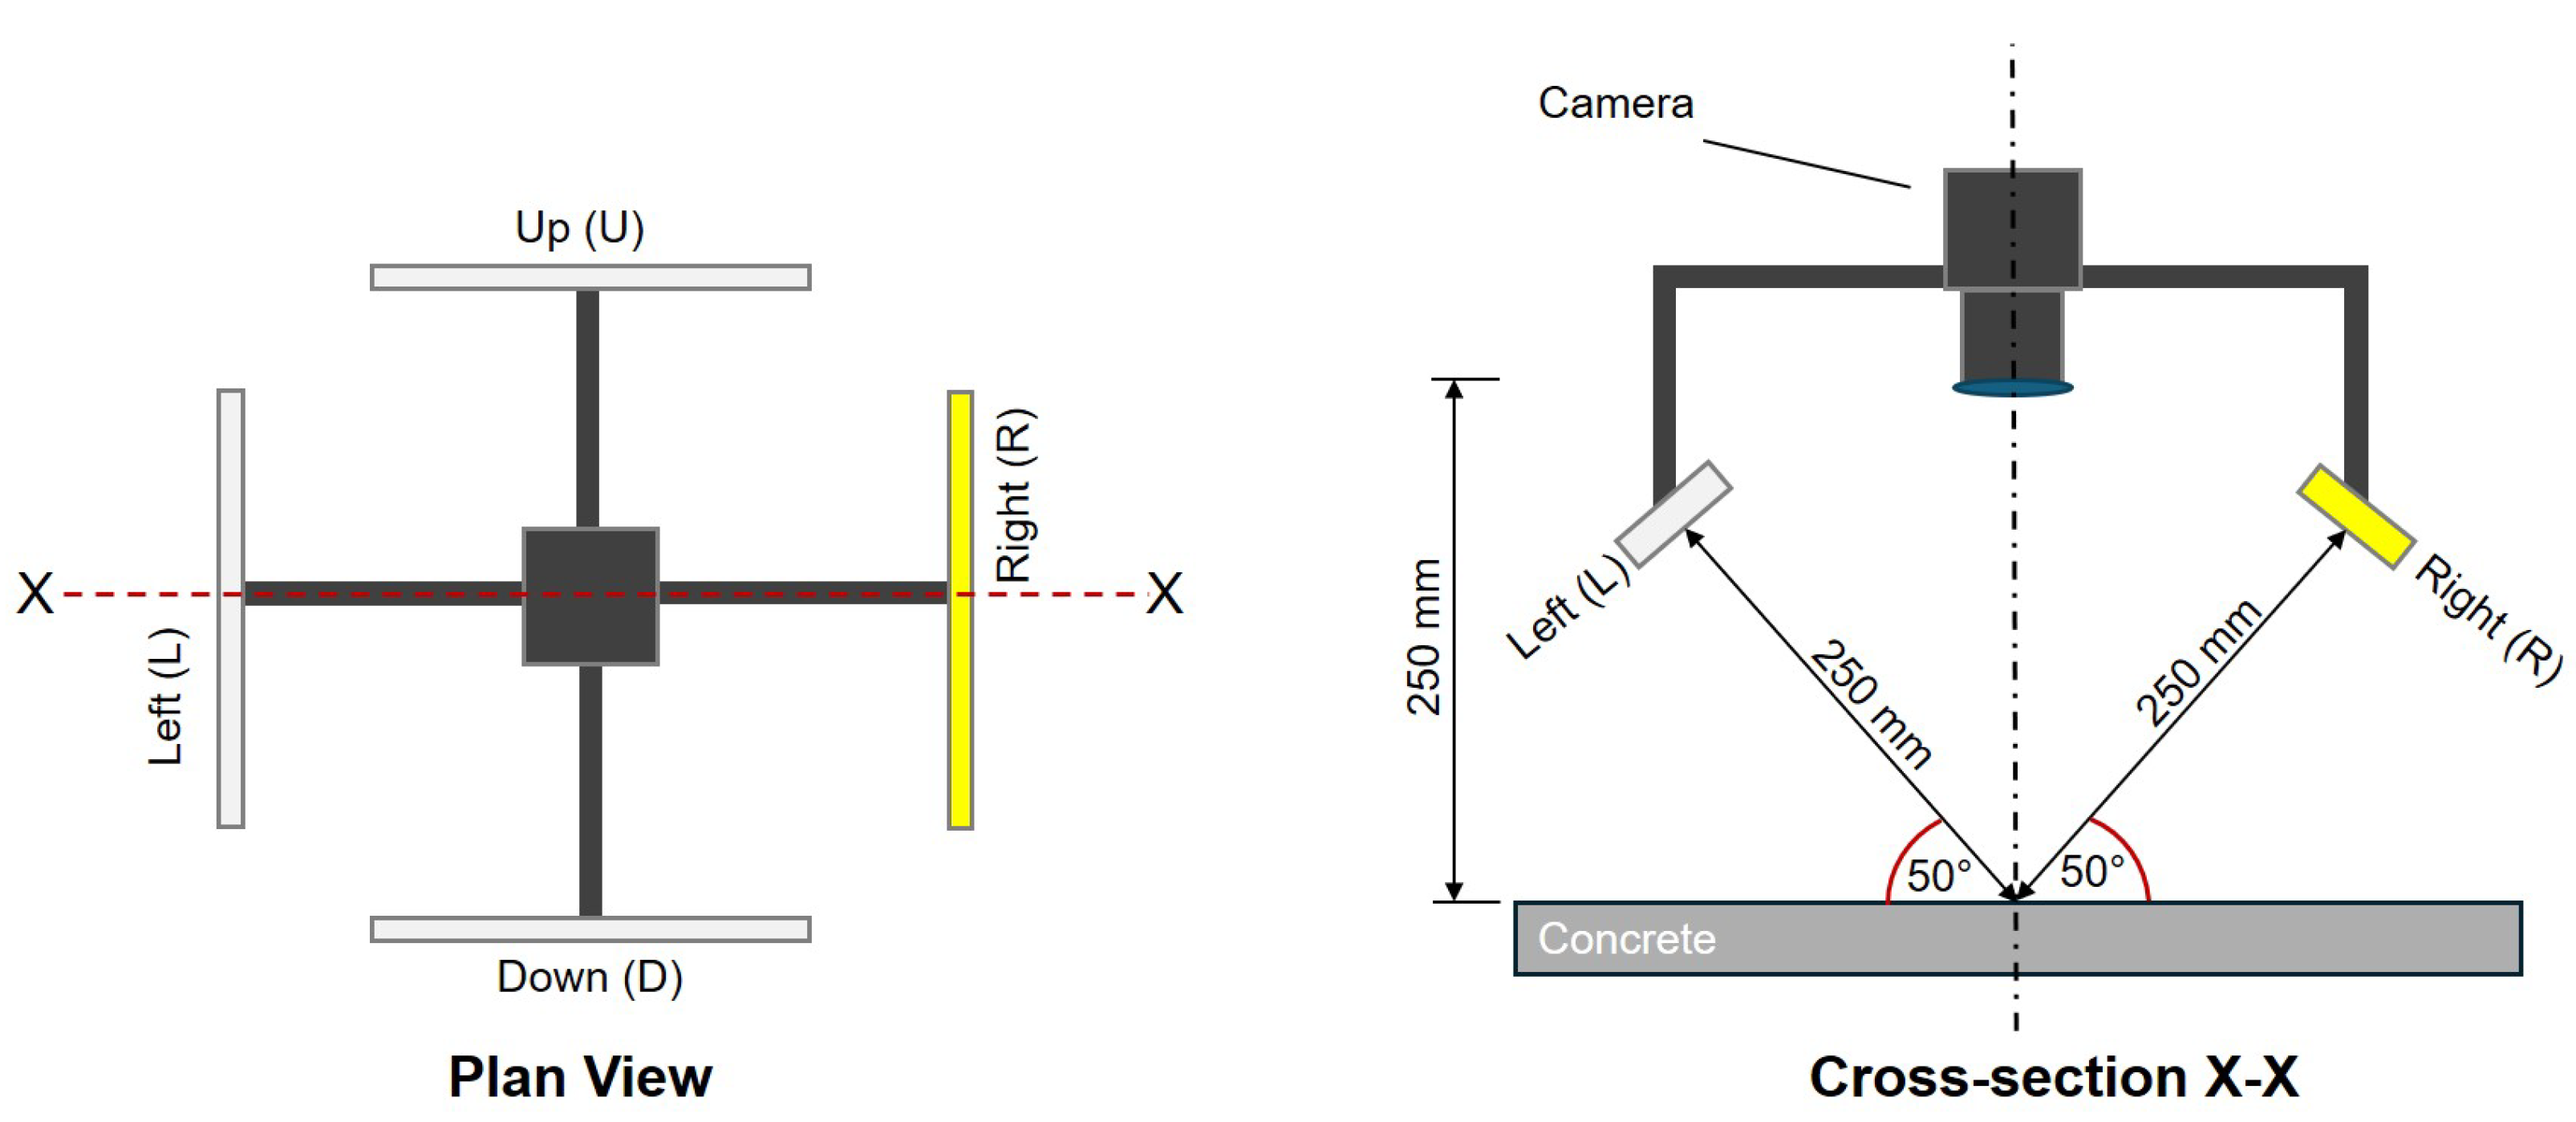
Directional lighting images are used as inputs to the crack segmentation algorithm. To capture these images, a fixed-position camera is mounted 250 mm from the concrete surface. Surrounding the camera are four identical LED strips, each placed 250 mm from the surface at a 50-degree angle of incidence. The lights are arranged to cast illumination from four directions: Right (R), Left (L), Down (D), and Up (U). This setup is designed to intentionally cast shadows within surface cracks and enhance their visibility and extremities against the concrete surface.
Figure 2 illustrates the configuration of lighting and camera position, while the shadow-enhancement effect is depicted in the cross-sectional views in
Figure 3.
Using the hardware, five images of the concrete surface are captured. Four images are illuminated with single-directional lighting from the R, L, D, and U directions of the image frame to capture the extremities of the crack. A fifth image with diffused lighting (A), where all lighting directions are on, is also captured.
Figure 4 shows an example of one full image set. The image processing techniques described in
Section 2.2,
Section 2.3 and
Section 2.4 are individually applied to each directional lighting image to create a binary image of the crack.
In this work, image capture is performed using the ALICS system, as proposed in [
24]. Specific camera and lighting configurations of the ALICS setup used for data collection are described in
Section 3.1.
2.2. Directional Lighting Contrast Enhancement
All directional lighting images are multiplied by the diffused lighting image to darken the captured shadows and increase the contrast between cracks and the surface. For each RGB channel, the intensity of each directional image pixel is multiplied by the intensity of the corresponding diffused lighting pixel . The resulting image is then scaled by dividing each RGB channel by 255.
This produces four enhanced contrast images (R × A, L × A, U × A, and D × A). Each image is then converted from RGB to greyscale for further image processing. Unit8 format is used, with each image having one channel of pixel intensities ranging from 0 (black) to 255 (white).
2.3. Noise Reduction
Similar to [
26,
27], anisotropic diffusion is used to reduce noise in each image; this is a non-destructive blurring method that does not blur edges in images. The edges (cracks) in each image are preserved, while the concrete surface is blurred. The authors og [
28] showed how modifications to this technique can improve crack detection results; however, for repeatability and simplicity, the widely used Perona–Malik diffusion [
29] is used in this algorithm. The following parameters were chosen: number of iterations = 6, delta t = 0.1, and kappa = 100.
2.4. Edge Detection
A Laplacian filter is applied to highlight cracks in each image; Dorafshan et al. [
15] concluded that this method is one of the most effective edge detectors for thin crack detection. Each Laplacian image (
) is created by convolving a Laplacian kernel and each enhanced contrast image. The following 3 × 3 Laplacian kernel is used in this work:
2.5. Edge Enhancement and Thresholding for Crack Segmentation
To improve edge visibility, the edges in each Laplacian image are enhanced using a method proposed by Dorafshan et al. [
7]. First
is normalised to create
, where
, using Equation (
1).
An edge enhancement process is applied to
, resulting in
. The edge enhancement equation (Equation (
2)) is used, where
and
denote the average and standard deviation of the pixel intensities in
, respectively.
Each enhanced edge image (
) is then binarised using a global threshold (
). This threshold is calculated according to Equation (
3), as proposed by Dorafshan et al. [
7], where
is defined based on the mean pixel intensity (
) and the standard deviation (
).
Strong edges, which represent cracks, are identified as pixels with intensities above and are assigned a value of 1. Weaker edges below this threshold are classified as uncracked, with a value of 0. This segments the image into binary cracked (1) and uncracked (0) pixels.
2.6. Image Combination
The thresholded edge images for each lighting direction are combined into a single image by normalising the sum of all binary values. As shown in
Figure 1, this creates an image where a pixel
has a value of 1 if
has a binary value of 1 in all input images. Similarly, a pixel
has a value of 0.5 if
has a binary value of 1 in two of the four input images. If
has a binary value of 0 in all input images,
in the output image has a value of 0. The resulting image from the image-summing operation highlights the extremities of cracks in the image under every lighting direction; values ranging from 0 to 1 indicate how confident the algorithm is that a given pixel represents a crack.
2.7. Image Blocking and Noise Removal
The image-summing operation results in aggregated noise from all inputs. To conduct noise removal, the combined image from
Section 2.6 is first “blocked” into 224 × 224 pixel sub-images that correspond to the ground truths. To remove noise, a modified version of the Skele–Marker algorithm proposed in [
30] is used. Isolated areas of noise are removed by analysing the maximum segmentation confidence in a connected component group.
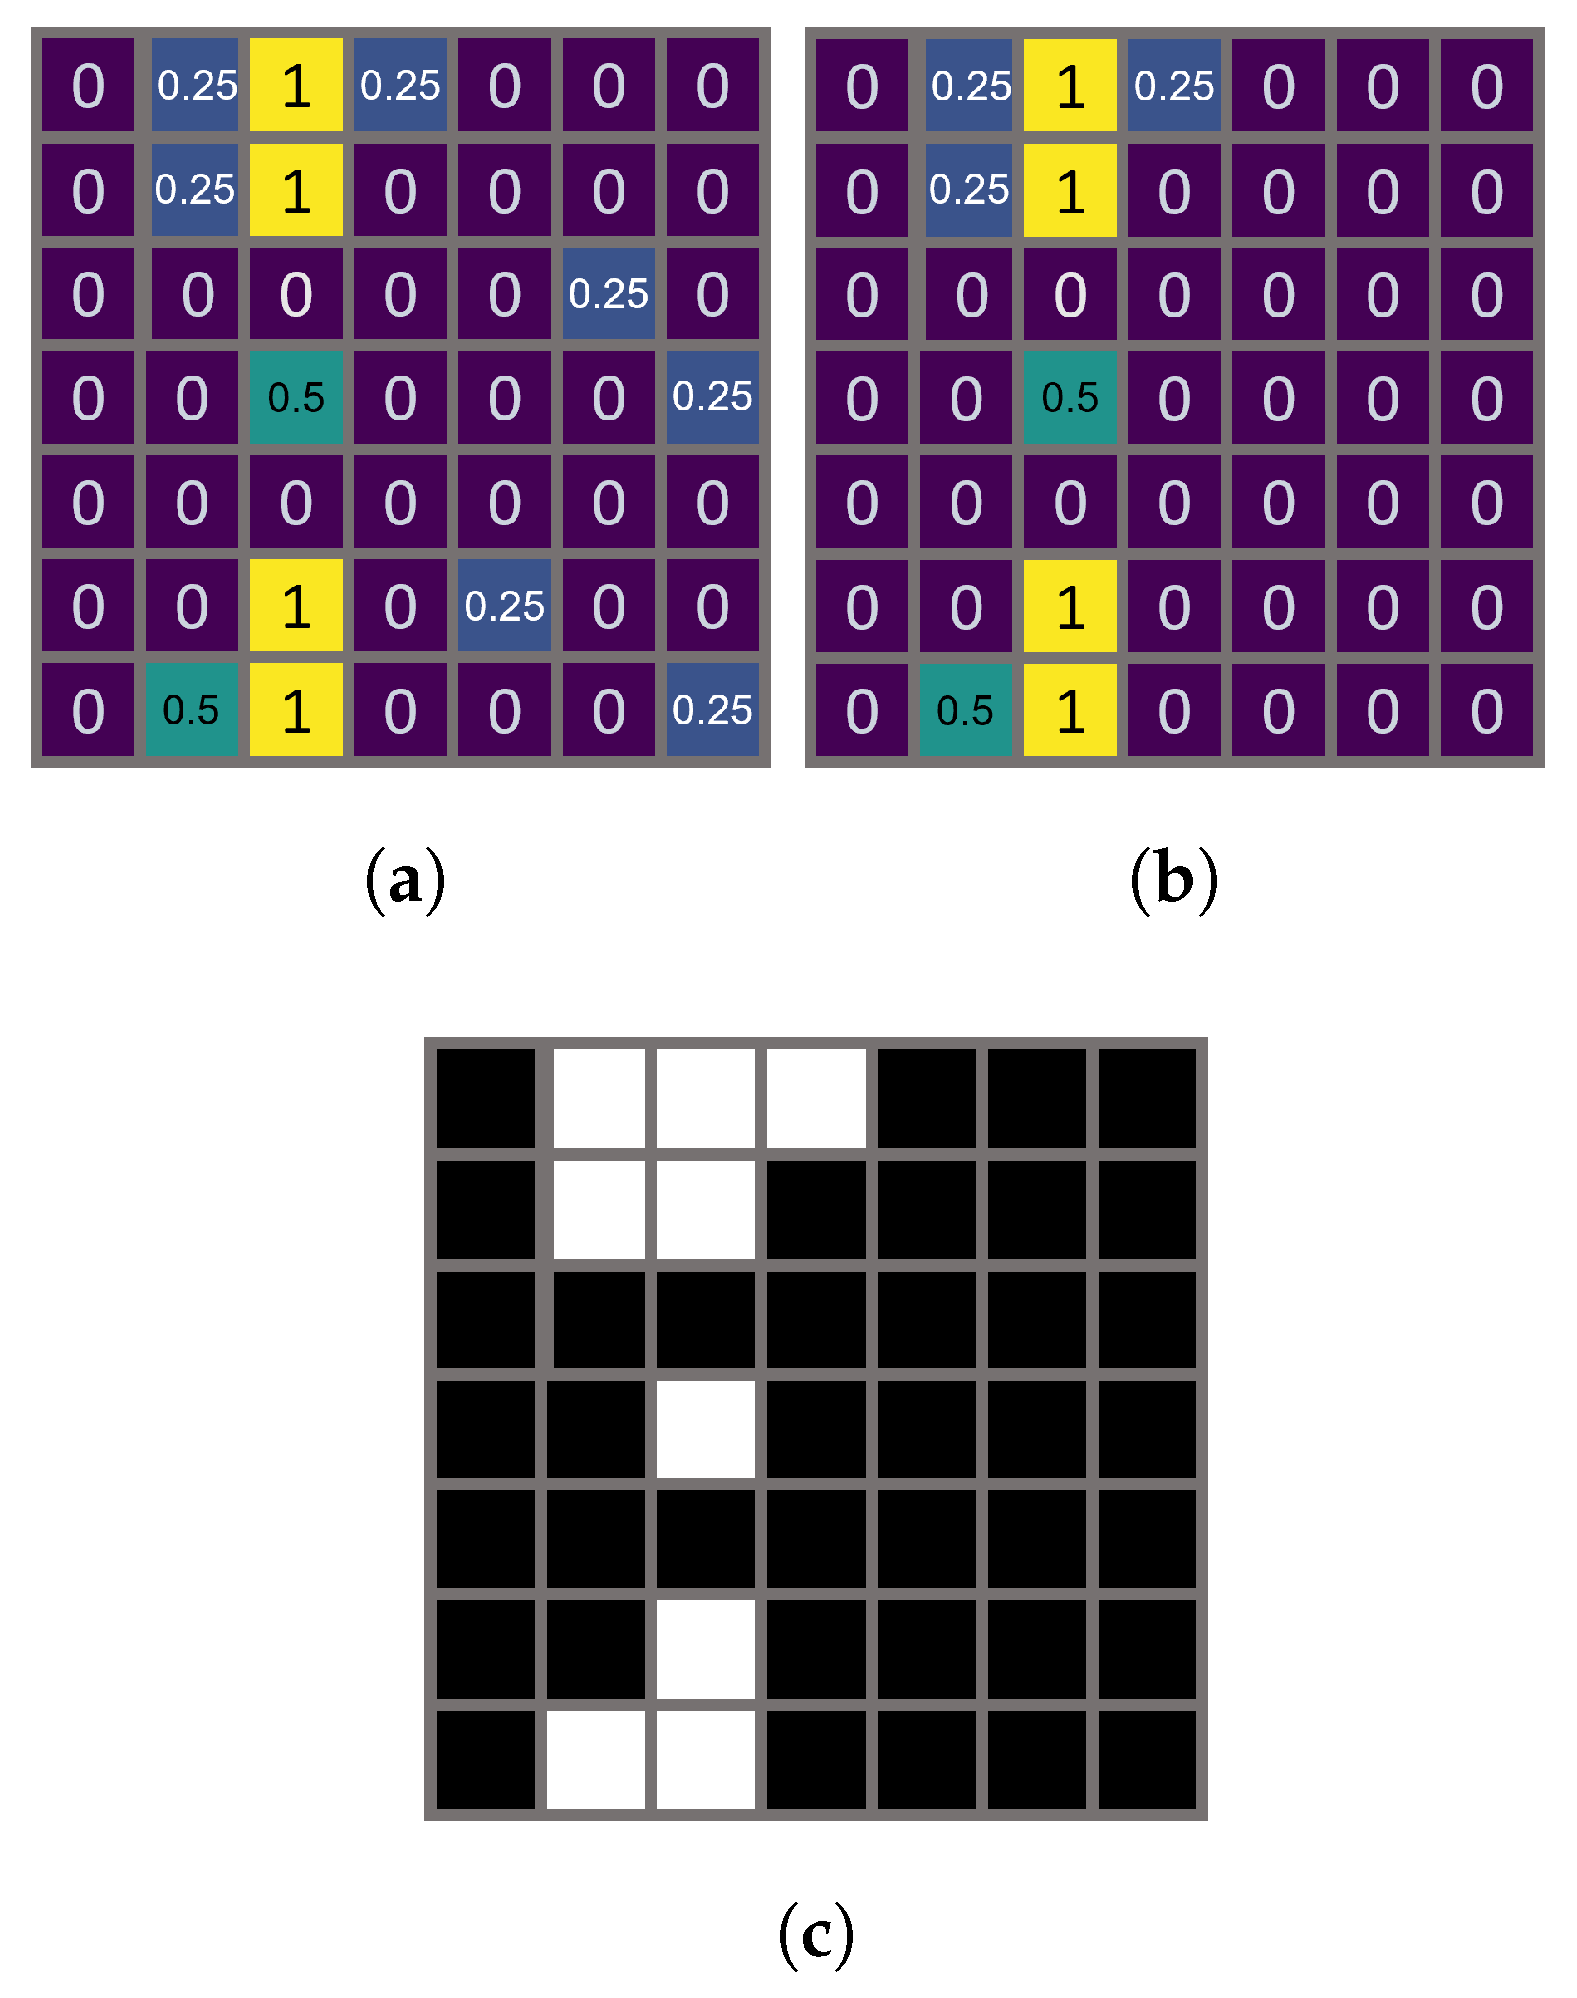
Figure 5 shows an indicative example of the process on a fictional 10 × 10 pixel sub-image. The connected components in the image are found using eight-neighbour connectivity. If the maximum confidence value of a group of connected components is 0.25, it is labelled as noise and removed; this leaves an image that shows pixel groups with highly confident pixels and low-confidence extremities (
Figure 5b). Following this, the Skele–Marker algorithm is used, with a length threshold of
= 55 pixels and a radius threshold of
= 8 pixels. The Skele–Marker area threshold stage is not applied, as it is replaced by the earlier confidence removal. The resulting binary image (
Figure 5c) shows the low-confidence extremities of highly confident pixel groups.
3. Methodology
This paper benchmarks the performance of directional and diffused lighting methods for concrete crack segmentation. To achieve this, the methodology consists of the following components:
Image acquisition and dataset formation;
Ground-truth definition and crack width classification;
Description of diffused lighting methodologies; and
Definition of benchmarking metrics.
3.1. Image Acquisition and Dataset Formation
The directional and diffused lighting datasets were captured using the ALICS system. The camera configuration is detailed in
Table 2. The system’s illumination sources consisted of 300 mm long, high-density APA102C LED strips, each containing 44 RGB LEDs. To produce white light, all LEDs were configured with equal RGB intensity values (red = green = blue = 255). The resulting mixed white light exhibited a broad spectral profile, with peak wavelengths at approximately 630 nm (red), 525 nm (green), and 465 nm (blue). The luminous flux of each 300 mm strip was approximately 400 lumens.
The datasets were created from two large slabs of defective laboratory concrete. The cracks in these slabs typically ranged in width from 0.07 mm to 0.4 mm. The slabs were partially stained with oil and dirt and featured a rough surface texture to simulate real-world concrete structures.
Images were taken of various sections of the slabs, with each image initially covering a field of view of approximately 402 × 269 mm after distortion corrections. To ensure sharpness and reduce edge blurring, the captured images were centrally cropped to a 1:1 aspect ratio, resulting in a final size of 269 × 269 mm. These images had a resolution of 3458 × 3458 pixels, with one image pixel corresponding to approximately 0.07 mm.
The images were acquired in a dark laboratory environment (illuminance of 0.2 lx) to simulate the conditions of a structure that requires external illumination. A total of ten image scenes were captured, with each scene consisting of five individual images taken from a fixed camera position. For each image in the scene, five different lighting configurations were captured: R, L, U, D, and A (as outlined in
Figure 4).
For each image scene, the UDLRA images formed the directional lighting dataset sample, while the A image made up the corresponding diffused lighting dataset sample.
3.2. Ground-Truth Definition
Ground-truth annotations for each image scene were manually generated using the tracing method described in the methodology of [
30]. As the camera position remained fixed across different lighting conditions, a single ground truth was applied to all directional lighting images within a scene. These ground-truth annotations were then cropped into 224 × 224 sub-images to match the output of the image blocking and noise removal process (see
Section 2.6). In total, 2250 ground-truth sub-images were created, of which 445 contained cracks. This resulted in two datasets:
The entire dataset, consisting of 2250 images, 445 of which are cracked and 1805 of which are uncracked;
The positive dataset, consisting of 445 images, all of which are cracked.
Figure 6 showcases the distribution of widths from the entire dataset’s ground truths, measured at 5-pixel intervals using the hybrid width method proposed by Ong et al. [
31]. The histogram clearly indicates that the measured widths occur in the sub-mm range, representing thin cracks. While there are fewer occurrences at the lower end around 0.07 mm and the higher end upwards of 0.4 mm, the majority of the data clearly lie within this range.
3.3. Diffused Lighting Crack Detection
In this work, the following two diffused lighting crack detection algorithms are compared to directional lighting:
The DIFF-REG method uses an LoG kernel with dimensions of 13 × 13 and a sigma value of 2. The DIFF-ENHANCED method follows the methodology outlined in
Section 2; however, the diffused lighting image is multiplied by itself, no image-summing operation is used, and the Skele–Marker algorithm is used for noise removal.
3.4. Benchmarking Methodology
The directional lighting method outlined in
Section 2 was quantitatively compared to the diffused lighting methods. Each resulting image was compared to the corresponding ground truth to calculate the true negatives (TN), false negatives (FN), false positives (FP), and true positives (TP). The TN, FP, FN, and TP results were then aggregated for the directional and diffused methods, allowing the performance metrics in
Table 3 to be calculated.
3.5. F1 Score of Width-Based Datasets
To evaluate model performance across varying object thicknesses, the dataset was analysed by categorising samples based on their median width. For each ground-truth instance in the positive dataset, width measurements were taken at 5-pixel intervals along the crack structure using Ong et al.’s hybrid width measurement method [
31]. For each 224 × 224 sub-image ground truth, the median of these measurements was used as a representative width value for that sample under the assumption that it provides a reasonable approximation of overall thickness.
The resulting median widths were used to assign each dataset image to a predefined width bin. This classification allows for the grouping of cracks by thickness. The following bins were used:
mm;
mm;
mm;
mm.
For each width bin, all corresponding image samples were grouped. The TP, FP, FN, and TN pixel counts, obtained by comparing each algorithm’s output to the ground truth, were summed across all images within that bin. Using these aggregated values, the F1 score was computed independently for each width bin. This process was conducted separately for the three evaluated methods: directional lighting, DIFF-ENHANCED, and DIFF-REG. As a result, the computed F1 scores were grouped by both width category and method, enabling a comparative analysis of the performance of methods across varying crack widths.
4. Results
4.1. Qualitative Comparison
Figure 7 displays a magnified scene from one dataset sample under both diffused and down-directional lighting conditions. Right-directional lighting casts shadows in the crack, making it appear more pronounced in comparison to the diffused lighting counterpart. However, the directional lighting image also exhibits more noise in the background, which may lead to additional segmentation noise.
This visual improvement and extremities directly impact segmentation performance.
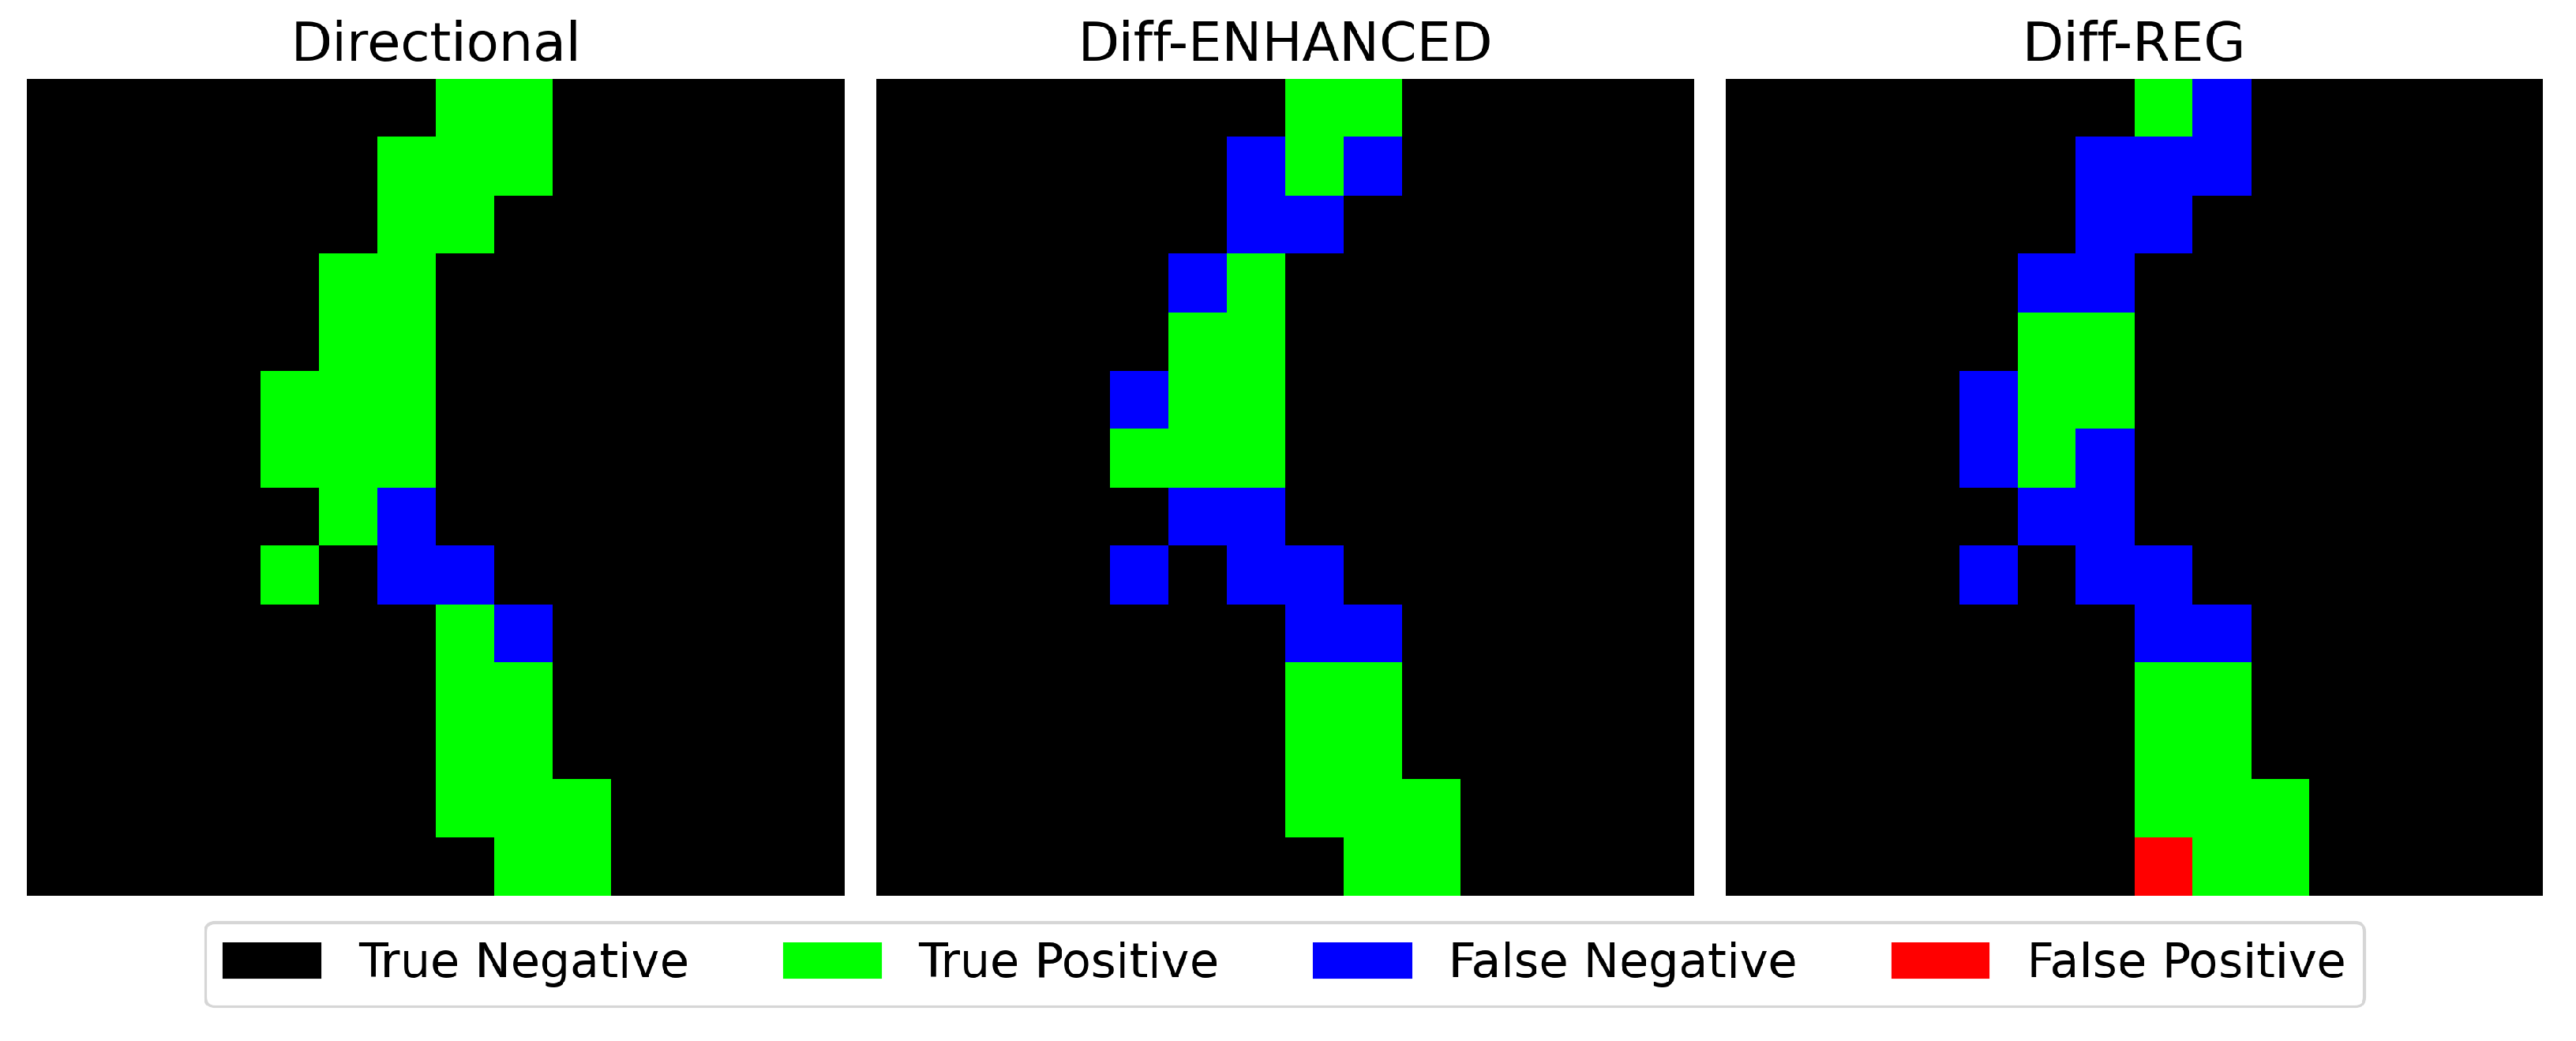
Figure 8 presents a pixel-level comparison of TN, TP, FN, and FP pixels across the three segmentation methods, evaluated on a 14 × 14 pixel crop of the same scene. Notably, the segmentation under directional lighting (created using multiple lighting directions) aligns more closely with the ground truth, demonstrating superior accuracy in segmenting the crack. In comparison to both diffused lighting methods, the segmentation output is thinner than the ground truth, resulting in a higher quantity of FN pixels.
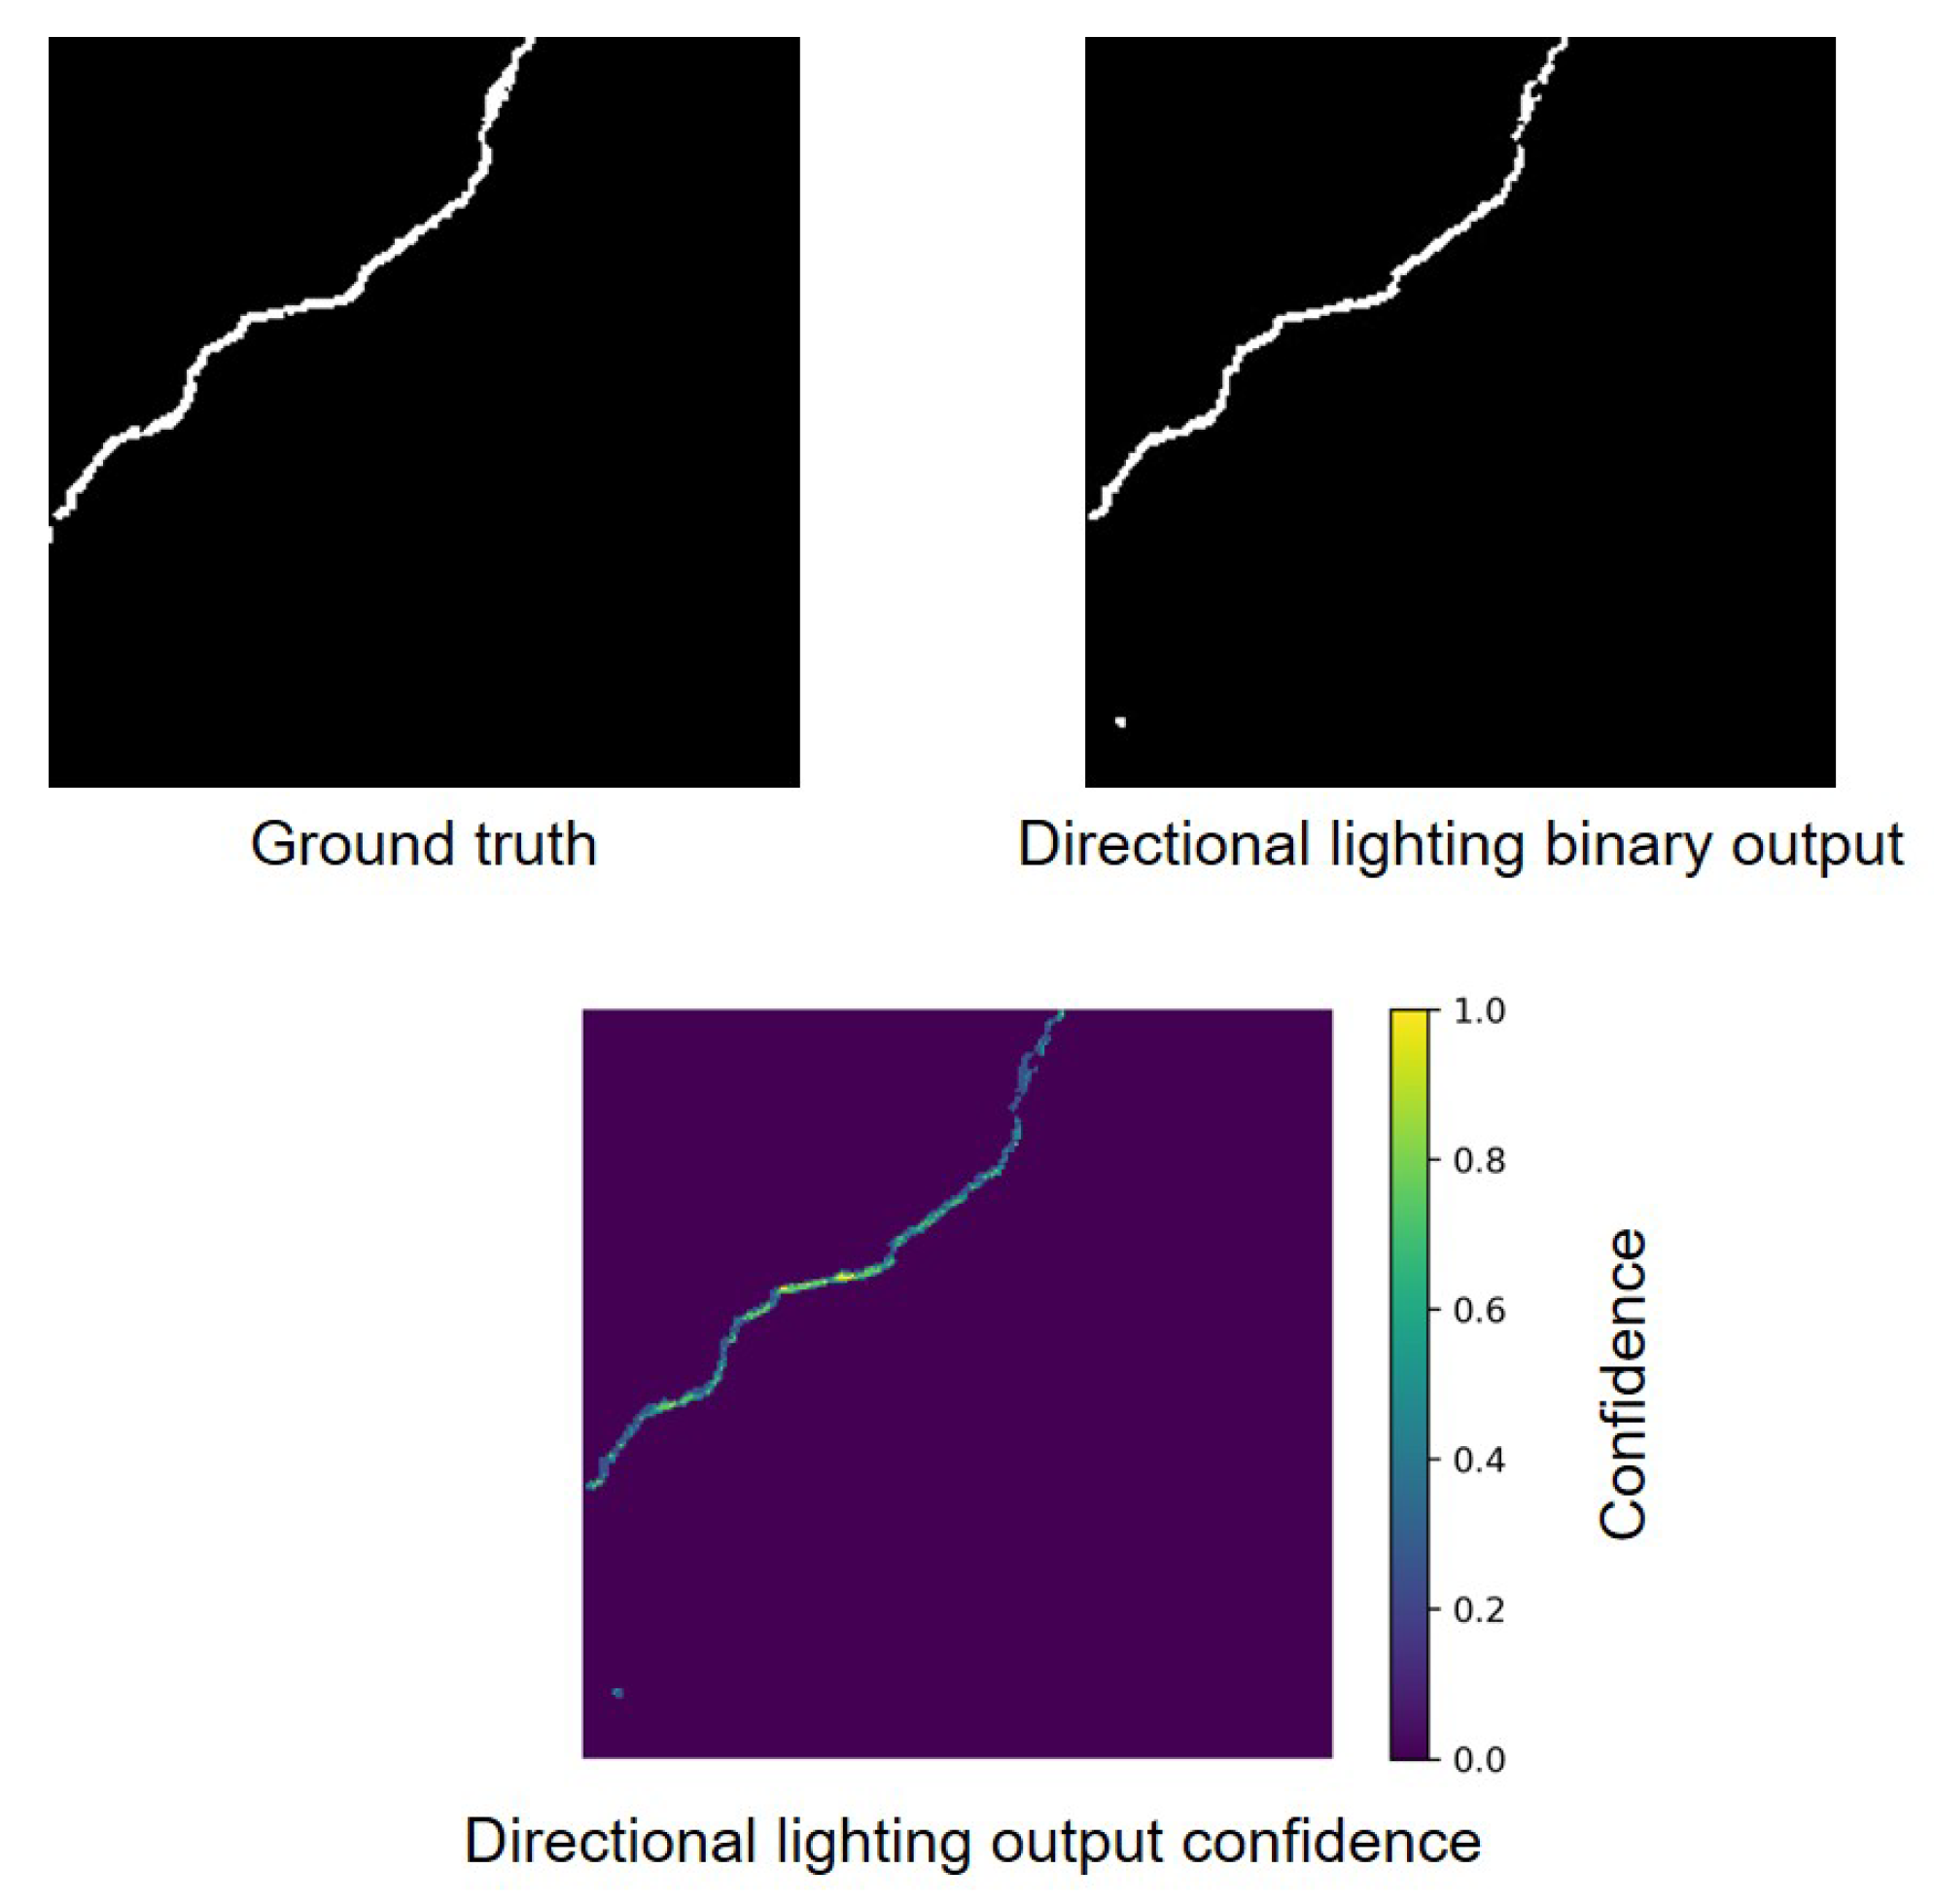
Figure 9 shows a sub-image ground truth and the typical output of the directional lighting white-box algorithm. For this sample, when compared to the ground truth, the algorithm has 49,451 TN, 41 FP, 105 FN and 579 TP. The confidence map is also displayed, where higher confidence values indicate that a pixel was recognised as cracked under multiple lighting directions. This confidence metric provides valuable insight into the reliability of each pixel’s classification, though for the purpose of quantitative evaluation, a binary segmentation map is used to maintain consistency in performance metrics.
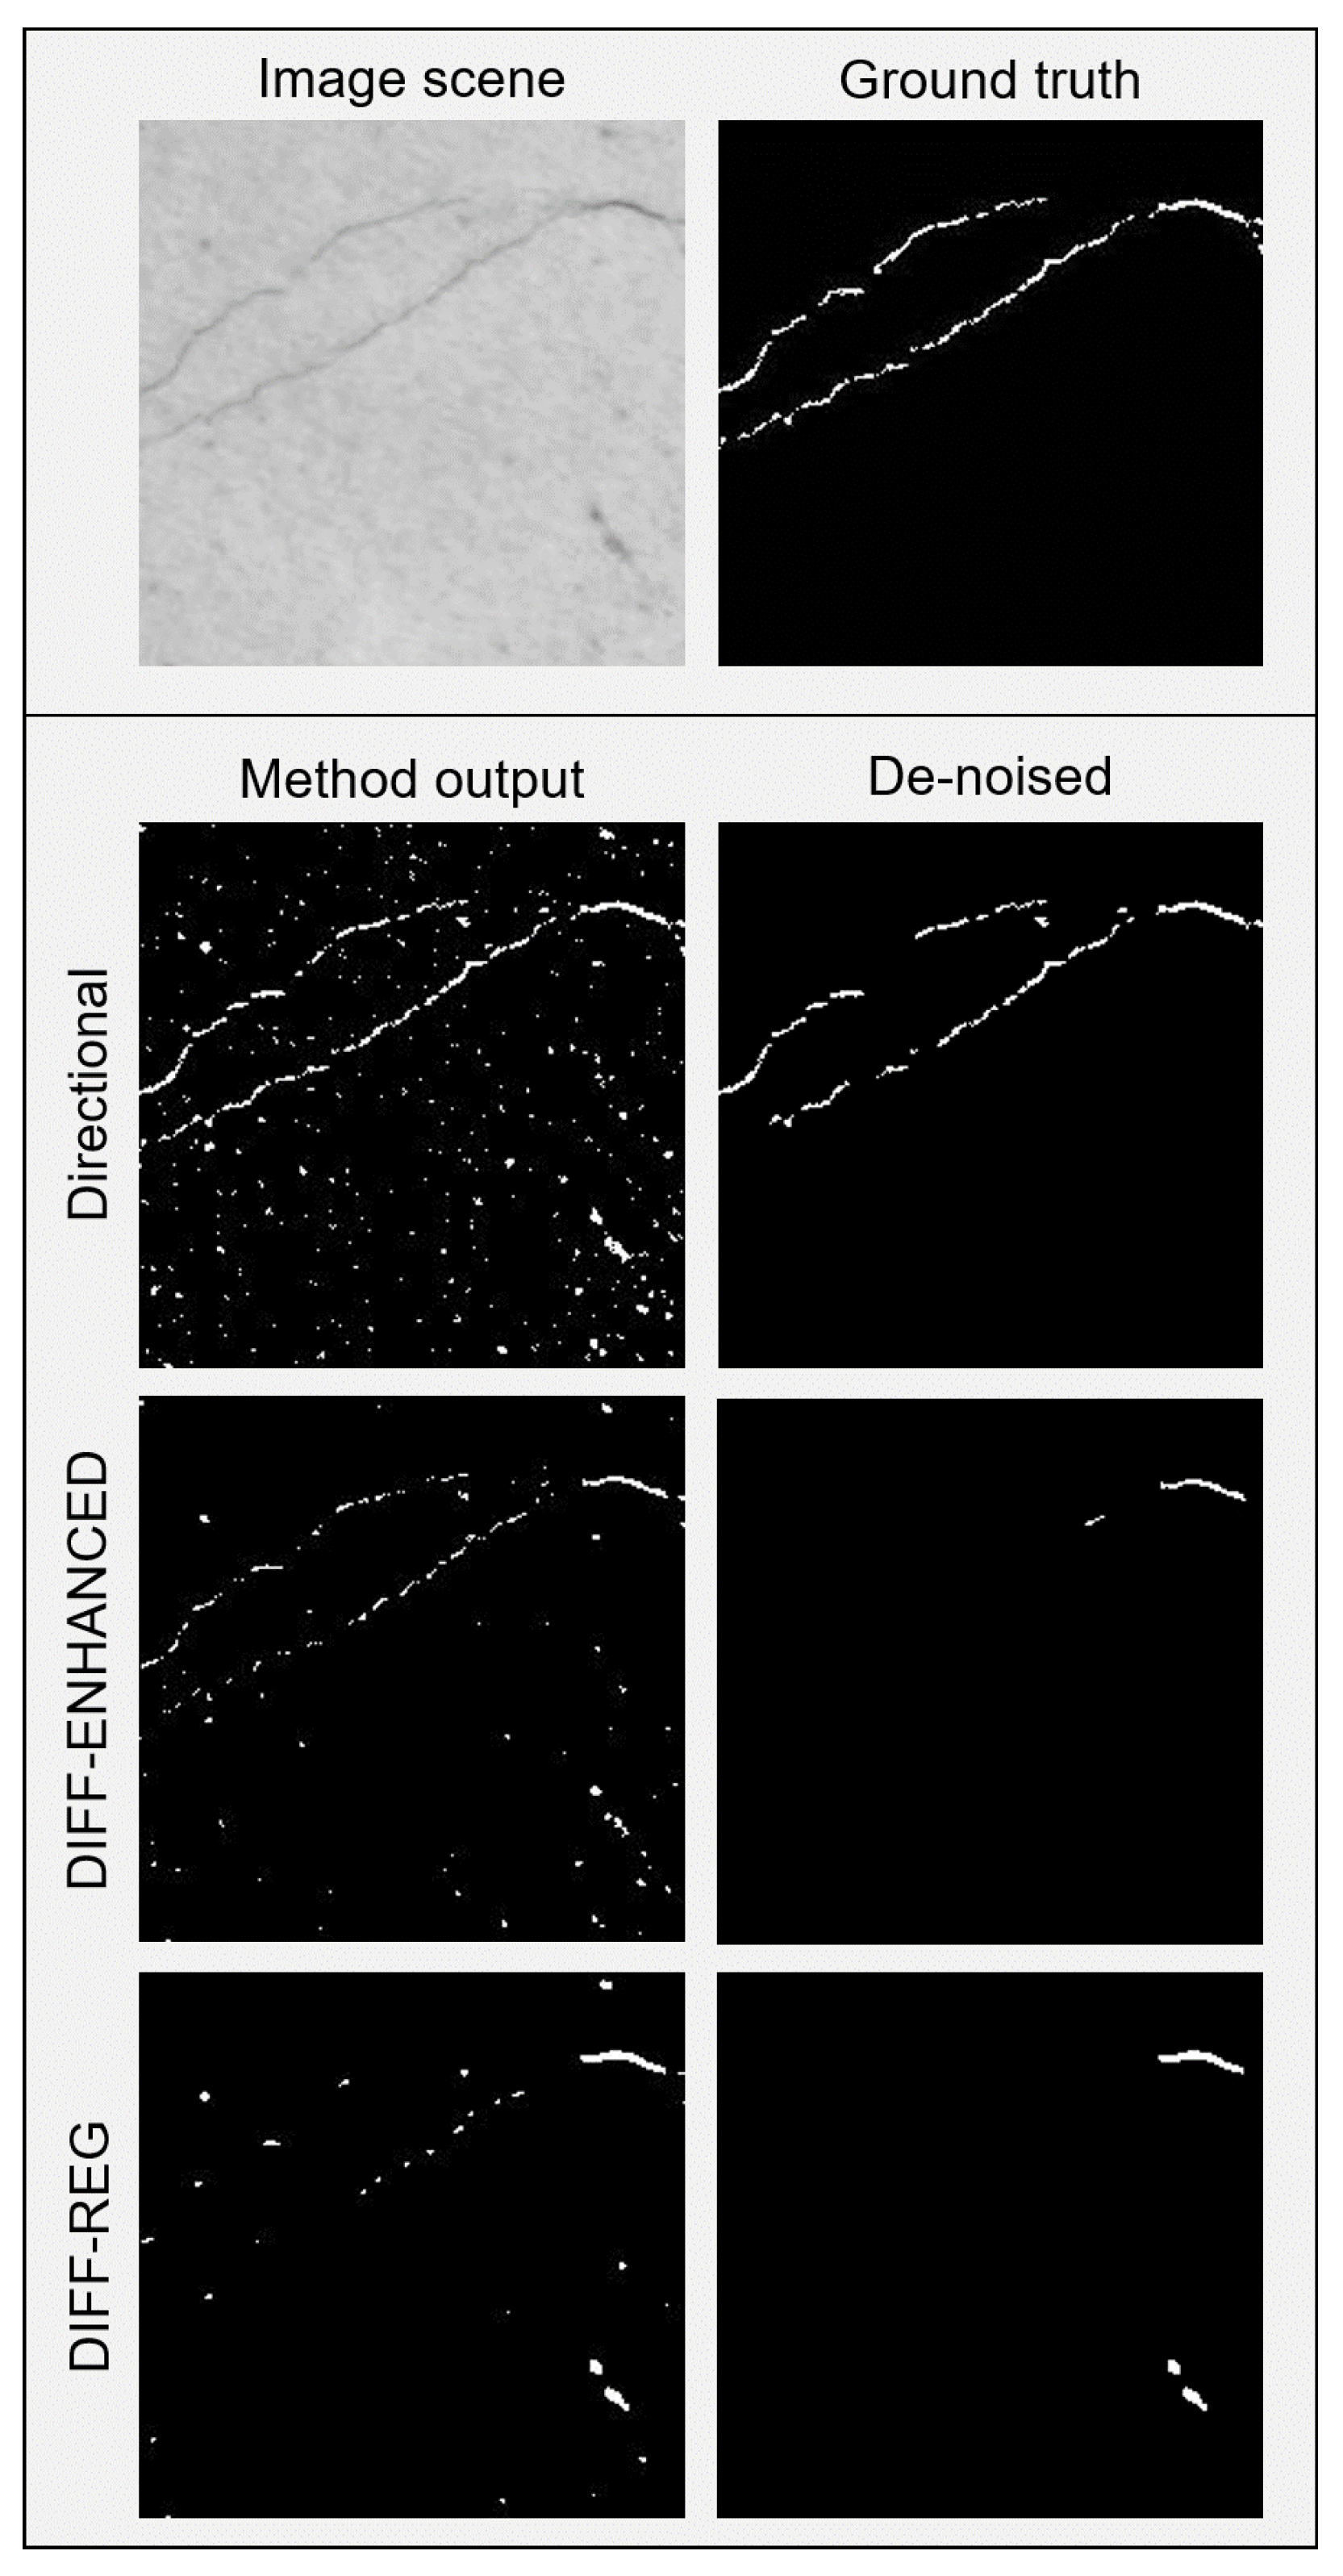
Figure 10 shows the binary outputs of the diffused and directional lighting crack segmentation methods applied to a single image with a thin crack measuring just 0.07 mm in width. Directional lighting clearly outperforms the diffused lighting methods, capturing more continuous crack structures. This shows that directional lighting enhances the visibility and extremities of thin cracks, allowing for more accurate segmentation.
The figure also highlights the impact of noise removal. Small connected components are removed in all methods but directional lighting preserves more crack segments. This is because it detects cracks more clearly from the outset, making them less likely to be mistaken for noise. In contrast, diffused lighting results in more fragmented and finer outputs, leading to the loss of legitimate crack details during post-segmentation noise removal.
4.2. Comparison Using Entire Dataset
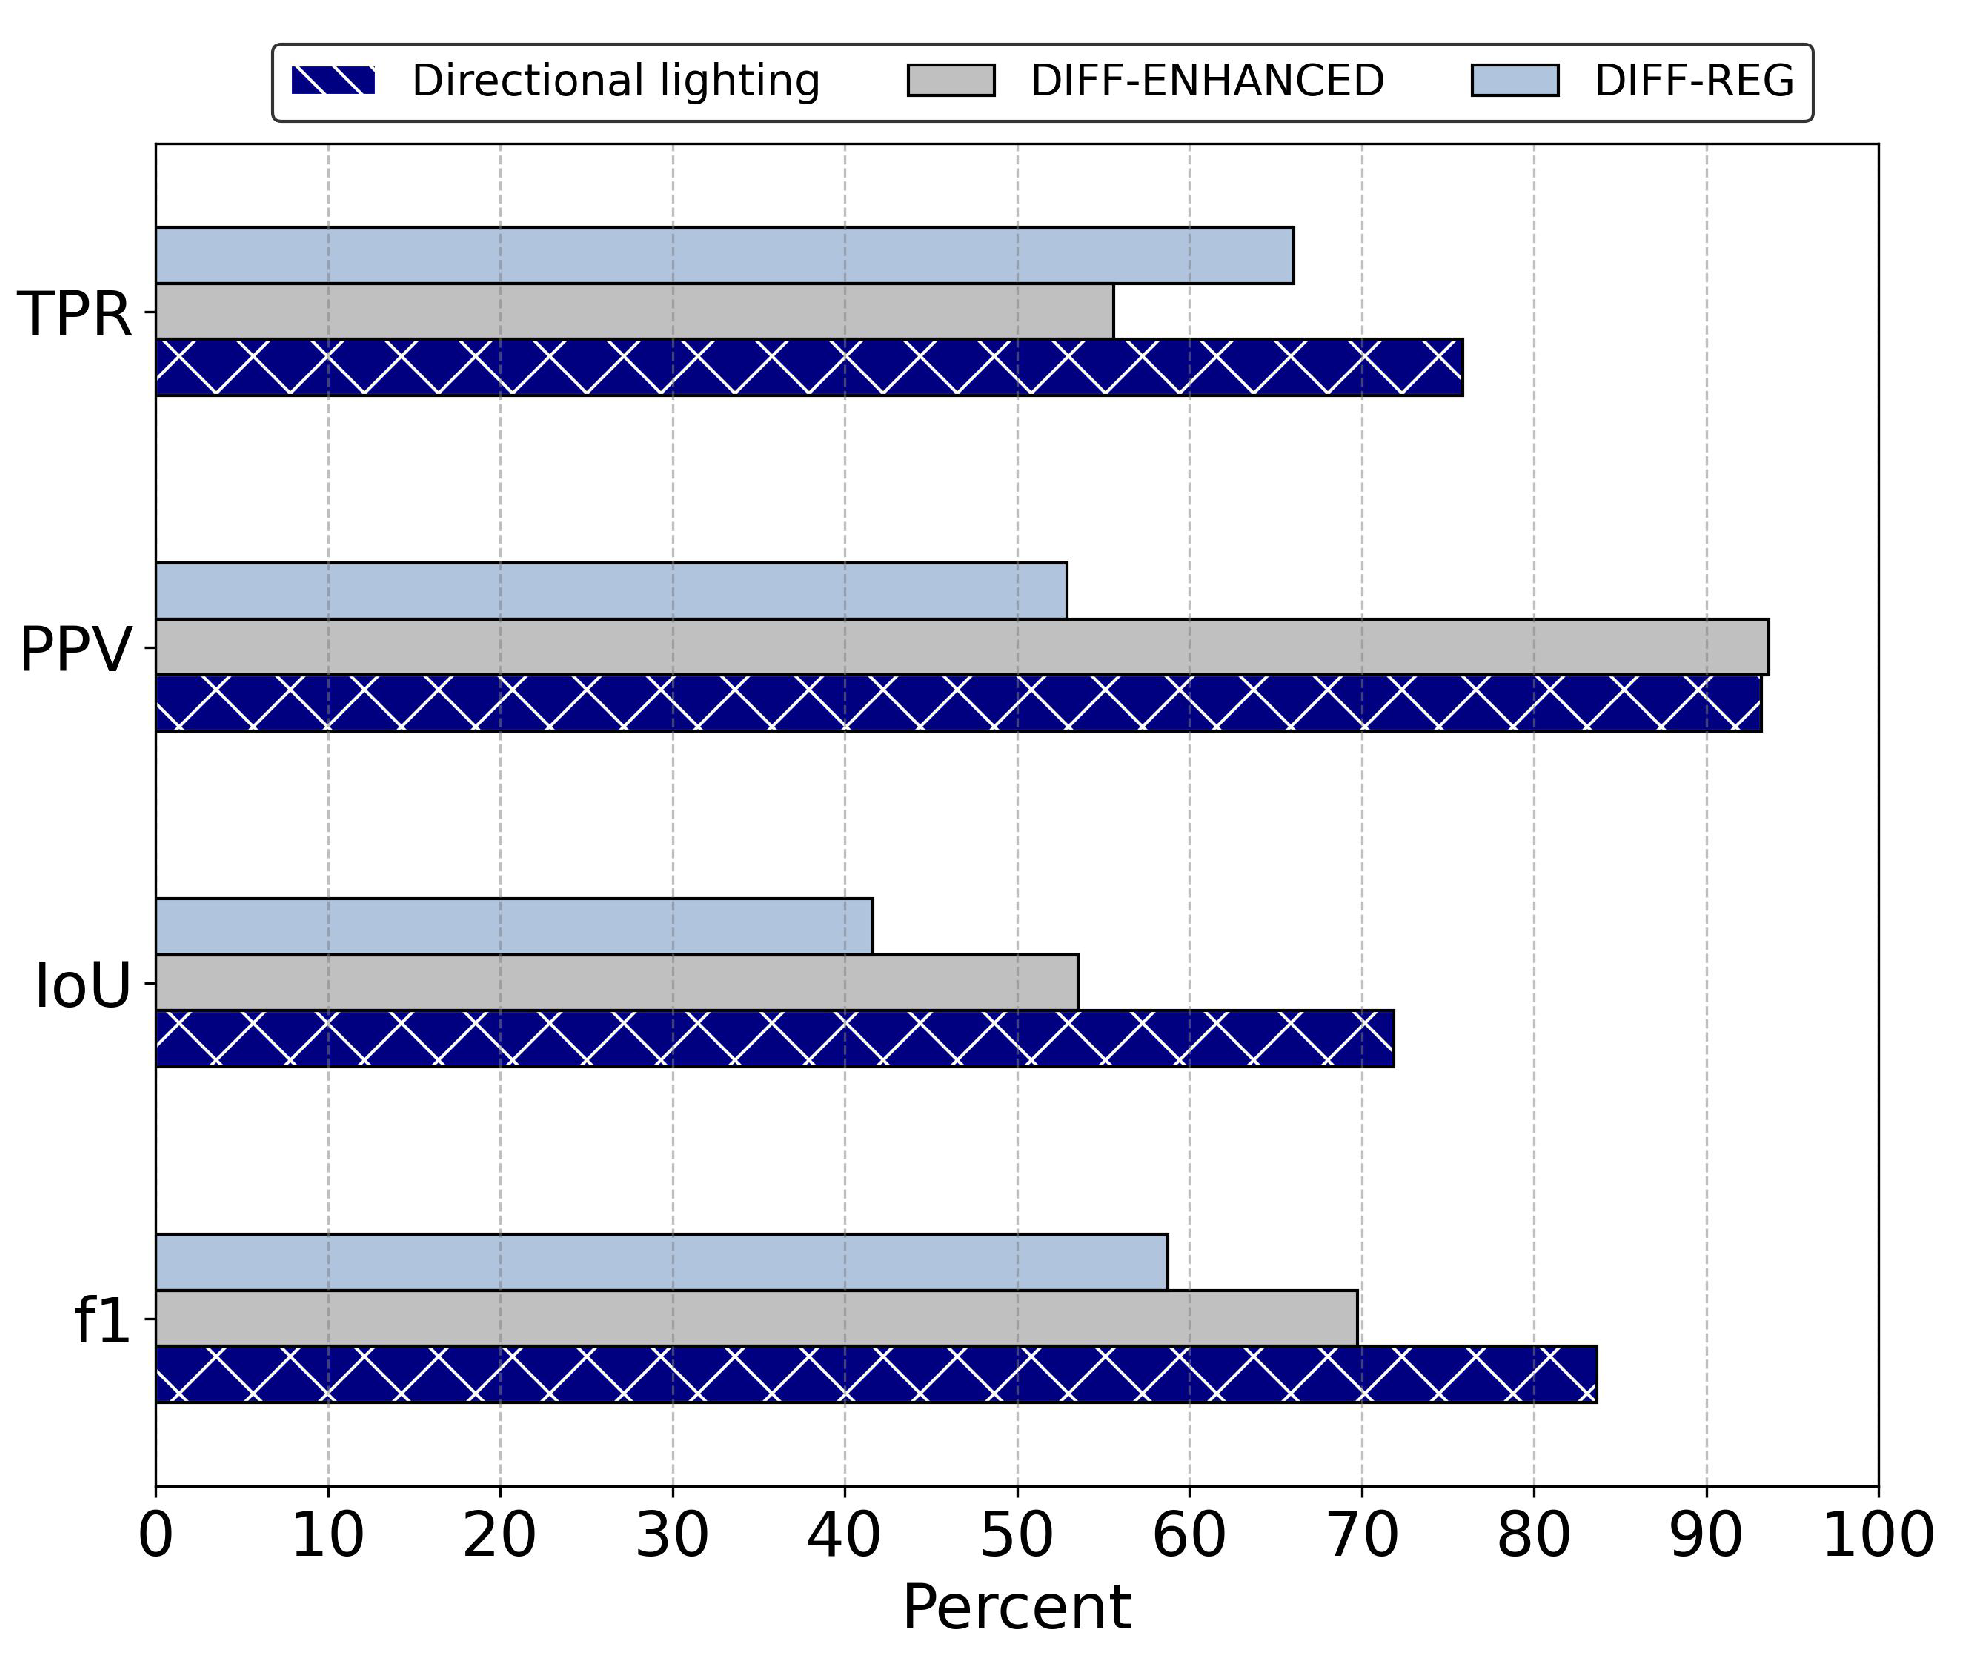
Figure 11 shows the crack segmentation metrics of all tested methods on the entire dataset (cracked and uncracked 224 × 224 sub-images). Directional lighting obtained the highest TPR, at 76%, followed by DIFF-REG and DIFF-ENHANCED at 66% and 56%, respectively. This means directional lighting detected approximately 10% more true crack pixels than DIFF-REG and 20% more than DIFF-ENHANCED.
While directional lighting obtained a PPV (precision) of 81%, DIFF-ENHANCED achieved a higher PPV of 88%. This indicates that although directional lighting identified more true crack pixels, it also produced more false positives. DIFF-REG had a significantly lower PPV of just 18%. This can be partly attributed to the poor performance of the area threshold noise removal method, as noted in [
30], where it underperformed relative to the Skele–Marker algorithm. However, directional lighting proved superior to this method.
The F1 score provides an indication of overall segmentation quality, balancing TPR and PPV. Directional lighting obtained the highest F1 score, at 78%, indicating that it found the most cracked pixels while maintaining a reasonable level of precision. In comparison, DIFF-ENHANCED reached a lower F1 score of 68%, showing that, while it performed well in terms of precision, it did not detect as many true crack pixels. DIFF-REG, with a significantly lower F1 score of 28%, demonstrates poor overall segmentation quality. This outcome is due to its lower TPR and PPV, indicating that the method failed to detect many cracks accurately.
The IoU score metric further supports the superiority of directional lighting. It achieved the highest IoU, outperforming DIFF-ENHANCED and DIFF-REG by 12% and 48%, respectively. This shows that directional lighting’s predictions align more closely with the ground truth, supporting the qualitative finding reported in
Section 4.1 that its segmentation boundaries are more accurate than those of the diffused methods.
4.3. Comparison Using Positive Dataset
Figure 12 shows the performance metrics of the tested methods on 224 × 224 sub-images where the ground truth contains a crack. Across all methods, the number of false positives was reduced, resulting in increased PPV and F1 values compared to testing on the entire dataset. TPR remained unchanged for all methods, as no additional true-positive pixels were introduced.
On this dataset, the PPV of the directional lighting and DIFF-ENHANCED methods increased to 93% and 94%, respectively. This shows that on positive samples, directional lighting has similar precision to diffused lighting while maintaining a higher TPR. While this indicates that directional lighting provides superior overall detection capability, it also suggests that directional lighting produces more false positives on negative samples.
Directional lighting’s high TPR and PPV result in it having the highest F1 score of 84%. In comparison, DIFF-ENHACNED and DIFF-REG obtained 70% and 59%, respectively. Additionally, directional lighting achieved the highest IoU, at 72%. These results further demonstrate that directional lighting produced superior crack segmentation results in comparison to its diffused counterparts.
4.4. Performance on Crack Width-Based Datasets
Figure 13 illustrates the F1 scores achieved by the segmentation methods across varying crack width classes. As shown, as the crack width narrows, the F1 score generally decreases for all methods, highlighting the increased difficulty in accurately segmenting finer cracks. Notably, the directional lighting method consistently outperformed both diffused lighting methods (DIFF-ENHANCED and DIFF-REG) across all crack width ranges, with F1-score differences ranging from 8% to 17%. For the widest cracks (0.20 ≤ median < 0.25 mm), the directional method achieved an F1 score of 92%, while the scores for the diffused methods were significantly lower. On the thinnest cracks (0.01 ≤ median < 0.1 mm), the directional lighting method obtained an F1 score of 78%. Notably, the performance of DIFF-ENHANCED shows a relative improvement, specifically for the thinnest crack interval (0.01 ≤ median < 0.1 mm); this suggests it might be more effective at capturing some of the very narrow crack features compared to its performance on slightly wider cracks. Overall, directional lighting demonstrates superior performance across all width classes.
5. Discussion
To the best of the authors’ knowledge, this study is the first to analyse and quantify the impact of directional lighting on crack segmentation performance compared to diffused lighting sources. The results demonstrate that cracks appear more distinct and defined under directional lighting. When combining segmentation outputs from images captured under multiple lighting directions, crack extremities are more effectively highlighted. This improvement was observed qualitatively in the form of clearer crack delineation in both raw and segmented images and quantitatively through increased IoU scores, indicating better alignment with the ground truths. Additionally, the directional lighting method achieved higher TPR and F1 scores, with only a minimal reduction in PPV. These findings align with Cho et al.’s [
23] analysis of angled lighting for human-led crack measurement, in which angled and directional lighting sources enabled a better crack outline. These results further support the conclusion that directional lighting enhances the identification of concrete defects, aligning with the findings of McAlorum et al. [
24], who demonstrated similar benefits for defect region detection.
A key aspect of this work is the deliberate use of a white-box crack segmentation algorithm. As described in
Section 2, the focus was not to develop a state-of-the-art segmentation approach but to isolate and study the effect of lighting conditions on segmentation outcomes. Given the limited availability of directional lighting images, a white-box algorithm was selected over a black-box deep learning approach requiring a large training dataset. This choice also prioritised transparency and interoperability and meant that the influence of directional lighting could be clearly attributed rather than confounded by black-box model complexity or training variability. The algorithm was designed to combine the segmentation results from multiple lighting directions, enhancing the definition of crack boundaries in a way that is both explainable and reproducible.
When evaluated on the positive-only subset of the dataset, the directional lighting method showed an increase in PPV. While some false positives identified on negative samples may result from surface texture noise, others may correspond to actual but unlabelled cracks missed in the ground truth, which was based on diffused lighting imagery. The positive-only evaluation also simulates a hybrid inspection workflow, where a black-box classifier initially flags candidate regions, followed by white-box segmentation for detailed analysis. In this context, directional lighting enhances the segmentation stage, offering improved accuracy in crack segmentation over diffused approaches.
Furthermore, the directional lighting method consistently outperformed the standard diffused lighting LoG-based approach proposed by Dorafshan et al. [
15], with gains across all performance metrics, such as a high F1 score of 84% on cracked data. In this study, this algorithm (DIFF-REG) obtained an F1 score of 59%, whereas in the original study, it obtained 68%. This decrease is likely due to the challenging dataset used in this study, which prioritises very thin cracks typically in the range of 0.07–0.4 mm. The results of the two diffused lighting approaches varied, highlighting that some performance increases were attributed to the use of additional image processing steps, such as the Skele–Marker noise removal algorithm.
While white-box methods offer advantages in transparency, they also have limitations in adaptability and scalability across different domains. For example, edge detection methods are less effective when dealing with very wide cracks, where they will eventually only locate crack boundaries. A natural next step would be to integrate directional lighting into deep learning-based segmentation models, which could generalise better across datasets and crack widths, especially when larger annotated datasets from real-world structures are developed.
In addition to enhancing segmentation performance, directional lighting offers practical benefits for field inspection, particularly in low-light or night-time conditions, where external lighting is already necessary. In such contexts, different directional lighting images capture more scene information in an image area while remaining interpretable and understandable by human inspectors. This allows inspectors to extract more information from each scene while also providing higher quality inputs for segmentation algorithms.
6. Conclusions
This paper compared diffused and directional scene lighting in images for pixel-level concrete crack segmentation using a white-box algorithm. To utilise the directional lighting images, a novel pixel-level crack segmentation method that uses multiple images of a concrete surface illuminated under varying lighting conditions was proposed. Image processing techniques are applied to each directional lighting image to segment the crack pixels. All images are then combined by summing them, resulting in an image that highlights the extremities of the crack on the surface and provides crack detection confidence levels ranging from 0 to 1, which are then segmented to produce a binary output.
The directional lighting method was benchmarked against two diffused lighting methods: a method in reported in the literature that proved superior to other pixel-level crack segmentation techniques (DIFF-REG) and a method that uses directional lighting image processing techniques on a diffused lighting image (DIFF-ENHANCED). Benchmarking results on cracked and uncracked samples with crack widths typically ranging from 0.07 to 0.4 mm showed that directional lighting outperformed both diffused lighting methods for pixel-level segmentation, achieving a 10% higher TPR, 12% higher IoU, and 10% higher F1 score at a nominal cost in precision. This increased performance was visible across all crack widths in the dataset. Testing on a dataset with only cracks greatly reduced the false positives for all methods, increasing the precision, IoU, and F1 score. The performance gap between diffused and directional lighting was visible across all crack width ranges in the dataset. Qualitative analysis highlighted that segmentation outputs from directional lighting more clearly defined the extremities and boundaries of cracks.
Future works should investigate how varying lighting angles affect pixel-level crack segmentation performance. Future research should also use a dataset captured from real-world concrete structures and compare methods in terms of measured widths, not just classified metrics. As demonstrated in this study, the use of a white-box algorithm enabled clear attribution of performance improvements to lighting conditions, offering a transparent foundation for future development. While this study demonstrated the effectiveness of a white-box method, future research could explore the integration of directional lighting into a deep learning crack segmentation approach.
Author Contributions
Conceptualization, H.D. and M.P.; methodology, H.D. and M.P.; software, H.D.; validation, H.D.; formal analysis, H.D.; investigation, H.D., M.P., S.P. and J.M.; resources, H.D., J.M. and S.P.; data curation, H.D., J.M. and S.P.; writing—original draft preparation, H.D.; writing—review and editing, H.D., M.P. and S.P.; visualization, H.D.; supervision, M.P.; project administration, H.D. and M.P.; funding acquisition, M.P. All authors have read and agreed to the published version of the manuscript.
Funding
This research was funded by the Scottish Funding Council (BE-ST/CENSIS) and the University of Strathclyde’s Advanced Nuclear Research Centre (ANRC). The APC was kindly waived by MDPI.
Data Availability Statement
The data presented in this study are available on request from the corresponding author due to confidentiality restrictions.
Conflicts of Interest
The authors declare no conflicts of interest. The funders had no role in the design of the study; in the collection, analyses, or interpretation of data; in the writing of the manuscript; or in the decision to publish the results.
References
- Liu, G.; Lu, Z. Crack Width Comparison between ACI 318, Eurocode 2 and GB 50010 for Flexural RC Members. Open J. Civ. Eng. 2024, 14, 116–126. [Google Scholar] [CrossRef]
- Dong, C.Z.; Catbas, F.N. A review of computer vision–based structural health monitoring at local and global levels. Struct. Health Monit. 2021, 20, 692–743. [Google Scholar] [CrossRef]
- Chen, S.; Laefer, D.F.; Mangina, E.; Zolanvari, S.M.I.; Byrne, J. UAV Bridge Inspection through Evaluated 3D Reconstructions. J. Bridge Eng. 2019, 24, 05019001. [Google Scholar] [CrossRef]
- Kheradmandi, N.; Mehranfar, V. A critical review and comparative study on image segmentation-based techniques for pavement crack detection. Constr. Build. Mater. 2022, 321, 126162. [Google Scholar] [CrossRef]
- Zhu, Q.; Dinh, T.H.; Hoang, V.T.; Phung, M.D.; Ha, Q.P. Crack Detection Using Enhanced Thresholding on UAV based Collected Images. arXiv 2018, arXiv:1812.07868. [Google Scholar] [CrossRef]
- Fujita, Y.; Hamamoto, Y. A robust automatic crack detection method from noisy concrete surfaces. Mach. Vis. Appl. 2011, 22, 245–254. [Google Scholar] [CrossRef]
- Dorafshan, S.; Thomas, R.J.; Maguire, M. Benchmarking Image Processing Algorithms for Unmanned Aerial System-Assisted Crack Detection in Concrete Structures. Infrastructures 2019, 4, 19. [Google Scholar] [CrossRef]
- Simler, C.; Trostmann, E.; Berndt, D. Automatic crack detection on concrete floor images. In Proceedings of the Photonics and Education in Measurement Science 2019, Jena, Germany, 17–19 September 2019; Volume 11144. [Google Scholar] [CrossRef]
- Mousa, M.A.; Yussof, M.M.; Hussein, T.S.; Assi, L.N.; Ghahari, S. A Digital Image Correlation Technique for Laboratory Structural Tests and Applications: A Systematic Literature Review. Sensors 2023, 23, 9362. [Google Scholar] [CrossRef]
- Liu, Z.; Cao, Y.; Wang, Y.; Wang, W. Computer vision-based concrete crack detection using U-net fully convolutional networks. Autom. Constr. 2019, 104, 129–139. [Google Scholar] [CrossRef]
- Zhang, J.; Zeng, Z.; Sharma, P.K.; Alfarraj, O.; Tolba, A.; Wang, J. A dual encoder crack segmentation network with Haar wavelet-based high–low frequency attention. Expert Syst. Appl. 2024, 256, 124950. [Google Scholar] [CrossRef]
- Shi, Y.; Cui, L.; Qi, Z.; Meng, F.; Chen, Z. Automatic Road Crack Detection Using Random Structured Forests. IEEE Trans. Intell. Transp. Syst. 2016, 17, 3434–3445. [Google Scholar] [CrossRef]
- Liu, G.; Ding, W.; Shu, J.; Strauss, A.; Duan, Y. Two-Stream Boundary-Aware Neural Network for Concrete Crack Segmentation and Quantification. Struct. Control Health Monit. 2023, 2023, 3301106. [Google Scholar] [CrossRef]
- Nyathi, M.A.; Bai, J.; Wilson, I.D. Deep Learning for Concrete Crack Detection and Measurement. Metrology 2024, 4, 66–81. [Google Scholar] [CrossRef]
- Dorafshan, S.; Thomas, R.J.; Maguire, M. Comparison of deep convolutional neural networks and edge detectors for image-based crack detection in concrete. Constr. Build. Mater. 2018, 186, 1031–1045. [Google Scholar] [CrossRef]
- Hui, L.; Ibrahim, A.; Hindi, R. Computer Vision-Based Concrete Crack Identification Using MobileNetV2 Neural Network and Adaptive Thresholding. Infrastructures 2025, 10, 42. [Google Scholar] [CrossRef]
- Pal, M.; Palevičius, P.; Landauskas, M.; Orinaitė, U.; Timofejeva, I.; Ragulskis, M. An Overview of Challenges Associated with Automatic Detection of Concrete Cracks in the Presence of Shadows. Appl. Sci. 2021, 11, 11396. [Google Scholar] [CrossRef]
- Hajjaj, S.S.H.; Khalid, I.B. Design and Development of an Inspection Robot for Oil and Gas Applications. Int. J. Eng. Technol. 2018, 7, 5–10. [Google Scholar] [CrossRef]
- Yangí, L.; Yang, G.; Liu, Z.; Chang, Y.; Jiang, B.; Awad, Y.; Xiao, J. Wall-climbing robot for visual and GPR inspection. In Proceedings of the 2018 13th IEEE Conference on Industrial Electronics and Applications (ICIEA), Wuhan, China, 31 May–2 June 2018; pp. 1004–1009. [Google Scholar] [CrossRef]
- Loupos, K.; Doulamis, A.D.; Stentoumis, C.; Protopapadakis, E.; Makantasis, K.; Doulamis, N.D.; Amditis, A.; Chrobocinski, P.; Victores, J.; Montero, R.; et al. Autonomous robotic system for tunnel structural inspection and assessment. Int. J. Intell. Robot. Appl. 2018, 2, 43–66. [Google Scholar] [CrossRef]
- Kolvenbach, H.; Wisth, D.; Buchanan, R.; Valsecchi, G.; Grandia, R.; Fallon, M.; Hutter, M. Towards autonomous inspection of concrete deterioration in sewers with legged robots. J. Field Robot. 2020, 37, 1314–1327. [Google Scholar] [CrossRef]
- Menendez, E.; Victores, J.G.; Montero, R.; Martínez, S.; Balaguer, C. Tunnel structural inspection and assessment using an autonomous robotic system. Autom. Constr. 2018, 87, 117–126. [Google Scholar] [CrossRef]
- Cho, H.W.; Yoon, H.J.; Yoon, J.C. Analysis of Crack Image Recognition Characteristics in Concrete Structures Depending on the Illumination and Image Acquisition Distance through Outdoor Experiments. Sensors 2016, 16, 1646. [Google Scholar] [CrossRef] [PubMed]
- McAlorum, J.; Dow, H.; Pennada, S.; Perry, M.; Dobie, G. Automated Concrete Crack Inspection with Directional Lighting Platform. IEEE Sens. Lett. 2023, 7, 5503704. [Google Scholar] [CrossRef]
- Dow, H.; Perry, M.; Pennada, S.; Lunn, R.; Pytharouli, S. 3D reconstruction and measurement of concrete spalling using near-field Photometric stereo and YOLOv8. Autom. Constr. 2024, 166, 105633. [Google Scholar] [CrossRef]
- Tang, J.; Gu, Y. Automatic Crack Detection and Segmentation Using a Hybrid Algorithm for Road Distress Analysis. In Proceedings of the 2013 IEEE International Conference on Systems, Man, and Cybernetics, Manchester, UK, 13–16 October 2013; pp. 3026–3030. [Google Scholar] [CrossRef]
- Oliveira, H.; Correia, P.L. Road surface crack detection: Improved segmentation with pixel-based refinement. In Proceedings of the 2017 25th European Signal Processing Conference (EUSIPCO), Kos, Greece, 28 August–2 September 2017; pp. 2026–2030. [Google Scholar] [CrossRef]
- Andrushia, D.; Anand, N.; Arulraj, P. Anisotropic diffusion based denoising on concrete images and surface crack segmentation. Int. J. Struct. Integr. 2019, 11, 395–409. [Google Scholar] [CrossRef]
- Perona, P.; Malik, J. Scale-space and edge detection using anisotropic diffusion. IEEE Trans. Pattern Anal. Mach. Intell. 1990, 12, 629–639. [Google Scholar] [CrossRef]
- Dow, H.; Perry, M.; McAlorum, J.; Pennada, S.; Dobie, G. Skeleton-based noise removal algorithm for binary concrete crack image segmentation. Autom. Constr. 2023, 151, 104867. [Google Scholar] [CrossRef]
- Ong, J.C.H.; Ismadi, M.Z.P.; Wang, X. A hybrid method for pavement crack width measurement. Measurement 2022, 197, 111260. [Google Scholar] [CrossRef]
Figure 1.
Summary of results of the directional lighting method. The individual binary crack detection results from each lighting direction image are combined by summing the images. The resulting image shows the extremities of the crack under all lighting directions and provides confidence levels in detection. N.B. This sample is a clean piece of concrete that is not part of the testing dataset used in this work but was selected for this figure to illustrate the impact of lighting on segmentation.
Figure 2.
Camera and lighting positions used to capture directional lighting images. The camera position is fixed 250 mm from the concrete surface. Each light source is positioned 250 mm from the surface at a 50-degree angle of incidence. All lights are identical in specification, and only one light is illuminated at a time to create directional lighting. The setup shown in this figure represents the configuration with the right (R) light activated.
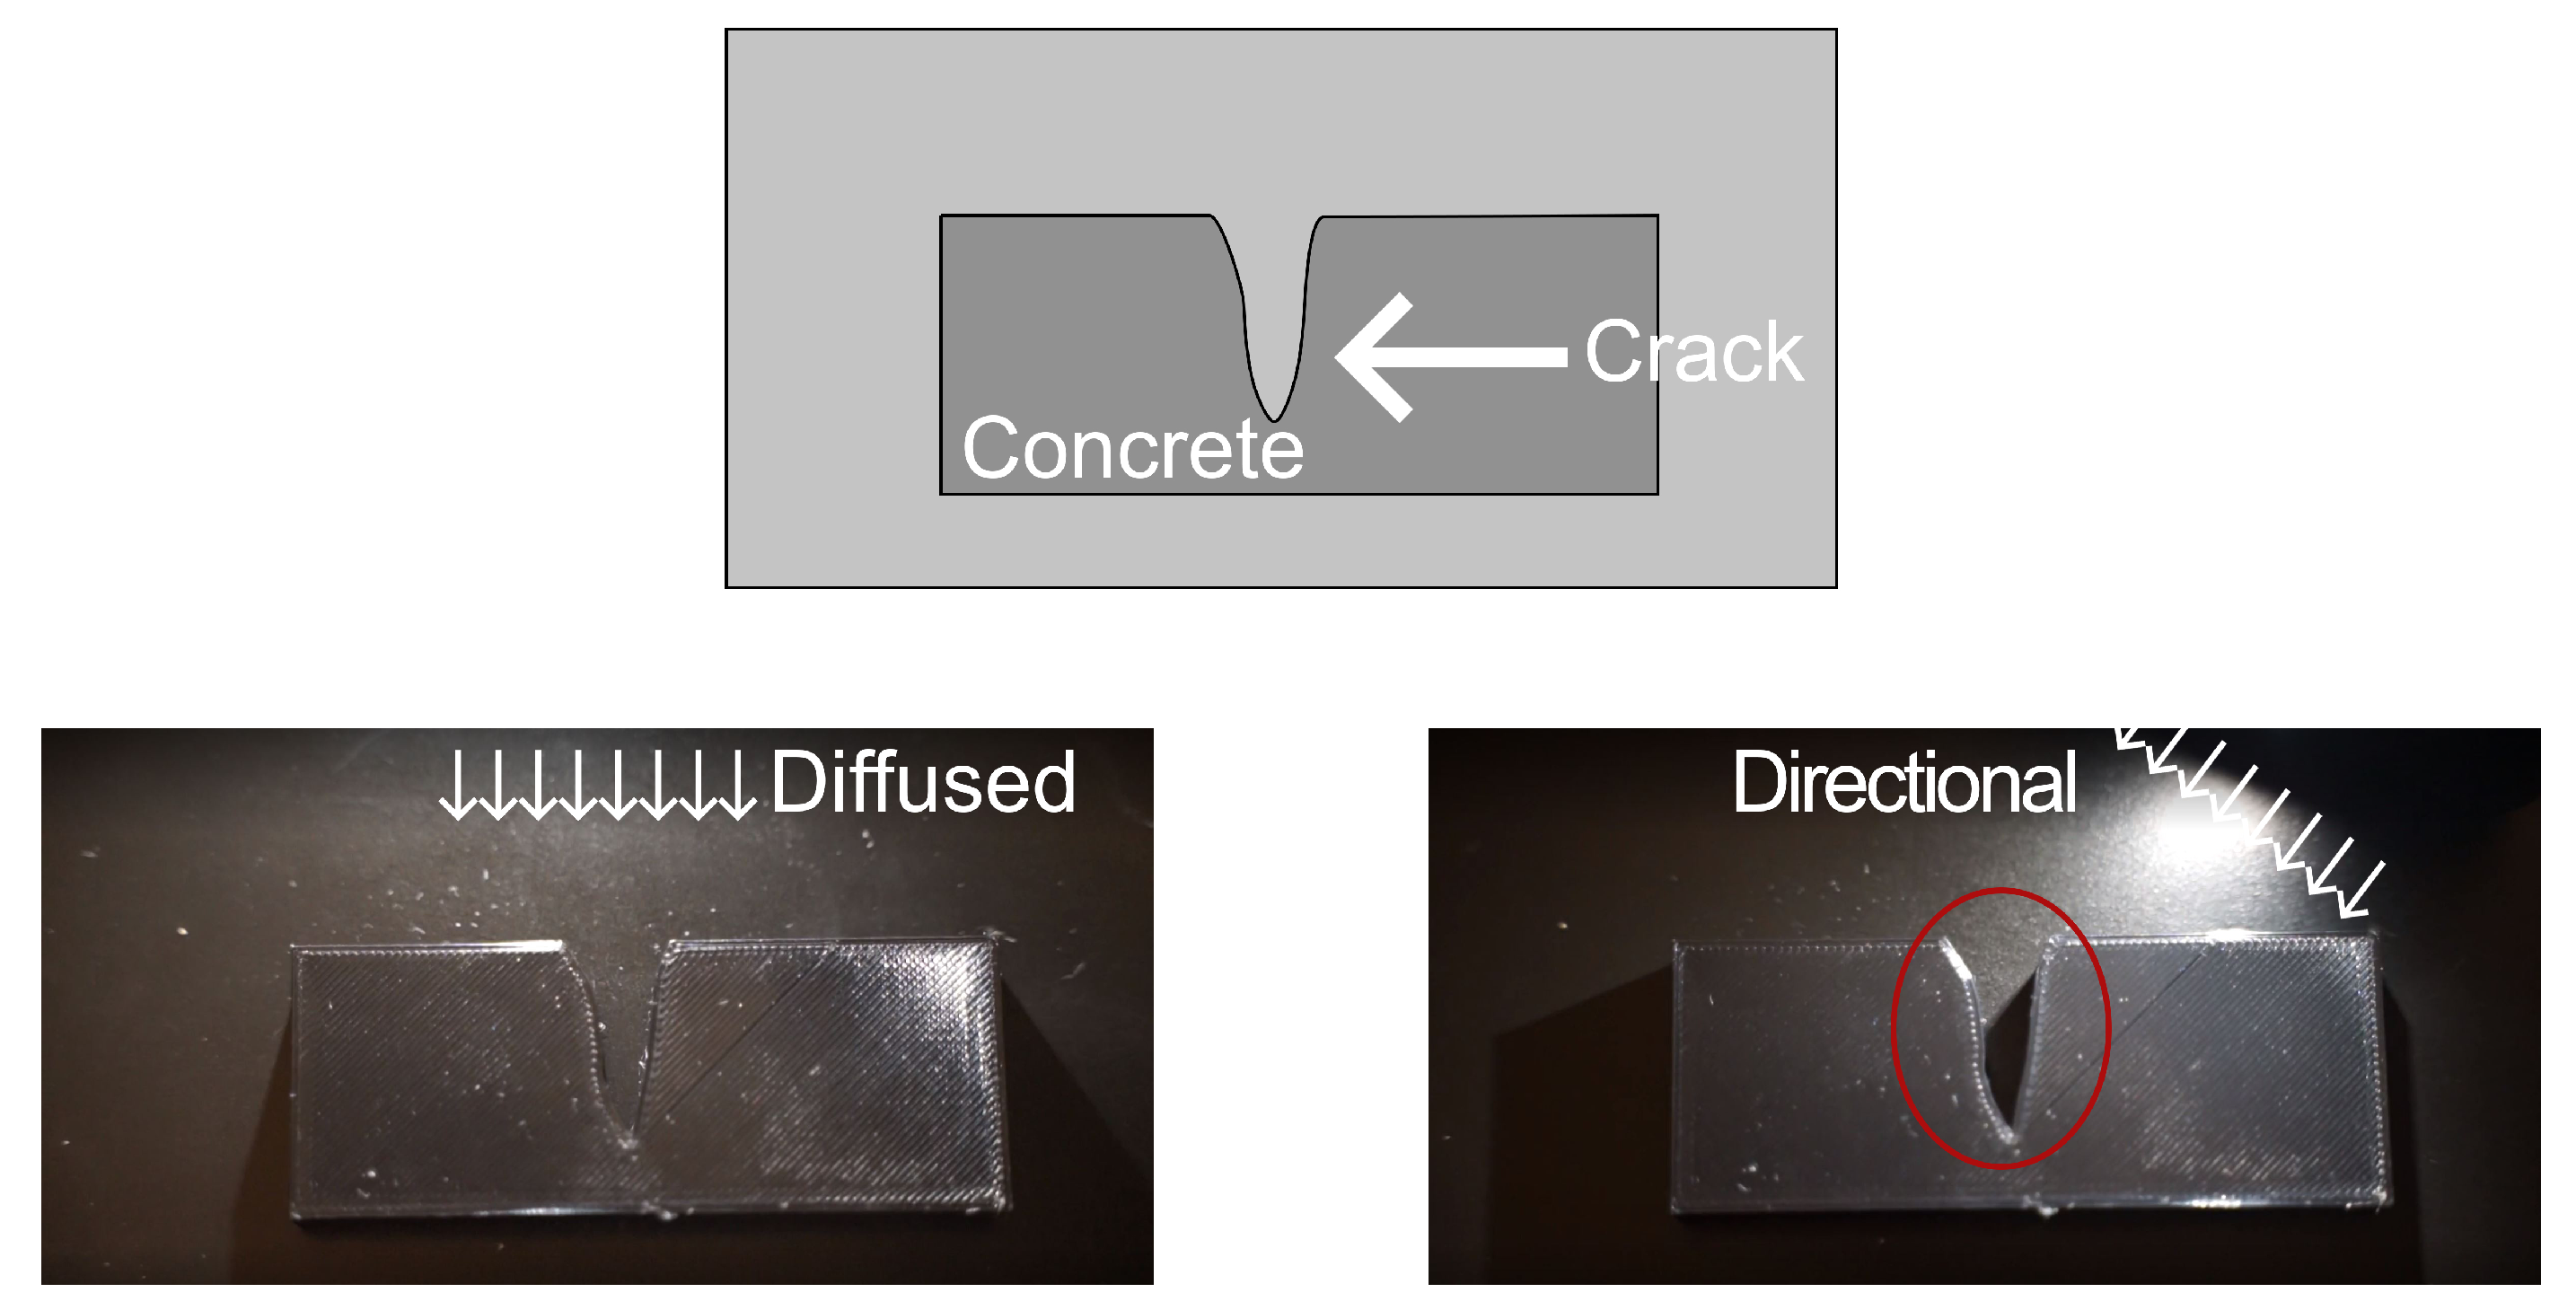
Figure 3.
Illustration of the effect of diffused and directional lighting on a crack. The red circle highlights an area where directional lighting produces shadowing along the crack boundary, enhancing the visibility of its extremities compared to diffuse lighting.
Figure 3.
Illustration of the effect of diffused and directional lighting on a crack. The red circle highlights an area where directional lighting produces shadowing along the crack boundary, enhancing the visibility of its extremities compared to diffuse lighting.
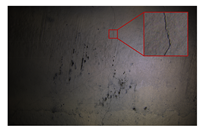
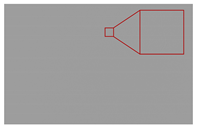
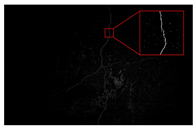
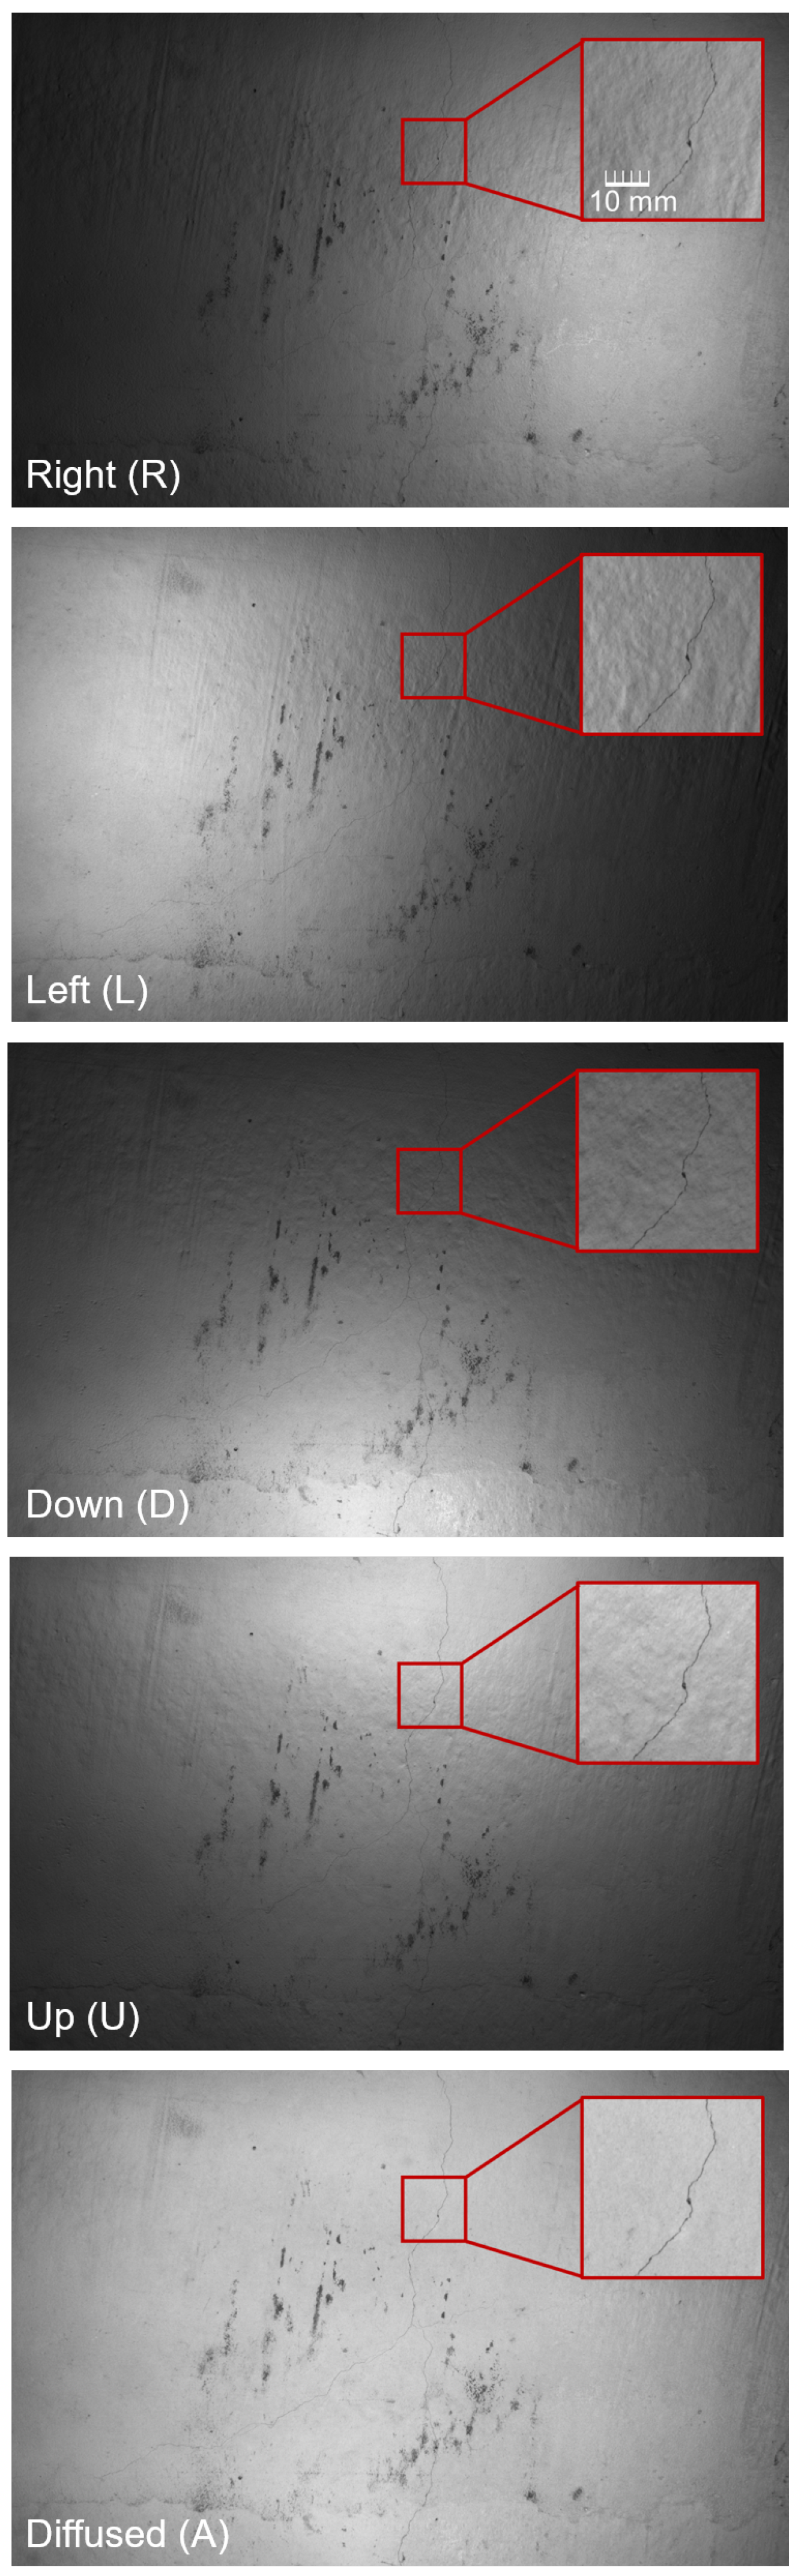
Figure 4.
Captured view of a surface with right, left, down, up, and diffused scene illumination. The red inset showcases how the information obtained from the crack and concrete background changes under different lighting conditions.
Figure 4.
Captured view of a surface with right, left, down, up, and diffused scene illumination. The red inset showcases how the information obtained from the crack and concrete background changes under different lighting conditions.
Figure 5.
Confidence-based noise removal. (
a) Noisy input image; (
b) image with isolated low-confidence pixels removed; (
c) binary output after application of the Skele–Marker algorithm. Numbers indicate confidence in detection, as per
Section 2.6.
Figure 5.
Confidence-based noise removal. (
a) Noisy input image; (
b) image with isolated low-confidence pixels removed; (
c) binary output after application of the Skele–Marker algorithm. Numbers indicate confidence in detection, as per
Section 2.6.
Figure 6.
Width distribution of dataset ground truths measured at 5-pixel intervals using the hybrid method. Frequency indicates the count of measurements falling within each width range.
Figure 6.
Width distribution of dataset ground truths measured at 5-pixel intervals using the hybrid method. Frequency indicates the count of measurements falling within each width range.
Figure 7.
Magnified view comparison of a scene under diffused and directional lighting. Directional lighting enhances crack visibility by highlighting extremities. Boxes indicate areas of significant change between diffused and directional lighting images.
Figure 7.
Magnified view comparison of a scene under diffused and directional lighting. Directional lighting enhances crack visibility by highlighting extremities. Boxes indicate areas of significant change between diffused and directional lighting images.
Figure 8.
Pixel-level segmentation results (TP, TN, FP, and FN) of three methods on a 14 × 14 pixel region. Directional lighting yields the most accurate segmentation with minimal FN pixels.
Figure 8.
Pixel-level segmentation results (TP, TN, FP, and FN) of three methods on a 14 × 14 pixel region. Directional lighting yields the most accurate segmentation with minimal FN pixels.
Figure 9.
Comparison of ground truth and directional lighting white-box algorithm output. The confidence map highlights pixel-wise certainty based on multiple lighting directions.
Figure 9.
Comparison of ground truth and directional lighting white-box algorithm output. The confidence map highlights pixel-wise certainty based on multiple lighting directions.
Figure 10.
The 224 × 224 pixel output of directional and diffused lighting crack segmentation methods on a challenging 0.07 mm width crack. Column one shows the output prior to noise removal, with column two showing the de-noised output. Directional lighting provides better overall segmentation and a more continuous crack, which results in better noise removal.
Figure 11.
Performance metrics for crack segmentation methods under directional and diffused lighting when tested on the entire dataset (cracked and uncracked samples). Abbreviations for TPR, PPV, IoU, and F1 are described in
Table 3. Directional lighting obtained the highest F1 score and IoU, indicating superior crack segmentation.
Figure 12.
Performance metrics for crack segmentation methods under directional and diffused lighting when tested on only cracked samples. Abbreviations for TPR, PPV, IoU, and F1 are described in
Table 3. Directional lighting obtained the highest F1 score and IoU, indicating superior crack segmentation.
Figure 13.
F1 score of directional and diffused crack segmentation methods across datasets of different median crack widths. Directional lighting outperformed the diffused methods for segmentation on all crack width classes.
Figure 13.
F1 score of directional and diffused crack segmentation methods across datasets of different median crack widths. Directional lighting outperformed the diffused methods for segmentation on all crack width classes.
Table 1.
Summary of image processing steps of the white-box directional lighting crack segmentation algorithm. The red inset shows a magnified view of the crack throughout the image processing steps.
Table 2.
Camera configurations of the ALICS system used in this work for data collection.
Table 2.
Camera configurations of the ALICS system used in this work for data collection.
| Parameter | Value |
|---|
| Camera | BFS-U3-200S6C-C (FLIR, Edmund Optics, York, UK) |
| Sensor size | 1” (SONY IMX183) |
| Lens focal length | 8 mm |
| Exposure time | 0.2 s (for U, D, L or R) and 0.1 s for A configurations. |
| Aperture | f8 |
| Gain (sensor sensitivity) | 1 |
Table 3.
Performance metrics used to compare the tested methods. TN, FP, FN, and TP were calculated by comparing segmentation outputs to ground truths and aggregating results.
Table 3.
Performance metrics used to compare the tested methods. TN, FP, FN, and TP were calculated by comparing segmentation outputs to ground truths and aggregating results.
| Name | Description | Equation |
|---|
| True-positive rate (recall) (TPR) | The estimated probability that an actual positive tests positive. | |
| Positive predictive value (precision) (PPV) | The estimated probability that a positive prediction is a true positive. | |
| Intersection over Union (IoU) | The ratio of the intersected area of predictions and the ground truths to the combined area of predictions and ground truths. | |
| F1 score (F1) | The weighted average of recall and precision. | |
| Disclaimer/Publisher’s Note: The statements, opinions and data contained in all publications are solely those of the individual author(s) and contributor(s) and not of MDPI and/or the editor(s). MDPI and/or the editor(s) disclaim responsibility for any injury to people or property resulting from any ideas, methods, instructions or products referred to in the content. |
© 2025 by the authors. Licensee MDPI, Basel, Switzerland. This article is an open access article distributed under the terms and conditions of the Creative Commons Attribution (CC BY) license (https://creativecommons.org/licenses/by/4.0/).


