1. Introduction
In earthquake-prone regions, predicting the aftermath of seismic events on highway bridges is essential for effective emergency response and the strategic planning of recovery efforts within the transportation networks [
1]. The extent of bridge damage not only dictates the cost and duration of repairs but, more importantly, influences the bridge’s functionality in terms of its ability to accommodate traffic flow [
2]. Loss of functionality often leads to disruptions in the transportation network, resulting in economic losses due to reduced traffic flow and restricted access to emergency routes [
3].
A chronology of destructive earthquakes has repeatedly exposed the critical role of flexural behavior and ductility in reinforced concrete (RC) bridge columns. The 1971 San Fernando Earthquake marked a turning point in seismic bridge design, as approximately 60 freeway structures suffered damage ranging from spalling to complete collapse due to inadequate confinement, poor anchorage, and widely spaced transverse ties [
4,
5]. These deficiencies led to bar buckling that compromised energy dissipation. Following this, the 1989 Loma Prieta Earthquake revealed that older bridges lacking modern confinement detailing were similarly vulnerable to combined flexure-shear failures and collapse, particularly when founded on soft soils [
4].
The 1994 Northridge Earthquake further emphasized the importance of flexural ductility. Retrofitted columns with steel jackets demonstrated significantly improved seismic performance by enhancing both flexural strength and energy dissipation capacity, while non-retrofitted columns continued to fail due to insufficient transverse reinforcement and splice detailing [
6]. The 1995 Kobe Earthquake in Japan highlighted the consequences of poor flexural detailing in older RC columns. Many collapsed bridges had inadequate confinement steel and poorly anchored longitudinal reinforcement, leading to bar buckling and premature flexural failure. Observations showed that plastic hinges formed in inadequately confined regions, drastically limiting ductile deformation capacity [
7].
The inventory of structures managed by the Quebec Ministry of Transportation and Sustainable Mobility (MTSM) comprises over 13,000 structures spread across the entire territory of Quebec [
8], where seismic hazard varies from low to high depending on the region. For seismic risk management, the Hazus methodology [
9] offers a simplified method for quantifying bridge fragility for seismic risk studies. Bridge fragility curves provide a probabilistic relationship between seismic intensity measures, such as the spectral acceleration at a specific period, and the expected degree of damage (e.g., slight, moderate, extensive, or complete). The Hazus methodology applies fragility curves that were developed by Basöz and Mander [
10] and utilizes the geometric and mechanical properties of a bridge to estimate fragility curves based on simplified mechanics-based equations. Recent studies have demonstrated the effectiveness of fragility analysis in diverse engineering applications, including nuclear power plant equipment [
11], buildings [
12], and bridge structures [
13]. Additionally, recent research has emphasized the importance of probabilistic updating techniques to enhance the accuracy of fragility models for a wider range of structures. For example, Li and Kurata [
14] proposed a probabilistic updating approach for assessing seismic damage in steel moment-resisting frames, while Minnucci et al. [
15] introduced an innovative fragility-based method for evaluating failure mechanisms and damage progression in bridges. Additionally, Gao et al. [
16] developed a stochastic harmonic function-based method for simulating traffic loads to assess fatigue damage in concrete bridges, further demonstrating the versatility of probabilistic fragility assessments across various structural systems. Incorporating such probabilistic methodologies not only broadens the scope of fragility analysis but also improves the reliability of seismic risk evaluations for both reinforced concrete and other structural systems.
The Basöz and Mander [
10] method used in Hazus [
9] provided estimates of the lateral displacement capacity of bridge columns based on predefined drift ratio limits for each damage state that are multiplied by the height of the bridge pier to estimate the displacement capacity. They proposed two sets of fixed drift limits for bridges with limited seismic design consideration (non-seismic) and for those that were designed with ductility-based approaches (seismic), with the main assumption that the drift limits for older non-seismic columns are lower than seismic columns. In addition, it should be mentioned that a non-seismic bridge pier nevertheless has an inherent limited ductility.
This paper presents the development of an improved methodology for simplified seismic risk assessment of bridges based on fragility curves. The fragility curves are used to calculate a new index called the Damage Margin Ratio (DMR), which is compared with a Threshold Damage Ratio (TDMR) at a seismic intensity with a predefined probability of exceedance. Seismic risk is conducted by evaluating if the DMR is lower or higher than the TDMR.
In the context of the proposed risk assessment method based on the new indices DMR and TDMR, a simplified fragility analysis approach is better suited than detailed dynamic time history analysis methods for assessing a bridge inventory since it can be implemented for a large portfolio of bridges. The methodology, therefore, applies the Basöz and Mander [
10] method used in Hazus with an updated model for the ductility ratio of reinforced concrete column piers for fragility assessment at two damage states: cover spalling and bar buckling, corresponding to slight and extensive damage states, respectively.
The updated ductility ratios are based on literature references using a large database of experimental results on cyclic tests of reinforced concrete circular columns. The fragility analysis methodology involves the evaluation of the lateral strength capacity of bridge columns and the corresponding displacement thresholds for the two damage states. Median Intensity Measures (IMs) in terms of Peak Ground Acceleration (PGA) of the fragility curves for the threshold damage states are developed using closed-form relationships based on the capacity spectrum method. Finally, a comparative assessment is conducted for the relative seismic risk and performance of non-seismic and seismic bridges corresponding to the seismic hazard values at 10% and 2% probability of exceedance in 50 years for 7 urban centers in the province of Quebec as a case study application of the methodology with a discussion on the implications for seismic performance.
2. Fragility Analysis Framework
In the context of regional-scale damage assessment of highway bridge networks. Bridges are typically categorized based on several structural characteristics, including the structural system of the superstructure, such as whether it is a girder or slab type; the number of spans comprising the bridge; the type of pier, which may be single, multiple-column bents, or pier walls; the abutment type and bearings supporting the bridge; and the level of span continuity across the structure. Additionally, consideration is given to the seismic design level of the bridge class. This encompasses factors such as strength reduction due to cyclic loading, prescribed drift limits, and the longitudinal reinforced ratio of the columns. This study focuses on the analysis of a multi-span continuous girder reinforced concrete bridge with columns comprised of multi-column bent. The mechanics-based fragility analysis method proposed by Basöz and Mander [
10] is employed to compute the median peak ground acceleration
for the damage state
associated with each of the four defined damage states: slight, moderate, extensive, and complete (see Equation (1)). The determination of
relies on a set of key parameters, including:
The lateral capacity of the bridge pier columns ();
The displacement thresholds for each damage state ;
A factor that modifies the two-dimensional capacity of the column to account for three-dimensional arch action of the deck ();
The Soil amplification factor for a 1.0 s period ();
The Damage state modification coefficients for short and long periods and respectively.
In this context, the factor
is determined based on the span continuity and the type of bearing [
17]. For continuous bridges,
is typically assumed to be 0.33. Here,
represents the number of spans in the bridge (with
being the number of supporting piers). Additionally,
and
denote the column drift and displacement limits for a specific damage state, respectively.
and
are the spectral acceleration values for
s and
s, respectively. The transition period between the constant acceleration and the decrease in acceleration of the idealized input spectrum is given by Equation (6). Thus, the median peak ground acceleration for a damage state
is determined based on where the effective period of the bridge pier (of the considered damage state
) lies in relation to
. Specifically, if the effective period of the bridge pier is shorter than
the short-period modification coefficient
is more influential in determining the
. Conversely, if the effective period is longer than
the long-period modification coefficient
become more significant.
and
are the coefficients of modification of the seismic demand for short and long periods, respectively, to consider the hysteretic energy dissipation at the response level corresponding to each damage state. The selection and application of these coefficients directly impact the calculated
values, which are the median intensity measures used to define the fragility curves for each damage state. Therefore, the effective period plays a crucial role in relating the structural response to the relevant part of the seismic spectrum, which is subsequently reflected in the fragility estimates. In general, for most of the multi-span bridges, the effective period is typically higher than the
.
The parameters
and
respectively, stand for the diameter of the pier and the height of the bridge pier.
signifies the strength reduction factor due to cyclic loading for each damage state.
denotes the fixity factor, where it equals 1 for multi-column bent and 0.5 for single-column cantilever action. Furthermore,
represents the volumetric ratio of longitudinal reinforcement,
stands for the yield stress of longitudinal reinforcement.
represents concrete compression strength.
signifies the average dead load axial stress ratio on the column.
denotes the dead load on each column of the deck and
represents the cross-sectional gross area of the column. For comprehensive insights into the derivation of the listed Equations, readers are directed to references [
10,
17].
The values of
,
and
in Equations (1), (3) and (4), respectively, depend on the seismic design level of the columns. Basöz and Mander [
10] proposed corresponding values of the above parameters for both non-seismic and seismic designed bridges. For slight damage state,
,
and
are equal to 0.005, 1.00, and 1.33 for non-seismic design level, respectively, and 0.01, 1.00, and 1.44 for seismic design levels, respectively. For extensive damage state,
,
and
are equal to 0.02, 0.60, and 1.49 for non-seismic design level, respectively, and 0.05, 0.80, and 1.63 for seismic design levels, respectively. These values are based on experimental and analytical data for bridge columns in North America.
The lognormal standard deviation of each damage state fragility curve (
) is set to 0.6. This typical value is estimated based on analytical and experimental studies, represented by the following equation:
In the total standard deviation of the fragility curve, the variability in seismic demand (
) is equal to 0.5, capacity (
) is equal to 0.25, and modelling of the bridge (
) is equal to 0.2 [
17]. This simplified procedure for fragility analysis serves as the foundation for existing fragility curves in the Hazus risk assessment tool [
9], applying input parameters compatible with bridge construction in North America.
The pier columns are the primary structural elements of bridges, and their degradation can quickly compromise the integrity of the structure. The observed damage primarily affects unconfined concrete, confined concrete, and reinforcement [
18]. Phenomena observed after an earthquake include spalling of unconfined concrete, yielding of reinforcements, rebars buckling, shear failure of confined concrete, and flexural failure of the pier [
19]. Since displacement ductility varies according to the bridge’s year of construction (or design era), which is in turn dependent on geometrical and material properties and reinforcement detailing, there is a need for improved methodology for updating the displacement capacity calculation and comparing the results in terms of fragility curves.
The proposed methodology in this paper includes the following steps:
At first, data obtained from literature experimental testing studies were compiled to establish ductility ratios for each damage state;
Thereafter, using bridge pier characteristics, a lateral displacement of the bridge pier equations for ductile and non-ductile circular bridge columns is proposed based on the corresponding displacement ductility;
Then, the displacement capacities for each damage state are used directly instead of fixed drift in Equation (3) to correlate displacement limits to median (Equation (1)).
Finally, fragility curves are generated and compared with those developed using fixed drift limits for seismic and non-seismic columns for a case study bridge.
3. Displacement Limits for Damage States
For the updated fragility methodology, two specific damage states (e.g., cover spalling and bar buckling) have been adopted to align with the slight and extensive damage states defined by Basöz and Mander [
10]. These damage states are introduced based on previous experimental studies that quantify ductility ratios corresponding to both non-ductile/non-seismic columns [
20] and ductile/seismic columns [
21]. In fact, Basöz and Mander [
10] define the slight damage state as minor spalling, which corresponds to the cover spalling damage identified in [
21] for seismic columns and minor spalling in [
20] for non-seismic columns. Similarly, Basöz and Mander [
10] definition of extensive damage is characterized as a column with significant degradation or being structurally unsafe without collapse. The extensive damage can be mapped to the bar buckling state as observed and defined in both [
20] and [
21]. Thus, the two damage states used in this study are adapted interpretations of existing classifications, intended to reflect physically observable and experimentally validated column behaviors in seismic conditions.
3.1. Slight Damage
Slight damage can be correlated to cover spalling, which is a critical aspect within the framework of serviceability limit states. The financial implications associated with repairing concrete spalling can be substantial. Spalling detrimentally affects the lateral stiffness of columns, hinders the lateral restraint of longitudinal bars, and consequently escalates the risk of bar buckling. Moreover, it has a direct impact on the bond integrity between the longitudinal reinforcement and the concrete [
22,
23,
24]. As the lateral load intensifies, the dimensions of the spalled area expand, leading to a partial or complete loss of concrete cover, thus exposing the underlying reinforcing steel.
The displacement ductility
at spalling is given by this equation:
where
is the displacement at spalling.
is equal to the displacement
in Equation (1). It should be mentioned that yield displacement
can be approximated by this equation:
where H is the bridge column height. Physically, this equation represents the lateral displacement experienced at the top of the column when the reinforcement first yields under lateral loading [
19]. The yield curvature
can be approximated as a function of the column diameter
and the yield strain of longitudinal reinforcement
as:
With equal to 2.45 for circular columns and is the yield strain of longitudinal reinforcement steel is taken equal to , where is the tensile strength of the reinforcement steel and is the Young’s modulus of steel bars taken equal to 200,000 MPa.
For non-seismic columns, the lognormal distribution parameters for the displacement ductility at minor spalling are analyzed based on the experimental database presented in [
20] with a corresponding median value of displacement ductility
of
. In fact, modern bridges are expected to perform better than non-ductile older bridges [
20]. In this latter study, the lognormal distribution parameters for the displacement ductility at DS2 (minor spalling) are analyzed with the median value
is estimated at 1.75 with 16 and 84 percentiles of 1.12 and 2.74, respectively [
20].
For seismic columns, Berry and Eberhard [
21] presented the statistical analysis of a database of spiral ductile columns tested under cyclic loading with a corresponding median value for displacement ductility
of
. In fact, Berry and Eberhard [
21] presented the statistical analysis of a database of spiral ductile columns tested under cyclic loading with the mean value and the coefficient of variation (COV) estimated at 2.31 and 46%, respectively. For fragility analysis, material probabilistic distribution generally follows a lognormal distribution. Therefore, the lognormal parameters, median, 16th, and 84th percentiles are estimated as follow:
is estimated by 2.09 with 1.35 and 3.25.
3.2. Extensive Damage
Extensive damage state is considered in this study to correspond to bar buckling, which refers to the observable bending of longitudinal bars within the plastic hinge zone. Various factors contribute to this phenomenon, including the Poisson’s effect of compressed concrete, the post-yield behavior of reinforcement bars, and the stiffness of transverse reinforcement elements (such as spacing and bar size) [
25,
26,
27]. In fact, bar buckling refers to the lateral instability of longitudinal reinforcement in the plastic hinge region of a column, typically under cyclic inelastic loading. As seismic demand increases, longitudinal bars yield and undergo large strain reversals. Inadequate transverse reinforcement (e.g., hoops or spirals) fails to provide sufficient lateral restraint, allowing the longitudinal bars to buckle. The mechanical interaction between the longitudinal and transverse reinforcement is crucial for maintaining column integrity. Transverse reinforcement plays a dual role: it confines the concrete core and restrains the longitudinal bars laterally. As the core concrete compresses and laterally expands, the confining reinforcement resists this expansion [
28]. Once cover concrete spalls, the full confinement demand shifts to the transverse reinforcement. If this confinement is insufficient, longitudinal bars become susceptible to outward buckling, particularly with high axial load and plastic hinge formation [
29].
The progression of bar buckling typically begins at localized zones where reinforcement lacks lateral support, often occurring over several tie spacings. Experimental studies show that inadequate confinement leads to buckling across multiple tie points, causing strength and stiffness degradation, reduced energy dissipation, and potential bar fracture [
30]. This degradation severely compromises the column’s seismic performance, potentially resulting in premature failure mechanisms such as shear failure or total collapse. Therefore, controlling bar buckling through proper detailing of transverse reinforcement is critical for enhancing the ductility, deformation capacity, and seismic resilience of reinforced concrete columns, allowing them to maintain structural integrity under large displacements.
Counteracting factors against bar buckling include having a thick concrete cover and a low spiral pitch. When the transverse reinforcement’s stiffness is insufficient, bars may buckle over multiple hoops, leading to a loss of contact between the concrete core and transverse reinforcement, thus disrupting the confinement provided by the hoops.
Syntzirma et al. [
31] conducted analyses indicating that the deformation capacity of flexural members, influenced by bar buckling, varies based on the loading history. Moyer and Kowalsky [
32] noted that cyclic load reversals lead to gradual accumulation of tensile steel strain in longitudinal bars of bridge columns, potentially causing bar buckling. They also suggested that the likelihood of buckling depends on the maximum crack width, as only the longitudinal bars resist compression until cracks close upon load reversal. Bar buckling can also contribute to transverse reinforcement fracturing. For bar buckling, the value of the
is given by the following equation:
where
is the displacement of the column at bar buckling, and
is the yield displacement.
is equal to
in Equation (1). For non-seismic columns, the median displacement ductility at bar buckling is estimated as
based on the statistical analysis of the experimental database presented in [
20].
In fact, as mentioned in [
20], the displacement ductility at bar buckling for non-ductile columns is estimated by its lognormal distribution parameters are:
with 16 and 84 percentiles of
and
For seismic columns, the median displacement ductility is estimated as
based on statistical analysis presented in [
21]. As mentioned in this latter reference, for a database of ductile columns, the lognormal distribution parameters are estimated by:
with 16 and 84 percentiles of
and
, respectively.
4. Fragility Analysis of a Case Study Bridge
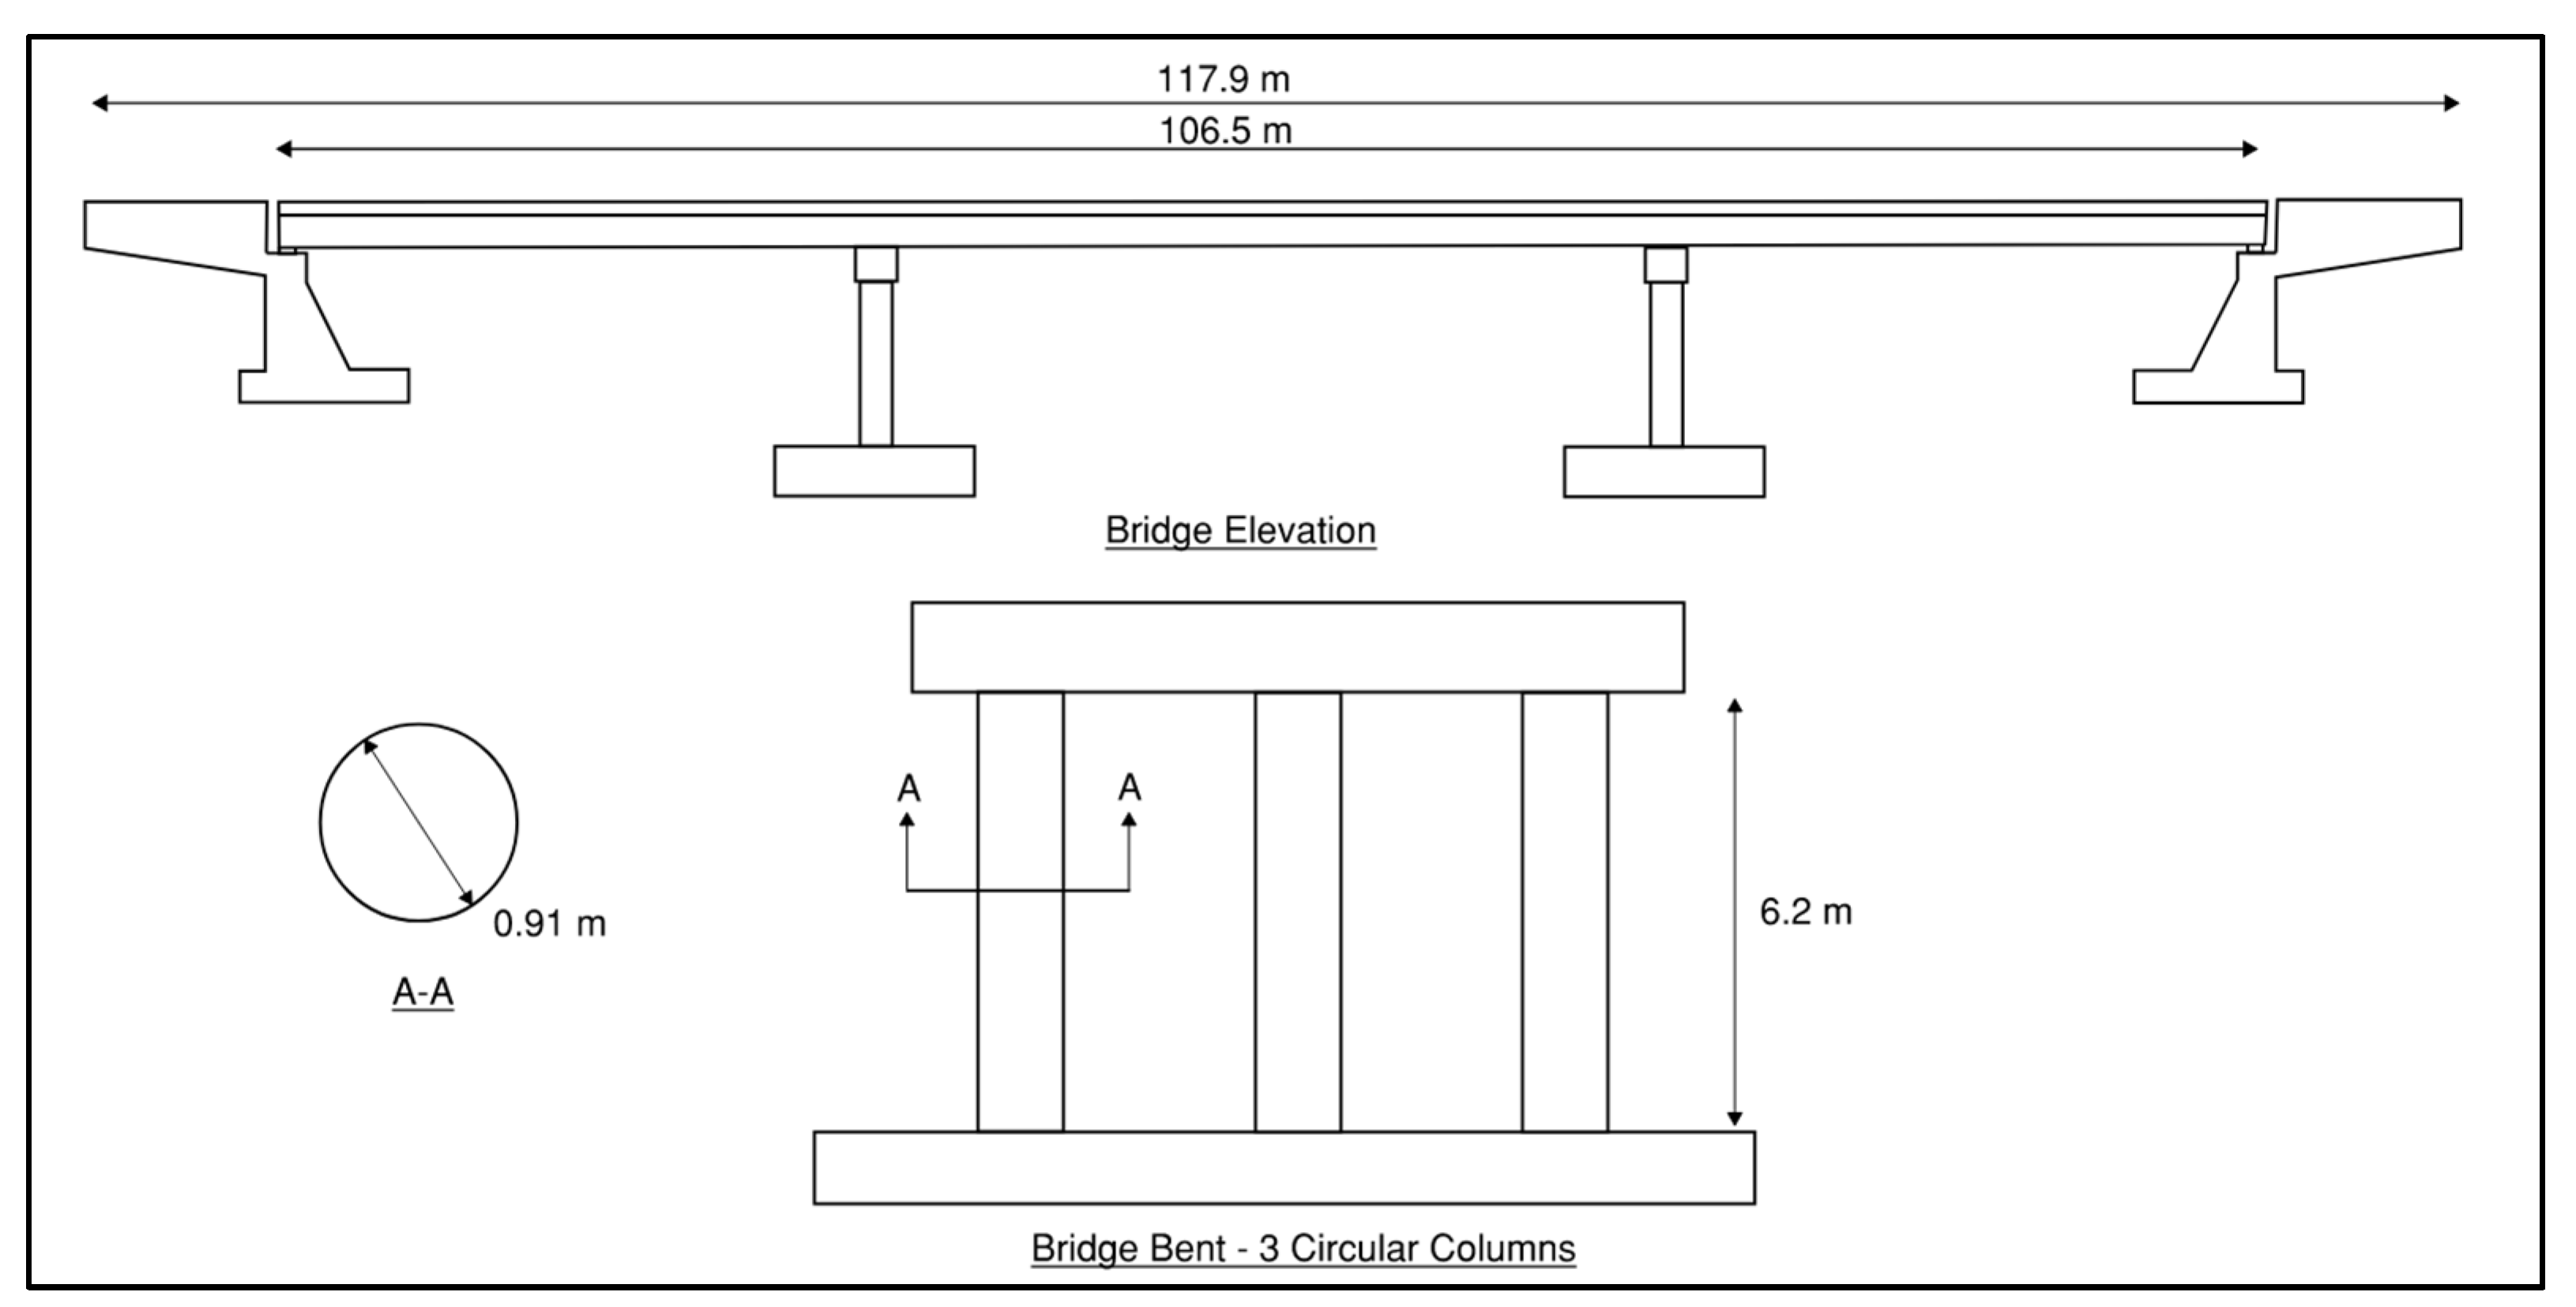
This section demonstrates the application of the simplified mechanics-based method for fragility analysis for a case study bridge representative of the multi-span continuous concrete girder bridge class in Quebec, Canada (
Figure 1). According to statistical data on bridge classes in Quebec [
33], approximately,
of highway bridges fall under the category of multi-span continuous concrete girder bridges. The geometrical parameters for the case study bridge have been assumed based on the characteristics of a real bridge located in Trois-Rivieres, Quebec, Canada, that has been studied in the literature [
34]. The bridge span is
m in length and
m in width, with piers consisting of multiple columns standing at a height of
m (
Figure 1). It consists of three spans supported by two concrete piers and two seat-type wing-wall abutments.
The piers, serving as rigid frames in the transverse direction, are composed of a transverse beam supported by three circular reinforced concrete columns, each with a diameter of m, resting on shallow foundations. The superstructure comprises a concrete deck supported by six AASHTO-type V precast concrete girders.
The concrete compression strength (
) was assumed to be 28 MPa. In the context of Quebec, Canada, the selection of this value of the average concrete compressive strength is consistent with regional engineering practices. The selection of site class C is consistent with the Canadian seismic codes as an average site class [
35,
36]. The manual for the assessment of bridge load-bearing capacity [
8] consider that
varies depending on the year of construction of the bridge. This manual, a reference document for evaluating bridges managed by the Quebec Ministry of Transportation, specifies that
is 275 MPa for bridges built between 1973 and 1978 (assumed for non-seismic columns in this study) and 300 MPa for bridges built after 1978 (assumed for seismic columns in this study).The steel reinforcement ratio
was assumed to be 1% for non-seismic columns and 2% for seismic columns according to [
10].
The uniform hazard spectrum for Trois-rivieres was used to obtain the value of
in Equation (6), corresponding to mean seismic acceleration hazard values for a 2% in 50 years return period for seismic Site Class C and 5% damping at the location of the bridge, and is obtained from the site of the seismic hazard calculator of Natural Resources Canada [
36]. The obtained values of
,
that corresponds to the spectral ratio of
. These spectral values are integrated into the mechanics-based fragility model through the calculation of
(Equation (6)), which determines whether the seismic demand is governed by short- or long-period response. The short-period and long-period modification coefficients
and
were applied accordingly.
Therefore, two design scenarios are considered:
Non-seismic design: Reflects older construction with limited ductility, lower reinforcement ratios, and weaker lateral capacity. Fragility parameters are based on experimental studies of non-ductile columns [
20].
Seismic design: Reflects modern design practices, with improved confinement and energy dissipation. Fragility parameters are based on experimental testing of ductile circular Reinforced Concrete (RC) columns [
21].
These seismic design levels influence key fragility parameters such as displacement ductility (
), strength reduction factors (
), and displacement thresholds (
). Instead of using fixed drift ratios as in Basöz and Mander [
10], this study incorporates experimentally derived displacement ductility, ensuring improved estimation of the seismic performance.
Fragility curves were developed for each scenario using the modified equations outlined in
Section 2, integrating the design-level-specific material properties, geometric data, and regional seismic hazard. The resulting curves are used for the comparative evaluation of bridge performance and risk across different urban centers in Quebec under specified seismic return periods (10% and 2% in 50 years).
5. Fragility Curves Based on the Updated Method
The estimated median values of
for each damage state are presented in
Table 1. These values are derived using both the original fixed drift ratios from Basöz and Mander [
10] and the updated displacement ductility approach. The comparison focuses on the slight and extensive damage states described in
Section 3.
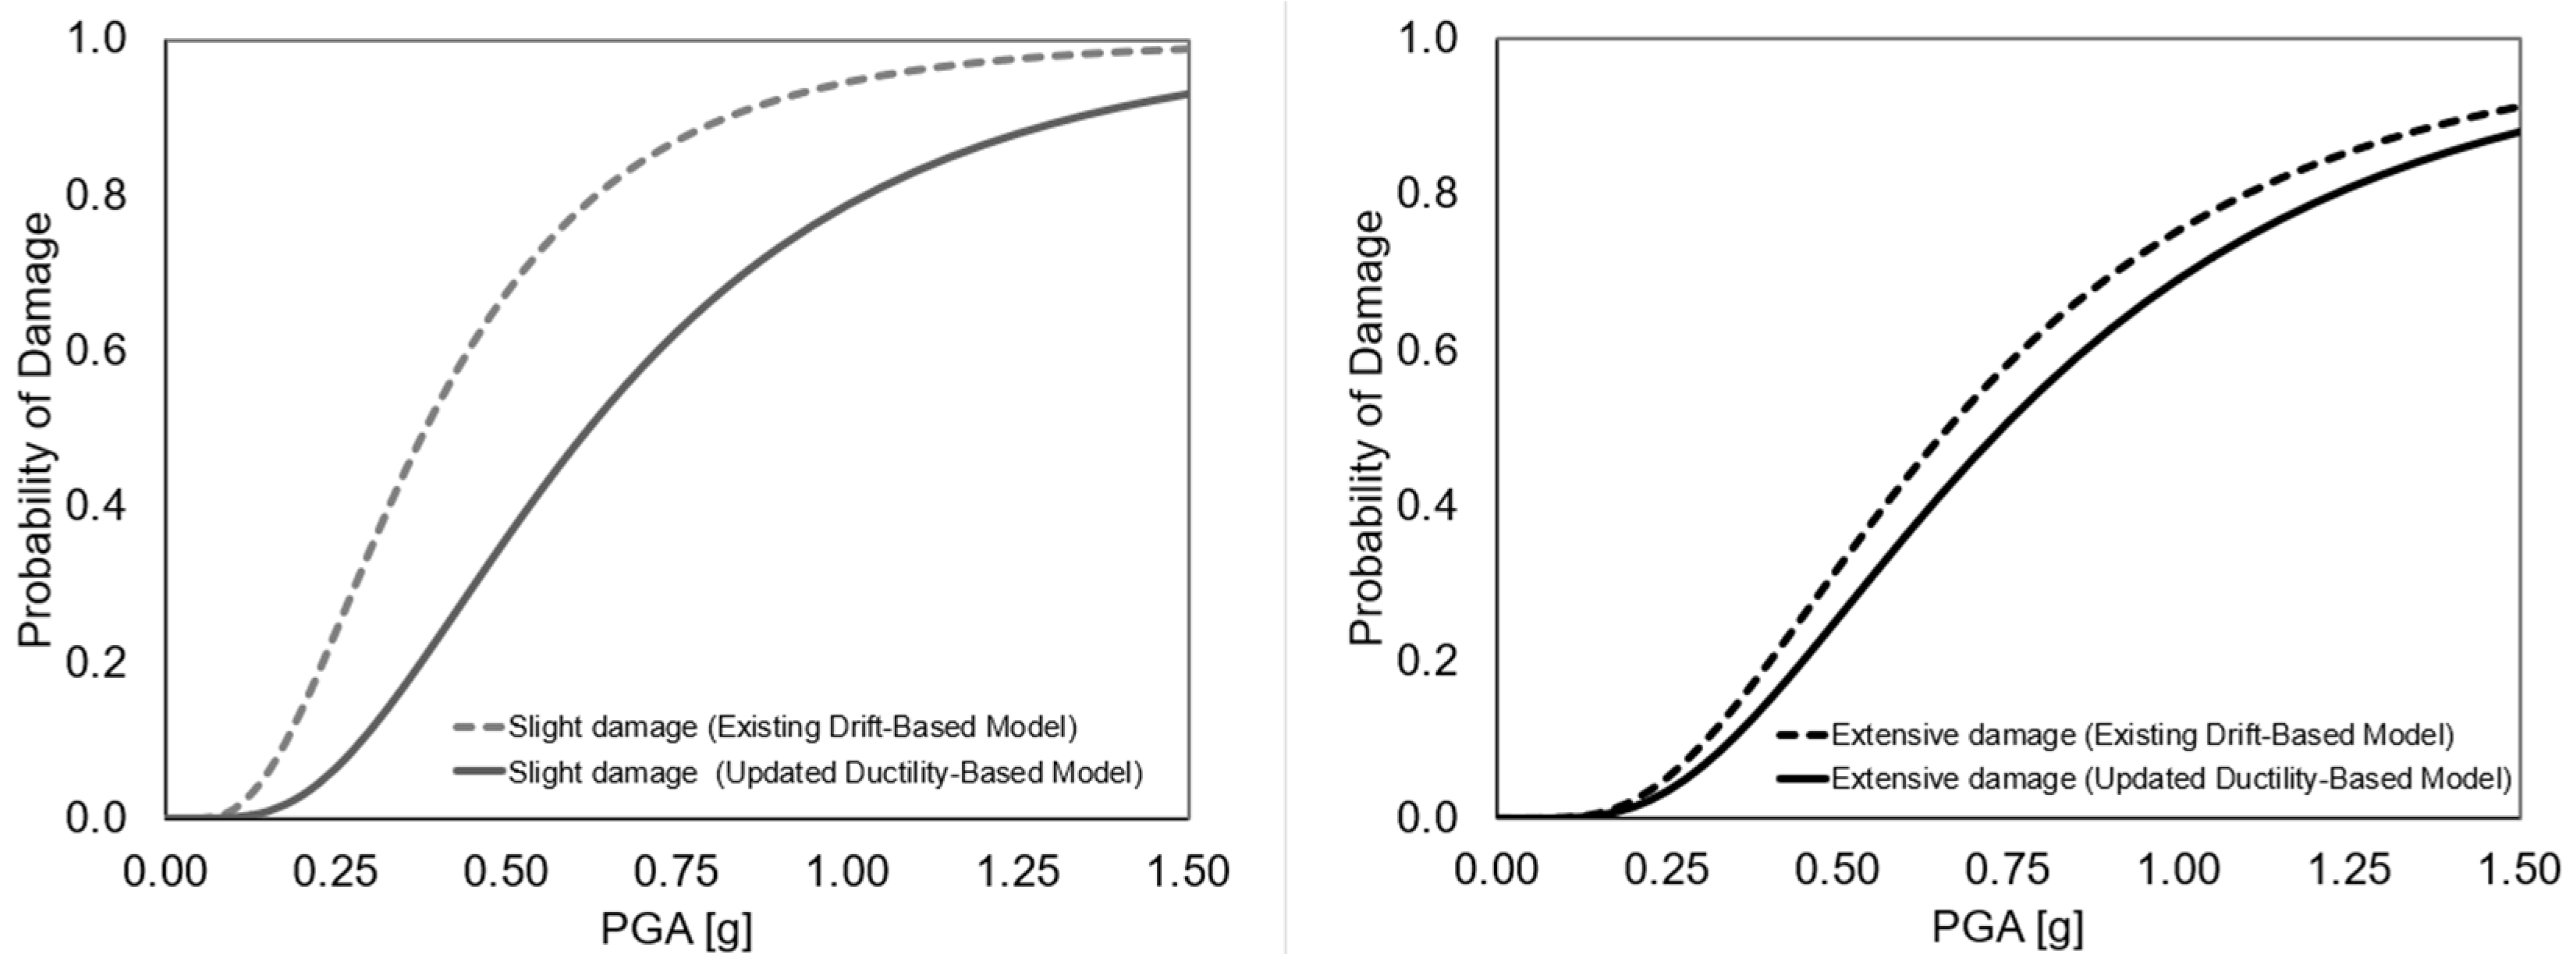
Figure 2 presents fragility curves for non-seismic bridge columns at slight and extensive damage states. The curves are developed using displacement ductility ratios proposed by Zhou and Kunnath [
20], incorporated into the updated ductility-based model. They are compared with curves derived from the existing drift-based model.
Figure 3 presents fragility curves for seismic bridge columns at slight and extensive damage states. The curves are developed using displacement ductility ratios proposed by Berry and Eberhard [
21], integrated into the updated ductility-based model. They are compared to those based on fixed drift ratios from the existing drift-based model.
For both ductile and non-ductile bridge piers, the median values predicted using the drift-based method and the updated method with a more comprehensive experimental database for ductility are comparable for the extensive damage state. For both non-seismic and ductile columns, the updated method predicts a higher median for the slight damage state—63% and 31% higher, respectively. This suggests that the drift values provided a conservative estimate of the slight damage state median capacity.
This increase is attributed to the use of experimentally derived ductility ratios. Specifically, for both non-seismic and seismic columns, the updated methodology reflects the nonlinear behavior observed in reinforced concrete columns during slight damage states such as cover spalling. As a result, higher displacement thresholds are reached before damage occurs, leading to higher corresponding median values.
A lower median gives lower seismic capacity for this specific damage state. When comparing the performance of non-seismic and seismic columns, the median of seismic columns is consistently higher for both damage states—56% higher for slight damage and 133% higher for extensive damage.
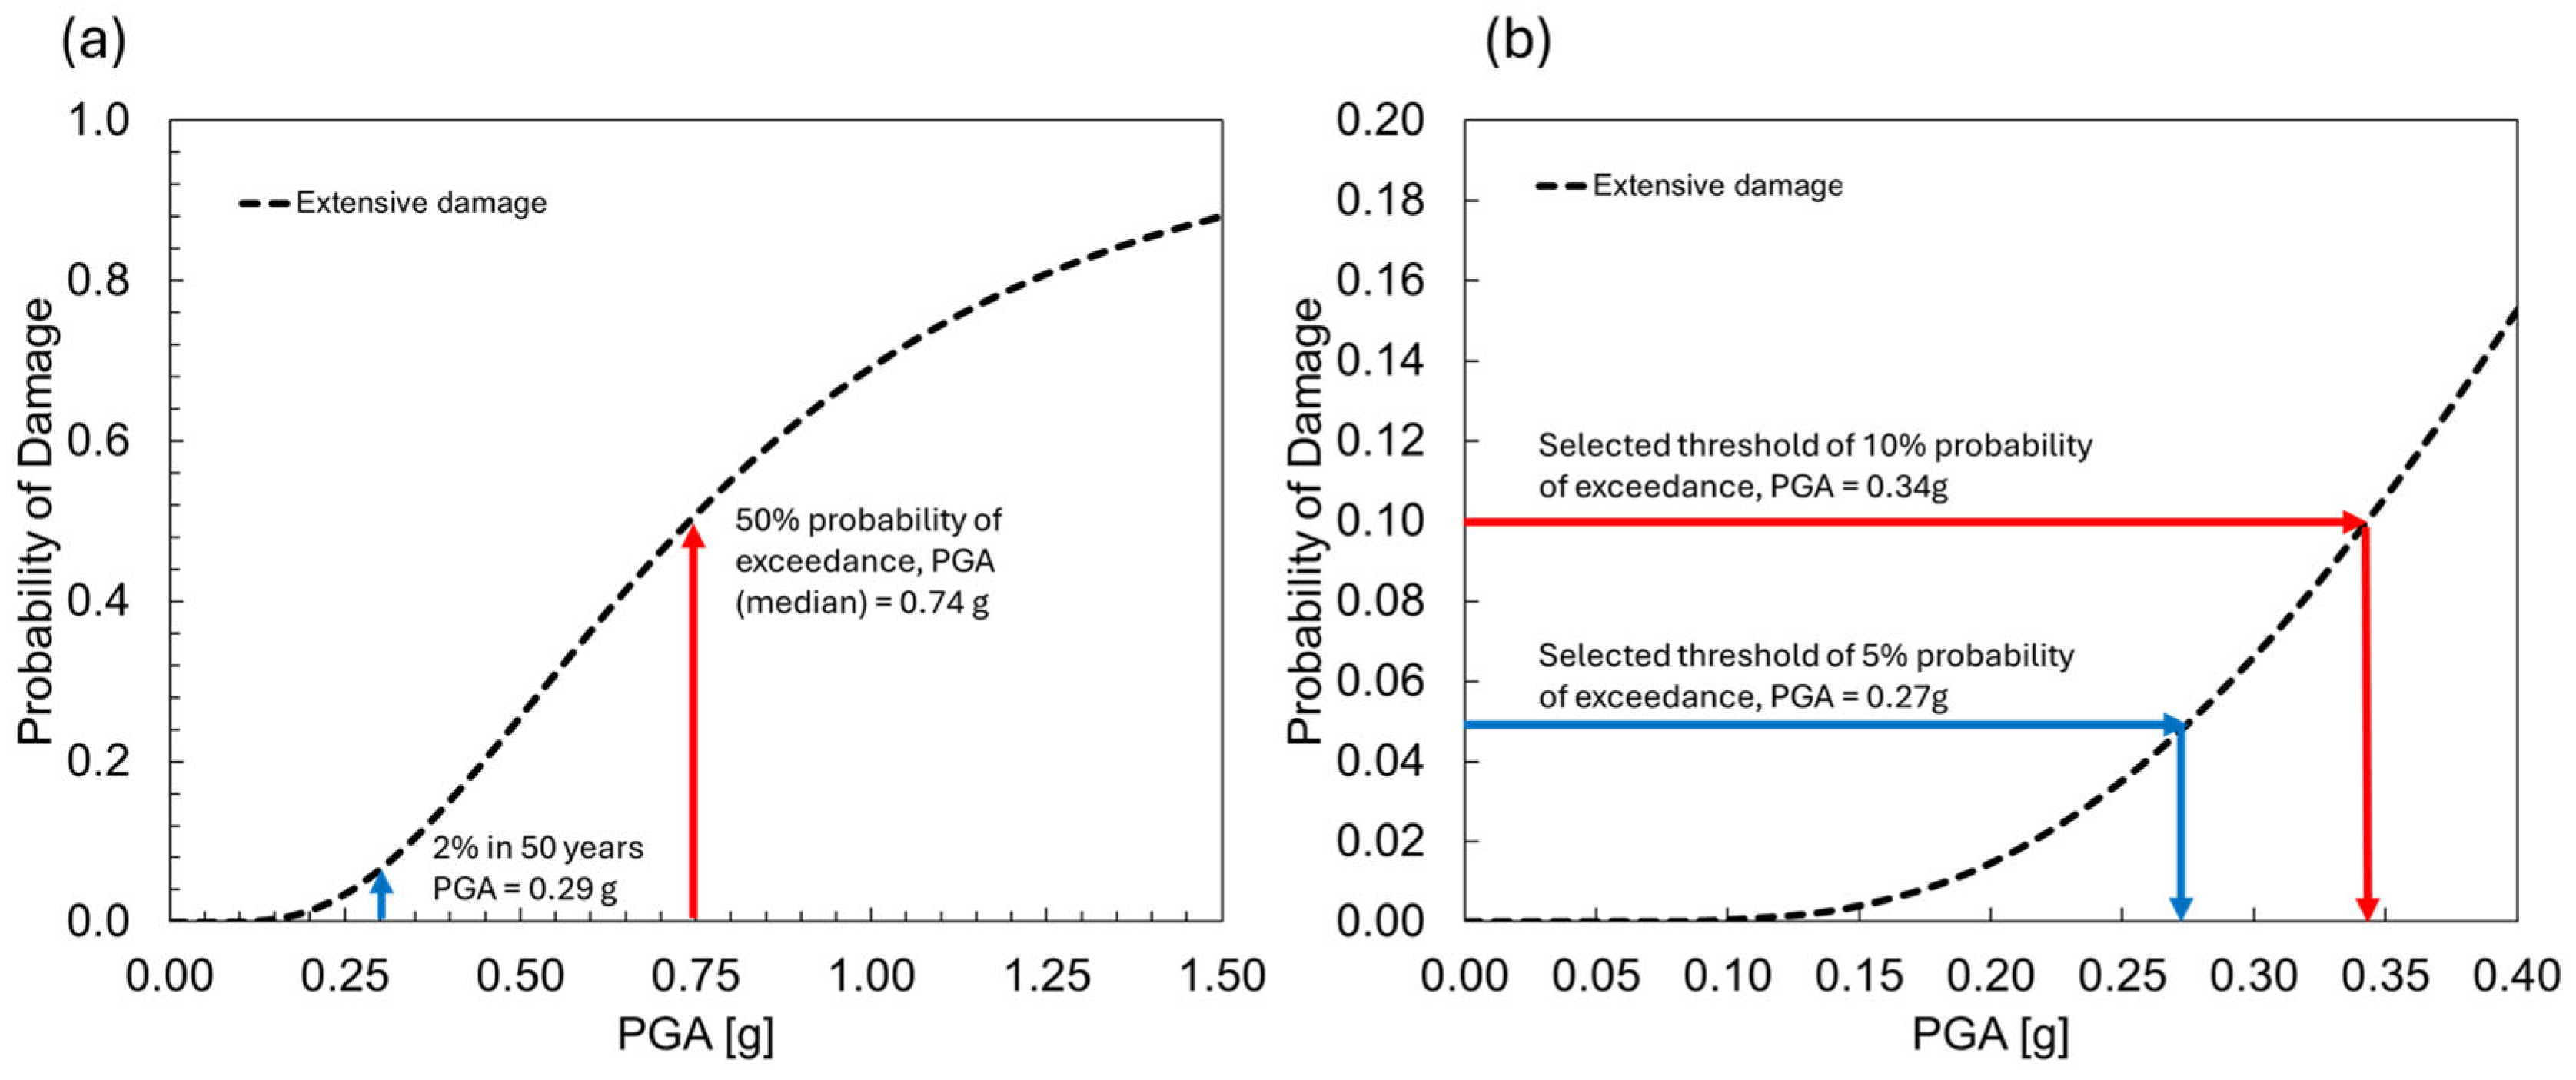
7. Application to Bridges Located in the Province of Quebec, Canada
This section presents an example application of the proposed risk assessment procedure to bridges located in major urban centers in the province of Quebec corresponding to varied seismic intensities. The objective is to evaluate the relative seismic risk for non-seismic and seismic designed bridges corresponding to seismic hazard levels outlined in the CSA S6:19 of 10% and 2% in 50 years of ground motions, respectively. For major route bridges, the expected performance of 10% in 50 years of ground motion is minimal damage, and that corresponds to the 2% in 50 years of extensive damage [
38]. On the other hand, the CSA S6:19 does not provide a specific threshold or acceptable probability of exceedance for these damage states. Hence, in this study, the proposed rapid risk assessment procedure is used to evaluate the relative performance in terms of passing or failing pre-defined thresholds or acceptable probability of exceedance of 5% and 10% for slight and extensive damage to estimate the TDMR. These values are then compared with the DMR using the developed fragility curves for both non-seismic and seismic bridges. The seismic hazard calculator of Natural Resources Canada [
35] has been used to extract the ground motion values for the 10% and 2% in 50 years ground motion.
It should be noted that the main assumption made to obtain the presented results is that the developed fragility curve in this study represents the average performance of typical multi-span concrete bridge in Quebec. Extensive study of the regional variations in the fragility curves with consideration of material and geometrical parameters is outside the scope of this paper and would be considered as future research for improved assessment of seismic performance of bridges. Therefore, the results presented herein should not be considered a definitive risk assessment but rather a demonstration of the proposed simplified and rapid risk assessment methodology.
Table 2 presents the PGA values for different ground motions (2% and 10% in 50 years) for the seven (7) Quebec’s seismic cities selected for the present study.
The results are presented as evaluations (pass or fail) based on the comparison of DMRs and TDMRs, using two threshold exceedance probabilities of 5% and 10% for the extensive and slight damage states, respectively. If the computed DMR for a city is lower than the TDMR, it is considered a «FAIL» case; meaning it fails the threshold acceptable probability criteria; otherwise, it is classified as a «PASS», meaning it passes the threshold acceptable probability criteria.
7.1. Risk Assessment and Screening for Non-Seismic Bridges
For the non-seismic bridge case in the seven selected cities,
Table 3 presents the «DMR, extensive» results as the DMR value, along with the screening results for the 5% and 10% threshold exceedance probability TDMRs for the extensive damage state. It is important to note that the
for the non-seismic bridge is set to 0.74g (see
Table 1). Additionally, the PGA values corresponding to the 5% and 10% threshold exceedance probabilities used for calculating the TDMRs are 0.27g and 0.34g, respectively. Consequently, the TDMR ratio thresholds for the 5% and 10% exceedance probabilities are «TDMR, 5%» equal to 2.74 and «TDMR, 10%» equal to 2.18.
Except for the city of Sherbrooke, the TDMR threshold exceedance probability of 5% is higher than the DMR for the extensive damage state for all cities. However, in the case of Trois-Rivières, when the TDMR is set to a higher exceedance probability of 5%, screening tests result in a «Fail». The results indicated that non-seismic bridges exhibit vulnerability due to their limited ductility capacity, leading to a higher risk of sustaining extensive damage if subjected to the high-intensity seismic event.
Table 4 presents the screening results for the 5% and 10% TDMRs for slight damage states. The non-seismic
is taken equal to 0.62g (See
Table 1). In addition, PGA values corresponding to threshold exceedance probabilities of 5% and 10% for the calculation of the TDMR are 0.23g and 0.29g, respectively. Then TDMRs ratios threshold exceedance probability of 5% and 10% are «TDMR, 5%» equal to 2.70 and «TDMR, 10%» equal to 2.14.
For all cities, the screening results indicate that the bridge case is «PASS» and TDMRs are lower than the DMRs ratios, indicating a low probability of exceedance of the slight damage state if subjected to a moderate-intensity event.
7.2. Risk Assessment for Seismic Bridges
For seismic bridges,
Table 5 presents the DMR values and the screening results for the 5% and 10% threshold probability of exceedance TDMRs for extensive damage states. It should be noted that
for seismic bridge is taken as equal to 1.73 g (See
Table 1). In addition, PGA values corresponding to threshold exceedance probabilities of 5% and 10% for the calculation of the TDMR are 0.63 g and 0.80 g, respectively. Then TDMRs ratios threshold exceedance probabilities of 5% and 10% are «TDMR, 5%» equal to 2.75 and «TDMR, 10%» equal to 2.16.
For all cities, the screening results are «PASS» for both TDMR exceedance probabilities of 5% and 10%. The PGA values corresponding to the 5% and 10% threshold exceedance probabilities used to calculate the TDMR are higher for the seismic bridge case compared to non-seismic bridges, meaning that higher ground motion intensities are required to exceed these values, which reflects higher seismic capacity. As a result, the obtained DMRs (see
Table 5) for the extensive seismic bridge case are higher than those for the non-seismic bridge. The results indicate that for seismic bridges, higher ductility capacity improved the seismic performance of the bridges that allowed it to pass even the lower threshold criteria of 5% exceedance probability of damage across all the studied cities.
Table 6 presents the screening results for the 5% and 10% TDMRs for slight damage states. The seismic
is taken equal to 0.97 g (See
Table 1). In addition, PGA values corresponding to threshold exceedance probabilities of 5% and 10% for the calculation of the TDMR are 0.36 g and 0.45 g, respectively. Then TDMRs ratios threshold exceedance probability of 5% and 10% are «TDMR, 5% » equal to 2.69 and «TDMR, 10%» equal to 2.16.
Table 6 shows that for screening results for both exceeding probabilities of 5% and 10%, the DMRs are higher than the TDMRs for all studied cities cases.
8. Discussion
This study presents a simplified methodology for seismic fragility analysis and rapid risk screening of multi-span concrete girder bridges, leveraging displacement ductility-based capacity estimates. The results are compared with previous fragility models, particularly those by Basöz and Mander [
10], and experimental datasets from Zhou and Kunnath [
20] and Berry and Eberhard [
21]. The proposed method uses displacement ductility ratios (i.e.,
and
) derived from experimental observations [
20,
21], multiplied by the yield displacement
(see Equations (8) and (11)) instead of drift ratios. This approach reflects the inelastic behavior of bridge piers under seismic loading and provides a more differentiated estimate of deformation capacity across column types. Consequently, larger displacements are predicted at slight and extensive damage states, leading to median
values of 63% and 31% higher for non-seismic and seismic columns, respectively, in the case of slight damage. This outcome highlights the conservatism of the drift-based model, particularly for early damage states.
For extensive damage states, the updated method produced PGA values similar to those in Basöz and Mander [
10], implying that the drift ratios remain a suitable conservative approximation for capturing severe damage modes such as bar buckling. However, the fragility analysis proposed in this study’s main applicability is limited to cases where the seismic response is dominated by pier behavior.
For bridges where bearings and abutments, govern the seismic response, the methodology would require further development to capture those additional sources of vulnerability. Fragility analysis for the bridge system in this case requires prediction of seismic demands and capacities for each component. A system-level fragility model can then be generated by integrating possible failure domains of all components based on the modelled response of bearing behavior and abutment stiffness and strength [
33,
39]. Damage states are then defined for both bearings and abutments based on their deformation capacities. Based on the results of three-dimensional nonlinear dynamic analyses for various bridge classes [
33], it was noted that the controlling fragile components depend on the bridge class and damage state of interest. At the lower damage states, the columns and elastomeric bearings tend to present increased fragility, while abutment wing walls are more vulnerable at higher damage states since they are protected by their gaps during small displacements of the system. Therefore, future simplified fragility assessments should consider bearings and abutments to provide a system-level understanding of seismic vulnerability based on calibrated modification factors of median fragility curves.
Slenderness effects and global stability of piers, while beyond the scope of the current analysis, are critical factors that should be incorporated in future research. Slender piers, especially those with high height-to-diameter ratios, are more susceptible to second-order (P–Δ) effects under seismic loading, which can lead to premature instability before material failure and reduces the displacement capacity of piers [
40]. Simplified pushover methods have been proposed to consider slenderness effects [
41], which highlighted the importance of their consideration for improved prediction of the lateral force-deformation capacity of bridge piers. Including these effects in future studies will improve the robustness and accuracy of seismic fragility models for slender piers.
A key contribution of this research is the introduction of the Damage Margin Ratio (DMR) and Threshold DMR (TDMR) framework for performance-based screening, adapted from the FEMA P-695 methodology. While several previous studies (e.g., [
35,
36]) developed probabilistic fragility models, this study offers a streamlined, quantifiable approach tailored for rapid prioritization at the network level.
The DMR–TDMR framework enables bridge owners and transportation agencies to make informed decisions regarding which bridges warrant more detailed evaluation or retrofitting. The method’s flexibility—allowing for customizable exceedance probability thresholds (e.g., 5% or 10%)—makes it adaptable to various policy contexts and local risk tolerances, a feature not directly addressed in earlier fragility assessment studies.
Although regional variability in fragility behavior was not explicitly modeled, the demonstration case study bridge was based on a real structure [
33] and reflects characteristics of Quebec’s existing concrete girder bridge inventory. While differences in material aging, construction quality, or geometric detailing may introduce uncertainty, the consideration of these factors was beyond the intended scope of this study and should be evaluated for further updating of the methodology. Therefore, the results presented herein should not be considered a definitive risk assessment but rather a demonstration of the proposed simplified and rapid risk assessment methodology. On the other hand, the comparative analyses presented in this study have highlighted that bridges designed with seismic detailing provisions passed all screening criteria, reaffirming the effectiveness of modern ductile design practices. This finding aligns with previous work by [
42], underscoring that proper capacity design and detailing significantly enhance the seismic performance of reinforced concrete bridges.


