

Analysis and Prediction of Traffic Conditions Using Machine Learning Models on Ikorodu Road in Lagos State, Nigeria


Abstract
1. Introduction
2. Literature Review
2.1. Traffic Flow and Congestion
2.2. Traditional Traffic Data Collection Methods
2.3. Machine Learning in Traffic Prediction
2.4. Applications on Machine Learning in Urban Transportation Systems
2.5. Challenges in Traffic Prediction and Model Validation
3. Materials and Methods
3.1. Study Area
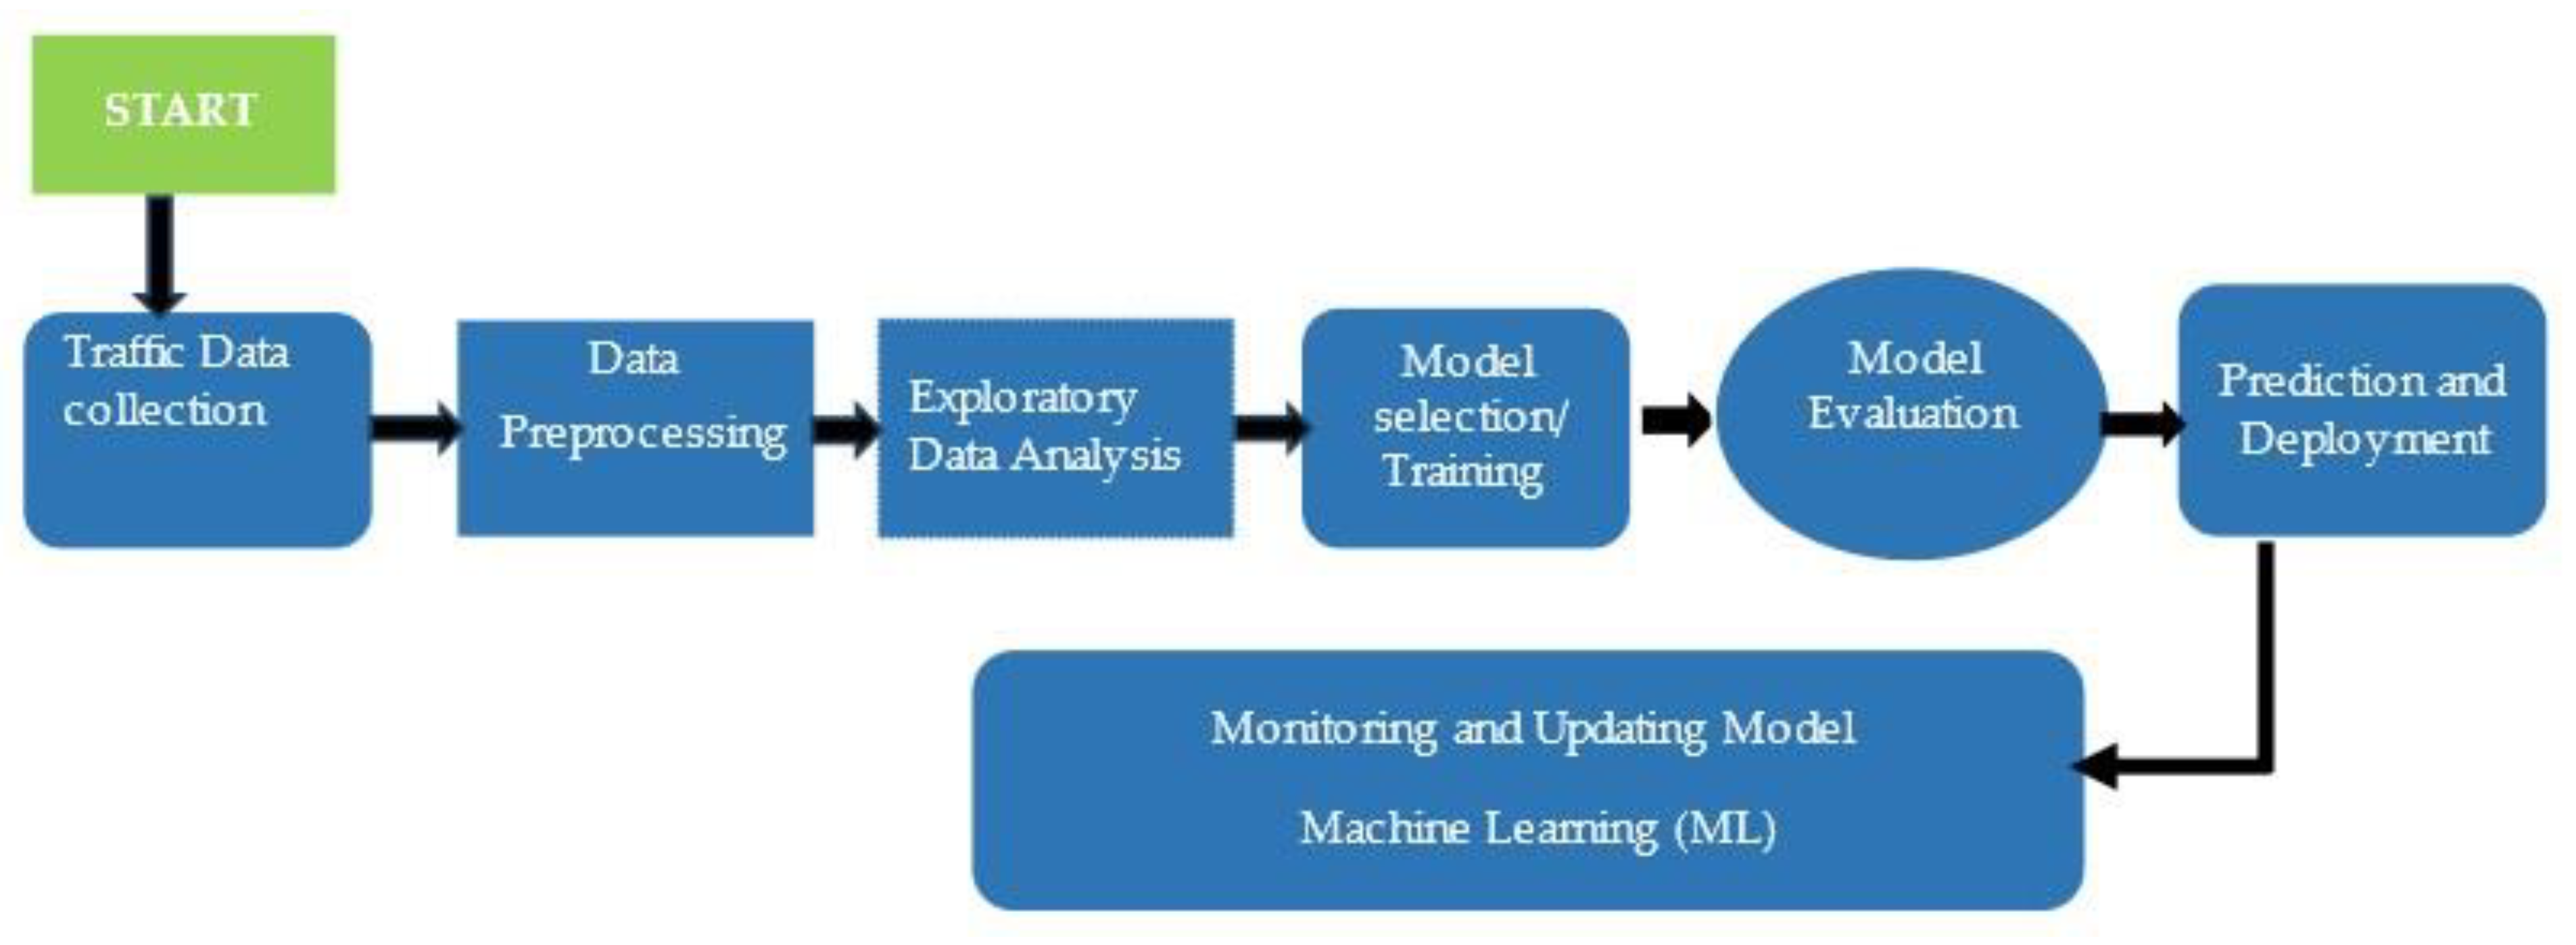
3.2. Methods
3.3. Traffic Count Survey
3.4. Machine Learning Models (ML)
3.4.1. Random Forest Model (RFC)
3.4.2. Decision Tree Model (DT)
3.4.3. Gradient Boosting Classifier (GBC)
3.5. Reliability Analysis
3.5.1. Descriptive Statistics
3.5.2. Correlation Analysis
3.5.3. Model Development
3.5.4. Data Preprocessing and Partitioning
3.5.5. Feature Selection
3.5.6. Model Evaluation and Validation
3.5.7. Predicting Traffic Conditions
4. Results and Discussion
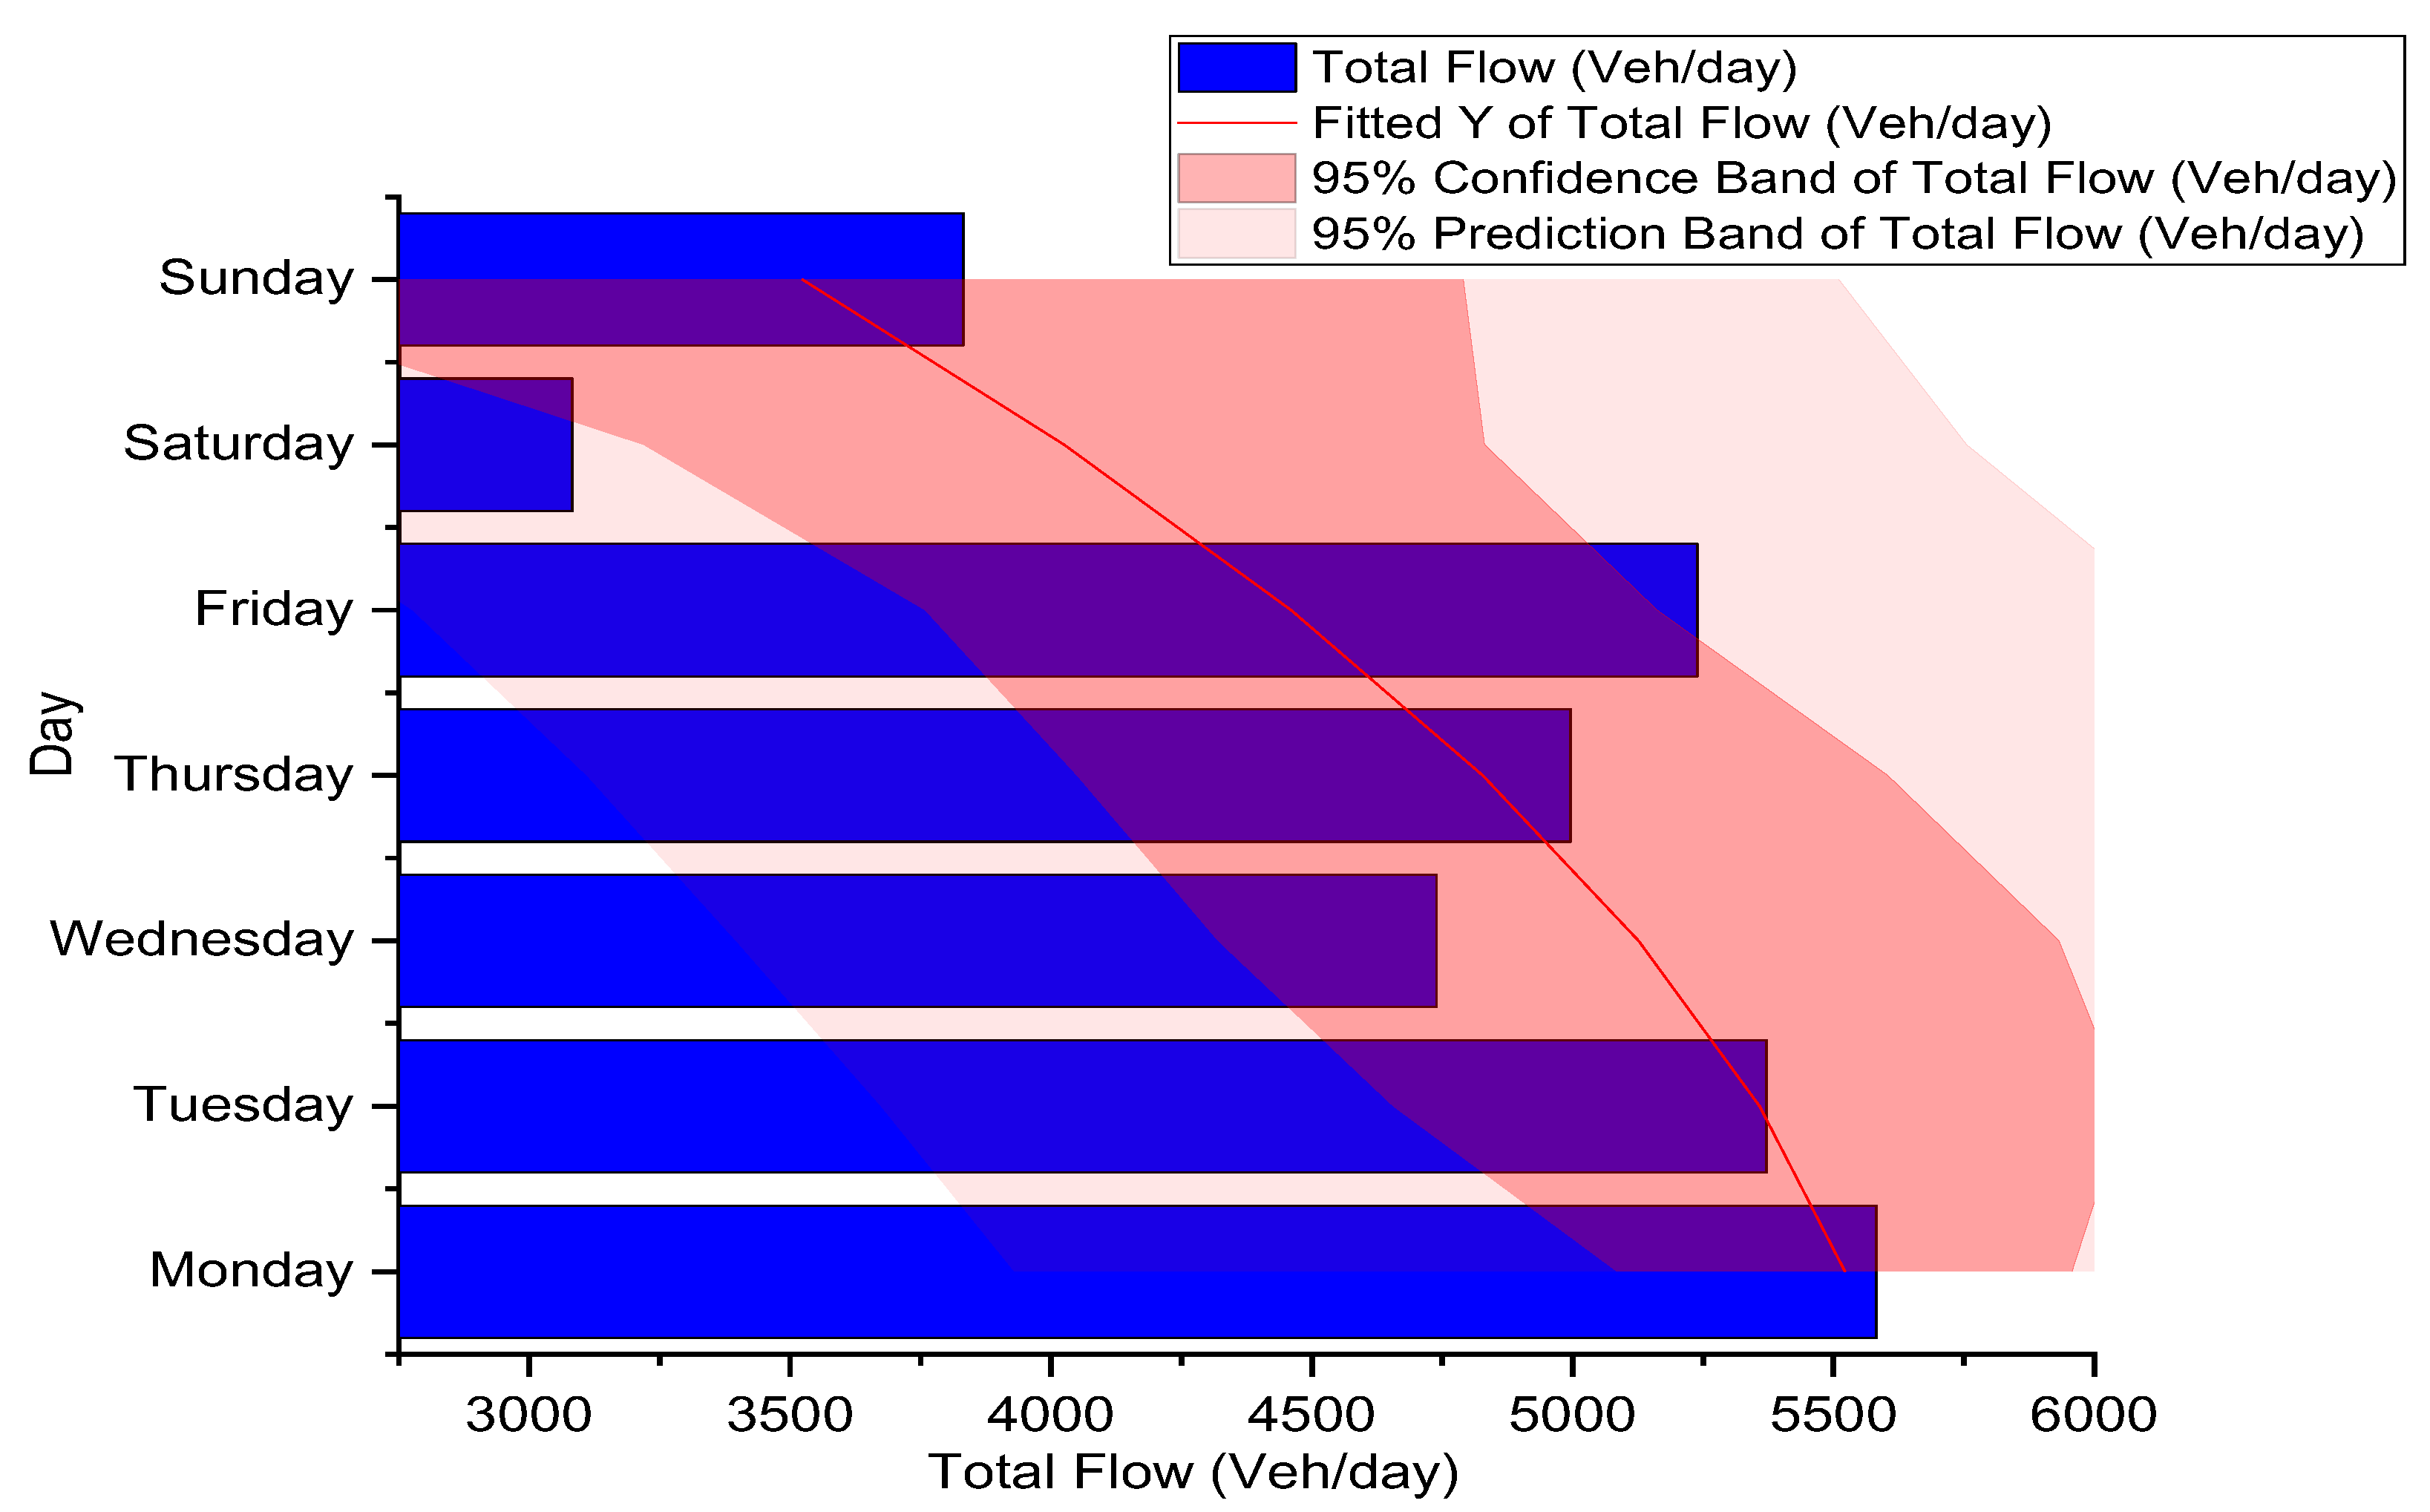
4.1. Daily Traffic Volume
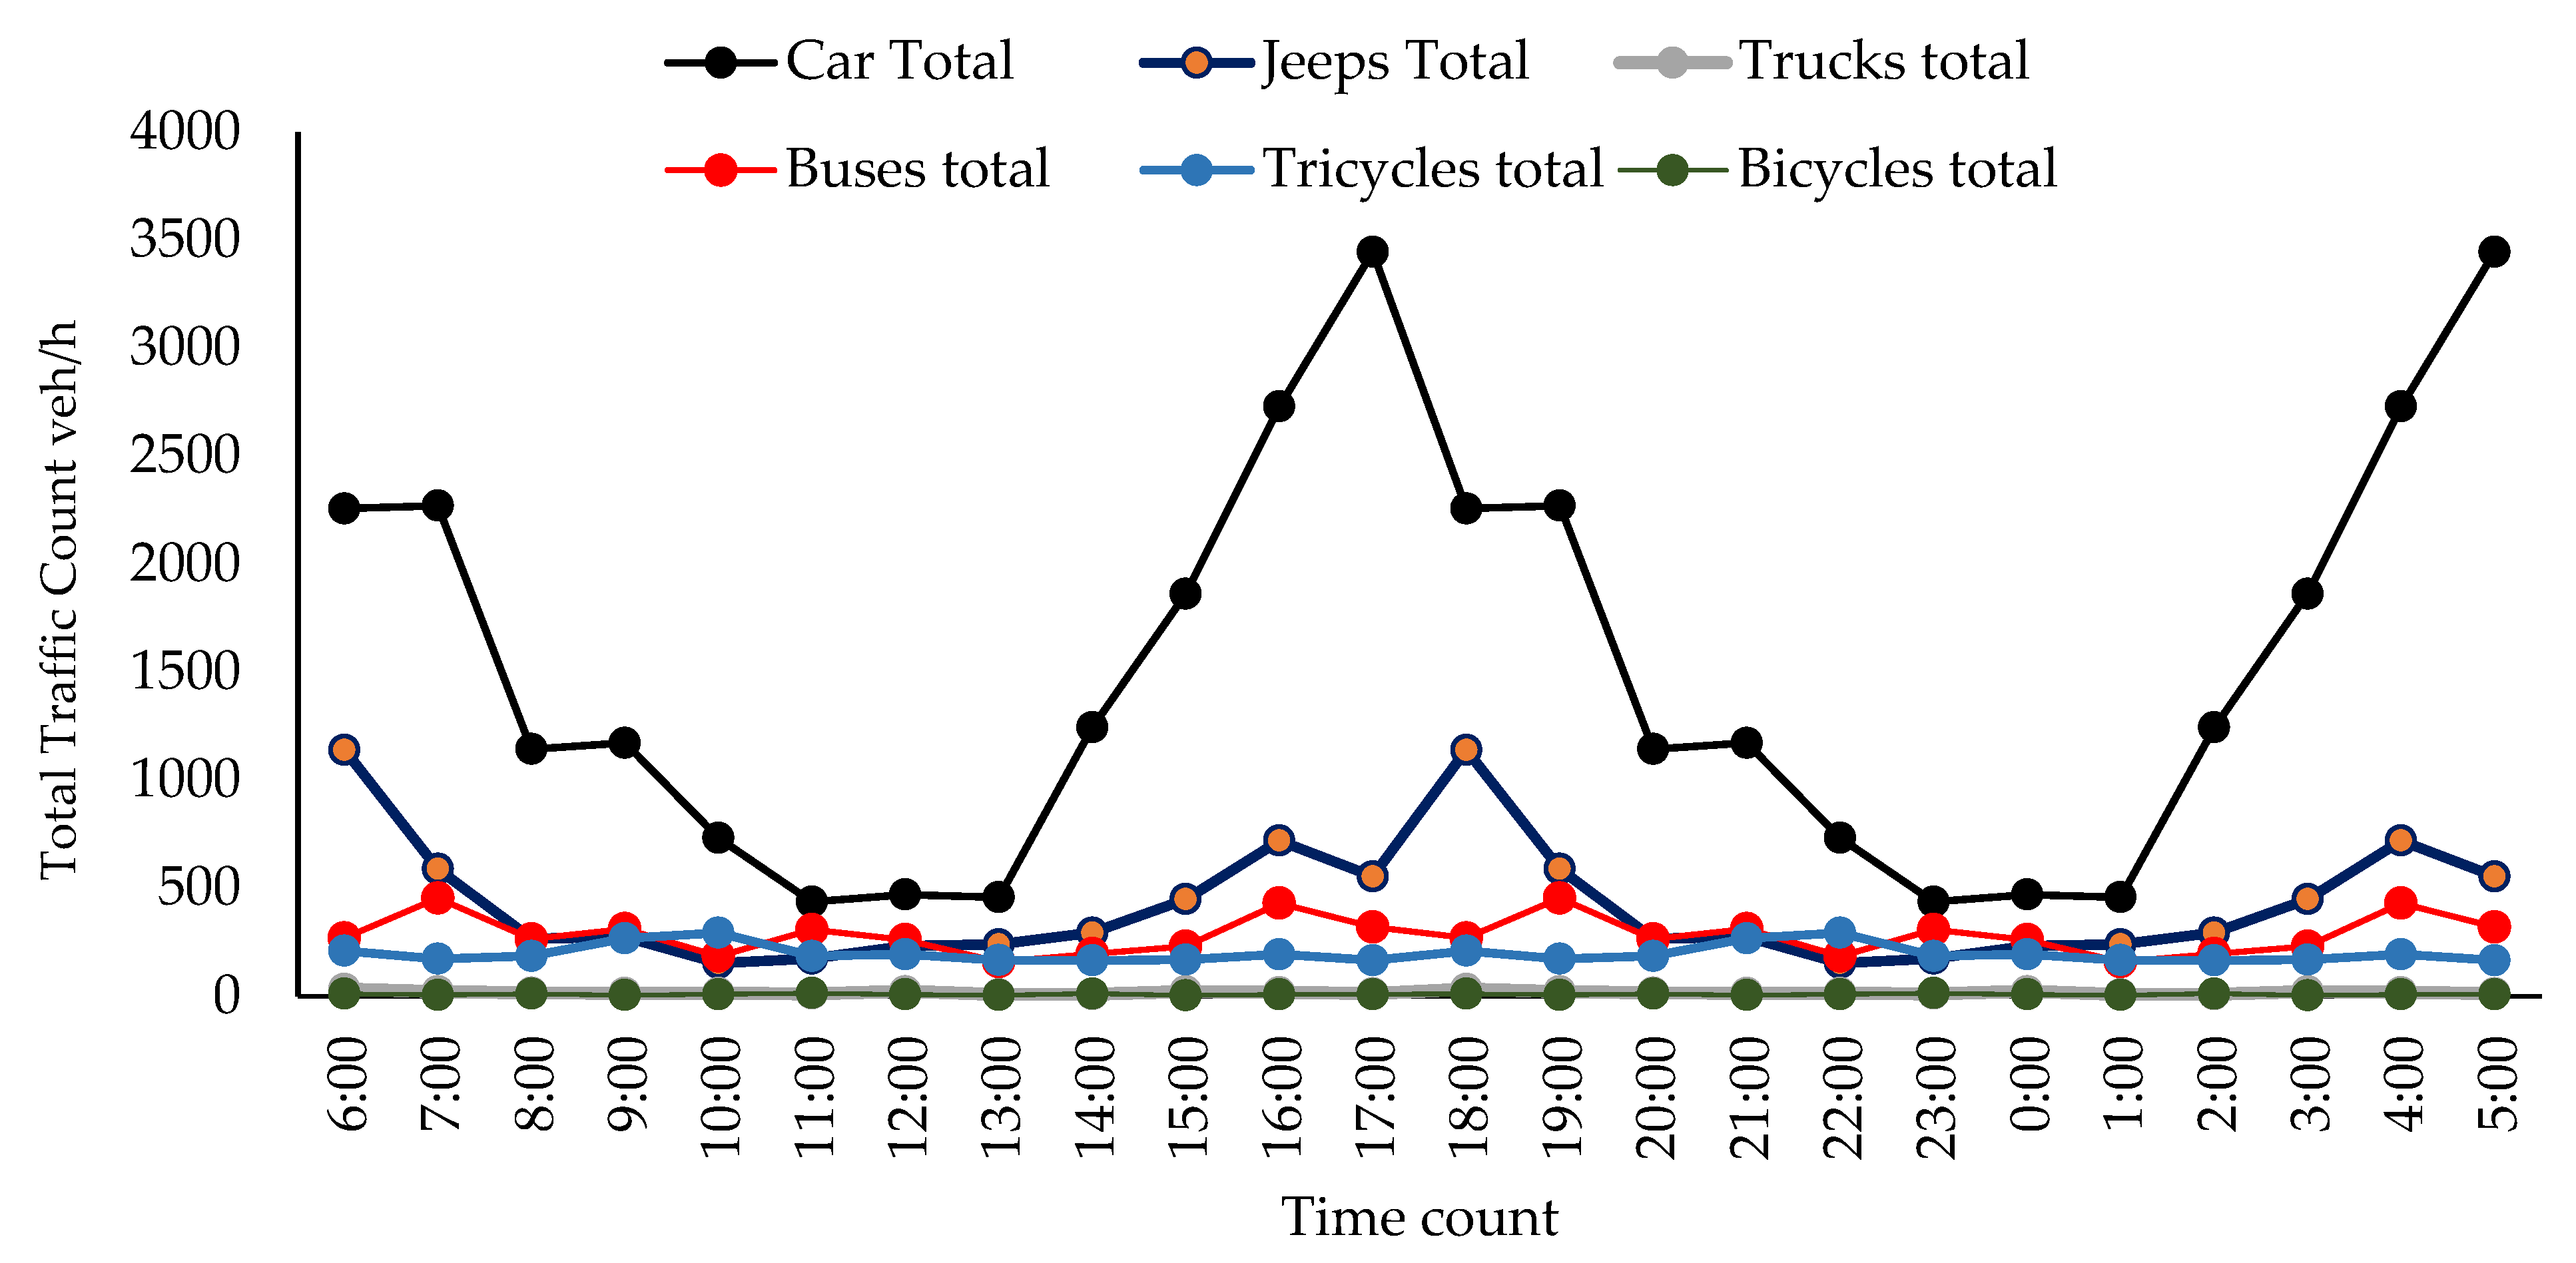
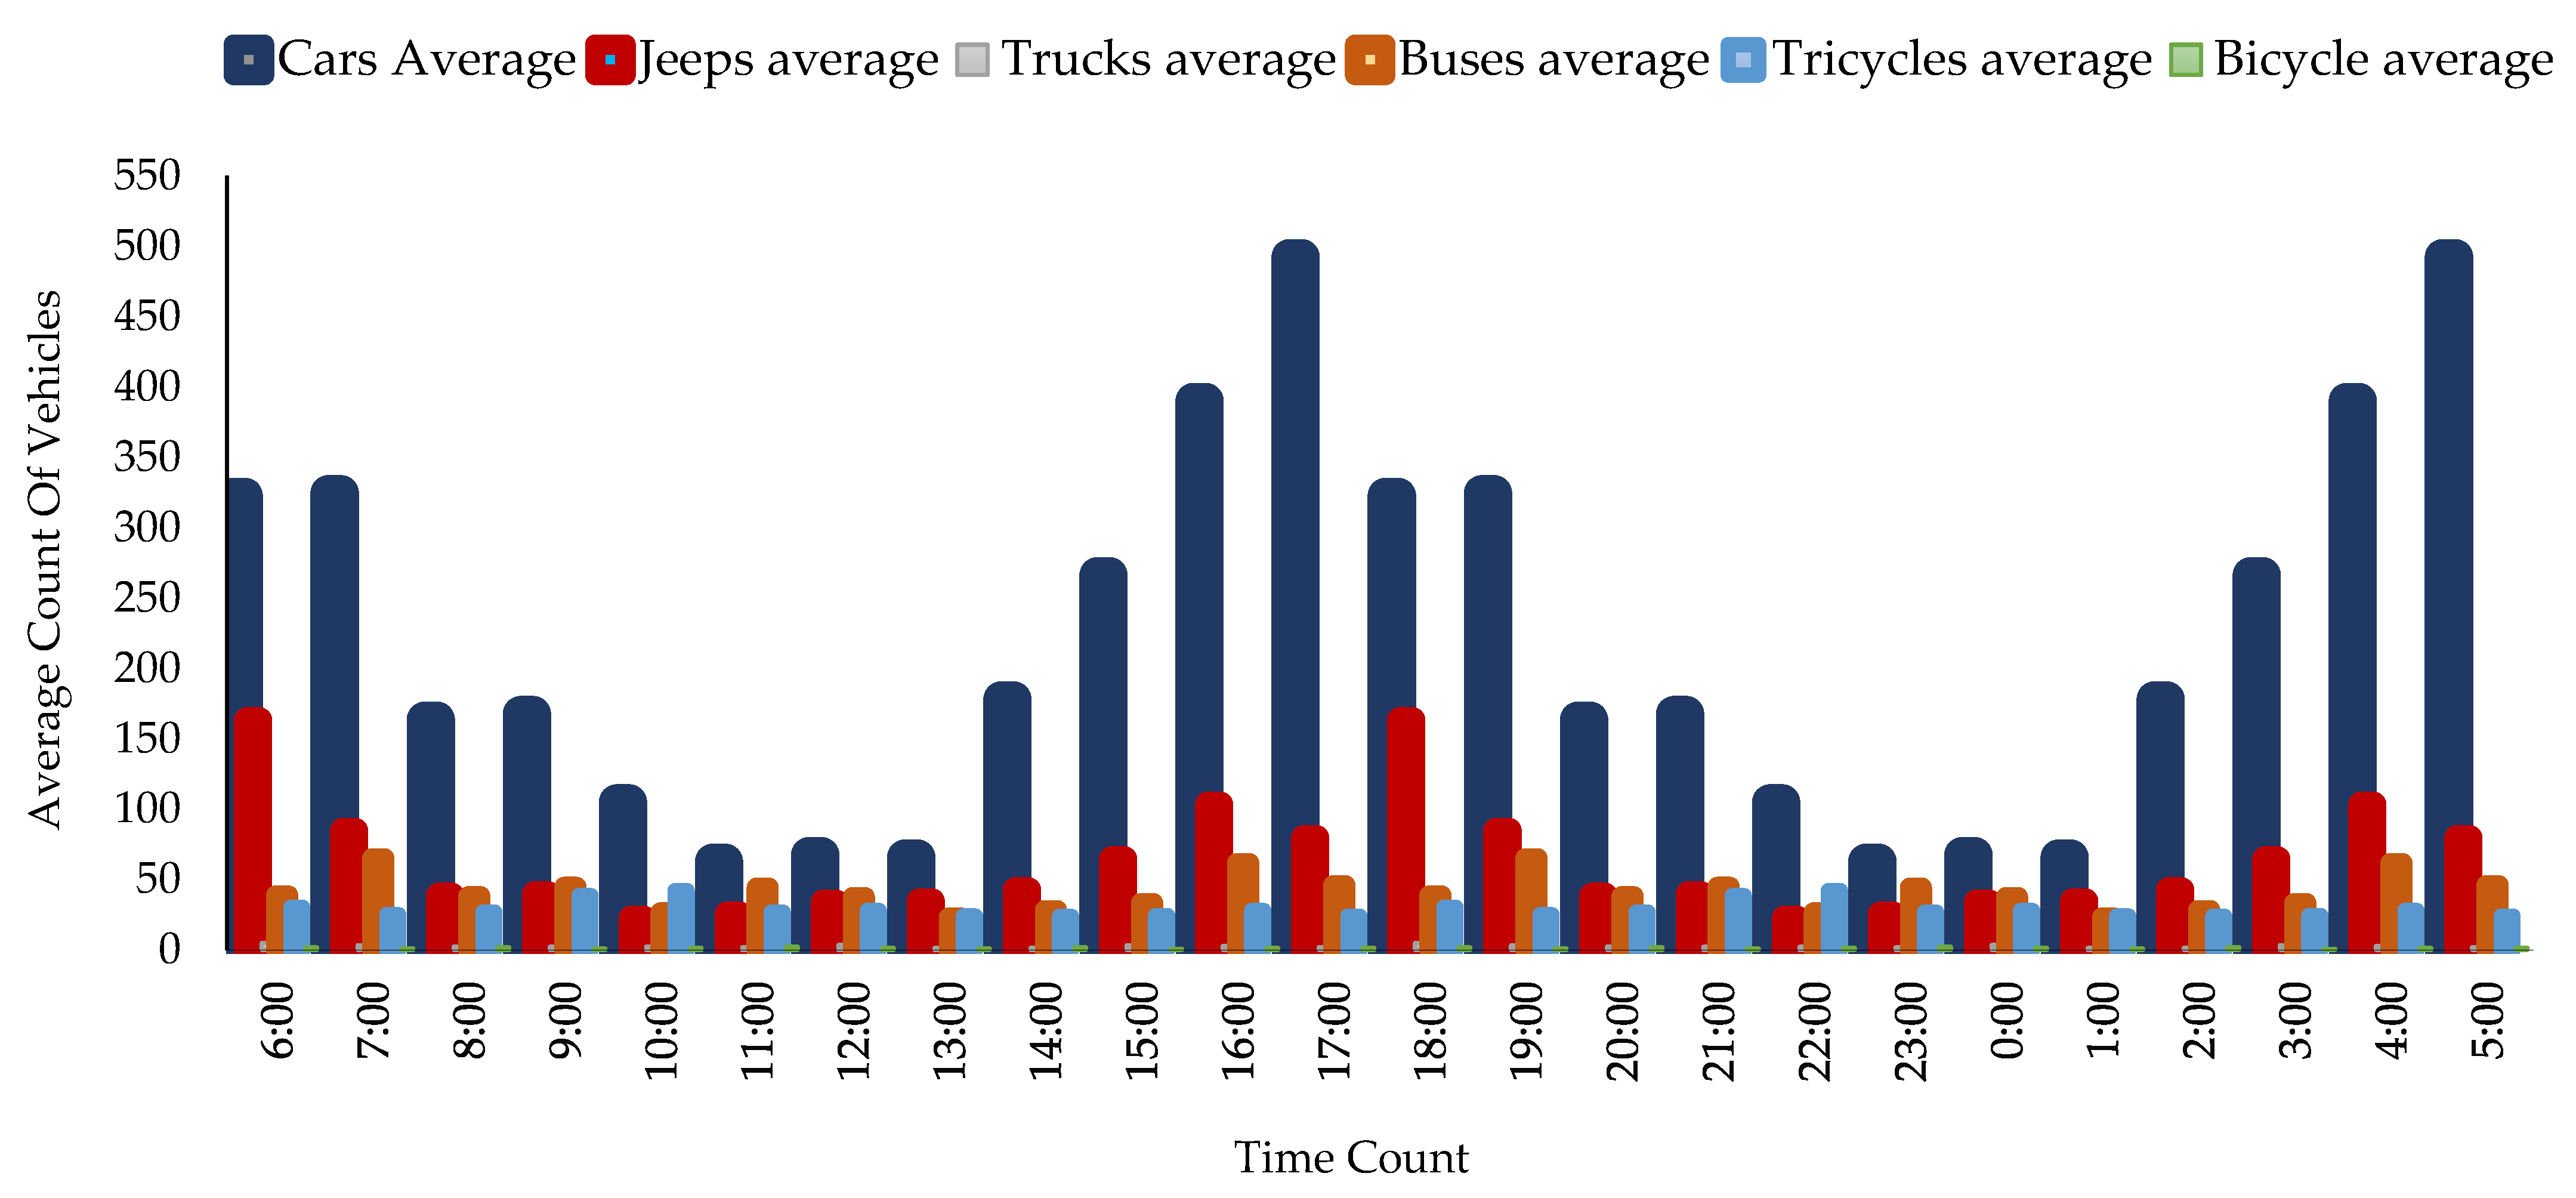
4.2. Time-Based Traffic Volume
4.3. Descriptive Statistics Results
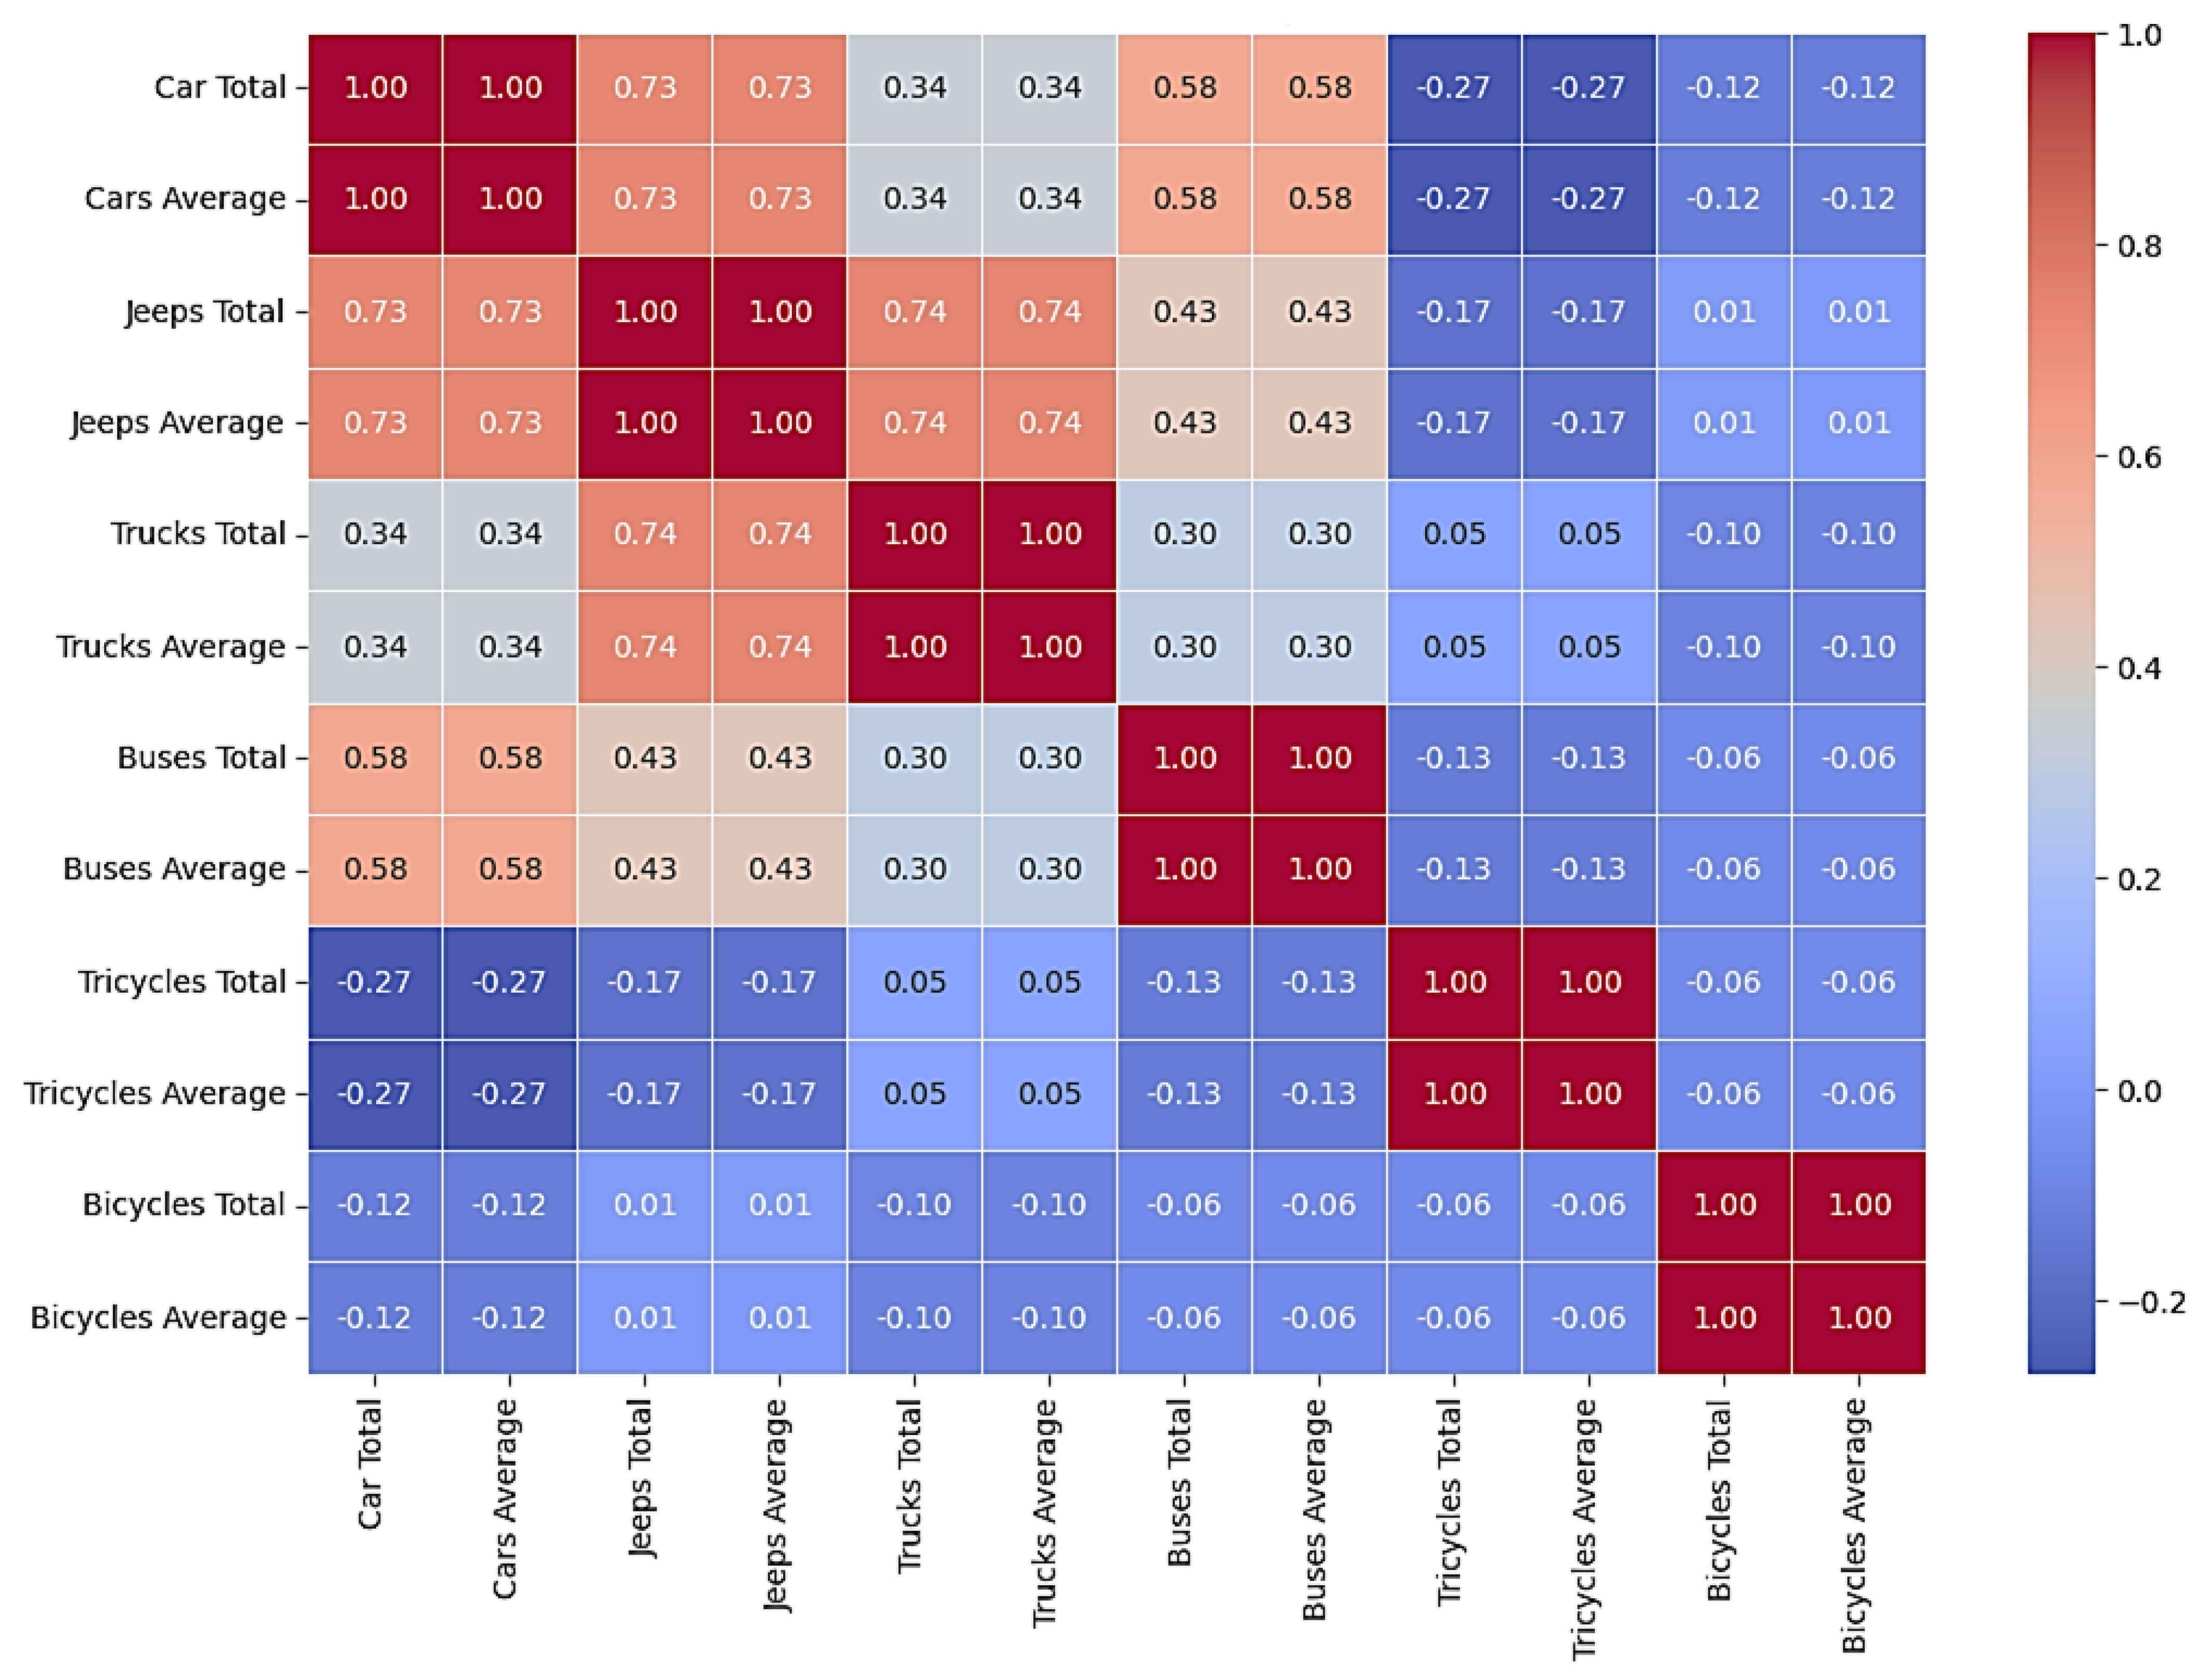
4.4. Correlation Analysis Results
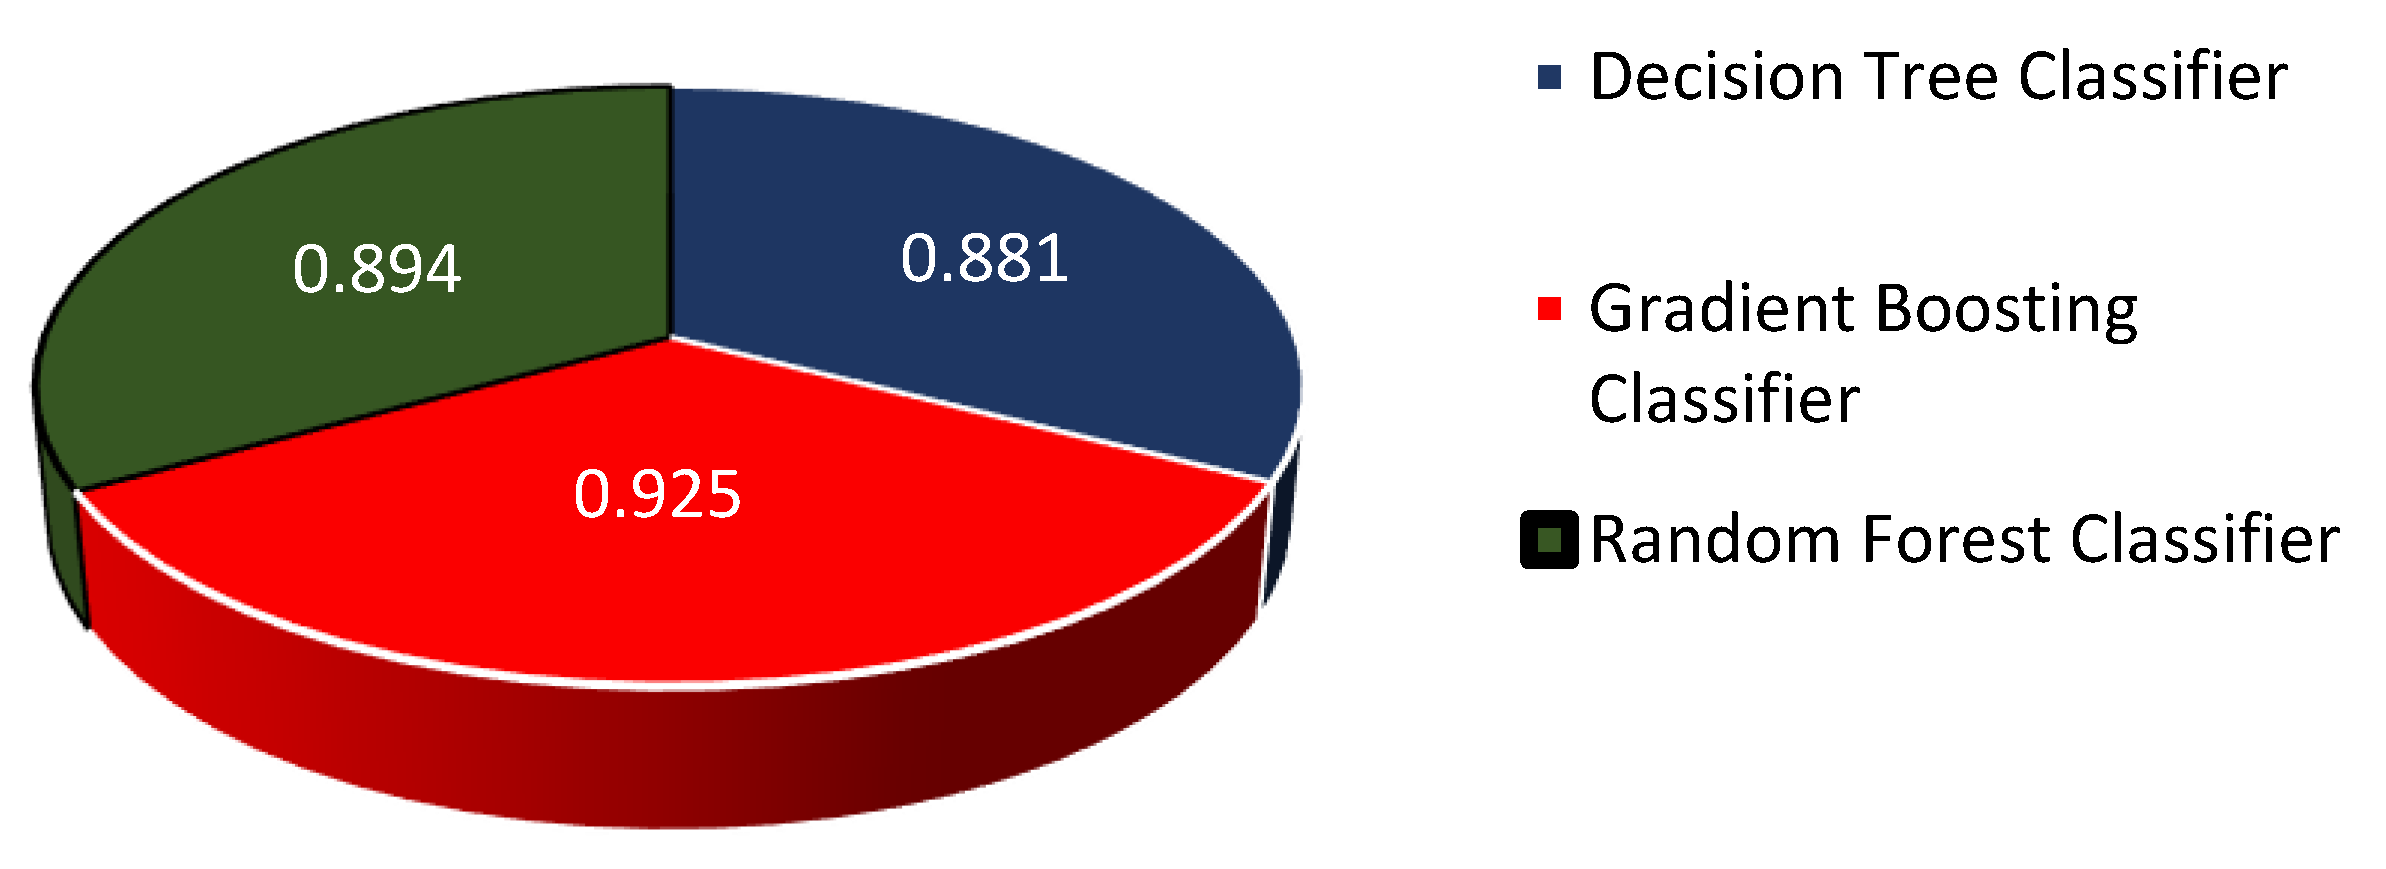
4.5. Model Performance Cross-Validation Results
4.6. Model Validation
4.7. Traffic Condition Predictions
5. Conclusions
- Implementation of dynamic traffic management: The Lagos Traffic Management Authority should consider using a random forest classifier model or similar predictive tools to facilitate dynamic traffic management strategies. This could involve taking proactive measures during predicted peak times to mitigate congestion.
- Consideration of additional factors: Future studies and traffic prediction models should incorporate additional external factors, such as weather conditions and special events, for more accurate and comprehensive traffic predictions.
- Exploration of advanced modeling techniques: Further research could explore the use of more advanced machine learning techniques or deep learning models that might better capture complex patterns in the data and provide more accurate predictions.
- Development of real-time traffic prediction systems: As technology and data collection techniques evolve, there is potential for developing real-time traffic prediction systems. Such systems can provide even more dynamic and responsive traffic management solutions.
Author Contributions
Funding
Data Availability Statement
Conflicts of Interest
Abbreviations
| ITS | Intelligent transportation systems |
| ADT | Average daily traffic |
| AADT | Annual average daily traffic |
| AI | Artificial intelligence |
| RFC | Random forest classifier |
| DT | Decision tree |
| GBC | Gradient boosting classifier |
| ML | Machine learning |
| Xi | Features |
| F | Trained model |
References
- Lowans, C.; Del Rio, D.F.; Sovacool, B.K.; Rooney, D.; Foley, A.M. What Is the State of the Art in Energy and Transport Poverty Metrics? A Critical and Comprehensive Review. Energy Econ. 2021, 101, 105360. [Google Scholar] [CrossRef]
- Oladimeji, D.; Gupta, K.; Kose, N.A.; Gundogan, K.; Ge, L.; Liang, F. Smart Transportation: An Overview of Technologies and Applications. Sensors 2023, 23, 3880. [Google Scholar] [CrossRef]
- Nugmanova, A.; Arndt, W.-H.; Hossain, M.A.; Kim, J.R. Effectiveness of Ring Roads in Reducing Traffic Congestion in Cities for Long Run: Big Almaty Ring Road Case Study. Sustainability 2019, 11, 4973. [Google Scholar] [CrossRef]
- Loo, B.P.Y. Transport, Urban. International Encyclopedia of Human Geography; Elsevier: Amsterdam, The Netherlands, 2009; pp. 465–469. [Google Scholar]
- Dimitrakopoulos, G.; Uden, L.; Varlamis, I. Transportation Network Applications. In The Future of Intelligent Transport Systems; Elsevier: Amsterdam, The Netherlands, 2020; pp. 175–188. [Google Scholar]
- Koźlak, A. The Role of the Transport System in Stimulating Economic and Social Development. Zesz. Nauk. Uniw. Gdańskiego. Ekon. Transp. I Logistyka 2017, 72, 19–33. [Google Scholar] [CrossRef]
- Anwar, A.H.M.M.; Oakil, A.T. Smart Transportation Systems in Smart Cities: Practices, Challenges, and Opportunities for Saudi Cities. In Smart Cities; Springer: Cham, Switzerland, 2024; pp. 315–337. [Google Scholar]
- Hajduk, S. Efficiency Evaluation of Urban Transport Using the DEA Method. Equilibrium. Q. J. Econ. Econ. Policy 2018, 13, 141–157. [Google Scholar] [CrossRef]
- Yannis, G.; Chaziris, A. Transport System and Infrastructure. Transp. Res. Procedia 2022, 60, 6–11. [Google Scholar] [CrossRef]
- Cheng, R.; Jiang, Y.; Nielsen, O.A. Integrated People-and-Goods Transportation Systems: From a Literature Review to a General Framework for Future Research. Transp. Rev. 2023, 43, 997–1020. [Google Scholar] [CrossRef]
- Gentili, M.; Mirchandani, P.B. Review of Optimal Sensor Location Models for Travel Time Estimation. Transp. Res. Part C Emerg. Technol. 2018, 90, 74–96. [Google Scholar] [CrossRef]
- Ng, A.K.Y.; Jiang, C.; Larson, P.; Prentice, B.; Duval, D. Transport Networks and Impacts on Transport Nodes. In Transport Nodal System; Elsevier: Amsterdam, The Netherlands, 2018; pp. 9–28. [Google Scholar]
- Mehmood, S.; Fan, J.; Dokota, I.S.; Nazir, S.; Nazir, Z. How to Manage Supply Chains Successfully in Transport Infrastructure Projects. Sustainability 2024, 16, 730. [Google Scholar] [CrossRef]
- Wu, D.; Zheng, A.; Yu, W.; Cao, H.; Ling, Q.; Liu, J.; Zhou, D. Digital Twin Technology in Transportation Infrastructure: A Comprehensive Survey of Current Applications, Challenges, and Future Directions. Appl. Sci. 2025, 15, 1911. [Google Scholar] [CrossRef]
- Fatorachian, H.; Kazemi, H. Sustainable Optimization Strategies for On-Demand Transportation Systems: Enhancing Efficiency and Reducing Energy Use. Sustain. Environ. 2025, 11, 2464388. [Google Scholar] [CrossRef]
- Ngcobo, N.; Akinradewo, O.; Mokoena, P. Evaluating the Measures to Promote Sustainable Transport Infrastructure: A Case of City of Johannesburg, South Africa. J. Eng. 2024, 2024, 6372226. [Google Scholar] [CrossRef]
- Yang, S.; Xiang, P.; Zhao, X.; Wang, Y.; Hu, M.; Qian, Y. Identifying Key Influencing Factors of Cross-Regional Railway Infrastructure Interconnection: A Fuzzy Integrated MCDM Framework. Humanit. Soc. Sci. Commun. 2025, 12, 169. [Google Scholar] [CrossRef]
- Lah, O. Sustainable Urban Mobility in Action. In Sustainable Urban Mobility Pathways; Elsevier: Amsterdam, The Netherlands, 2019; pp. 133–282. [Google Scholar]
- Jin, K.; Wang, W.; Li, X.; Hua, X.; Chen, S.; Qin, S. Identifying the Critical Road Combination in Urban Roads Network under Multiple Disruption Scenarios. Phys. A Stat. Mech. Its Appl. 2022, 607, 128192. [Google Scholar] [CrossRef]
- Bin Hariz, M.; Said, D.; Mouftah, H.T. A Dynamic Mobility Traffic Model Based on Two Modes of Transport in Smart Cities. Smart Cities 2021, 4, 253–270. [Google Scholar] [CrossRef]
- Alessandretti, L.; Orozco, L.G.N.; Saberi, M.; Szell, M.; Battiston, F. Multimodal Urban Mobility and Multilayer Transport Networks. Environ. Plan B Urban Anal City Sci. 2023, 50, 2038–2070. [Google Scholar] [CrossRef]
- Saif, M.A.; Zefreh, M.M.; Torok, A. Public Transport Accessibility: A Literature Review. Period. Polytech. Transp. Eng. 2018, 47, 36–43. [Google Scholar] [CrossRef]
- Schiller, P.L.; Kenworthy, J.R. An Introduction to Sustainable Transportation, 2nd ed.; Routledge: New York, NY, USA, 2018; ISBN 9781315644486. [Google Scholar]
- Yang, S.; Stepanchuk, O.; Pylypenko, O.; Ji, J.; Bieliatynskyi, A. Scientific Basis for Improving the Efficiency of Urban Street and Road Network Operation. J. Navig. 2023, 76, 685–708. [Google Scholar] [CrossRef]
- Yusuf, O.; Rasheed, A.; Lindseth, F. Exploring Urban Mobility Trends Using Cellular Network Data. In Proceedings of the 1st International Conference on Net-Zero Built Environment, Oslo, Norway, 19–21 June 2024. [Google Scholar] [CrossRef]
- Wang, J.; Ren, Y.; Shu, T.; Shen, L.; Liao, X.; Yang, N.; He, H. Economic Perspective-Based Analysis on Urban Infrastructures Carrying Capacity—A China Study. Environ. Impact Assess. Rev. 2020, 83, 106381. [Google Scholar] [CrossRef]
- Ruiz, A.; Guevara, J. Environmental and Economic Impacts of Road Infrastructure Development: Dynamic Considerations and Policies. J. Manag. Eng. 2020, 36, 04020006. [Google Scholar] [CrossRef]
- Mtweve, P.; Moseti, V.; Mahmoud, N.; Kramm, T.; Bogner, C.; Ibisch, P.; Biber-Freudenberger, L. Exploring Socioeconomic and Environmental Impacts of Road Infrastructure Development in Sub-Saharan Africa: A Systematic Literature Review. Environ. Dev. 2025, 54, 101177. [Google Scholar] [CrossRef]
- Kuncoro, E.; Wurarah, R.N.; Erari, I.E. The Impact of Road Infrastructure Development on Ecosystems and Communities. Soc. Ecol. Econ. Sustain. Dev. Goals J. 2024, 1. [Google Scholar] [CrossRef]
- Gutman, S.; Malashenko, M. The Impact of Transport Infrastructure on Sustainable Economic Development of Russian Regions. Sustainability 2025, 17, 3776. [Google Scholar] [CrossRef]
- Ben, S.O. Significance of Road Infrastructure on Economic Sustainability. Am. Int. J. Multidiscip. Sci. Res. 2019, 5, 1–9. [Google Scholar] [CrossRef]
- Vijayakumar, A.; Mahmood, M.N.; Gurmu, A.; Kamardeen, I.; Alam, S. Social Sustainability Indicators for Road Infrastructure Projects: A Systematic Literature Review. IOP Conf. Ser. Earth Environ. Sci. 2022, 1101, 022039. [Google Scholar] [CrossRef]
- Papadakis, D.M.; Savvides, A.; Michael, A.; Michopoulos, A. Advancing Sustainable Urban Mobility: Insights from Best Practices and Case Studies. Fuel Commun. 2024, 20, 100125. [Google Scholar] [CrossRef]
- Rodrigue, J.-P. The Geography of Transport Systems; Routledge: London, UK, 2024; ISBN 9781003343196. [Google Scholar]
- Gao, Y.; Zhu, J. Characteristics, Impacts and Trends of Urban Transportation. Encyclopedia 2022, 2, 1168–1182. [Google Scholar] [CrossRef]
- Fattah, M.A.; Morshed, S.R.; Kafy, A.-A. Insights into the Socio-Economic Impacts of Traffic Congestion in the Port and Industrial Areas of Chittagong City, Bangladesh. Transp. Eng. 2022, 9, 100122. [Google Scholar] [CrossRef]
- Abdullahi, U.O.; Adnan, A. Sustainable Urban Mobility: Lessons from European Cities. Glob. J. Eng. Technol. Adv. 2024, 21, 157–170. [Google Scholar] [CrossRef]
- Aliyu, A.; Amadu, L. Urbanization, Cities, and Health: The Challenges to Nigeria—A Review. Ann. Afr. Med. 2017, 16, 149. [Google Scholar] [CrossRef]
- Solanke, M.O. Challenges of Urban Transportation in Nigeria. Int. J. Dev. Sustain. 2013, 2, 891–901. [Google Scholar]
- Thondoo, M.; Marquet, O.; Márquez, S.; Nieuwenhuijsen, M.J. Small Cities, Big Needs: Urban Transport Planning in Cities of Developing Countries. J. Transp. Health 2020, 19, 100944. [Google Scholar] [CrossRef]
- Pojani, D.; Stead, D. Sustainable Urban Transport in the Developing World: Beyond Megacities. Sustainability 2015, 7, 7784–7805. [Google Scholar] [CrossRef]
- Faheem, H.B.; Shorbagy, A.M.E.; Gabr, M.E. Impact Of Traffic Congestion on Transportation System: Challenges and Remediations—A Review. Mansoura Eng. J. 2024, 49, 18. [Google Scholar] [CrossRef]
- Sokido, D.L. Measuring the Level of Urban Traffic Congestion for Sustainable Transportation in Addis Ababa, Ethiopia, the Cases of Selected Intersections. Front. Sustain. Cities 2024, 6, 1366932. [Google Scholar] [CrossRef]
- Obanya, H.E.; Amaeze, N.H.; Togunde, O.; Otitoloju, A.A. Air Pollution Monitoring around Residential and Transportation Sector Locations in Lagos Mainland. J. Health Pollut. 2018, 8, 180903. [Google Scholar] [CrossRef] [PubMed]
- Afifa; Arshad, K.; Hussain, N.; Ashraf, M.H.; Saleem, M.Z. Air Pollution and Climate Change as Grand Challenges to Sustainability. Sci. Total Environ. 2024, 928, 172370. [Google Scholar] [CrossRef]
- Zhang, K.; Batterman, S. Air Pollution and Health Risks Due to Vehicle Traffic. Sci. Total Environ. 2013, 450–451, 307–316. [Google Scholar] [CrossRef]
- Kumar, P.G.; Lekhana, P.; Tejaswi, M.; Chandrakala, S. Effects of Vehicular Emissions on the Urban Environment- a State of the Art. Mater. Today Proc. 2021, 45, 6314–6320. [Google Scholar] [CrossRef]
- Lu, S. Modeling Dynamics of Traffic Flow, Information Creation and Spread through Vehicle-to-Vehicle Communications: A Kinetic Approach. Int. J. Non Linear Mech. 2025, 175, 105096. [Google Scholar] [CrossRef]
- Kotsi, A.; Politis, I.; Mitsakis, E. Strategic Traffic Management in Mixed Traffic Road Networks: A Methodological Approach Integrating Game Theory, Bilevel Optimization, and C-ITS. Future Transp. 2024, 4, 1602–1624. [Google Scholar] [CrossRef]
- Zhang, Y.; Yang, X. (Terry) Discrete Macroscopic Traffic Flow Model Considering the Lane-Changing Behaviors in the Mixed Traffic Environment. Transp. Res. Part C Emerg. Technol. 2024, 164, 104672. [Google Scholar] [CrossRef]
- Lieberthal, E.B.; Serok, N.; Duan, J.; Zeng, G.; Havlin, S. Addressing the Urban Congestion Challenge Based on Traffic Bottlenecks. Philos. Trans. R. Soc. A Math. Phys. Eng. Sci. 2024, 382, 20240095. [Google Scholar] [CrossRef]
- Kumar, S. Urban Traffic: Understanding the Traffic Flow Factor Through Fluid Dynamics. SSRN 2023. [Google Scholar] [CrossRef]
- Narayanan, S.; Chaniotakis, E.; Antoniou, C. Factors Affecting Traffic Flow Efficiency Implications of Connected and Autonomous Vehicles: A Review and Policy Recommendations. Adv. Transp. Policy Plan. 2020, 5, 1–50. [Google Scholar]
- Khanmohamadi, M.; Guerrieri, M. Advanced Sensor Technologies in CAVs for Traditional and Smart Road Condition Monitoring: A Review. Sustainability 2024, 16, 8336. [Google Scholar] [CrossRef]
- Wang, Y.; Szeto, W.Y.; Han, K.; Friesz, T.L. Dynamic Traffic Assignment: A Review of the Methodological Advances for Environmentally Sustainable Road Transportation Applications. Transp. Res. Part B Methodol. 2018, 111, 370–394. [Google Scholar] [CrossRef]
- Antoniou, C.; Balakrishna, R.; Koutsopoulos, H.N. A Synthesis of Emerging Data Collection Technologies and Their Impact on Traffic Management Applications. Eur. Transp. Res. Rev. 2011, 3, 139–148. [Google Scholar] [CrossRef]
- Yu, H.; Jiang, R.; He, Z.; Zheng, Z.; Li, L.; Liu, R.; Chen, X. Automated Vehicle-Involved Traffic Flow Studies: A Survey of Assumptions, Models, Speculations, and Perspectives. Transp. Res. Part C Emerg. Technol. 2021, 127, 103101. [Google Scholar] [CrossRef]
- Razali, N.A.M.; Shamsaimon, N.; Ishak, K.K.; Ramli, S.; Amran, M.F.M.; Sukardi, S. Gap, Techniques and Evaluation: Traffic Flow Prediction Using Machine Learning and Deep Learning. J. Big Data 2021, 8, 152. [Google Scholar] [CrossRef]
- Rowan, D.; He, H.; Hui, F.; Yasir, A.; Mohammed, Q. A Systematic Review of Machine Learning-Based Microscopic Traffic Flow Models and Simulations. Commun. Transp. Res. 2025, 5, 100164. [Google Scholar] [CrossRef]
- Ogunkan, S.K.; Ogunkan, D.V. Traffic Pattern Recognition Using IoT Sensors and Machine Learning: A Comprehensive Review. Int’l J. Manag. Innov. Syst. 2025, 9, 13. [Google Scholar] [CrossRef]
- Casali, Y.; Aydin, N.Y.; Comes, T. Machine Learning for Spatial Analyses in Urban Areas: A Scoping Review. Sustain. Cities Soc. 2022, 85, 104050. [Google Scholar] [CrossRef]
- Dritsas, E.; Trigka, M. Exploring the Intersection of Machine Learning and Big Data: A Survey. Mach. Learn. Knowl. Extr. 2025, 7, 13. [Google Scholar] [CrossRef]
- Singh, V.; Sahana, S.K.; Bhattacharjee, V. A Novel CNN-GRU-LSTM Based Deep Learning Model for Accurate Traffic Prediction. Discov. Comput. 2025, 28, 38. [Google Scholar] [CrossRef]
- Mystakidis, A.; Koukaras, P.; Tjortjis, C. Advances in Traffic Congestion Prediction: An Overview of Emerging Techniques and Methods. Smart Cities 2025, 8, 25. [Google Scholar] [CrossRef]
- Govindaraju, S. Intelligent Transportation System’s Machine Learning-Based Traffic Prediction. J. Appl. Data Sci. 2024, 5, 1826–1837. [Google Scholar] [CrossRef]
- Elassy, M.; Al-Hattab, M.; Takruri, M.; Badawi, S. Intelligent Transportation Systems for Sustainable Smart Cities. Transp. Eng. 2024, 16, 100252. [Google Scholar] [CrossRef]
- Zemmouchi-Ghomari, L. Artificial Intelligence in Intelligent Transportation Systems. J. Intell. Manuf. Spec. Equip. 2025, 6, 26–42. [Google Scholar] [CrossRef]
- Yuan, T.; Da Neto, W.R.; Rothenberg, C.E.; Obraczka, K.; Barakat, C.; Turletti, T. Machine Learning for Next-generation Intelligent Transportation Systems: A Survey. Trans. Emerg. Telecommun. Technol. 2022, 33, e4427. [Google Scholar] [CrossRef]
- Hassan, M.; Mahin, H.D.; Al Nafees, A.; Paul, A.; Shraban, S.S. Big Data Applications in Intelligent Transport Systems: A Bibliometric Analysis and Review. Discov. Civ. Eng. 2025, 2, 49. [Google Scholar] [CrossRef]
- Khalil, R.A.; Safelnasr, Z.; Yemane, N.; Kedir, M.; Shafiqurrahman, A.; SAEED, N. Advanced Learning Technologies for Intelligent Transportation Systems: Prospects and Challenges. IEEE Open J. Veh. Technol. 2024, 5, 397–427. [Google Scholar] [CrossRef]
- Mrabet, M.; Sliti, M. Integrating Machine Learning for the Sustainable Development of Smart Cities. Front. Sustain. Cities 2024, 6, 1449404. [Google Scholar] [CrossRef]
- Tao, X.; Cheng, L.; Zhang, R.; Chan, W.K.; Chao, H.; Qin, J. Towards Green Innovation in Smart Cities: Leveraging Traffic Flow Prediction with Machine Learning Algorithms for Sustainable Transportation Systems. Sustainability 2023, 16, 251. [Google Scholar] [CrossRef]
- Zhu, X.; Yu, H.; Qian, G.; Yao, D.; Dai, W.; Zhang, H.; Li, J.; Zhong, H. Evaluation of Asphalt Mixture Micromechanical Behavior Evolution in the Failure Process Based on Discrete Element Method. Case Stud. Constr. Mater. 2023, 18, e01773. [Google Scholar] [CrossRef]
- Wang, X.; Han, S.; Lv, H.; Xie, H.; Zhu, Y. DEM Analysis of the Effect of Geocell on Splitting Tensile Behavior of Asphalt Mixture Based on Multi-Phase Model. Constr. Build. Mater. 2024, 411, 134567. [Google Scholar] [CrossRef]
- Abdullah, S.M.; Periyasamy, M.; Kamaludeen, N.A.; Towfek, S.K.; Marappan, R.; Raju, S.K.; Alharbi, A.H.; Khafaga, D.S. Optimizing Traffic Flow in Smart Cities: Soft GRU-Based Recurrent Neural Networks for Enhanced Congestion Prediction Using Deep Learning. Sustainability 2023, 15, 5949. [Google Scholar] [CrossRef]
- Rasulmukhamedov, M.; Tashmetov, T.; Tashmetov, K. Forecasting Traffic Flow Using Machine Learning Algorithms. Proc. EEPES 2024, 70, 14. [Google Scholar]
- Sanchez-Sepulveda, M.V.; Navarro, J.; Fonseca-Escudero, D.; Amo-Filva, D.; Antunez-Anea, F. Exploiting Urban Data to Address Real-World Challenges: Enhancing Urban Mobility for Environmental and Social Well-Being. Cities 2024, 153, 105275. [Google Scholar] [CrossRef]
- Bibri, S.E. Data-Driven Smart Sustainable Cities of the Future: An Evidence Synthesis Approach to a Comprehensive State-of-the-Art Literature Review. Sustain. Futures 2021, 3, 100047. [Google Scholar] [CrossRef]
- Sanchez-Sepulveda, M.V.; Navarro, J.; Amo-Filva, D.; Fonseca, D.; Antúnez-Anea, F.; Barranco-Albalat, A. A Data-Driven Approach to Enhance Urban Infrastructure for Sustainable Mobility and Improved Quality of Life in Highly Populated Cities. Case Study: Barcelona. Front. Built. Env. 2024, 10, 1439700. [Google Scholar] [CrossRef]
- Mohsen, B.M. AI-Driven Optimization of Urban Logistics in Smart Cities: Integrating Autonomous Vehicles and IoT for Efficient Delivery Systems. Sustainability 2024, 16, 11265. [Google Scholar] [CrossRef]
- Elefteriadou, L. An Introduction to Traffic Flow Theory; Springer: New York, NY, USA, 2014; Volume 84, ISBN 978-1-4614-8434-9. [Google Scholar]
- Ren, Q.; He, J.; Liu, Z.; Xu, M. Traffic Flow Characteristics and Traffic Conflict Analysis in the Downstream Area of Expressway Toll Station Based on Vehicle Trajectory Data. Asian Transp. Stud. 2024, 10, 100138. [Google Scholar] [CrossRef]
- Al-Turki, M.; Ratrout, N.T.; Rahman, S.M.; Reza, I. Impacts of Autonomous Vehicles on Traffic Flow Characteristics under Mixed Traffic Environment: Future Perspectives. Sustainability 2021, 13, 11052. [Google Scholar] [CrossRef]
- Kerner, B.S. Three-Phase Traffic Theory and Highway Capacity. Phys. A Stat. Mech. Its Appl. 2004, 333, 379–440. [Google Scholar] [CrossRef]
- Wu, Y.; He, X. Using the Automated Random Forest Approach for Obtaining the Compressive Strength Prediction of RCA. Multiscale Multidiscip. Model. Exp. Des. 2024, 7, 855–867. [Google Scholar] [CrossRef]
- Choudhary, A.; Gokhale, S.; Kumar, P.; Pradhan, C.; Sahu, S.K. Urban Traffic Congestion: Its Causes-Consequences-Mitigation. Res. J. Chem. Env. 2022, 26, 164–176. [Google Scholar] [CrossRef]
- Udo, I.U.; Ndarake, U.I.; Udeme, U.U.; Julius, E. Challenges on the Exposition of Traffic Signs and Symbols to Lagos State Road Users. Int. J. Innov. Res. Adv. Eng. 2021, 8, 239–250. [Google Scholar] [CrossRef]
- Dong, S.; Zhang, H.; Li, S.; Jia, N.; He, N. A Study on Urban Traffic Congestion Pressure Based on CFD. Sustainability 2024, 16, 10911. [Google Scholar] [CrossRef]
- Zheng, P.; Mike, M. An Investigation on the Manual Traffic Count Accuracy. Procedia Soc. Behav. Sci. 2012, 43, 226–231. [Google Scholar] [CrossRef]
- Ulvi, H.; Yerlikaya, M.A.; Yildiz, K. Urban Traffic Mobility Optimization Model: A Novel Mathematical Approach for Predictive Urban Traffic Analysis. Appl. Sci. 2024, 14, 5873. [Google Scholar] [CrossRef]
- Sarker, T.; Meng, X. Traffic Signal Recognition Using End-to-End Deep Learning. In Proceedings of the Tran-SET 2022, San Antonio, TX, USA, 31 August–2 September 2022; American Society of Civil Engineers: Reston, VA, USA, 2022; pp. 182–191. [Google Scholar]
- Soori, M.; Arezoo, B.; Dastres, R. Artificial Intelligence, Machine Learning and Deep Learning in Advanced Robotics, a Review. Cogn. Robot. 2023, 3, 54–70. [Google Scholar] [CrossRef]
- Bhartiya, P.; Bhatele, M.; Waoo, A.A. A MACHINE LEARNING APPROACH FOR PREDICTIVE ANALYSIS OF TRAFFIC FLOW. ShodhKosh J. Vis. Perform. Arts 2024, 5, 422–430. [Google Scholar] [CrossRef]
- Shaygan, M.; Meese, C.; Li, W.; Zhao, X.; Nejad, M. Traffic Prediction Using Artificial Intelligence: Review of Recent Advances and Emerging Opportunities. Transp. Res. Part C Emerg. Technol. 2022, 145, 103921. [Google Scholar] [CrossRef]
- Toan, T.D.; Truong, V.-H. Support Vector Machine for Short-Term Traffic Flow Prediction and Improvement of Its Model Training Using Nearest Neighbor Approach. Transp. Res. Rec. J. Transp. Res. Board 2021, 2675, 362–373. [Google Scholar] [CrossRef]
- Al-refai, G.; Al-refai, M.; Alzu’bi, A. Driving Style and Traffic Prediction with Artificial Neural Networks Using On-Board Diagnostics and Smartphone Sensors. Appl. Sci. 2024, 14, 5008. [Google Scholar] [CrossRef]
- Ahmed, M.; Zhang, X.; Shen, Y.; Ahmed, T.; Ali, S.; Ali, A.; Gulakhmadov, A.; Nam, W.-H.; Chen, N. Low-Cost Video-Based Air Quality Estimation System Using Structured Deep Learning with Selective State Space Modeling. Environ. Int 2025, 199, 109496. [Google Scholar] [CrossRef]
- Zhao, Y.; Yang, Y.; Wen, X. A Study on Predicting Traffic Flow by Random Forest Based on Treatment of Eliminating Skewed Distribution. Highlights Sci. Eng. Technol. 2024, 115, 97–106. [Google Scholar] [CrossRef]
- Liu, Y.; Wu, H. Prediction of Road Traffic Congestion Based on Random Forest. In Proceedings of the IEEE 2017 10th International Symposium on Computational Intelligence and Design (ISCID), Hangzhou, China, 9–10 December 2017; pp. 361–364. [Google Scholar]
- Mądziel, M. Predictive Methods for CO2 Emissions and Energy Use in Vehicles at Intersections. Sci. Rep. 2025, 15, 6463. [Google Scholar] [CrossRef]
- Rajha, R.; Shiode, S.; Shiode, N. Improving Traffic-Flow Prediction Using Proximity to Urban Features and Public Space. Sustainability 2024, 17, 68. [Google Scholar] [CrossRef]
- Kashyap, A.A.; Raviraj, S.; Devarakonda, A.; Nayak K, S.R.; KV, S.; Bhat, S.J. Traffic Flow Prediction Models—A Review of Deep Learning Techniques. Cogent Eng. 2022, 9, 2010510. [Google Scholar] [CrossRef]
- Yan, M.; Shen, Y. Traffic Accident Severity Prediction Based on Random Forest. Sustainability 2022, 14, 1729. [Google Scholar] [CrossRef]
- Qiu, J.; Zhao, Y. Traffic Prediction with Data Fusion and Machine Learning. Analytics 2025, 4, 12. [Google Scholar] [CrossRef]
- Phapale, A.; Shravagi, S. Traffic Flow Prediction on Road Using Machine Learning. Int. J. Appl. Adv. Multidiscip. Res. 2024, 2, 31–38. [Google Scholar] [CrossRef]
- Abduljabbar, R.; Dia, H.; Liyanage, S. Machine Learning Models for Traffic Prediction on Arterial Roads Using Traffic Features and Weather Information. Appl. Sci. 2024, 14, 11047. [Google Scholar] [CrossRef]
- Gheorghe, C.; Soica, A. Revolutionizing Urban Mobility: A Systematic Review of AI, IoT, and Predictive Analytics in Adaptive Traffic Control Systems for Road Networks. Electronics 2025, 14, 719. [Google Scholar] [CrossRef]
- Kayisu, A.K.; Mikusova, M.; Bokoro, P.N.; Kyamakya, K. Exploring Smart Mobility Potential in Kinshasa (DR-Congo) as a Contribution to Mastering Traffic Congestion and Improving Road Safety: A Comprehensive Feasibility Assessment. Sustainability 2024, 16, 9371. [Google Scholar] [CrossRef]
- Deng, S. Research on Traffic Prediction Based on Machine Learning. Appl. Comput. Eng. 2025, 135, 195–203. [Google Scholar] [CrossRef]
- Xiong, J.; Xu, L.; Wei, Z.; Wu, P.; Li, Q.; Pei, M. Identifying, Analyzing, and Forecasting Commuting Patterns in Urban Public Transportation: A Review. Expert Syst. Appl. 2024, 249, 123646. [Google Scholar] [CrossRef]
- Zhong, C.; Wu, P.; Zhang, Q.; Ma, Z. Online Prediction of Network-Level Public Transport Demand Based on Principle Component Analysis. Commun. Transp. Res. 2023, 3, 100093. [Google Scholar] [CrossRef]
- Jovanović, B.; Shabanaj, K.; Ševrović, M. Conceptual Model for Determining the Statistical Significance of Predictive Indicators for Bus Transit Demand Forecasting. Sustainability 2022, 15, 749. [Google Scholar] [CrossRef]
- Gilani, S.A.U.; Al-Rajab, M.; Bakka, M. Challenges and Opportunities in Traffic Flow Prediction: Review of Machine Learning and Deep Learning Perspectives. Data Metadata 2024, 3, 378. [Google Scholar] [CrossRef]
- Otković, I.I.; Deluka-Tibljaš, A.; Šurdonja, S. Validation of the Calibration Methodology of the Micro-Simulation Traffic Model. Transp. Res. Procedia 2020, 45, 684–691. [Google Scholar] [CrossRef]
- Hammoumi, L.; Farah, S.; Benayad, M.; Maanan, M.; Rhinane, H. Leveraging Machine Learning to Predict Traffic Jams: Case Study of Casablanca, Morocco. J. Urban Manag. 2025, In Press, Corrected Proof. [Google Scholar] [CrossRef]
- Ulu, M.; Kilic, E.; Türkan, Y.S. Prediction of Traffic Incident Locations with a Geohash-Based Model Using Machine Learning Algorithms. Appl. Sci. 2024, 14, 725. [Google Scholar] [CrossRef]
- Munappy, A.R.; Bosch, J.; Olsson, H.H.; Arpteg, A.; Brinne, B. Data Management for Production Quality Deep Learning Models: Challenges and Solutions. J. Syst. Softw. 2022, 191, 111359. [Google Scholar] [CrossRef]
- Ali, Y.; Hussain, F.; Haque, M.M. Advances, Challenges, and Future Research Needs in Machine Learning-Based Crash Prediction Models: A Systematic Review. Accid. Anal. Prev. 2024, 194, 107378. [Google Scholar] [CrossRef] [PubMed]
- Ismaeel, A.G.; Janardhanan, K.; Sankar, M.; Natarajan, Y.; Mahmood, S.N.; Alani, S.; Shather, A.H. Traffic Pattern Classification in Smart Cities Using Deep Recurrent Neural Network. Sustainability 2023, 15, 14522. [Google Scholar] [CrossRef]
- Betkier, I.; Oszczypała, M. A Novel Approach to Traffic Modelling Based on Road Parameters, Weather Conditions and GPS Data Using Feedforward Neural Networks. Expert. Syst. Appl. 2024, 245, 123067. [Google Scholar] [CrossRef]
- Barbierato, E.; Gatti, A. The Challenges of Machine Learning: A Critical Review. Electronics 2024, 13, 416. [Google Scholar] [CrossRef]
- Lones, M.A. Avoiding Common Machine Learning Pitfalls. Patterns 2024, 5, 101046. [Google Scholar] [CrossRef]
- Taye, M.M. Understanding of Machine Learning with Deep Learning: Architectures, Workflow, Applications and Future Directions. Computers 2023, 12, 91. [Google Scholar] [CrossRef]
- Mienye, I.D.; Sun, Y.; Ileberi, E. Artificial Intelligence and Sustainable Development in Africa: A Comprehensive Review. Mach. Learn. Appl. 2024, 18, 100591. [Google Scholar] [CrossRef]
- Tekouabou, S.C.K.; Diop, E.B.; Azmi, R.; Jaligot, R.; Chenal, J. Reviewing the Application of Machine Learning Methods to Model Urban Form Indicators in Planning Decision Support Systems: Potential, Issues and Challenges. J. King Saud Univ. Comput. Inf. Sci. 2022, 34, 5943–5967. [Google Scholar] [CrossRef]
- Ezugwu, A.E.; Oyelade, O.N.; Ikotun, A.M.; Agushaka, J.O.; Ho, Y.-S. Machine Learning Research Trends in Africa: A 30 Years Overview with Bibliometric Analysis Review. Arch. Comput. Methods Eng. 2023, 30, 4177–4207. [Google Scholar] [CrossRef]
- Ofoezie, E.I.; Eludoyin, A.O.; Udeh, E.B.; Onanuga, M.Y.; Salami, O.O.; Adebayo, A.A. Climate, Urbanization and Environmental Pollution in West Africa. Sustainability 2022, 14, 15602. [Google Scholar] [CrossRef]
- Akhtar, M.; Moridpour, S. A Review of Traffic Congestion Prediction Using Artificial Intelligence. J. Adv. Transp. 2021, 2021, 8878011. [Google Scholar] [CrossRef]
- Majumder, M.; Wilmot, C. Automated Vehicle Counting from Pre-Recorded Video Using You Only Look Once (YOLO) Object Detection Model. J. Imaging 2023, 9, 131. [Google Scholar] [CrossRef]
- Jakubec, M.; Cingel, M.; Lieskovská, E.; Drliciak, M. Integrating Neural Networks for Automated Video Analysis of Traffic Flow Routing and Composition at Intersections. Sustainability 2025, 17, 2150. [Google Scholar] [CrossRef]
- Sarker, I.H. Machine Learning: Algorithms, Real-World Applications and Research Directions. SN Comput. Sci. 2021, 2, 160. [Google Scholar] [CrossRef]
- Algren, M.; Fisher, W.; Landis, A.E. Machine Learning in Life Cycle Assessment. In Data Science Applied to Sustainability Analysis; Elsevier: Amsterdam, The Netherlands, 2021; pp. 167–190. [Google Scholar]
- Bagui, S.; Fang, X.; Kalaimannan, E.; Bagui, S.C.; Sheehan, J. Comparison of Machine-Learning Algorithms for Classification of VPN Network Traffic Flow Using Time-Related Features. J. Cyber Secur. Technol. 2017, 1, 108–126. [Google Scholar] [CrossRef]
- Gomes, B.; Coelho, J.; Aidos, H. A Survey on Traffic Flow Prediction and Classification. Intell. Syst. Appl. 2023, 20, 200268. [Google Scholar] [CrossRef]
- Cao, J.; Wang, D.; Qu, Z.; Sun, H.; Li, B.; Chen, C.-L. An Improved Network Traffic Classification Model Based on a Support Vector Machine. Symmetry 2020, 12, 301. [Google Scholar] [CrossRef]
- Friedman, J.H. Stochastic Gradient Boosting. Comput. Stat. Data. Anal. 2002, 38, 367–378. [Google Scholar] [CrossRef]
- Breiman, L.; Cutler, A.; Liaw, A.; Wiener, M. RandomForest: Breiman and Cutlers Random Forests for Classification and Regression. In CRAN: Contributed Packages 2002; Vienna University of Economics: Vienna, Austria, 2022. [Google Scholar]
- Song, Y.-Y.; Lu, Y. Decision Tree Methods: Applications for Classification and Prediction. Shanghai Arch. Psychiatry 2015, 27, 130–135. [Google Scholar] [CrossRef] [PubMed]
- Chala, A.T.; Ray, R. Assessing the Performance of Machine Learning Algorithms for Soil Classification Using Cone Penetration Test Data. Appl. Sci. 2023, 13, 5758. [Google Scholar] [CrossRef]
- Chala, A.T.; Ray, R.P. Machine Learning Techniques for Soil Characterization Using Cone Penetration Test Data. Appl. Sci. 2023, 13, 8286. [Google Scholar] [CrossRef]
- Mahdavian, A.; Shojaei, A.; Salem, M.; Laman, H.; Yuan, J.S.; Oloufa, A. Automated Machine Learning Pipeline for Traffic Count Prediction. Modelling 2021, 2, 482–513. [Google Scholar] [CrossRef]
- Ali, Y.; Awwad, E.; Al-Razgan, M.; Maarouf, A. Hyperparameter Search for Machine Learning Algorithms for Optimizing the Computational Complexity. Processes 2023, 11, 349. [Google Scholar] [CrossRef]
- Wu, P.; Zhang, Z.; Peng, X.; Wang, R. Deep Learning Solutions for Smart City Challenges in Urban Development. Sci. Rep. 2024, 14, 5176. [Google Scholar] [CrossRef]


| Day | Total Flow (Veh/day) | Average Flow (Veh/day) |
|---|---|---|
| Monday | 5582 | 465.17 |
| Tuesday | 5372 | 447.67 |
| Wednesday | 4739 | 394.92 |
| Thursday | 4996 | 416.33 |
| Friday | 5239 | 436.58 |
| Saturday | 3083 | 256.92 |
| Sunday | 3832 | 319.33 |
| Time | Car Total | Jeeps Total | Trucks Total | Buses Total | Tricycles Total | Bicycles Total |
|---|---|---|---|---|---|---|
| 6:00 | 2258 | 1141 | 34 | 270 | 211 | 12 |
| 7:00 | 2271 | 590 | 23 | 455 | 174 | 7 |
| 8:00 | 1145 | 268 | 17 | 266 | 187 | 12 |
| 9:00 | 1173 | 276 | 15 | 313 | 269 | 6 |
| 10:00 | 733 | 154 | 15 | 186 | 294 | 10 |
| 11:00 | 438 | 175 | 12 | 309 | 187 | 15 |
| 12:00 | 471 | 234 | 24 | 262 | 195 | 9 |
| 13:00 | 459 | 241 | 9 | 160 | 168 | 6 |
| 14:00 | 1245 | 295 | 10 | 197 | 166 | 13 |
| 15:00 | 1863 | 450 | 23 | 232 | 170 | 5 |
| 16:00 | 2730 | 721 | 19 | 431 | 195 | 9 |
| 17:00 | 3445 | 555 | 14 | 321 | 167 | 10 |
| 18:00 | 2258 | 1141 | 34 | 270 | 211 | 12 |
| 19:00 | 2271 | 590 | 23 | 455 | 174 | 7 |
| 20:00 | 1145 | 268 | 17 | 266 | 187 | 12 |
| 21:00 | 1173 | 276 | 15 | 313 | 269 | 6 |
| 22:00 | 733 | 154 | 15 | 186 | 294 | 10 |
| 23:00 | 438 | 175 | 12 | 309 | 187 | 15 |
| 0:00 | 471 | 234 | 24 | 262 | 195 | 9 |
| 1:00 | 459 | 241 | 9 | 160 | 168 | 6 |
| 2:00 | 1245 | 295 | 10 | 197 | 166 | 13 |
| 3:00 | 1863 | 450 | 23 | 232 | 170 | 5 |
| 4:00 | 2730 | 721 | 19 | 431 | 195 | 9 |
| 5:00 | 3445 | 555 | 14 | 321 | 167 | 10 |
| Time | Car Total | Cars Average | Jeeps Total | Jeeps Average | Trucks Total | Trucks Average | Buses Total | Buses Average | Tricycles Total | Tricycles Average | Bicycles Total | Bicycle Average |
|---|---|---|---|---|---|---|---|---|---|---|---|---|
| 6:00 | 2258 | 322.57 | 1141 | 163 | 34 | 4.86 | 270 | 38.57 | 211 | 30.14 | 12 | 1.71 |
| 7:00 | 2271 | 324.43 | 590 | 84.29 | 23 | 3.29 | 455 | 65 | 174 | 24.86 | 7 | 1 |
| 8:00 | 1145 | 163.57 | 268 | 38.29 | 17 | 2.43 | 266 | 38 | 187 | 26.71 | 12 | 1.71 |
| 9:00 | 1173 | 167.57 | 276 | 39.43 | 15 | 2.14 | 313 | 44.71 | 269 | 38.43 | 6 | 0.86 |
| 10:00 | 733 | 104.71 | 154 | 22 | 15 | 2.14 | 186 | 26.57 | 294 | 42 | 10 | 1.43 |
| 11:00 | 438 | 62.57 | 175 | 25 | 12 | 1.71 | 309 | 44.14 | 187 | 26.71 | 15 | 2.14 |
| 12:00 | 471 | 67.29 | 234 | 33.43 | 24 | 3.43 | 262 | 37.43 | 195 | 27.86 | 9 | 1.29 |
| 13:00 | 459 | 65.57 | 241 | 34.43 | 9 | 1.29 | 160 | 22.86 | 168 | 24 | 6 | 0.86 |
| 14:00 | 1245 | 177.86 | 295 | 42.14 | 10 | 1.43 | 197 | 28.14 | 166 | 23.71 | 13 | 1.86 |
| 15:00 | 1863 | 266.14 | 450 | 64.29 | 23 | 3.29 | 232 | 33.14 | 170 | 24.29 | 5 | 0.71 |
| 16:00 | 2730 | 390 | 721 | 103 | 19 | 2.71 | 431 | 61.57 | 195 | 27.86 | 9 | 1.29 |
| 17:00 | 3445 | 492.14 | 555 | 79.29 | 14 | 2 | 321 | 45.86 | 167 | 23.86 | 10 | 1.43 |
| 18:00 | 2258 | 322.57 | 1141 | 163 | 34 | 4.86 | 270 | 38.57 | 211 | 30.14 | 12 | 1.71 |
| 19:00 | 2271 | 324.43 | 590 | 84.29 | 23 | 3.29 | 455 | 65 | 174 | 24.86 | 7 | 1 |
| 20:00 | 1145 | 163.57 | 268 | 38.29 | 17 | 2.43 | 266 | 38 | 187 | 26.71 | 12 | 1.71 |
| 21:00 | 1173 | 167.57 | 276 | 39.43 | 15 | 2.14 | 313 | 44.71 | 269 | 38.43 | 6 | 0.86 |
| 22:00 | 733 | 104.71 | 154 | 22 | 15 | 2.14 | 186 | 26.57 | 294 | 42 | 10 | 1.43 |
| 23:00 | 438 | 62.57 | 175 | 25 | 12 | 1.71 | 309 | 44.14 | 187 | 26.71 | 15 | 2.14 |
| 0:00 | 471 | 67.29 | 234 | 33.43 | 24 | 3.43 | 262 | 37.43 | 195 | 27.86 | 9 | 1.29 |
| 1:00 | 459 | 65.57 | 241 | 34.43 | 9 | 1.29 | 160 | 22.86 | 168 | 24 | 6 | 0.86 |
| 2:00 | 1245 | 177.86 | 295 | 42.14 | 10 | 1.43 | 197 | 28.14 | 166 | 23.71 | 13 | 1.86 |
| 3:00 | 1863 | 266.14 | 450 | 64.29 | 23 | 3.29 | 232 | 33.14 | 170 | 24.29 | 5 | 0.71 |
| 4:00 | 2730 | 390 | 721 | 103 | 19 | 2.71 | 431 | 61.57 | 195 | 27.86 | 9 | 1.29 |
| 5:00 | 3445 | 492.14 | 555 | 79.29 | 14 | 2 | 321 | 45.86 | 167 | 23.86 | 10 | 1.43 |
| Variables | Correlation |
|---|---|
| Time of day and traffic volume | 0.1048 |
| Model | Cross-Validation Score | Test Accuracy |
|---|---|---|
| Decision Tree Classifier | 0.881 | 0.88 |
| Gradient Boosting Classifier | 0.925 | 0.88 |
| Random Forest Classifier | 0.894 | 1.00 |
| Class | Precision | Recall | F1-Score |
|---|---|---|---|
| High | 1.00 | 1.00 | 1.00 |
| Low | 0.80 | 0.80 | 0.80 |
| Medium | 0.67 | 0.67 | 0.67 |
| Average/Total | 0.88 | 0.88 | 0.88 |
| Class | Precision | Recall | F1-Score |
|---|---|---|---|
| High | 1.00 | 1.00 | 1.00 |
| Low | 0.80 | 0.80 | 0.80 |
| Medium | 0.67 | 0.67 | 0.67 |
| Average/Total | 0.88 | 0.88 | 0.88 |
| Class | Precision | Recall | F1-Score |
|---|---|---|---|
| High | 1.00 | 1.00 | 1.00 |
| Low | 1.00 | 1.00 | 1.00 |
| Medium | 1.00 | 1.00 | 1.00 |
| Average/Total | 1.00 | 1.00 | 1.00 |
Disclaimer/Publisher’s Note: The statements, opinions and data contained in all publications are solely those of the individual author(s) and contributor(s) and not of MDPI and/or the editor(s). MDPI and/or the editor(s) disclaim responsibility for any injury to people or property resulting from any ideas, methods, instructions or products referred to in the content. |
© 2025 by the authors. Licensee MDPI, Basel, Switzerland. This article is an open access article distributed under the terms and conditions of the Creative Commons Attribution (CC BY) license (https://creativecommons.org/licenses/by/4.0/).
Share and Cite
Imoh, U.U.; Rad, M.M. Analysis and Prediction of Traffic Conditions Using Machine Learning Models on Ikorodu Road in Lagos State, Nigeria. Infrastructures 2025, 10, 122. https://doi.org/10.3390/infrastructures10050122
Imoh UU, Rad MM. Analysis and Prediction of Traffic Conditions Using Machine Learning Models on Ikorodu Road in Lagos State, Nigeria. Infrastructures. 2025; 10(5):122. https://doi.org/10.3390/infrastructures10050122
Chicago/Turabian StyleImoh, Udeme Udo, and Majid Movahedi Rad. 2025. "Analysis and Prediction of Traffic Conditions Using Machine Learning Models on Ikorodu Road in Lagos State, Nigeria" Infrastructures 10, no. 5: 122. https://doi.org/10.3390/infrastructures10050122
APA StyleImoh, U. U., & Rad, M. M. (2025). Analysis and Prediction of Traffic Conditions Using Machine Learning Models on Ikorodu Road in Lagos State, Nigeria. Infrastructures, 10(5), 122. https://doi.org/10.3390/infrastructures10050122