Article

Mechanistic-Empirical Analysis of LDPE-SBS-Modified Asphalt Concrete Mix with RAP Subjected to Various Traffic and Climatic Loading Conditions

1
Department of Transportation and Geotechnical Engineering, Military College of Engineering (MCE), National University of Sciences & Technology (NUST), Risalpur 24070, Pakistan
2
Faculty of Civil Engineering, University of Technology Malaysia (UTM), Johor Bahru 81310, Malaysia
3
Department of Civil Engineering, University of Engineering & Technology (UET) Lahore, Lahore 54890, Pakistan
4
Offshore Energy Structures Department, Jan De Nul n.v., 9300 Aalst, Belgium
*
Authors to whom correspondence should be addressed.
Infrastructures 2025, 10(11), 288; https://doi.org/10.3390/infrastructures10110288
Submission received: 26 July 2025 / Revised: 13 October 2025 / Accepted: 21 October 2025 / Published: 30 October 2025

Abstract

The current global economic challenges and resource scarcity necessitate the development of cost-effective and sustainable pavement solutions. This study investigates the performance of asphalt mixtures modified with Low-Density Polyethylene (LDPE) and Styrene–Butadiene–Styrene (SBS) as binder modifiers, and Hydrated Lime (Ca(OH)2) and Reclaimed Asphalt Pavement (RAP) as aggregate replacements. The research aims to optimize the combination of these materials for enhancing the durability, sustainability, and mechanical properties of asphalt mixtures under various climatic and traffic conditions. Asphalt mixtures were modified with 5% LDPE and 2–6% SBS (by bitumen weight), with 2% Hydrated Lime and 15% RAP added to the mix. The performance of these mixtures was evaluated using the Simple Performance Tester (SPT), focusing on rutting, cracking, and fatigue resistance at varying temperatures and loading frequencies. The NCHRP 09-29 Master Solver was employed to generate master curves for input into the AASHTOWare Mechanistic-Empirical Pavement Design Guide (MEPDG), allowing for an in-depth analysis of the modified mixes under different traffic and climatic conditions. Results indicated that the mix containing 5% LDPE, 2% SBS, 2% Hydrated Lime, and 15% RAP achieved the best performance, reducing rutting, fatigue cracking, and the International Roughness Index (IRI), and improving overall pavement durability. The combination of these modifiers showed enhanced moisture resistance, high-temperature rutting resistance, and improved dynamic modulus. Notably, the study revealed that in warm climates, thicker pavements with this optimal mix exhibited reduced permanent deformation and better fatigue resistance, while in cold climates, the inclusion of 2% SBS further improved the mix’s low-temperature performance. The findings suggest that the incorporation of LDPE, SBS, Hydrated Lime, and RAP offers a sustainable and cost-effective solution for improving the mechanical properties and lifespan of asphalt pavements.

1. Introduction

The rapid pace of urbanization and industrialization, driven by population growth and economic development, has rendered the construction sector one of the least sustainable industries, primarily due to its substantial consumption of natural resources [1]. In recent years, the increasing costs of asphalt binders and the scarcity of high-quality aggregates have heightened the focus on sustainable resource utilization. Consequently, the recycling of waste asphalt pavement has gained significant attention in both academic and industrial sectors [2,3,4,5].
Globally, the unchecked extraction of natural resources—without adherence to circular economy principles—has led to severe environmental degradation, increased pollution, solid waste generation, biodiversity loss, and global warming [6]. Solid waste from commercial and industrial activities poses threats to human health, ecosystems, and water bodies [7,8,9]. The construction industry, in particular, contributes substantially to this issue due to the large volumes of waste generated during both the construction and service life of infrastructure [10,11], thereby increasing the global carbon footprint [12]. To mitigate these challenges, researchers and construction agencies have emphasized the reduction in energy consumption and environmental impact through the recycling and reuse of construction materials [11,13,14,15].
Since the 1950s, the widespread use of plastic has resulted in approximately 6.9 billion tons of plastic waste, of which 6.3 billion tons are non-recyclable. Low-Density Polyethylene (LDPE), a thermoplastic polymer heavily used in packaging, is a major contributor to this waste stream [16,17]. In 2020, about 55% of plastic waste was discarded, 25% incinerated, and only 20% recycled. Overall, 79% of plastic waste did not undergo proper recycling [17,18].
For sustainable pavement systems, assessing long-term performance degradation is crucial. The Mechanistic-Empirical Pavement Design Guide (MEPDG) offers an integrated approach that combines structural analysis and performance prediction [19,20]. It computes pavement responses under varying traffic, climate, material properties, and structural configurations, and correlates them with performance indicators such as alligator, longitudinal, and transverse cracking, rutting, and the International Roughness Index (IRI). According to AASHTOWare MEPDG (version 2.6), target values for Interstate, Primary, and Secondary roads are 160, 200, and 200 in./mile for IRI; 10%, 20%, and 35% for fatigue cracking; and 0.40, 0.50, and 0.65 inches for total rut depth, respectively [21,22,23].
LDPE is characterized by a semi-rigid structure formed through free radical polymerization and is used in diverse applications such as containers, bags, and electronics [17,24]. Its use as a modifier in Hot Mix Asphalt (HMA) has demonstrated several benefits, including improved Marshall stability (>100%), moisture resistance (13%), complex modulus (11%), softening point (18%), viscosity (120%), reduced rut depth (67%), penetration resistance (24%), and enhanced fatigue performance [25,26,27,28,29]. Several studies have identified 5% LDPE as the optimum content [30,31].
Styrene–Butadiene–Styrene (SBS), a triblock copolymer composed of polystyrene (providing rigidity) and polybutadiene (providing flexibility), has also shown improved performance in asphalt mixtures. The addition of polymers enhances the fatigue resistance, thermal cracking resistance, and rutting resistance of asphalt binders. This is especially true for polymer types such as Styrene–Butadiene–Styrene (SBS) and Styrene–Ethylene–Butylenes–Styrene (SEBS), which significantly improve the mechanical properties of asphalt [32,33,34,35,36,37,38,39,40,41,42]. SBS performs effectively in combination with other polymers and is particularly beneficial for improving the low-temperature properties of LDPE- or EVA-modified asphalt [39]. Studies show that 5% SBS can significantly increase rutting resistance and maintain binder viscosity at lower temperatures, thereby reducing the required mixing and compaction temperatures [42,43]. SBS can be effectively employed in conjunction with other polymer modifiers [44,45,46]. Additionally, SBS helped maintain the viscosity of the asphaltic binder at low levels, allowing for much lower mix and compaction temperatures [47].
Calcium Hydroxide (Ca(OH)2), commonly known as hydrated lime, is widely used as a chemical filler in asphalt to improve various properties. Research has shown that 2% hydrated lime enhances tensile strength, stiffness, and Marshall stability [48,49,50,51,52].
Reclaimed Asphalt Pavement (RAP), which consists of asphalt and aggregate recovered during resurfacing or utility access, has been recognized for improving rutting resistance, fatigue life, stiffness, and dynamic modulus. However, excessive RAP content (>20%) can reduce performance at low temperatures [53,54,55,56,57]. It is essential to design pavements that are durable, cost-effective and environmentally friendly to counter the economic challenges of today. Based on previous research, the current study focuses on the modification of 2% hydrated lime as filler replacement, 5% LDPE, and varying 0 to 6% SBS as binder modification, and 15% RAP as HMA replacement, respectively [58,59,60,61,62]. The DOT of Iowa, Illinois, and Indiana endorsed the use of 15% RAP by the weight of mix of surface course for all levels of ESALs for the sustainability with binder. Moreover, RAP greater than 15% will require the reduction in PG grade with respect to classification of one temperature [62].
Incorporating Reclaimed Asphalt Pavement (RAP) and Crumb Rubber (CR) in asphalt mixtures has demonstrated significant environmental and mechanical benefits. RAP has been shown to improve rutting resistance, while CR enhances elasticity and fatigue resistance, making the mix more resilient under traffic loads. The optimal blend of 50% RAP and 30% CR achieves the best balance between durability and cost-efficiency, while also reducing the carbon footprint of pavement rehabilitation [63,64].
Several barriers hinder the widespread use of RAP in asphalt mixtures. On the technical side, limitations in recycling techniques, challenges in characterizing RAP, and quality control issues are significant concerns. The material itself is highly variable; its fundamental properties, like stiffness, depend on multiple factors including aggregate type, binder age, and environmental conditions. A major problem is the aged binder in RAP, which becomes viscous and brittle, making mixtures prone to thermal cracking. While these challenges force most agencies to cap RAP content at around 15%, laboratory tests show that higher proportions are possible with careful material selection and modified mix designs [65].
To address the economic and environmental challenges facing the asphalt industry, this study investigates the combined modification of Hot Mix Asphalt using 2% hydrated lime as filler, 5% LDPE and varying doses of SBS (0–6%) as binder modifiers, and 15% RAP as aggregate replacement. The performance of these modified mixtures is assessed using AASHTOWare MEPDG (version 2.6) to predict pavement distress over the design life of both thin and thick pavement structures under various traffic and climatic conditions.
Asphalt mixtures with a higher elastic modulus (E) demonstrate significantly better resistance to permanent deformation. In particular, polymer-modified hot mix asphalt (PHMA) exhibited the highest elastic modulus, resulting in approximately 10.6% and 19.1% higher rutting life compared to stone mastic asphalt (SMA) and hot mix asphalt (HMA), respectively. The increased rutting life of PHMA mixtures is attributed to their superior mechanical behavior, offering enhanced resistance to deformation under traffic and environmental stresses [65].

2. Materials and Methods

The aggregate used in this study was sourced from the Pabbi quarry in Khyber Pakhtunkhwa province of Pakistan, while a 60/70 penetration grade binder was obtained from Attock Refinery Limited (ARL) in Attack, Pakistan. This binder grade was selected due to its widespread application in Pakistan’s road infrastructure and its suitability for the local climate, which ranges from cold to mild conditions [63]. The Styrene–Butadiene–Styrene (SBS) modifier (YH-791H) was procured from Shijiazhuang Tuya Technology Co. Ltd., Shijiazhuang, China. Low-Density Polyethylene (LDPE) was collected from a plastic manufacturing facility in Hayatabad, Peshawar, and Reclaimed Asphalt Pavement (RAP) was extracted from the discarded asphalt wearing course of Defence Housing Authority (DHA), Peshawar, Pakistan. Hydrated lime was purchased locally from a hardware supplier on University Road, Peshawar, Pakistan [66].
In this investigation, hydrated lime, LDPE, and SBS were used as modifiers in both conventional and RAP-inclusive asphalt concrete mixtures. Incorporating natural asphalt (NA) with Hydrated Lime (HL) and Portland Cement (PC) in asphalt stabilized base (ASB) mixtures enhances the mechanical properties, particularly the stiffness, fatigue resistance, and water resistance. This approach offers a sustainable alternative that reduces asphalt consumption and costs [67]. The modified mixtures incorporated 2% hydrated lime, 5% LDPE, and 15% RAP by weight. SBS was varied at four levels: 0%, 2%, 4%, and 6%. The physical properties of hydrated lime, LDPE, and SBS are provided in Table 1, Table 2, and Table 3, respectively. The results of the tests conducted on aggregates and ARL 60/70 penetration grade bitumen are provided in Table 4 and Table 5, respectively.
A comprehensive description of the methodology adopted in this study is provided below.

2.1. Marshall Mix Design for Optimum Binder Content

In accordance with the National Highway Authority (NHA) specifications (1998), NHA Class-B aggregates were selected for the preparation of dense-graded surface course asphalt mixtures. The Marshall mix design method, as outlined in ASTM D6926-10 (2010a) [81], was employed, with a nominal maximum aggregate size (NMAS) of 19 m. Curves relating asphalt content to key parameters such as volumetric properties, flow, and Marshall stability were developed following the guidelines provided in the MS-2 manual [64]. These curves were subsequently used to determine the Optimum Binder Content (OBC) for the asphalt mixtures. As presented in Table 6, all measured values met the specified criteria, confirming compliance with the relevant standards.

2.2. Superpave Gyratory Sample Preparation for Performance Test

The Simple Performance Tester (SPT) requires specimens to be compacted using the Superpave Gyratory Compactor to replicate real-world compaction conditions during road paving operations. Therefore, a Superpave Gyratory Compactor was employed for specimen preparation in this study. Prior to compaction, the bitumen was modified by adding the appropriate proportion of modifier and stirring the mixture thoroughly. The aggregates were also modified by incorporating hydrated lime as a filler replacement. Gyratory samples were prepared using both conventional Hot Mix Asphalt (HMA) and HMA containing 15% Reclaimed Asphalt Pavement (RAP). A total of 33 samples were prepared and then cut and trimmed to the required dimensions for performance testing.
This research involved three primary modifications in comparison to conventional HMA: (i) incorporation of 15% RAP into the total mix mass, (ii) replacement of a portion of bitumen with modifiers (LDPE and SBS), and (iii) replacement of the aggregate filler with hydrated lime. The bitumen and modifiers were heated to 160 °C and stirred using a mechanical stirrer at a speed of 3000 revolutions per minute for 30 min. Four binder modifications were tested: 5% LDPE, 5% LDPE with 2% SBS, 5% LDPE with 4% SBS, and 5% LDPE with 6% SBS [82,83,84,85]. The rheological properties of LDPE-modified asphalt binders showed enhanced resistance to permanent deformation under cyclic loading. The MSCR tests revealed that extended recovery times (19 s) were particularly beneficial for high-dosage LDPE binders, improving their ability to recover from deformation under stress. This behavior underscores the importance of extended recovery periods in optimizing binder performance at high temperatures [86].
Recent studies have investigated the addition of LDPE and HDPE as modifiers in asphalt mixtures to improve their moisture resistance, permanent deformation, and fatigue resistance. The incorporation of polyethylene not only improves the binder-aggregate bond but also enhances the structural durability of the asphalt under moisture and cyclic loading conditions [87]. Solid calcium oxide (CaO) was procured from the local market, soaked in water, and allowed to hydrate before cooling to room temperature. The resulting hydrated lime slurry (Ca(OH)2) solidified and was subsequently pulverized and sieved through a No. 200 sieve (0.075 mm) to obtain a fine powder. This hydrated lime powder was used as a 2% replacement (by weight) of aggregate filler in all modified HMA mixes, excluding the conventional sample. The aggregate weights for the preparation of gyratory samples are tabulated in Table 7.
The bitumen content in the RAP was determined following ASTM D2172 [88], and found to be 4.29%, which closely corresponded with the Optimum Binder Content (OBC) of the mix. For each laboratory-prepared gyratory specimen, a total of 7.300 Kg of HMA mixture was used for both conventional and modified mixes. Mixing of aggregate and asphalt was performed using a mechanical mixer, following the procedures outlined in ASTM D6925 (2003) [89] and AASHTO T312 (2015) [90], at a mixing temperature range of 160 °C to 170 °C—consistent with typical production temperatures for paving mixes in Pakistan, as per NHA specifications.
After conditioning, the asphalt mixtures were compacted using the Superpave Gyratory Compactor at a compaction temperature of 135 °C. To satisfy the high-traffic design requirement for roadways with more than 30 million ESALs, the specimens were compacted to 125 gyrations (N_design). The resulting samples had a diameter of 150 mm and an approximate height of 170 mm [63].
For dynamic modulus testing, the gyratory-compacted specimens were cored from the centre using a portable coring machine and then trimmed using a saw cutter to meet the required height-to-diameter ratio of 1.5. The saw-cut specimens were inspected to ensure smooth, parallel diametric faces and adherence to dimensional requirements per AASHTO TP62-07 (2009) [91]. To comply with AASHTO TP79-09 (2025) [92], specifications for dynamic modulus testing, each specimen was cored to a diameter of 100 mm and trimmed to a height of 150 mm [63].

2.3. Performance Test by Simple Performance Tester

The dynamic modulus determined in this study using SPT adhered to the guidelines outlined in AASHTO TP 62-07 (2009) [91]. Triplicate samples of each modified HMA mixture were tested at controlled temperatures of 4.4 °C, 21.1 °C, 37.8 °C, and 54.4 °C ± 0.5 °C within the environmental chamber. The test method applied continuous uniaxial sinusoidal compressive stress to the specimens. As per the standard, the environmental chamber was sealed and allowed to reach thermal equilibrium at the designated test temperature. The UTS 6 software was used to initiate the testing process once the specimens reached equilibrium. Testing was performed at multiple frequencies: 25, 10, 5, 1, 0.5, and 0.1 Hz. Prior to the main test, an initial modulus was established by subjecting each sample to a 20-cycle haversine load, which provided the baseline modulus value. Upon completion, the testing generated a report containing dynamic modulus and phase angle measurements across the specified temperature and frequency ranges [63].

3. Results

3.1. Consistency Test for Binder

The penetration value is commonly used to assess the hardening and stiffness of bitumen at moderate temperatures. A lower penetration value indicates higher binder stiffness. As illustrated in Figure 1, increasing the percentage of the modifier (5% LDPE-SBS) in the bitumen results in a progressive decrease in penetration, signifying a reduction in binder fluency and an increase in stiffness. The addition of 5% LDPE alone leads to an 11.3% reduction in penetration, while the combination of 5% LDPE and 2% SBS results in a 14.52% decrease. Beyond this point, penetration values drop sharply, indicating an undesirable increase in stiffness.
The softening point test is a standard method used to evaluate the resistance of bitumen to deformation at elevated temperatures and to identify the approximate transition between viscoelastic and viscous behavior. Incorporating 5% LDPE by mass into the binder raises the softening point by approximately 4 °C. As shown in Figure 1, the addition of 5% LDPE and 2% SBS increases the softening point by around 8 °C. A rapid increase in softening point is observed beyond the 5% LDPE–2% SBS modification level. This increase in stiffness is attributed to factors such as higher surface energy, increased modulus, and enhanced contact forces between LDPE and SBS, which collectively inhibit material penetration. Figure 1 illustrates the influence of LDPE and SBS modification across the experimental range.

3.2. Evaluating Dynamic Modulus by the Use of SPT

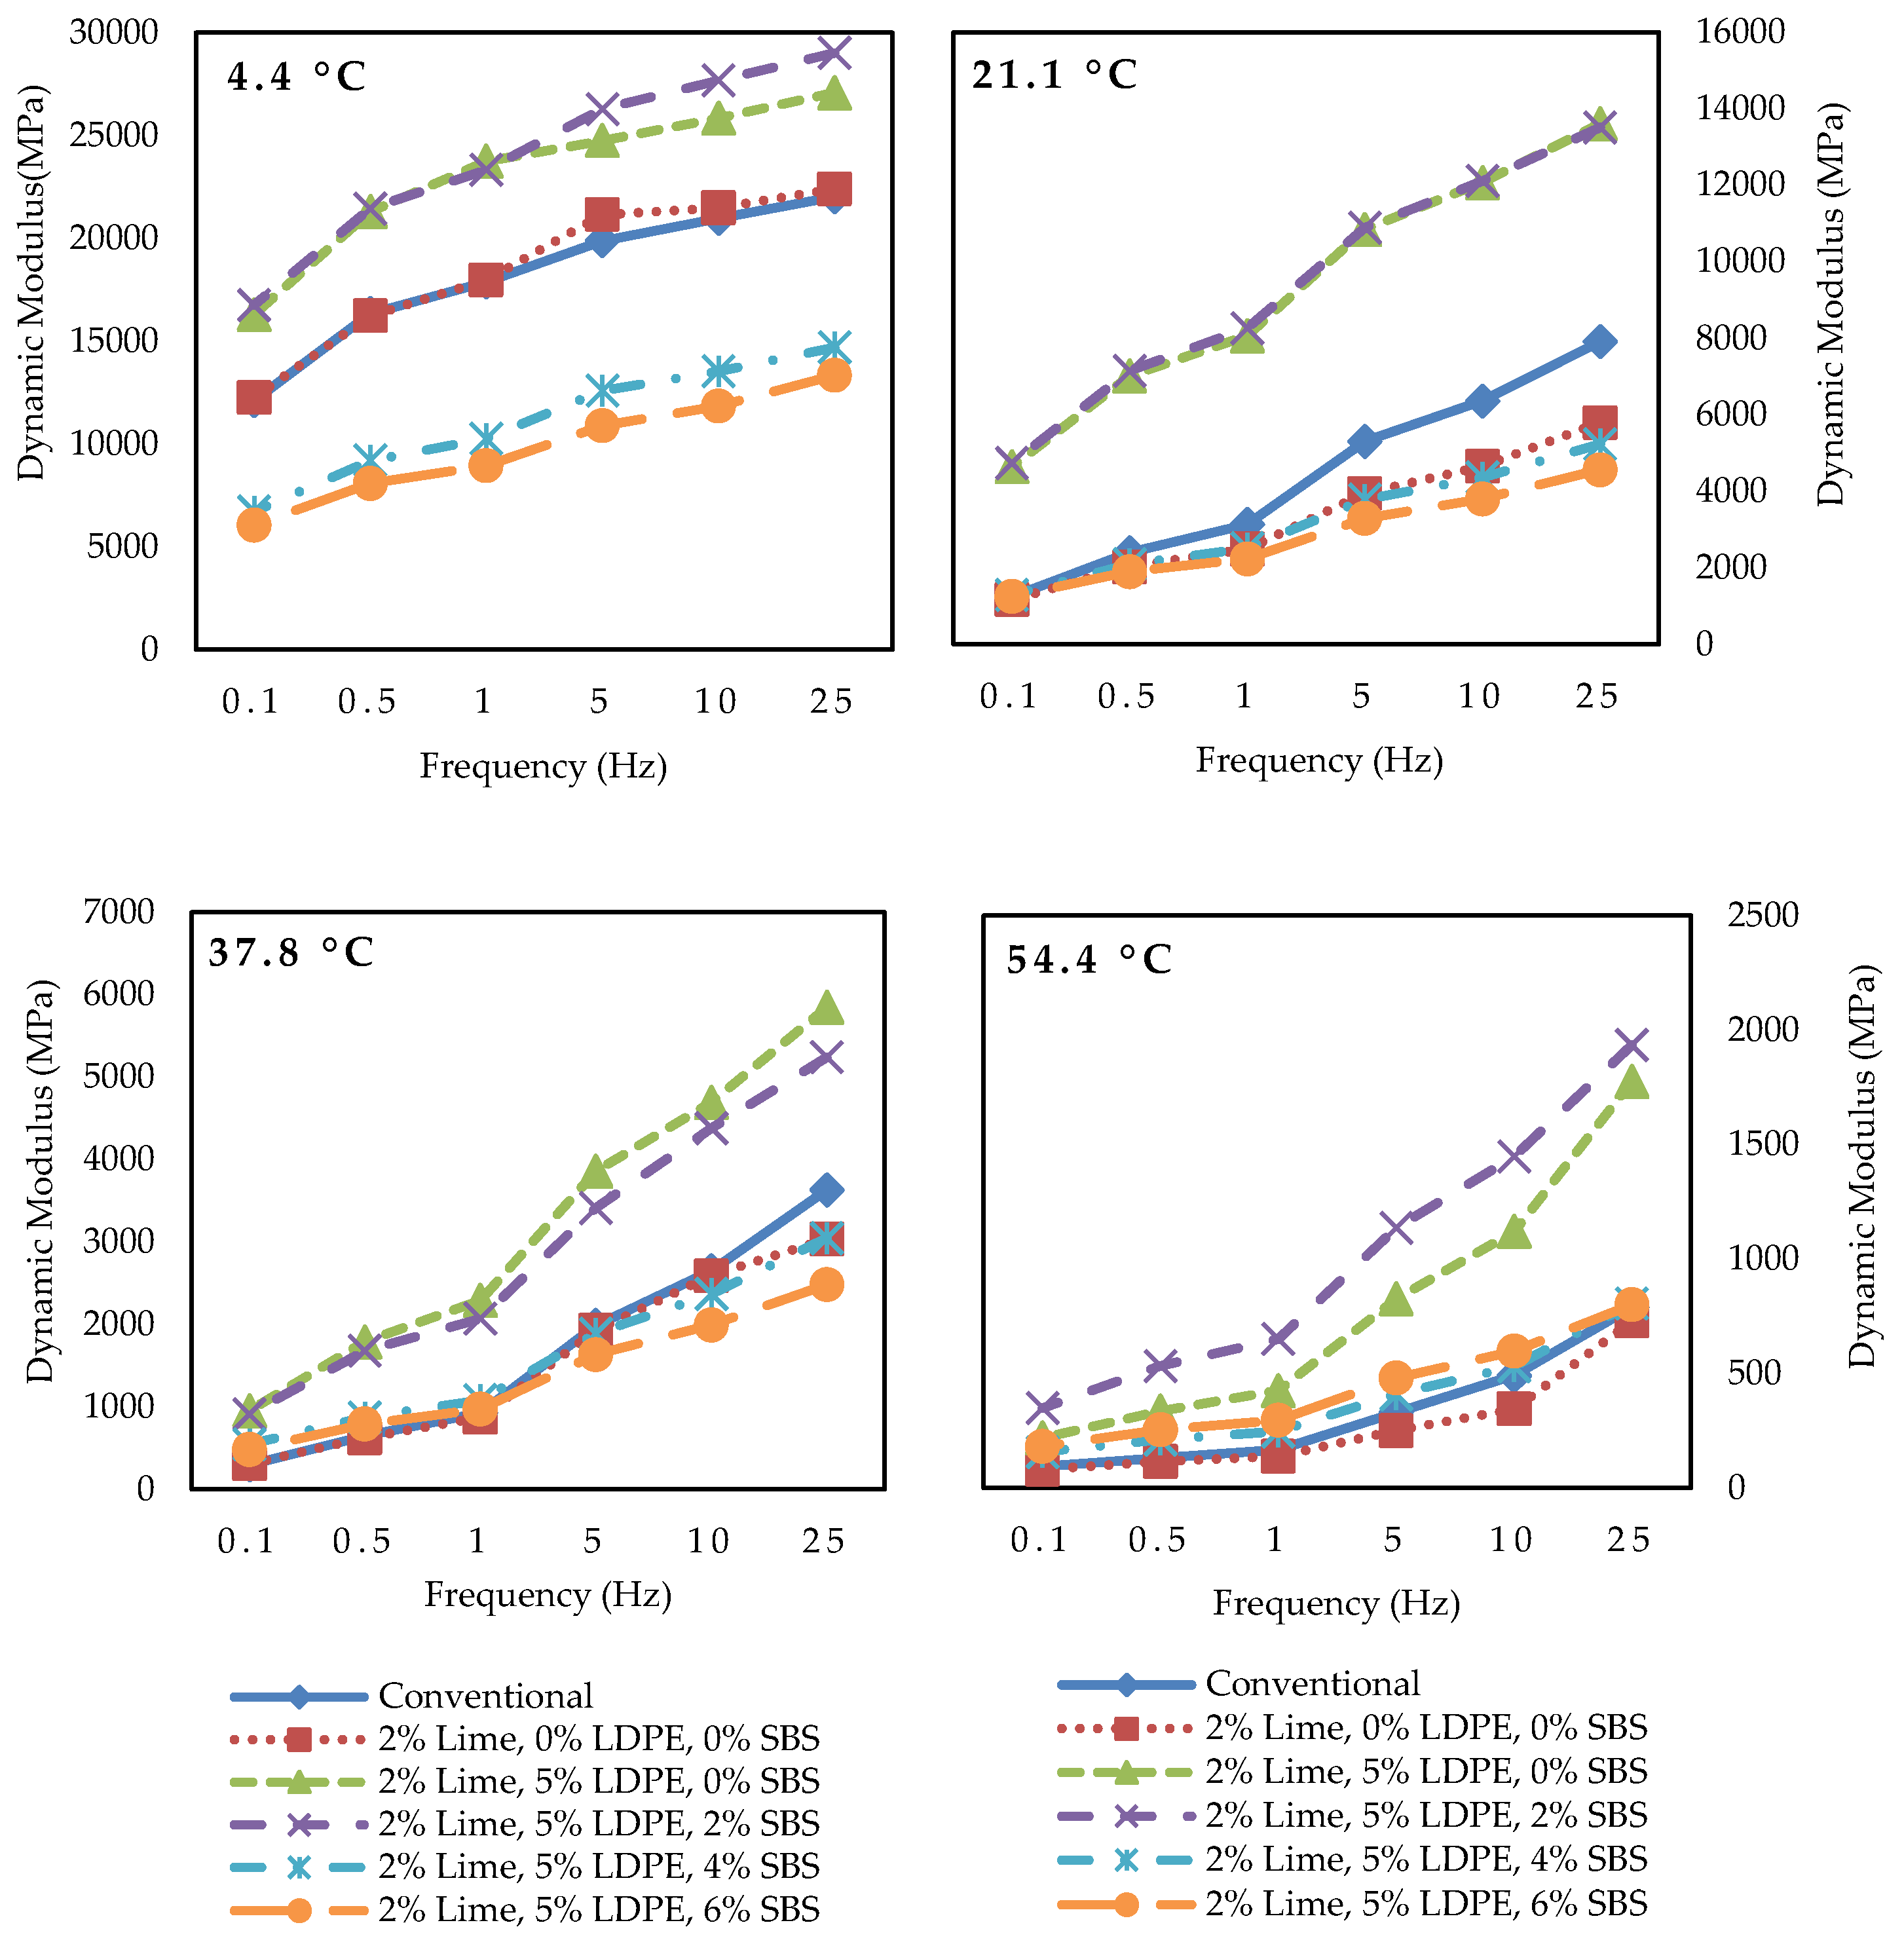
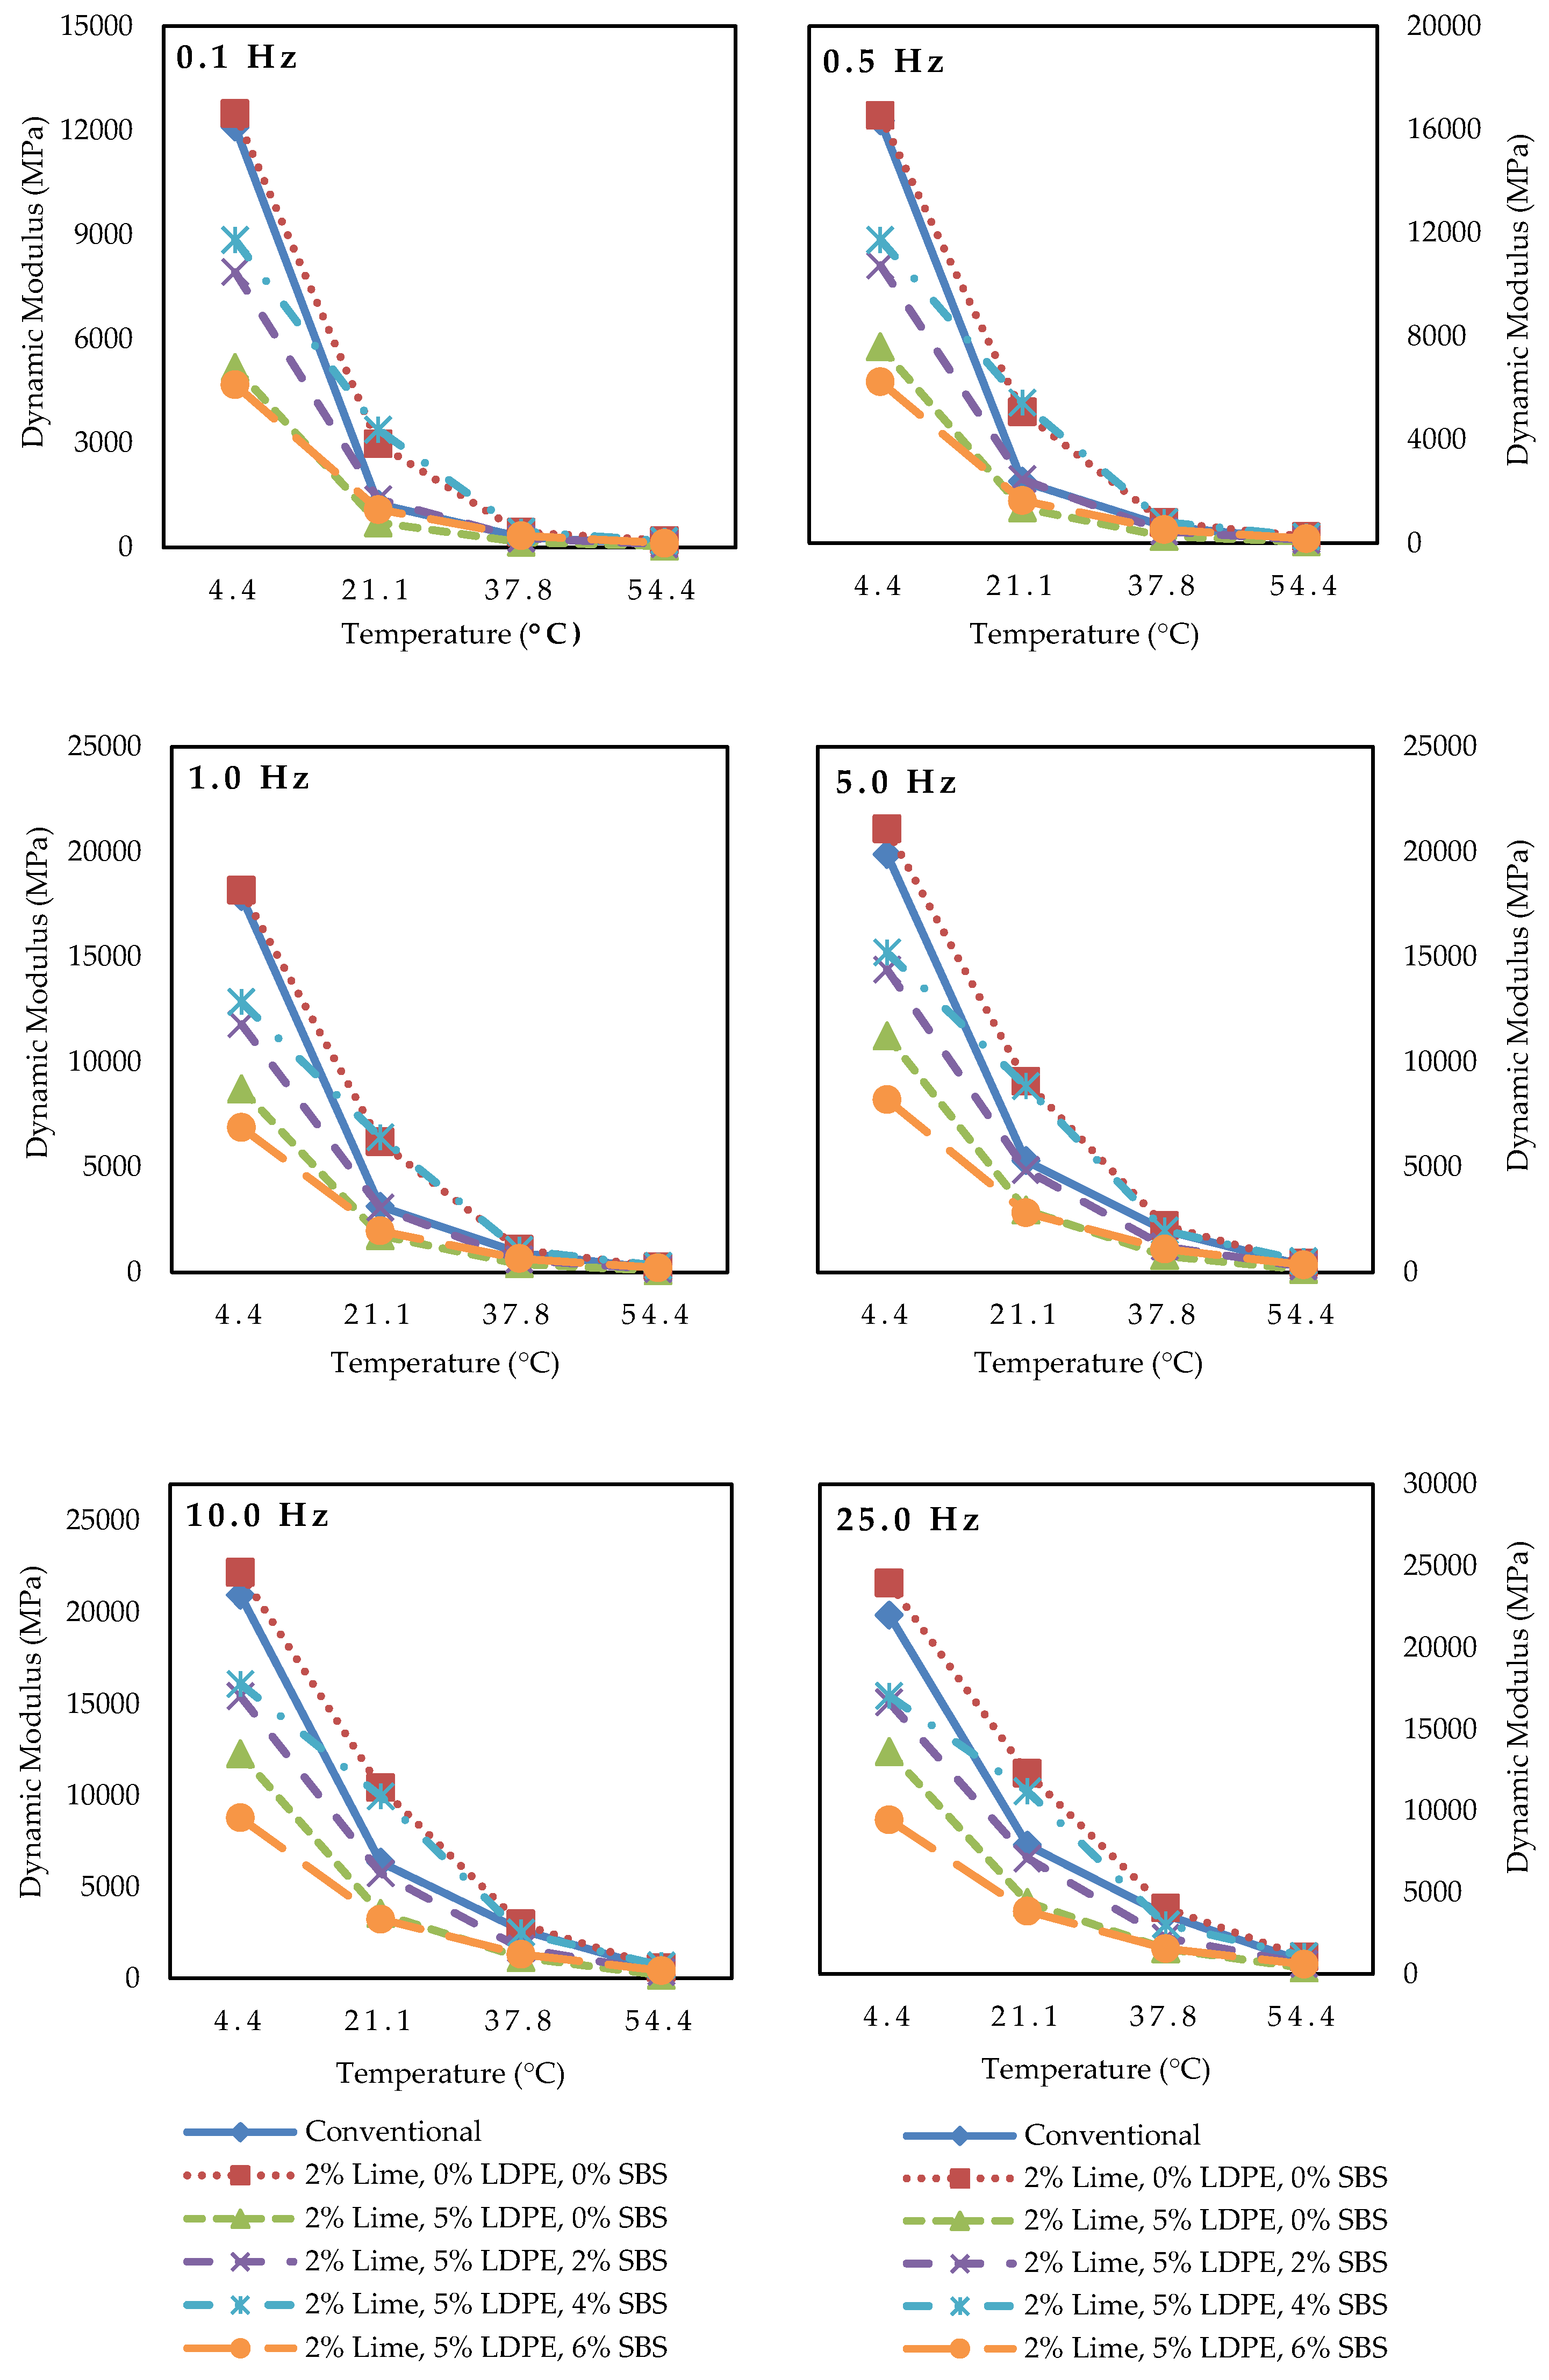
The dynamic modulus of the samples exhibited an inverse relationship with temperature, indicating that higher test temperatures resulted in lower dynamic modulus values. Similarly, a decrease in loading frequency led to reduced dynamic modulus, confirming the material’s sensitivity to both temperature and loading rate. The results demonstrated significant variation in dynamic modulus values, highlighting the binder’s susceptibility to thermal and frequency-related changes in stiffness.
A total of 33 modified HMA samples were tested at four different temperatures (4.4 °C, 21.1 °C, 37.8 °C, and 54.4 °C) and six loading frequencies (25, 10, 5, 1, 0.5, 0.1, and 0.01 Hz). Each modified mixture contained three replicate specimens and was composed of 2% Hydrated Lime, 5% LDPE, and varying SBS contents (0%, 2%, 4%, and 6%), both with and without 15% RAP.
Figure 2, Figure 3, Figure 4 and Figure 5 present isothermal and isochronal plots of the dynamic modulus (E*) for the modified HMA samples. The figures clearly illustrate that dynamic modulus increases with loading frequency and decreases with temperature. At lower temperatures, the modulus values were significantly higher, indicating greater stiffness. In contrast, higher temperatures resulted in reduced modulus values, reflecting increased flexibility. These trends confirm the thermo-rheological behavior of modified asphalt mixtures and the critical role of temperature and frequency in determining pavement performance.
Furthermore, the addition of HMA modifiers such as hydrated lime, LDPE, and SBS resulted in an increase in dynamic modulus. Specifically, the dynamic modulus increased with the inclusion of SBS up to 2%, beyond which the improvement plateaued. The incorporation of 2% hydrated lime also contributed positively to the dynamic modulus. Among the HMA-modified samples containing 15% RAP, the highest dynamic modulus was observed in samples modified with the combined addition of lime, LDPE, and SBS. Overall, the optimum dynamic modulus was achieved in samples containing 2% hydrated lime, 5% LDPE, 2% SBS, and 15% RAP.
As illustrated in Figure 2 and Figure 3, the dynamic modulus (E*) increases with rising loading frequency. This behavior is attributed to the reduced contact time and pressure between the tire and pavement at higher frequencies, which enhances the mixture’s stiffness and resistance to deformation, resulting in a higher dynamic modulus.
Furthermore, the graph indicates that the HMA mixture containing 2% hydrated lime, 5% LDPE, 2% SBS, and 15% RAP exhibits a higher dynamic modulus compared to other modified HMA combinations. This enhancement can be attributed to the role of SBS, which improves the viscosity and stiffness of the mixture, thereby increasing the dynamic modulus. Figure 4 and Figure 5 clearly illustrate the relationship between dynamic modulus and loading frequency. As observed, the dynamic modulus decreases with decreasing frequency and increases with increasing frequency, reflecting the viscoelastic nature of the asphalt mix.
The response curve reaches a peak at the combination of 2% hydrated lime, 5% LDPE, and 2% SBS with 15% RAP, indicating that this specific blend offers optimum stiffness and viscosity characteristics. Consequently, it yields a higher dynamic modulus than other modified mixtures. These findings are consistent across all tested temperatures and frequencies, highlighting the robustness of this modifier combination for enhanced pavement performance.

3.3. Development of Master Curves

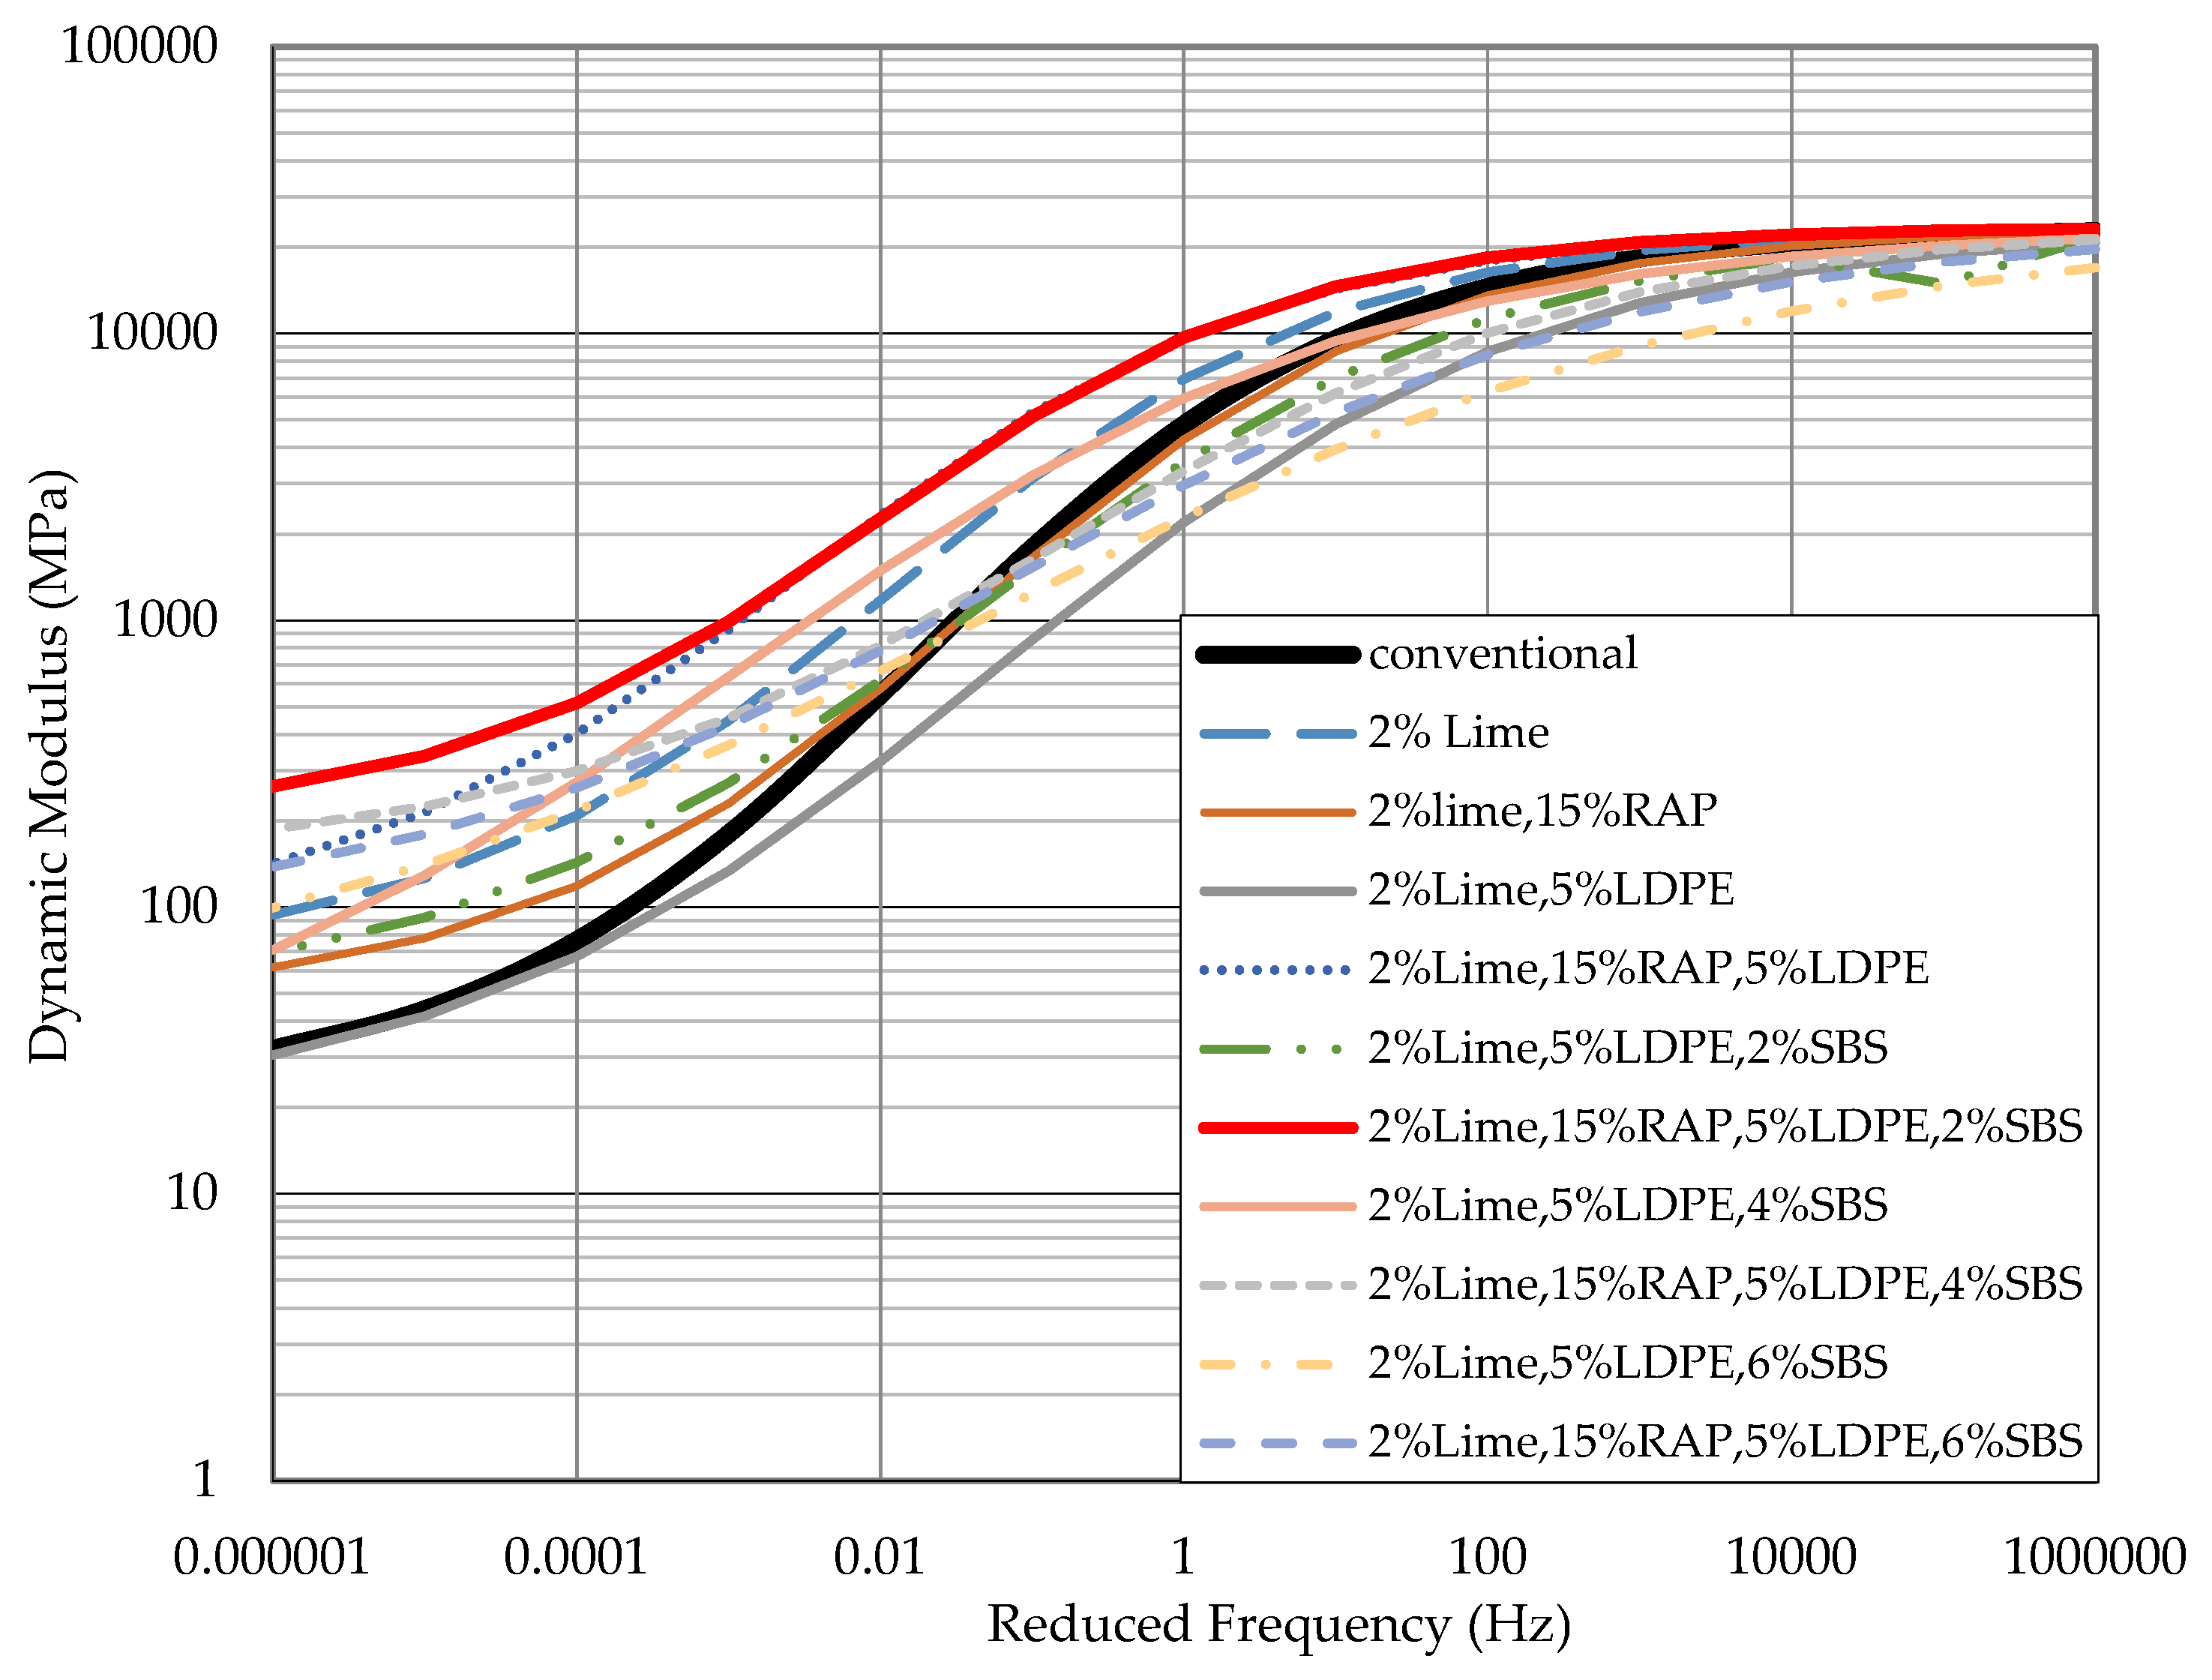
The development of the master curve followed the methodology outlined in the NCHRP master curve analysis using Master Solver 09-29 2.2. For pavement design, dynamic modulus values obtained from the Asphalt Mixture Performance Tester (AMPT) were used. The data for each combination of modified materials was averaged at each temperature, and the master curve was constructed using the time–temperature superposition principle, with a reference temperature of 21.1 °C. A solver add-in in MS Excel was employed to minimize the sum of squared errors (SSE) and obtain the best-fit line. This process transformed dynamic modulus values recorded at various frequencies and temperatures to the reference temperature, producing a smooth master curve that represents the relationship between dynamic modulus and frequency.
The time–temperature superposition principle is applicable to thermo-rheologically simple materials, and it is assumed that all HMA mixtures in this study exhibit such behavior. These curves provide critical insights into how temperature and frequency affect stiffness, and they serve as essential inputs for AASHTOWare MEPDG (version 2.6) sed in pavement design.
The master curves for lime and LDPE–SBS-modified HMA mixtures, with and without 15% RAP, are presented in Figure 6. The figure illustrates the response of dynamic modulus across a frequency spectrum.
The results show that HMA modified with 15% RAP exhibited greater stiffness across both temperature extremes, up to 2% SBS content, beyond which stiffness declined. The combination of 2% hydrated lime, 5% LDPE, 2% SBS, and 15% RAP yielded the optimum performance, showing peak values of dynamic modulus at both low and high frequencies.
The low-frequency range (e.g., 0.1 Hz) represents conditions such as slow-moving or stationary loads, while the high-frequency range (e.g., 25 Hz) simulates fast-moving traffic. Across the full temperature range (4.4 °C to 54.4 °C), the mixture containing 2% hydrated lime, 5% LDPE, 2% SBS, and 15% RAP demonstrated the most favourable dynamic modulus values, making it suitable for diverse traffic conditions.
The Master Solver worksheet also includes essential inputs such as reduced frequency, shift factors, and values required for the MEPDG tool.
By examining the master curves, valuable insights were obtained regarding stiffness, fatigue resistance, rutting resistance, and temperature susceptibility. Quantitative and statistical analyses can be performed to compare and evaluate the performance of different modifier combinations.
At low frequencies and high temperatures, materials with higher dynamic modulus and less degradation are considered to have better fatigue resistance. The sample containing 2% hydrated lime, 5% LDPE, 2% SBS, and 15% RAP showed the best performance under these conditions, achieving a dynamic modulus of 349.35 MPa at 0.1 Hz and 54.4 °C. This value was 254.675 MPa higher than the conventional mix, representing a 269% increase. The addition of 15% RAP alone improved average stiffness by 273% (up to 250 MPa), up to 2% SBS content, after which performance declined. The inclusion of 2% hydrated lime alone added 110.2 MPa, or a 116% increase over the conventional sample at the same conditions.
At high frequencies and high temperatures, which relate to rutting resistance, the same optimal mix achieved a dynamic modulus of 1934.75 MPa at 25 Hz and 54.4 °C. This was 1145.55 MPa higher than the conventional sample, showing a 145% increase. Here too, 15% RAP contributed an average improvement of 200%, while 2% hydrated lime alone improved stiffness by 280.35 MPa, or 35.52%, at high frequency and temperature, indicating excellent rutting resistance and suitability for heavy traffic scenarios.
Finally, the shape and position of the master curves were compared across materials. Mixtures that maintained consistent dynamic modulus values over the temperature range were considered less temperature susceptible. A reduction in curve variation was observed in modified samples compared to conventional ones, indicating better temperature stability and greater performance reliability across varying climatic conditions.

3.4. MEPDG AASHTOWare

3.4.1. Distress Analysis

Various pavement design scenarios were analyzed in this study, including combinations of cold and warm regions, thin and thick pavement structures, and low and high traffic conditions, with a design life of 20 years.
In the Mechanical Properties input section of the AASHTOWare MEPDG (version 2.6), “Input Level 1” was selected for the dynamic modulus. Values obtained from the Simple Performance Test (SPT), corresponding to respective temperatures, were inputted. These dynamic modulus values were critical in defining the mechanical behavior of the asphalt layers. The reference temperature was set to 70 °F (≈21.1 °C), following AASHTO guidelines.
The asphalt binder input level was set to Level 1, with Penetration/Viscosity Grade selected. The corresponding values for softening point, specific gravity, and penetration (according to the chosen asphalt modifier) were entered. The Indirect Tensile Strength (ITS) at 14 °F (≈−10 °C) and creep compliance were automatically generated by AASHTOWare as part of “Input Level 3”, based on the dynamic modulus and binder properties. Thermal properties were kept at default values.
In the Climate section, historical data since 1979 was selected from the AASHTOWare climate database for two locations:
1.
New York (cold region): Avg. temperature = 11.8 °C, with 160.3 wet days/year.
2.
Arizona (warm region): Max. temperature = 42 °C, with 68.1 wet days/year.
For pavement thickness, two types were used:
1.
Thin pavement: 4 in (≈101.6 mm);
2.
Thick pavement: 6 in (≈152.4 mm).
The asphalt layer was assigned a unit weight of 23.56 KN/m3, effective binder content of 9.93%, air voids of 4%, and Poisson’s ratio of 0.35. The pavement structure also included:
1.
8 in (≈203 mm) aggregate base (A-1-a);
2.
8 in (≈203 mm) sub-base (A-1-b);
3.
Semi-infinite subgrade (A-1-a).
For traffic loading, two conditions were considered based on the National Highway Authority (NHA) 2017 report:
1.
Low traffic:
  • AADTT (trucks) = 2209;
  • AADTT (cars) = 11,076;
  • Estimated cumulative truck traffic over 20 years = 9,849,470.
2.
High traffic:
  • AADTT (trucks) = 4418;
  • AADTT (cars) = 22,152;
  • Estimated cumulative truck traffic over 20 years = 19,698,900.
Other traffic and geometric parameters included:
    • Urban freeway terrain and facility type;
    • Non-truck linear traffic growth rate: 4%;
    • Number of lanes: 3;
    • Truck distribution: 50% in the design direction and 95% in the design lane;
    • Operating speed: 60 mph (≈96.54 Km/h);
    • Reliability level: 90% for performance criteria.

3.4.2. Comparison of Modifier Performance at Different Scenarios

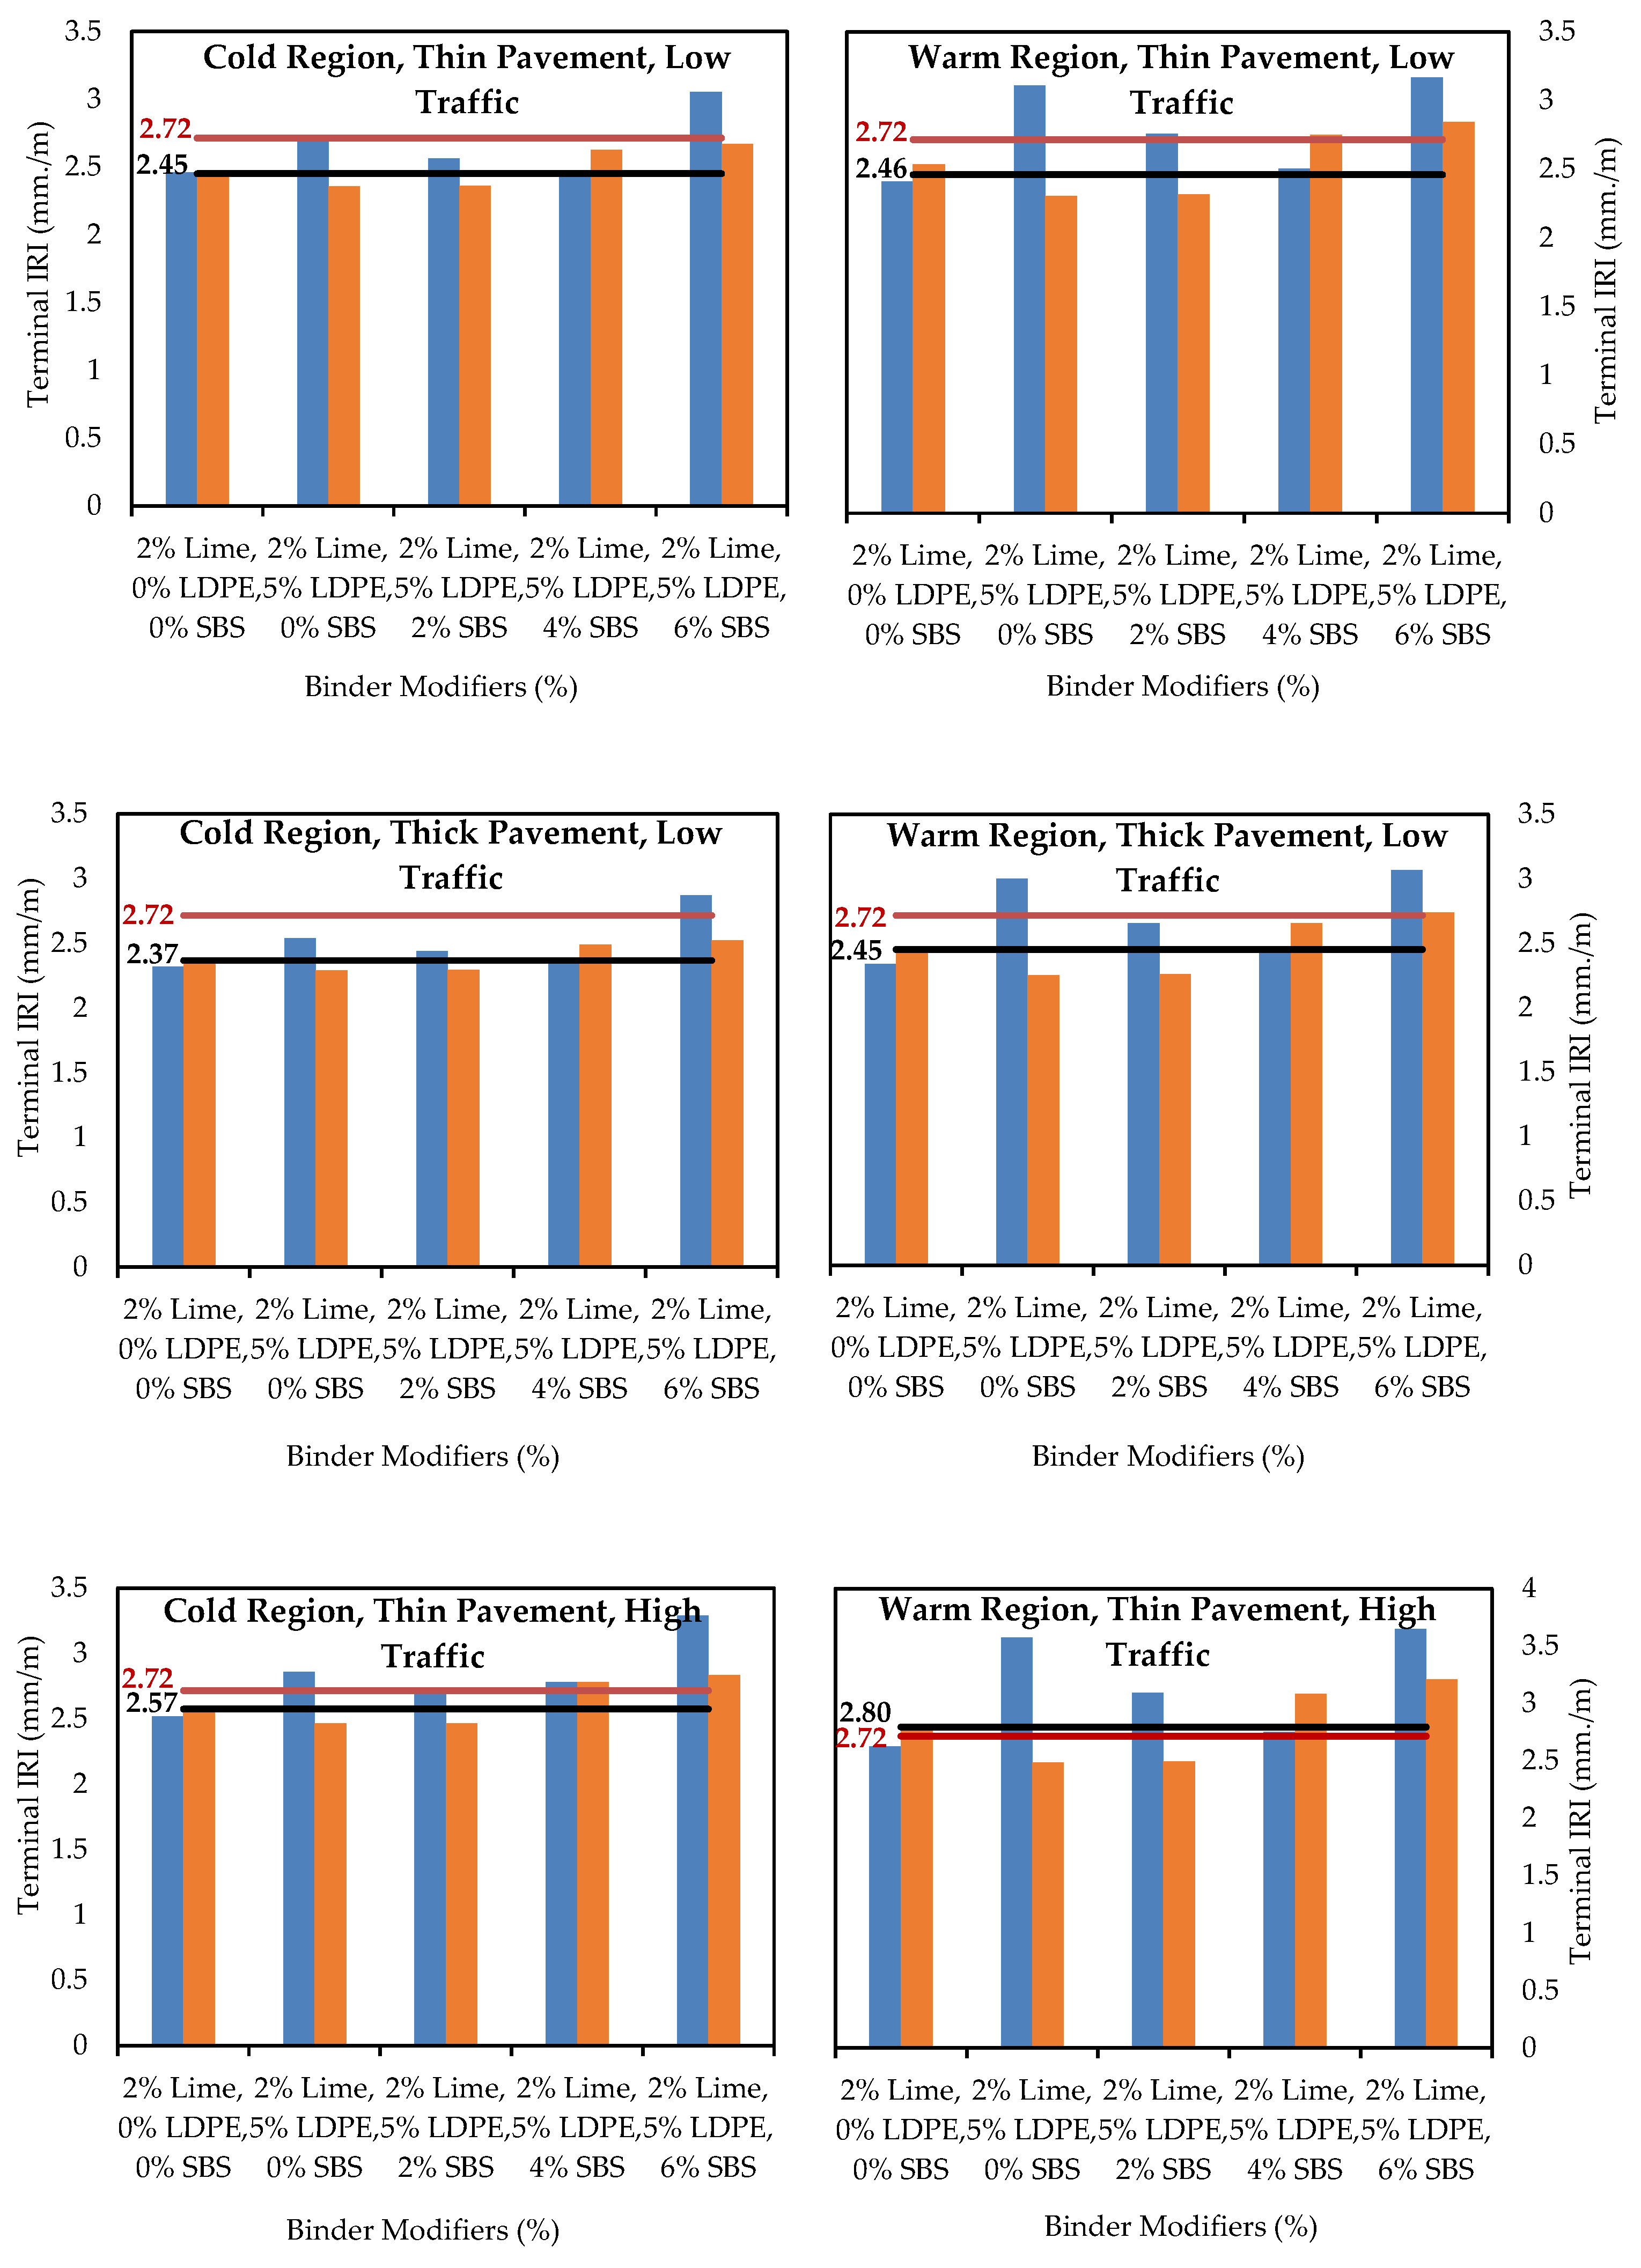
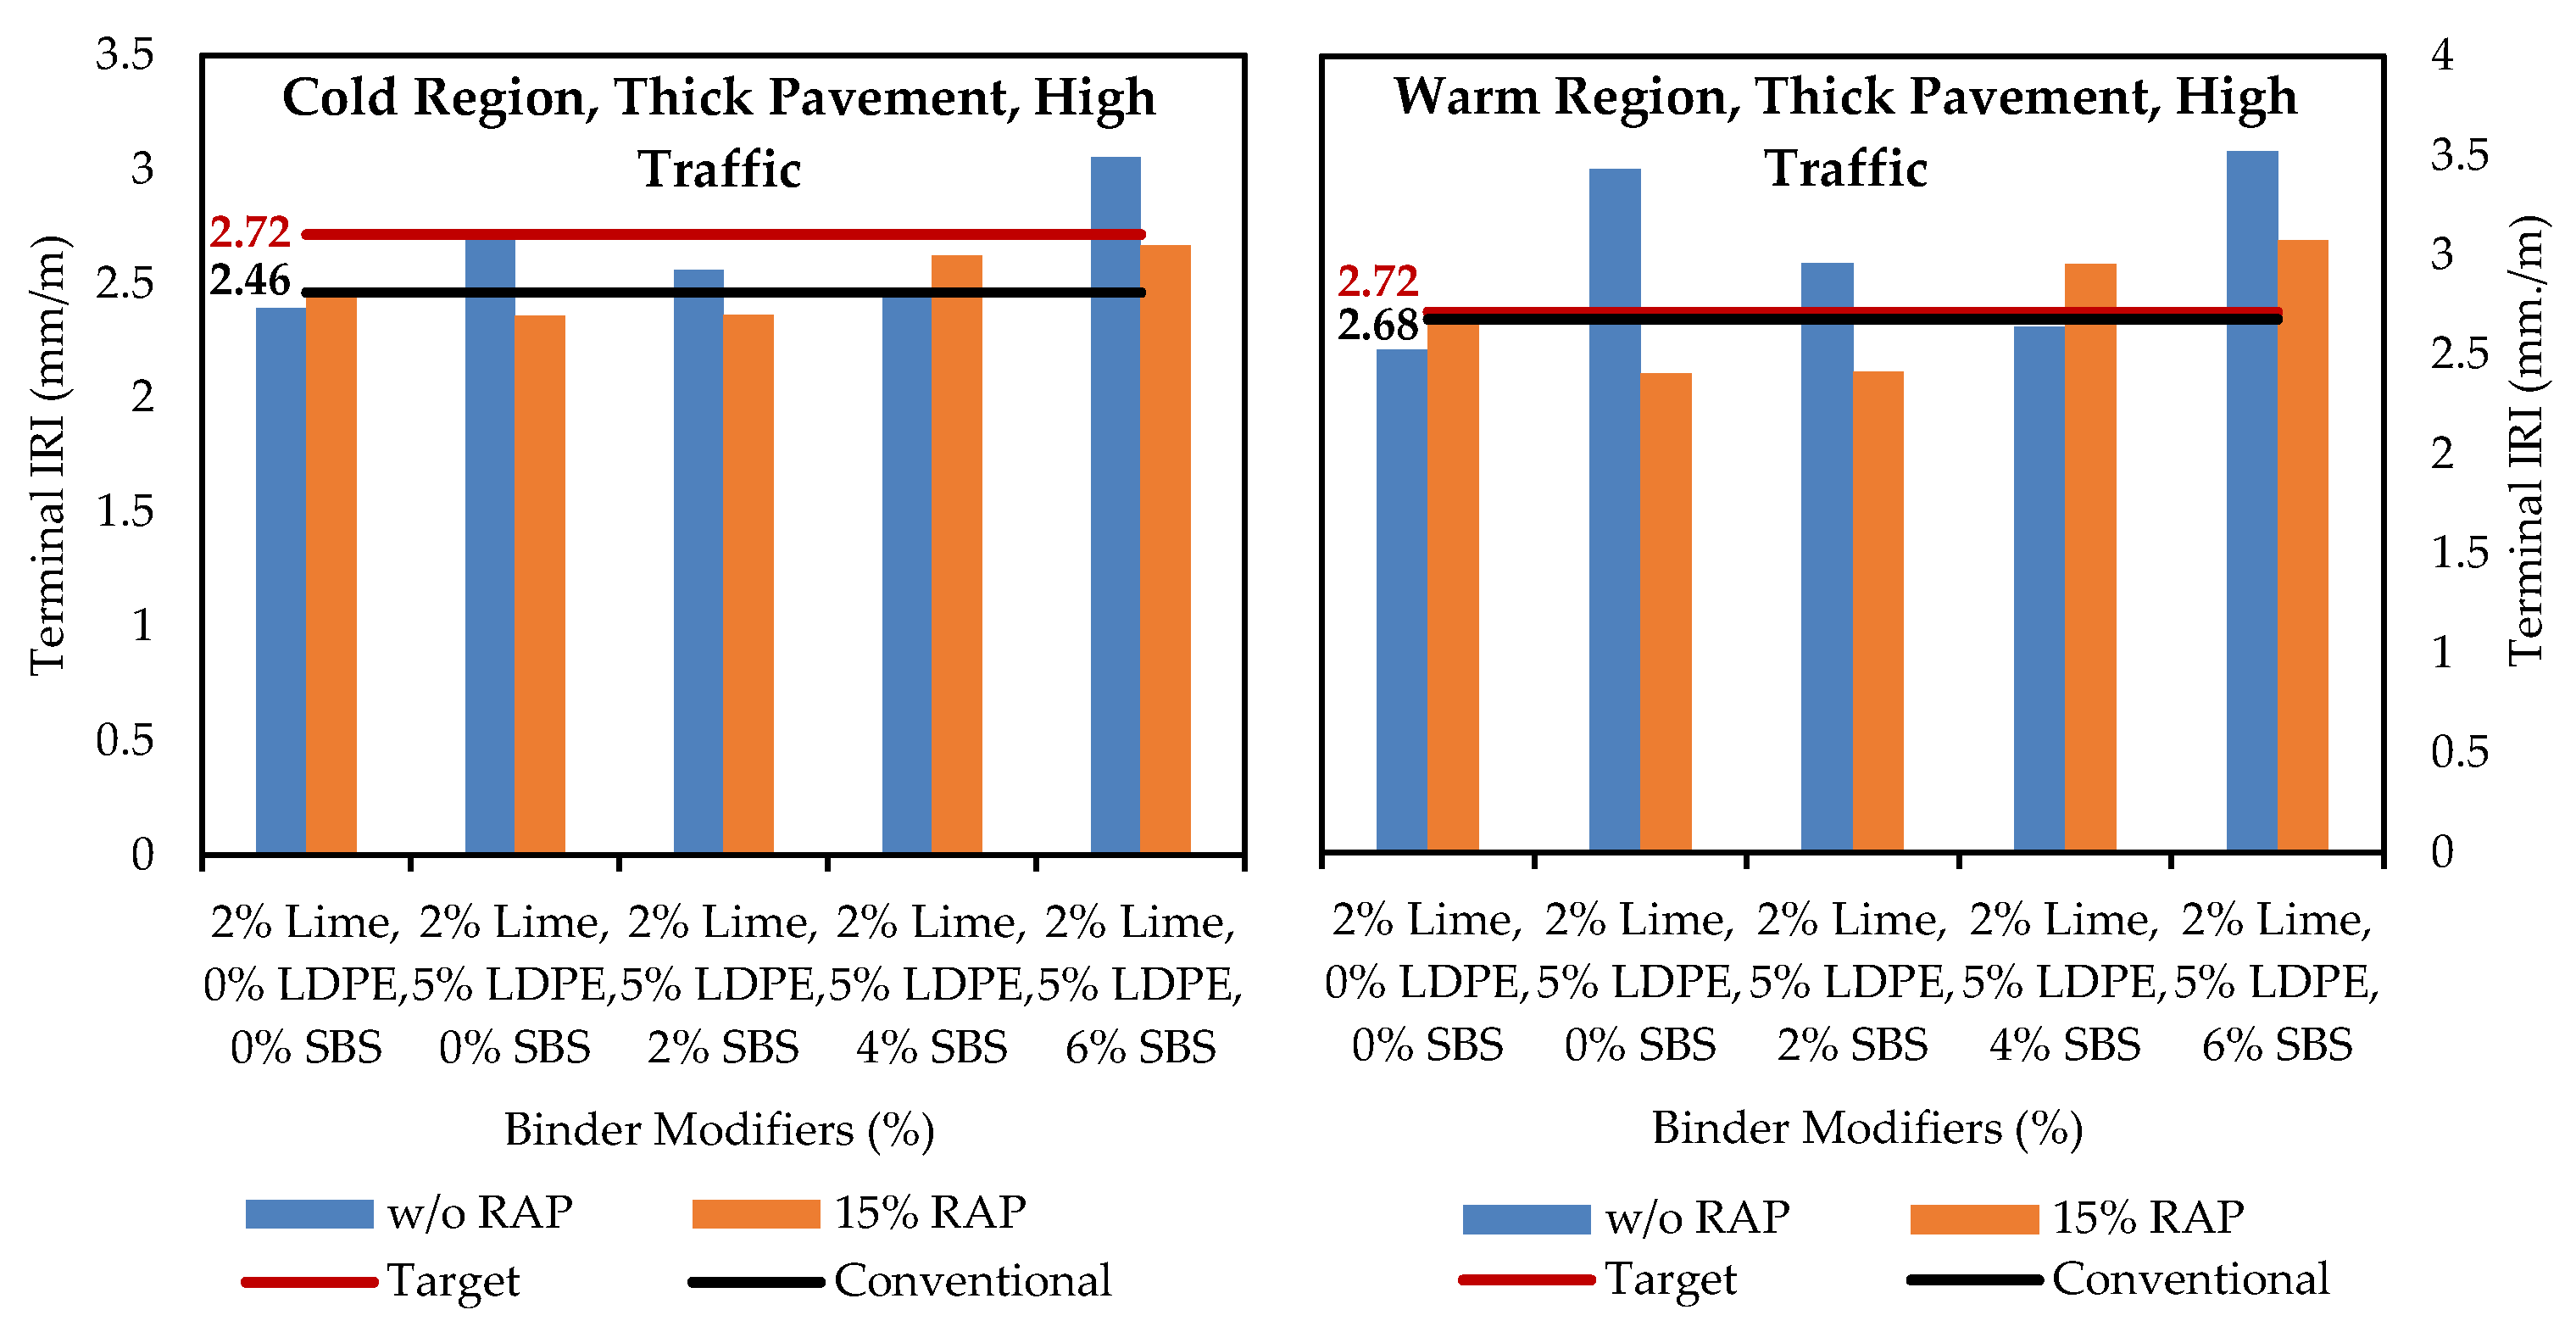
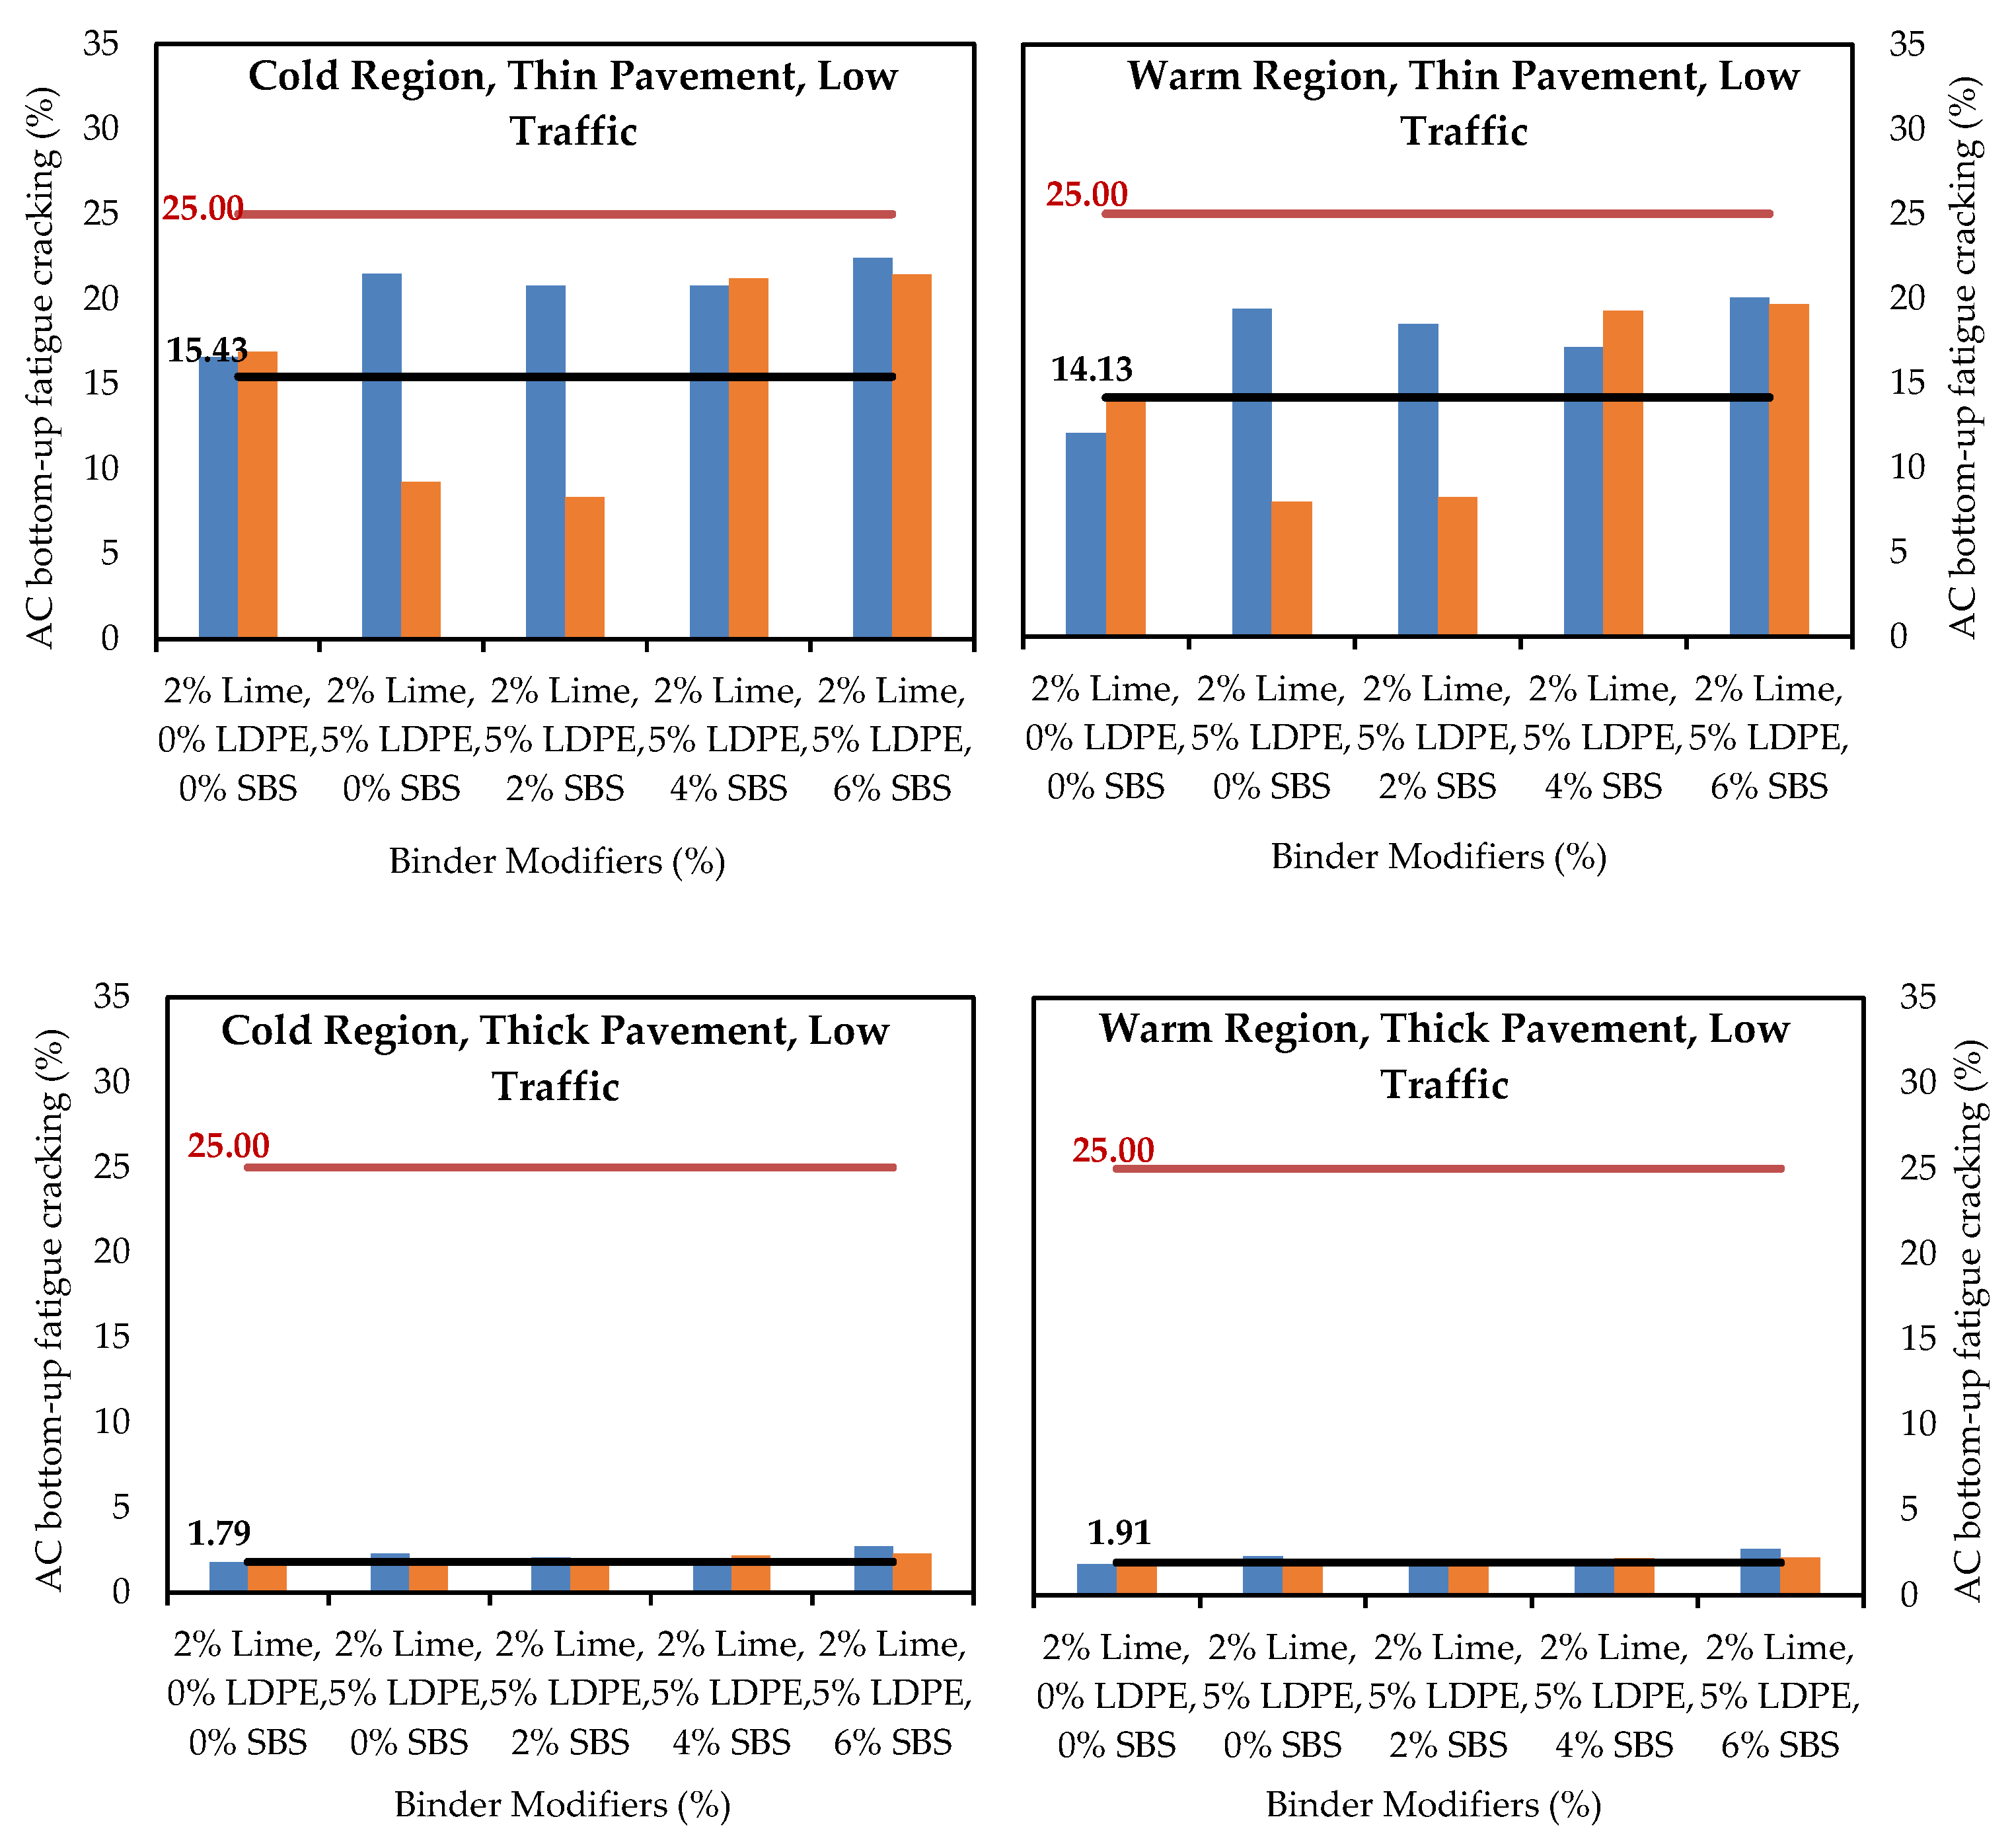
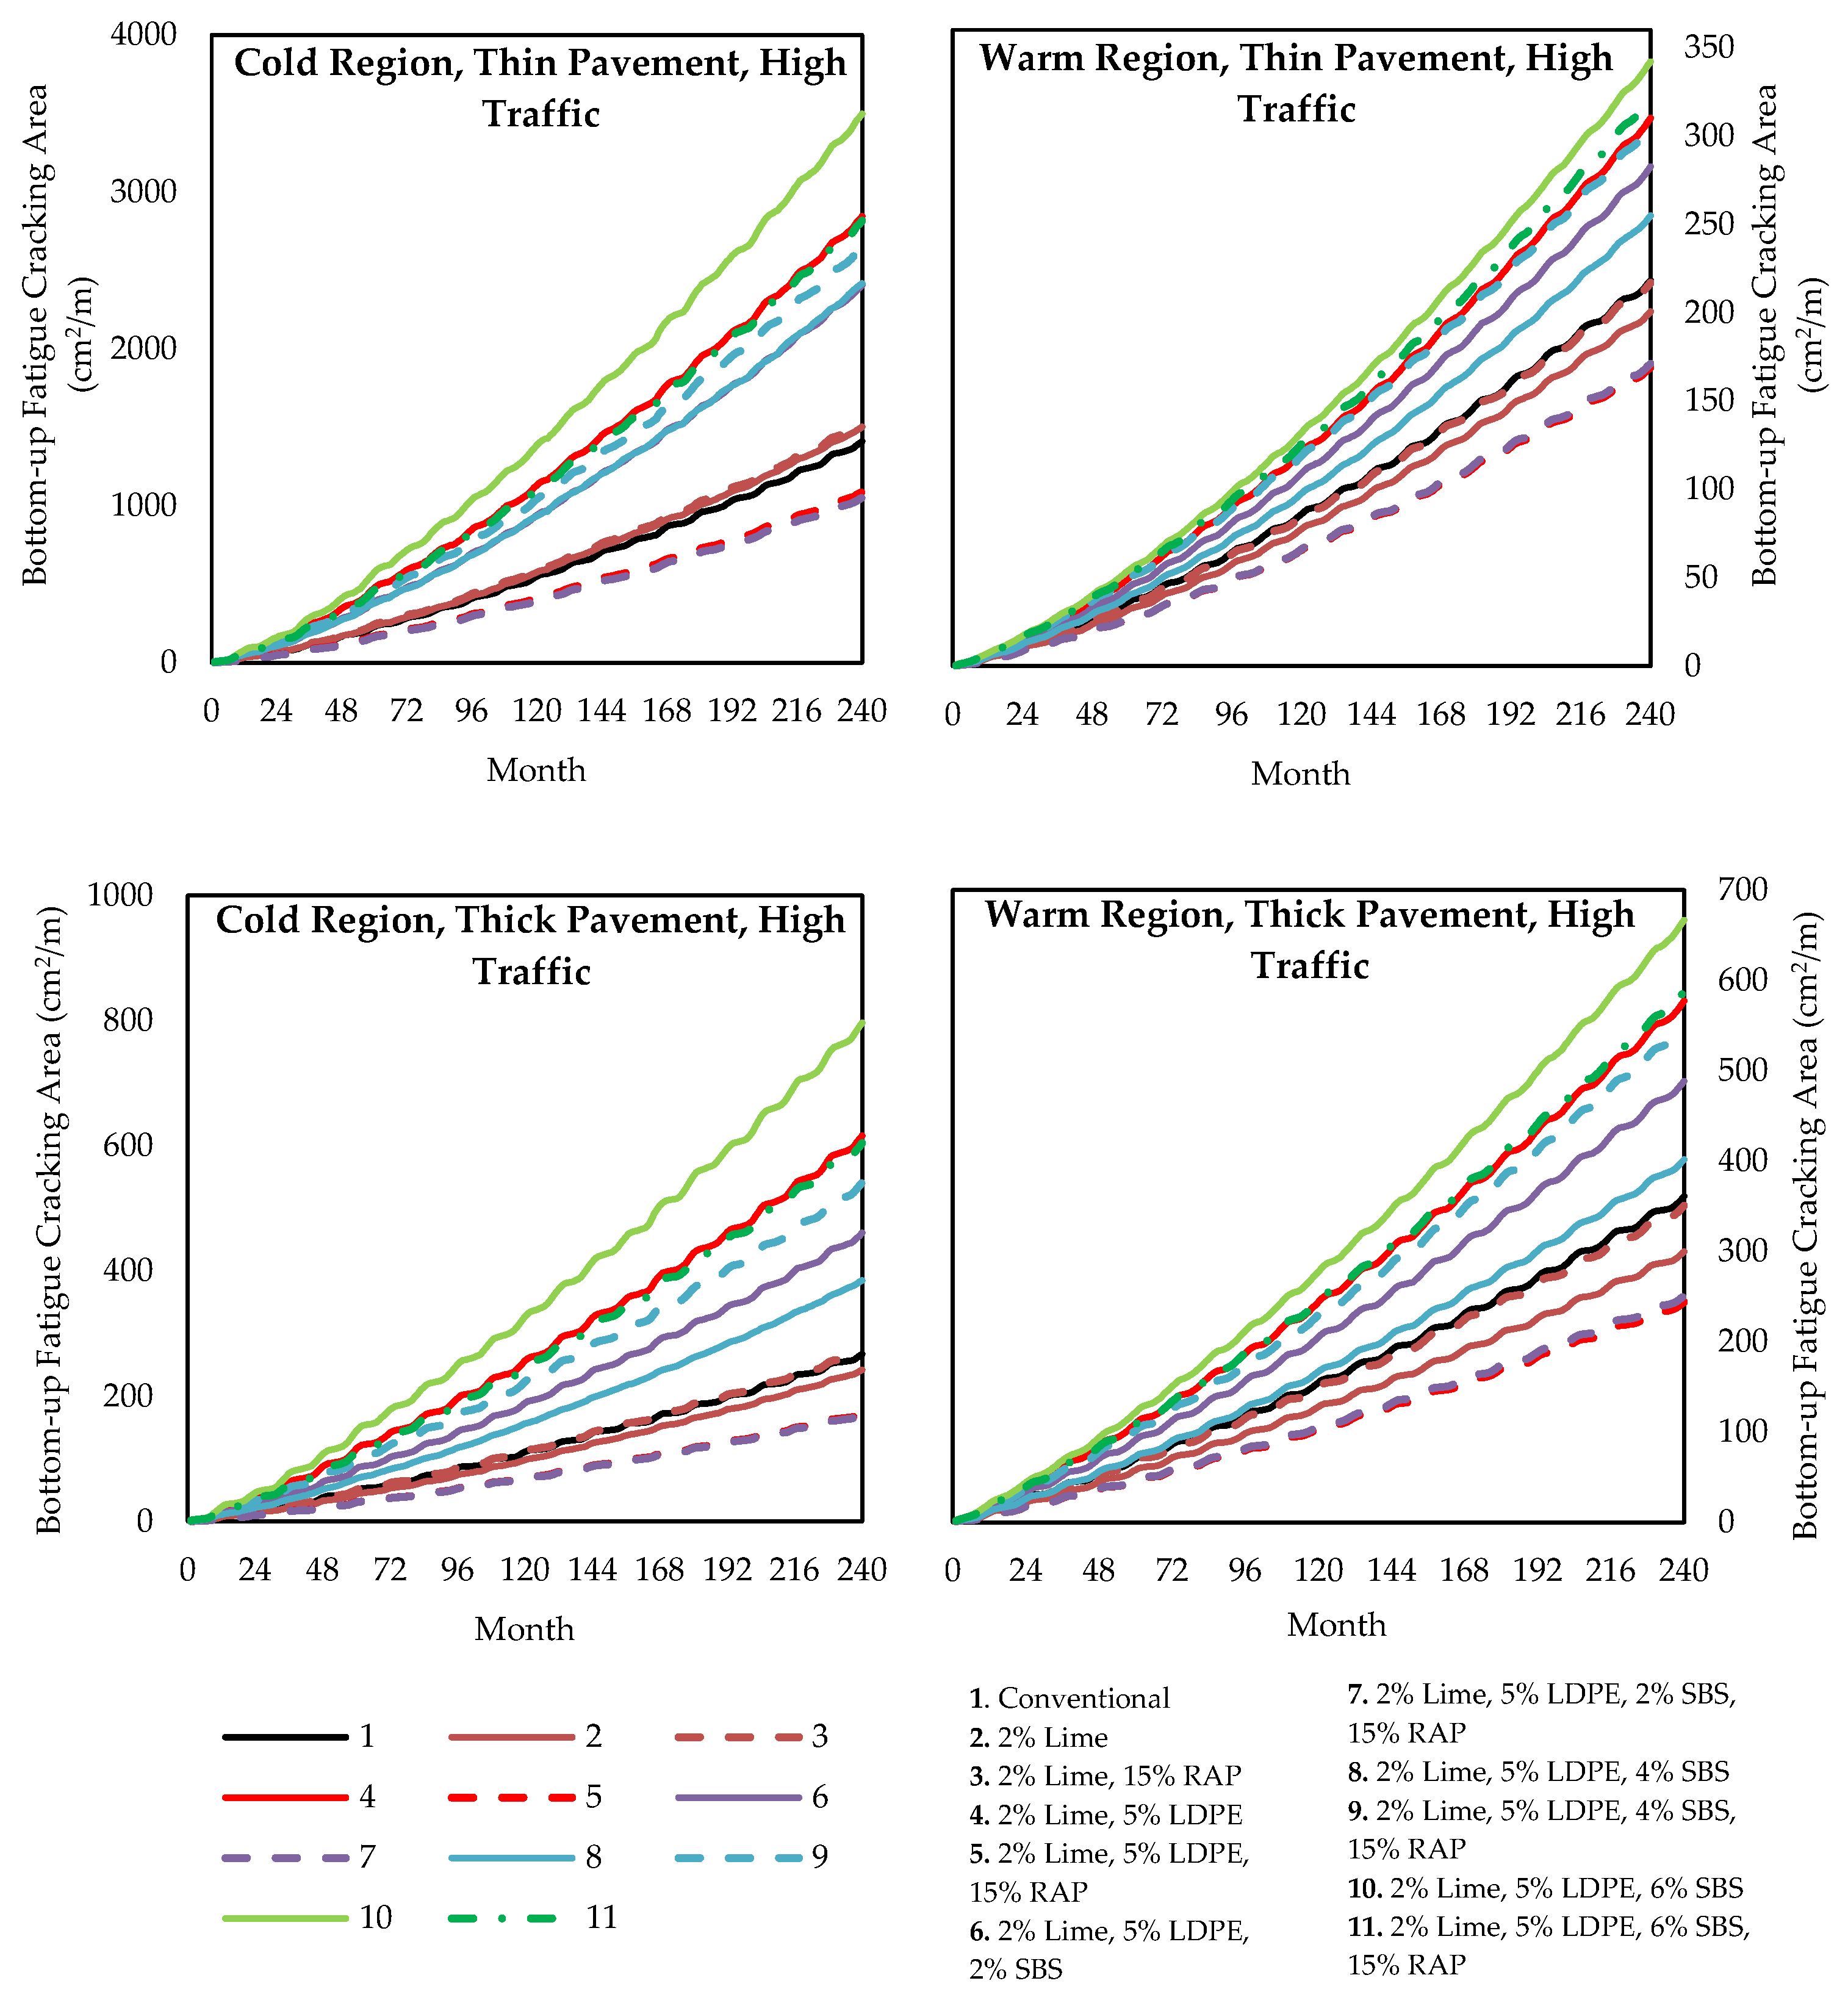
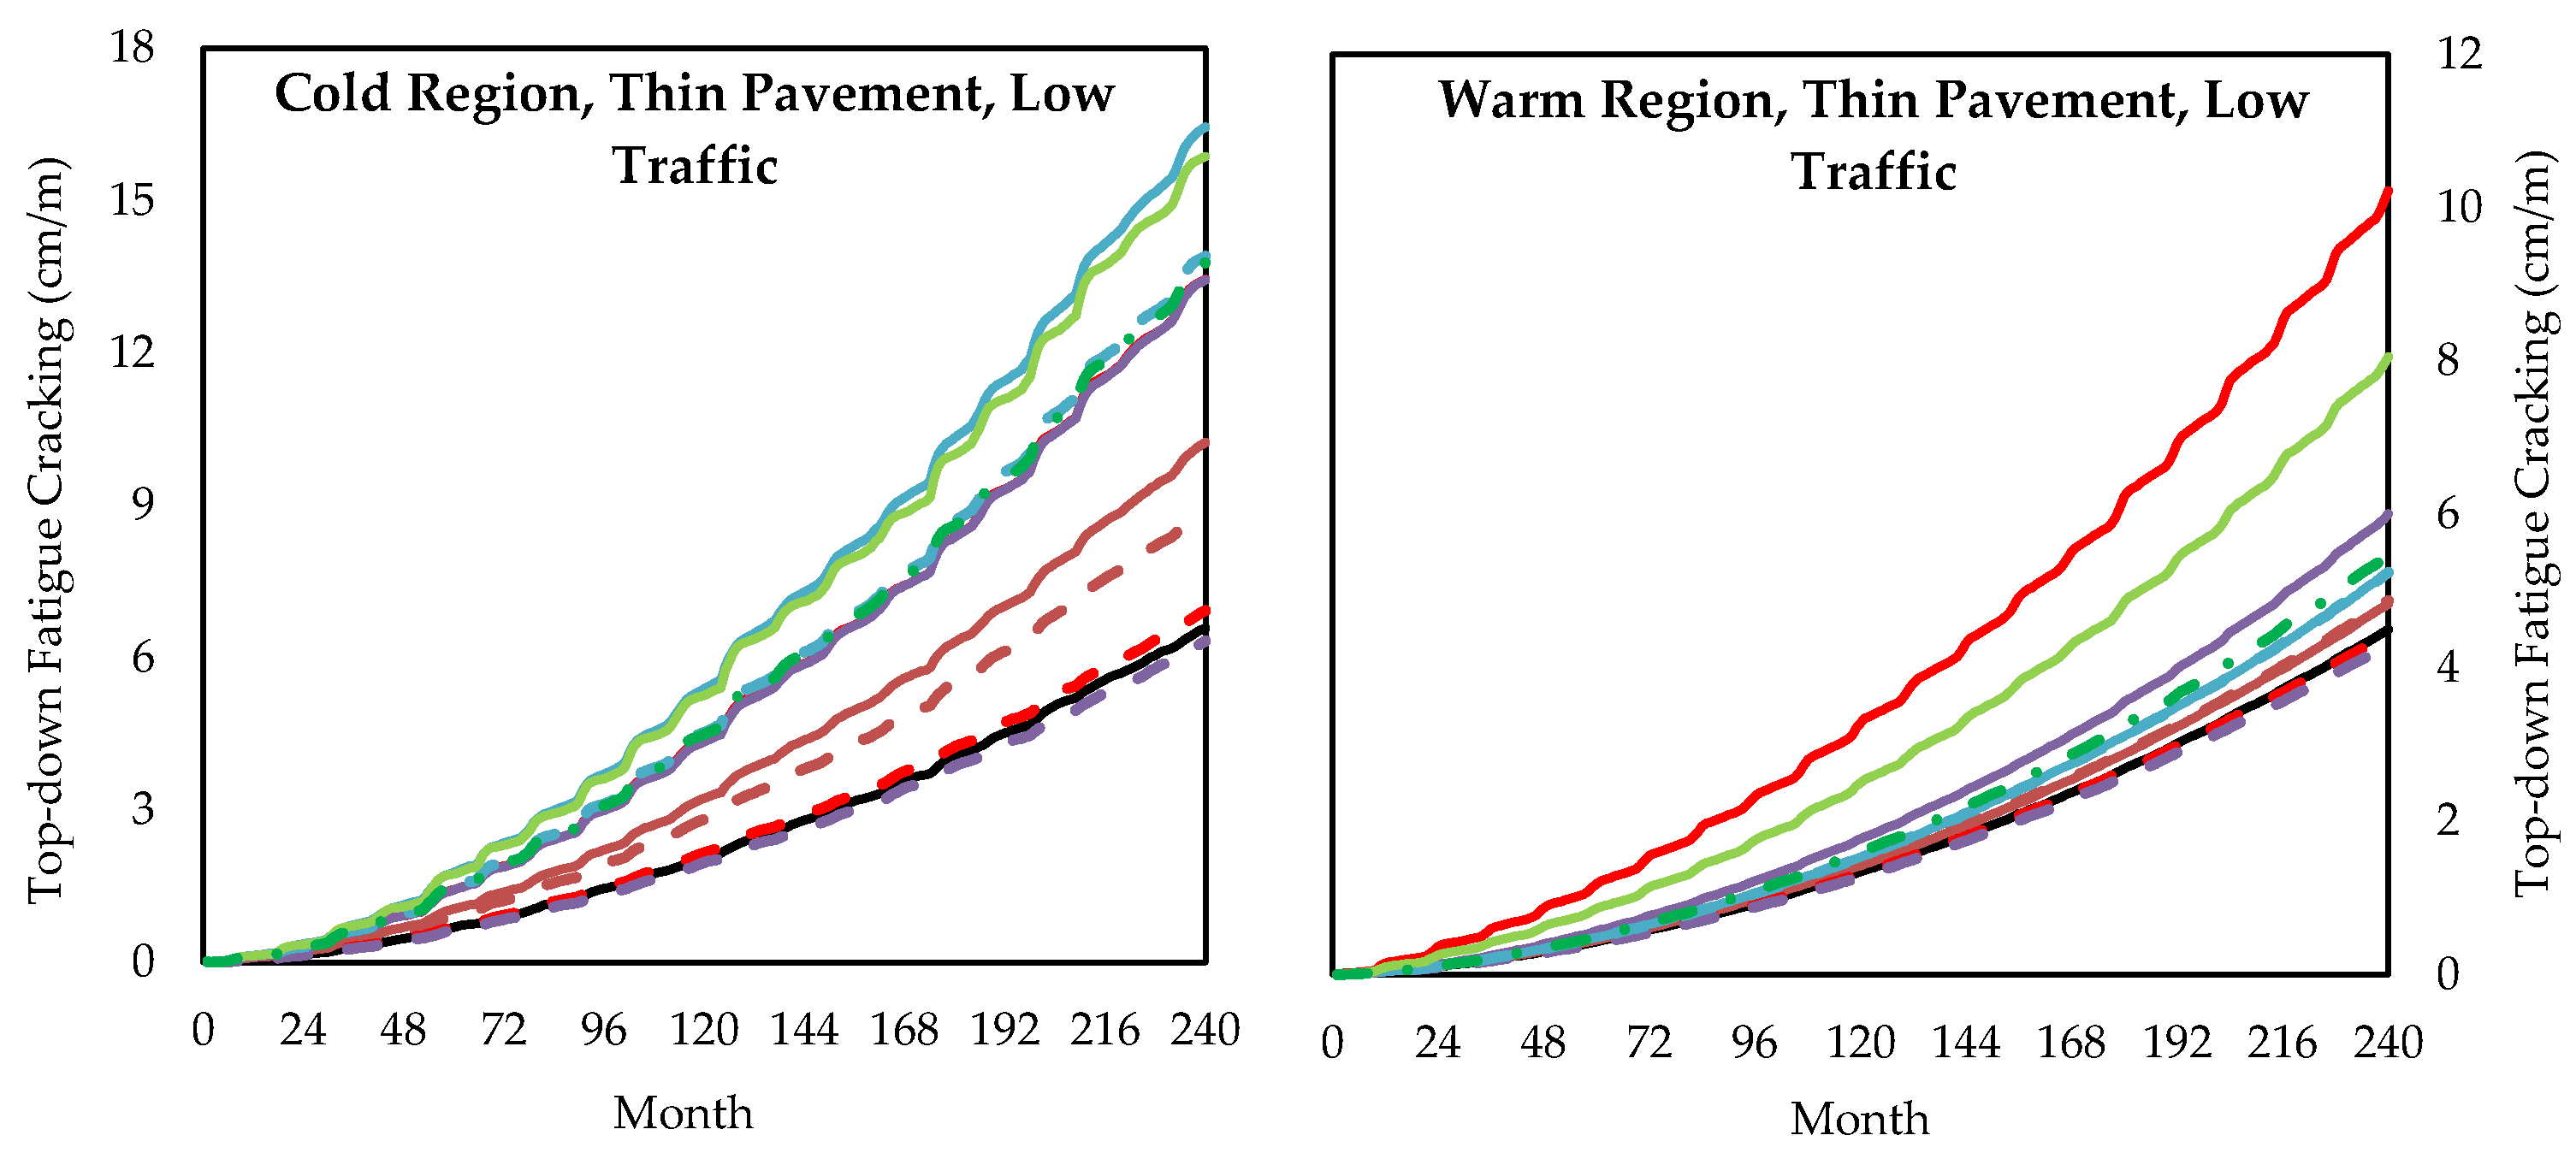
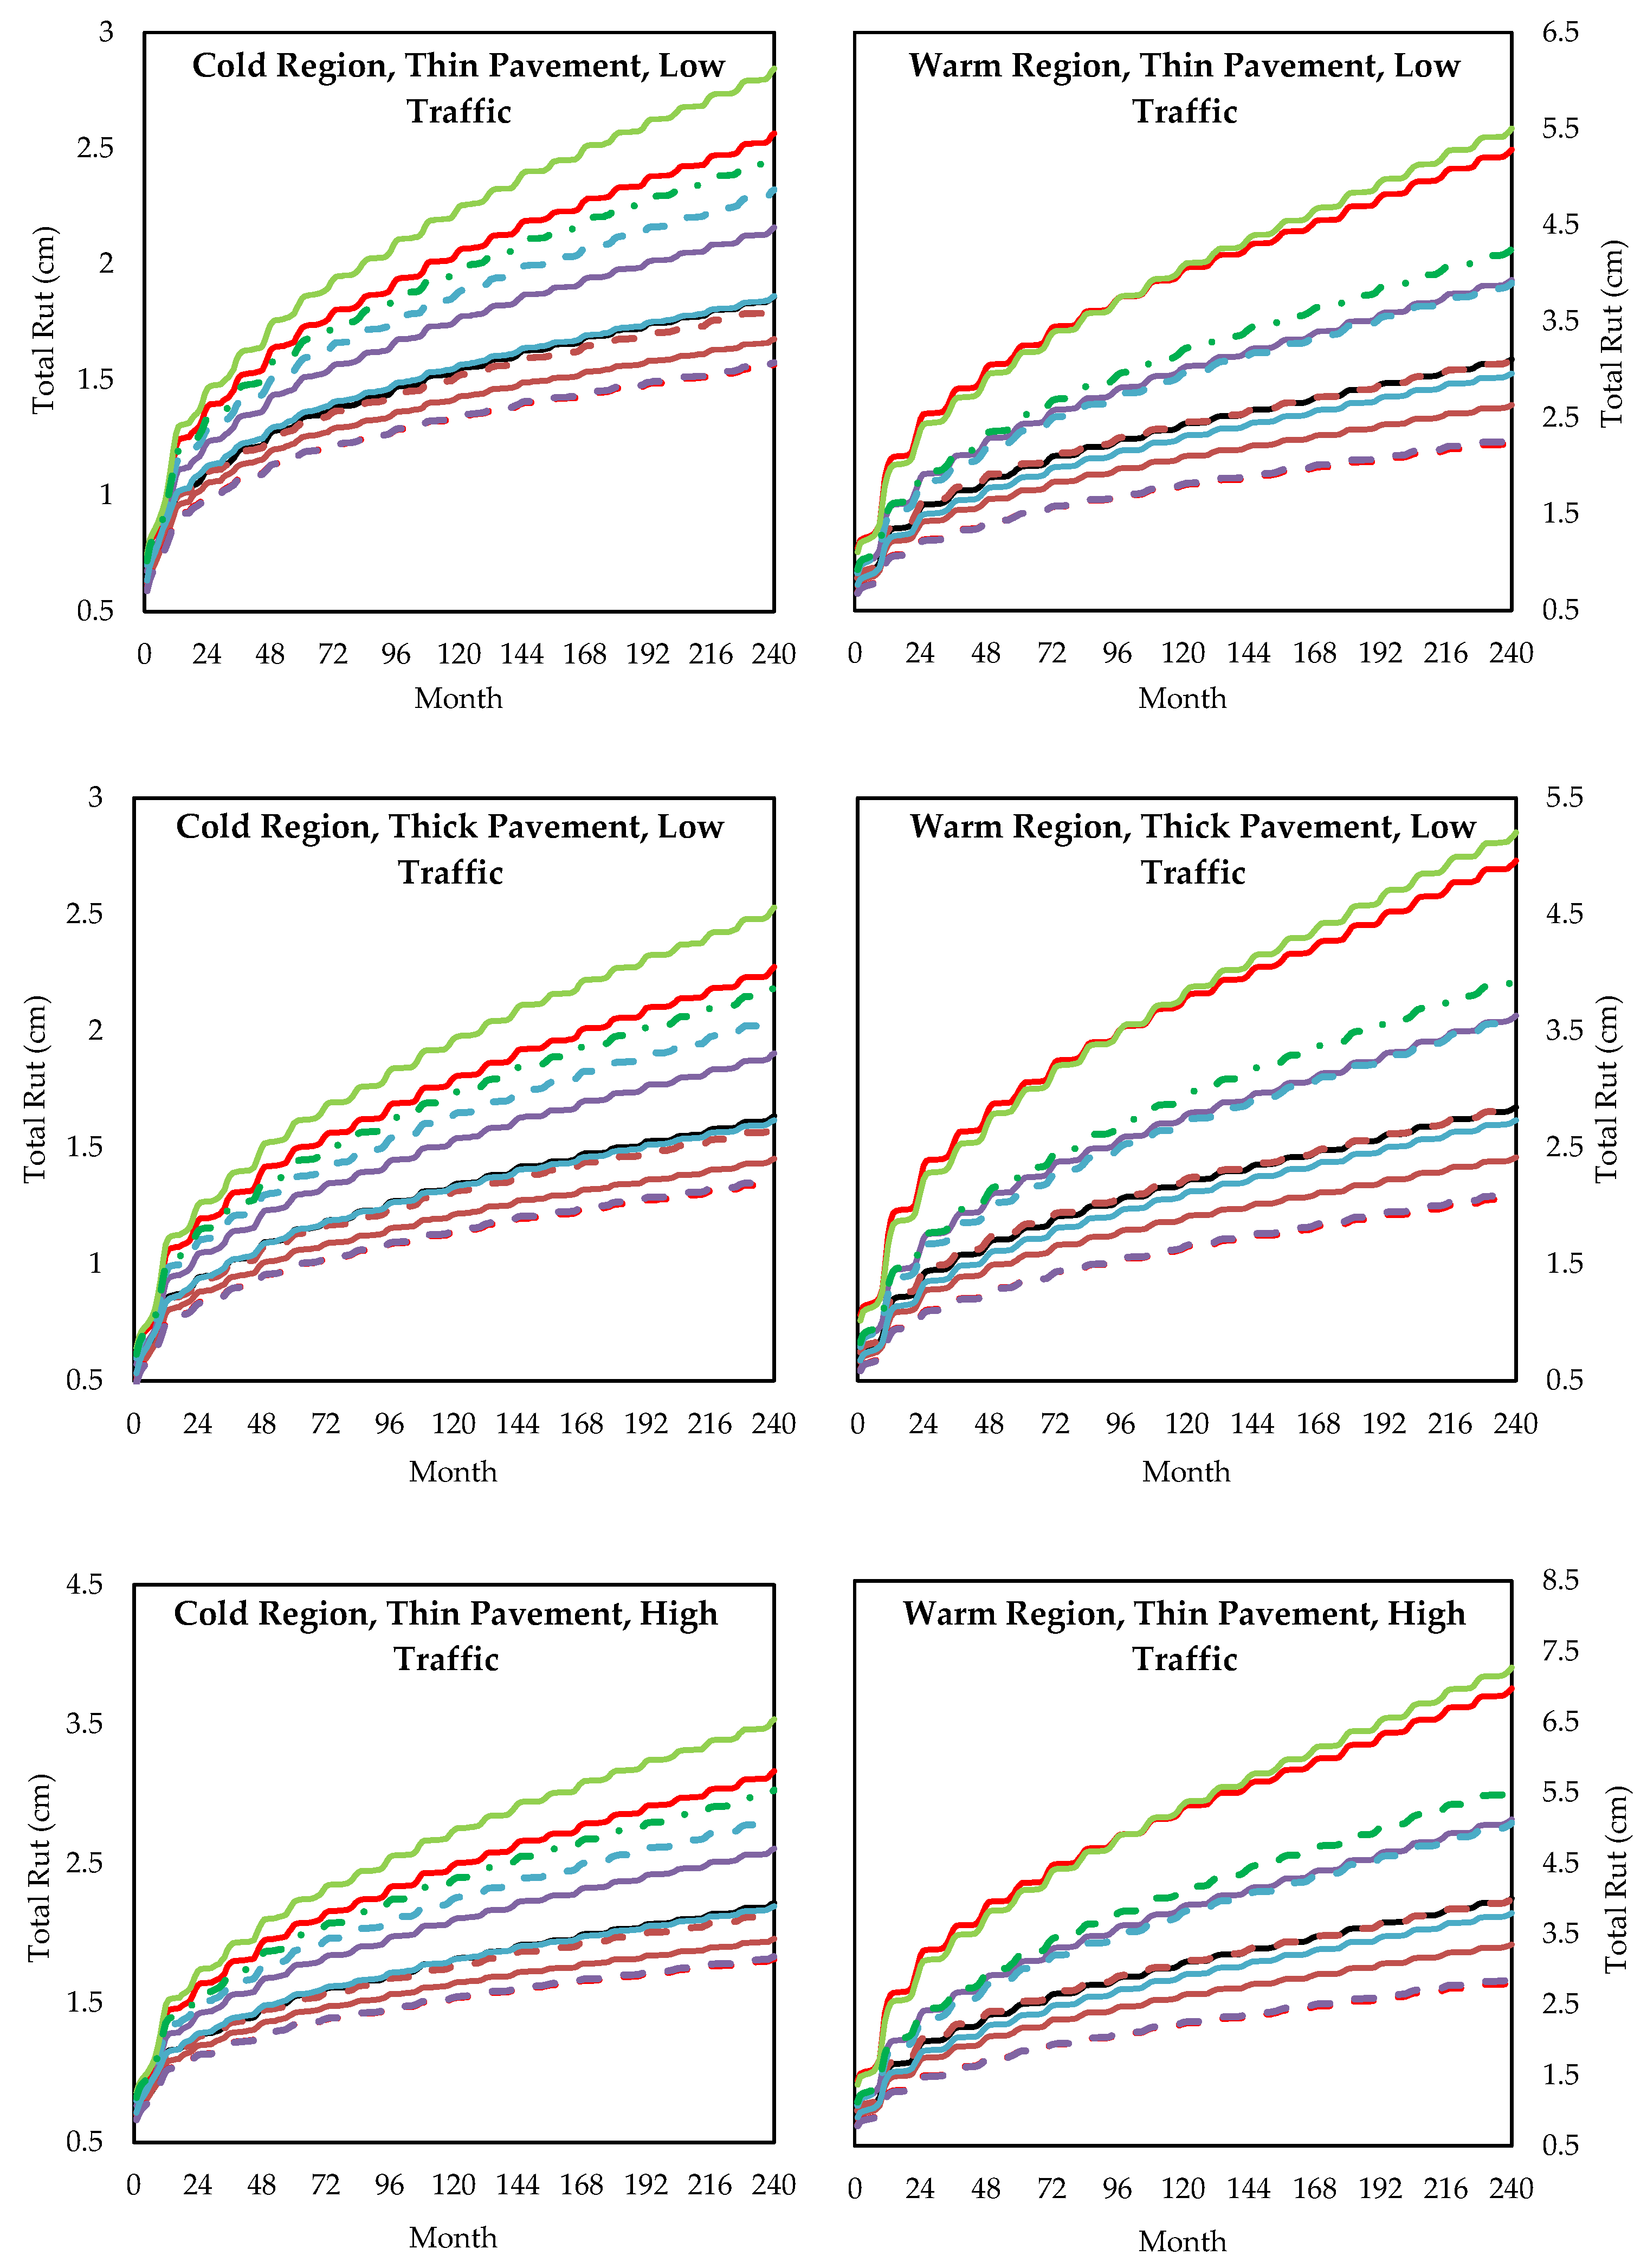
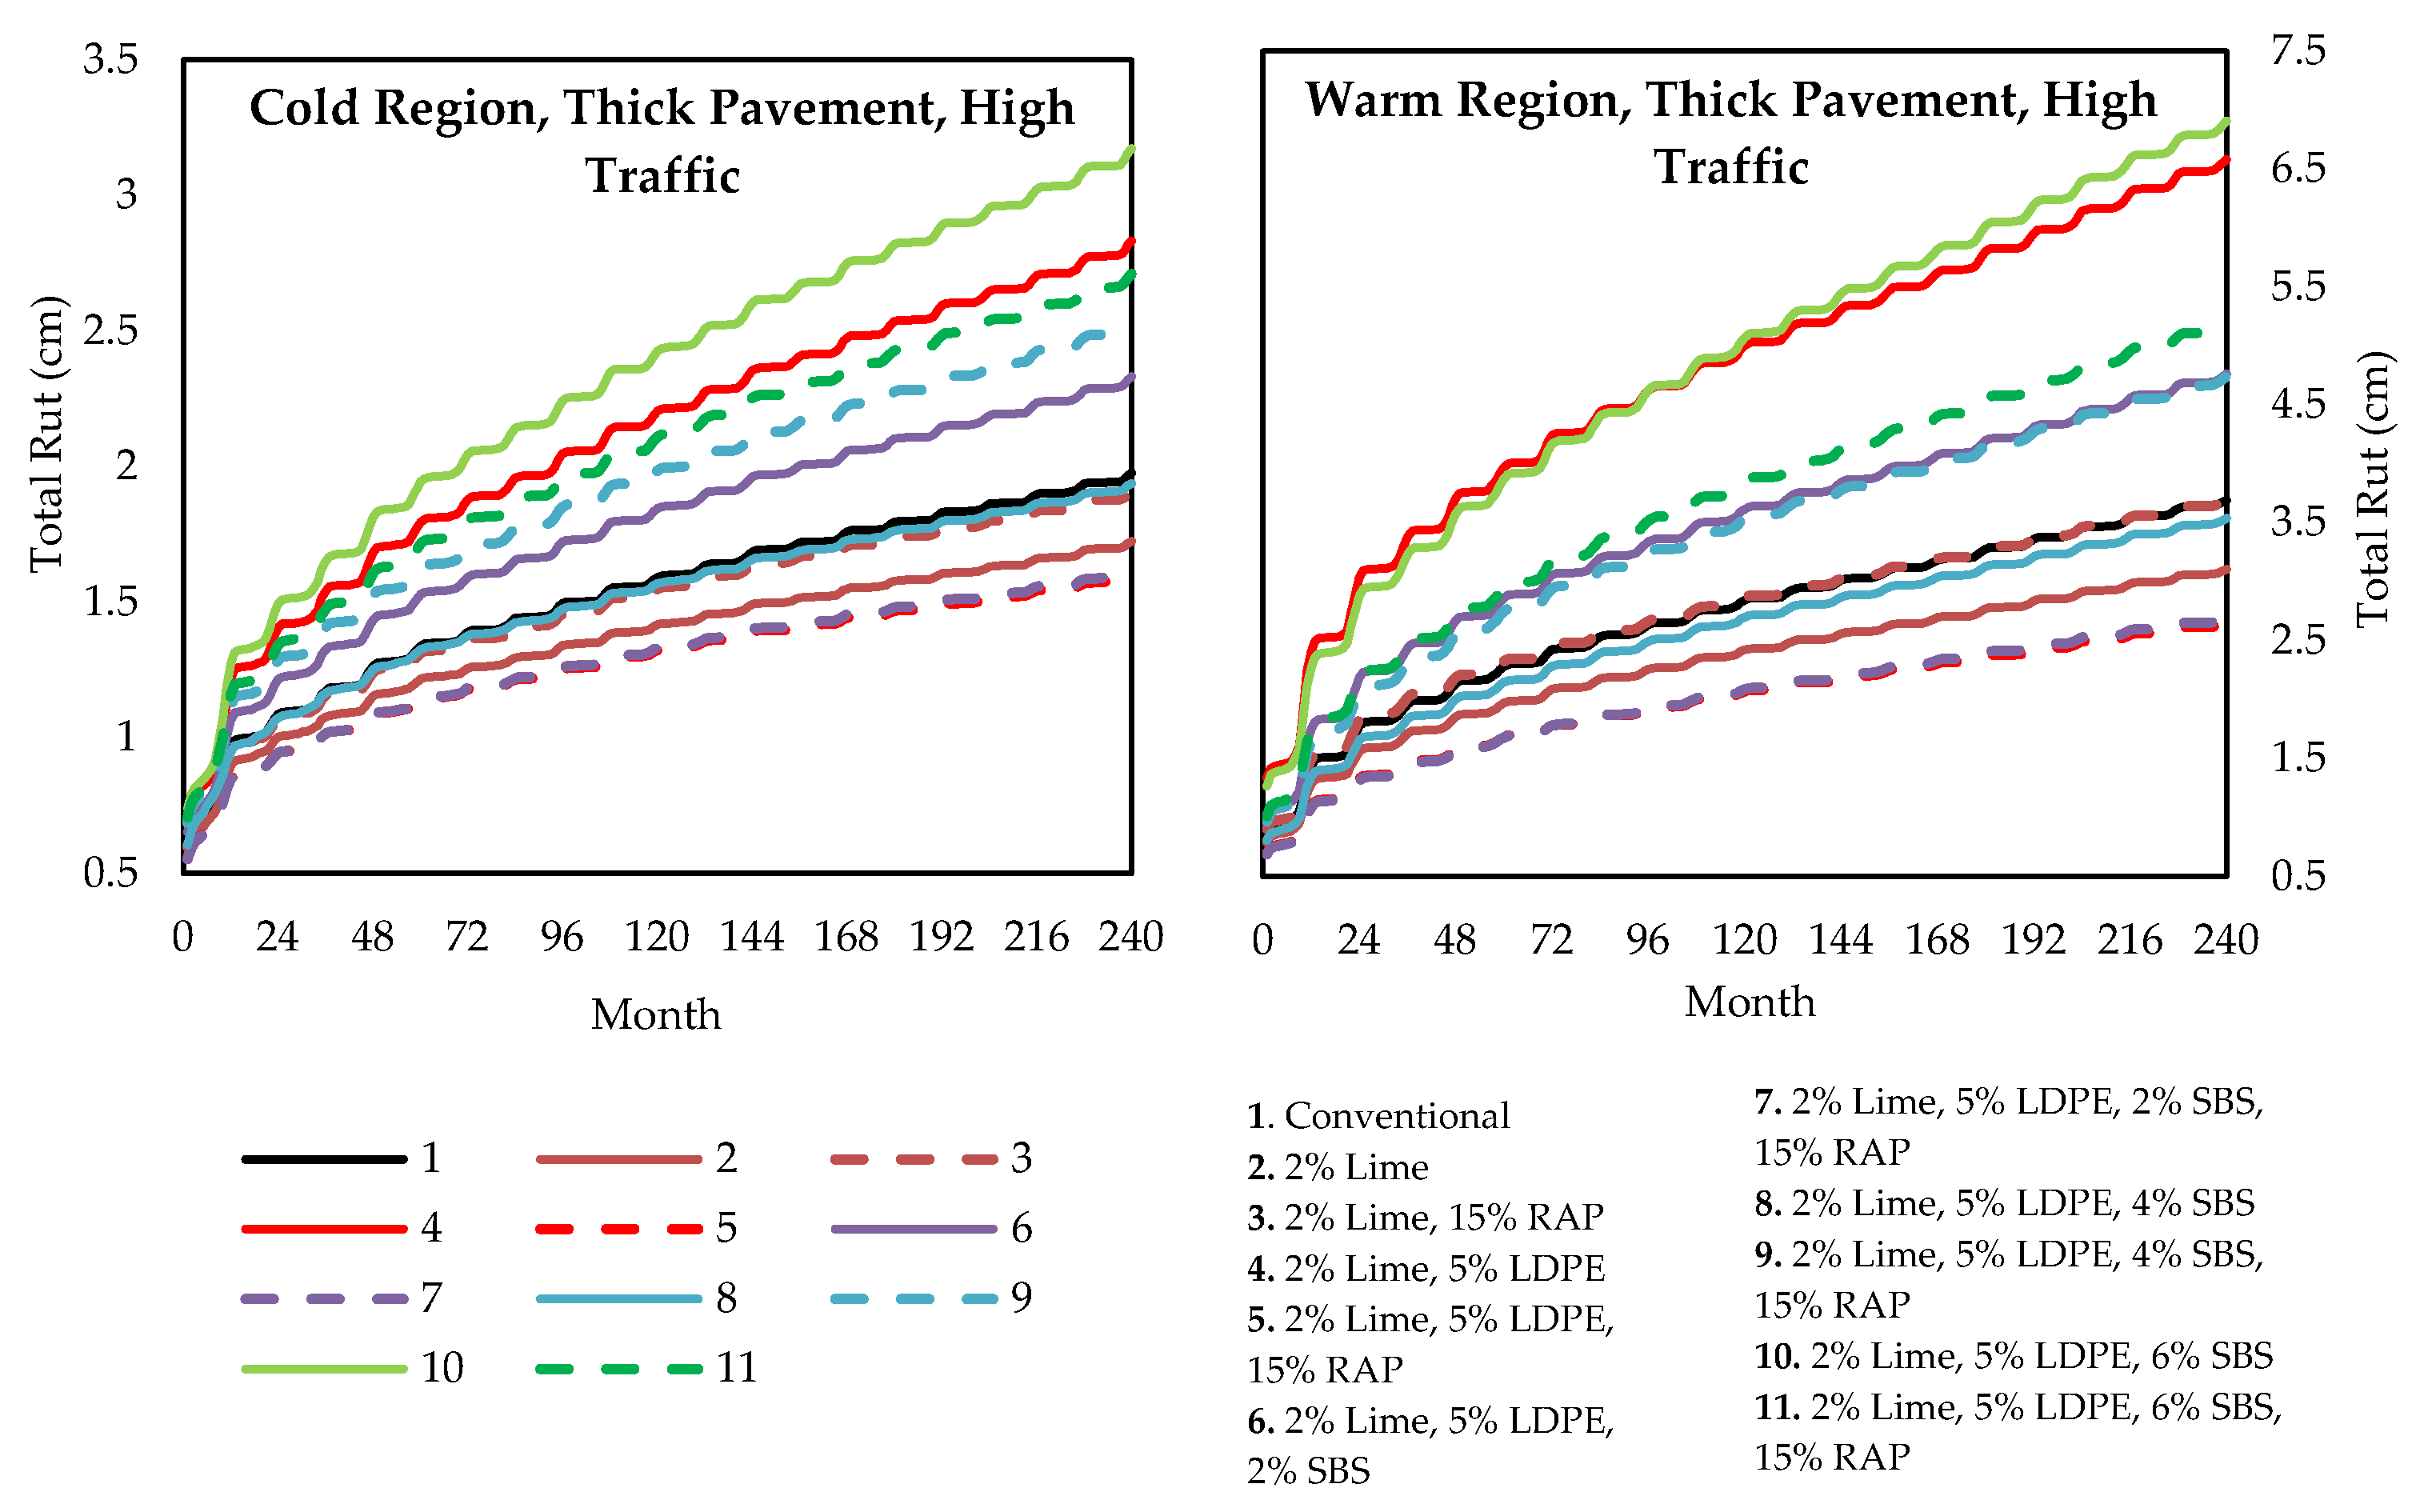
Figure 7, Figure 8, Figure 9, Figure 10 and Figure 11 present the distress outputs after the design life period for various HMA modifier combinations under different climatic, structural, and traffic conditions. In the case of a cold region with thin pavement and low traffic, the mixture containing 2% SBS, alongside 2% hydrated lime, 5% LDPE, and 15% RAP, demonstrated the best performance across most distress indicators, although the 0% SBS mix showed slightly better results for IRI. The optimum mixture outperformed the conventional HMA with a reduction in IRI by 0.084 mm/m (7.07%), a 7.07% decrease in bottom-up fatigue cracking, and a reduction of 5.35 mm/m in top-down fatigue cracking. Additionally, a 2.79 mm reduction was observed in both total rutting and AC rutting, with improvements of 0.99%, 15.07%, and 34.38%, respectively.
In warm region, thin pavements under low traffic, 0% SBS performed best overall, while 2% SBS gave slightly better results in top-down fatigue cracking. This performance shift was attributed to regional temperature effects, leading to reduced ductility and penetration at higher SBS content. The optimized mix reduced IRI by 0.229 mm/m, bottom-up fatigue cracking by 6.14%, and top-down fatigue cracking by 5.015 mm/m. Total rut and AC rut were reduced by 8.64 mm, corresponding to improvements of 9.04%, 43.45%, 0.30%, 27.87%, and 36.67%, respectively.
For cold region, thick pavements with low traffic, the 0% SBS mixture yielded the best performance in most parameters, with 2% SBS performing slightly better in bottom-up fatigue cracking. The shift in optimum from higher to lower polymer content was due to the increased AC thickness and a decrease in ductility and penetration. Compared to the conventional sample, the optimized mix showed an IRI reduction of 0.075 mm/m, a 0.13% decrease in bottom-up fatigue cracking, and a 74.673 mm/m reduction in top-down fatigue cracking. Total rut and AC rut were each reduced by 2.79 mm, resulting in improvements of 3.18%, 6.70%, 20.88%, 17.19%, and 32.26%.
In warm region, thick pavements with low traffic, the 0% SBS content again performed best across all distress parameters, with 2% SBS showing similar performance. The improved outcomes at lower SBS content were again linked to better adaptability at high temperatures. The optimized sample exhibited an IRI reduction of 0.201 mm/m, a 0.15% and 15.336 mm/m decrease in bottom-up and top-down fatigue cracking, respectively, and a 7.62 mm reduction in both total and AC rutting. The corresponding improvements were 8.18%, 7.85%, 3.36%, 26.79%, and 32.94%.
Under cold region, thin pavement with high traffic, 2% SBS performed best in most factors, although 0% SBS yielded slightly better results in IRI and AC rutting. The optimum mix, compared to the conventional one, showed an IRI reduction of 0.11 mm/m, a 1.23% and 8.12 mm/m reduction in bottom-up and top-down fatigue cracking, and a 3.81 mm decrease in both rutting indicators, with percent changes of 4.21%, 5.61%, 1.15%, 17.24%, and 32.56%.
In warm region, thin pavements under high traffic conditions, the 0% SBS mixture again performed best, with 2% SBS slightly better in top-down fatigue cracking. The optimized mixture led to a 0.309 mm/m IRI reduction, a 1.07% and 7.125 mm/m reduction in bottom-up and top-down fatigue cracking, and an 11.94 mm reduction in rut depths, with improvements of 11.05%, 4.94%, 0.31%, 29.75%, and 36.59%.
For cold region, thick pavements under high traffic, 0% SBS performed best across most indicators, with 2% SBS giving comparable values. The optimal mix exhibited an IRI reduction of 0.102 mm/m, a 0.29% and 82.872 mm/m decrease in bottom-up and top-down fatigue cracking, and a 3.81 mm reduction in rutting depths, with percent improvements of 4.14%, 13.12%, 17.76%, 19.23%, and 30.95%.
Finally, for warm region, thick pavements under high traffic, the 0% SBS content again yielded the best outcomes in all categories, with 2% SBS performing similarly. The optimized mixture showed a reduction in IRI by 0.273 mm/m, bottom-up fatigue cracking by 0.5%, and top-down cracking by 19.915 mm/m. Total rutting and AC rutting were reduced by 10.414 mm, with respective improvements of 10.18%, 19.01%, 3.41%, 28.28%, and 33.33%.
With the incorporation of 15% RAP, the overall performance improved significantly, showing an average reduction of 0.344 mm/m in IRI, 4.11% and 111.03 mm/m in bottom-up and top-down fatigue cracking, and 12.7 mm and 11.94 mm in total and AC rutting, with respective gains of 12.30%, 33.17%, 18.32%, 35.86%, and 49.24%. The addition of 2% hydrated lime also improved performance, with average reductions of 0.097 mm/m in IRI and 0.19% in bottom-up fatigue cracking, while top-down fatigue cracking increased by 15.802 mm/m. Total rut and AC rut were reduced by 3.81 mm and 3.55 mm, showing improvements of 3.75%, 3.58%, −1.90%, 13.39%, and 21.28%, respectively.
In all scenarios, the terminal IRI and bottom-up fatigue cracking values generally remained within the acceptable limits set by the Virginia DOT [23]. However, values for top-down fatigue cracking and rutting often exceeded the limits, except in cases using lower polymer contents, which showed improved compliance.

3.4.3. Comparison of Performance Due to Change in Scenario

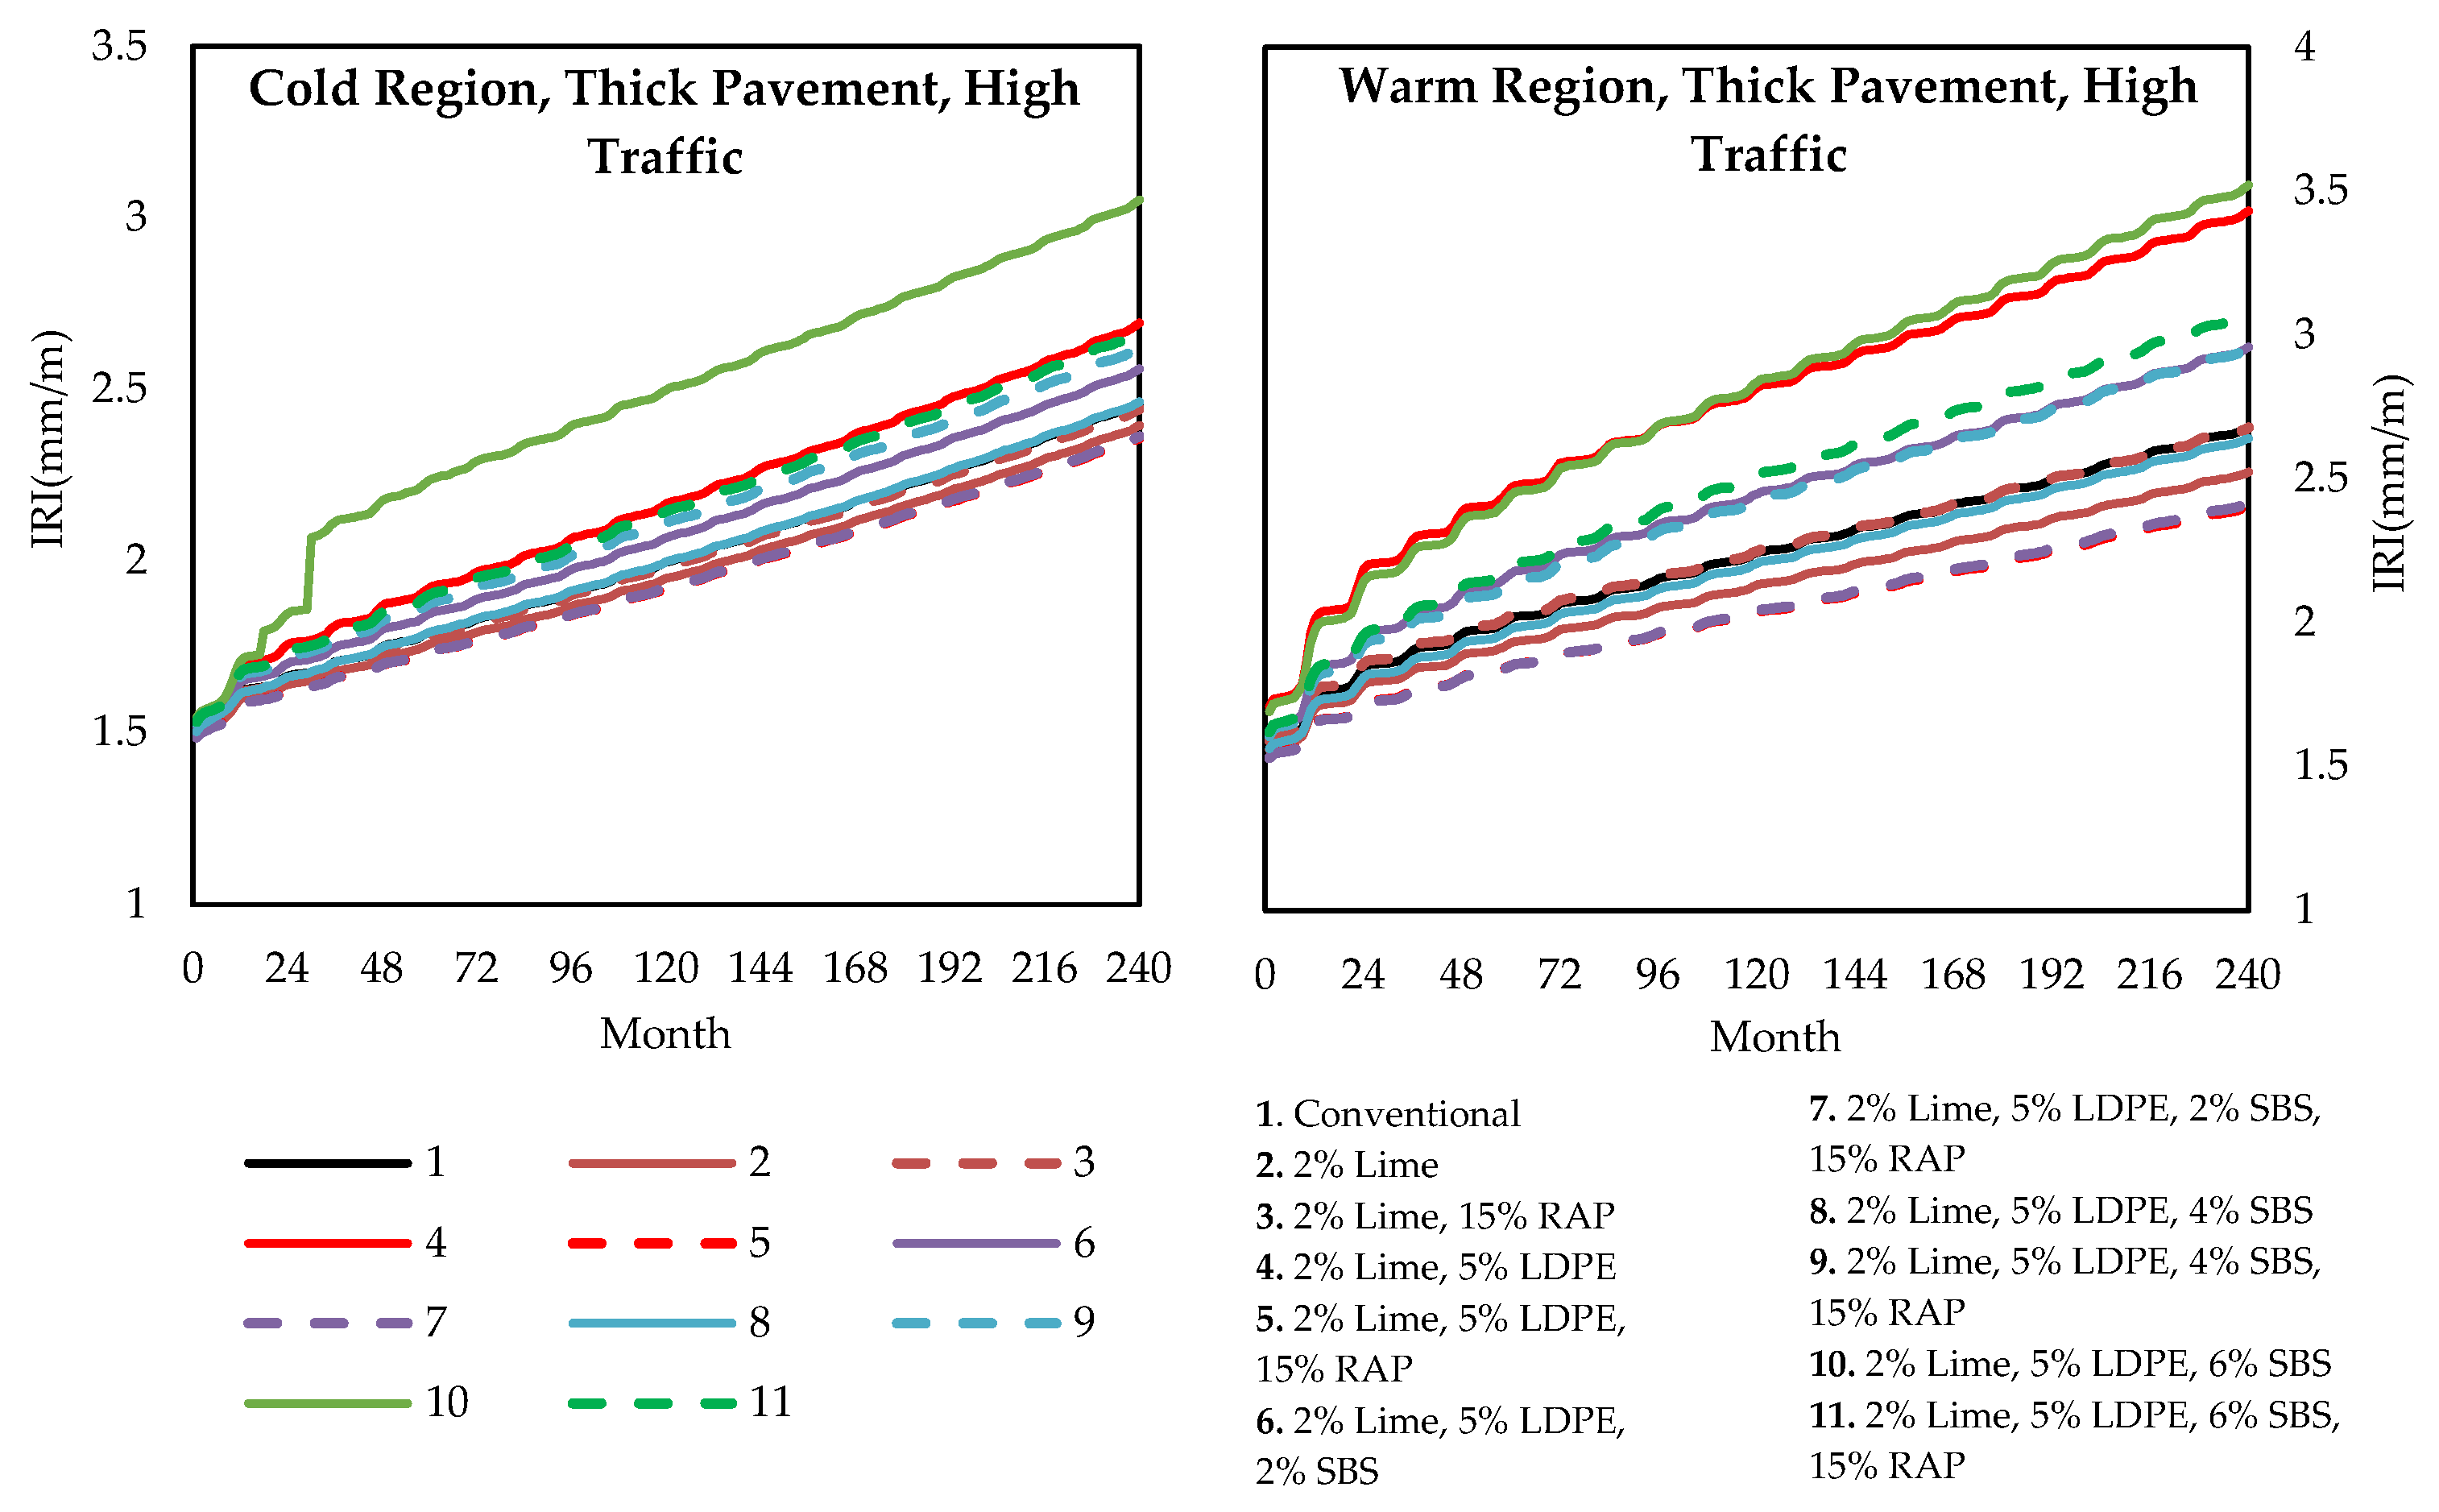
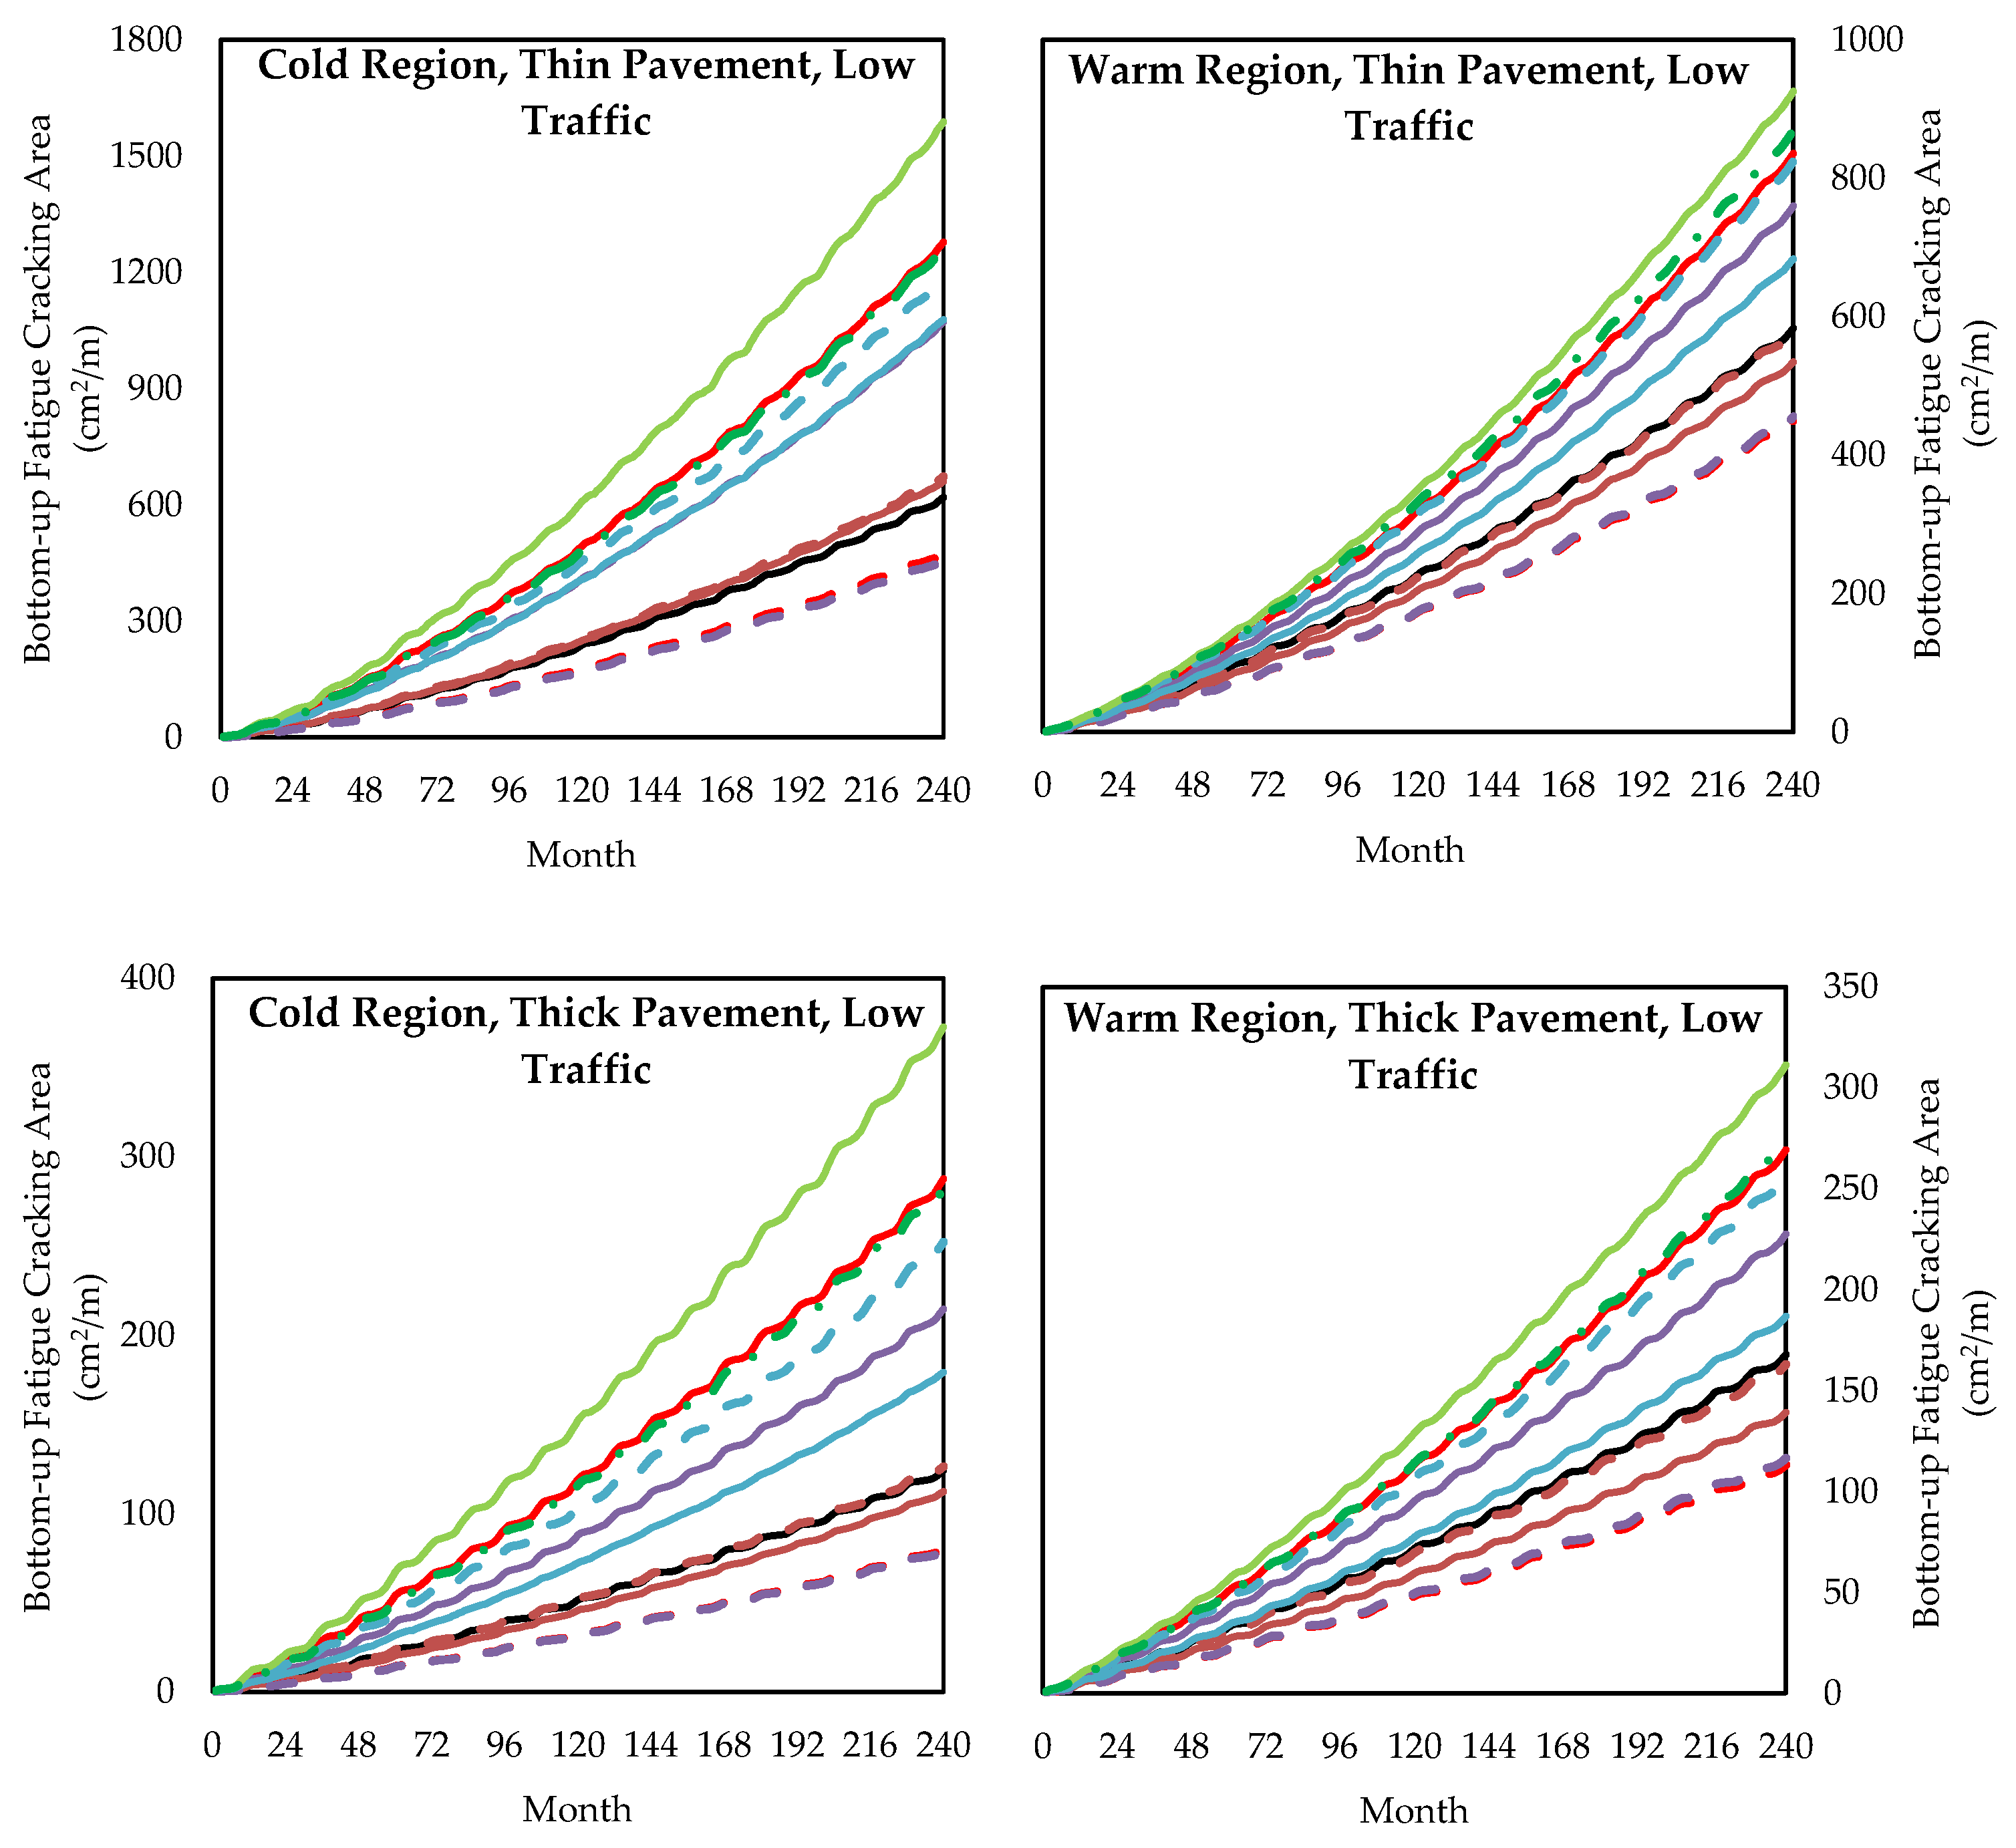
A comparison of pavement thickness, traffic levels, and climatic conditions was conducted using MEPDG AASHTOWare version 2.6 predictions over a 20-year design life, as shown in Figure 12, Figure 13, Figure 14 and Figure 15. The key pavement performance indicators analyzed were: International Roughness Index (IRI), bottom-up fatigue cracking, top-down fatigue cracking, total rutting, and rutting in the asphalt concrete (AC) layer.
When comparing thin and thick pavements, thick pavements demonstrated better performance overall. The IRI decreased by an average of 3.33%, bottom-up fatigue cracking was reduced by 83.88%, top-down fatigue cracking decreased by 28.41%, and total rutting was reduced by 9.97%. However, rutting within the AC layer showed negligible change regardless of traffic level.
Under increased traffic conditions, the predicted pavement distresses worsened. The IRI increased by an average of 5.41%, bottom-up fatigue cracking rose by 83.95%, top-down fatigue cracking increased by 30.54%, total rutting increased by 21.43%, and rutting in the AC layer increased significantly by 37.15%.
Climatic effects also influenced pavement performance. Comparing cold versus warm regions, the IRI decreased slightly by an average of 1.61%, bottom-up fatigue cracking reduced by 2.29%, and top-down fatigue cracking decreased by 18.47%. In contrast, total rutting increased by 32.90%, and rutting in the AC layer rose markedly by 70.57%, indicating greater susceptibility to deformation under elevated temperatures.
Further comparison of individual pavement configurations reveals additional insights. According to Table 8, thin pavements under low traffic exhibited an increase in IRI (excluding the optimum mixture), a reduction in fatigue cracking, and an increase in rutting when transitioning from colder to warmer climates. Table 9 indicates that thick pavements under low traffic conditions showed an increase in IRI (again excluding the optimum sample), along with increases in fatigue cracking and rutting when shifting from cold to warm regions. As shown in Table 10, thin pavements subjected to high traffic conditions demonstrated increased IRI, decreased fatigue cracking, and increased rutting in warmer climates. Similarly, Table 11 shows that thick pavements under high traffic experienced increases in IRI, fatigue cracking, and rutting when moving from colder to warmer regions.
The results suggest that pavement configuration and modifier selection should be tailored to environmental and traffic conditions. For warmer climates and thick pavements, the optimal performance was achieved with a mixture containing 2% hydrated lime, 5% LDPE, and 15% RAP. In contrast, for cold climates and thin pavements under both low and high traffic, the most effective mixture was composed of 2% hydrated lime, 5% LDPE, 2% SBS, and 15% RAP. Only slight variations in performance were observed among these modifications, highlighting the robustness of the selected combinations across different stress environments.

4. Conclusions

The research findings conclude that the modification with 5% LDPE and 2% SBS content by weight of bitumen has outperformed other tested modification percentages with an addition of 2% Hydrated Lime as a filler replacement in the aggregate and 15% RAP replacement in the total HMA mix. The addition of these modifiers has led to an enhancement in the dynamic modulus at different temperature ranges and frequencies and a reduction in the distress value.
The specimens with 5% LDPE, 2% SBS content by weight of bitumen, and 2% Hydrated Lime as filler replacement, along with the inclusion of 15% RAP in HMA, demonstrated the best results in performance tests, as outlined below:
  • Dynamic Modulus peaked response over a wide range of testing temperatures and loading frequencies as depicted through a master curve. The dynamic modulus increased by 254.675 MPa compared to conventional samples, representing a 269% increase at the lowest frequency of 0.1 Hz and 54.4 °C, indicating better performance at high strain levels and repeated loading conditions, signifying better fatigue resistance.
  • At the highest frequency and temperature of 25 Hz and 54.4 °C, the values were also increased by 1145.55 MPa with a 145% increase indicating better performance in resistance to rutting and permanent deformation, thus suggesting suitability for heavy traffic conditions.
  • Enhancement in moisture resistance was also observed as depicted by minimal variation in master curve, indicating lesser temperature susceptibility, respectively,
  • The softening point was also increased by approximately 8 °C compared to ARL 60/70 bitumen binder.
The output of the MEPDG application provided distress condition analysis after the pavement’s life period at different scenarios by varying pavement thickness, regional temperature, traffic magnitude. This analysis showed a decrease in IRI, bottom-up and top-down fatigue cracking and rutting for optimum sample as compared to conventional samples. In hotter regions and thicker pavements, the pavement optimum distress condition shifted from higher polymer to lower polymer content.
It was observed that, compared to the conventional sample, addition of 15% RAP and 2% Hydrated lime improved results accordingly due to a decrease in International Roughness Index (IRI), bottom-up and top-down fatigue cracking and rut, while causing an increase in top-down fatigue cracking for lime modification after the design life period of the pavement. However, higher percentages of LDPE-SBS were not as effective as the combination of 5% LDPE and 2% SBS as they led to agglomeration, which, in turn, increased the air voids in the asphalt mixture. Therefore, the study recommends utilizing 5% LDPE and 2% SBS, with the addition of 2% Hydrated Lime as a filler replacement in the aggregate and 15% RAP replacement in the total HMA mix in a wider range of climate and traffic conditions.

Author Contributions

Conceptualization: M.H. and S.A.; Methodology: M.H. and S.A.; Software: M.H. and A.N. (Asad Naseem); Validation: A.N. (Asad Naseem) and M.K.; Resources: A.N. (Ahsan Naseem) and S.A.; Writing—original draft preparation: M.H. and A.N. (Asad Naseem); Writing—review and editing: All authors; Supervision: A.N. (Ahsan Naseem); Project administration: S.A. and A.N. (Ahsan Naseem); Funding acquisition: A.N. (Ahsan Naseem). All authors have read and agreed to the published version of the manuscript.

Funding

The APC was funded by Ahsan Naseem.

Data Availability Statement

The data supporting the findings of this study are presented within the paper. Additional data and materials may be available from the corresponding authors upon reasonable request.

Acknowledgments

The authors are thankful to the National University of Sciences and Technology (NUST), Islamabad, Pakistan for providing the research facilities. During the preparation of this manuscript, the authors utilized ChatGPT–5 to assist with improving the language and grammar. The authors have reviewed and edited the output and take full responsibility for the content of this publication.

Conflicts of Interest

Author Ahsan Naseem was employed by the company Jan De Nul n.v. The remaining authors declare that the research was conducted in the absence of any commercial or financial relationships that could be construed as a potential conflict of interest.

References

  1. Behera, M.; Bhattacharyya, S.K.; Minocha, A.K.; Deoliya, R.; Maiti, S. Recycled Aggregate from C&D Waste & Its Use in Concrete—A Breakthrough towards Sustainability in Construction Sector: A Review. Constr. Build. Mater. 2014, 68, 501–516. [Google Scholar] [CrossRef]
  2. Xing, C.; Li, M.; Liu, L.; Lu, R.; Liu, N.; Wu, W.; Yuan, D. A Comprehensive Review on the Blending Condition between Virgin and RAP Asphalt Binders in Hot Recycled Asphalt Mixtures: Mechanisms, Evaluation Methods, and Influencing Factors. J. Clean. Prod. 2023, 398, 136515. [Google Scholar] [CrossRef]
  3. Li, M.; Xing, C.; Liu, L.; Huang, W.; Meng, Y. Gel Permeation Chromatography-Based Method for Assessing the Properties of Binders in Reclaimed Asphalt Pavement Mixtures. Constr. Build. Mater. 2022, 316, 126005. [Google Scholar] [CrossRef]
  4. Ma, Y.; Polaczyk, P.; Hu, W.; Zhang, M.; Huang, B. Quantifying the Effective Mobilized RAP Content during Hot In-Place Recycling Techniques. J. Clean. Prod. 2021, 314, 127953. [Google Scholar] [CrossRef]
  5. Ma, Y.; Polaczyk, P.; Park, H.; Jiang, X.; Hu, W.; Huang, B. Performance Evaluation of Temperature Effect on Hot In-Place Recycling Asphalt Mixtures. J. Clean. Prod. 2020, 277, 124093. [Google Scholar] [CrossRef]
  6. Zhong, Y.; Wu, P. Economic Sustainability, Environmental Sustainability and Constructability Indicators Related to Concrete- and Steel-Projects. J. Clean. Prod. 2015, 108, 748–756. [Google Scholar] [CrossRef]
  7. Akhtar, A.; Sarmah, A.K. Construction and Demolition Waste Generation and Properties of Recycled Aggregate Concrete: A Global Perspective. J. Clean. Prod. 2018, 186, 262–281. [Google Scholar] [CrossRef]
  8. Rahman, M.A.; Imteaz, M.; Arulrajah, A.; Disfani, M.M. Suitability of Recycled Construction and Demolition Aggregates as Alternative Pipe Backfilling Materials. J. Clean. Prod. 2014, 66, 75–84. [Google Scholar] [CrossRef]
  9. Wang, J.; Fang, Z.; Cai, Y.; Chai, J.; Wang, P.; Geng, X. Preloading Using Fill Surcharge and Prefabricated Vertical Drains for an Airport. Geotext. Geomembr. 2018, 46, 575–585. [Google Scholar] [CrossRef]
  10. Kisku, N.; Joshi, H.; Ansari, M.; Panda, S.K.; Nayak, S.; Dutta, S.C. A Critical Review and Assessment for Usage of Recycled Aggregate as Sustainable Construction Material. Constr. Build. Mater. 2017, 131, 721–740. [Google Scholar] [CrossRef]
  11. Shi, X.; Mukhopadhyay, A.; Zollinger, D.; Grasley, Z. Economic Input-Output Life Cycle Assessment of Concrete Pavement Containing Recycled Concrete Aggregate. J. Clean. Prod. 2019, 225, 414–425. [Google Scholar] [CrossRef]
  12. Santero, N.J.; Masanet, E.; Horvath, A. Life-Cycle Assessment of Pavements. Part I Crit. Rev. Resour. Conserv. Recycl. 2011, 55, 801–809. [Google Scholar] [CrossRef]
  13. Jin, R.; Li, B.; Zhou, T.; Wanatowski, D.; Piroozfar, P. An Empirical Study of Perceptions towards Construction and Demolition Waste Recycling and Reuse in China. Resour. Conserv. Recycl. 2017, 126, 86–98. [Google Scholar] [CrossRef]
  14. Menaria, Y.; Sankhla, R. Use of Waste Plastic in Flexible Pavements-Green Roads. Open J. Civ. Eng. 2015, 5, 299–311. [Google Scholar] [CrossRef]
  15. Fanijo, E.O.; Kolawole, J.T.; Babafemi, A.J.; Liu, J. A Comprehensive Review on the Use of Recycled Concrete Aggregate for Pavement Construction: Properties, Performance, and Sustainability. Clean. Mater. 2023, 9, 100199. [Google Scholar] [CrossRef]
  16. Hahladakis, J.N.; Velis, C.A.; Weber, R.; Iacovidou, E.; Purnell, P. An Overview of Chemical Additives Present in Plastics: Migration, Release, Fate and Environmental Impact during Their Use, Disposal and Recycling. J. Hazard Mater. 2018, 344, 179–199. [Google Scholar] [CrossRef]
  17. Sarwar, S.; Shaibur, M.R.; Akter, S. Conversion of Waste Plastic (Low Density Polyethylene) to Alternative Resources. Case Stud. Constr. Mater. 2023, 19, e02339. [Google Scholar] [CrossRef]
  18. Ahmed, T.; Shahid, M.; Azeem, F.; Rasul, I.; Shah, A.A.; Noman, M.; Hameed, A.; Manzoor, N.; Manzoor, I.; Muhammad, S. Biodegradation of Plastics: Current Scenario and Future Prospects for Environmental Safety. Environ. Sci. Pollut. Res. 2018, 25, 7287–7298. [Google Scholar] [CrossRef]
  19. Xin, J.; Akiyama, M.; Frangopol, D.M. Sustainability-Informed Management Optimization of Asphalt Pavement Considering Risk Evaluated by Multiple Performance Indicators Using Deep Neural Networks. Reliab. Eng. Syst. Saf. 2023, 238, 109448. [Google Scholar] [CrossRef]
  20. Pierce, L.M.; Ginger, M. Implementation of the AASHTO Mechanistic-Empirical Pavement Design Guide and Software; Transportation Research Board: Washington, DC, USA, 2014. [Google Scholar] [CrossRef]
  21. AASHTO. Top-Down Cracking Enhancement to the MEPDG, 3rd Edition Manual of Practice; AASHTO: Washington, DC, USA, 2021.
  22. Tran, N.; Robbins, M.M.; Rodezno, C.; Timm, D.H.; Tran, T. Pavement ME Design, Impact of Local Calibration, Foundation Support, Design and Reliability Thresholds; NCAT Report 17-08; NCAT: Greensboro, NC, USA, 2017.
  23. Habib, A. AASHTOWare Pavement ME User Manual; Virginia Department of Transportation: Richmond, VA, USA, 2017.
  24. Malpass, D.B. Introduction to Industrial Polyethylene; Wiley: Hoboken, NJ, USA, 2010. [Google Scholar] [CrossRef]
  25. Pugin, K.G. The Use of Polymer Materials in the Composition of Asphalt Concrete; Materials Research Forum: Millersville, PA, USA, 2022; pp. 150–155. [Google Scholar] [CrossRef]
  26. Yassoub, N.; Mohammed, A.S. Effect of Density of the Polyethylene Polymer on the Asphalt Mixtures. J. Babylon Univ. Eng. Sci. 2014, 22, 674–683. [Google Scholar]
  27. Nizamuddin, S.; Boom, Y.J.; Giustozzi, F. Sustainable Polymers from Recycled Waste Plastics and Their Virgin Counterparts as Bitumen Modifiers: A Comprehensive Review. Polymers 2021, 13, 3242. [Google Scholar] [CrossRef]
  28. Hameed, A.; Al-Busaltan, S.; Dulaimi, A.; Kadhim, M.A.; Al-Yasari, R. Evaluating Modified Asphalt Binder Comprising Waste Paper Fiber and Recycled Low-Density Polyethylene. J. Phys. Conf. Ser. 2021, 1973, 012237. [Google Scholar] [CrossRef]
  29. Alghrafy, Y.M.; Abd Alla, E.-S.M.; El-Badawy, S.M. Rheological Properties and Aging Performance of Sulfur Extended Asphalt Modified with Recycled Polyethylene Waste. Constr. Build. Mater. 2021, 273, 121771. [Google Scholar] [CrossRef]
  30. Sharma, S.; Sharma, S.; Upadhyay, N. Composition Based Physicochemical Analysis of Modified Bitumen by HDPE/LDPE. Orient. J. Chem. 2019, 35, 1167–1173. [Google Scholar] [CrossRef]
  31. Du, Z.; Jiang, C.; Yuan, J.; Xiao, F.; Wang, J. Low Temperature Performance Characteristics of Polyethylene Modified Asphalts—A Review. Constr. Build. Mater. 2020, 264, 120704. [Google Scholar] [CrossRef]
  32. Dong, F.; Yu, X.; Liu, S.; Wei, J. Rheological Behaviors and Microstructure of SBS/CR Composite Modified Hard Asphalt. Constr. Build. Mater. 2016, 115, 285–293. [Google Scholar] [CrossRef]
  33. Liang, M.; Xin, X.; Fan, W.; Luo, H.; Wang, X.; Xing, B. Investigation of the Rheological Properties and Storage Stability of CR/SBS Modified Asphalt. Constr. Build. Mater. 2015, 74, 235–240. [Google Scholar] [CrossRef]
  34. Kanny, K.; Mohan, T.P. Rubber Nanocomposites with Nanoclay as the Filler. In Progress in Rubber Nanocomposites; Elsevier: Amsterdam, The Netherlands, 2017; pp. 153–177. [Google Scholar] [CrossRef]
  35. Kim, T.W.; Baek, J.; Lee, H.J.; Choi, J.Y. Fatigue Performance Evaluation of SBS Modified Mastic Asphalt Mixtures. Constr. Build. Mater. 2013, 48, 908–916. [Google Scholar] [CrossRef]
  36. Airey, G. Rheological Properties of Styrene Butadiene Styrene Polymer Modified Road Bitumens⋆. Fuel 2003, 82, 1709–1719. [Google Scholar] [CrossRef]
  37. Chen, Z.; Zhang, H.; Liu, X.; Duan, H. A Novel Method for Determining the Time-Temperature Superposition Relationship of SBS Modified Bitumen: Effects of Bitumen Source, Modifier Type and Aging. Constr. Build. Mater. 2021, 280, 122549. [Google Scholar] [CrossRef]
  38. Liu, J.; Yan, K.; Liu, W.; Zhao, X. Partially Replacing Styrene-Butadiene-Styrene (SBS) with Other Asphalt Binder Modifier: Feasibility Study. Constr. Build. Mater. 2020, 249, 118752. [Google Scholar] [CrossRef]
  39. Hong, Z.; Yan, K.; Ge, D.; Wang, M.; Li, G.; Li, H. Effect of Styrene-Butadiene-Styrene (SBS) on Laboratory Properties of Low-Density Polyethylene (LDPE)/Ethylene-Vinyl Acetate (EVA) Compound Modified Asphalt. J. Clean. Prod. 2022, 338, 130677. [Google Scholar] [CrossRef]
  40. Tayfur, S.; Ozen, H.; Aksoy, A. Investigation of Rutting Performance of Asphalt Mixtures Containing Polymer Modifiers. Constr. Build. Mater. 2007, 21, 328–337. [Google Scholar] [CrossRef]
  41. Omrani, H.; Ghanizadeh, A.R.; Tanakizadeh, A. Effect of SBS Polymer and Anti-Stripping Agents on the Moisture Susceptibility of Hot and Warm Mix Asphalt Mixtures. Civ. Eng. J. 2017, 3, 987–996. [Google Scholar] [CrossRef]
  42. Yang, Q.; Lin, J.; Wang, X.; Wang, D.; Xie, N.; Shi, X. A Review of Polymer-Modified Asphalt Binder: Modification Mechanisms and Mechanical Properties. Clean. Mater. 2024, 12, 100255. [Google Scholar] [CrossRef]
  43. Modarres, A. Investigating the Toughness and Fatigue Behavior of Conventional and SBS Modified Asphalt Mixes. Constr. Build. Mater. 2013, 47, 218–222. [Google Scholar] [CrossRef]
  44. Bai, M. Investigation of Low-Temperature Properties of Recycling of Aged SBS Modified Asphalt Binder. Constr. Build. Mater. 2017, 150, 766–773. [Google Scholar] [CrossRef]
  45. Kök, B.V.; Çolak, H. Laboratory Comparison of the Crumb-Rubber and SBS Modified Bitumen and Hot Mix Asphalt. Constr. Build. Mater. 2011, 25, 3204–3212. [Google Scholar] [CrossRef]
  46. Sengoz, B.; Isikyakar, G. Analysis of Styrene-Butadiene-Styrene Polymer Modified Bitumen Using Fluorescent Microscopy and Conventional Test Methods. J. Hazard Mater. 2008, 150, 424–432. [Google Scholar] [CrossRef]
  47. Özen, H. Rutting Evaluation of Hydrated Lime and SBS Modified Asphalt Mixtures for Laboratory and Field Compacted Samples. Constr. Build. Mater. 2011, 25, 756–765. [Google Scholar] [CrossRef]
  48. Abed, A.H.; Bahia, H.U. Enhancement of Permanent Deformation Resistance of Modified Asphalt Concrete Mixtures with Nano-High Density Polyethylene. Constr. Build. Mater. 2020, 236, 117604. [Google Scholar] [CrossRef]
  49. Little, D.N.; Petersen, J.C. Unique Effects of Hydrated Lime Filler on the Performance-Related Properties of Asphalt Cements: Physical and Chemical Interactions Revisited. J. Mater. Civ. Eng. 2005, 17, 207–218. [Google Scholar] [CrossRef]
  50. Mohan, H.M.; Obaid, H.A. Laboratory Examination for the Effect of Adding Hydrated Lime on the Moisture Damage Resistance of Asphalt Concrete Mixtures. Kufa J. Eng. 2014, 5, 1–12. [Google Scholar] [CrossRef]
  51. Singh, B.; Prasad, D.; Kant, R.R. Effect of Lime Filler on RCA Incorporated Bituminous Mixture. Clean. Eng. Technol. 2021, 4, 100166. [Google Scholar] [CrossRef]
  52. Hussain, M.A. Performance Evaluation of Flexible Pavement against Rutting. Int. J. Adv. Struct. Geotech. Eng. 2015, 4, 2319–5347. [Google Scholar]
  53. Federal Highway Administration Research and Technology. Reclaimed Asphalt Pavement; National Asphalt Pavement Association: Lanham, MD, USA, 2023. Available online: https://www.fhwa.dot.gov/publications/research/infrastructure/pavements/97148/046.cfm#:~:text=Reclaimed%20asphalt%20pavement%20(RAP)%20is,obtain%20access%20to%20buried%20utilities (accessed on 24 July 2025).
  54. Zhang, J.; Guo, C.; Chen, T.; Zhang, W.; Yao, K.; Fan, C.; Liang, M.; Guo, C.; Yao, Z. Evaluation on the Mechanical Performance of Recycled Asphalt Mixtures Incorporated with High Percentage of RAP and Self-Developed Rejuvenators. Constr. Build. Mater. 2021, 269, 121337. [Google Scholar] [CrossRef]
  55. Moniri, A.; Ziari, H.; Aliha, M.R.M.; Saghafi, Y. Laboratory Study of the Effect of Oil-Based Recycling Agents on High RAP Asphalt Mixtures. Int. J. Pavement Eng. 2021, 22, 1423–1434. [Google Scholar] [CrossRef]
  56. Esfandiarpour, S.; Shalaby, A. Effect of Local Calibration of Dynamic Modulus and Creep Compliance Models on Predicted Performance of Asphalt Mixes Containing RAP. Int. J. Pavement Res. Technol. 2018, 11, 517–529. [Google Scholar] [CrossRef]
  57. Izaks, R.; Haritonovs, V.; Klasa, I.; Zaumanis, M. Hot Mix Asphalt with High RAP Content. Procedia Eng. 2015, 114, 676–684. [Google Scholar] [CrossRef]
  58. Huang, B.; Shu, X.; Vukosavljevic, D. Laboratory Investigation of Cracking Resistance of Hot-Mix Asphalt Field Mixtures Containing Screened Reclaimed Asphalt Pavement. J. Mater. Civ. Eng. 2011, 23, 1535–1543. [Google Scholar] [CrossRef]
  59. Kim, S.; Sholar, G.A.; Byron, T.; Kim, J. Performance of Polymer-Modified Asphalt Mixture with Reclaimed Asphalt Pavement. Transp. Res. Rec. J. Transp. Res. Board 2009, 2126, 109–114. [Google Scholar] [CrossRef]
  60. Mcdaniel, R.S.; Anderson, R.M. Recommended Use of Reclaimed Asphalt Pavement in the Superpave Mix Design Method Technician’s Manual; National Academy Press: Washington, DC, USA, 2001. [Google Scholar]
  61. Widyatmoko, I. Mechanistic-Empirical Mixture Design for Hot Mix Asphalt Pavement Recycling. Constr. Build. Mater. 2008, 22, 77–87. [Google Scholar] [CrossRef]
  62. Pradyumna, T.A.; Mittal, A.; Jain, P.K. Characterization of Reclaimed Asphalt Pavement (RAP) for Use in Bituminous Road Construction. Procedia Soc. Behav. Sci. 2013, 104, 1149–1157. [Google Scholar] [CrossRef]
  63. Shannon, C.; Lee, W.; Williams, C.; Tang, S. Development of Quality Standards for Inclusion of High Recycled Asphalt Pavement Content in Asphalt Mixtures; Public Policy Center: Washington, DC, USA, 2012. [Google Scholar]
  64. Ali, Z.K.; Jasim, A.F. A Scenario-Based Case Study Approach to Pavement Rehabilitation Using Life Cycle Analysis of Recycled Asphalt Materials. Eng. Technol. Appl. Sci. Res. 2025, 15, 22072–22080. [Google Scholar] [CrossRef]
  65. Leiva-Villacorta, F.; Cerdas-Murillo, A. Performance Evaluation of Recycled Fibers in Asphalt Mixtures. Constr. Mater. 2024, 4, 839–855. [Google Scholar] [CrossRef]
  66. Do, T.C.; Nguyen, T.H.; Nguyen, V.L. Experimental Study on the Resistance of Asphalt Mixtures to Permanent Deformation and Its Relation to Mechanical Behavior of Pavement Structures. Case Stud. Constr. Mater. 2025, 22, e04248. [Google Scholar] [CrossRef]
  67. Zahid, A.; Ahmed, S.; Irfan, M. Experimental Investigation of Nano Materials Applicability in Hot Mix Asphalt (HMA). Constr. Build. Mater. 2022, 350, 128882. [Google Scholar] [CrossRef]
  68. Bastidas-Martínez, J.G.; Ruge, J.C.; Herrera Cano, C.E. Mechanical Performance of an Asphalt Stabilized Base with Natural Asphalt, Hydrated Lime and Portland Cement. Constr. Build. Mater. 2024, 446, 137938. [Google Scholar] [CrossRef]
  69. ASTM D5821; Standard Test Method for Determining the Percentage of Fractured Particles in Coarse Aggregate. ASTM International: West Conshohocken, PA, USA, 2017.
  70. ASTM C131; Standard Test Method for Resistance to Degradation of Small-Size Coarse Aggregate by Abrasion and Impact in the Los Angeles Machine. ASTM International: West Conshohocken, PA, USA, 2020.
  71. ASTM D4791; Standard Test Method for Flat Particles, Elongated Particles, or Flat and Elongated Particles in Coarse Aggregate. ASTM International: West Conshohocken, PA, USA, 2019.
  72. BS 812; Testing Aggregates—Methods for Determination of Aggregate Impact Value (AIV). British Standards Institution: London, UK, 1990.
  73. ASTM C128; Standard Test Method for Relative Density (Specific Gravity) and Absorption of Fine Aggregate. ASTM International: West Conshohocken, PA, USA, 2015.
  74. ASTM C127; Standard Test Method for Relative Density (Specific Gravity) and Absorption of Coarse Aggregate. ASTM International: West Conshohocken, PA, USA, 2015.
  75. ASTM C142; Standard Test Method for Clay Lumps and Friable Particles in Aggregates. ASTM International: West Conshohocken, PA, USA, 2017.
  76. ASTM D5; Standard Test Method for Penetration of Bituminous Materials. ASTM International: West Conshohocken, PA, USA, 2019.
  77. ASTM D92; Standard Test Method for Flash and Fire Points by Cleveland Open Cup Tester. ASTM International: West Conshohocken, PA, USA, 2021.
  78. ASTM D70; Standard Test Method for Density of Semi-Solid Bituminous Materials (Pycnometer Method). ASTM International: West Conshohocken, PA, USA, 2018.
  79. ASTM D36; Standard Test Method for Softening Point of Bitumen (Ring-and-Ball Apparatus). ASTM International: West Conshohocken, PA, USA, 2014.
  80. ASTM D113; Standard Test Method for Ductility of Bituminous Materials. ASTM International: West Conshohocken, PA, USA, 2020.
  81. ASTM D6926; Standard Practice for Preparation of Asphalt Mixture Specimens Using Marshall Apparatus. ASTM International: West Conshohocken, PA, USA, 2016.
  82. The Editors of Encyclopaedia Britannica. Properties of Hydrated Lime. Encyclopedia Britannica. 2025. Available online: www.britannica.com (accessed on 17 October 2025).
  83. Awodiji Chioma, B.T.; Onyebuchi, D.J.; Chibuike, N.; Olujide, A.O.; Joan, A.I. Reactions of Hydrated Lime-Saw Dust Ash Blend on the Strength Properties of Cement Concrete. Glob. J. Res. Eng. 2019, 19, 29–39. [Google Scholar]
  84. Mansour, A.; Hamdy, A.; Saber, D.; El-Meniawy, M.A.; Abdelhaleim, A.M.; Abdelnaby, A.H. Mechanical Properties and Corrosion Behavior of Sugarcane Bagasse Fiber Reinforced Low Density Polyethylene Composites. Egypt. Int. J. Eng. Sci. Technol. 2021, 36, 63–71. [Google Scholar]
  85. BPF. Polyethylene (Low Density) LDPE, LLDPE. Available online: https://www.bpf.co.uk/plastipedia/polymers/LDPE.aspx (accessed on 24 July 2025).
  86. Singh, A.; Gupta, A. Revisiting MSCR Test Parameters for LDPE-Modified Asphalt Binders. Constr. Build. Mater. 2025, 494, 143353. [Google Scholar] [CrossRef]
  87. Junaid, M.; Jiang, C.; Eltwati, A.; Khan, D.; Alamri, M.; Eisa, M.S. Statistical Analysis of Low-Density and High-Density Polyethylene Modified Asphalt Mixes Using the Response Surface Method. Case Stud. Constr. Mater. 2024, 21, e03697. [Google Scholar] [CrossRef]
  88. ASTM D2172; Standard Test Methods for Quantitative Extraction of Asphalt Binder from Asphalt Mixtures. ASTM International: West Conshohocken, PA, USA, 2017.
  89. ASTM D6925; Standard Test Method for Preparation and Determination of the Relative Density of Asphalt Mix Specimens by Means of the Superpave Gyratory Compactor. ASTM International: West Conshohocken, PA, USA, 2015.
  90. AASHTO T312; Standard Method of Test for Preparing and Determining the Density of Asphalt Mixture Specimens by Means of the Superpave Gyratory Compactor. American Association of State Highway and Transportation Officials: Washington, DC, USA, 2015.
  91. AASHTO TP62-07; Standard Method of Test for Determining Dynamic Modulus of Hot-Mix Asphalt Concrete Mixtures. American Association of State Highway and Transportation Officials: Washington, DC, USA, 2009.
  92. AASHTO TP79-09; Standard Method of Test for Determining the Dynamic Modulus and Flow Number for Asphalt Mixtures Using the Asphalt Mixture Performance Tester (AMPT). American Association of State Highway and Transportation Officials: Washington, DC, USA, 2009.
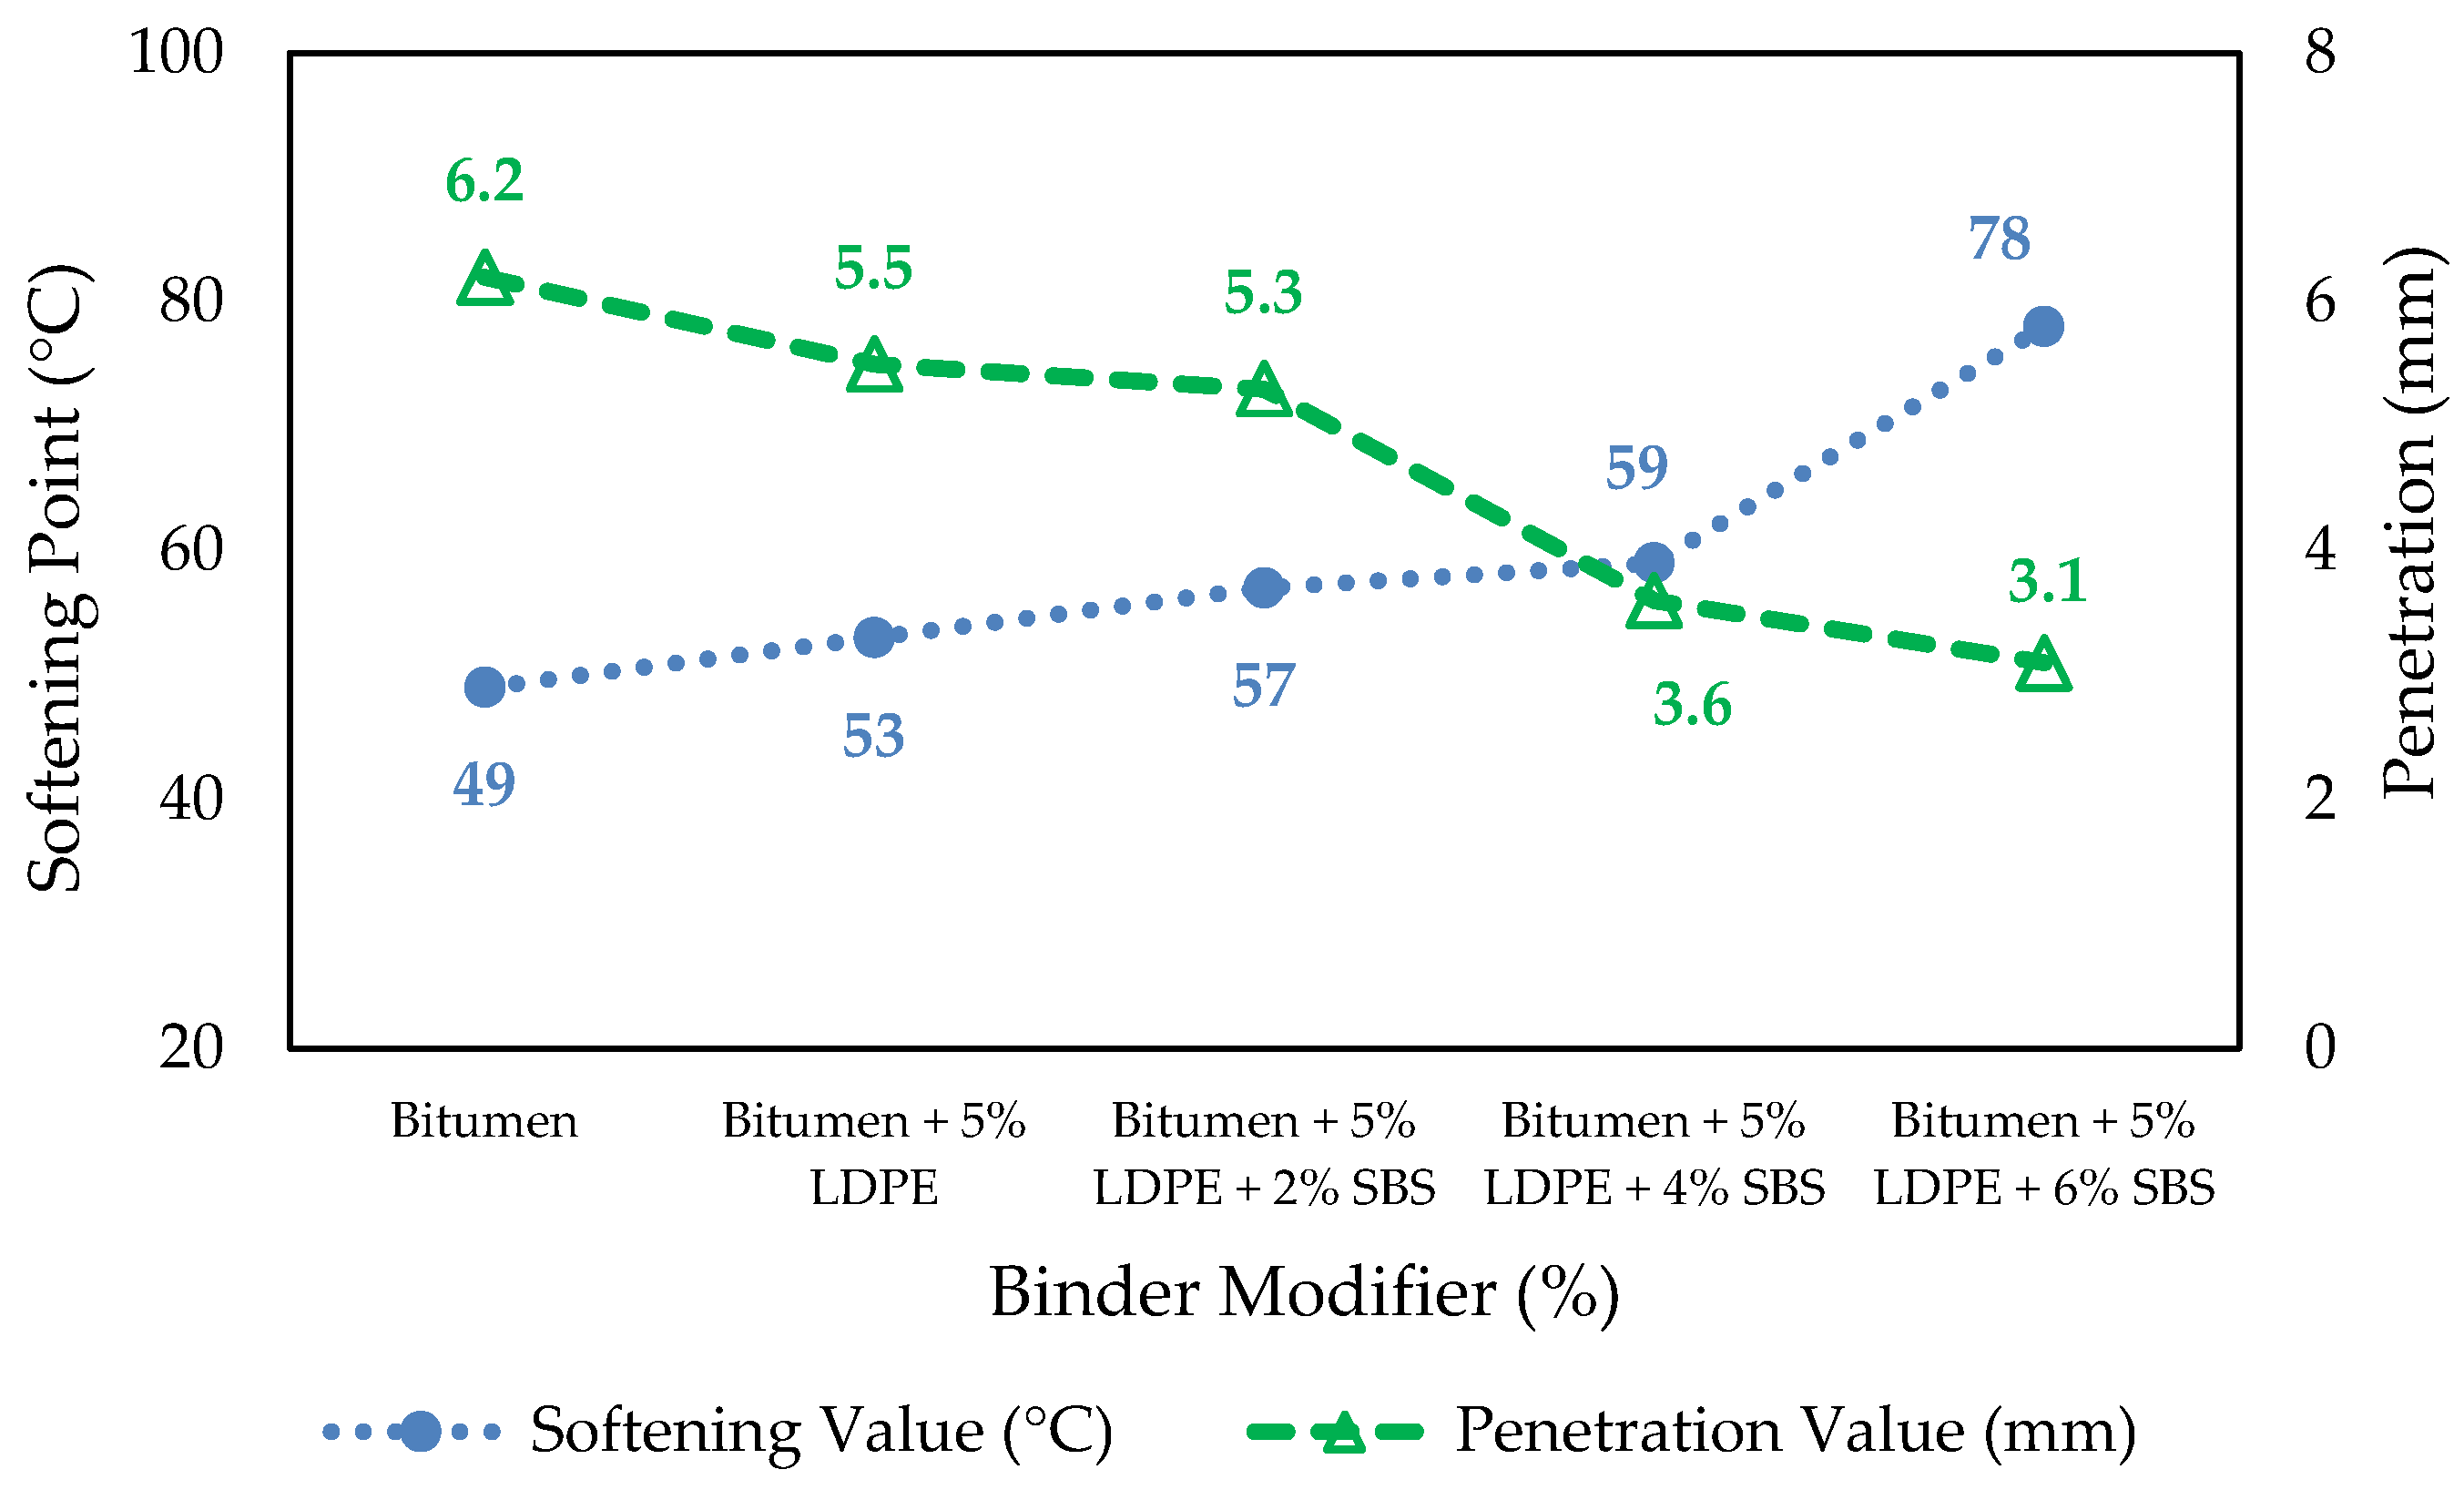
Figure 1. Effect of Binder Modification on Consistency.
Infrastructures 10 00288 g001
Figure 2. Isothermal Curves for Samples without RAP.
Infrastructures 10 00288 g002
Figure 3. Isothermal Curves for Samples with 15% RAP.
Infrastructures 10 00288 g003
Figure 4. Isochronal Curves for Samples without RAP.
Infrastructures 10 00288 g004
Figure 5. Isochronal Curves for Samples with 15% RAP.
Infrastructures 10 00288 g005
Figure 6. Dynamic Modulus (E*) Master Curves for Modified HMA Samples.
Infrastructures 10 00288 g006
Figure 7. IRI Profiles at Various Experimental Scenarios.
Infrastructures 10 00288 g007aInfrastructures 10 00288 g007b
Figure 8. AC Bottom-up Fatigue Cracking at Various Experimental Scenarios.
Infrastructures 10 00288 g008aInfrastructures 10 00288 g008b
Figure 9. AC Top-down Fatigue Cracking at Various Experimental Scenarios.
Infrastructures 10 00288 g009
Figure 10. Rut Depth in Total Pavement at Various Experimental Scenarios.
Infrastructures 10 00288 g010
Figure 11. Rut Depth in AC at Various Experimental Scenarios.
Infrastructures 10 00288 g011
Figure 12. IRI (mm/m) during Life Period.
Infrastructures 10 00288 g012aInfrastructures 10 00288 g012b
Figure 13. Bottom-up Fatigue Cracking during Life Period.
Infrastructures 10 00288 g013aInfrastructures 10 00288 g013b
Figure 14. Top-down Fatigue Cracking during Life Period.
Infrastructures 10 00288 g014aInfrastructures 10 00288 g014b
Figure 15. Total Rutting during lifetime.
Infrastructures 10 00288 g015aInfrastructures 10 00288 g015b
Table 1. Physical Properties of Hydrated Lime [64,65].
Density (Kg/m3)Molar Mass (g/mol)Melting Point (°C)ColorTextureSol. in H2OSol. in HCl
224074.09580WhiteSmoothPartialPartial
Table 2. Physical Properties of LDPE [66,67].
PropertiesValues
Density (Kg/m3)917–930
ReactivityNon-reactive
Long-term thermal exposure (°C)65
Short-term thermal exposure (°C)90
ColorOpaque
Tensile Strength (MPa)9
Thermal coefficient of expansion (×10−6)100–220
Melt flow rate (g/s)0.033 at 190 °C
Flexural strength (MPa)7
Flexural Modulus (MPa)175
Strain at breakage (%)150
Izod impact strength (J/m2)500
Hardness shore D45
Table 3. Physical Properties of SBS [68].
PropertiesValues
Styrene to Butadiene ratio0.43
GradeYH-791H
StructureLinear
Styrene solution’s Viscosity (Pa. s) at 25 °C2.24 at 5%
Volatility (%)<1.0
Tensile strength (MPa)20
Melt flow rate (g/s)0.166 × 10−3
Hardness shore A76
Table 4. Results of Tests performed on Aggregates [69,70,71,72,73,74,75].
Test TypeResults (%)Specification (%)Standards
Fractured Particles98.67>90ASTM D5821
Los Angeles Abrasion24.56<45ASTM C131
Flakiness Index11.41<15ASTM D4791
Elongation Index3.86<15ASTM D4791
Impact Value16.62<30BS 812
Crushing Value20.58<30BS 812
Water AbsorptionFine Aggregate2.37<3ASTM C128
Coarse Aggregate0.56<3ASTM C127
Specific GravityFine Aggregate2.67-ASTM C128
Coarse Aggregate2.70-ASTM C127
Clay PercentageFine Aggregate2.78-ASTM C142
Coarse Aggregate0.56-ASTM C142
Table 5. Results of Tests Performed on ARL 60/70 penetration grade bitumen [76,77,78,79,80].
Test DescriptionResultSpecificationStandard
Penetration Test (mm)6.260–70ASTM 5
Flash Point (°C)258Min. 232ASTM D92
Fire Point (°C)273Min. 270ASTM D92
Specific Gravity1.000.97–1.02ASTM D70
Softening Point (°C)4949–56ASTM D36-06
Ductility Test (cm)111Min. 100ASTM D113-99
Table 6. Results of Marshall test at 4% air voids (OBC).
ParametersValueCriteriaRemarks
OBC (%)4.264-
Unit Weight (KN/m3)23.63--
VMA (%)13.90>13Pass
VFA (%)71.5065–75Pass
Stability (KN)11.02>8.006Pass
Flow (mm)2.622.0–3.5Pass
Table 7. Aggregate Weight (Wt.) retained on each sieve for the preparation of Gyratory samples.
Sieve Size (mm)Passing Range for NHA-B for ACWC 1 (%)Selection for Study (%)Retained Proportion on Each Sieve (%)Retained Wt. of Sample (gm)Retained Wt. with 2% Lime (gm)Retained Wt. with 15%RAP & 2% Lime (gm)
1910010000.000.000.00
12.575–9082.517.51223.081223.081039.62
9.560–807012.5873.63873.63742.58
4.7540–6050201397.801397.801188.13
2.3820–4030201397.801397.801188.13
1.185–1510201397.801397.801188.13
0.0753–85.54.5314.51314.51267.33
Pan005.5384.40238.40202.64
Total1006989.026843.025816.57
1 ACWC refers to Asphalt Concrete wearing coarse.
Table 8. Difference with varying Temperature Thin Pavement Low Traffic.
Binder ModifierDistress Type
Terminal IRI (mm/m)AC
Bottom-Up
Fatigue Cracking (%)
AC Top-Down
Fatigue Cracking (mm/m)
Permanent Deformation
Total (mm)AC Only (mm)
Conventional0.085−1.300−46.54712.44614.732
Without RAP2% Lime, 0% LDP, 0% SBS0.003−4.520−101.4429.65212.192
2% Lime, 5% LDPE, 0% SBS0.453−2.130−46.87327.17829.718
2% Lime, 5% LDPE, 2% SBS0.210−2.290−121.10517.78020.320
2% Lime, 5% LDPE, 4% SBS0.018−3.680−178.69710.92213.970
2% Lime, 5% LDPE, 6% SBS0.107−2.380−114.80926.67029.210
With RAP2% Lime, 0% LDP, 0% SBS0.092−2.910−79.36012.95415.240
2% Lime, 5% LDPE, 0% SBS−0.060−1.250−54.8466.6049.144
2% Lime, 5% LDPE, 2% SBS−0.053−0.090−46.2147.1129.398
2% Lime, 5% LDPE, 4% SBS0.146−1.960−144.25815.74818.288
2% Lime, 5% LDPE, 6% SBS0.202−1.810−136.95917.78020.320
Table 9. Difference with varying Temperature Thick Pavement Low Traffic.
Binder ModifierDistress Type
Terminal IRI (mm/m)AC
Bottom-Up
Fatigue Cracking (%)
AC Top-Down
Fatigue Cracking (mm/m)
Permanent Deformation
Total (mm)AC Only (mm)
Conventional0.083−1.30098.69912.19213.716
Without RAP2% Lime, 0% LDP, 0% SBS0.018−4.520118.5369.65211.430
2% Lime, 5% LDPE, 0% SBS0.464−2.13083.84926.67028.702
2% Lime, 5% LDPE, 2% SBS0.215−2.29037.99617.27219.050
2% Lime, 5% LDPE, 4% SBS0.050−3.68055.96511.17613.208
2% Lime, 5% LDPE, 6% SBS0.194−2.38075.53826.67028.702
With RAP2% Lime, 0% LDP, 0% SBS0.095−2.91098.85812.44614.224
2% Lime, 5% LDPE, 0% SBS−0.042−1.250158.0057.3669.144
2% Lime, 5% LDPE, 2% SBS−0.037−0.090158.5827.3669.398
2% Lime, 5% LDPE, 4% SBS0.165−1.96017.78515.49417.526
2% Lime, 5% LDPE, 6% SBS0.220−1.8107.95117.78019.304
Table 10. Difference with varying Temperature Thin Pavement High Traffic.
Binder ModifierDistress Type
Terminal IRI (mm/m)AC
Bottom-Up
Fatigue Cracking (%)
AC Top-Down
Fatigue Cracking (mm/m)
Permanent Deformation
Total (mm)AC Only (mm)
Conventional0.221−1.300−71.44418.03420.320
Without RAP2% Lime, 0% LDP, 0% SBS0.110−4.520−167.86413.97016.510
2% Lime, 5% LDPE, 0% SBS0.718−2.130−84.68338.10040.640
2% Lime, 5% LDPE, 2% SBS0.386−2.290−209.93025.14627.940
2% Lime, 5% LDPE, 4% SBS0.129−3.680−308.57216.00219.050
2% Lime, 5% LDPE, 6% SBS0.363−2.380−204.74337.33840.132
With RAP2% Lime, 0% LDP, 0% SBS0.230−2.910−128.83918.28821.082
2% Lime, 5% LDPE, 0% SBS0.021−1.250−84.5709.90612.700
2% Lime, 5% LDPE, 2% SBS0.031−0.090−70.45010.41412.954
2% Lime, 5% LDPE, 4% SBS0.301−1.960−246.09922.60625.146
2% Lime, 5% LDPE, 6% SBS0.376−1.810−235.57825.40027.940
Table 11. Difference with varying Temperature Thick Pavement High Traffic.
Binder ModifierDistress Type
Terminal IRI (mm/m)AC
Bottom-Up
Fatigue Cracking (%)
AC Top-Down
Fatigue Cracking (mm/m)
Permanent Deformation
Total (mm)AC Only (mm)
Conventional0.217−1.300117.31717.01819.050
Without RAP2% Lime, 0% LDP, 0% SBS0.130−4.520138.38013.71615.748
2% Lime, 5% LDPE, 0% SBS0.738−2.130128.34037.33839.370
2% Lime, 5% LDPE, 2% SBS0.398−2.29051.61324.13026.162
2% Lime, 5% LDPE, 4% SBS0.177−3.68077.34216.00218.288
2% Lime, 5% LDPE, 6% SBS0.469−2.380127.69037.33839.370
With RAP2% Lime, 0% LDP, 0% SBS0.234−2.910117.92417.78019.558
2% Lime, 5% LDPE, 0% SBS0.046−1.250180.24010.41412.446
2% Lime, 5% LDPE, 2% SBS0.053−0.090181.08110.66812.700
2% Lime, 5% LDPE, 4% SBS0.332−1.96026.29622.09823.876
2% Lime, 5% LDPE, 6% SBS0.405−1.81011.70324.89226.924
Disclaimer/Publisher’s Note: The statements, opinions and data contained in all publications are solely those of the individual author(s) and contributor(s) and not of MDPI and/or the editor(s). MDPI and/or the editor(s) disclaim responsibility for any injury to people or property resulting from any ideas, methods, instructions or products referred to in the content.