1. Introduction
Urban underground pipe networks are fundamental to supporting the health, safety, and economic vitality of cities [
1], providing essential services such as water supply, sewage management [
2], and stormwater drainage. As the age and complexity of these buried infrastructures [
3] increase, so too do the challenges associated with maintenance and timely rehabilitation. Asset managers frequently encounter difficulties in assessing the actual condition [
4,
5] of underground pipes due to the limited accessibility and visibility inherent in these systems. Traditional assessment methods [
6] often involve intrusive, time-consuming, and costly physical inspections, which may not adequately capture the nuanced interplay of factors influencing pipe deterioration [
7]. This growing need for efficient, accurate, and scalable assessment strategies has prompted researchers and practitioners to explore advanced data-driven approaches for pipe condition [
6] evaluation.
Recent advances in machine learning [
8,
9] have opened new avenues for condition assessment by leveraging the diverse and voluminous data generated from urban utility networks [
10]. By systematically incorporating variables such as pipe age, material, diameter, length, soil properties, slope, and environmental indices, machine learning [
11,
12] enables the extraction of hidden patterns [
13,
14] and relationships beyond human capability. Conventional models [
15], such as logistic regression [
16] or decision trees, have demonstrated promise in classifying pipe condition [
17] states when trained on large-scale datasets. However, the performance of any single model is often limited by dataset complexity [
18], nonlinearity of the underlying processes, and the presence of noisy or missing data. To address these limitations, hybrid approaches [
19] that combine multiple machine learning [
20,
21] algorithms into meta-models [
22,
23] have emerged as powerful alternatives, offering robustness and improved generalizability.
Hybrid machine learning [
19] meta-models integrate the strengths of individual learners by employing both integration strategies and meta-learning techniques, making them more advanced and efficient compared to traditional ensemble approaches. This study explores a novel meta-model architecture [
24] for the classification of water pipe conditions [
25] in an urban context. Diverse base models, such as Random Forest [
26], Light Gradient-Boosting Machine (LightGBM) [
27], and Categorical Boosting (CatBoost) [
28], are trained on a comprehensive dataset featuring key attributes of urban pipes. Through stacking and meta-learning, their collective predictions are synthesized to achieve higher predictive accuracy and resilience to data imperfections. This approach enhances the representation of complex interactions [
29] among features, mitigates the risks of overfitting, and provides interpretable insights to guide infrastructure management decisions [
30]. Model evaluation is conducted via multifaceted metrics [
31], including accuracy [
32], precision [
33], recall [
34], and F1 score [
35], supplemented by visualizations and feature importance analyses [
36].
Overall, this research demonstrates the feasibility and advantages of a hybrid machine learning meta-model framework for the condition assessment of urban underground pipes. By incorporating heterogeneous algorithms and focusing on both prediction quality and interpretability, the study addresses critical gaps in current assessment methodologies. The proposed approach fosters more reliable decision-making for urban asset management, potentially reducing maintenance costs, optimizing rehabilitation timing, and ultimately advancing the resilience of urban infrastructure systems. The findings highlight a scalable, data-driven path for municipalities and utility providers to modernize their assessment protocols and improve service continuity in rapidly evolving urban environments. The basic structure of this paper is as follows.
Section 2 presents Related Works on machine learning approaches for infrastructure condition assessment;
Section 3 introduces the main Methodology including the hybrid meta-model framework and evaluation metrics, and
Section 4 presents data exploration.
Section 5 shows the experimental results from the stacking architecture and individual model comparisons;
Section 6 discusses the results including feature importance analysis and model performance evaluation; and
Section 7 concludes this paper.
2. Related Works
Recent advancements in urban underground pipe condition assessment [
37] research reveal a shift from traditional inspection techniques toward the integration of machine learning and data-driven strategies [
38,
39]. This evolution is propelled by the need to overcome the limitations of manual and technology-driven approaches, aiming for scalable solutions that ensure more accurate pipeline health monitoring [
40]. To provide a comprehensive background, the following paragraphs critically compare pairs of significant studies, focusing on their methodologies, datasets, and results, and effectively illustrate the progression in this research domain.
To begin, the work of Zheng Liu and Yehuda Kleiner (2013) [
41] can be contrasted with the empirical modeling approach of Mosavi et al. (2020) [
42]. Whereas Liu and Kleiner provided a qualitative evaluation of direct and indirect technologies—such as CCTV, ultrasound, and smart robotics—their review highlighted capability (e.g., SmartBall detecting leaks < 0.026 L/h, LeakFinderRT location < 10 cm) but did not employ a quantitative dataset [
41]. In contrast, Mosavi et al. applied Recursive Feature Elimination and ensemble machine learning (Random Forest, AdaBoost, GamBoost, Bagged CART) to a dataset of 339 groundwater locations and 15 variables. The Random Forest achieved an accuracy of 0.86 and a recall of 0.91, outperforming boosting models. Thus, this comparison demonstrates how transitioning from reviews [
43] of technical tools to integrated data-driven frameworks can yield higher predictive accuracy and actionable outcomes [
42].
Similarly, a notable comparison can be drawn between Rayhana et al. (2021) [
44] and Mohsen Mohammadagha et al. (2025) [
45], reflecting the progress from system-wide vision technology reviews to targeted machine learning implementations. While Rayhana et al. synthesized findings from datasets of 100 to over 2 million CCTV and SSET pipe images—demonstrating deep learning models such as DCNN and Faster R-CNN achieving defect detection accuracies up to 98% [
44]—Mohammadagha et al. systematically modeled 612 cases of reinforced concrete sewer pipe inspections using both Artificial Neural Networks (ANN) and Multiple Linear Regression (MLR). The ANN model yielded R
2 = 0.9066, outperforming MLR [
45]. Both studies endorse data-intensive approaches but differ in scale, with Rayhana et al. emphasizing automated vision at a network level and Mohammadagha et al. focusing on feature-driven pipeline condition forecasting at the asset level.
Furthermore, when considering the broad landscape of pipeline monitoring, the reviews by Jawwad Latif et al. (2022) [
46] and by Liu & Kleiner (2013) [
41] illuminate the evolution of sensor integration and methodological sophistication. On one hand, Latif et al. categorized monitoring into acoustic, electromagnetic, visual, and IoT-enabled methods, discussing visual classifiers like YOLOv3 and acoustic detections (SmartBall < 0.1 gal/hr) while emphasizing the need for robust, cost-effective, and machine learning integration [
46]. On the other hand, Liu & Kleiner mainly addressed the capabilities and cost limitations of traditional and semi-automated systems. This comparison highlights a shift from static technology evaluation to the advocacy for dynamic, adaptable, and intelligent monitoring platforms [
41].
What is equally important is that the studies of Dawood et al. (2020) [
47] and Rayhana et al. (2021) [
44] exemplify the harmonization of artificial intelligence theory with practical image-based inspection. Dawood et al. reviewed 66 studies across seven AI model categories, reporting that ANN models can reach R
2 of up to 0.9510 for failure prediction, though their findings relied on synthesizing published results rather than a singular dataset [
47]. Conversely, Rayhana et al. demonstrated that vision-based deep learning (e.g., Faster R-CNN) achieved up to 98% accuracy in defect detection across enormous and diverse image collections [
44]. Both works underscore the value of hybrid and data-driven frameworks, yet Dawood et al. foreground the potential of hybrid modeling logic, while Rayhana et al. stress the strengths of advanced computer vision in real-world applications.
Ultimately, while previous studies have advanced pipe condition assessment [
48] with machine learning, Hybrid models [
49], and meta-analysis, existing research has not systematically evaluated nor benchmarked a comprehensive hybrid meta-model that integrates the tree-based mixture [
50] methods (CatBoost [
51], LightGBM [
52], Random Forest), and meta-learning for multi-class urban pipe condition prediction using real, multifaceted operational datasets [
53]. In this research, we address these gaps by designing and implementing a unified hybrid meta-learning framework, comparing algorithmic performance and feature importance, and providing interpretable model diagnostics using a large-scale, diverse urban pipe dataset. A comprehensive comparison between previous methodological approaches and the proposed hybrid meta-model framework is presented in
Table 1.
3. Methodology
The methodology for this research is structured around a hybrid machine learning meta-model by using Python 3.12.0 (Python Software Foundation, Wilmington, DE, USA) with scikit-learn 1.7.1, LightGBM 4.6.0 (Microsoft Corporation, Redmond, WA, USA), and CatBoost 1.2.8 (Yandex LLC, Moscow, Russia) (all open-source libraries available at
https://pypi.org/), designed for interpretable condition assessment of urban underground water pipes. The urban water pipe dataset comprises 11,544 records of urban potable water distribution pipes and pressurized distribution mains for potable water supply systems, sourced from New Zealand’s municipal infrastructure systems, with 3297 records from the South Island and 8247 records from the North Island, reflecting the comprehensive coverage of both the Waimakariri District Council (2022) [
25] and Matamata-Piako District Council (2024) [
26,
54,
55] networks. While the original dataset contained more environmental and operational parameters, this study strategically selected seven core parameters that are most commonly available and represent the primary factors influencing pipe deterioration. Building on
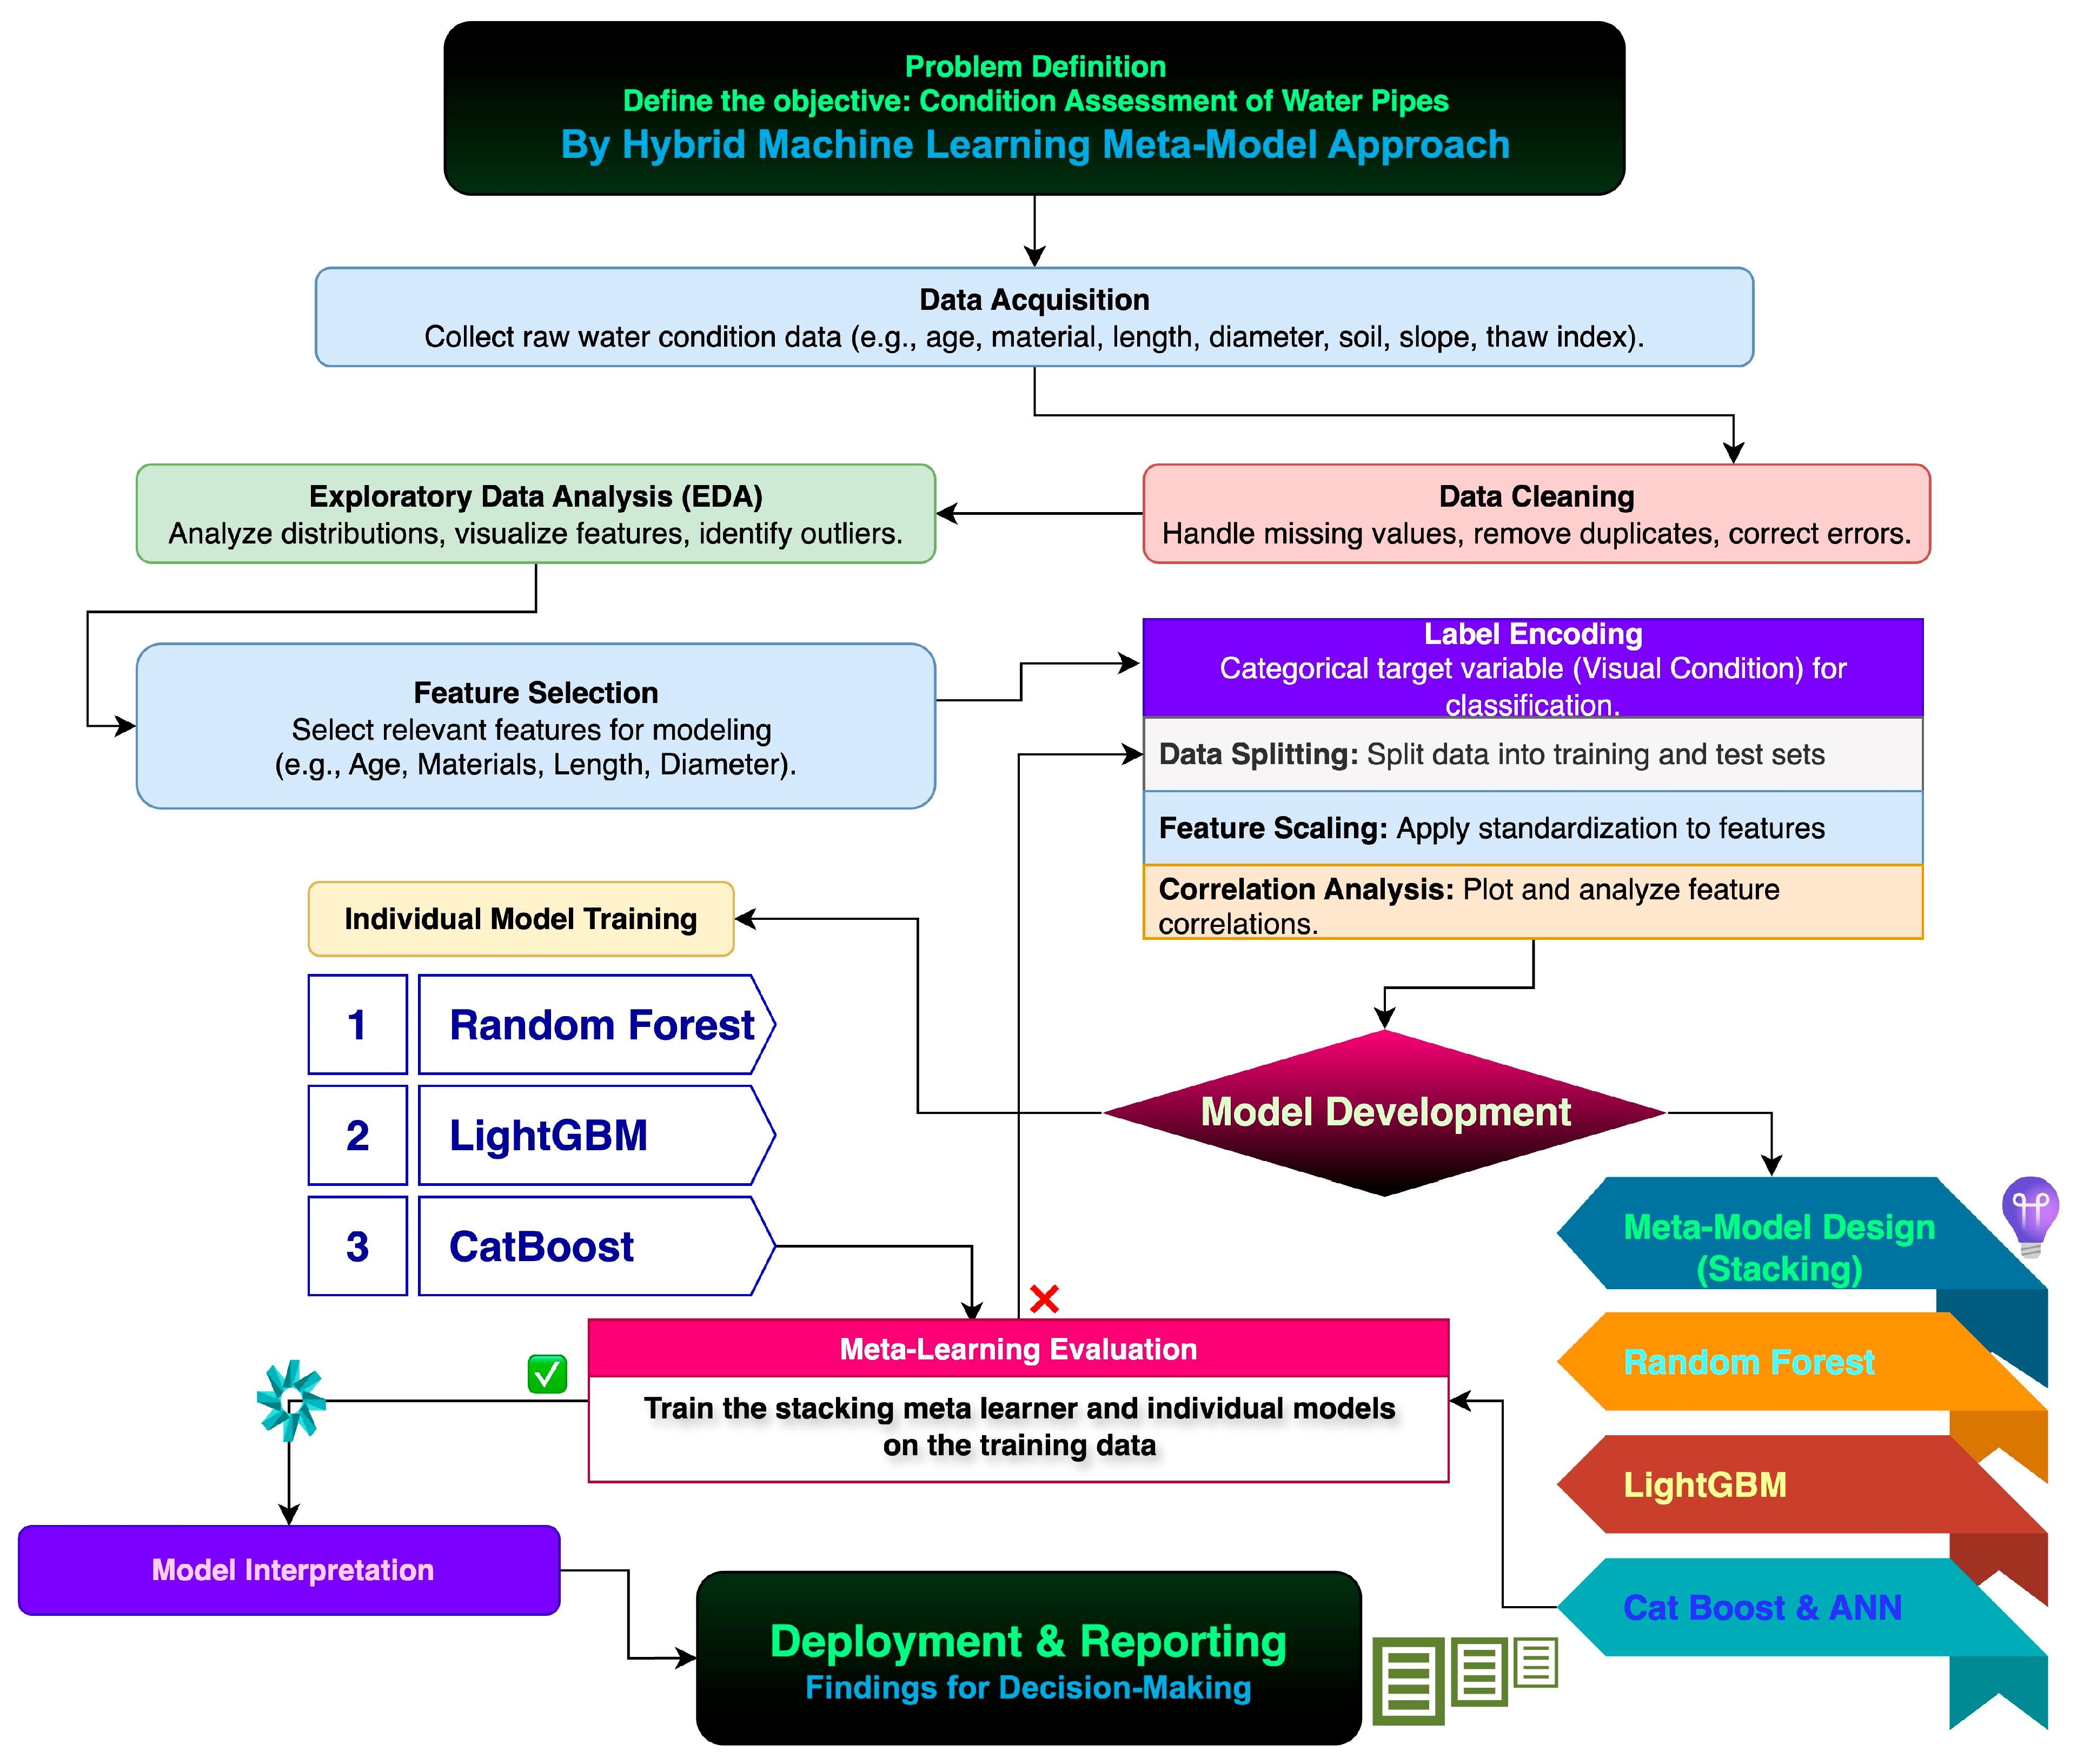
Figure 1’s workflow diagram, the process begins with extensive data acquisition, collecting features such as age, material, length, diameter, slope, soil properties, and thaw index from operational pipe inventories. Thaw index is a proxy for environmental stress that influences buried pipe bedding and surrounding soils; higher thaw indices generally imply deeper seasonal thaw and stability, or serviceability impacts relevant to condition assessment features. Data cleaning first harmonizes schemas, addresses missing values, and removes obvious errors, after which Exploratory Data Analysis (EDA) identifies outliers and distribution patterns. The workflow visualization employs standard symbols including checkmarks (✅) for process validation and X marks (❌) for decision points.
Following preprocessing and feature scaling, complementary machine learning algorithms are selected as base learners for the stacking ensemble: Random Forest, LightGBM [
27], and CatBoost. This systematic selection process focuses on algorithms with diverse learning paradigms to maximize ensemble diversity and predictive performance. The stacking architecture employs enhanced base models with optimized hyperparameters configured with fixed random seeds for reproducibility.
The stacking ensemble integrates these base learners through stratified cross-validation, where out-of-fold predicted class probabilities serve as meta-features to prevent information leakage. A comprehensive meta-learner selection process evaluates distinct meta-learning approaches: Neural Network with deep architecture, Random Forest meta-learner, and LightGBM meta-learner. Each meta-learner candidate employs cross-validation techniques with the predict_proba stacking method to learn optimal weighting strategies for combining individual model outputs.
The meta-learner selection algorithm automatically identifies the best-performing architecture based on validation accuracy, ensuring optimal ensemble configuration. The meta-learner incorporates regularization techniques, including early stopping and adaptive learning rate optimization, to prevent overfitting. All meta-learners utilize cross-validation with the same stratified splits to maintain consistency in training procedures, while a held-out test split remains reserved for unbiased final evaluation.
Performance assessment employs comprehensive metrics, including accuracy, precision, recall, F1-score, and multi-class ROC-AUC curves, which are evaluated on an independent test set to ensure model validation.
A crucial component of this methodology is the use of mathematical formulas and evaluation metrics in the background of the models, ensuring best-practice model comparison and interpretability by calculating the accuracy, Precision, Recall, and F1 score. Seven common formulas drive the assessment: (1) Min-Max Normalization for feature scaling [
56]; (2) Accuracy for overall performance; (3) Precision and (4) Recall (Sensitivity) for quantifying the correctness and completeness of class predictions; (5) F1 Score to balance precision and recall, especially under class imbalance; (6) Feature Importance, typically the mean decrease in impurity in tree-based models, to prioritize influential variables; and (7) Stacking Prediction [
57], which mathematically combines the predictions of diverse base models via a meta-learner for improved overall robustness. This methodology uses well-established mathematical formulas and evaluation metrics that underpin the modeling and assessment processes. Some common formulas central to this study include Min-Max Normalization for Purpose Scales, featuring (variable) a range between 0 and 1. This ensures all features contribute equally to the model and prevents features with larger ranges from dominating, which is shown in Equation (1) [
58]:
: Feature matrix of shape , with samples and features. : A scalar value of a feature before normalization. : The normalized (scaled) value of . , : Minimum and maximum values of a feature across the dataset, used in min–max scaling. : Ground-truth class label vector; multiclass labels in after encoding. : Predicted class label(s). : Number of classes in the multiclass classification problem. : Number of samples; : Number of features.
Accuracy is a fundamental metric for evaluating classification models, representing the proportion of correctly predicted instances among all predictions. Calculated as shown in Equation (2), which is a classification metric, it provides a straightforward measure of overall model performance, especially when the dataset is balanced between classes [
28].
Precision quantifies the correctness of positive predictions made by a model. Defined as shown in Equation (3), it measures the proportion of true positives among all instances predicted as positive. High precision indicates that the model makes very few false positive errors, which is vital in many applications.
Recall, also known as sensitivity, assesses a model’s ability to identify all relevant positive cases. The formula, as shown in Equation (4), calculates the proportion of actual positives correctly predicted. High recall is essential when missing positive instances have significant consequences, such as in medical diagnoses or fraud detection.
The F1 score is the harmonic mean of precision and recall, providing a balanced metric for model evaluation, particularly with imbalanced datasets. Calculated as shown in Equation (5), it penalizes extreme values and offers a single, interpretable measure of model effectiveness.
: True positives; number of positive instances correctly classified as positive. : True negatives; number of negative instances correctly classified as negative. : False positives; number of negative instances incorrectly classified as positive. : False negatives; number of positive instances incorrectly classified as negative.
Feature importance [
59] quantifies the contribution of each input variable to a model’s predictive power. In tree-based models, it is often computed as the mean decrease in impurity, as shown in Equation (6), which is feature importance, when a feature is used for splitting. This metric aids in model interpretation, enabling practitioners to identify and prioritize influential variables in decision-making.
where t is an index of the tree nodes where feature j is used for splitting. N
t is the number of samples reaching node t. N is the total number of samples.
is the decrease in impurity (such as Gini impurity or entropy) caused by the split at node t. Stacking prediction combines multiple base models’ outputs using a meta-learner to improve predictive accuracy and robustness. The final prediction is expressed as shown in Equation (7). This approach leverages the strengths of diverse models, often outperforming individual learners in complex tasks.
By applying all the above formulas in the model, the pipeline deploys and benchmarks Random Forest, LightGBM, and CatBoost models—each trained on stratified training/test splits, and their performance compared using accuracy, precision, recall, and F1. Individual feature importances are computed for transparent, actionable interpretation; stacking meta-models aggregates these predictions to further elevate performance. The integration of three models represents methodological novelty, allowing enhanced representation learning directly from infrastructure data.
In summary, this research advances the condition assessment of urban pipes by integrating a diverse stack of machine learning models—uniquely combining tree-based and neural network approaches within a meta-learning framework. Unlike some prior literature that focused on classic or singly ensembled models, our workflow consistently benchmarks stacking models, which demonstrate superior performance on water pipe data, revealing domain-driven feature patterns and reporting interpretable decision rules. The principal novelty lies in the comprehensive ensemble architecture with multiple meta-learner candidates, directly addressing prior gaps in feature interaction learning and transparency. This architecture delivers state-of-the-art prediction and interpretability, enabling urban utilities and asset managers to implement data-driven, generalizable, and actionable assessments for maintenance prioritization and long-term infrastructure resilience.
4. Data Exploration
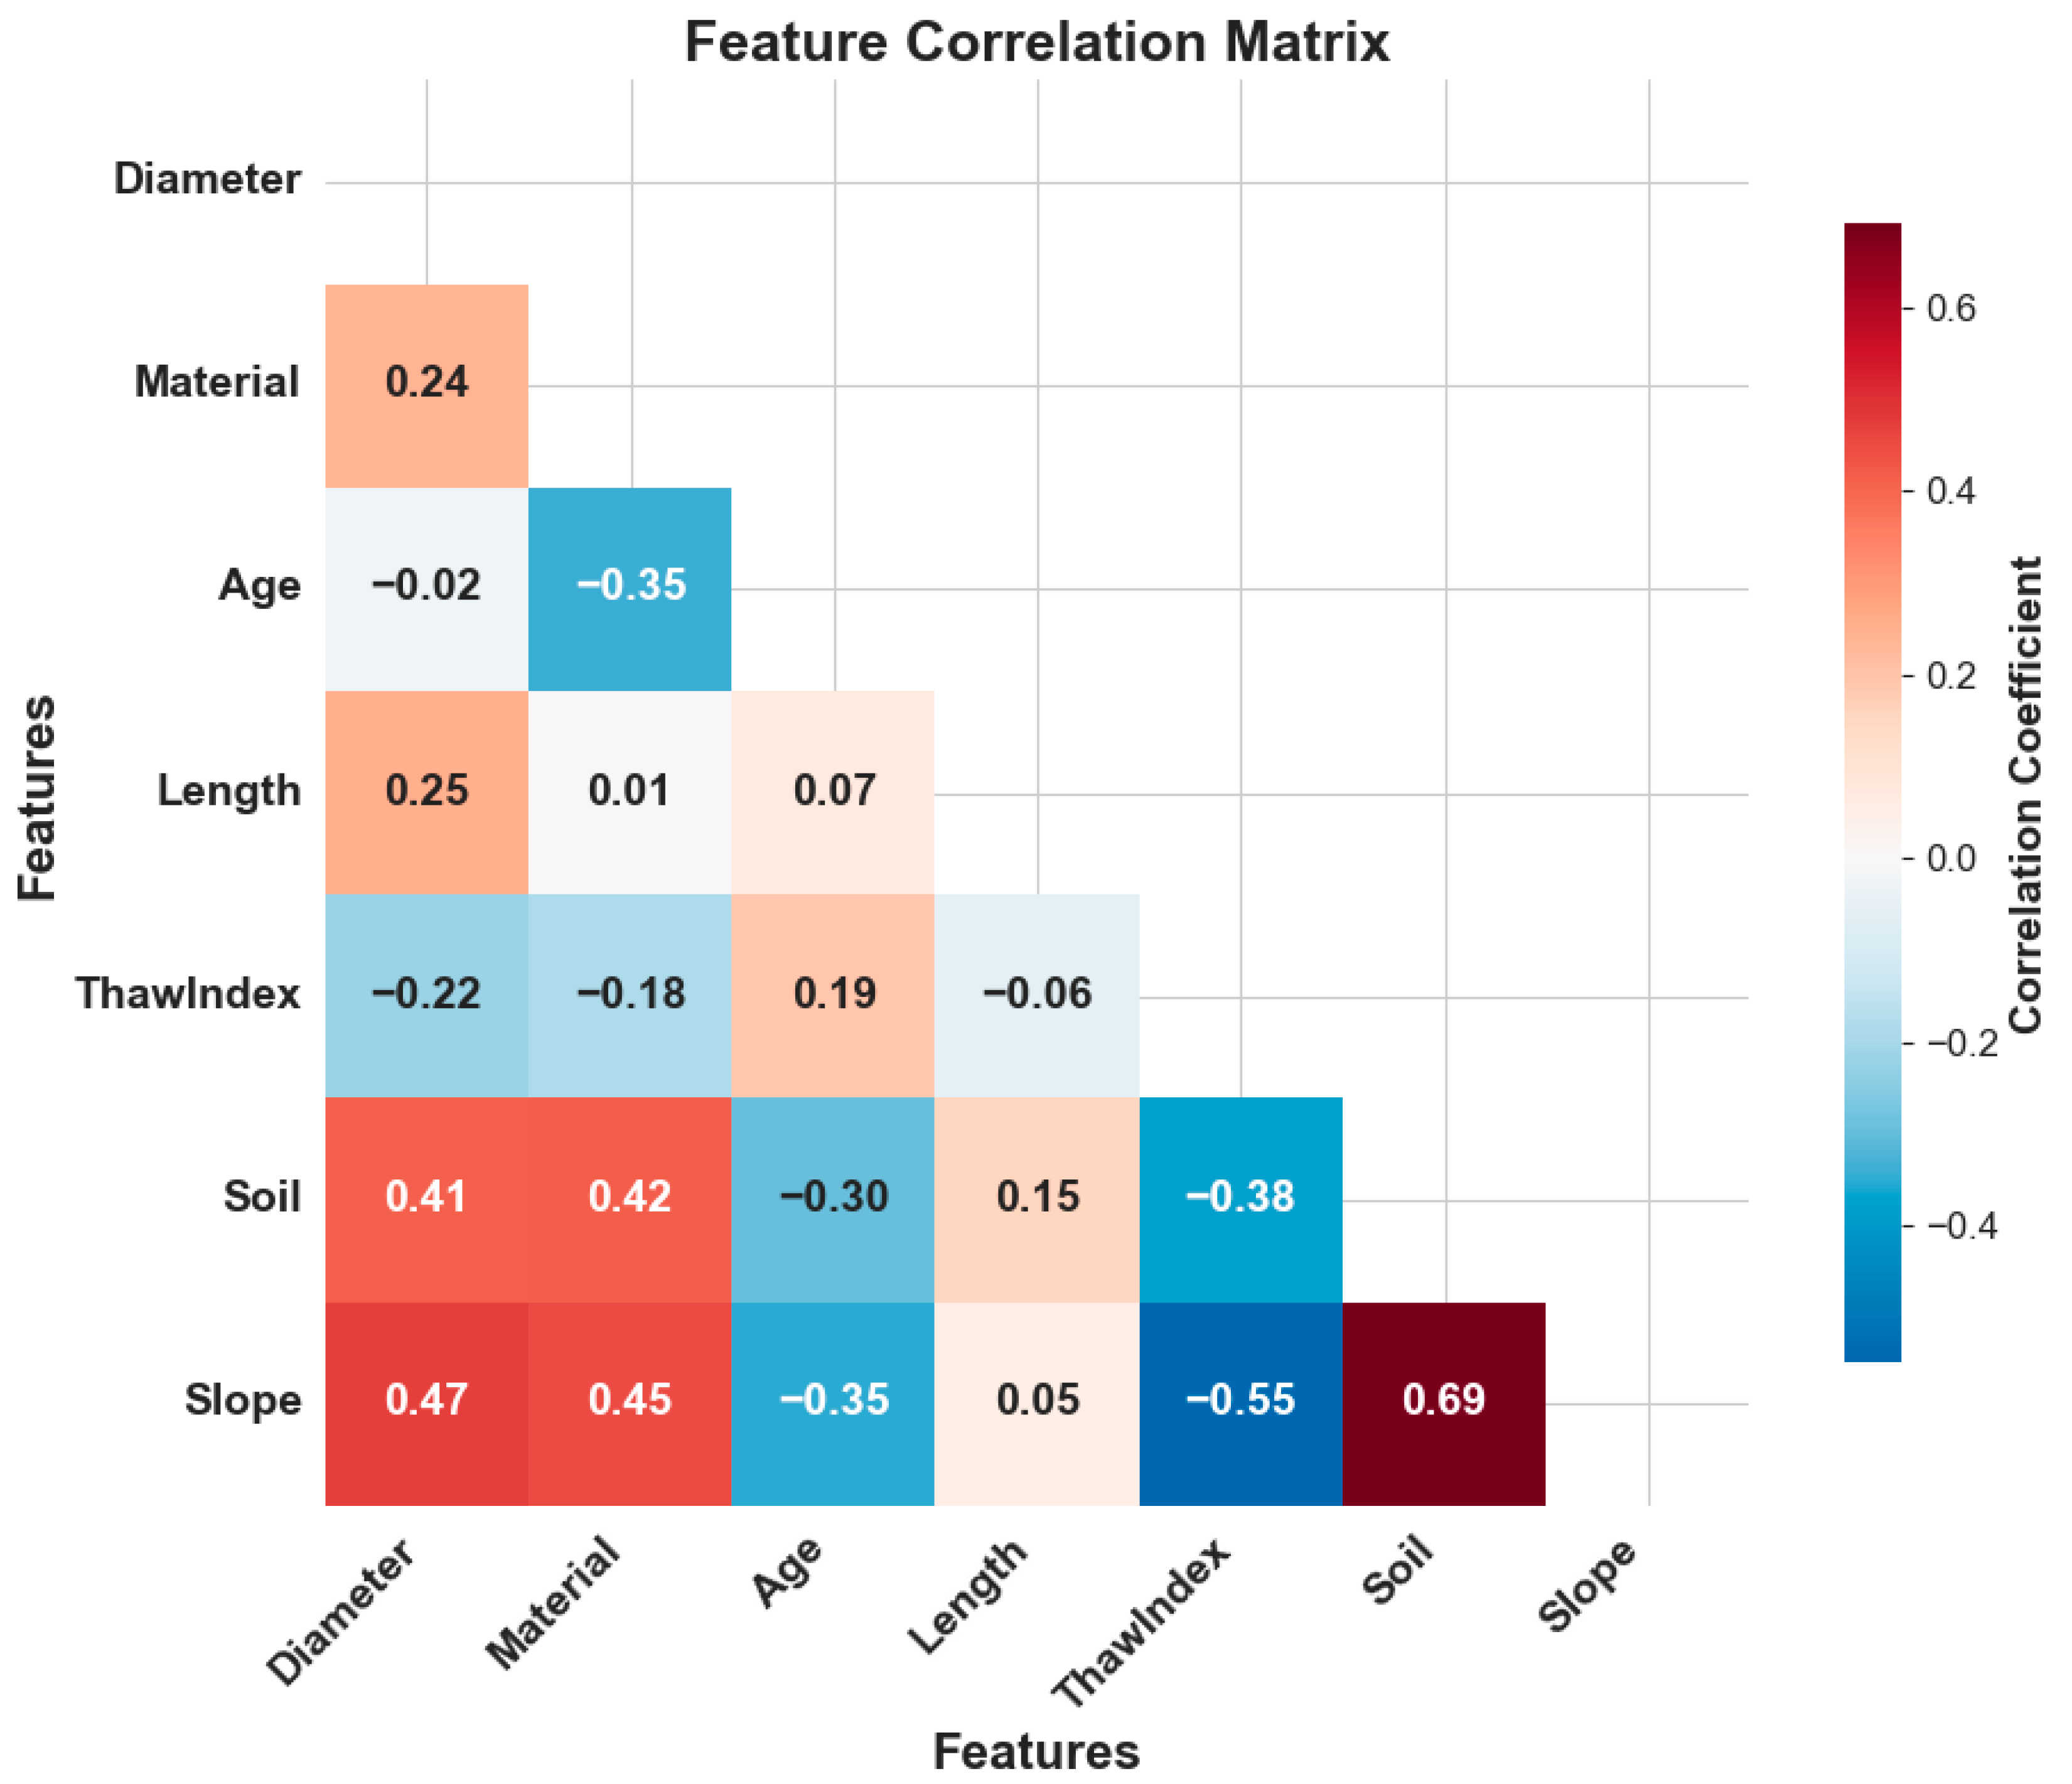
A comprehensive correlation analysis in
Figure 2 reveals critical feature interdependencies that inform both data preprocessing and model development strategies. The feature correlation matrix demonstrates moderate positive correlations between infrastructure characteristics, notably diameter-material (r = 0.24) and diameter-slope (r = 0.47), indicating that larger-diameter pipes are often associated with specific materials and terrain conditions. Significant negative correlations emerge between thaw index and soil properties (r = −0.38) and between thaw index and slope characteristics (r = −0.55), suggesting that environmental factors interact in predictable patterns across the infrastructure network. These statistical relationships align with engineering principles, where soil composition, environmental conditions, and pipe specifications collectively influence system performance and degradation patterns.
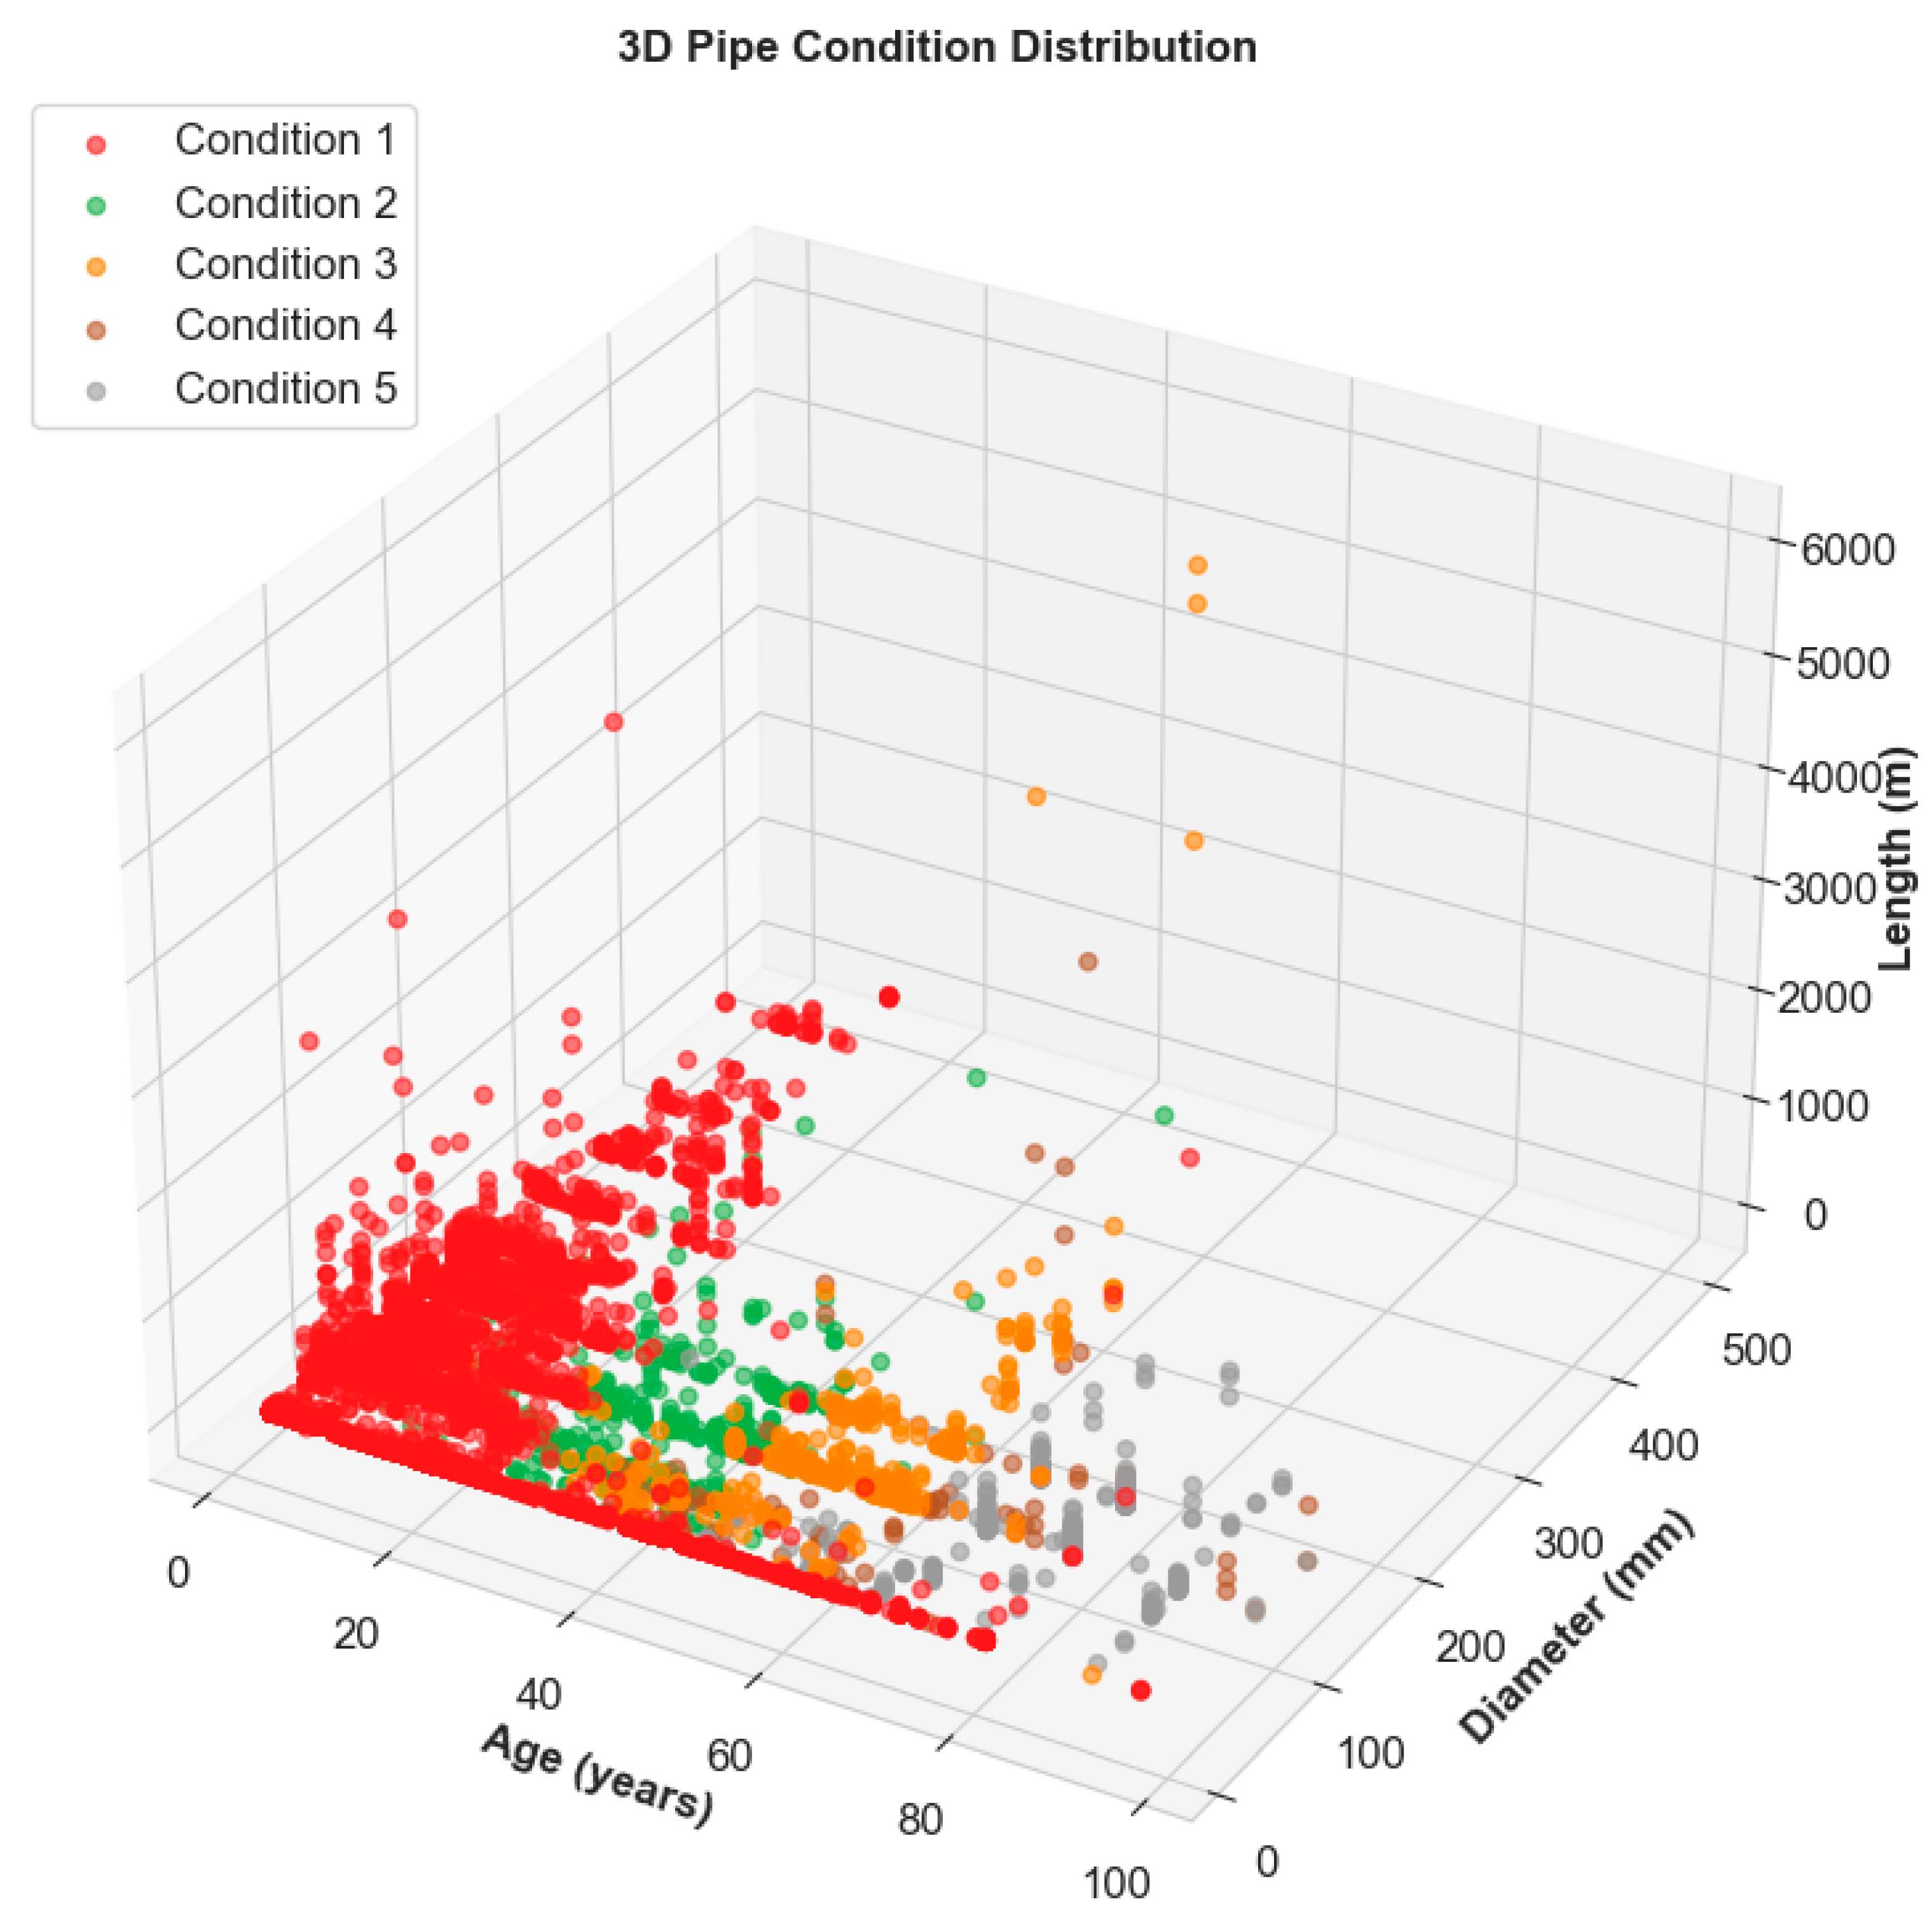
Three-dimensional visualization of the pipe condition distribution in
Figure 3 provides insights into the multifactorial nature of infrastructure deterioration across age (X), diameter (Y), and length dimensions (Z). The 3D scatter plot reveals distinct clustering patterns where Condition 1 pipes (excellent condition) dominate the lower age ranges below 20 years, while deteriorated conditions (Classes 4 and 5) appear predominantly in aging infrastructure exceeding 40–60 years. Diameter–length relationships demonstrate heterogeneous distribution across condition classes, with larger-diameter pipes showing varied condition states independent of length, suggesting that age remains the primary deterioration driver. These spatial patterns validate domain knowledge regarding infrastructure lifecycle management and provide empirical evidence for age-weighted feature importance in the subsequent machine learning pipeline, ensuring that model predictions align with established engineering deterioration principles.
The comprehensive material frequency analysis in
Figure 4, displayed on a logarithmic scale, demonstrates the hierarchical dominance of modern polymer-based materials in contemporary water infrastructure systems. Medium-Density Polyethylene (MDPE) represents the overwhelming majority of pipe installations, exceeding 4000 installations and reflecting current industry standards for durability and cost-effectiveness. Unplasticized Polyvinyl Chloride (UPVC) and standard Polyvinyl Chloride (PVC) follow as secondary materials with approximately 1500 and 1000 installations, respectively, while traditional materials, including Asbestos Cement (AC), Cast Iron (CI), and Steel (ST), demonstrate markedly lower frequencies below 100 installations each. This material distribution hierarchy validates the transition from metallic and cement-based systems to modern polymer solutions, providing essential context for material-based feature importance in deterioration prediction models.
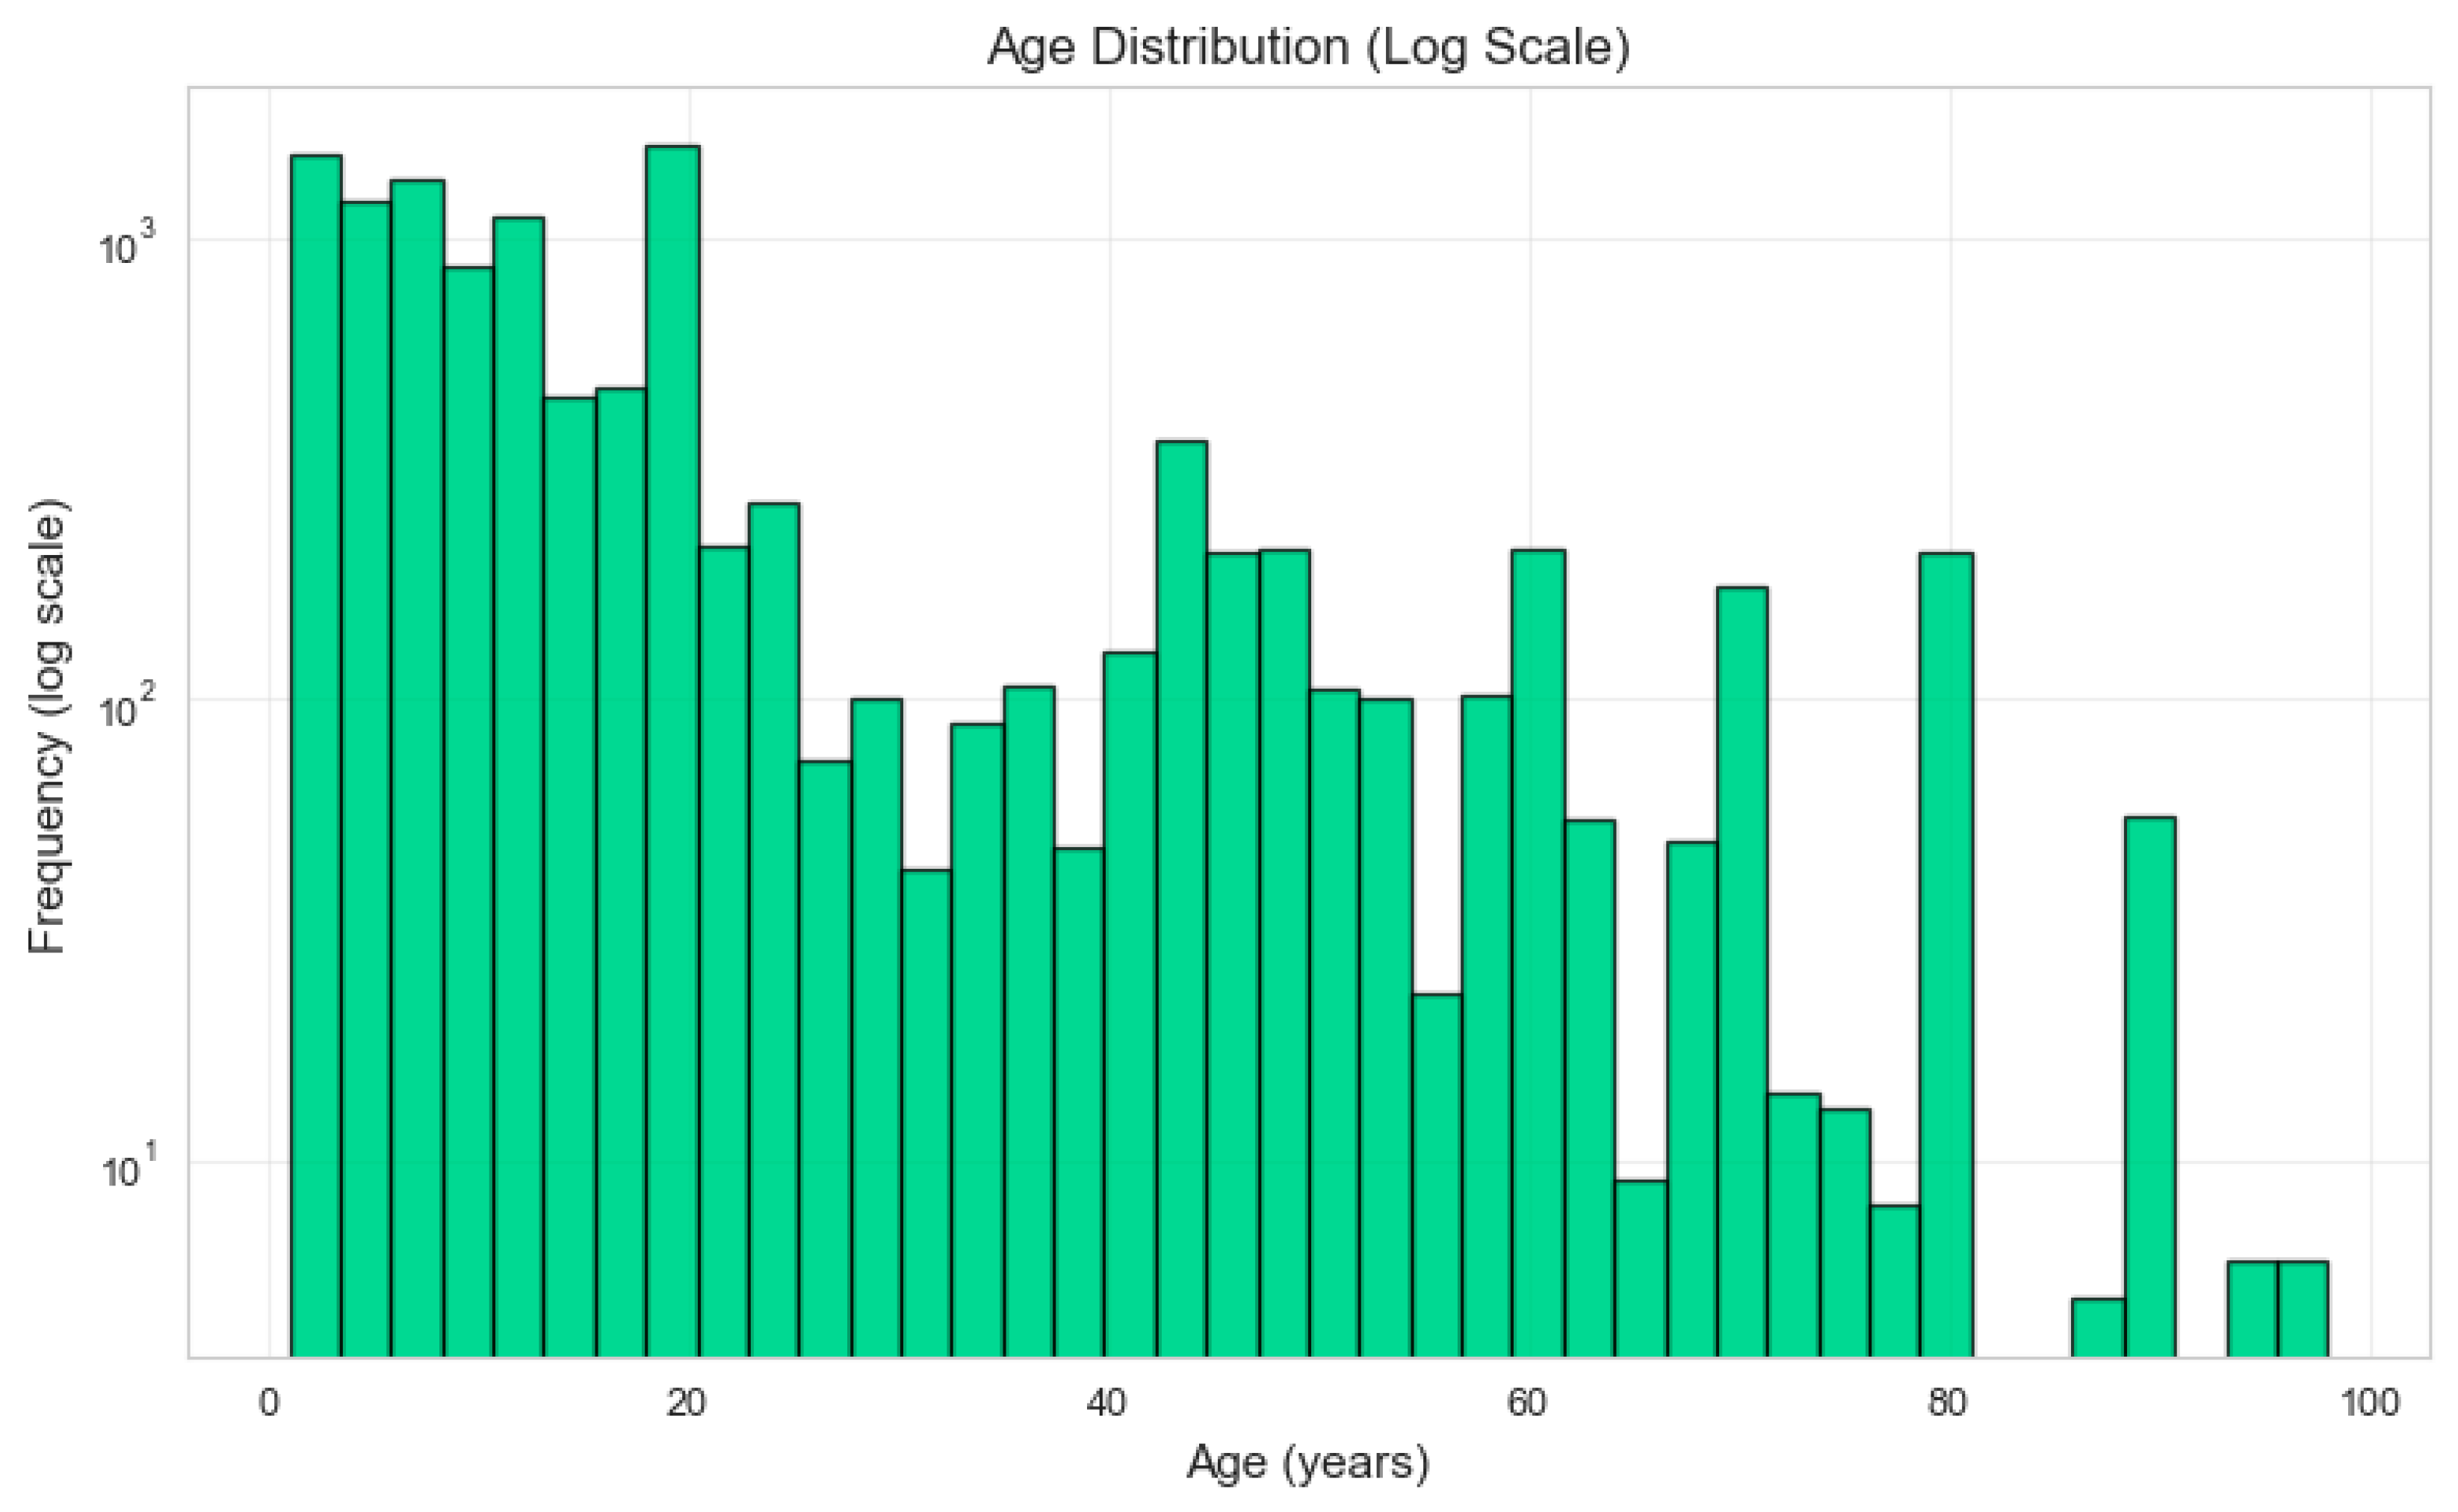
Visualization of age distribution in
Figure 5 reveals insights into infrastructure lifecycle patterns across the urban water network. The age histogram demonstrates a characteristic bimodal distribution with peak frequencies concentrated in the 0–20 year range, indicating substantial recent infrastructure investment and renewal activities. A secondary frequency peak emerges around 40–50 years, reflecting historical construction periods, while the logarithmic scale effectively captures the exponential decay in pipe counts for assets exceeding 60 years. This age profile suggests a system undergoing modernization, with the majority of infrastructure representing contemporary installation practices, while legacy components provide critical insights into long-term deterioration patterns for predictive modeling applications.
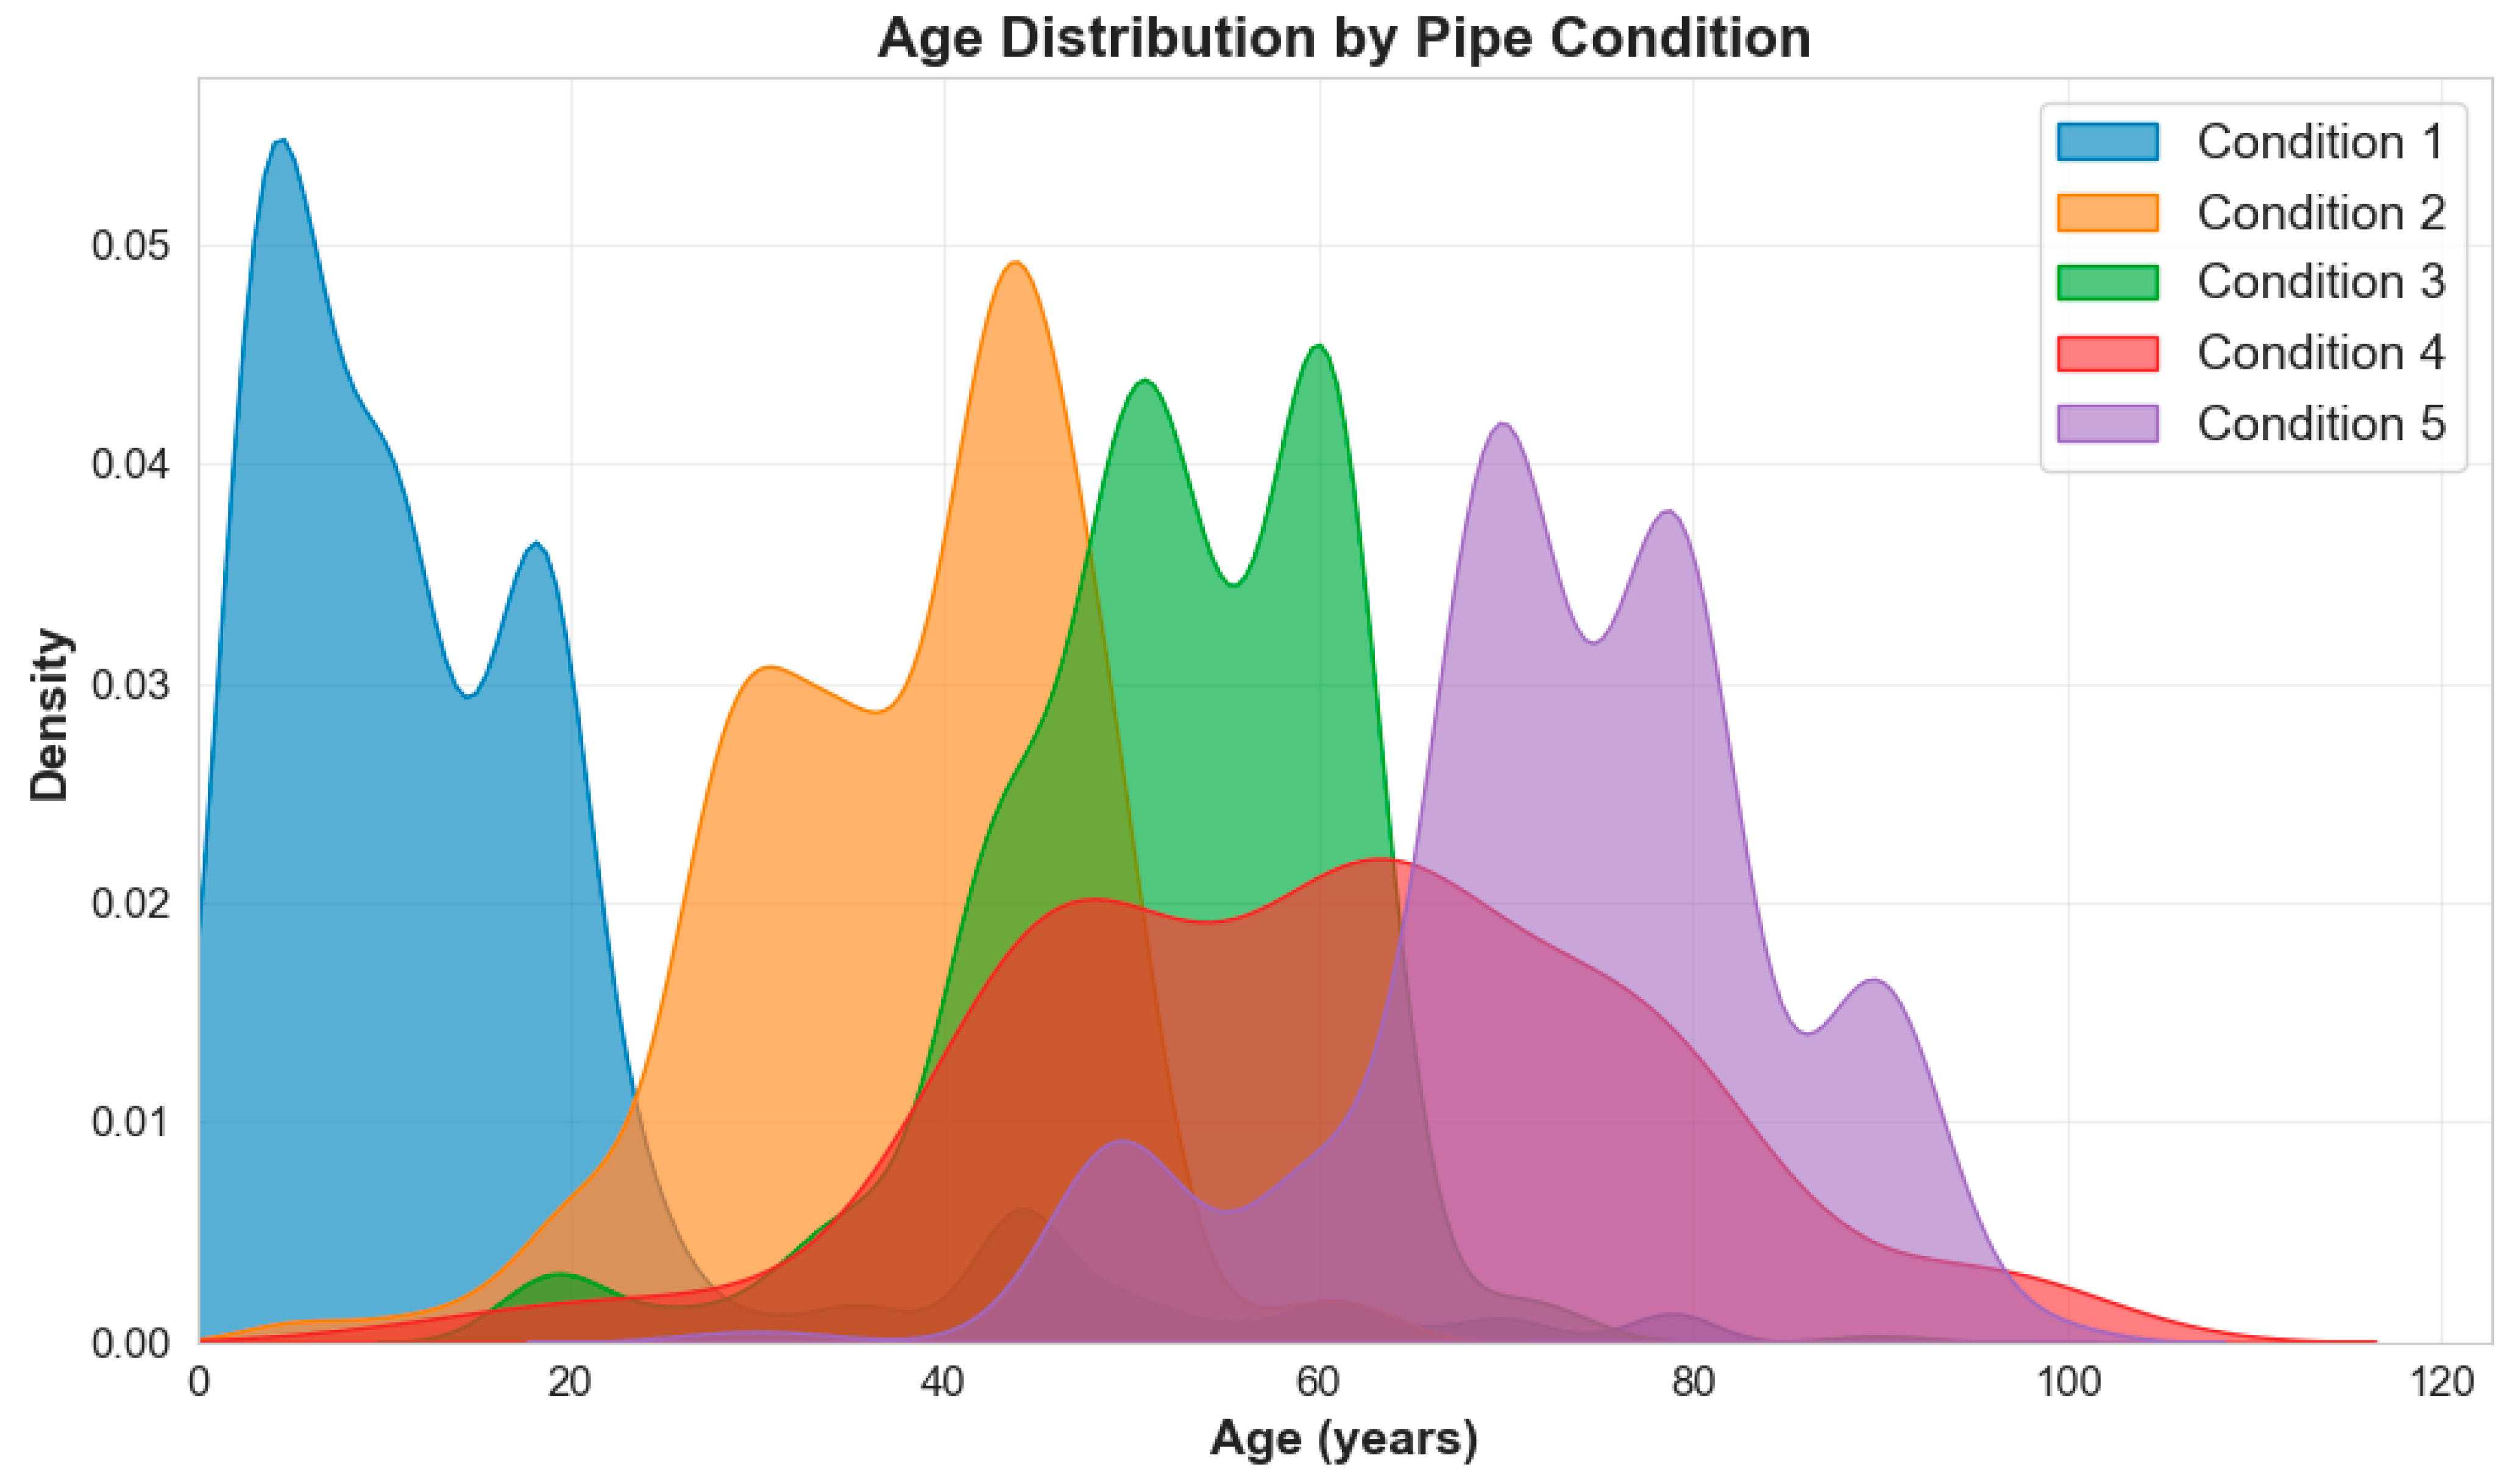
Advancing from material composition analysis, the kernel density estimation in
Figure 6 reveals critical age-condition relationships that validate deterioration patterns. Condition 1 pipes exhibit sharp density peaks at younger ages (below 20 years), establishing excellent condition ratings for newly installed infrastructure. Conditions 2, 3, and 4 demonstrate sequential progression with density peaks at approximately 40, 50, and 50 years, respectively, indicating gradual deterioration patterns through mid-life infrastructure phases. Most significantly, Condition 5 shows pronounced density concentration beyond 65 years, establishing age as the primary deterioration predictor and confirming time-dependent infrastructure degradation patterns essential for predictive modeling.
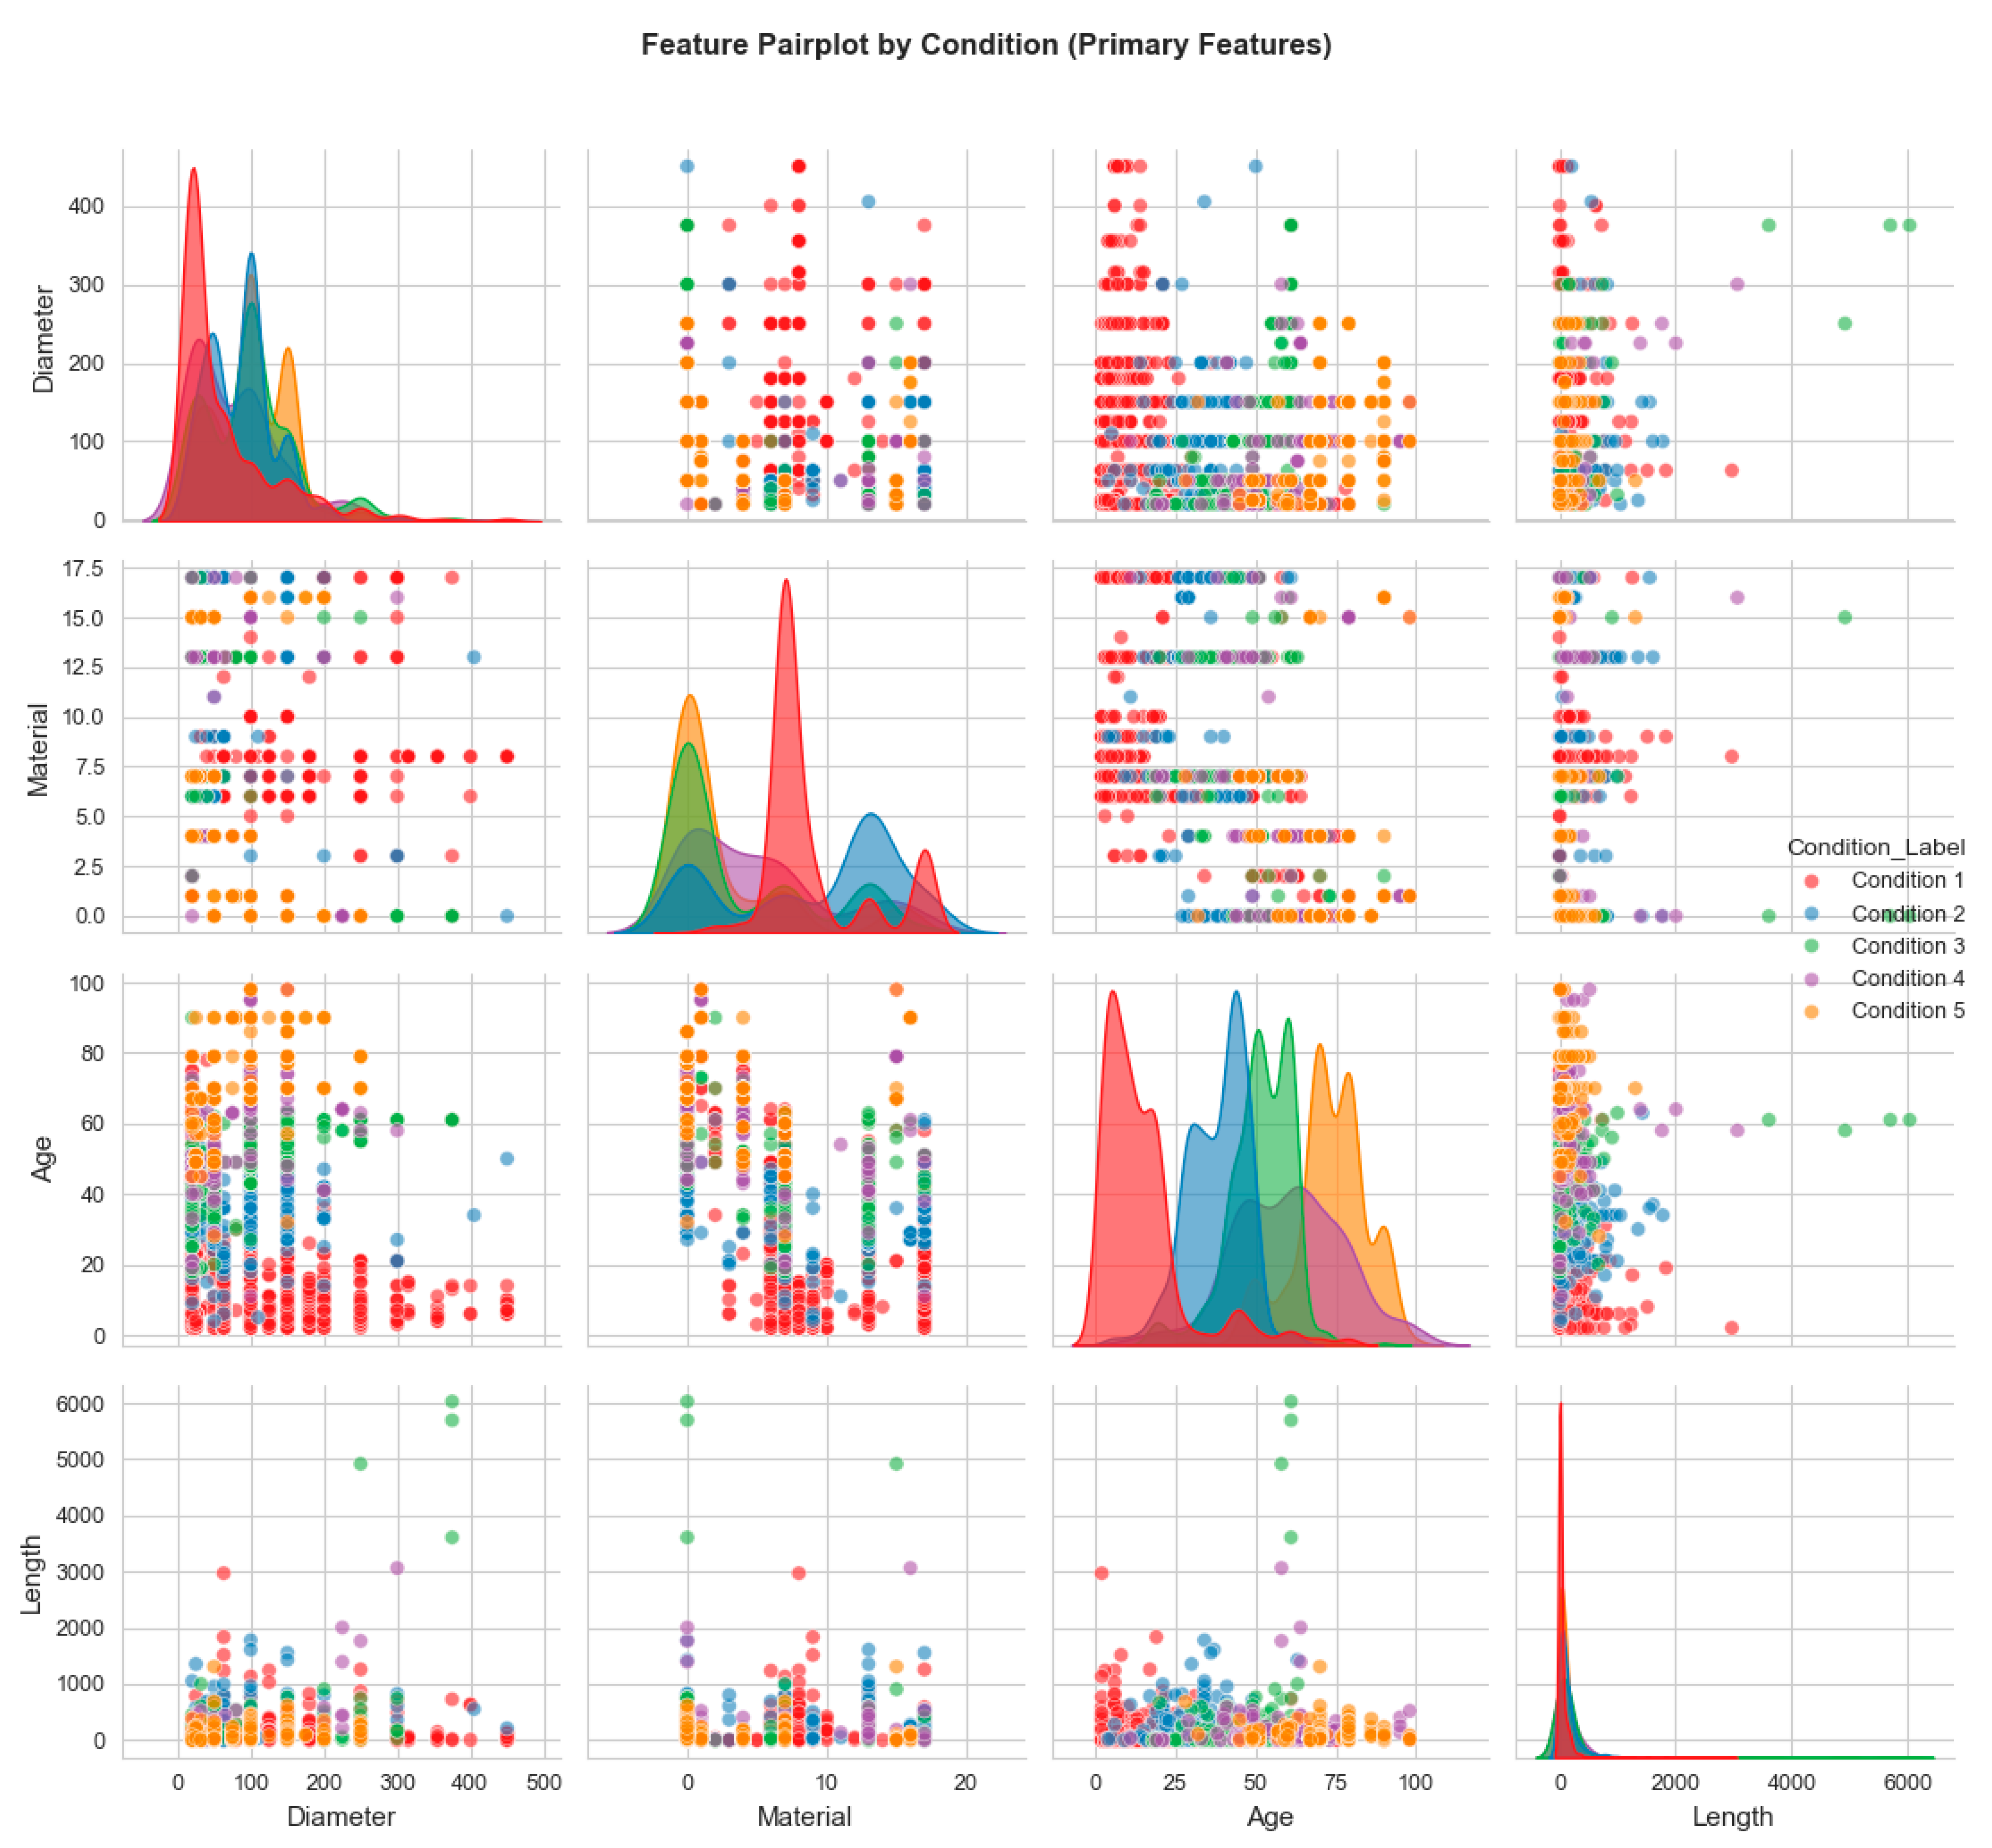
The comprehensive pairplot in
Figure 7 reveals multivariate relationships across the four primary features (Diameter, Material, Age, Length), colored by condition class. This analysis demonstrates the complexity of condition prediction, with substantial overlap between condition categories across most feature combinations, particularly evident in the scatter plot matrices. The diagonal density plots reveal distinct age-based separation patterns, where Condition 1 concentrates in younger age ranges while Conditions 4 and 5 extend into older infrastructure. However, diameter-length relationships show inter-condition mixing, highlighting the multifactorial nature of infrastructure deterioration and justifying the need for ensemble learning approaches to capture these complex, non-linear feature interactions.
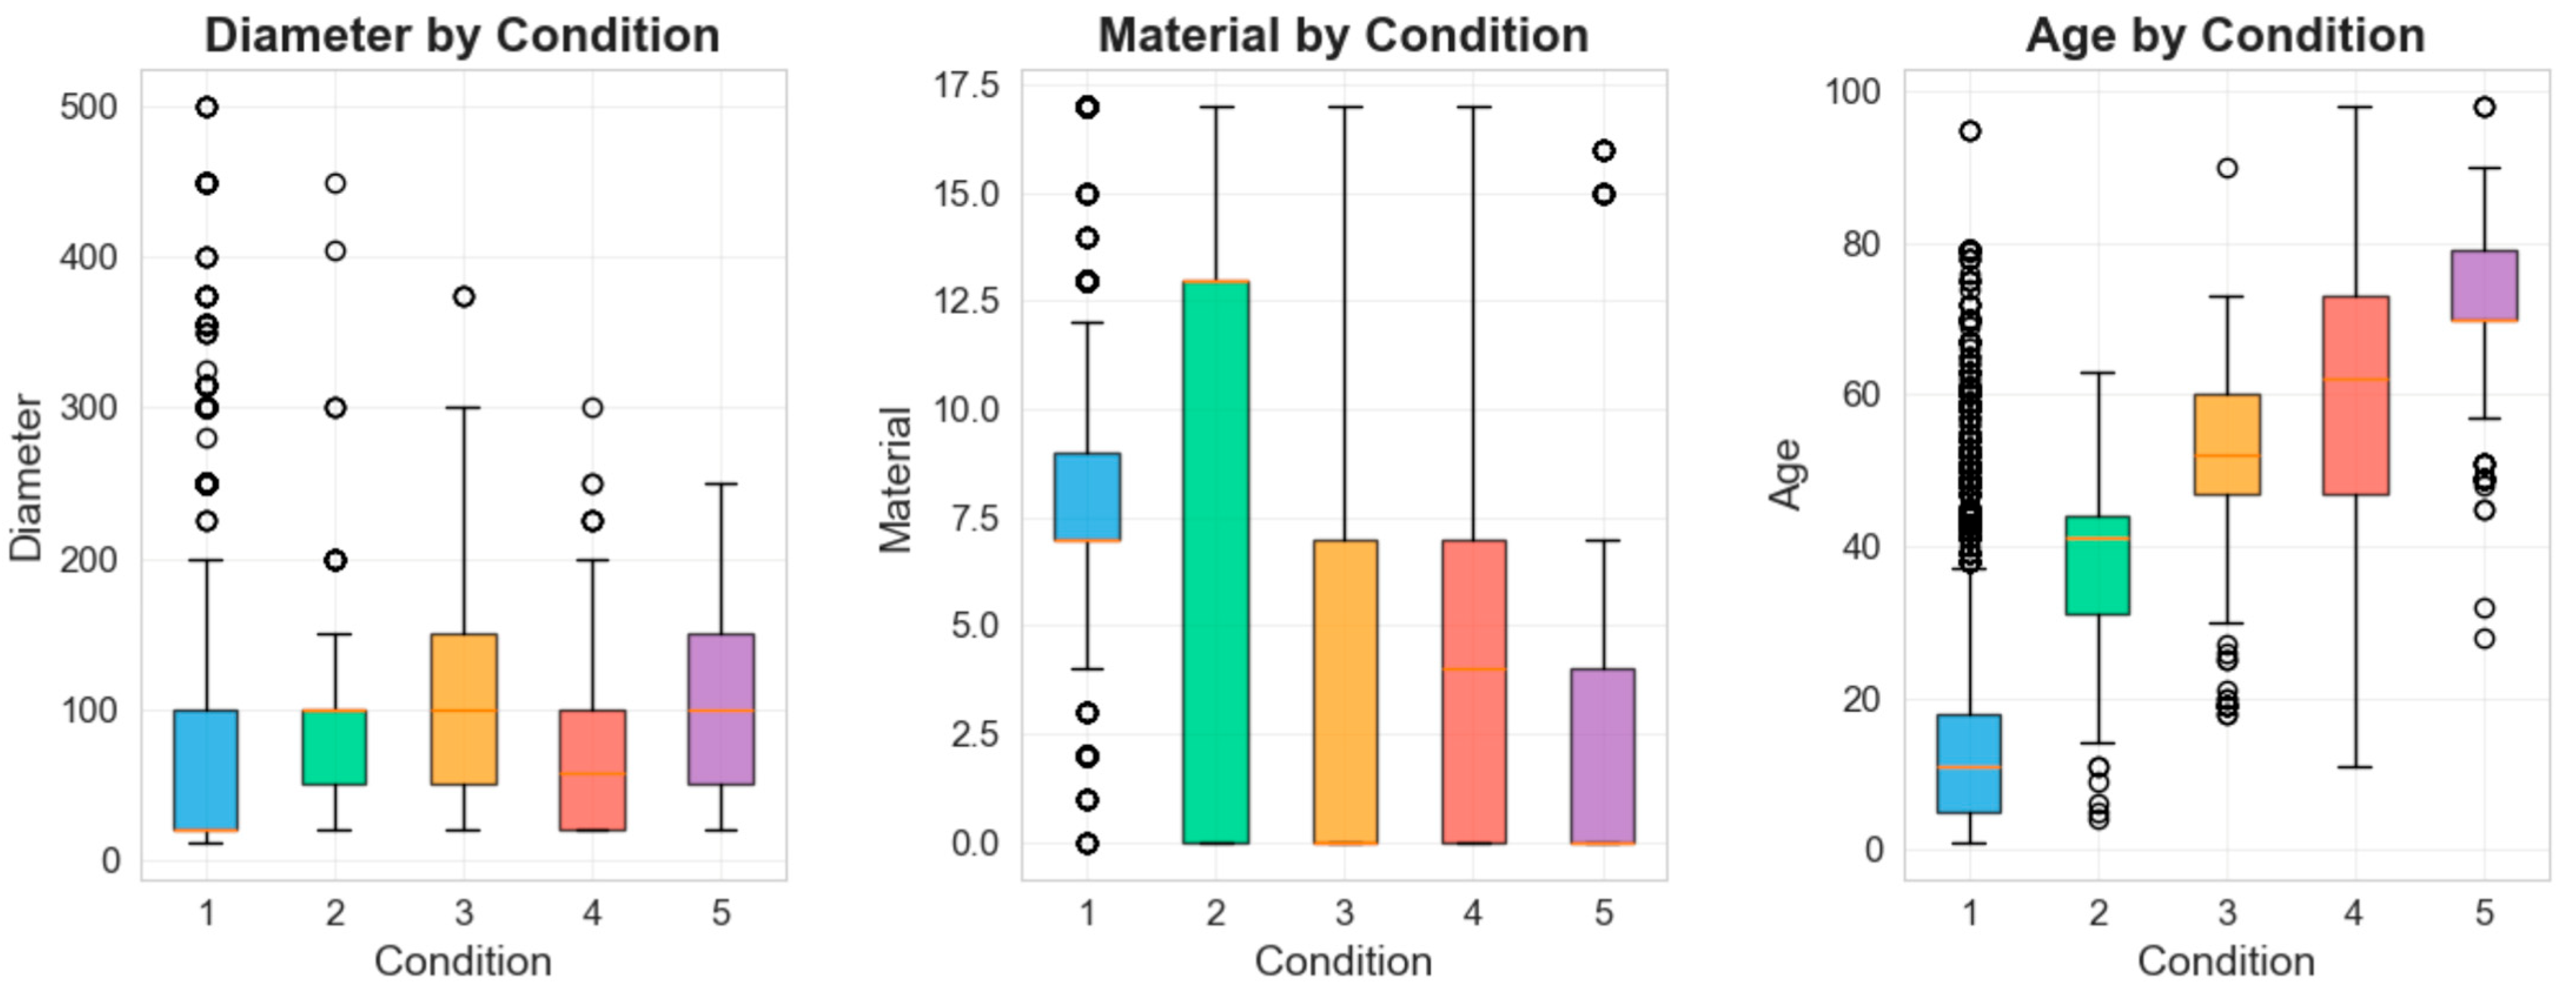
Boxplot analysis in
Figure 8 reveals distinct patterns validating infrastructure parameters for condition assessment. Age distribution demonstrates the strongest discriminative power, with excellent condition pipes exhibiting younger median ages and progressively increasing values through deteriorated conditions, establishing age as the primary indicator. Diameter distributions show consistent medians but increasing variability in deteriorated conditions, suggesting extreme values contribute to degradation. Material distributions reveal heterogeneous patterns with certain types associated with specific deterioration pathways, confirming the multifactorial nature requiring sophisticated algorithmic treatment.
5. Results
The hybrid machine learning meta-model developed for urban underground pipe condition assessment was evaluated using a comprehensive dataset of 11,544 water pipe records, strategically partitioned into 9235 training samples (80%) and 2309 testing samples (20%) using stratified sampling to maintain class distribution. The dataset encompasses seven key features, diameter, material, age, length, thaw index, soil properties, and slope, with condition ratings ranging from 1 (excellent) to 5 (poor). This section presents the detailed analysis results, including exploratory data analysis, feature correlations, distribution patterns, model performance comparisons, and the effectiveness of the proposed stacking meta-model architecture. The results demonstrate the superiority of the neural network-based ensemble approach over individual algorithms and provide insights into age as the most influential factor affecting pipe deterioration, followed by material composition and infrastructure geometry parameters.
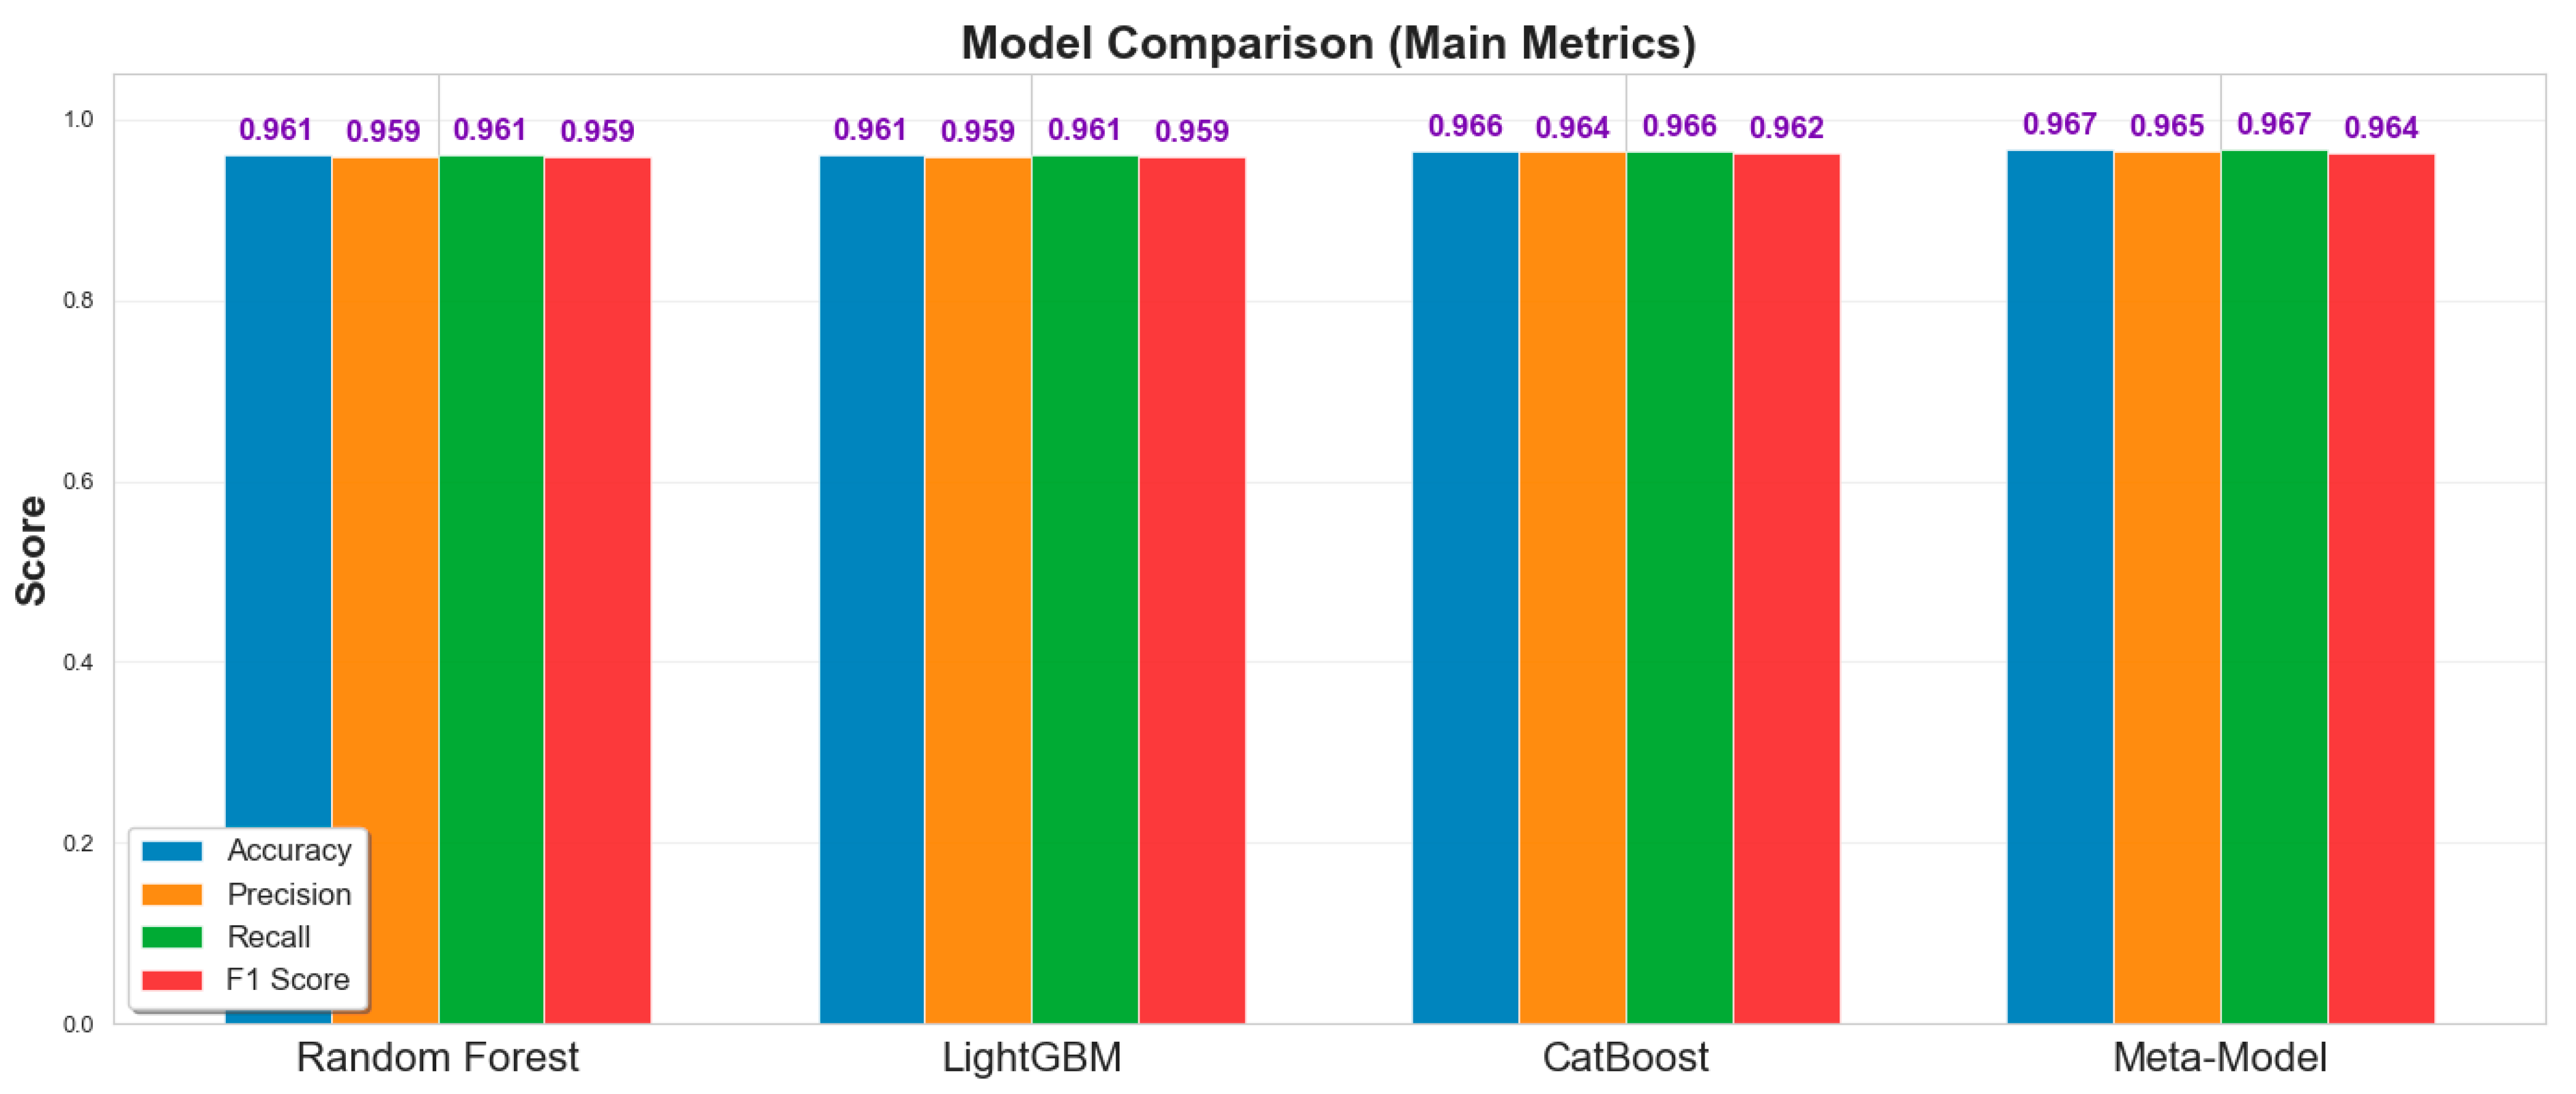
The comparative performance analysis in
Figure 9 demonstrates the superiority of the meta-learner across all evaluation metrics. The stacking ensemble achieves an accuracy of 96.67%, representing an improvement over individual base models: Random Forest (96.10%), LightGBM (96.15%), and CatBoost (96.58%). The meta-model demonstrates consistently high performance with precision (96.47%), recall (96.67%), and F1-score (96.38%), indicating balanced predictive capability across all condition classes without bias toward dominant categories.
The performance enhancement validates the effectiveness of the hybrid meta-learning approach, where the meta-learner successfully integrates diverse algorithmic strengths while mitigating individual model limitations. The marginal but consistent improvements across all metrics demonstrate that the ensemble captures complex feature interactions, particularly in distinguishing intermediate condition classes where infrastructure deterioration patterns exhibit subtle variations.
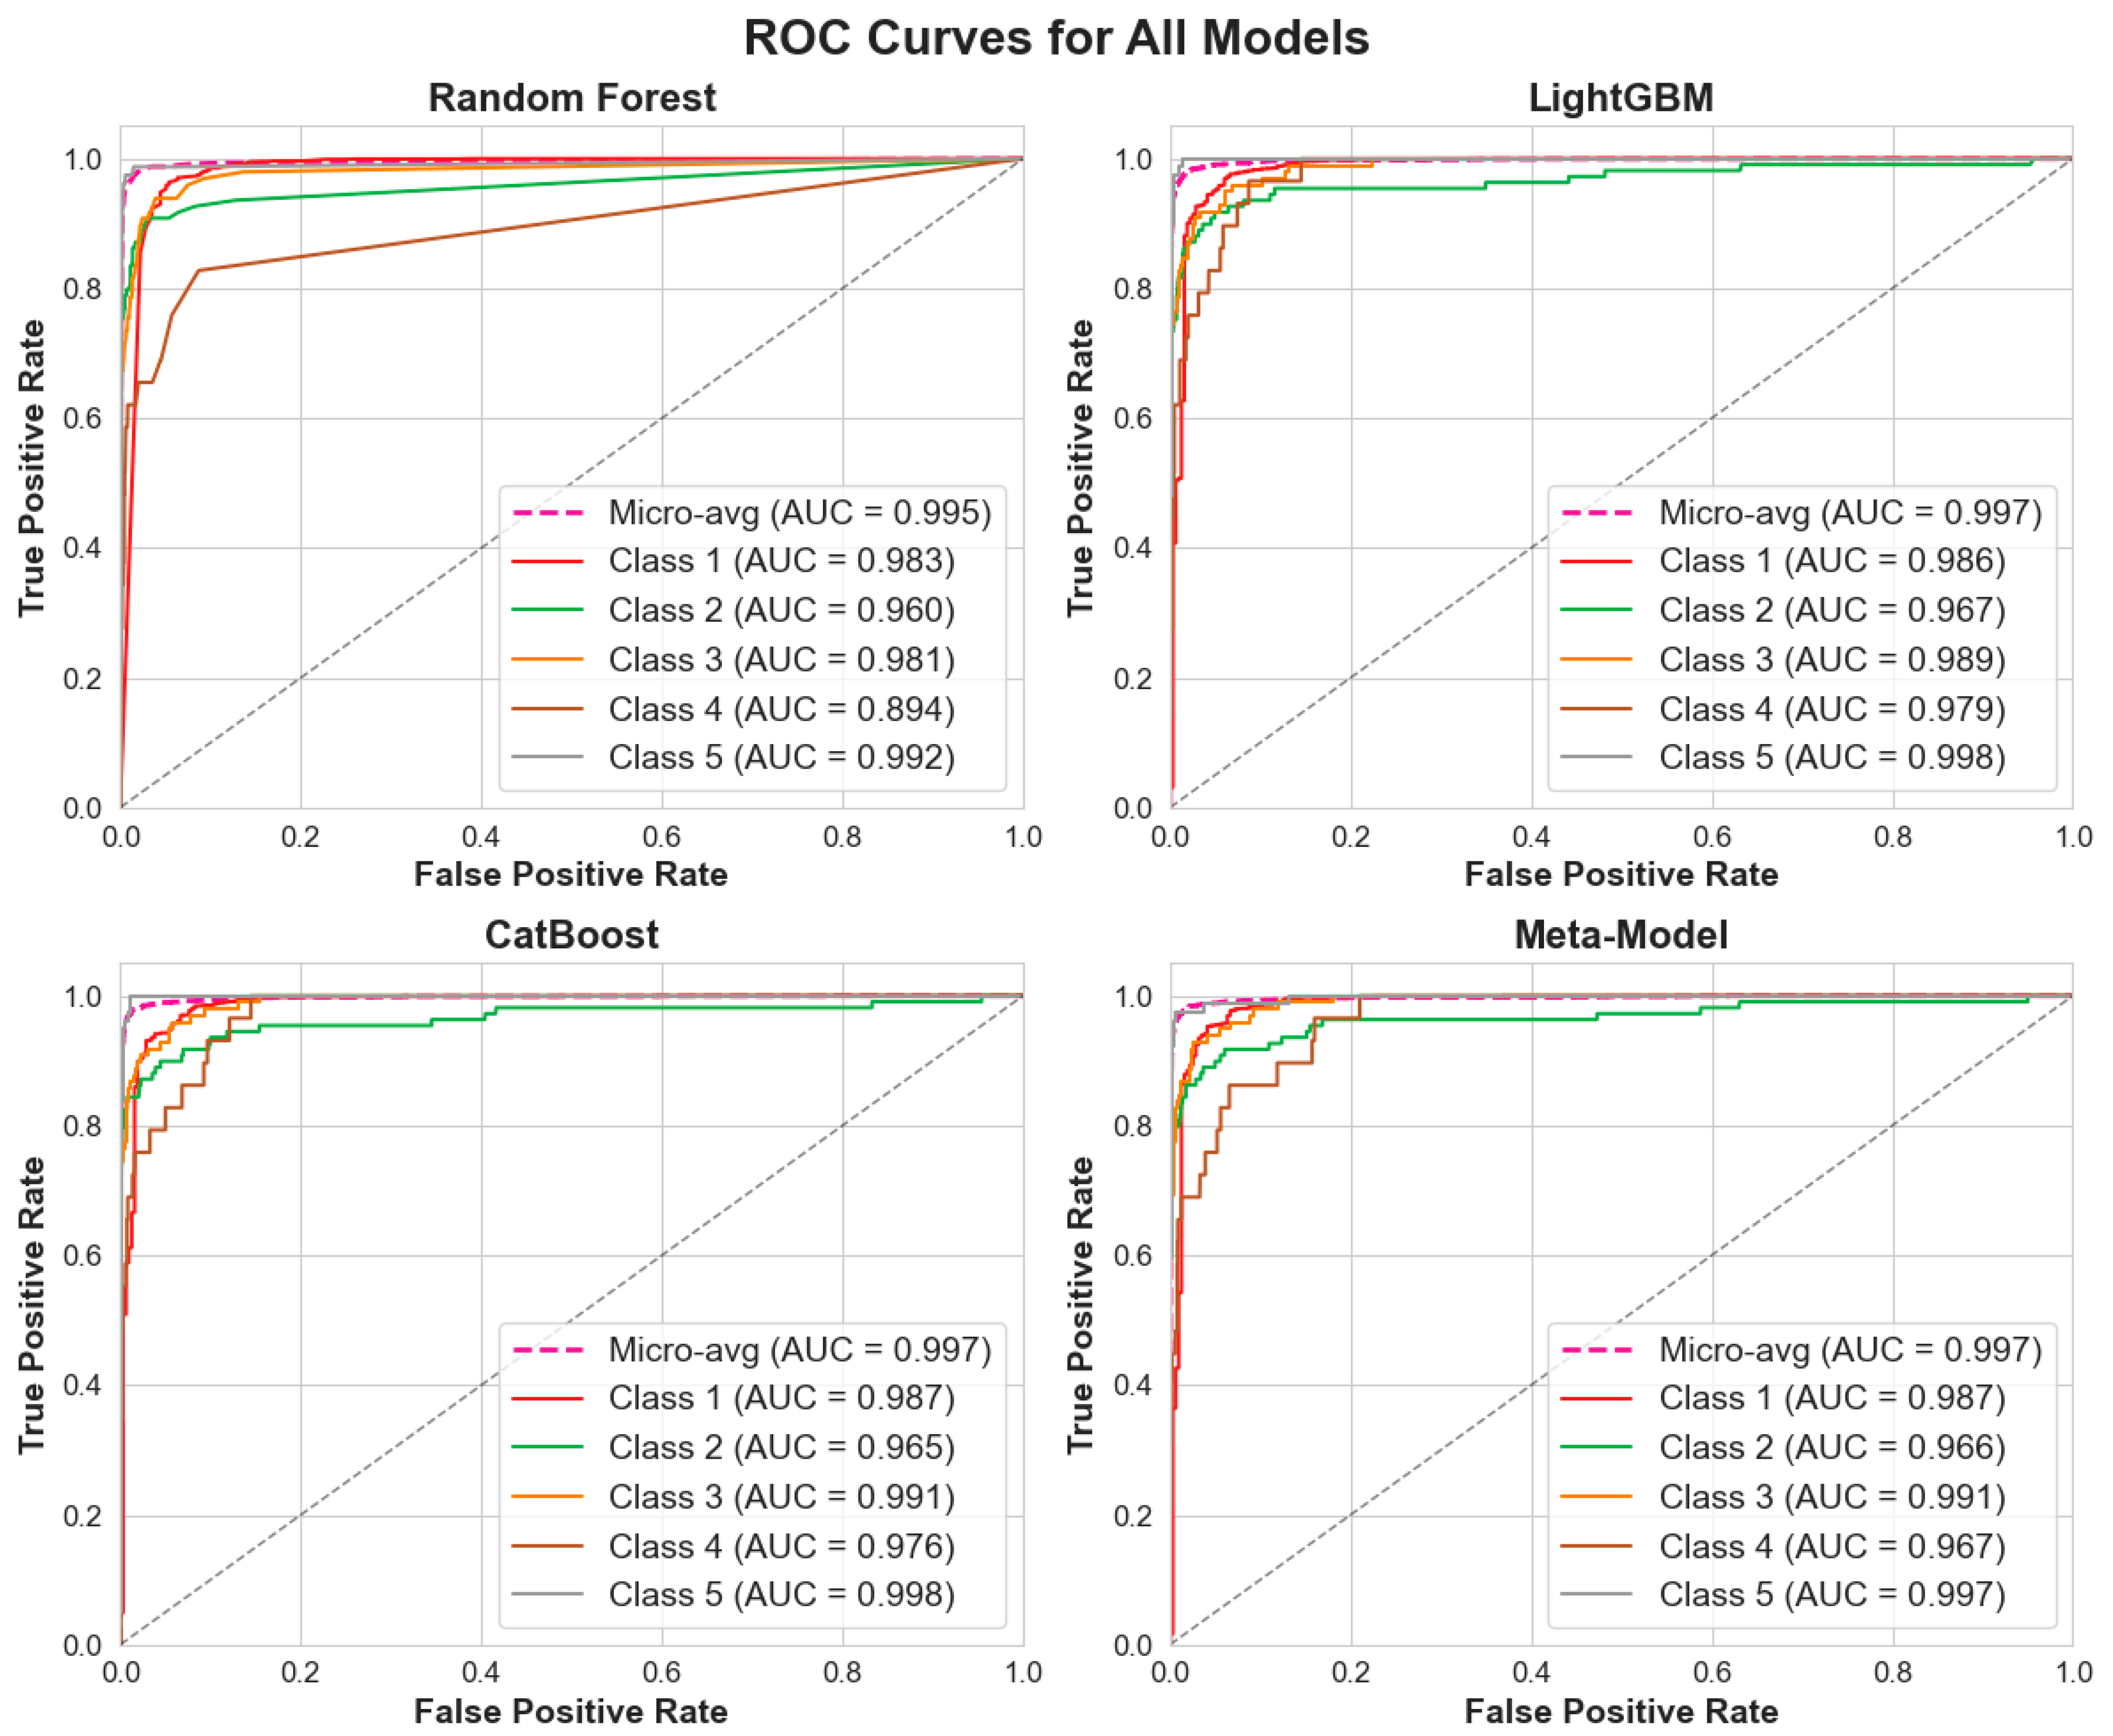
The receiver operating characteristic curves in
Figure 10 reveal discriminative performance across all models and condition classes, with micro-averaged AUC values consistently exceeding 0.997 for the meta-model. Individual class performance demonstrates separation capability, with Condition 1 (excellent) and Condition 5 (poor) achieving near-perfect classification accuracy, while intermediate conditions (2–4) maintain robust AUC scores above 0.95, indicating reliable multi-class discrimination even for subtle deterioration states.
The ROC analysis validates the meta-model’s capacity to maintain high sensitivity and specificity simultaneously across all condition categories. The consistently superior performance of the stacking ensemble compared to individual base learners demonstrates enhanced robustness against false positive and false negative classifications, critical for infrastructure management decisions where misclassification costs can impact maintenance resource allocation and system reliability.
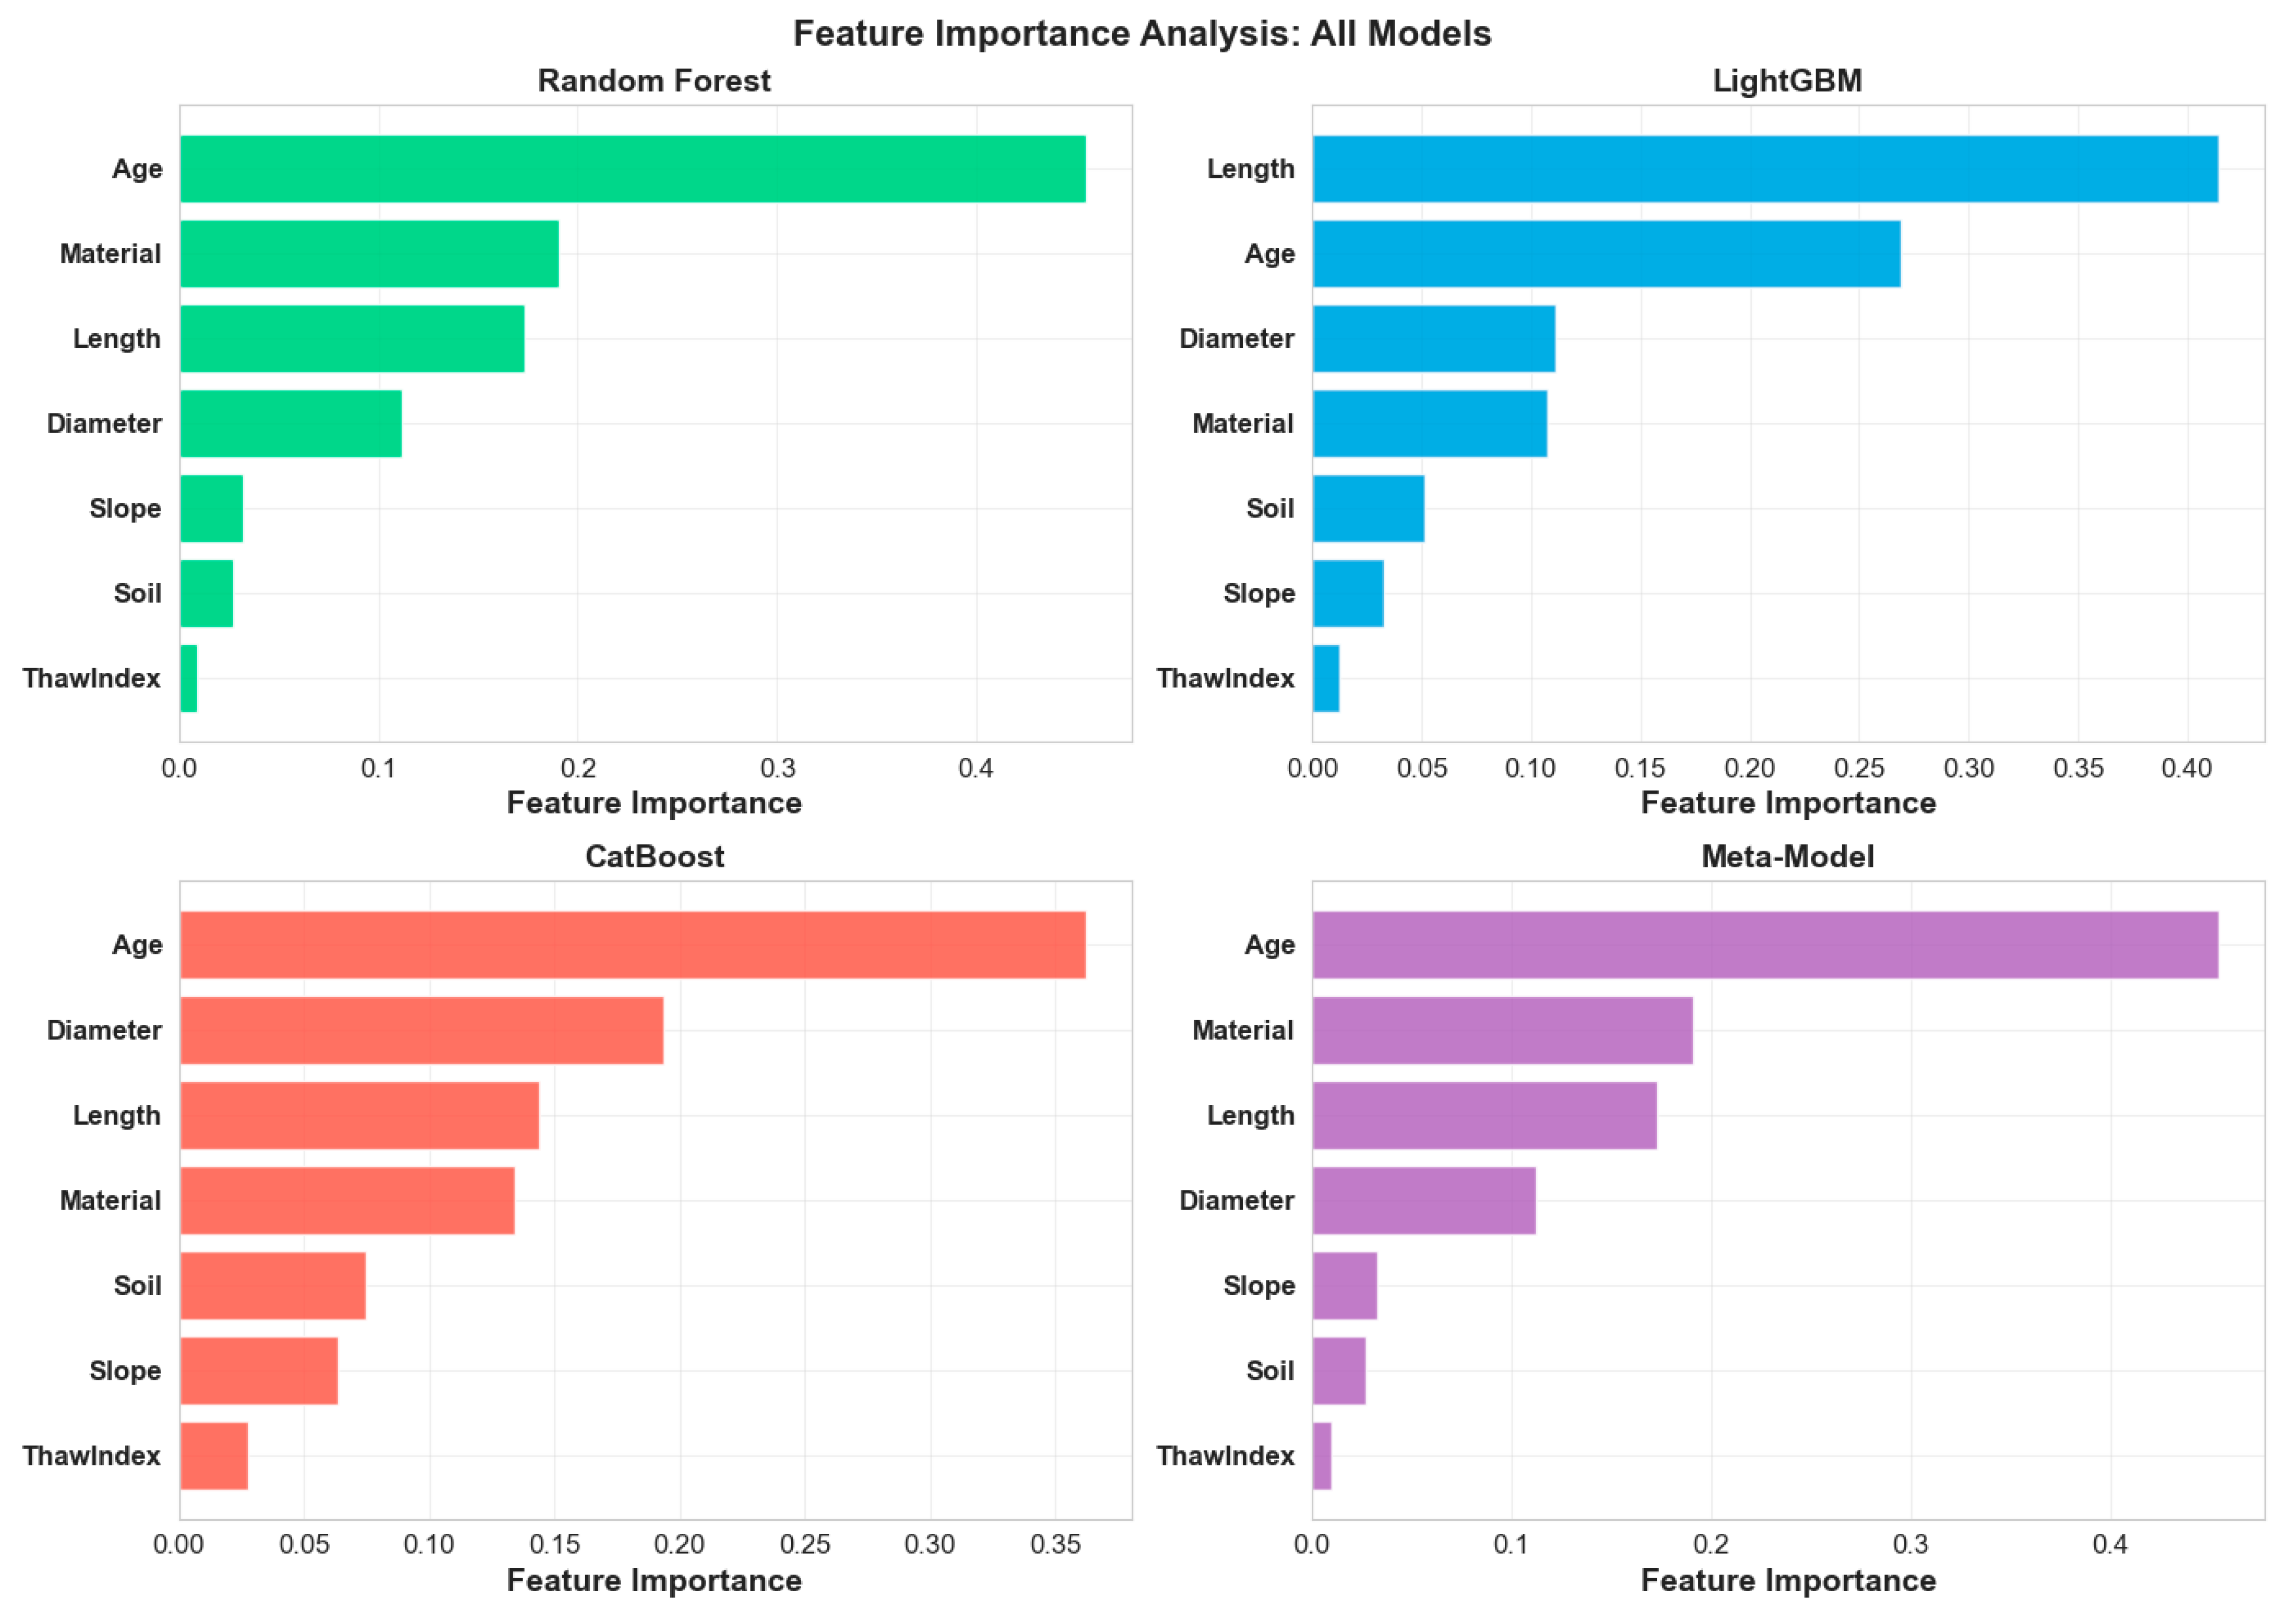
Feature importance analysis across all models consistently in
Figure 11 identifies age as the dominant predictor, contributing approximately 38.5% of the predictive power, followed by length (22.6%), material (15.6%), and diameter (13.2%). However, notable algorithmic variations emerge in feature weighting patterns, reflecting distinct model architectures and learning mechanisms. Random Forest exhibits balanced importance distribution through its ensemble of decision trees, while LightGBM shows enhanced sensitivity to age-related patterns due to its gradient boosting optimization that iteratively focuses on difficult cases where temporal deterioration is most pronounced.
CatBoost demonstrates unique material importance elevation compared to other models, attributed to its specialized categorical feature handling algorithms that better capture material-specific deterioration pathways without extensive preprocessing. The meta-model shows intermediate importance patterns that synthesize individual model strengths while maintaining the established hierarchical ranking. These algorithmic differences highlight complementary learning approaches: Random Forest’s random subspace sampling captures diverse feature interactions, LightGBM’s gradient-based optimization emphasizes age-related patterns, and CatBoost’s categorical handling enhances material discrimination, collectively justifying the ensemble approach where diverse algorithmic perspectives improve overall predictive robustness.
Despite these model-specific variations, the convergent identification of age as the primary predictor across all algorithms validates the robustness of this finding and demonstrates that temporal deterioration represents the fundamental physical process underlying infrastructure condition assessment. The relatively balanced contribution of secondary features (approximately 60% combined) supports the multi-factorial modeling approach, indicating that comprehensive condition assessment requires sophisticated integration of temporal, physical, and environmental variables through diverse algorithmic lenses.
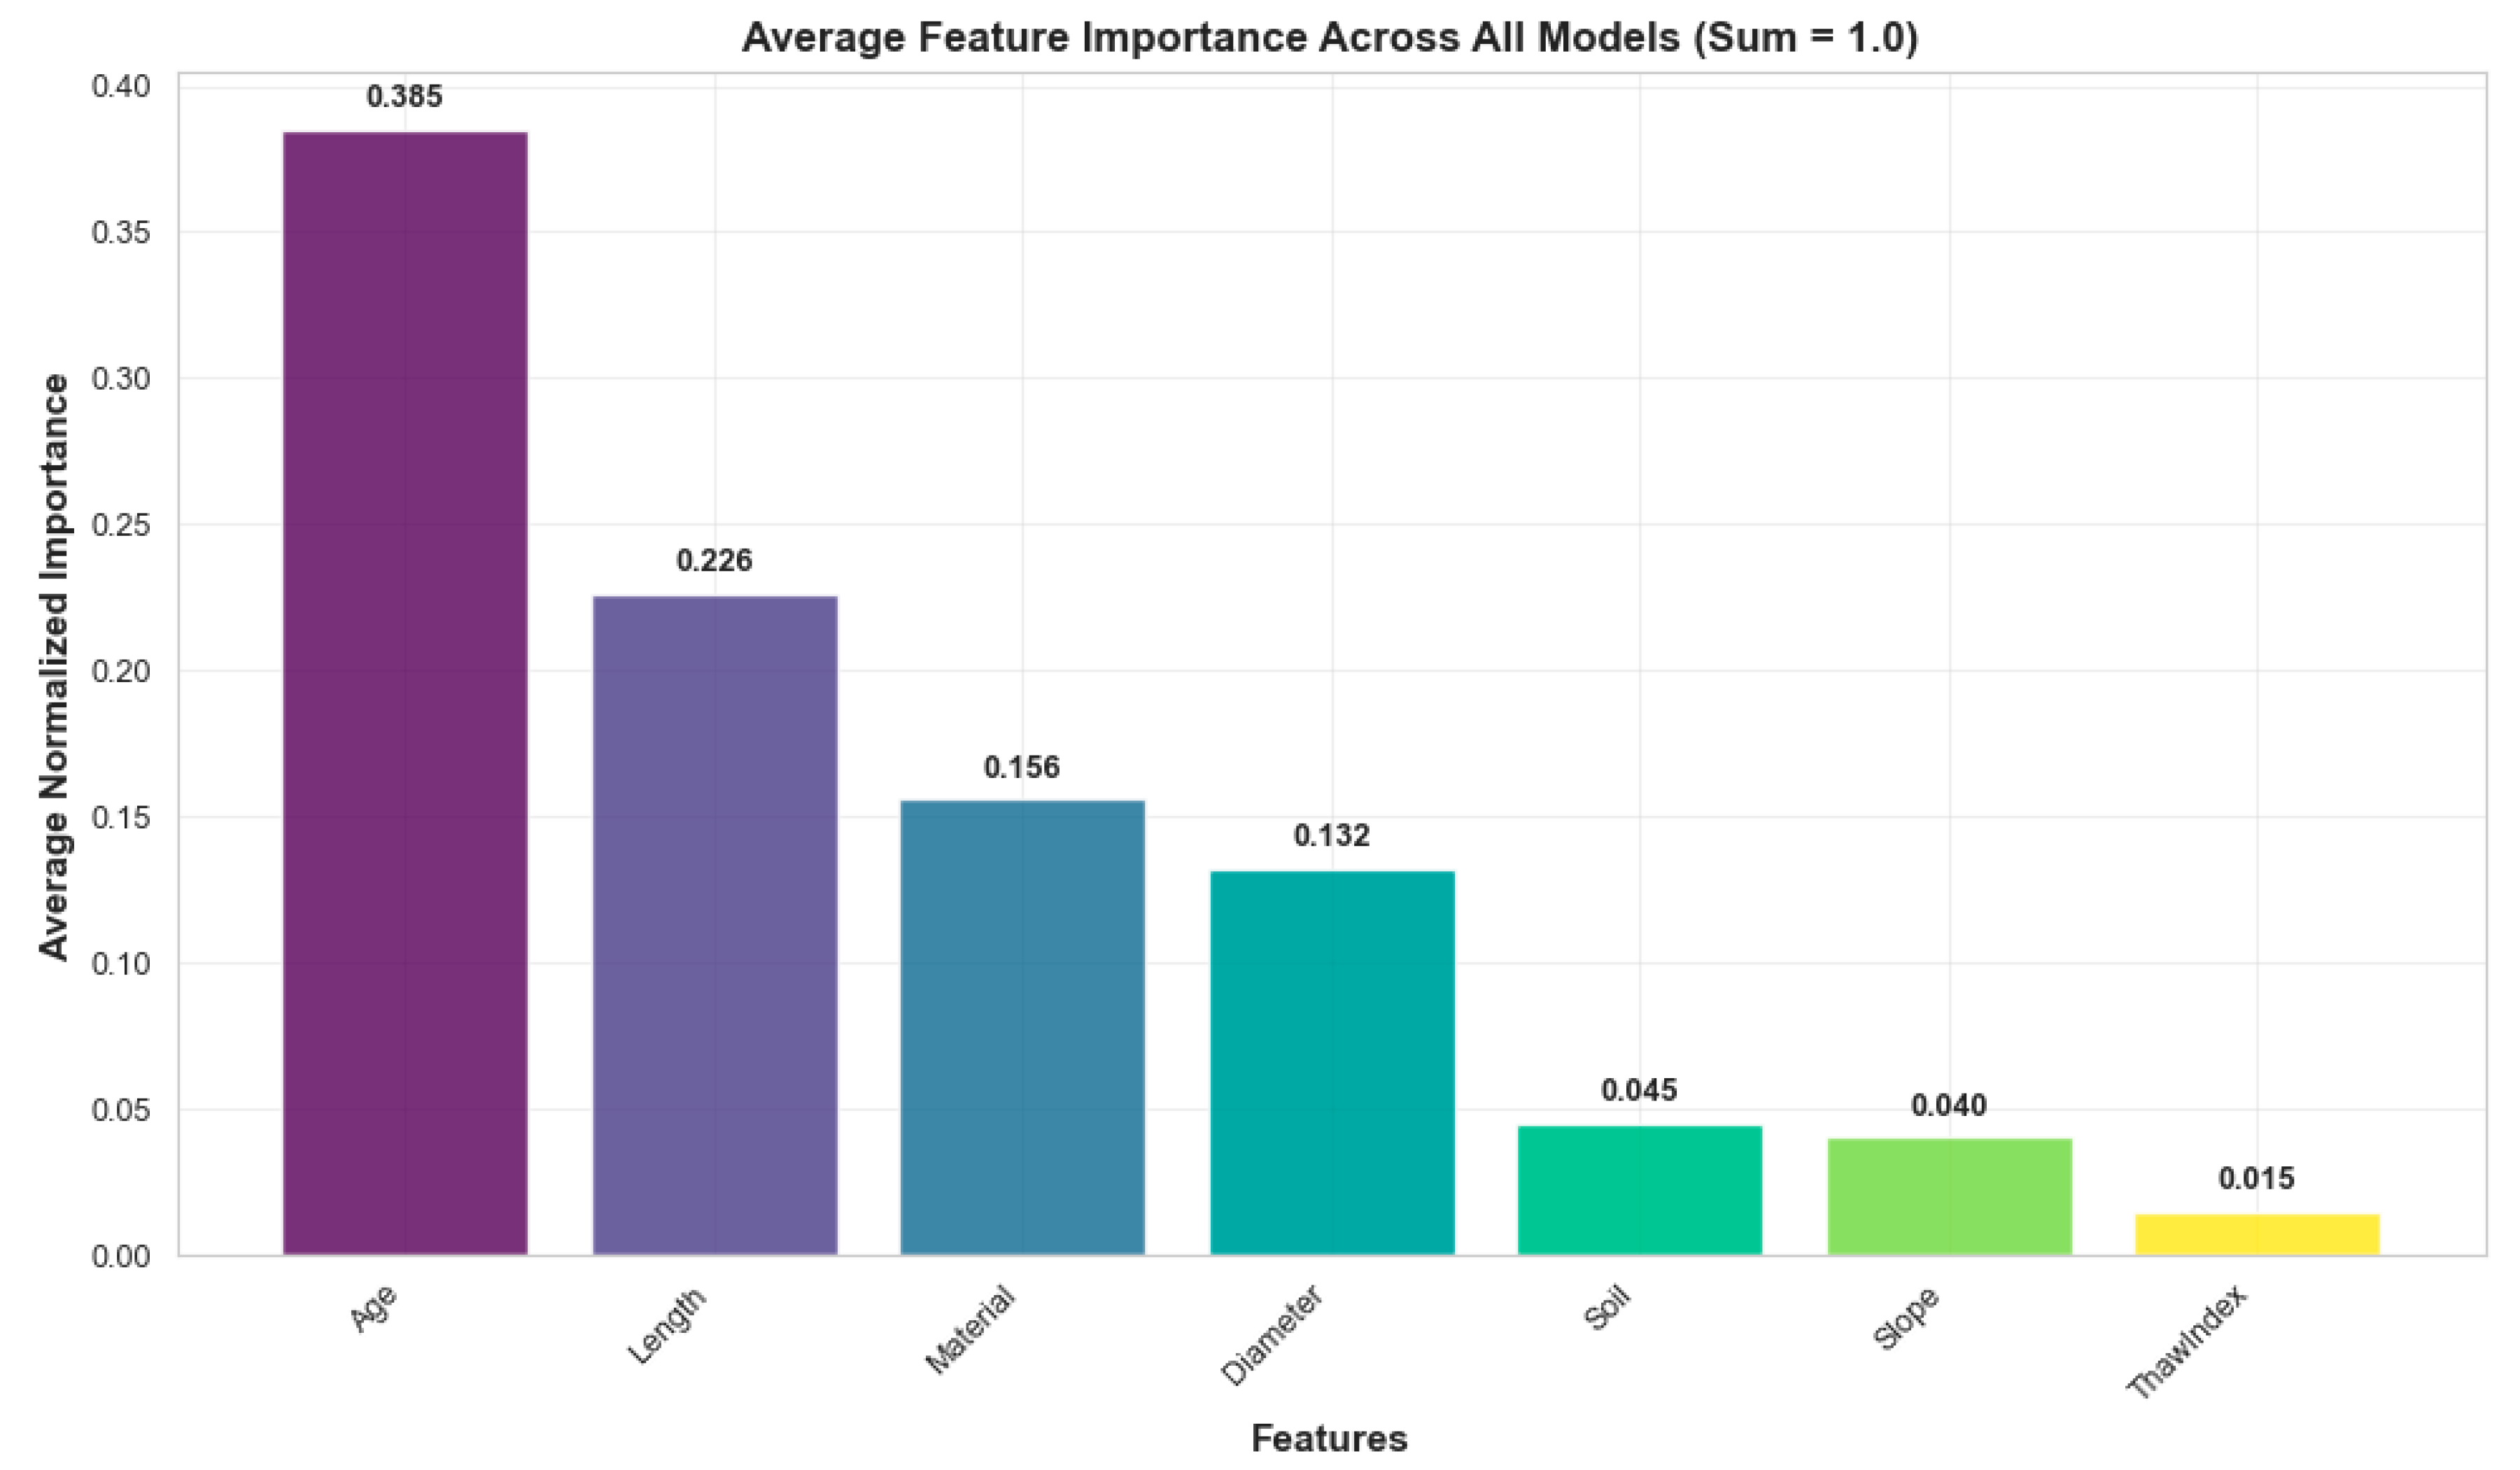
The consolidated feature importance ranking in
Figure 12 confirms age as the predominant condition predictor with a normalized importance of 0.385, establishing temporal factors as the primary deterioration driver across all modeling approaches. Secondary features demonstrate meaningful but reduced contributions—length (0.226), material (0.156), and diameter (0.132)—while environmental factors (thaw index, soil, slope) provide supplementary predictive value, collectively accounting for the remaining variance in condition assessment.
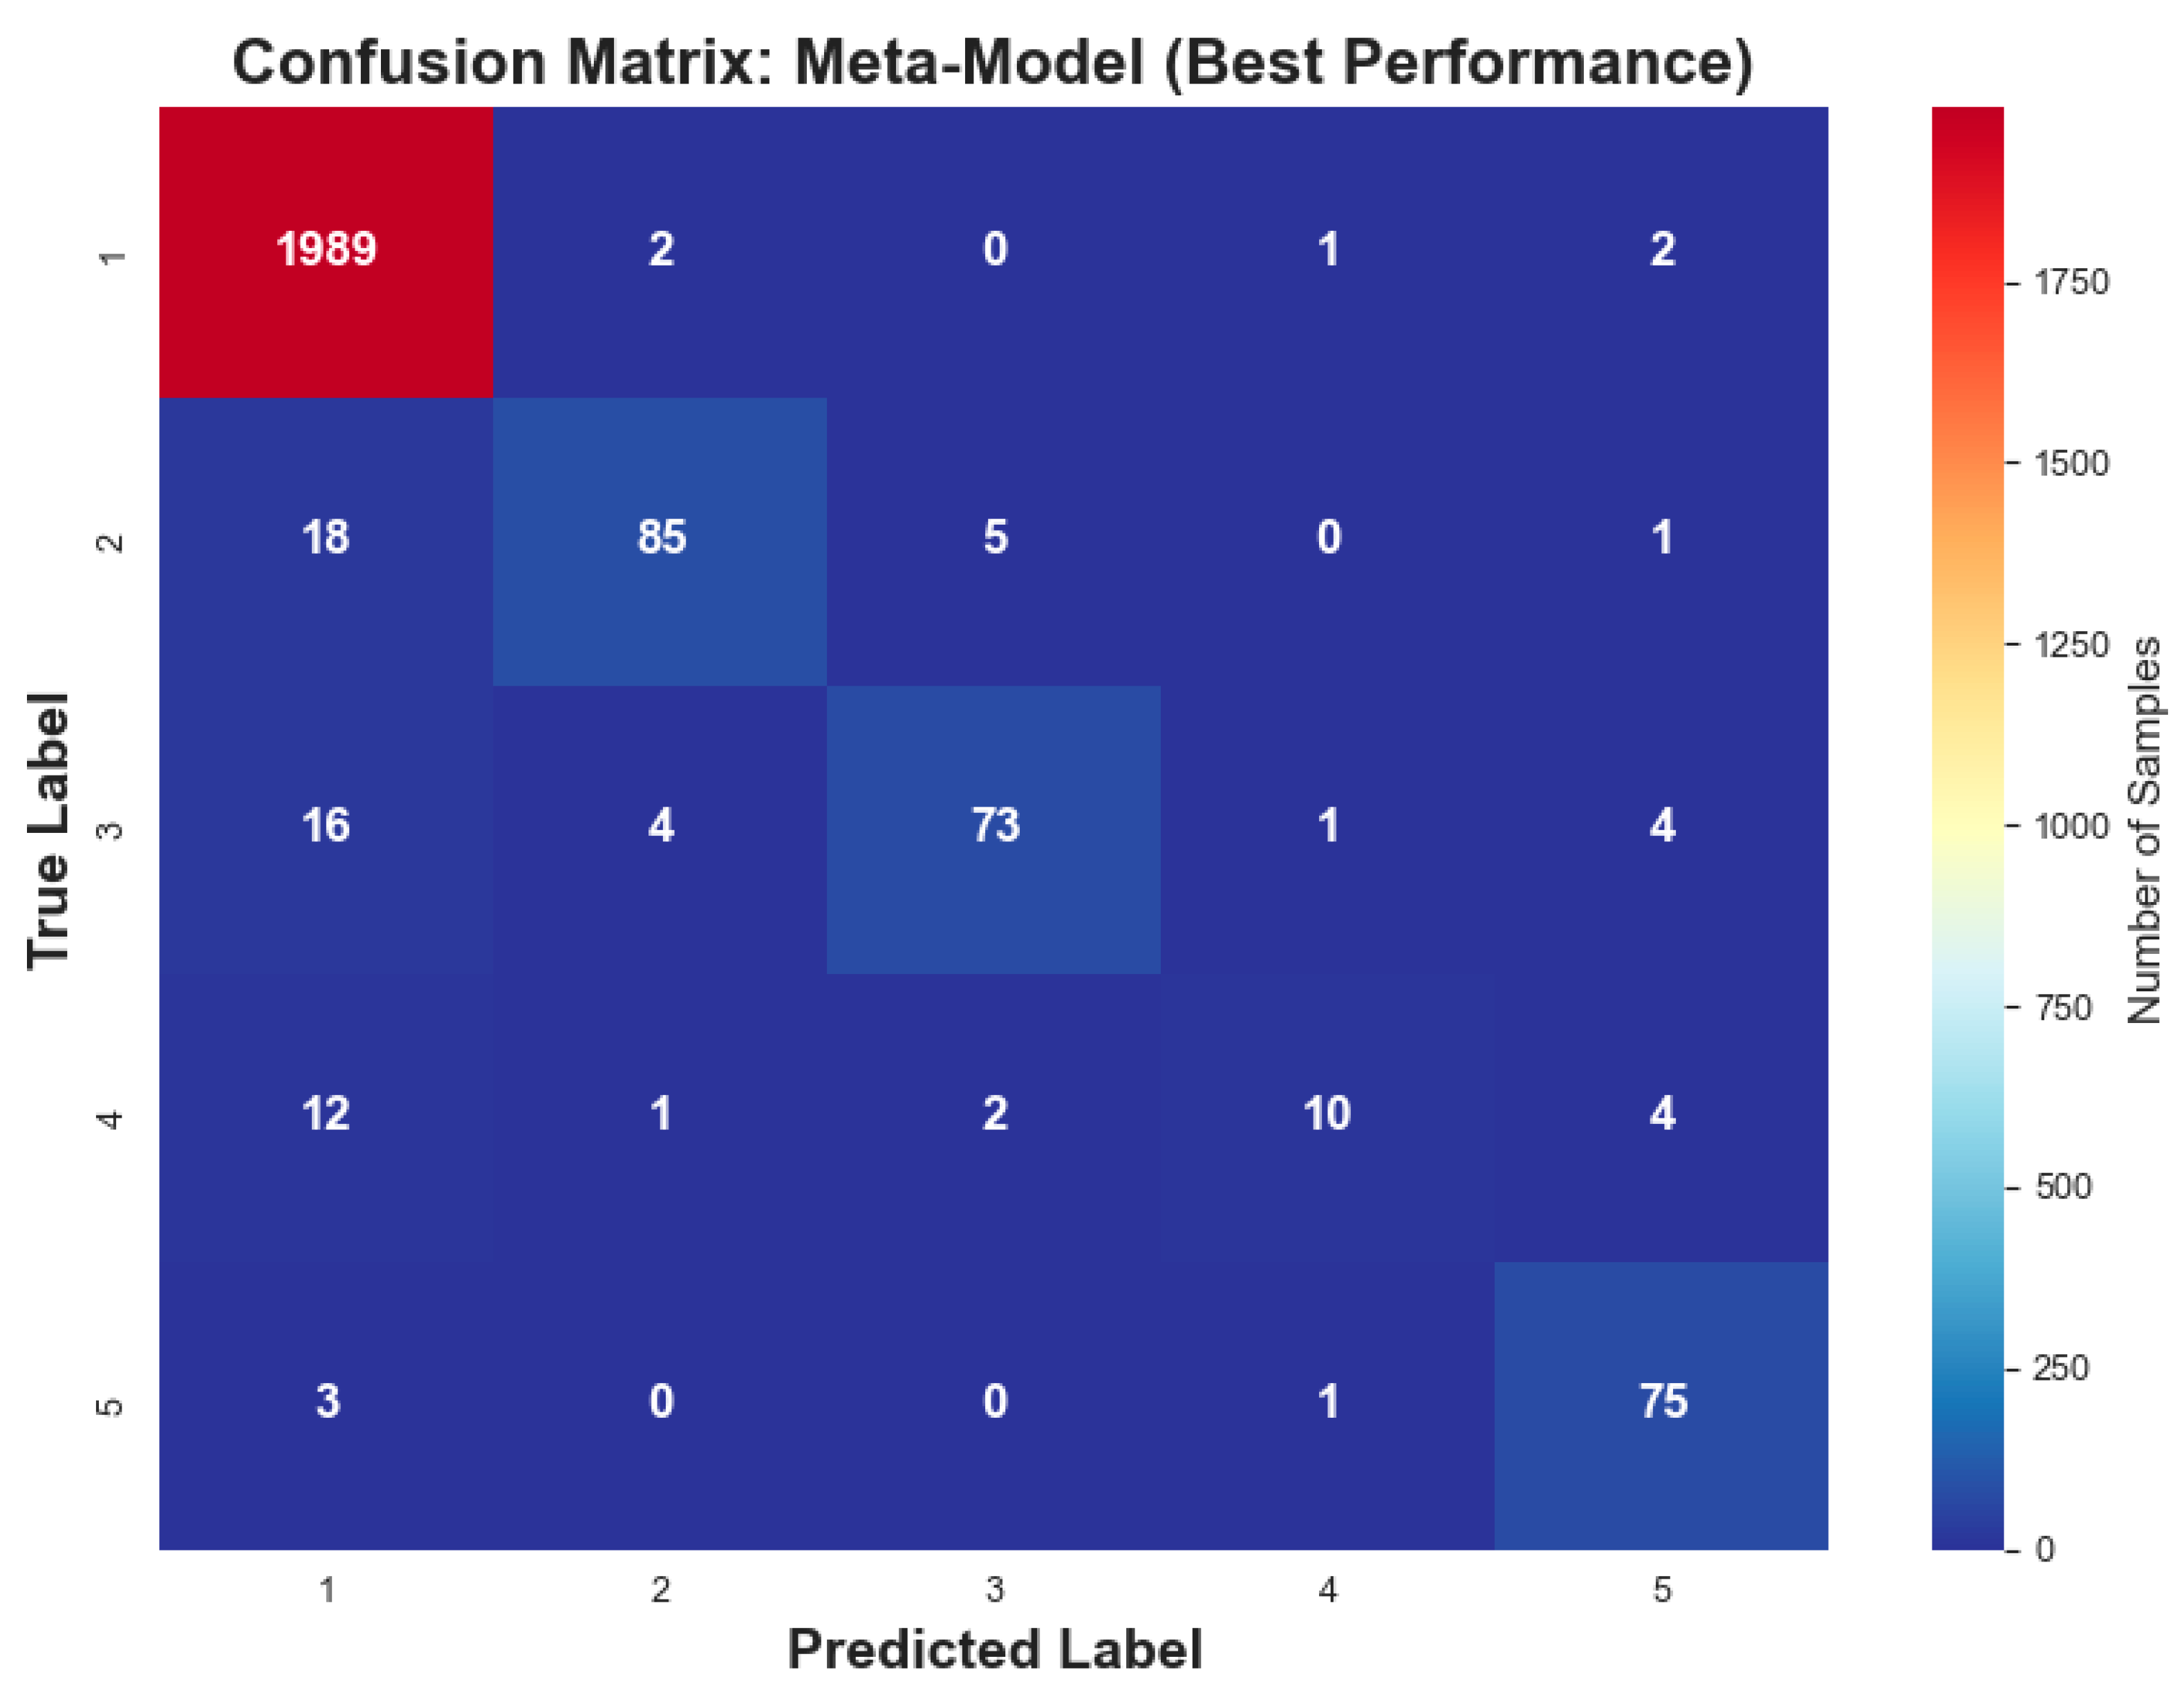
The confusion matrix in
Figure 13 demonstrates classification accuracy with 1989 correctly classified Condition 1 pipes and minimal misclassification across all categories. The meta-model achieves acceptable performance for critical condition states: Condition 5 (poor) with 75 correct classifications from 79 total cases (94.9% accuracy) and Condition 1 (excellent) with near-perfect precision. Intermediate conditions maintain diagonal concentration, with Condition 2 (85/109 correct) and Condition 3 (73/98 correct) demonstrating reliable classification capability.
The predominant concentration of values along the main diagonal confirms the meta-model’s superior discriminative capability and practical utility for infrastructure management applications. The minimal off-diagonal scatter validates the ensemble’s ability to distinguish between adjacent condition classes, critical for accurate maintenance prioritization and resource allocation in urban water network management.
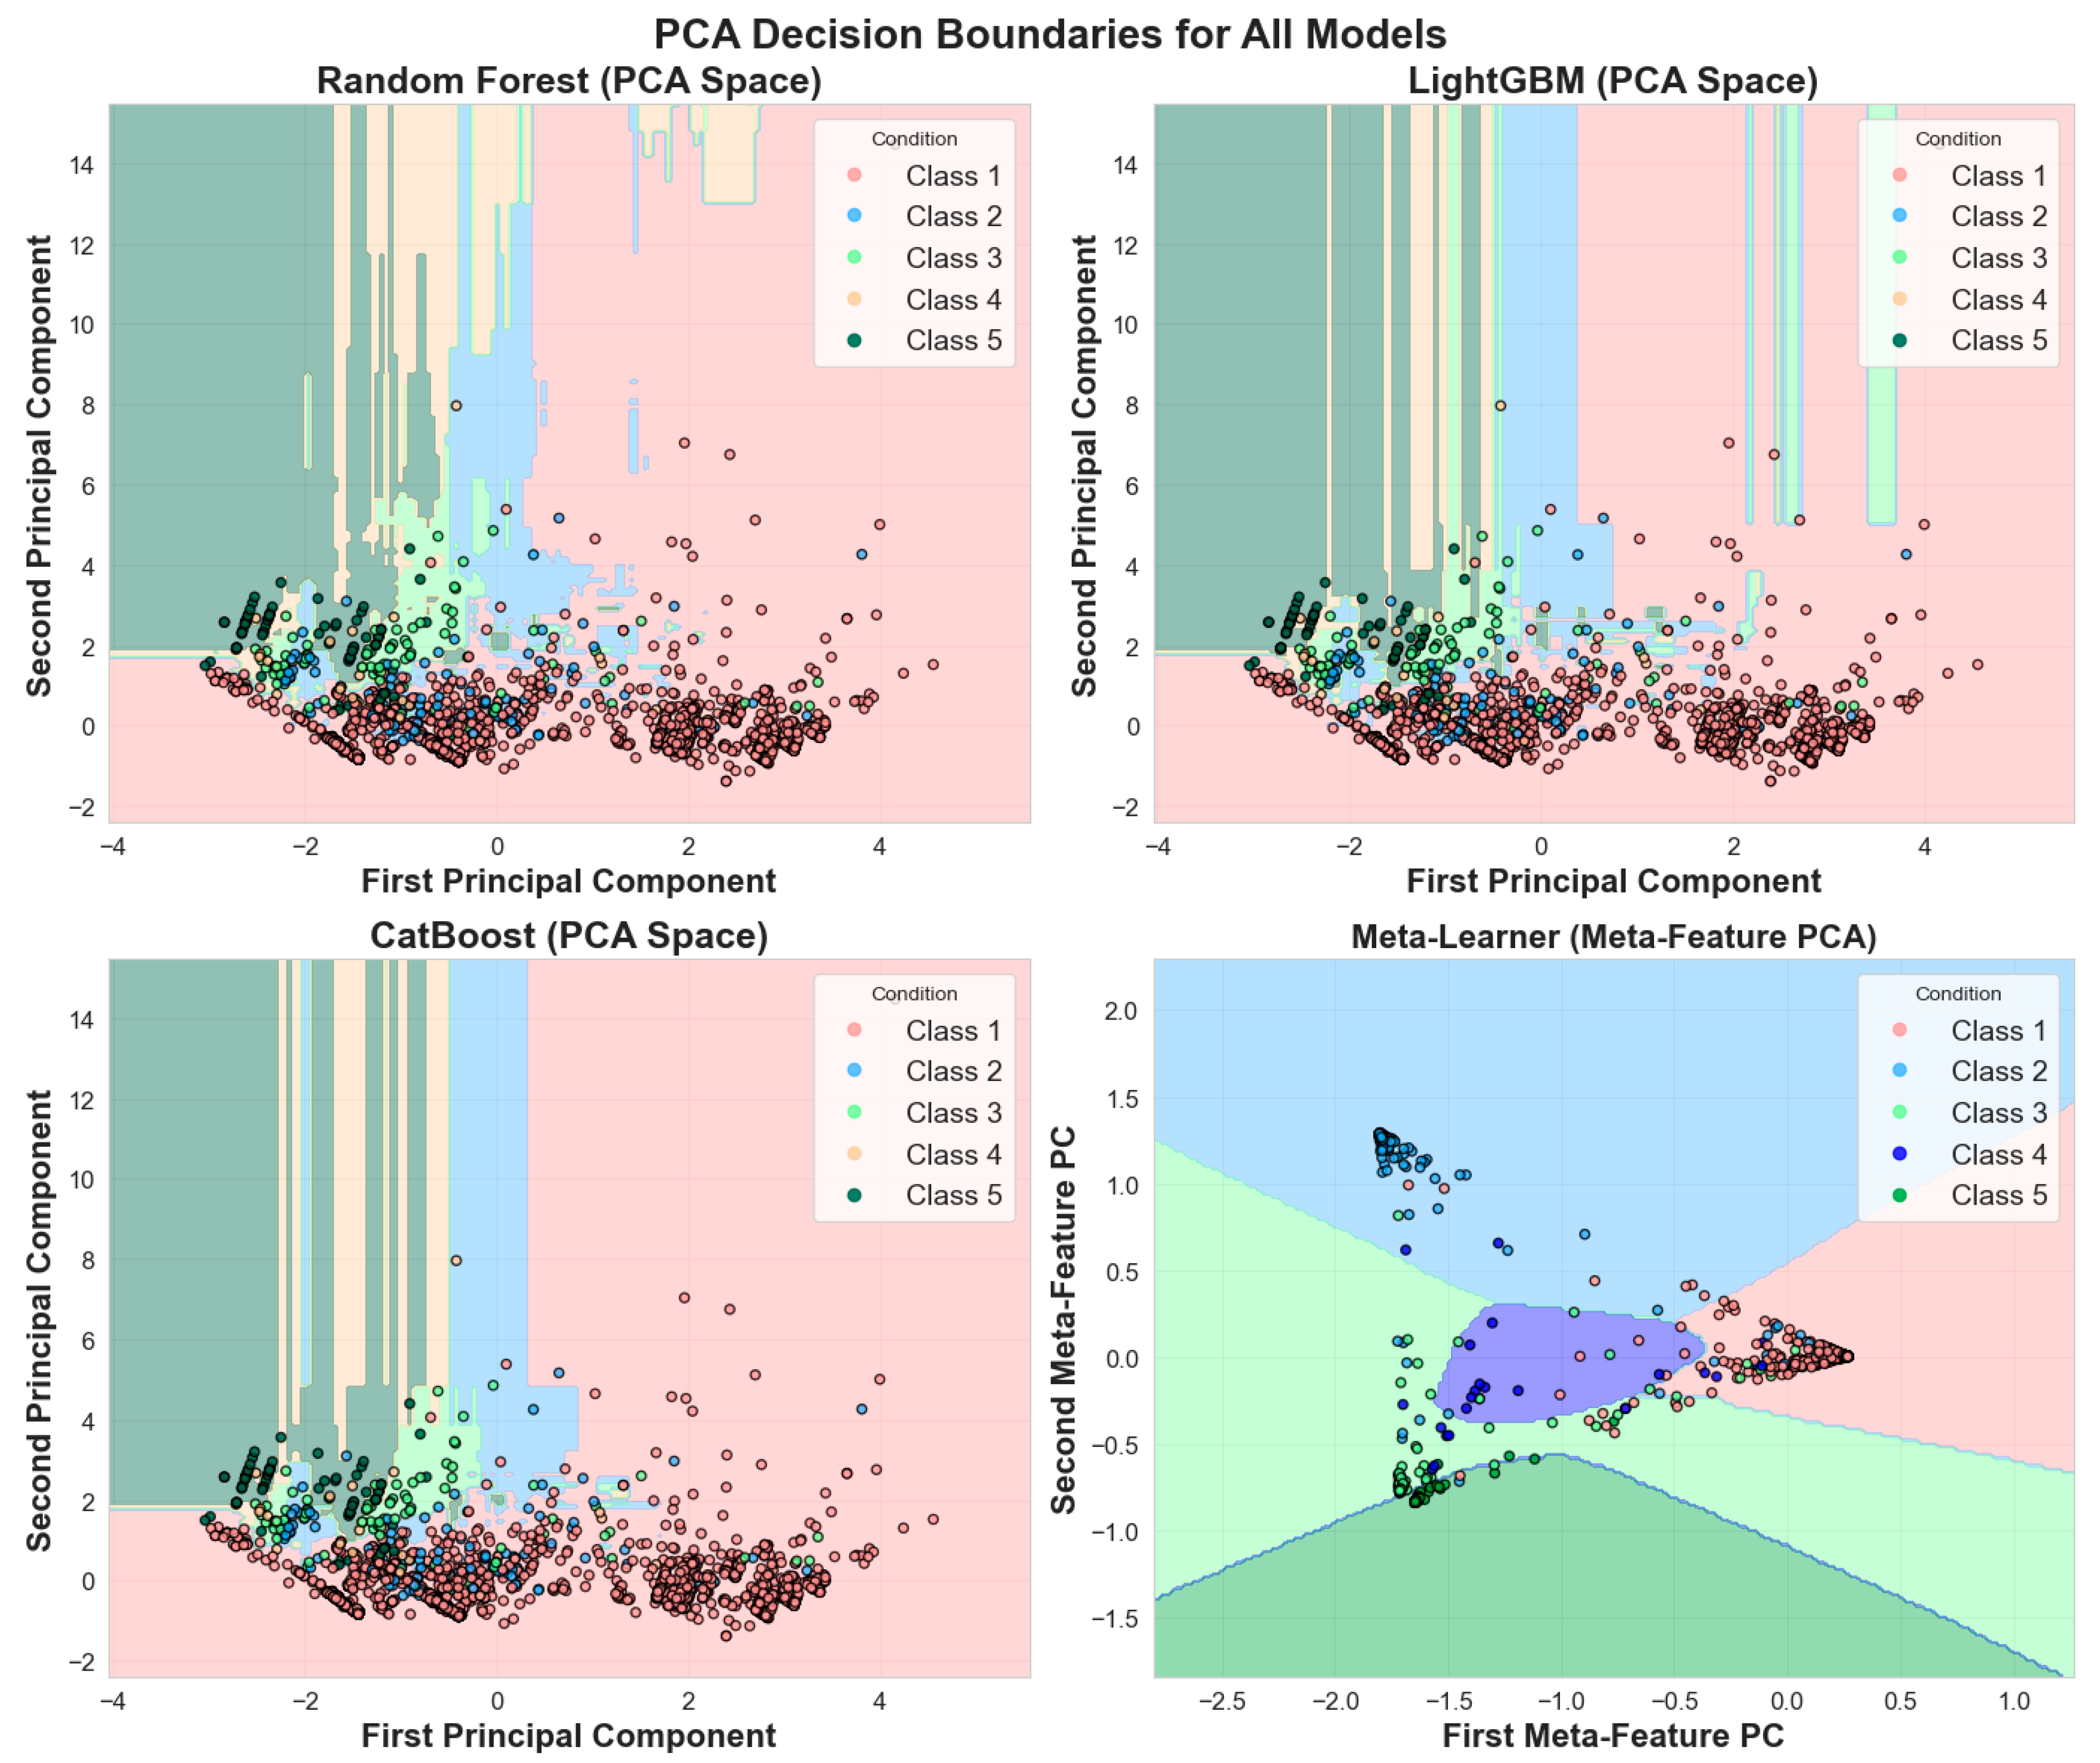
The principal component analysis in
Figure 14 reveals distinct decision boundaries across all models when projected into two-dimensional space, with the meta-learner demonstrating the most refined classification regions. The visualization confirms effective separation between condition classes, particularly distinguishing excellent (Condition 1) from deteriorated states (Conditions 4–5), while intermediate conditions show expected overlap reflecting the gradual nature of infrastructure deterioration processes.
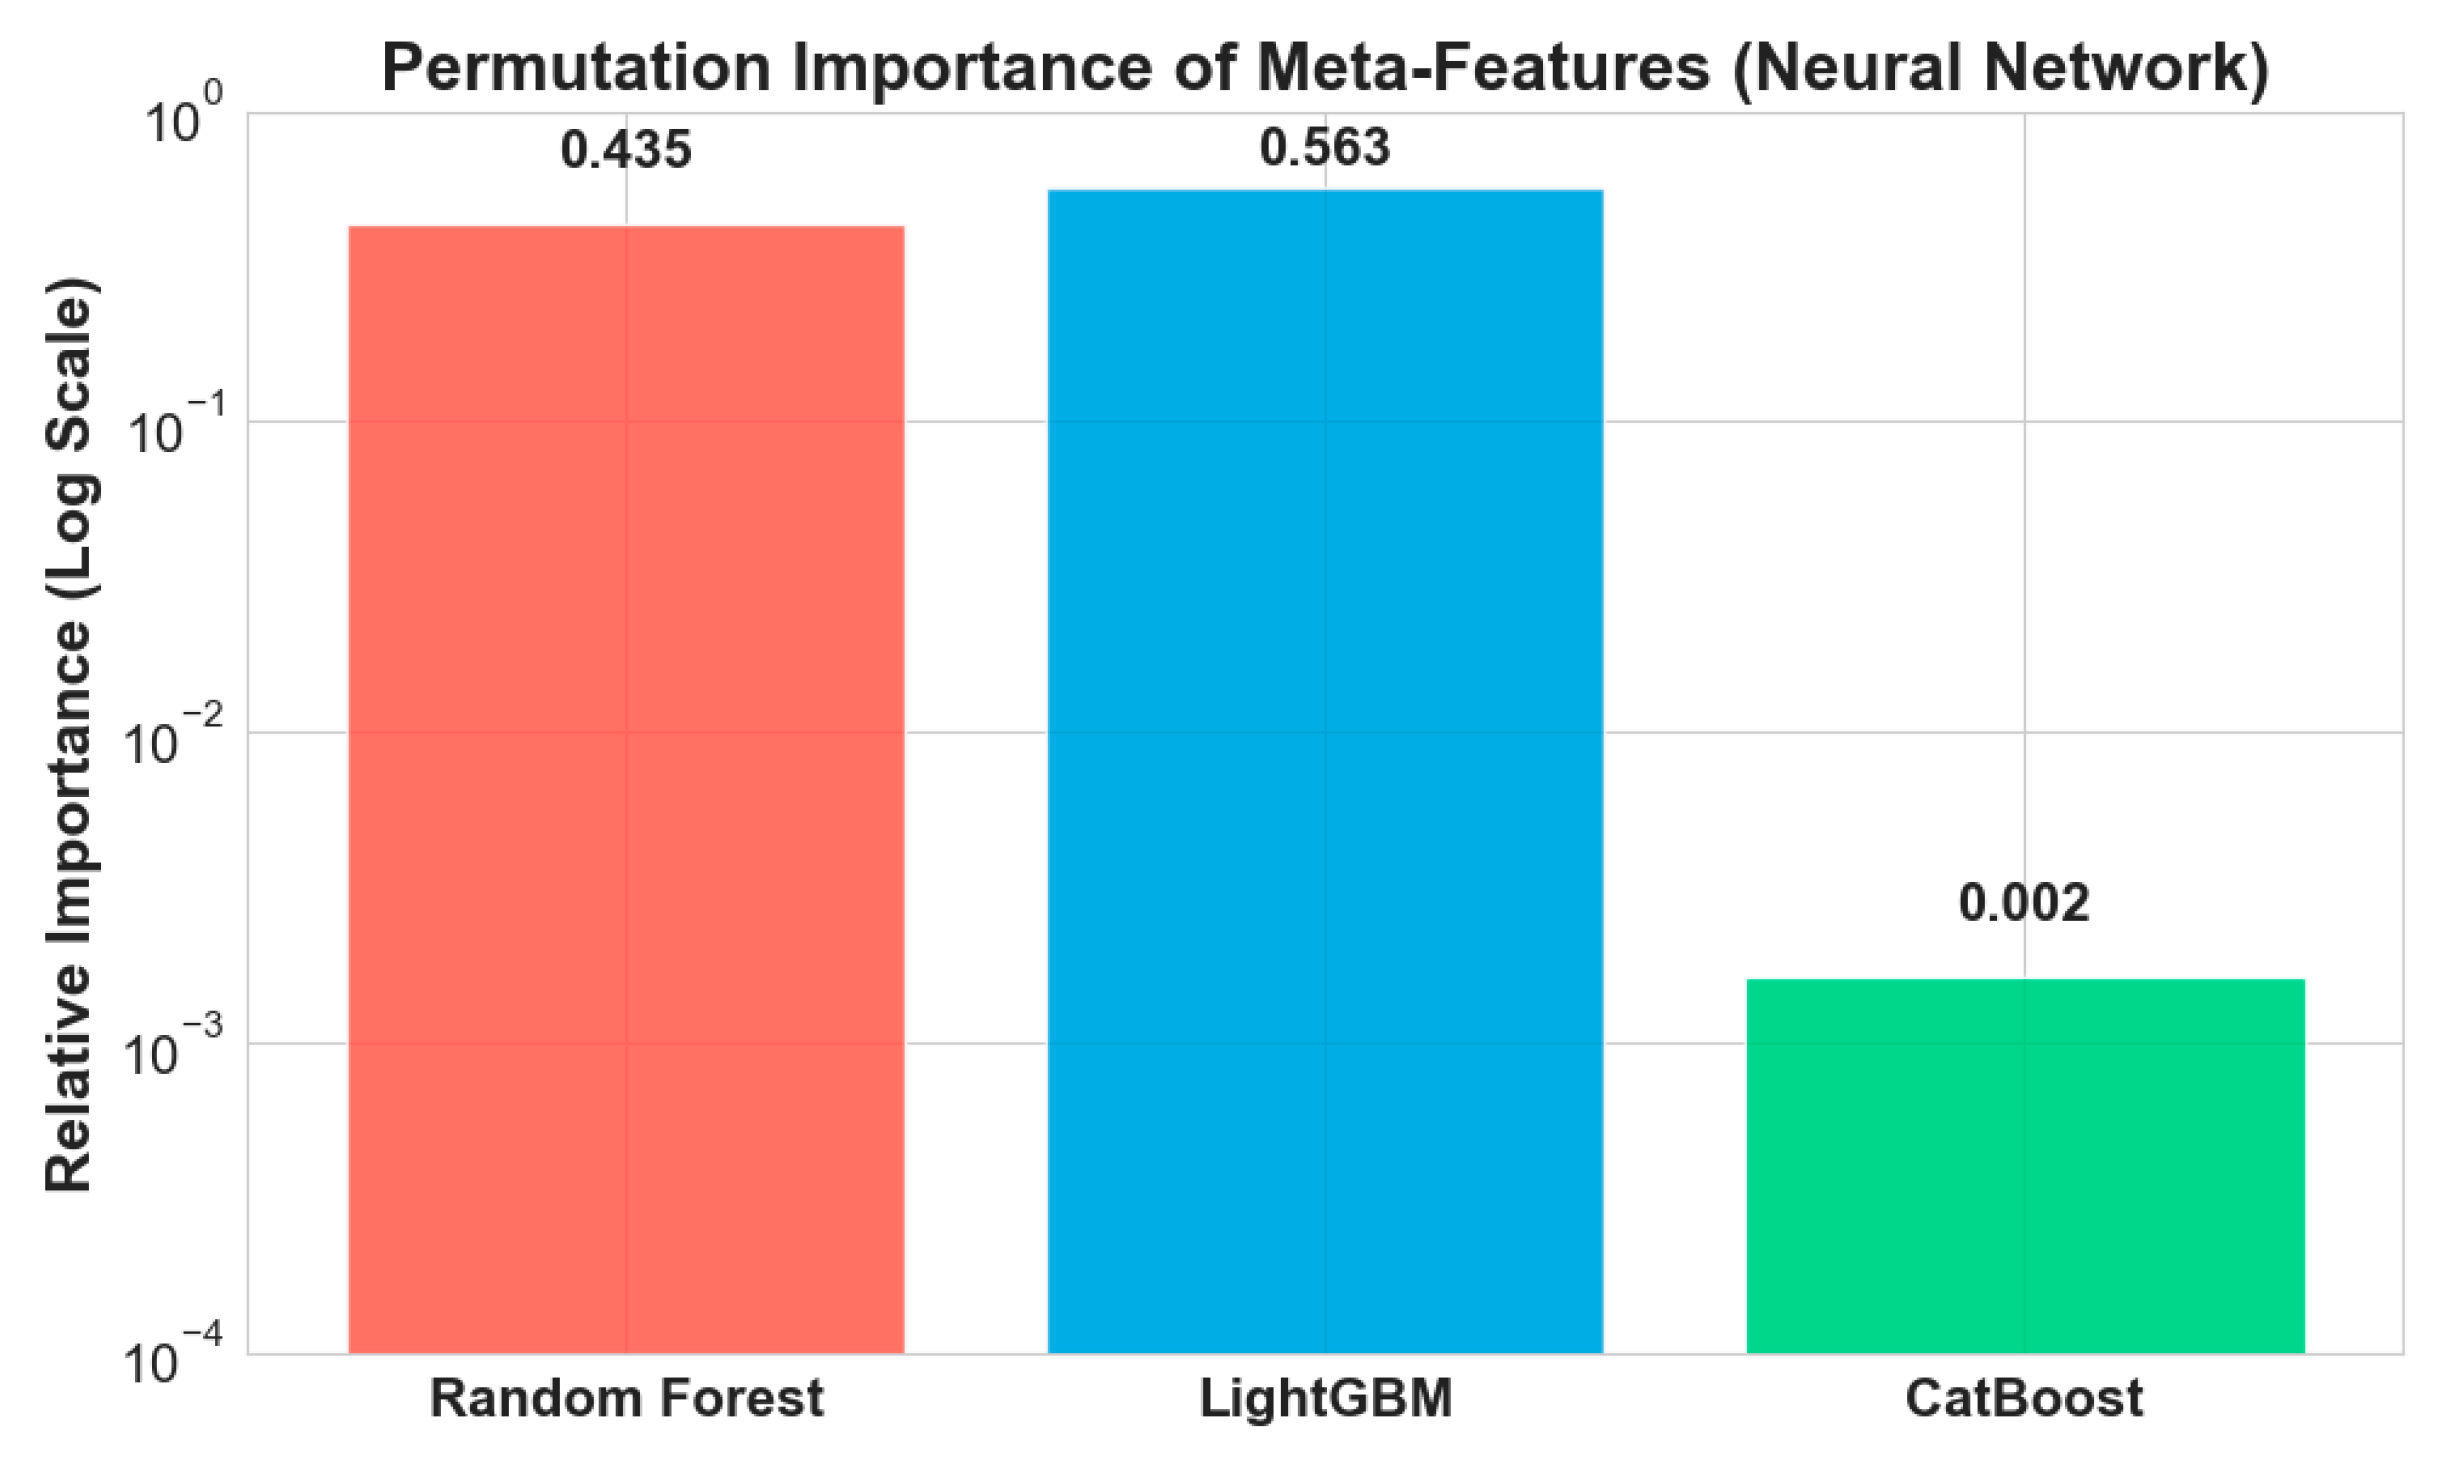
Permutation importance analysis of meta-features in
Figure 15 reveals balanced contributions from base learners, with LightGBM (56.3%) providing the strongest individual contribution, followed by Random Forest (43.5%), while CatBoost contributes specialized pattern recognition for complex cases. This distribution validates the ensemble design philosophy, where diverse algorithmic strengths combine to achieve superior predictive performance through complementary learning approaches.
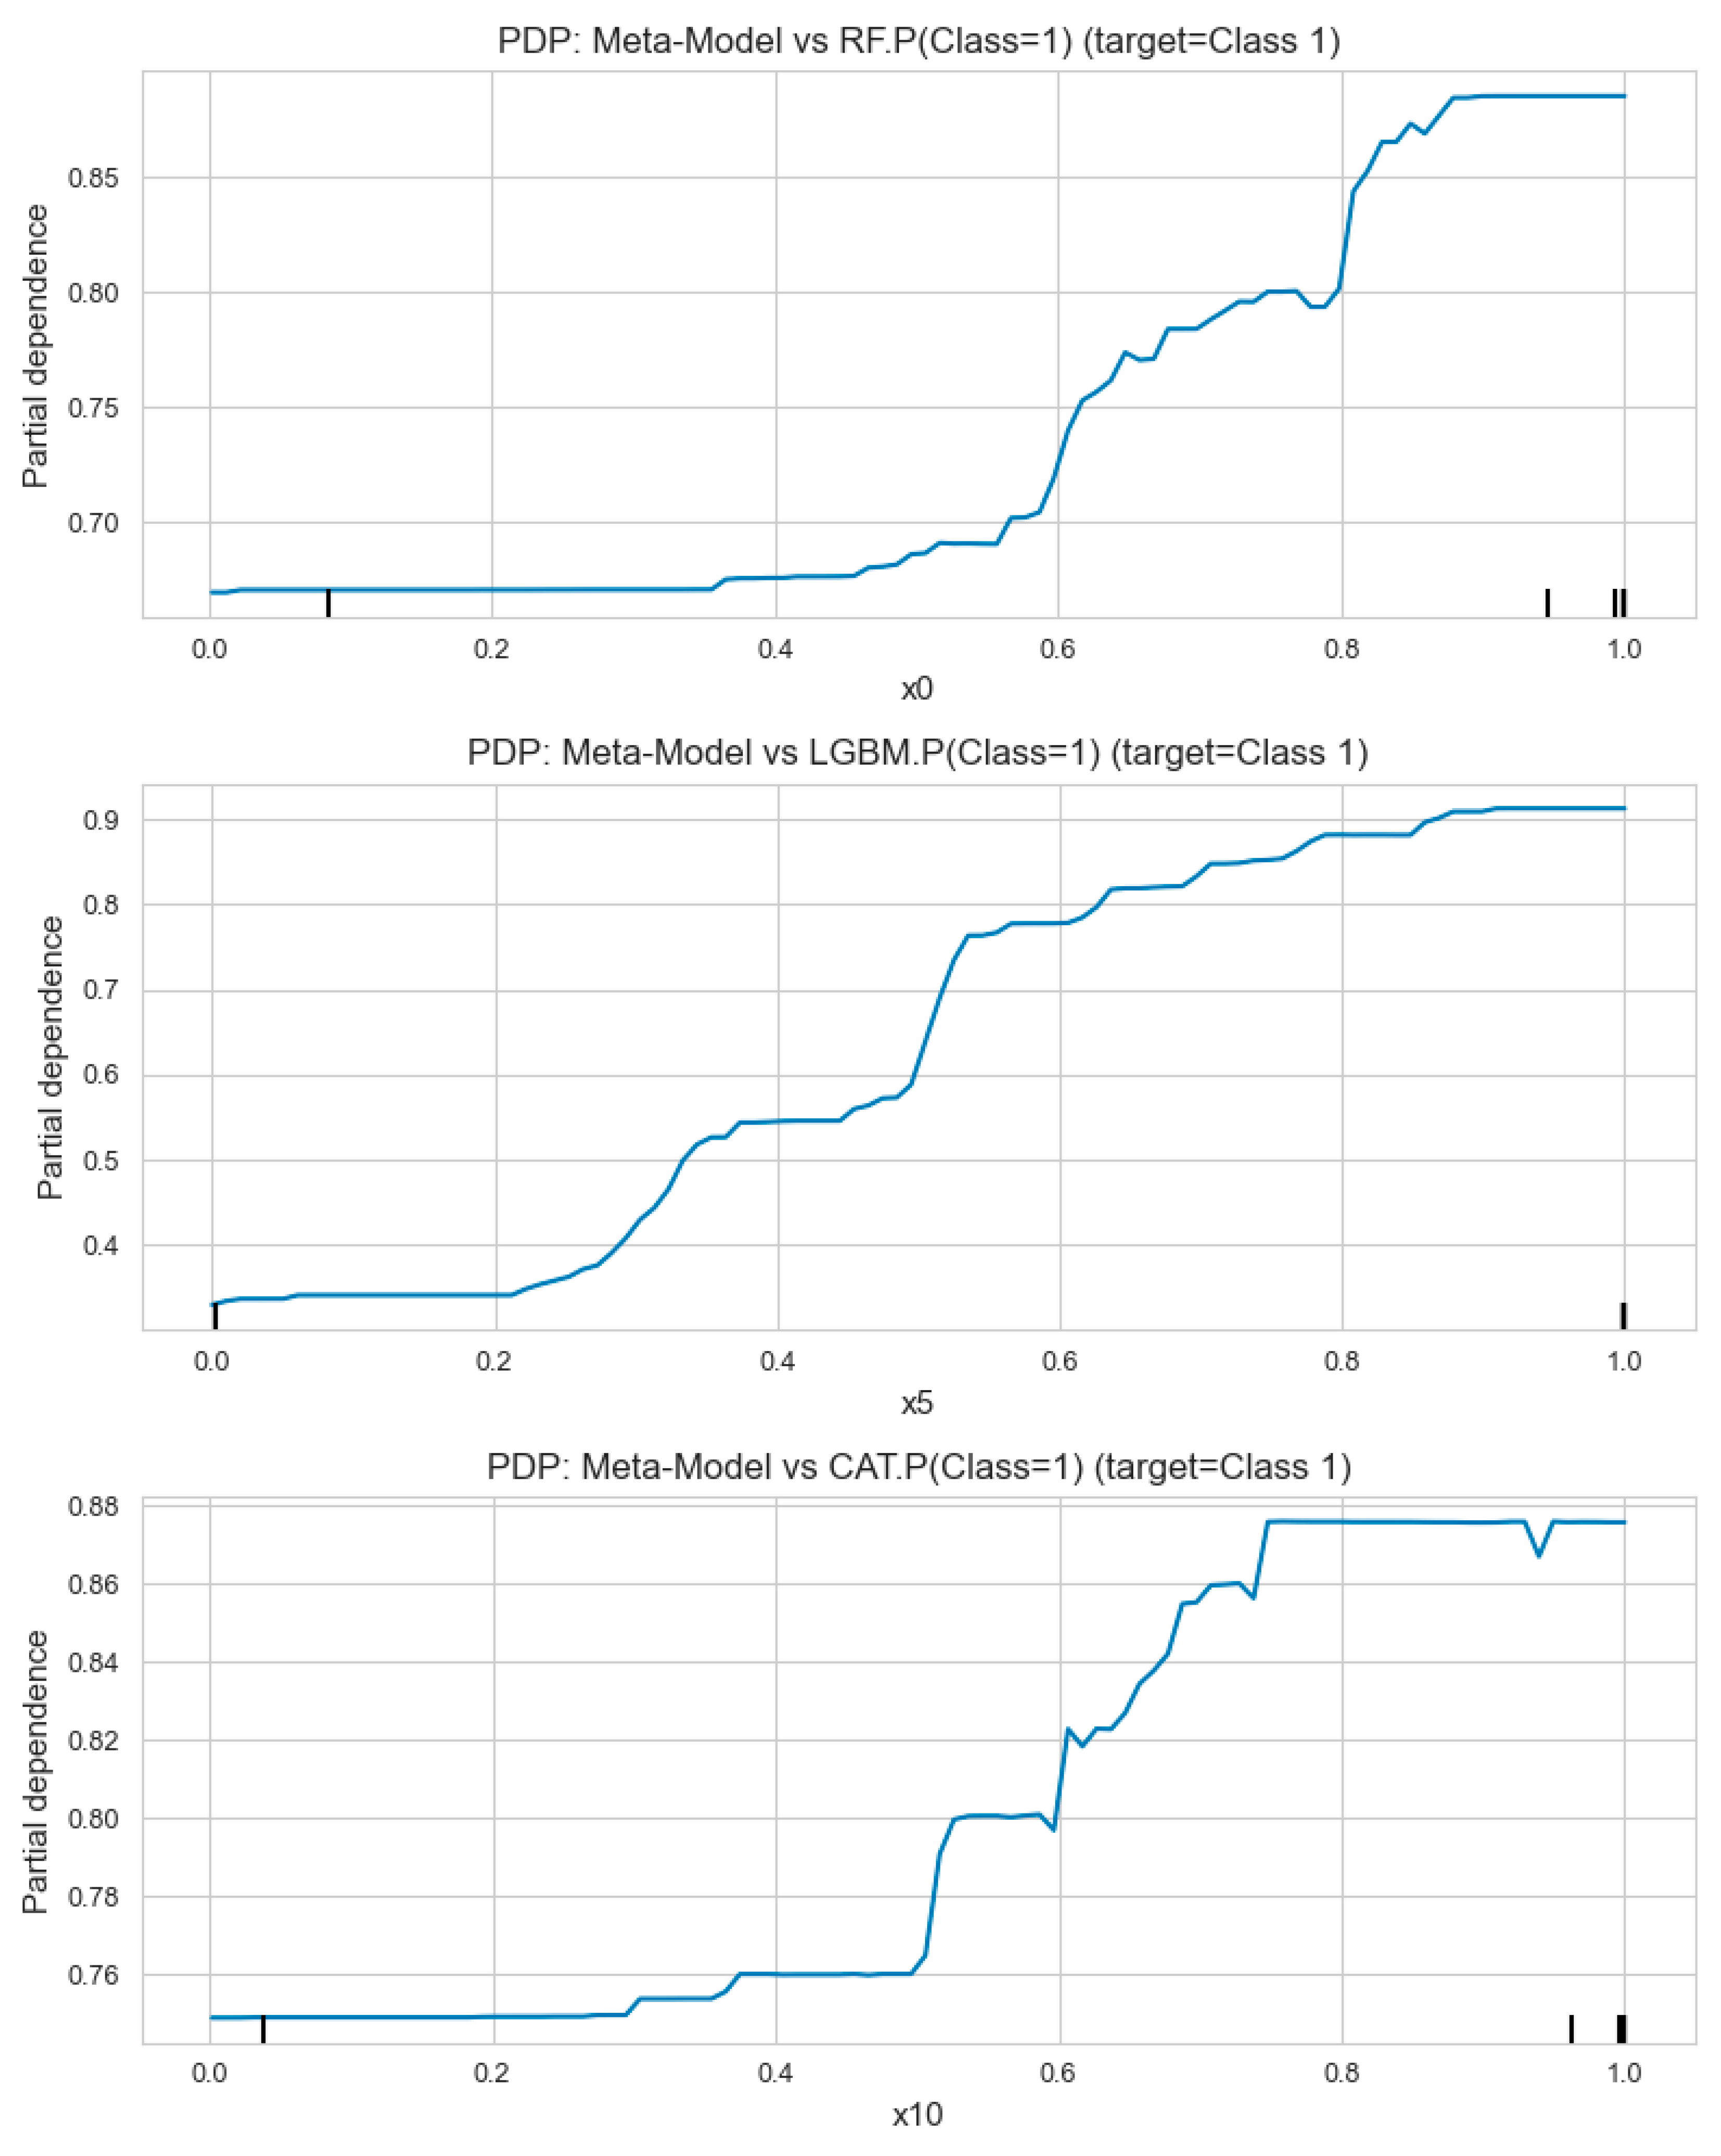
Partial dependence analysis in
Figure 16 reveals how individual base learner predictions influence the meta-model’s decision-making process. The plots demonstrate that the meta-model exhibits increasing dependence on Random Forest predictions above the 0.6 probability threshold, shows strong sensitivity to LightGBM predictions in the 0.4–0.8 range with steepest response around 0.6, and maintains consistent reliance on CatBoost predictions across the full probability spectrum. The vertical black lines indicate the data concentration regions for each base model’s probability predictions, marking areas where the partial dependence analysis is most statistically reliable. These dependency patterns validate the meta-learning architecture’s ability to leverage complementary strengths from each base model for enhanced predictive performance.
The comprehensive results demonstrate that the proposed hybrid meta-learning framework represents an advancement in urban underground pipe condition assessment, achieving a state-of-the-art accuracy of 96.67% through systematic integration of diverse machine learning paradigms. The consistent performance across multiple evaluation metrics, robust feature importance patterns establishing age as the primary deterioration predictor, and multi-class discrimination capability validate the practical applicability of this approach for real-world infrastructure management. The successful combination of Random Forest, LightGBM, and CatBoost base learners with meta-learning delivers both superior predictive accuracy and interpretable insights, providing municipalities and utility providers with a reliable, data-driven tool for optimizing maintenance strategies and enhancing urban infrastructure resilience.
6. Discussion
The results demonstrate that the proposed hybrid machine learning meta-model represents an advancement in urban underground pipe condition assessment. The stacking meta-model achieves 96.67% accuracy, surpassing individual base learners by effectively integrating the complementary strengths of tree-based methods (Random Forest, LightGBM, CatBoost) within a unified ensemble framework. The average feature importance analysis reveals age as the dominant predictor (38.5%), followed by length (22.6%), material (15.6%), and diameter (13.2%), while environmental factors contribute smaller but meaningful influences. Feature correlation and distribution [
60] studies further validate the multi-dimensional nature of pipe degradation and reinforce the need for sophisticated machine learning approaches. The model’s consistent performance across all condition classes—confirmed through detailed confusion matrices and ROC curve [
61] analyses—highlights its practical applicability for data-driven infrastructure management. These findings establish a foundation for implementing intelligent maintenance strategies and optimizing resource allocation in urban water networks.
The successful fusion of diverse algorithmic paradigms within the meta-model architecture marks a methodological contribution to the field. By combining complementary learning mechanisms from different model families—Random Forest’s ensemble diversity, LightGBM’s gradient optimization, and CatBoost’s categorical handling—this hybrid approach delivers both superior accuracy and enhanced interpretability. Beyond water pipe assessment, this meta-learning framework demonstrates strong potential for adaptation to other infrastructure evaluation challenges, reinforcing its value as a versatile and scalable data-driven decision-support tool.
The evaluation employs stratified data splitting and class-sensitive metrics (macro/micro-AUC, weighted F1-score) to mitigate potential imbalance effects. The resulting high discrimination across all condition classes suggests that observed performance reflects genuine learnable structure in tabular operational data rather than artifacts of class skew or single-feature dominance. This performance surpasses comparable studies: Mohammadagha et al. (2025) achieved R
2 = 0.9066 with ANN models on reinforced concrete sewer pipes [
45], while Mosavi et al. (2020) reached 86% accuracy for groundwater potential prediction using Random Forest [
42]. The consistent feature importance rankings, with age emerging as the primary predictor, corroborate findings from Dawood et al. (2020) in their comprehensive AI review [
47]. However, unlike some previous studies focusing on different algorithmic approaches, this research demonstrates that systematic meta-model integration overcomes individual model limitations while preserving interpretability.
Compared to vision-based approaches reviewed by Rayhana et al. (2021), which achieved up to 98% accuracy but required massive image datasets (up to 2 million images) [
44], the proposed framework achieves comparable performance using structured operational data with significantly reduced computational requirements and enhanced practical deployability in resource-constrained municipal environments.
