Abstract
Optimizing pavement maintenance and rehabilitation (M&R) strategies is essential, especially in developing countries with limited budgets. This study presents an integrated framework combining a deterioration prediction model and a genetic algorithm (GA)-based optimization model to plan cost-effective M&R strategies for flexible pavements, including asphalt concrete (AC) and double bituminous surface treatment (DBST). The GA schedules multi-year interventions by accounting for varied deterioration rates and budget constraints to maximize pavement performance. The optimization process involves generating a population of candidate solutions representing a set of selected road sections for maintenance, followed by fitness evaluation and solution evolution. A mixed Markov hazard (MMH) model is used to model uncertainty in pavement deterioration, simulating condition transitions influenced by pavement bearing capacity, traffic load, and environmental factors. The MMH model employs an exponential hazard function and Bayesian inference via Markov Chain Monte Carlo (MCMC) to estimate deterioration rates and life expectancies. A case study on Cambodia’s road network evaluates six budget scenarios (USD 12–27 million) over a 10-year period, identifying the USD 18 million budget as the most effective. The framework enables road agencies to access maintenance strategies under various financial and performance conditions, supporting data-driven, sustainable infrastructure management and optimal fund allocation.
1. Introduction
Effective pavement maintenance plans require a proactive approach to ensure long-term functionality, performance, and cost-efficiency of road infrastructure. Recent advancements in transportation infrastructure management emphasize systematic and optimized maintenance strategies []. Consequently, road agencies are increasingly adopting advanced methodologies to prioritize preservation and maintenance strategies, ensuring the longevity and performance of existing pavement networks []. For example, optimization models can be used to determine multi-year maintenance and rehabilitation (M&R) strategies by incorporating predictions of future pavement condition [,]. However, pavement deterioration is influenced by traffic loads, environmental conditions, material aging, and construction variability, making accurate long-term plans challenging []. Since uncertainties around pavement performance impact the reliability of maintenance, these uncertainties must be considered when making decisions [].
Traditional pavement management systems (PMSs) at the network level often rely on deterministic deterioration models, assuming fixed inputs and outcomes []. Agencies with access to historical and extensive pavement condition data use statistical analysis to identify significant pavement deterioration trends []. While deterministic models provide a simplified decision-making framework, they fail to account for inherent uncertainties in pavement performance, resulting in suboptimal maintenance strategies []. Hence, a multi-year flexible pavement optimization approach must incorporate deterioration prediction models that explicitly consider uncertainty.
Unlike deterministic models, probabilistic models consider input variability, modeling pavement performance as a range of possible outcomes [,]. The Markov model, a common probabilistic approach, simplifies the assessment of infrastructure deterioration with minimal data requirements []. Integrating Bayesian methods into the Markov model enhances parameter estimation, resulting in more robust predictions even with limited data []. Building on these predictions, road agencies can employ optimization models to develop proactive and cost-effective maintenance strategies. Compared to traditional rule-based methods, optimization provides a systematic, data-driven framework aimed at maximizing pavement performance while minimizing life cycle costs.
A key challenge in long-term maintenance planning is aligning network-level strategies with project-level maintenance activities []. Broad network recommendations based on visible wear may not always align with the requirements of specific pavement sections, causing discrepancies in cost estimation and resource allocation. This is primarily because network-level strategies are generally derived from functional evaluations, which focus on surface conditions such as roughness [,,]. In addition to functional assessments, recent structural assessments at the network level have been introduced using fast-moving measurement systems such as the Traffic Speed Deflectometer (TSD). However, while TSD provides valuable continuous deflection measurements at traffic speed, it has limitations in reliably evaluating subsurface structural properties, such as the resilient modulus of subgrade, when compared to the Falling Weight Deflectometer (FWD) [,,]. Therefore, FWD testing remains essential for accurately capturing the underlying structural integrity of the pavement and bridging the gap between network-level strategies and project-level maintenance needs. The comprehensive structural information derived from FWD can then be integrated with an optimization approach that can accommodate various constraints, including budget limitations, resource availability, and project-specific requirements.
The genetic algorithm (GA) is one of the most robust optimization techniques widely used in pavement maintenance programming, as it can handle highly constrained problems and is even capable of addressing multi-objective optimization with relatively low computational effort [,]. Inspired by natural selection and genetics, the GA iteratively refines solutions to achieve optimal or near-optimal outcomes. This method effectively optimizes pavement repair policies within pavement management. Mathew and Isaac proposed a bi-objective optimization framework to maximize the performance while minimizing maintenance cost []. However, their deterministic prediction model did not account for uncertainties in pavement deterioration. In contrast, Obunguta and Matsushima employed a probabilistic Markov hazard model for deterioration prediction and a greedy algorithm (GrA) for optimization []. While computationally efficient, the GrA may result in suboptimal resource allocation. For instance, due to its myopic nature, the algorithm may prioritize roads in the worst condition over those at the fastest rate, or vice versa, depending on immediate decision-making criteria.
In this study, the integration of uncertainty-aware deterioration models is investigated within a multi-year optimization framework for flexible pavements. Specifically, a mixed Markov hazard (MMH) model is employed for probabilistic predictive analytics alongside a genetic algorithm (GA) for optimization. Furthermore, a comparative analysis between the GA and the GrA is conducted to demonstrate the GA’s effectiveness in delivering optimal solutions that outperform those of the GrA. By leveraging this combined approach, the proposed framework enhances PMS by enabling data-driven decision-making that adapts to the dynamic and uncertain nature of road infrastructure, ensuring cost-effectiveness and consistency.
2. Pavement Management System in Cambodia
As of 2022, Cambodia’s road network has comprised a system of national and provincial roads, as illustrated in Figure 1. The national roads (NRs) span 7415.09 km, including 9 primary (one-digit) and 72 secondary (two-digit) routes []. The provincial roads (PR) cover 12,380.04 km across 750 routes, including tertiary and local roads. The surfaces of one-digit NRs are typically constructed using asphalt concrete (AC), a mixture of asphalt binder and aggregates that provides a smooth and durable riding surface. In contrast, the surfaces of two-digit NRs and PRs, which are less costly and quicker to construct, are generally built using double bituminous surface treatment (DBST). This method involves spraying a bituminous binder over a prepared base layer, followed by the application of aggregates, typically 19 mm and 12 mm in size. Looking ahead, the Royal Government of Cambodia (RGC) has outlined plans to expand the national and provincial road network to 21,000 km by 2033 and 25,412 km by 2050 [].
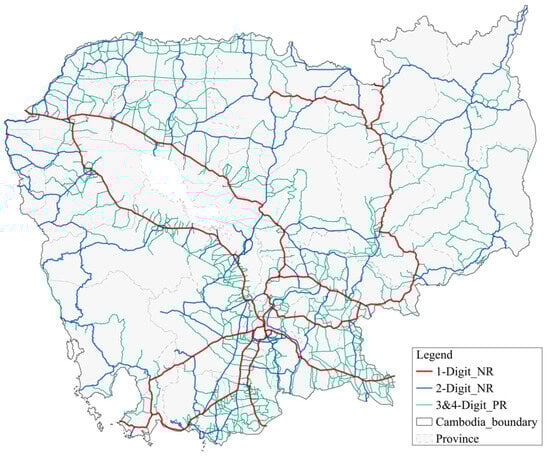
Figure 1.
Road networks in Cambodia.
The RGC, through the Ministry of Public Works and Transport (MPWT), has been actively working to develop a more comprehensive and systematic approach to road asset management, aiming to optimize the use of its limited resources []. Currently, short-term maintenance planning, particularly the three-year rolling maintenance plan, follows a pavement condition policy that prioritizes the most severely damaged road sections.
Road condition data are primarily collected within sub-regions through visual inspections conducted routinely by the provincial Department of Public Works and Transport (DPWT), which assesses harmful surface defects and damage severity. In addition, the MPWT’s Road Data Collection Unit conducts functional evaluations of pavement conditions nationwide using the Dynamic Response Intelligent Monitoring System (DRIMS). This involves the use of a survey that mainly measures IRI and is typically carried out every one to two years. For structural evaluation, the FWD is used to assess pavement strength; however, due to high cost and time requirement, FWD testing is conducted less frequently, often on a one-off basis for specific projects. Despite these efforts, maintenance interventions are often determined through subjective decision-making by engineers, resulting in a reactive rather than proactive maintenance strategy.
The Road Asset Management Project II (RAMP II) was launched to strengthen asset management practices and improve planning through simplified models []. This project formulates short-term and medium-term maintenance programs by incorporating a Road Management Decision Support (RMDS) system, such as HDM-4, to evaluate road investment and maintenance needs. However, the application of HDM-4 poses challenges due to its high operation costs. Furthermore, it requires a broad variety of input data and can become data-intensive when detailed calibration is needed to align the model with a country’s specific conditions []. This process is not only time-consuming but also costly, particularly due to the need for comprehensive data collection and analysis.
3. Methodology
3.1. Decision Process for Repair Action Selection
Implementing multi-year maintenance planning involves accounting for various maintenance types aligned with specific pavement performance states []. The International Roughness Index (IRI) is a widely used metric for ride quality evaluation and is promoted under Sustainable Development Goal (SDG) 9 []. Predicting this indicator over time is crucial for effective implementation of maintenance planning [,,]. To minimize discrepancies between planned budget allocations at the network level and cost estimates at the project level, this study integrates two evaluation approaches: the assessment of surface condition based on the IRI state rating and the evaluation of sublayer bearing capacity using deflection bowl parameters (DBPs) derived from the FWD. This combined approach ensures a cost-effective and well-informed maintenance strategy, addressing both surface functional deficiencies and underlying structural issues.
The DBPs, comprising the Base Layer Index (BLI) (also known as the Surface Curvature Index, SCI), the Middle Layer Index (MLI) (also called the Base Curvature Index, BCI), and the Lower Layer Index (LLI) (sometimes referred to as the Base Damage Index, BDI), offer insight into the structural health of different pavement layers. Specifically, BLI indicates the strength of the combined surface and base course layers, MLI reflects the strength of the sub-base course layer, and LLI represents the strength of the combined selected and subgrade layer []. These indices, expressed in micron (µm), are calculated using the deflections measured at radial distances of 0, 300, 600, and 900 mm from the FWD load center, denoted as D0, D300, D600, and D900, respectively:
FWD testing was conducted with a 50 kN impulse load and a 300 mm diameter loading plate. For AC pavements, since the surface course is highly sensitive to temperature, deflection values were corrected to a standard reference temperature of 20 °C to account for the influence of temperature on the stiffness of the asphalt layer [,]. The empirical temperature correction model proposed by Březina et al. was applied in this study for practical implementation []. In contrast, for pavements with a thin bituminous surfacing layer over a granular base, such as DBST pavements, the bituminous layer has minimal influence on the overall structural response measured by the FWD [,]. Because the pavement’s bearing capacity is primarily governed by the underlying granular layers and subgrade, deflections on DBST pavement in this study were assumed to be temperature-insensitive, and no temperature correction was applied.
The maintenance decision is primarily determined by the IRI state rating, and the IRI state is updated following the application of a specific maintenance type, as shown in Table 1. To provide an optimal maintenance strategy, sublayer structural conditions were also implemented, represented by the DBPs BLI, MLI, and LLI (see Table 2). These structural conditions were then classified into different groups based on combinations of these DBPs’ ratings (see Table 3) and were updated after maintenance based on the treatment applied. Each rating system provides a corresponding maintenance type and index, ranging from 1 (No Maintenance) to 6 (Reconstruction). The final maintenance action is guided by the higher maintenance index derived from the two evaluation systems. For instance, if the IRI state rating suggests Preventive Maintenance (Index 2) but the DBP rating indicates Corrective Maintenance (Index 3), this latter decision is prioritized due to its higher index. This ensures that the most critical issues, whether functional or structural, are addressed promptly and effectively.

Table 1.
IRI condition rating, maintenance requirement, and IRI state updates.
Table 2.
Structural benchmark criteria. Adapted from [], with permission from CRC Press, Talyor & Francis Group, 2025.
Table 3.
Structural classification, maintenance requirement, and structural state updates.
3.2. Model Framework
The framework of this study enables strategic budget allocation, prioritization of critical maintenance projects, and proactive road management to mitigate costly emergency repairs, as illustrated in Figure 2. It integrates a probabilistic deterioration prediction model with GA optimization, enabling data-driven and cost-effective maintenance. The Markov model, a widely used probabilistic approach, predicts pavement degradation over time by capturing the uncertainty and variability caused by various influencing factors. Meanwhile, GA is well-suited for exploring large solution spaces, making it effective for optimizing multi-year maintenance planning by maximizing cost-effectiveness within annual budget constraints.
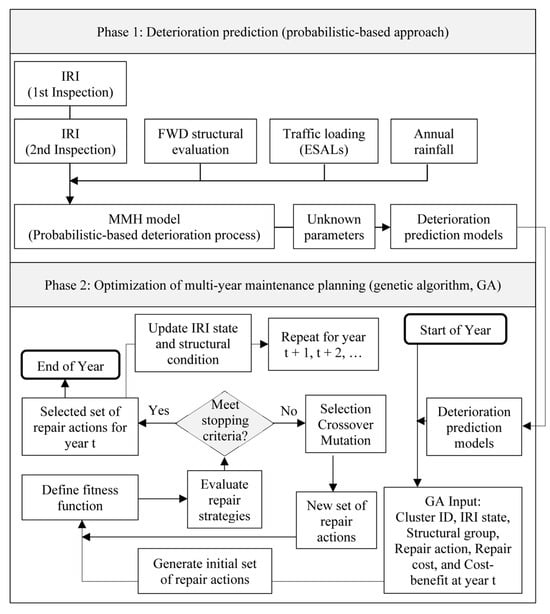
Figure 2.
Flowchart of the model framework.
As shown in Figure 2, pavement deterioration is primarily governed by the structural condition of the pavement, traffic loading, and annual rainfall. Higher traffic loading and greater rainfall intensity accelerate the growth of the IRI, leading to faster pavement deterioration and a shorter service life. In contrast, pavements with high structural stiffness (e.g., lower DBPs) exhibit slower deterioration. The relative influence of each factor is quantified through the estimated unknown parameters derived from the MMH model, presented in the Results Section. Specifically, the structural condition reflects the pavement’s bearing capacity between the first and second IRI inspections; traffic loading represents the cumulative ESALs; and annual rainfall indicates the average rainfall intensity over the same inspection period.
For the empirical study, IRI measurements were collected twice, in 2022 and 2023, across 6085 road sections, covering both AC and DBST pavements, along with FWD testing on the same sections. The cumulative ESALs for 2022–2023 were calculated by converting daily vehicle counts into a standard axle load of 80 kN []. The average annual rainfall for each road section was derived from the mean annual rainfall recorded between 2000 and 2015, based on gauged observations obtained from the Asian Precipitation—Highly-Resolved Observational Data Integration Towards Evaluation (APHRODITE) dataset.
3.3. Deterioration Prediction Based on Mixed Markov Hazard (MMH) Model
The mixed Markov hazard (MMH) model addresses the Markov deterioration process by incorporating a multi-stage exponential hazard framework with a heterogeneity factor []. The model follows survival analysis principles and captures heterogeneous deterioration patterns across different infrastructure groups (see Figure 3), with hazard rates evolving according to an underlying Markov process.
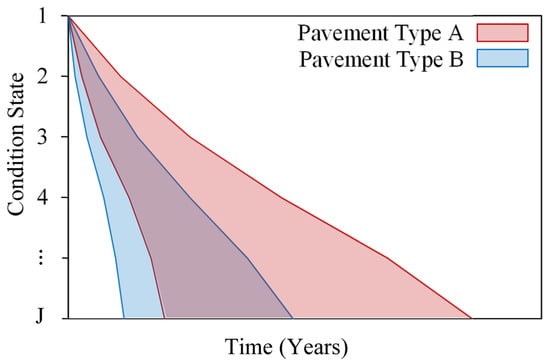
Figure 3.
Illustration of pavement deterioration.
In this context, IRI is discretized into distinct condition states, denoted as , with as the best, and (, as shown in Table 1, as the worst, requiring reconstruction. Condition state changes between two consecutive inspections are represented by Markov transition probabilities (MTPs), denoted as .
The model considers no repair works between inspections, resulting in zero probabilities for transitions to better states. All procedures and derivations of the estimated hazard rates and transition probabilities follow the methodology described in []. The transition probability between inspections at and can be expressed as follows:
Survival analysis principles, in association with Markov processes, were incorporated and further developed in the following steps to model the deterioration process of infrastructure []. This process is characterized by a hazard function, , which represents the instantaneous risk of transitioning from state to . The hazard function is defined as
where is the probability density function, and is the survival function, representing the probability of remaining in the current state beyond time . The survival function is given by
where is the cumulative distribution function, given by
Assuming the hazard function follows an exponential distribution, the hazard rate becomes constant due to the memoryless property. Given , the survival function can be written as
To capture the variability in deterioration across different infrastructure groups, a heterogeneity factor , assumed to follow a gamma distribution, is incorporated. The survival function then becomes
where represents the mean value of the heterogeneity factor. Therefore, the probability of condition state changes can be determined as follows:
For , where , the transition probability is
where and .
Finally, the transition probability (transitioning to the worst condition state ) is given by
The hazard rate is modeled as a joint probability of factors influencing deterioration. It can then be written as a function of explanatory variables that address these factors. Hence, it can be expressed as
where is baseline coefficient, and represents coefficients of the explanatory variables contributing to the deterioration rate from state to . These coefficients are the unknown parameters that need to be estimated.
The life expectancy () for state remaining in state until reaching state can be determined as follows:
The predicted lifespan of a road section is the summation of the life expectancy of each condition state. Using Bayes’ theorem, the posterior distribution of the model parameters can be derived by combining the assumed prior distribution and the likelihood function. The posterior distribution for the transition probability matrix can be expressed as
where represents the field survey data ( and ) and a dummy variable , while represents the estimated parameters. is an unknown parameter associated with in the Gamma distribution.
To avoid explicit mathematical derivations, the Metropolis–Hastings (M-H) algorithm is used in this study, a popular Markov Chain Monte Carlo (MCMC) method, to sample the values of the parameter directly from the posterior distribution under sufficient iterative processes, ensuring convergence [].
It is important to note that, in this study, only the IRI state is predicted over time using the MMH model that incorporates influencing factors. However, the condition of DBPs is not modeled dynamically over time. Instead, DBPs are only updated following maintenance activities, where the applied repair action results in a revised structural condition. This limitation arises because repeated FWD testing is often impractical due to high operational costs. As a result, it is generally not possible to predict changes in the condition of DBPs via the MMH model, similar to IRI, which requires at least two time-series inspections.
3.4. GA Optimization
The optimization technique used in this study to implement the maintenance strategy is a metaheuristic approach, specifically the genetic algorithm (GA). The GA is a type of evolutionary algorithm (EA) that simulates natural selection and genetic processes to efficiently search for optimal solutions []. The GA uses rules to find solutions efficiently rather than exhaustively searching every possibility. Since it relies on probability and approximation, the GA is not guaranteed to always find the global optimum solution. However, with proper tuning of its operations, it can find solutions that are very close to optimal and suitable for practical use []. Moreover, potential limitations may occur, such as high computation demand for very large networks (e.g., tens of thousands of segments); in such cases, alternative GA configurations or hybrid approaches may be required to maintain computational feasibility.
In this study, because the application involves a large road network with numerous sections, the GA begins by deterministically generating an initial population of 1000 genomes to ensure convergence toward a high-quality solution. A larger population size generally increases the likelihood of obtaining a more optimal solution, but also leads to higher computational demand. Different population sizes may be tested to identify the most efficient balance between computational effort and solution quality. Each genome encodes a maintenance decision using a chromosome representation, where individual genes indicate whether a set of road segments is selected for maintenance, as shown in Figure 4. The fitness of each genome is then evaluated based on the total cost-effectiveness, incorporating a penalty if the budget constraint is exceeded. Offspring are produced through three primary mechanisms: selection, crossover, and mutation. Tournament selection is employed to choose the fitness individuals for reproduction, while crossover is performed using a two-point method with a crossover rate (CR) of 0.8. Mutation is applied using a bit-flip function with a mutation rate (MR) of 0.05, introducing genetic diversity. If an offspring solution demonstrates higher fitness than the parent population, it replaces the weaker individuals. This iterative process continues for 500 generations until an optimal selection of projects is identified, at which point the stopping criteria prevent further evolution. The convergence of the algorithm is tracked and visualized, ensuring that the best solution meets the budgetary constraints while maximizing total effectiveness.
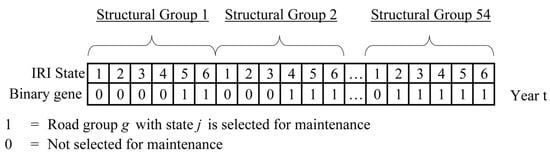
Figure 4.
GA chromosome encoding.
3.5. Benefit Optimization
While some studies focus on minimizing life cycle cost (LCC) for maintenance planning, others adopt a cost–benefit analysis approach aimed at maximizing the effectiveness of repair actions under budget constraints [,]. In this study, an optimized maintenance decision-making process is developed by evaluating all road sections based on their structural classification and current IRI condition state to determine the most beneficial repair strategy.
The effectiveness of maintenance is represented by the maintenance benefit area, defined as the shaded region between the pavement deterioration curves before and after repair (see Figure 5). In this study, the deterioration curves are modeled using third-order polynomial regression based on MMH model predictions. Within this framework, applying a repair action restores the IRI condition state to state 2 for repair actions 3 and 4, and to state 1 for all other repair actions (as indicated in Table 1). Details of repair strategies are summarized in Table 4. The depth of pavement removal and replacement determines the extent of structural restoration. For example, restorative maintenance upgrades the BLI to Sound condition, while rehabilitation improves both the BLI and MLI. The layers not targeted by the repair retain their existing condition. The combined improvement in BLI, MLI, and LLI elevates the overall structural classification to a stiffer group (as shown in Table 3).
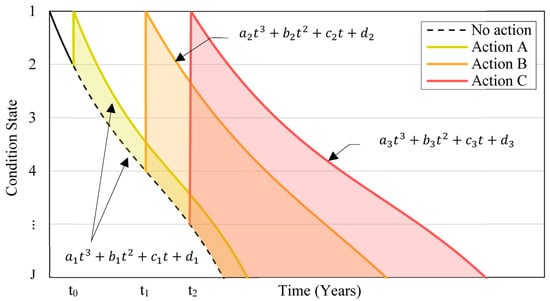
Figure 5.
Effectiveness of maintenance activities.
Table 4.
Repair details by maintenance type.
The proposed optimization model in this study aims to achieve two primary objectives: maximizing the improvement in pavement conditions and minimizing maintenance costs. Maintenance costs are determined by multiplying the unit cost of each repair strategy by the area of the segments in each structural group to which it is applied. These two objectives are combined into a single metric, the cost–benefit (CB) value, which quantifies the benefit achieved per dollar spent.
The CB is calculated by dividing the benefit area by the total cost of the repair action, serving as the final measure of maintenance efficiency. The CB calculation for pavement sections in group under repair action at year is computed as follows:
Here, the represents the unit cost of repair action (see Table 5), while denotes the total area of road sections in group . The function describes the deterioration curve after applying action , which restores the IRI condition state and updates the structural group to . In contrast, represents the deterioration curve of group before maintenance.
Table 5.
Maintenance unit cost.
The optimal cost–benefit allocation of repair treatments for a road network in year is determined by maximizing the cumulative cost–benefit of selected maintenance strategies. Instead of directly selecting specific repair actions, the optimization model identifies pavement sections for maintenance, represented by the binary variable . Although the repair action is not explicitly treated as a decision variable, it evolves dynamically over time. The choice of repair action for a given section in year depends on the pavement’s condition, specifically the structural condition of the sublayer, which is influenced by past maintenance decisions, and the IRI condition state, which deteriorates over time as predicted by the MMH model. For instance, if a section was maintained in year , it may require a different (or no) intervention in year . The objective function for year is formulated as follows:
subject to budget constraint
where is the decision that equals 1 if a given section is selected for maintenance and 0 otherwise. Equation (19) ensures that the total expenditure on selected maintenance projects does not exceed the allocated budget for year .
4. Results
4.1. MMH Model Estimation Result
Table 6 presents the results of parameter estimation that involved a total of 40,000 iterations, with the first 20,000 iterations discarded as burn-in samples to ensure convergence, and the remaining 20,000 iterations used for estimation. The heterogeneity factor captures the deterioration characteristics of different pavement types, AC and DBST. AC pavement () deteriorates at a slower rate, whereas DBST pavement () exhibits a faster deterioration rate. Furthermore, all factors, including pavement bearing capacities, traffic loading, and rainfall, demonstrate significant contributions to pavement deterioration. Among these, structural parameters show the most substantial impact, particularly the BLI, which reflects the strength of the top layers subject to high vehicle tire pressure. The convergence of the estimated parameters, , is assessed using Geweke’s z-score in parentheses, with values within indicating convergence.
Table 6.
Parameter estimation through Bayesian MMH model.
Using and along with the average values of bearing capacities (BLI, MLI, and LLI), ESAL, and rainfall, the benchmark hazard rate can be computed using Equation (14). This allows for the estimation of the life expectancy of each condition state, enabling the visualization of the deterioration trend, as illustrated in Figure 6.
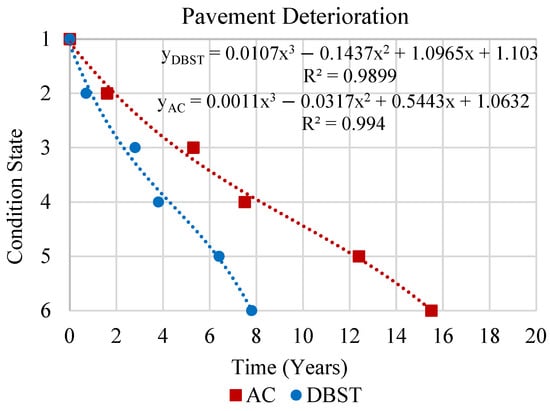
Figure 6.
Pavement deterioration curves.
To account for the diverse deterioration characteristic of pavement and enhance the assessment of maintenance and repair effectiveness through benefit area calculations, pavement is categorized into distinct structural groups in this study. These groups are defined based on the ratings of BLI, MLI, and LLI, which are classified into three condition levels: Sound, Warning, and Severe, as indicated in Table 2. Given this classification, pavements consisting of AC and DBST can be divided into 54 structural groups: 27 for AC and 27 for DBST (see Table 3). By incorporating the average values of ESAL and rainfall, the deterioration curves for these structural groups can be systematically determined and visualized, as shown in Figure 7. AC pavements with Sound ratings for BLI, MLI, and LLI, representing the stiffest structures, have an expected service life of 23.8 years. In contrast, DBST pavements rated Severe in all three indices, representing the weakest structural category, have a projected service life of only 3.2 years. These outcomes demonstrate that even when survey data are limited, as is often the case in developing countries, the Markov model can generate reliable deterioration predictions. By explicitly incorporating uncertainty in the deterioration process, the model avoids the need for decades of historical records, while still providing robust and practical estimates of pavement service life.
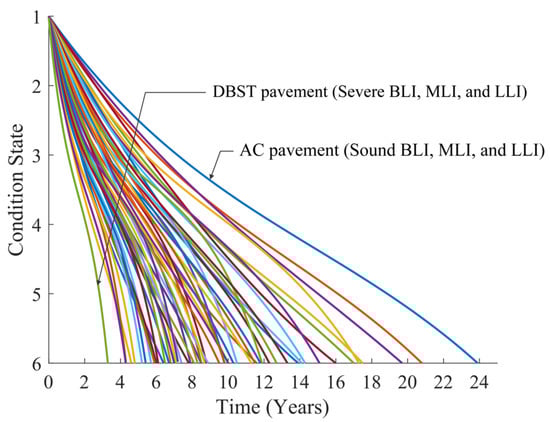
Figure 7.
Deterioration curves through various structural groups (1–54).
The evolution of pavement performance over time can be expressed as , where represents the initial condition state of the road network and denotes the number of time intervals. In this study, the initial condition states are derived from the most recent IRI inspection results. Figure 8 illustrates the condition state distribution based on the estimated transition probability matrix, highlighting the natural degradation over a 10-year period in the absence of maintenance interventions.
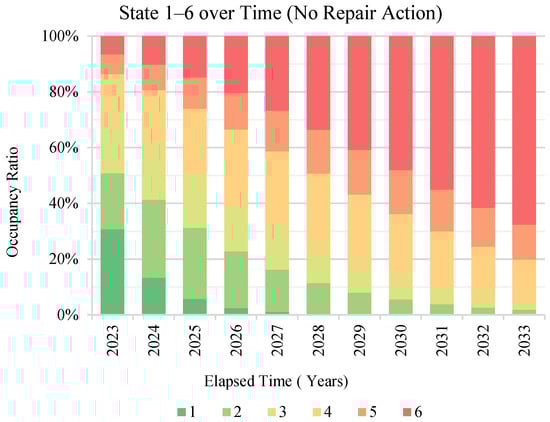
Figure 8.
Condition state evolution of the network with no repairs.
4.2. GA Optimization Result
This study optimizes the selection of pavement sections for maintenance while adhering to annual budget constraints. Multiple budget scenarios were examined over a 10-year period (2024–2033) to assess their impact on network pavement conditions. The analyzed budget allocation included USD 12 million, USD 15 million, USD 18 million, USD 21 million, USD 24 million, and USD 27 million per year. This case study focuses on Cambodia’s road network, which comprises approximately 275.7 km of AC pavements and 332.7 km of DBST pavements. The GA identifies the optimal allocation of maintenance treatments that maximizes the network-wide cost–benefit ratio under each of these budget scenarios. To evaluate the efficiency of the optimization process, it is essential to use a diagram that visualizes the convergence of the solution. The performance plots in Figure 9 illustrate the USD 18 M-per-year scenario, demonstrating that the GA model successfully converged to optimal solutions within 500 iterations.
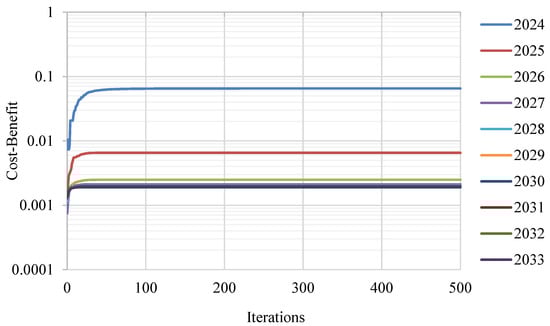
Figure 9.
GA iteration process ($18M/Year Scenario).
Figure 10 presents the impact of six budget scenarios examined over a 10-year period (2024–2033) on the progress of network performance. The analysis indicates that as the annual budget allocation increases, the overall condition of the road network improves. When the annual budget reaches USD 18 million, the percentage of roads in condition state 6 stabilizes below 10%.
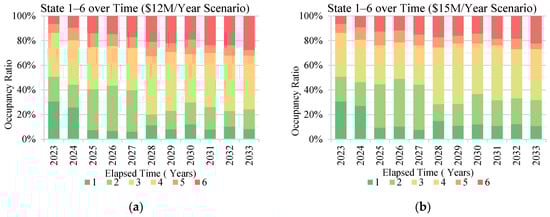
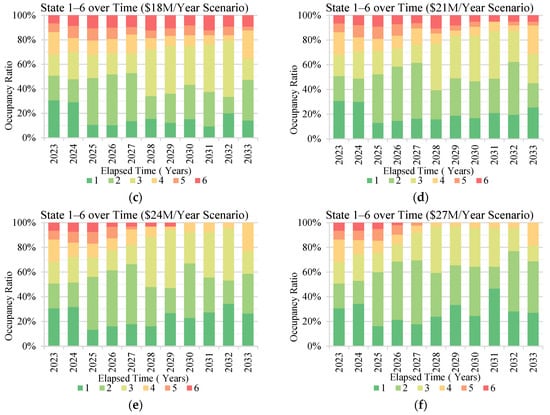
Figure 10.
Condition state evolution of network under various annual budget scenarios: (a) USD 12 M, (b) USD 15 M, (c) USD 18 M, (d) USD 21 M, (e) USD 24 M, and (f) USD 27 M.
To effectively assess the impact of different budget levels on the network performance, the overall or average IRI condition state can be calculated over time for each budget scenario in relation to a predefined performance threshold. In this study, condition state 3 (IRI ≤ 4 m/km) is set as an acceptable criterion that the road network should maintain throughout the maintenance planning period. The projected overall IRI condition state under various budget scenarios is illustrated in Figure 11.
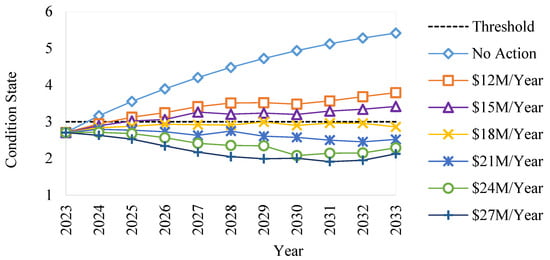
Figure 11.
Predicted IRI condition state over the year under various budget scenarios.
The results suggest that a USD 18 million annual budget is the optimal budget level, ensuring functionality and serviceability while maintaining cost-effectiveness and maximizing benefits over the planned 10-year life cycle. Based on these findings, the analysis of the maintenance plan provides a detailed policy framework to assist road administrators in decision-making. This framework includes an assessment of maintenance costs associated with various repair strategies implemented annually for road networks, as depicted in Figure 12.
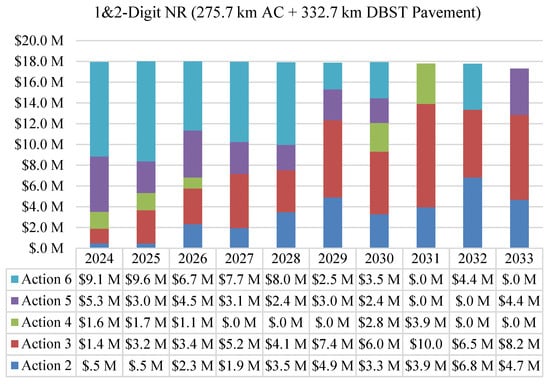
Figure 12.
Maintenance expenditure by repair action type ($18M/Year Scenario).
Notably, the highest cost–benefit ratio was achieved in the base year 2024 (Year 1), followed by a progressive decline in subsequent years. The trend of this scenario may result from improvements in the bearing capacities of road segments due to early maintenance interventions. As pavement conditions are enhanced in the initial years, their lifespan is extended, requiring only minor repair treatments in later years. For instance, major repair actions such as rehabilitation and reconstruction dominate in the early years, but their application decreases significantly in later years. This trend suggests a strategic shift from heavy repair works toward minor ones, such as preventive and corrective maintenance.
Furthermore, the performance trends of eight representative road sections under the USD 18 M annual scenario are shown in Figure 13. The analysis highlights the need for segment-specific maintenance scheduling based on surface condition and structural condition. For instance, NR78_32000_32100, initially in condition state 6, receives priority treatment in 2024, with no further intervention required until 2030. This indicates that timely maintenance can restore surface and structural conditions and sustain performance over several years. Conversely, NR1_63500_63600, despite initially being in good surface condition, exhibits a faster rate of deterioration and, therefore, warrants early maintenance intervention by 2026 to avoid performance decline. In contrast, maintenance work for segments with slower deterioration rates because of their strong structural conditions, such as NR55_15800_15900 and NR67_37600_37700, can be deferred until 2030 and 2033, respectively.
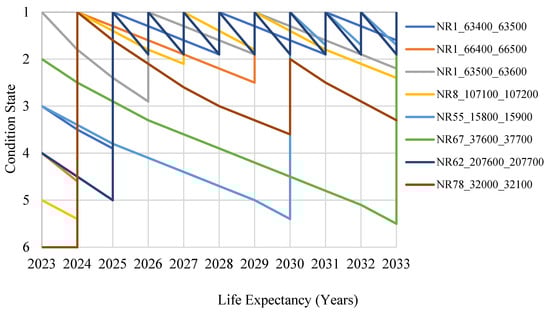
Figure 13.
Performance of eight selected road segments ($18M/Year Scenario).
Moreover, the cumulative cost–benefit outcomes calculated over a 10-year planning period (2024–2033) in this study are compared against those of a GrA, under a fixed annual budget of USD 18 million. Figure 14 presents a comparative analysis of the cumulative cost–benefit achieved by both algorithms. Over the decade, both algorithms exhibit consistent year-over-year growth in total cost–benefit, reflecting sustained improvements in maintenance outcomes. However, the GA achieves a slightly higher cumulative cost–benefit (0.4152) by the end of the planning period, outperforming the GrA (0.4088).
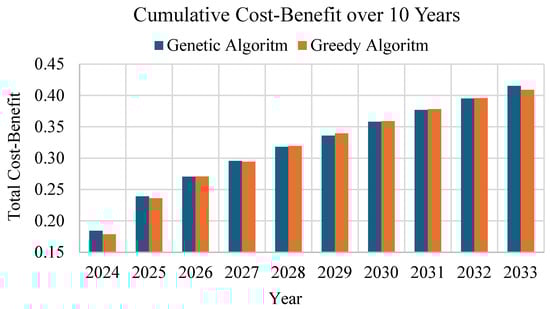
Figure 14.
Cumulative cost–benefit: genetic vs. greedy algorithm.
Furthermore, the GA indicates a more flexible and nuanced allocation strategy, effectively balancing immediate needs and long-term objectives, as illustrated in Figure 15 and Figure 16. In contrast, the GrA predominantly prioritizes major repair actions (e.g., Action 6: reconstruction), adhering to a step-by-step, locally optimal solutions that may neglect broader systematic benefits. These findings suggest that the GA’s global optimization approach yields better long-term results compared to the GrA’s localized decision-making, reinforcing its suitability for large-scale multi-year maintenance planning.
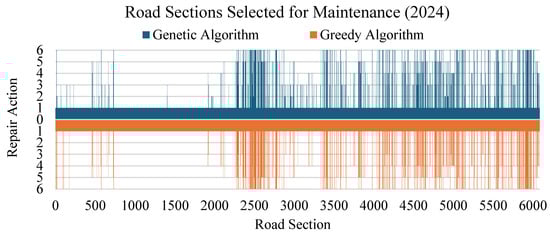
Figure 15.
Road maintenance selection: genetic vs. greedy algorithm.
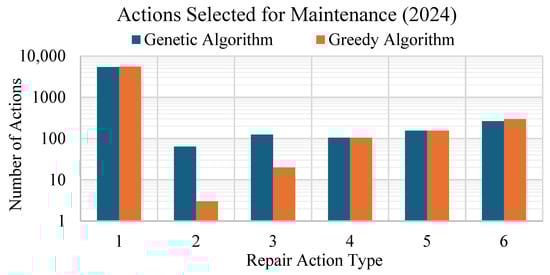
Figure 16.
Repair action selected for maintenance: genetic vs. greedy algorithm.
5. Discussion
The proposed framework consists of two core components: deterioration forecasting and maintenance planning optimization. While the prediction of deterioration plays a pivotal role, the model specifically focuses on estimating the relative influence of various factors contributing to the deterioration process. Meanwhile, the optimization component aligns with Cambodia’s current multi-year rolling maintenance policy, shifting decision-making from subjective, human-based approaches toward objective, data-driven strategies. The framework allows maintenance planning to be dynamically updated based on annual government budget allocations and applied maintenance strategies without requiring a full restart of the planning process.
A notable observation from the parameter estimation results is the occurrence of inverted relationships for certain parameters across specific condition transitions (e.g., ESAL during the transitions from state 1 → 2 and 4 → 5). These counterintuitive results may stem from data reliability issues and an insufficient sample size, which can affect the stability of the estimated parameters. In this study, ESAL values were determined using conventional traffic count methods that assume fixed vehicle classifications and axle configurations, potentially misrepresenting actual field conditions.
To enhance input reliability, automated traffic load measurement systems, such as Weigh-In-Motion (WIM), are recommended. These systems provide continuous, reliable axle load data, which can significantly improve deterioration predictions []. Additionally, a richer and more frequent pavement monitoring dataset is essential to ensure a consistent and realistic relationship between influencing factors and all deterioration states. Regular inspections and expanded datasets would enable more robust calibration, better capturing deterioration dynamics and variability across the network.
Additionally, as the transition probability matrix in the MMH model is derived from the joint probability distribution of multiple influencing factors, introducing numerous variables can also complicate model convergence. This is evidenced by Geweke’s z-scores falling outside the acceptable range of for some parameters. This highlights the need for careful and accurate data collection using modern technology to ensure reliable input.
6. Conclusions
In this study, an optimal pavement maintenance framework at the network level is presented by integrating a mixed Markov hazard (MMH) model to predict the deterioration curves of road segments. Key factors influencing deterioration include pavement bearing capacities—specifically the Base Layer Index (BLI), Middle Layer Index (MLI), and Lower Layer Index (LLI), traffic load (ESAL), and environmental conditions such as rainfall. Road sections were classified into 54 groups based on structural condition ratings of BLI, MLI, and LLI (Sound, Warning, and Severe) to account for varied deterioration patterns. This clustering enabled a more accurate analysis of deterioration within the network.
A genetic algorithm (GA) was employed under six annual budget scenarios (USD 12, USD 15, USD 18, USD 21, USD 24, and USD 27 million) over a 10-year planning horizon to optimize maintenance planning. The findings indicate that an annual budget of $18 million provides the most effective maintenance policy, providing the best balance between maximizing benefits and budget allocation while meeting performance criteria. In this scenario, the IRI condition state 6 is kept below 10% by the end of the design period and sustains overall performance within IRI condition state 3 (IRI ≤ 4 m/km) throughout the planning period. Additionally, the study offers a comprehensive breakdown of annual maintenance costs and repair strategies for road networks, providing a tailored approach to each road section’s needs.
The comparison between GA and the greedy algorithm (GrA) highlights the core contribution of this study: GA achieves a more cost-effective and optimal solution over the planning horizon, outperforming GrA in terms of benefit maximization and budget allocation efficiency. The comparison shows that GA provides a cost–benefit of 0.4152, up to 1.6% higher than GrA (0.4088) under the same budget allocation, without exceeding the available budget. While the performance gap is moderate for smaller networks, the advantage of GA may become increasingly significant for larger and more complex networks, demonstrating the scalability and effectiveness of the proposed framework. This quantifiable advantage highlights that the additional computational complexity of GA translates into tangible improvements in effectiveness, making it a more superior algorithm for efficient road asset management.
The findings of this study contribute significantly to data-driven decision-making for road asset management, aiding transportation authorities in prioritizing maintenance strategies within budget constraints while ensuring optimal road performance over time. Importantly, because the model predicts the IRI condition state based on structural parameters that can change over time, routine FWD data collection is recommended to update input parameters and support dynamic maintenance planning.
Nevertheless, several limitations should be acknowledged. First, the deterioration model would benefit from calibration using long-term inspection and maintenance history, improving its predictive validity. Second, the current GA optimization approach simplifies input variability by using average values for traffic load and rainfall across structural categories. While this reduces complexity, it may overlook the impact of regional and temporal variability.
Future research should consider advanced GA techniques, such as parallel GA, hybrid GA, or adaptive GA, capable of efficiently navigating larger and more complex search spaces. This would enhance scalability and solution quality, particularly in large-scale network optimization under diverse operational conditions.
Author Contributions
Conceptualization, N.S., F.O., K.S. and K.K.; methodology, N.S., F.O., K.S. and K.K.; software, N.S., F.O., K.S. and K.K.; formal analysis, N.S.; investigation, N.S.; resources, N.S.; data curation, N.S.; writing—original draft preparation, N.S.; writing—review and editing, N.S., F.O., K.S. and K.K.; supervision, K.K. All authors have read and agreed to the published version of the manuscript.
Funding
This work was (partially) supported by the Council for Science, Technology and Innovation (CSTI), Cross-ministerial Strategic Innovation Promotion Program (SIP), 3rd period of SIP “Smart Infrastructure Management System”, Grant Number JPJ012187 (funding agency: Public Works Research Institute).
Data Availability Statement
The data supporting the findings of this study are available from the corresponding author upon reasonable request.
Acknowledgments
The authors thank the Road Data Collection and Management Unit (RDCMU), Ministry of Public Works and Transport (MPWT) of Cambodia, for providing the data utilized in this study.
Conflicts of Interest
The authors declare no conflicts of interest.
References
- Peraka, N.S.P.; Biligiri, K.P. Pavement Asset Management Systems and Technologies: A Review. Autom. Constr. 2020, 119, 103336. [Google Scholar] [CrossRef]
- Yamany, M.S.; Cawley, L.; Reza, I.; Ksaibati, K. Network-Level Pavement Maintenance and Rehabilitation Planning Using Genetic Algorithm. Innov. Infrastruct. Solut. 2024, 9, 208. [Google Scholar] [CrossRef]
- Chootinan, P.; Chen, A.; Horrocks, M.R.; Bolling, D. A Multi-Year Pavement Maintenance Program Using a Stochastic Simulation-Based Genetic Algorithm Approach. Transp. Res. Part Policy Pract. 2006, 40, 725–743. [Google Scholar] [CrossRef]
- Chen, W.; Zheng, M. Multi-Objective Optimization for Pavement Maintenance and Rehabilitation Decision-Making: A Critical Review and Future Directions. Autom. Constr. 2021, 130, 103840. [Google Scholar] [CrossRef]
- Bhandari, S.; Luo, X.; Wang, F. Understanding the Effects of Structural Factors and Traffic Loading on Flexible Pavement Performance. Int. J. Transp. Sci. Technol. 2023, 12, 258–272. [Google Scholar] [CrossRef]
- Ben-Akiva, M.; Humplick, F.; Madanat, S.; Ramaswamy, R. Infrastructure Management under Uncertainty: Latent Performance Approach. J. Transp. Eng. 1993, 119, 43–58. [Google Scholar] [CrossRef]
- Chang, C.M.; Salas, R.; Smith, R.E. Advancing Pavement Management Systems Using a Two-Tier Probabilistic Performance Modeling Approach for Improved Condition Forecasting and Budgeting Analysis. Int. J. Transp. Sci. Technol. 2025. [Google Scholar] [CrossRef]
- AASHTO. Pavement Management Guide, 2nd ed.; American Association of State Highway and Transportation Officials: Washington, DC, USA, 2012; ISBN 978-1-68015-231-9. [Google Scholar]
- Xiao, F.; Shi, B.; Gao, J.; Chen, H.; Yang, D. Enhanced Probabilistic Prediction of Pavement Deterioration Using Bayesian Neural Networks and Cuckoo Search Optimization. Sci. Rep. 2025, 15, 8665. [Google Scholar] [CrossRef]
- Obunguta, F.; Matsushima, K. Optimal Pavement Management Strategy Development with a Stochastic Model and Its Practical Application to Ugandan National Roads. Int. J. Pavement Eng. 2022, 23, 2405–2419. [Google Scholar] [CrossRef]
- Han, D. Heterogeneous Deterioration Process and Risk of Deficiencies of Aging Bridges for Transportation Asset Management. Sustainability 2021, 13, 7094. [Google Scholar] [CrossRef]
- Tsuda, Y.; Kaito, K.; Aoki, K.; Kobayashi, K. Estimating Markovian Transition Probabilities for Bridge Deterioration Forecasting. Struct. Eng. Eng. 2006, 23, 241s–256s. [Google Scholar] [CrossRef]
- Kobayashi, K.; Kaito, K.; Lethanh, N. A Bayesian Estimation Method to Improve Deterioration Prediction for Infrastructure System with Markov Chain Model. Int. J. Archit. Eng. Constr. 2012, 1, 1–13. [Google Scholar] [CrossRef]
- Mbwana, J.R.; Turnquist, M.A. Optimization Modeling for Enhanced Network-Level Pavement Management System. Transp. Res. Rec. 1996, 1524, 76–85. [Google Scholar] [CrossRef]
- Pierce, L.M.; McGovern, G.; Zimmerman, K.A. Practical Guide for Quality Management of Pavement Condition Data Collection; Federal Highway Administration: Washington, DC, USA, 2013.
- Wang, J.; Chen, M.; Gao, W.; Guo, Z.; Liu, Y. A Comparison of Network Level Pavement Condition Assessment in Road Asset Management. Int. J. Transp. Eng. Technol. 2020, 6, 95. [Google Scholar] [CrossRef]
- Kargah-Ostadi, N.; Stoffels, S.M.; Tabatabaee, N. Network-Level Pavement Roughness Prediction Model for Rehabilitation Recommendations. Transp. Res. Rec. 2010, 2155, 124–133. [Google Scholar] [CrossRef]
- Katicha, S.W.; Shrestha, S.; Flintsch, G.W.; Diefenderfer, B.K. Network Level Pavement Structural Testing with the Traffic Speed Deflectometer; Virginia Transportation Research Council (VTRC): Charlottesville, VA, USA, 2020.
- Zhang, M.; Zhang, J.; Gong, H.; Jia, X.; Xiao, R.; Huang, H.; Huang, B. Numerical Investigation of Pavement Responses under TSD and FWD Loading. Constr. Build. Mater. 2022, 318, 126014. [Google Scholar] [CrossRef]
- Hamidi, A.; Mirhosseini, A.F.; Hoff, I.; Mork, H.; Grannes, K.R.B.; Aursand, P.O. Comparative Evaluation of Falling Weight Deflectometer, Traffic Speed Deflectometer and Rapid Pavement Tester in Deflection Measurement. Transp. Res. Rec. 2025, 2679, 1475–1494. [Google Scholar] [CrossRef]
- Fwa, T.; Chan, W.; Hoque, K. Analysis of Pavement Management Activities Programming by Genetic Algorithms. Transp. Res. Rec. 1998, 1643, 1–6. [Google Scholar] [CrossRef]
- Slowik, A.; Kwasnicka, H. Evolutionary Algorithms and Their Applications to Engineering Problems. Neural Comput. Appl. 2020, 32, 12363–12379. [Google Scholar] [CrossRef]
- Mathew, B.S.; Isaac, K.P. Optimisation of Maintenance Strategy for Rural Road Network Using Genetic Algorithm. Int. J. Pavement Eng. 2014, 15, 352–360. [Google Scholar] [CrossRef]
- IRITWG. Overview of the Transport Infrastructure Sector in the Kingdom of Cambodia, 7th ed.; Infrastructure and Regional Integration Technical Working Group (IRITWG): Phnom Penh, Cambodia, 2023.
- Royal Government. Comprehensive Master Plan on Cambodia Intermodal Transport and Logistics System 2023–2033; Royal Government: Phnom Penh, Cambodia, 2023.
- Bun, V. Project Information Document-Integrated Safeguards Data Sheet—KH-Road Asset Management Project II Additional Financing—P165249 (English); World Bank Group: Washington, DC, USA, 2018. [Google Scholar]
- World Bank. Cambodia—Road Asset Management Project: Additional Financing—Environmental Assessment: Site Specific Environmental Management Plan for National Road 4 (English); World Bank: Phnom Penh, Cambodia, 2018. [Google Scholar]
- Thao, N.D.; Aoki, K.; Kato, T.; Toan, T.N.; Kobayashi, K.; Kaito, K. A Practical Process to Introduce a Customized Pavement Management System in Vietnam. J. JSCE 2015, 3, 246–258. [Google Scholar] [CrossRef]
- Han, C.; Huang, J.; Yang, X.; Chen, L.; Chen, T. Long-Term Maintenance Planning Method of Rural Roads under Limited Budget: A Case Study of Road Network. Appl. Sci. 2023, 13, 12661. [Google Scholar] [CrossRef]
- Thegeya, A.; Mitterling, T.; Martinez, A.; Bulan, J.A.N.; Durante, R.L.; Mag-atas, J. Application of Machine Learning Algorithms on Satellite Imagery for Road Quality Monitoring: An Alternative Approach to Road Quality Surveys; ADB Economics Working Paper Series; Asian Development Bank (ADB): Mandaluyong City, Philippines, 2022. [Google Scholar]
- Albuquerque, F.S.; Núñez, W.P. Development of Roughness Prediction Models for Low-Volume Road Networks in Northeast Brazil. Transp. Res. Rec. 2011, 2205, 198–205. [Google Scholar] [CrossRef]
- Tamagusko, T.; Ferreira, A. Machine Learning for Prediction of the International Roughness Index on Flexible Pavements: A Review, Challenges, and Future Directions. Infrastructures 2023, 8, 170. [Google Scholar] [CrossRef]
- Ghodratabadi, M.; Golroo, A.; Entezari, M.S. Machine Learning for Predicting Pavement Roughness and Optimising Maintenance. Road Mater. Pavement Des. 2025, 1–20. [Google Scholar] [CrossRef]
- Horak, E. Benchmarking the Structural Condition of Flexible Pavements with Deflection Bowl Parameters. J. S. Afr. Inst. Civ. Eng. 2008, 50, 2–9. [Google Scholar]
- Kim, Y.R.; Hibbs, B.O.; Lee, Y.-C. Temperature Correction of Deflections and Backcalculated Asphalt Concrete Moduli. Transp. Res. Rec. 1995. Available online: https://www.semanticscholar.org/paper/TEMPERATURE-CORRECTION-OF-DEFLECTIONS-AND-ASPHALT-Kim-Hibbs/69a818218e00a74b17859d6b921bea3ea09b4019 (accessed on 10 August 2025).
- Lukanen, E.; Stubstad, R.; Briggs, R. LTPP Guide to Asphalt Temperature Prediction and Correction; FHWA-RD-98-085; U.S. Federal Highway Administration (FHWA): Washington, DC, USA, 2002; p. 71.
- Březina, I.; Machel, O.; Zavřel, T. Temperature Correction of Deflections and Backcalculated Elasticity Moduli Determined from Falling Weight Deflectometer Measurements on Asphalt Pavements. Commun.-Sci. Lett. Univ. Zilina 2022, 24, D1–D8. [Google Scholar] [CrossRef]
- Garasia, K.; Juremalani, J. Modification of Temperature Correction Factor in Fwd Based On Field Experience in Indian Context. Int. J. Civ. Eng. Technol. 2019, 10, 1239–1251. [Google Scholar]
- Smith, K.D.; Bruinsma, J.E.; Wade, M.J.; Chatti, K.; Vandenbossche, J.; Yu, H.T. Using Falling Weight Deflectometer Data with Mechanistic-Empirical Design and Analysis; Federal Highway Administration: Washington, DC, USA, 2017; Volume I.
- Sovanneth, N.; Sasai, K.; Obunguta, F.; Kaito, K. Defining Structural Thresholds for Cambodian Pavements Using Stochastic Approach. In Life-Cycle Performance of Structures and Infrastructure Systems in Diverse Environments; Taylor & Francis: Abingdon, UK, 2025. [Google Scholar]
- AASHTO. Guide for Design of Pavement Structures; American Association of State Highway and Transportation Officials: Washington, DC, USA, 1993; Volume 1. [Google Scholar]
- Obama, K.; Okada, K.; Kaito, K.; Kobayashi, K. Disaggregated Hazard Rates Evaluation and Bench-Marking. J. Jpn. Soc. Civ. Eng. 2008, 64, 857–874. [Google Scholar] [CrossRef]
- Han, D.; Kaito, K.; Kobayashi, K. Application of Bayesian Estimation Method with Markov Hazard Model to Improve Deterioration Forecasts for Infrastructure Asset Management. KSCE J. Civ. Eng. 2014, 18, 2107–2119. [Google Scholar] [CrossRef]
- Goldberg, D.E. Genetic Algorithm in Search, Optimization and Machine Learning, Addison; Wesley Publishing Company: Reading, MA, USA, 1989; Volume 1, p. 9. [Google Scholar]
- Santos, J.; Ferreira, A.; Flintsch, G. An Adaptive Hybrid Genetic Algorithm for Pavement Management. Int. J. Pavement Eng. 2019, 20, 266–286. [Google Scholar] [CrossRef]
- Bo, W.; Qian, Z.; Yu, B.; Ren, H.; Yang, C.; Zhao, K.; Zhang, J. MILP-Based Approach for High-Altitude Region Pavement Maintenance Decision Optimization. Appl. Sci. 2024, 14, 7670. [Google Scholar] [CrossRef]
- Sujon, M.A. Weigh-in-Motion Data-Driven Pavement Performance Prediction Models. Ph.D. Dissertation, West Virginia University, Morgantown, WV, USA, 2023. [Google Scholar]
Disclaimer/Publisher’s Note: The statements, opinions and data contained in all publications are solely those of the individual author(s) and contributor(s) and not of MDPI and/or the editor(s). MDPI and/or the editor(s) disclaim responsibility for any injury to people or property resulting from any ideas, methods, instructions or products referred to in the content. |
© 2025 by the authors. Licensee MDPI, Basel, Switzerland. This article is an open access article distributed under the terms and conditions of the Creative Commons Attribution (CC BY) license (https://creativecommons.org/licenses/by/4.0/).