Abstract
Electric vehicles have a limited driving range compared to conventional vehicles. This paper aims to present a particular study of the performances of electric vehicles based on real driving conditions on a cycle carried out using the general conditions of European Regulation regarding RDE tests. In this sense, a modern electric SUV was used and experimental tests were conducted using a measuring equipment connected to the vehicle via the OBD2 plug. The experimental results will be analyzed and presented in the following sections, and the main influencing factors on the energy performances (range, state of charge, energy consumption) that may occur in real running conditions will be identified.
1. Introduction
Determining the dynamic and energetic performances of electric vehicles (EVs) under real-world conditions is a topic of major interest in the specialized literature, given the accelerated expansion of electromobility and the need to understand the differences between the values obtained in standardized cycles and the behavior of the vehicle in everyday use. Studies have shown that parameters such as driving style, road profile, ambient temperature, and traffic density can influence the energy consumption of electric vehicles by over 20–40%, justifying the importance of real-world analyses [1].
The wide-scale adoption of electric vehicles is influenced by a set of technical, economic, social, and environmental factors, each of which contributes to both the advantages and disadvantages of the electric solution.
From a technical perspective, electric vehicles offer advantages such as high efficiency, instantaneous torque, low noise, and the possibility of recovering kinetic energy during deceleration phases. At the same time, the limitations regarding the real range and the sensitivity of the battery to low temperatures continue to be intensely discussed. In [2] the authors have highlighted, through real measurements carried out on fully electric vehicles, that consumption variations depend considerably on the driving style and local traffic conditions, with differences of up to 25% compared to the values estimated in the standardized procedures. These results are complemented by large-scale analyses such as the one carried out by [3], which have demonstrated the importance of charging infrastructure and daily use on energy consumption.
From a social, economic, and environmental point of view, the development of electric vehicles is closely linked to the reduction in local emissions and the improvement of the quality of urban life. LCA (Life Cycle Assessment) analyses, such as the one carried out by the authors of [4], underline the fact that electric vehicles can significantly reduce emissions during their use, although battery production and their management still pose challenges. Paper [5] showed that consumer perceptions regarding autonomy, charging infrastructure, and acquisition costs significantly influence the rate of adoption, as they are essential elements for the overall context of electric mobility.
The use of electric vehicles (EVs) is viewed as an attractive option to reduce CO2 emissions and fuel consumption resulting from the transport sector, but the popularization of EVs has been hindered by the cruising range limitation and the charging process inconvenience. Energy consumption characteristics are the important foundation to study charging infrastructures locating, eco-driving behavior, and energy saving route planning, which are helpful to extend EVs’ cruising range [6,7].
Although the determination of pollutant emissions was not the primary focus, as there is no logical basis for this for an electric propulsion system, some hardware and software equipment is still needed to facilitate communication with the vehicle and to allow the recording of some data of interest that can later be used in the validation of the realized simulation model, such as the speed profile of the real cycle, the obtained energy consumption, and the autonomy of the vehicle.
However, reducing road emissions is a common challenge in metropolitan cities. Given this, numerous studies have shown that the electrification of the public service fleet is an effective solution to reduce pollution and the carbon footprint in the transport sector. Despite this, the implementation of electric vehicles is currently limited by factors such as the high cost of ownership, the limited autonomy of the vehicles, and the lack of availability of appropriate charging points for their operation, as well as the lack of incentives and government policies for the benefit of sustainable mobility [7].
In order to achieve all these points and comply with some basic conditions regarding the measurement on a real cycle, the existing conditions in the European regulations (EU) 2017/1151 [8], and (EU) 2018/1832 [9], with their amendments will be analyzed and used. The basic conditions also apply to an electric vehicle when determining its energy consumption and range.
In terms of current regulations, the assessment of dynamic and energy performances in real conditions is aligned with European standards such as the WLTP (Worldwide Harmonized Light Vehicles Test Procedure), which sets requirements for the speed profile, the ambient temperature, and the way to measure energy consumption. In parallel, EU Regulation 2018/1832 introduces updates to determine consumption and range in conditions close to real use, while RDE (Real Driving Emission) procedures are used complementarily to capture the effects of traffic variability on energy performance. In this context, the recent literature highlights the need to correlate results obtained on dynamometers with tests carried out on real routes to obtain a complete assessment of vehicle behavior [10].
Several studies have investigated the performance of EVs in real conditions. The authors of [11] analyzed the variation in energy consumption in relation to driving style and climatic conditions, highlighting differences of over 30% compared to the values in standardized cycles. In paper [12], the authors demonstrated the importance of temperature on the efficiency of thermal management systems, while [10] compared the dynamic performances obtained through numerical simulations with those obtained experimentally, suggesting the need to calibrate the models based on real data.
Experimental determination of performance requires precise data acquisition methods, including the use of high-accuracy GPS systems, CAN sensors, and equipment dedicated to measuring energy flows. Correlating this data with numerical modeling and simulation involves the development of parameterized models that faithfully reproduce the behavior of the vehicle depending on the rolling resistance, speed profile, and control strategy. A critical aspect is the validation of the models based on real data, as well as the identification of their limitations under extreme operating conditions.
In order to study the behavior of an electric vehicle and to take into account all of the existing influencing factors [13], this paper approaches the determination of the performances in real driving conditions for an electric vehicle using an low-cost diagnosis equipment, as presented by the authors in [14], with the aim of identifying all the advantages as well as the disadvantages of using an electric vehicle in different driving conditions (e.g., urban, extra-urban, or highway) or on established routes such as city–airport trips [14]. The purpose of the experiment is to determine both the variation in energy consumption on a predetermined route and the variation in autonomy via a detailed analysis while considering the internal and external factors that influence these performances via the subsequent analysis of sustainable solutions to optimize the dynamic and energetic performances of an electric vehicle [15].
Also, this paper proposes a comparative analysis using the numerical simulation of the dynamic and energetic performances of an electric SUV vehicle when running on a real cycle and on a standardized cycle (WLTC—Worldwide Harmonized Light Vehicles Test Cycle). Through the multitude of results obtained from the simulation and the optimization of the basic model in accordance with certain internal and external factors of influence, a tool for experimental research of the performance of electric vehicles is developed so that it can be used by specialists in the field of scientific and research activity, as well as for the elaboration of future studies with a role of optimization or development, allowing conclusive analysis in this branch of the industry.
The following topics will be analyzed in turn in the following sections: the structure of the vehicle used for experimental research, the conditions that were considered in accordance with the mentioned regulations, and the experimental results obtained.
To facilitate the understanding of this paper, a brief presentation of the sections comprising the stages of this study is provided:
Section 2 (Materials and Methods) presents the electric vehicle specifications and construction data used to parameterize the simulation model, the legislative conditions imposed for experimental research, the equipment used for measurements, the conditions under which the route was established, and a series of simplifying hypotheses for the development of the simulation model.
Section 3 (Development of the Simulation Model) presents the simulation environment (MATLAB 2022–Simulink), the conditions established for simulations, and the standardized cycle used in this study (WLTC).
Section 4 (Results) presents the main results from this study for both cases, experimental results and simulation results (for driving on the proposed cycle and the WLTC), and a brief analysis of factors influencing energy performance using the simulation model.
Section 5 (Discussion) presents the most important data obtained from this study and uses it to show the impact of this paper in the field of electric vehicles and the importance of the simulation model for studying their performances.
Section 6 (Conclusions) presents the final conclusions identified by the authors at the end of this study.
2. Materials and Methods
2.1. Electric Vehicle Specifications
The Skoda ENIAQ iV 80 model, which is the first electric SUV produced by Skoda, was chosen for the experimental test, considering the requirements for running in all areas mentioned in the regulation (EU) 2018/1832. The constructive particularity of this vehicle is related to the platform on which the propulsion system is mounted, called MEB (Modularer E-Antriebs-Bauksten) [16], which translates to a modular kit that allows the implementation of an electric propulsion system.
This platform is common in the VAG (Volkswagen & Audi Group) and has the advantage that it can be used on several models of electric vehicles. During experimental research, the vehicle uses the rear-wheel drive solution.
2.2. Legislative Conditions Imposed on Experimental Research
ANNEX III A from [9] presents several types of requirements and conditions that must be considered when carrying out RDE homologation tests. Given that this work strictly addresses a vehicle equipped with an electric propulsion system, only some parts of the respective conditions that apply, regardless of the type of fuel or propulsion system used, were extracted for the experiments.
These conditions were tracked and considered in the experimental measurements in this paper as follows:
- Driving in an urban environment is characterized by speeds lower than or equal to 60 km/h;
- Rural driving is characterized by speeds greater than 60 km/h and less than or equal to 90 km/h;
- Driving on the highway is characterized by speeds over 90 km/h;
- The cycle must consist of approximately 34% urban driving, 33% rural driving, and 33% highway driving;
- The duration of the cycle must be between 90 and 120 min;
- The minimum distance for each type of driving (urban, rural, and highway) must be 16 km.
2.3. The Equipment Used to Carry Out the Experimental Tests
Considering that the experimental tests are based on running on a real cycle in order to acquire the necessary data, the Bosch KTS 590 module from ESI [tronic] is used. This device allows a fast and efficient connection between the vehicle and the laptop via a cable that connects through the OBD socket and allows communication with the vehicle’s computer. KTS is part of the category of multi-brand devices with the possibility of connecting to most vehicles on the market and is a module that deals with the diagnosis of control units. The advantage of using the KTS module in the experimental tests in this work is related to the fact that it can be powered directly through the OBD socket, which allows driving for a longer period of time with the vehicle without the need for an external power source, which also simplified the placement of the data acquisition “installation” in the vehicle. Also, the equipment used has a low acquisition cost and high measurement accuracy (0.5 s).
The use of this equipment for data acquisition (KTS), being one intended for diagnostics, represents a personal idea of the authors in this paper to diversify data acquisition solutions with low-cost equipment, considering other methods used and analyzed by the authors in papers that deal with similar topics, such as the use of GPS according to [7].
Using the connection to the vehicle computer via the OBD socket and communication with the CAN network, the KTS module allows the measurement of several characteristic quantities of the set driving cycle in real time. In addition, it also allows the saving of the obtained graphs as a function of time and the subsequent conversion of the files to a form that is automatically saved in the device’s memory, such as in .xlsx-type files that allow for the rapid processing of the measured data and help in the detailed analysis of the experimental results obtained. Figure 1 shows a schematic diagram of the way to connect the KTS module to the vehicle OBD socket, along with the laptop used as an interface for the command and control of the module and for data acquisition:
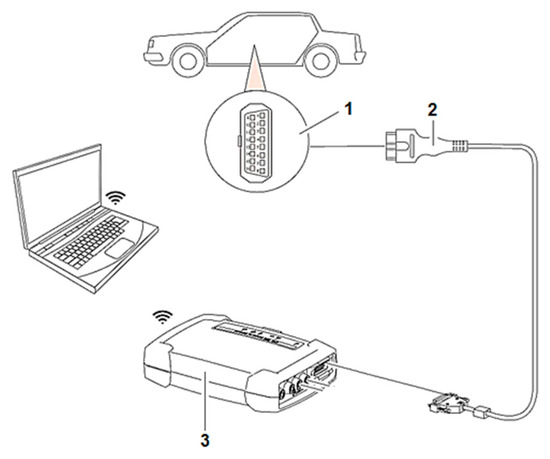
Figure 1.
Schematic diagram of the connection plan for KTS 560/590 [17]. 1: OBD connection on board the vehicle; 2: OBD connection cable; 3: KTS module.
The following parameters were extracted through the KTS module:
- The variation in speed over time;
- The variation in the speed of the electric motor over time;
- The electric motor torque–driver option;
- The battery’s state of charge (SOC) over time;
- The variation in the working voltage of the traction battery;
- The variation in the intensity of the electric current absorbed by the inverter from the traction battery;
- Energy consumed during the actual cycle performed [kWh];
- Energy consumption achieved during the real cycle [kWh/100 km].
2.4. Route Selection and Vehicle Instrumentation
For the chosen route, in addition to the conditions imposed by the European regulation, an important motivation is the three sections of the road, considering the speed limits allowed by the road laws imposed in Romania, the traffic conditions, and the fact that the three sections considered largely respected the test cycle in terms of force and the WLTC. It was possible to drive at low speeds following the low phase of the cycle, after which the driving speed increases to the extra-urban speed, which is similar to the medium and high phases. Also, the driving regime on the highway allowed driving at high speeds, similar to the extra-high phase.
The tests were carried out in Bucharest and the surrounding areas, and the starting point was in the inner yard of the Faculty of Transport in the laboratory area of the Department of Road Vehicles, where the vehicle was charged at a 11 kW/32A station and its instrumentation was carried out. Then, in order to avoid changing the slope of the road, the direct exit through “Iuliu Maniu” Boulevard was avoided, and the area from “Doina Cornea” Boulevard was chosen, after which the route followed its course to “Virtutii” Road through “Iuliu Maniu” Boulevard, then onto “Splaiul Independetei” to the Northern Railway Station, and finally on “Calea Grivitei” towards the exit from Bucharest towards Chitila. This portion constituted the running part in the urban area, which is until the exit on the Bucharest Ring Road. Then, the route continued on the belt until the entrance to the A3 Bucharest–Ploiesti Highway (a portion considered the extra-urban cycle), and finally a part of the Highway was traveled to complete the cycle. Obviously, through the higher speeds required to achieve the extra-urban cycle and the one on the highway, they determined the increase in the distance traveled so that the time is proportional to that in the urban environment.
The route is presented in Figure 2 through points of interest that helped shape it.

Figure 2.
Map of the route established for research.
Instrumentation of the vehicle consisted of connecting the KTS module to the OBD plug of the vehicle located in the driver’s seat area, which is on the left side under the steering wheel, allowing the connection between the module and the laptop with the KTS ESI [tronic] interface, where the parameters were monitored and stored throughout the trials. To ensure the best possible contact during the tests and to avoid disconnection of the diagnostic module in the event of vibrations or involuntary touches by the driver, the cable was fixed to certain points in the steering wheel area, and the connection plug was secured by adhesive tape and plastic tie bands. Figure 3 shows the equipment and instrumentation of the vehicle made before the start of the tests:
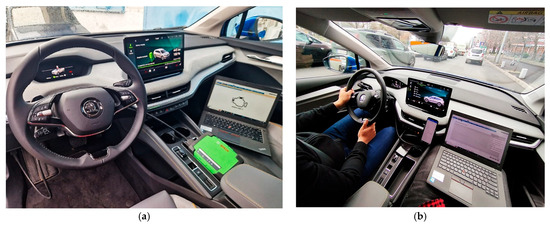
Figure 3.
(a) The KTS module and its connection with the OBD socket of the Skoda Eniaq vehicle; (b) sequence from experimental trails.
2.5. Hipothesese Established to Carry Out the Experiments
To carry out the tests, Friday was chosen, and the time interval was 12–15 pm. In accordance with the conditions in Section 2.2, several basic assumptions were established to model the route and make the cycle as conclusive as possible for the analysis and study of the dynamic and energetic performances of the electric vehicle used for the tests. These assumptions are based on the conditions in the regulation, the dynamic performances of the vehicle, and external factors that may influence the tests.
Thus, the assumptions are as follows [15]:
- The vehicle was driven on level road sections where the angle of inclination was 0°;
- The altitude of the entire route was considered constant at around 75 m (the altitude of the city of Bucharest);
- The average temperature in the predetermined time interval was around 10 °C;
- The wind speed was low enough to not significantly influence the aerodynamic resistance of the electric vehicle;
- The quality of the track was very good throughout the route, without bumps, obstacles, or other factors that could influence the experimental measurements;
- All sections of the road were dry and passable under normal speed conditions according to the limits established by the law;
- In all three areas of the completed cycle, the driving speed was adapted to the limits in force according to the law, and the driver did not exceed these limits;
- Traffic lights were taken into account, without going through pedestrian crossings, roundabouts and unforeseen traffic situations where it was necessary to reduce speed;
- The battery’s state of charge at the start of the route was 100%. A longer time was considered for the charging process to allow the battery cells to stabilize and not be additionally and unnecessarily stressed;
- The total mass of the vehicle consisted of the own mass of the electric vehicle, the mass of the driver and the companion, and the mass of the measuring equipment–2325 kg;
- The air pressure in the tires was checked to ensure that there were no differences or air losses.
3. Development of the Simulation Model
3.1. Simulation Environment
The study of systems using modeling and simulations has transformed the way scientists and engineers work by transferring many of the processes and tasks performed in the laboratory or in real running conditions to the computer. Currently, modeling and simulations are widely used for the synthesis of systems and their analysis, as well as for the development and verification of control algorithms [18].
Simulink is a dynamic system modeling, simulation, and analysis environment that is a standard in academia and industry. It is included as a toolbox in the MATLAB 2022 environment, and this facilitates the interaction between the two environments, allowing, among others, the rapid introduction of parameters, the automation of simulations, the processing and visualization of results [18].
In this study, the implementation of the electric propulsion system’s components consisted of creating several subsystems using different specific blocks from the Simscape library and using basic connections to interconnect these components. In order to be functional, the blocks were parameterized in accordance with the technical data of each component. Also, the stages of developing the mathematical model according to the work of [19] were taken into account. The considered components are as follows: the electric motor; the vehicle’s transmission, which is represented by a single-stage gearbox; and the traction battery for which an existing block was used in the Simscape library from Simulink, allowing the selection of the type of battery used and its parameterization according to the data provided by the manufacturer of the vehicle used.
The basic subsystems are as follows:
- An Electric SUV, which contains part of the components of the electric propulsion system: the electric motor; the reducer, together with the “driver” subsystem; and the system of equations represented by the resisting forces, which are derived from the general equation of the rectilinear movement results. This subsystem connects to the real cycle used for simulation and is represented by the vehicle speed variation in time;
- The Battery, which has as input parameter, and Pbat, which represents the total power absorbed from the battery during the cycle. For this subsystem an existing block in the Simscape library (“Driveline”–“Power Sources”) from Simulink was used, allowing the parameterization of the battery according to the characteristics of the studied vehicle;
- Power and Energy Calculation was added to the model to calculate Pbat. Mm (motor torque, [Nm]) and nm (motor speed, [rpm]) are defined as the input parameters of this subsystem. Outputs of this subsystem represent the basic electrical quantities for energy performance analysis: Pbat [kW] and Energy [kWh];
- The variable Measurements is a subsystem created to process the results obtained through simulations and to determine other quantities of interest (consumption [kWh/100 km] and autonomy [km]). It is based on mathematical equations defined in [20];
The simulation model for the electric vehicle can be seen in Figure 4.
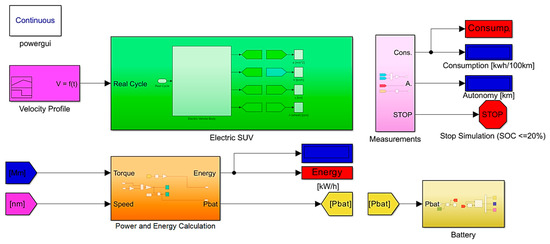
Figure 4.
Simulation model.
The main mathematical equations used to develop the simulation model are the following:
- Electric SUV Dynamics
- The general equation of rectilinear motion of vehicles is as follows:where Ft is traction force [daN].
- Rolling resistance force is calculated as follows:where f is the rolling resistance coefficient, m is the vehicle weight, g is gravitational acceleration (9.81 m/s2), and α is the inclination of the road.
- Hill climbing force is calculated as follows:
- Aerodynamic force is calculated as follows:where cx is the drag coefficient, A [m2] is the cross-sectional area, and Vx is the relative air speed on the longitudinal direction in km/h.
- Braking torque is calculated as follows:where amax is the maximum acceleration and rr is the tire rolling radius.
- Power and Energy Calculationwhere Pmotor input is the electric power absorbed by the motor from the battery in traction mode “Pe” and Paux is the electric power consumed by auxiliary systems.
- Mechanical power of the electric motor is calculated as follows:where Mm is the motor torque in [Nm]; nm is the motor speed in [rpm], and ωm is the angular speed in [s−1].
- The electric power absorbed by the motor is calculated as follows:where ηmotor represents the efficiency of the electric motor.
- Discharge current is calculated as follows:
- Total energy absorbed from the battery is calculated as follows:
- Energy consumption is calculated as follows:where d total distance, [km].
To determine the range, a condition was implemented, whereby the model operates until the battery discharges to the value at which recharging becomes necessary. As a rule the BMS (Battery Management System) allows the operation of the traction battery up to a state of charge of 20%, and in general, this value is specific to lithium batteries because if they are discharged below 20%, the charging process becomes complicated, and there is a risk of cell imbalances, which can cause irreparable damage [21,22]. The imposed condition consisted of the “State of Charge” signal connected to a “Compare to Constant” operator and a “Stop Simulation” block. In this way the comparison operator checks the values of the state of charge in real time during the simulation, and when it reaches the value of 20%, the “Stop Simulation” block comes into operation, which stops the simulation.
For the real driving cycle, a “Signal Builder” block that has no limitations related to the number of entered values and allows the signal to be imported as an “.xlsx” file, where the data must be placed in consecutive columns and each sheet must be private and contains a single quantity as a function of time, was used.
Since this study is investigating electric vehicle energy consumption, SOC, and range variation, only the powertrain system and the longitudinal vehicle dynamics are modeled. The lateral dynamics is neglected as it does not have a major impact on the vehicle’s energy consumption [19].
3.2. Conditions for Simulations
To carry out the simulations, several characteristic data of the used vehicle were used, in accordance with the information provided by the manufacturer. These data are presented in the Table 1, Table 2 and Table 3 below.

Table 1.
Electric SUV parameters [16].

Table 2.
Electric motor parameters [16].

Table 3.
Battery parameters [16].
Along with these parameters, a series of simplifying conditions, as presented in Table 4, was introduced into the simulation model:

Table 4.
Simplifying conditions.
3.3. Standardized Cycle—WLTC
The WLTC is more advantageous than other standardized cycles (e.g., NEDC) in terms of driving style being characterized by strong and frequent accelerations, followed by short braking, which causes the new procedure to be much closer to real driving conditions. Table 5 shows the main characteristics of the cycle.

Table 5.
WLTC characteristics [23].
The WLTC consists of four phases: low, medium, high, and extra high. In the case of the procedure, there is also a classification of vehicles according to the class they belong to, with the classification criterion being dependent on their specific power (Pspecific [W/kg]): Class 1, Class 2, and Class 3 [8].
The electric SUV used for the simulation is characterized by a specific power of ~72.3 W/kg, so it falls into Class 3, and from the point of view of velocity, with a maximum value of 160 km/h, it also falls into Class 3b.
The WLTC is shown in Figure 5.
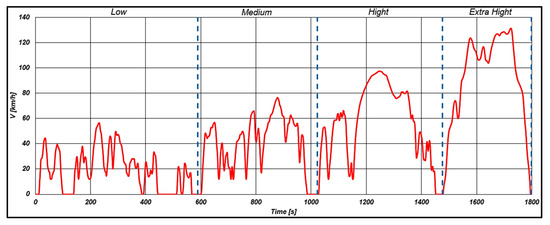
Figure 5.
WLTC velocity profile (dash line—was used to divide the profile into the 4 phases of the WLTC).
4. Results
In this section, the results of this study will be presented one by one, starting with the experimental measurements made using the specialized equipment, and these results will be used for the validation of the simulation model and then for the performance study using the WLTC cycle.
4.1. Experimental Results
According to the experimental measurements, the real cycle completed had a duration of 5676 s, which is approximately 95 min, and the total traveled distance on the established route was 77 km.
The average speed in the urban environment was 19.7 km/h, and the maximum speed reached on the highway was 131 km/h, in accordance with the legislation in force. By complying with all the traffic rules and adapting the driving speed according to the traffic conditions, the following real driving cycle, as presented in Figure 6, based on the conditions specified in the regulation (EU) 2018/1832, Annex III, was obtained:
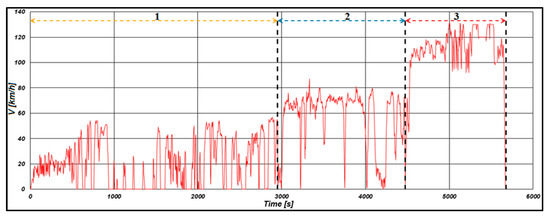
Figure 6.
Velocity profile obtained from experimental measurements: 1: urban phase; 2: extra-urban phase; 3: highway phase (dash line—was used to divide the profile into the 3 phases of the real driving cycle).
The maximum acceleration reached was 2.81 m/s2, while the maximum deceleration was ~8.32 m/s2. Figure 7 show the variation in acceleration during the cycle.
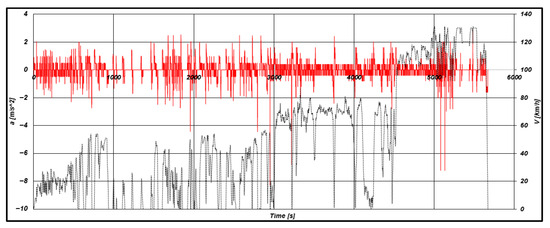
Figure 7.
Variation in acceleration during the cycle: red line: real acceleration; black line: speed profile.
Other parameters measured and processed were as follows: the state of charge of the battery (Figure 8), the total energy absorbed from the battery (Figure 9), and the energy consumed (Figure 10).
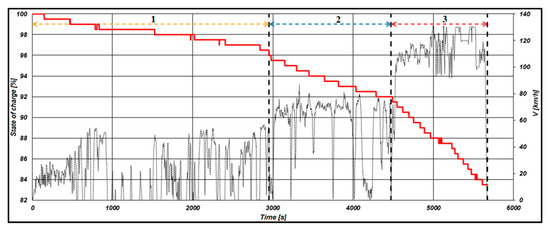
Figure 8.
Battery SOC variation: red line: real SOC; black line: speed profile; dash line: used to divide the profile into the 3 phases of the real driving cycle.
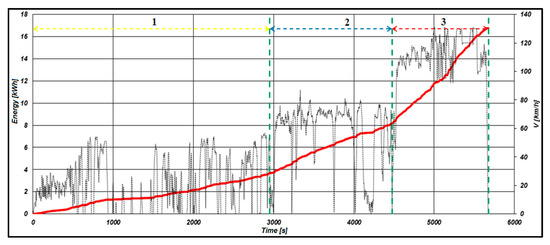
Figure 9.
Variation in total energy during the cycle: red line: real energy; black line: speed profile; dash line: used to divide the profile into the 3 phases of the real driving cycle.
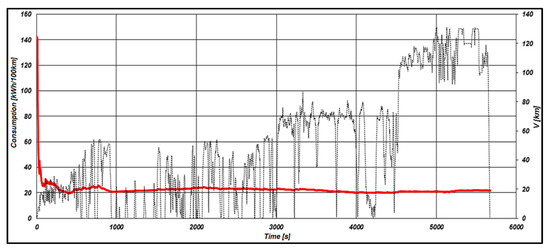
Figure 10.
Variation in energy consumption during the cycle: red line: real energy consumption; black line: speed profile.
The total energy absorbed from the battery during the driving cycle was another parameter measured and recorded, and its variation is represented in Figure 9.
After completing the route and the cycle of measurement, the value of energy consumed after traveling 77 km was 16.77 kWh. Based on the variation in total energy during the cycle, Figure 10 shows the variation in energy consumption during the proposed cycle.
The variation in energy consumption on the established route was also recorded, and the value obtained was 21.78 kWh/100 km (Figure 10). In [24], where the consumption values are presented depending on the driving regime and the area, the average energy consumed when driving in the city (urban environment), the extra-urban environment, and the highway is presented by the manufacturer. To compare this value with the measured one, the results are centralized in Table 6.

Table 6.
Energy consumption comparison.
Regarding the range of the vehicle obtained when running on the real cycle proposed in this work, it was considered to cover the route until the state of charge of the traction battery reaches the value of 20%, at which point a distance of 373.3 km was determined, which represents the value of autonomy when running on a real cycle.
In [24] a series of autonomy values for the three phases or driving environments is presented, as well as a global value that is obtained by combining all three phases over a cycle, like the one proposed in the paper. Thus, for the urban environment, rangeis [365, 400] km; for the extra-urban environment, the value is [300, 330] km; and for the highway, the value is [205, 225] km, resulting in a global combined value of the three phases of 337 km. Table 7 shows a comparison between the range proposed by the manufacturer and the measured one.

Table 7.
Autonomy comparison.
4.2. Simulation Results
This section proposes a comparative analysis of the experimental results obtained by measurements in real running conditions on the proposed cycle and the results of simulations using the presented model. This comparative analysis is substantiated by the need to validate the model developed for the study of the performances of electric vehicles and to identify the similarities or major inadvertences between the real, measured, and simulated values to search for optimization solutions of the model with as few errors as possible during a run cycle. For these reasons, in the following sections, a series of diagrams that represent the overlap of the variation in the measured quantities with those resulting from the simulations will be presented; the values of interest for certain quantities will be compared; and relative errors will be calculated based on them.
However, it should be noted that although the simulation model has been implemented as many functions as possible to follow real driving conditions in terms of road quality, unforeseen traffic situations, weather conditions, ambient temperature, as well as basic characteristics (constructive and dynamic performances of the vehicle used for the experimental measurements), the existence of some errors between the real and simulated values is natural since the model cannot provide the results with 100% efficiency. The errors resulting from the comparison of the two situations are necessary for further optimizations and will support the model in becoming a tool for analyzing the performance of electric vehicles.
4.2.1. Real Cycle
The main quantity of interest is the speed of the vehicle along the proposed cycle. Figure 11 graphically shows the comparison between the two profiles: the real (measured) and the simulated.
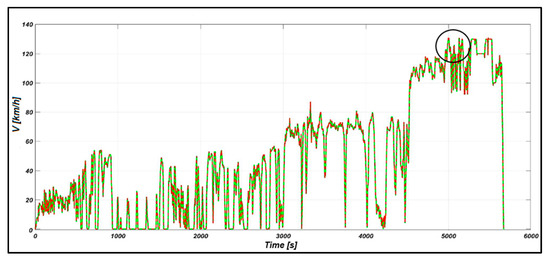
Figure 11.
Velocity profiles: green line: real speed; red line: simulated speed.
A deviation in the speed profile in relation to the reference one with a margin of ±2 km/h is admitted and accepted [9]. In this sense, the verification of this deviation in several points of the diagram from Figure 11 was followed, and an area was identified where the maximum deviation was +0.15 km/h and the minimum was −0.2 km/h, representing values that respect the regulation interval. Figure 12 shows the details of the deviation of the two speed profiles.
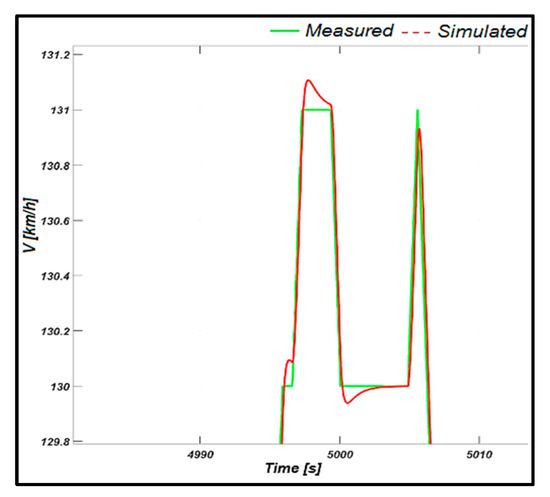
Figure 12.
Velocity profiles: green line: real speed; red line: simulated speed.
The comparative studies for the state of charge of the battery and for the variation in the energy consumed during the cycle are presented in Figure 13 and Figure 14.
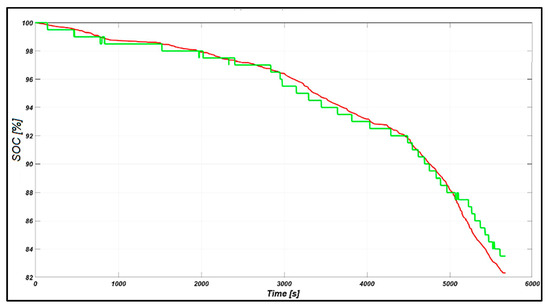
Figure 13.
Variation in the state of charge: green line: real SOC; red line: simulated SOC.
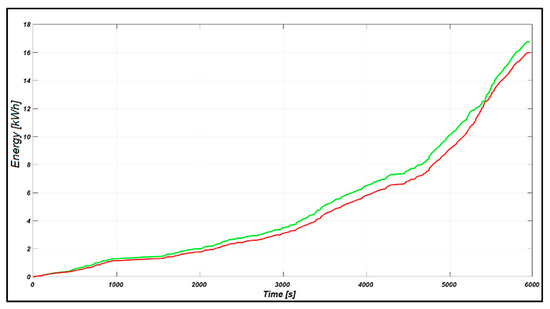
Figure 14.
Energy variation: green line: real energy; red line: simulated energy.
Regarding the state of charge of the battery, the final values obtained by both the measurement and the simulation are extremely close: 83.5% from the real (measured) experiment and 82.31% from the simulation. From the point of view of the energy consumed during the driving cycle, the measured value according to the time variation was 16.77 kWh, while the simulation resulted in a value of 15.99 kWh, so a difference of 0.78 kWh was observed between the real case and the simulation, resulting in an error of 4.65%.
A comparison was also made between the measured consumption and the one resulting from the simulation, from which the following values were obtained: 21.78 kWh/100 km from the real (measured) condition and 20.76 kWh/100 km from the simulation, a situation in which it resulted in an error of 4.68%. The comparative variation in energy consumption is shown in Figure 15.
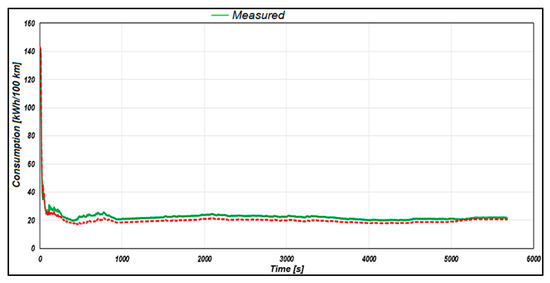
Figure 15.
Energy consumption variation: green line: real energy consumption; red line: simulated energy consumption.
4.2.2. WLTC
At first the deviation in the simulated profile in relation to the reference one (WLTC profile) was followed, and for this case, the two profiles overlapped, as shown in Figure 16.
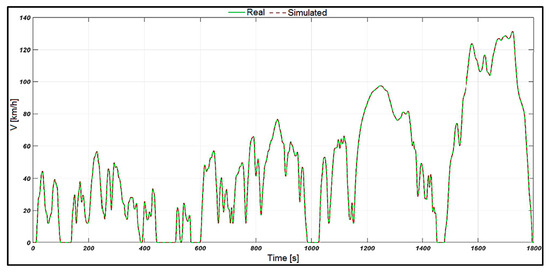
Figure 16.
Real–simulated speed profile comparison for the WLTC: green line: real speed profile; red line: simulated speed profile.
Regarding the acceleration profile in relation to the specialized literature [14], where the cycle characteristics are specified, the simulation resulted in a maximum acceleration of 1.684 m/s2. The actual acceleration profile was obtained by time derivation, and the reference profile was imported from Excel using the mathematical function “Derivative” from the Simscape library. The overlap of the two acceleration profiles is represented in Figure 17.
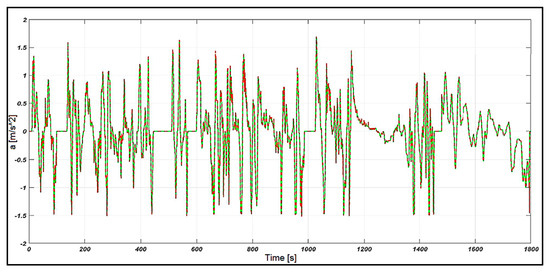
Figure 17.
Real–simulated acceleration profile comparison for the WLTC: green line: real acceleration; red line: simulated acceleration.
In terms of energy performances, the WLTC simulation resulted in a battery SOC of ~95.95%, with a 4.05% decrease from the initial value of 100%. The variation in the SOC of the battery is represented in Figure 18.
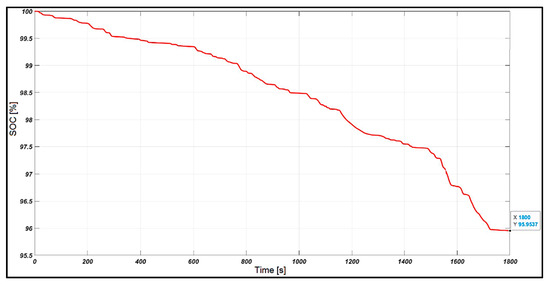
Figure 18.
Simulated SOC for the WLTC.
The variation in the total energy absorbed during the cycle is shown in Figure 19. The energy consumed during the WLTC was 3.361 kWh, a value that considered the energy consumed by the auxiliary systems, which, using the reference profile obtained through experimental measurements, turned out to be 0.35 kWh.
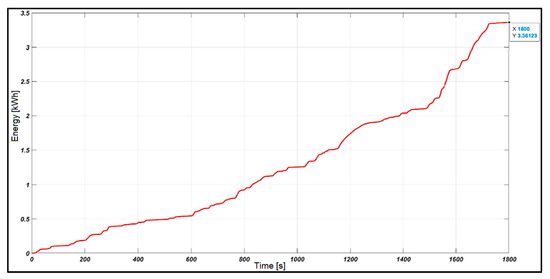
Figure 19.
Simulated energy for the WLTC.
The energy consumed considering the distance covered during the cycle of ~23.3 km was 14.49 kWh/100 km (Figure 20).
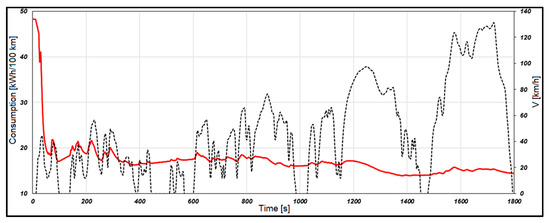
Figure 20.
Simulated consumption for the WLTC: red line: energy consumption; black line: WLTC.
To determine the range of the WLTC by simulation, a time of 42,000 s was set, and the simulation was started. When the state of charge reached a value of 20%, the simulation was stopped at tfinal = 40,110 s, resulting in a distance of 512 km, which represents the autonomy of the vehicle used for this research.
Next the results obtained from the simulation for the WLTC are recorded and presented in Table 8 in order to compare the values mentioned by the manufacturer. This comparison was performed using several specialized websites.

Table 8.
Range comparison.
Table 9 compares the values obtained by simulation and those indicated by the manufacturer from tests on the WLTC cycle:

Table 9.
Comparison between simulation results and values indicated by the manufacturers for the WLTC.
Considering Table 9 the relative errors are less than 5%.
4.2.3. Analysis of Factors Influencing Energy Performance Using the Simulation Model
Once the simulation model was validated by comparing it with experimental results, the authors proposed an extension of this study based on the analysis of some influencing factors on the energy consumption of an electric vehicle. These factors are linked to both the dynamic characteristics of the vehicle and certain properties of the external environment with which the vehicle comes into contact while driving. The impact of certain coefficients that characterize a vehicle from a dynamic point of view is as follows: the influence of the road on the vehicle’s performance through the contact between the tire and the road. The influence of the vehicle’s aerodynamics is already well known. At the same time, another important parameter, especially in the case of electric vehicles where a considerable increase is felt due to the existence of the traction battery, is the mass of the vehicle. This can vary from curb weight “m0” under operating conditions to the total weight that considers the maximum load that the vehicle can support, the way in which the load distribution is carried out at the axle level, and, of course, the position of the center of gravity depending on the load.
For this study, using the basic simulation model together with the dynamic and energetic characteristics of the reference vehicle (Skoda Eniaq iV80), a series of experiments was carried out to determine how these parameters or coefficients can influence the overall performance of the vehicle. The impacts are studied and determined using the proposed real cycle, in accordance with the imposed initial conditions and the simplifying hypotheses considered from the beginning of the modeling and simulation. Using the variation in the parameters considered in different intervals, the parameters analyzed are the following:
- Rolling resistance coefficient f, [-];
- Vehicle weight mt, [kg];
Rolling Resistance Coefficient
The rolling resistance coefficient is defined by the ratio of the rolling resistance force developed in the contact patch of the wheel when it starts to roll, Frr, and the normal force from the ground, Z [26]. As is well known, rolling resistance is predominantly manifested and can increase up to a speed range of [60, 80] km/h [26]. This force depends on the weight of the vehicle, the angle of inclination of the road, and obviously on the rolling resistance coefficient, f. This coefficient depends on several factors: the quality of the road, the construction and characteristics of the tire; the ambient temperature, and the vehicle’s speed. The main problem related to this coefficient is determined by the occurrence of energy losses through hysteresis due to the deformation of the tire and the roadway, which is directly proportional to the speed of travel [26].
To study the impact of the coefficient “f” on the performance of electric vehicles through modeling and simulations, it was necessary to define and implement the coefficient as the following calculation formula [27]:
where “f0” is the rolling resistance coefficient at low speeds; f01, f02, and f04 are the speed influence coefficients on the rolling resistance coefficient; and V is the vehicle’s speed [17]. Current trends regarding the optimization and increase in vehicle performance, in general, have also determined changes in terms of the quality of the tires in relation to the road surface, so the reduction in the coefficient f is sought. According to [28], f01 = (5∙10)−7 and f02 = (2 × 0)−7, and f04 = 0, indicating that the main influence term of the rolling resistance coefficient formula is the low-speed rolling resistance coefficient “f0”, and depending on its value, the global impact on performances can be identified.
f = f0 + f01∙V + f02∙V2 + f04∙V4 [-]
Also, from [19], for the radial construction of the tire, in accordance with the tire speed index, its maximum load, and the type of roadway (in this study: new asphalt and concrete), the variation in “f0” in the range [0.005, 0.015] was considered. Using this variation correlated with Relation 12, and the variation in the total rolling resistance coefficient in relation to the vehicle speed was determined for values with a step of 0.001 of the coefficient “f0” while taking into account the variation in the speed on the real cycle considered, along with additional processing in Excel to extend the results of “f” up to the maximum speed of 160 km/h, resulting in the variation shown below (Figure 21).
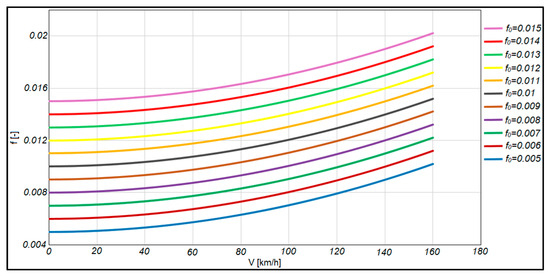
Figure 21.
Variation in the rolling resistance coefficient depending on the value of f0.
Thus, for the vehicle speed variation from 0 to 160 km/h, the following ranges of values of the rolling resistance coefficient were obtained as a function of f0 (Table 10).

Table 10.
Rolling resistance coefficient values according to Figure 21.
Therefore, following these determinations, the implementation of Relation 1 followed using the mathematical operator “Fcn”, which allows us to write a function in relation to an input variable, in this case the speed of the vehicle when moving on the real cycle, a function that had the following form: f = f0 + (5∙10)−7∙(u(1)) + (2∙10)−7∙(u(1))2, where u(1) is the variable corresponding to the speed of movement. Following the simulations for each value of f0 according to Table 10, the values of the total energy consumed per cycle, the specific energy consumption, the battery charge state, and the range of the reference vehicle when driving on the real cycle were determined as shown below (Table 11).

Table 11.
Variation in the energetic performances of the reference vehicle in relation to the variation in f.
From Table 11 the following variations were identified, and they are graphically represented in Figure 22 and Figure 23.
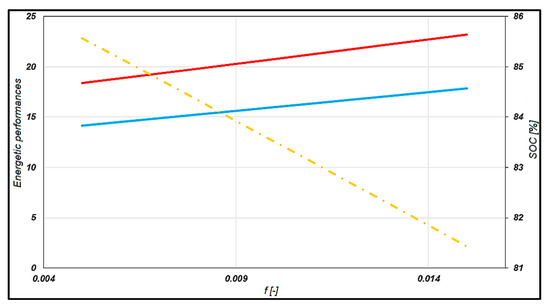
Figure 22.
The influence of the rolling resistance coefficient on the energetic performances: red line: consumption [kWh/100 km]; blue line: energy [kWh]; yellow line: SOC [%].
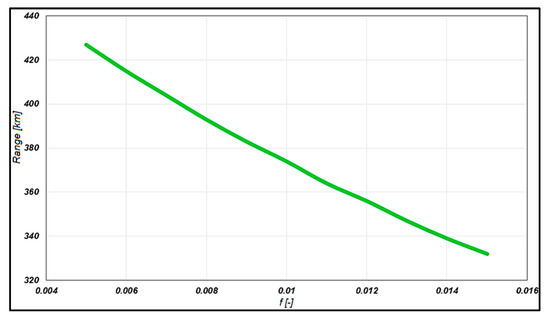
Figure 23.
Influence of the rolling resistance coefficient on the vehicle’s range.
The important influence of the rolling resistance coefficient in relation to the speed of travel and the quantities that define the energy and consumption performances of an electric vehicle is observed (Figure 22). With the increase in “f”, both electrical energy and consumption take on an increasing linear trend, and for the global interval obtained from Figure 22 ([0.005, 0.02]), a variation in consumption was obtained between [18.36, 23.2] kWh/100 km and the energy within the interval [14.13, 17.87] kWh. The state of charge resulting from the simulations on the real cycle varied slightly in the interval [85.56, 81.43] %, with an average reduction of 16.5%, and in the interval [14.44, 18.57] %. The range obtained is [332, 427] km, so there is an overall reduction of 95 km between a minimum coefficient of 0.005 and the maximum obtained of 0.02. Its variation is represented in Figure 23.
Vehicle Weight
Regarding the influence of the vehicle weight, starting from its curb weight (“m0”) in operating conditions, when it is fully equipped, and when it has a driver, an additional load corresponding to a passenger will be progressively added together with the mass of the luggage, and according to [26], the mass of the additional luggage to be added is defined as “mbs”. The final value of the mass considered will be equal to the total mass of the vehicle resulting from Relation 13:
where “mun” is the nominal maximum permissible weight, which can be calculated from [26] for a passenger car or using the following formula:
where N represents the number of seats, except for the one occupied by the driver (N = 4 in this case), and “mbs” represents the mass of the additional luggage (it is adopted within the limits of [50, 200] kg). According to [16,24], the curb weight of the reference vehicle is in accordance with the information from the manufacturer (m0 = 2075 kg), and the total weight is mt = 2540 kg, whereby the maximum permissible load is mun = 465 kg.
For the initial analysis, in real driving conditions, which considers the mass of the driver (approx. 110 kg), the mass of the passenger (110 kg), and the mass of the measuring equipment used, a test mass of 2325 kg was determined, a value also used in the basic model in its validation analysis. Therefore, we will start from m0 with the driver’s mass, which is currently considered standard at 75 kg [15], and progressively add passengers with the corresponding weight of “68 + 7 = 75” kg. In this regard, the simulation results obtained due to the influence of weight variation on energy and consumption performance are presented in Table 12.

Table 12.
Variation in the energetic performances of the reference vehicle in relation to the weight.
The result was an energy variation of [15.18, 16.98] kWh, limit values corresponding to the minimum weight under driving conditions (curb weight + driver weight) and the maximum weight corresponding to the total weight of the vehicle according to the manufacturer; therefore, the energy consumed on the proposed real cycle increases globally by 1.8 kWh with the progressive increase in mass.
The consumption obtained varies in the range of [19.71, 22.02] kWh/100 km; therefore, an overall increase of 2.31 kWh/100 km was observed. SOC was reduced from the initial value of 100% by [15.59, 17.79]%; therefore, an overall improvement of 2% in relation to the mass variation was observed.
All these variations were processed and graphed, resulting in Figure 24.
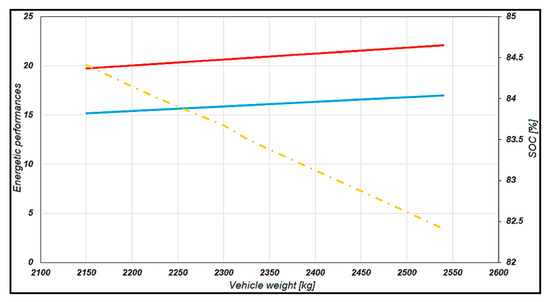
Figure 24.
The influence of the weight on energetic performances: red line: consumption [kWh/100 km]; blue line: energy [kWh]; yellow line: SOC [%].
Similar to the rolling resistance coefficient, the range variation was also determined by simulating the mass values considered in Figure 25.
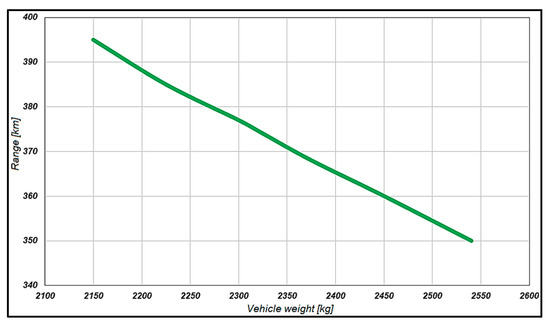
Figure 25.
Influence of the weight on the range of the vehicle.
The vehicle’s range decreases from 395 km when mt is 2150 kg to 350 km when the maximum value according to the manufacturer is reached.
In order to correlate the influence of the two dynamic parameters of the vehicle (f and mt), a data processing step was performed, whereby the rolling resistance was calculated using Relation 4 [26] for the variation in the rolling resistance coefficient considered in the simulation model for the reference vehicle, where f0 = 0.01 and the resulting interval was [0.01, 0.0152], taking into account the values of f up to and including the maximum speed reached during the real driving cycle.
Therefore, the variation in rolling resistance force depending on the weight value was obtained, and it is presented in Figure 26.
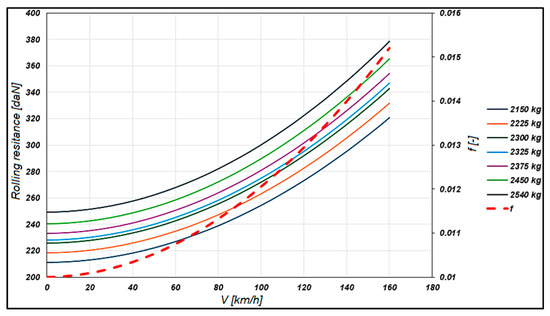
Figure 26.
Influence of vehicle weight on rolling resistance force.
5. Discussion
After a controlled charging process and sufficient time for stabilization, the state of charge of the battery at the start of the run cycle was 100%. During the urban driving phase, SOC decreased by 3.5%, reaching 96.5%; then, during the extra-urban driving phase, it decreased by another 4.5%, thus reaching 92%, and finally during the phase of running in the highway regime where speeds were higher, the state of charge dropped to 83.5%, representing another 8.5% decrease; this phase included the moment when the vehicle was stopped and the measurements were completed. Thus, on the chosen route, the state of charge decreased by a total of 16.5% (Figure 8).
The average value of the energy absorbed from the battery during each phase of the proposed cycle was determined, resulting in the following values: urban driving phase: 1.72 kWh, extra-urban driving phase: 3.22 kWh, and highway phase: 12.4 kWh.
The proposed real cycle was used in a period with low temperatures, an aspect that constituted a negative influencing factor on energetic performances.
The speed profile obtained experimentally was influenced by the driver’s driving style and also by the portions chosen for the cycle, but it was especially influenced by the speed limits in force according to Romanian law.
When driving at speeds below 60 km/h, with an average speed of 19.7 km/h and short and frequent braking due to the existence of traffic lights and busy intersections, the state of charge experienced slight increases generated by regenerative braking, which demonstrates, from a practical point of view, the fact that an electric vehicle lends itself extremely well to driving in the urban environment.
In the extra-urban area, namely the ring road of the capital, the northern part where the speed limits allowed the realization of the second phase of the cycle where the driving speed could be maintained in the speed range [60, 90] km/h, there were still sections where it was necessary to decelerate to very low speeds or sometimes even to a stop when pedestrian crossings or roundabouts were encountered.
The simulations carried out using the standardized cycle (WLTC) aimed to analyze the operation mode of the simulation model proposed in this work and to diversify the research regarding the determination of the dynamic and energetic performances of an electric vehicle.
Research on the influence of the rolling resistance coefficient on energy performance has highlighted the significant impact it has on energy consumption and range.
The simulation has highlighted the fact that vehicle loading influences energy performance and autonomy during the driving cycle. In the study presented in the paper, a 10.5% increase in energy consumption and a 12.85% decrease in range were recorded.
6. Conclusions
Through the comparative analysis between the results obtained experimentally and those from the simulation, errors around 0–5% were obtained, signifying a high degree of confidence of the model’s use for other more complex studies.
The differences between the values obtained experimentally and those from the simulation using the real speed profile are generated by the fact that certain conditions and situations encountered in reality cannot be 100% implemented in a mathematical simulation model, such as the precision of the developed subsystems, certain settings in the program options regarding the chosen step, the type of solver, as well as certain conditions that cannot be physically modeled or simulated in a manner that is similar to the traffic reality.
The main objective of this study was to develop an original mathematical model using the modeling–simulation program MATLAB–Simulink 2022, which allows the analysis of the dynamic and energetic performances of an electric vehicle, especially from the perspective of the M1 and N1 categories using a real driving cycle or a standardized one (in this paper: WLTC). The foundation on which this objective was based was the general evaluation of the dynamic and energetic performances of the electric vehicle, representing the preliminary validation criterion of the mathematical model developed by the authors.
As a result of this research, it was found that the operating mode of an electric vehicle considerably influences its real autonomy.
Through the multitude of results obtained using the simulation model in accordance with certain internal and external factors of influence, a tool for researching the performances of electric vehicles has been developed. This tool can be used by specialists in the field to develop and create future studies with the role of analyzing and optimizing electric vehicles’ performances by implementing innovative solutions such as multi-speed transmission and multiple electric motors.
Author Contributions
Carrying out experimental research and determining the real speed profile by measurement, A.-A.A. and C.-A.R.; simulation model development, A.-A.A.; simulation model optimization, A.-A.A. and C.-A.R.; processing of experimental data and results obtained from simulations, A.-A.A.; writing and organizing the paper, A.-A.A., C.-A.R. and D.-M.I.; project administration, C.-A.R. and D.-M.I. All authors have read and agreed to the published version of the manuscript.
Funding
This research was funded by the National University of Science and Technology POLITEHNICA Bucharest, RO-060042, Romania, by a grant from the National Program for Research of the National Association of Technical Universities (GNAC ARUT 2023), contract number 161/04.12.2023.
Data Availability Statement
The original contributions presented in the study are included in the article; further inquiries can be directed to the corresponding author.
Acknowledgments
This work was supported by a grant from the National Program for Research of the National Association of Technical Universities (GNAC ARUT 2023).
Conflicts of Interest
The authors declare no conflicts of interest.
References
- Birrell, S.A.; Taylor, J.E.; McGordon, A.; Son, J.; Jennings, P. Analysis of three independent real-world driving studies: A data driven and expert analysis approach to determining parameters affecting fuel economy. Transp. Res. Part D Transp. Environ. 2014, 33, 74–86. [Google Scholar] [CrossRef]
- Bucher, J.; Bradley, T.; Lohse-Busch, H.; Rask, E. Analyzing the Energy Consumption Variation during Chassis Dynamometer Testing of Conventional, Hybrid Electric, and Battery Electric Vehicles. SAE Int. J. Electrified Veh. 2014, 3, 36–43. [Google Scholar] [CrossRef]
- Neaimeh, M.; Salisbury, S.D.; Hill, G.; Blythe, P.T. Analysing the usage and evidencing the importance of fast chargers for the adoption of battery electric vehicles. Energy Policy 2017, 108, 474–486. [Google Scholar] [CrossRef]
- Hawkins, T.R.; Singh, B.; Majeau-Bettez, G.; Strømman, A.H. Comparative Environmental Life Cycle Assessment of Conventional and Electric Vehicles. J. Ind. Ecol. 2012, 17, 53–64. [Google Scholar] [CrossRef]
- Rezvani, Z.; Jansson, J.; Bodin, J. Advances in consumer electric vehicle adoption research: A review. Renew. Sustain. Energy Rev. 2015, 34, 122–136. [Google Scholar]
- Zhang, R.; Yao, E. Electric vehicles’ energy consumption estimation with real driving condition data. Transp. Res. Part D Transp. Environ. 2015, 41, 177–187. [Google Scholar] [CrossRef]
- Castillo-Calderón, J.; Díaz-Sinche, D.; Jaura, R.C.; Reinoso, A.S.; Abad, J.C. Energy Consumption of a Battery Electric Vehicle Used for City-Airport Trips: A Case Study in an Andean Region. In Proceedings of the 2023 IEEE Seventh Ecuador Technical Chapters Meeting (ECTM), Ambato, Ecuador, 10–13 October 2023; pp. 1–6. [Google Scholar] [CrossRef]
- Regulation (EU) 2017/1151 of the COMMISSION of 01.06.2017. Available online: https://eur-lex.europa.eu/search.html?scope=EURLEX&text=2017%2F1151&lang=en&type=quick&qid=1709127536185 (accessed on 27 March 2024).
- Regulation (EU) 2018/1832 of the COMMISSION of 05.11.2018. Available online: https://eur-lex.europa.eu/legal-content/RO/TXT/HTML/?uri=CELEX%3A32018R1832#d1e39-105-1 (accessed on 15 March 2024).
- De Gennaro, M.; Paffumi, E.; Martini, G.; Manfredi, U.; Scholz, H.; Lacher, H.; Kuehnelt, H.; Simic, D. Experimental and Numerical Evaluation of Electric Vehicle Performance Under Real Driving Conditions; SAE Technical Paper 2014-01-1817; SAE International: Warrendale, PA, USA, 2022. [Google Scholar] [CrossRef]
- Seo, J.; Cha, J. Real-world energy consumption of battery electric vehicles: Influence of driving behavior and environmental conditions. Energy Convers. Manag. 2025, 345, 120372. [Google Scholar] [CrossRef]
- Tiwary, A.; Garg, S.; Mishra, S. Impact of Driving Behaviour on Energy Consumption of Electric Vehicle. In Proceedings of the 2022 22nd National Power Systems Conference (NPSC), New Delhi, India, 17–19 December 2022. [Google Scholar] [CrossRef]
- Skuza, A.; Jurecki, R.S. Analysis of factors affecting the energy consumption of an EV vehicle—A literature study. In IOP Conference Series: Materials Science and Engineering, Proceedings of the 13th International Conference on Automotive Safety (Automotive Safety 2022), Kaluza, Slovakia, 26–29 April 2022; IOP Publishing Ltd.: Bristol, UK, 2022; Volume 1247, p. 012001. [Google Scholar]
- Rimpas, D.; Papadakis, A.; Samarakou, M. OBD-II sensor diagnostics for monitoring vehicle operation and consumption. Energy Rep. 2020, 6, 55–63. [Google Scholar] [CrossRef]
- Ancuța, A.A. Research on the Determining the Dynamic and Energetic Performances of Electric Vehicles. Ph.D. Thesis, National University of Science and Technology Poiltehnica Bucharest, Faculty of Transport, Bucharest, Romania, June 2024. [Google Scholar]
- Individual study program-SSP (PDF). Skoda ENIAQ, Service catalog, unpublished (made available to the authors by the Porsche Group Romania).
- Robert Bosch GmbH KTS, 560/590 (KTS 5a Series) Module for Control Unit Diagnosis, 1,689,989,223. 24 September 2021. Available online: http://mediathek.bosch-automotive.com/files/bosch_wa/989/223.pdf?_gl=1*q6h7u*_ga*NDY5MTIzNzgwLjE2OTY5NDUwMzk.*_ga_913VVKMZ46*MTcwNzIyNjUxMC40LjEuMTcwNzIyNjUyMS4wLjAuMA (accessed on 15 March 2024).
- Bățăuș, M. Modern Automotive Transmissions: An Introduction in Modeling and Simulation; Politehnica Press: Bucharest, Romania, 2018; ISBN 978-606-515-806-1. [Google Scholar]
- Miri, I.; Fotouhi, A.; Ewin, N. Electric vehicle energy consumption modelling and estimation—A case study. Int. J. Energy Res. 2021, 45, 501–520. [Google Scholar] [CrossRef]
- Ancuța, A.A.; Voloacă, Ș.; Frățilă, G.; Danciu, G. Analysis of Energetic and Traction Performances for an Electric Vehicle in Real Driving Conditions. In IOP Conference Series: Materials Science and Engineering, Proceedings of the Economicity, Safety and Reliability for Motor Vehicles Congress (and SIAR International Automotive and Transport Engineering Congress), Bucharest, Romania, 2–4 November 2023; IOP Publishing Ltd.: Bristol, UK, 2024; Volume 1303, p. 012006. [Google Scholar] [CrossRef]
- Ehsani, M.; Gao, Y.; Emadi, A. Modern Electric, Hybrid and Fuel Cell Vehicles—Fundaments, Theory and Design, 2nd ed.; Texas A&M University College Station: College Station, TX, USA.
- Larminie, J.; Lowry, J. Electric Vehicle Technology Explained; Oxford Brookes University: Oxford, UK, 2012; ISBN 0-470-85163-5. [Google Scholar]
- Available online: https://en.wikipedia.org/wiki/Worldwide_Harmonised_Light_Vehicles_Test_Procedure (accessed on 27 March 2024).
- Available online: https://www.automobile-catalog.com/auta_perf1.php#gsc.tab=0 (accessed on 28 March 2024).
- Available online: https://ev-database.org/car/1280/Skoda-Enyaq-iV-80 (accessed on 28 March 2024).
- Andreescu, C. Dynamics of Wheeled Vehicles; Politehnica Press Publishing House: Bucharest, Romania, 2010; Volume I. [Google Scholar]
- Mitschke, M.; Wallentowitz, H. Dynamik der Kraftfahrzeuge, 5th ed.; Überarbeitete und Ergänzte Auflage; Springer Fachmedien: Wiesbaden, Germany, 2014; ISBN 978-3-658-05067. [Google Scholar] [CrossRef]
- Available online: https://x-engineer.org/rolling-resistance/ (accessed on 29 March 2024).
Disclaimer/Publisher’s Note: The statements, opinions and data contained in all publications are solely those of the individual author(s) and contributor(s) and not of MDPI and/or the editor(s). MDPI and/or the editor(s) disclaim responsibility for any injury to people or property resulting from any ideas, methods, instructions or products referred to in the content. |
© 2025 by the authors. Licensee MDPI, Basel, Switzerland. This article is an open access article distributed under the terms and conditions of the Creative Commons Attribution (CC BY) license (https://creativecommons.org/licenses/by/4.0/).