Article

Parameters Impacting the 3D Direct Ink Writing (DIW) Silicone Printing Process and Investigating How the Size of 3D-Printed Aortic Heart Valve Models Influences Cardiac Efficiency

1
Department of Mechanical Engineering, Texas Tech University, Lubbock, TX 79409, USA
2
Department of Mechanical Engineering, Karadeniz Technical University, Trabzon 61080, Türkiye
*
Author to whom correspondence should be addressed.
Designs 2025, 9(4), 98; https://doi.org/10.3390/designs9040098
Submission received: 10 June 2025 / Revised: 19 July 2025 / Accepted: 11 August 2025 / Published: 19 August 2025

Abstract

In the healthcare industry, the selection of biocompatible materials suitable for 3D printing is markedly less extensive than what is typically available through conventional manufacturing processes. Liquid silicone rubber (LSR) is distinguished by its exceptional stability, excellent biocompatibility, and considerable flexibility, offering significant prospects for manufacturers of medical devices involved in 3D printing. The primary aim of this research is to examine the essential factors and their interconnections that affect the 3D printing process with a Direct Ink Writing (DIW) 3D printer, which is specifically tailored for the production of aortic heart valves made from UV-cured silicone. Additionally, this study aims to investigate how the size of the heart valve impacts cardiac performance. This study implements House of Quality (HOQ) and Interpretive Structural Modeling (ISM) techniques to evaluate the interrelations among the different factors identified in the 3D printing process. Liquid silicone is especially advantageous for Direct Ink Writing (DIW) due to its low-temperature curing properties and low viscosity, which enable precise printing for intricate designs. Two different sizes of aortic heart valves, namely 23 mm and 36 mm, will be manufactured using UV-cured silicone, with both sizes having the same leaflet thickness of 0.8 mm and 1.6 mm. An examination will be conducted to assess how the size of the valve influences its performance and functionality. A Mock Circulatory Loop experimental setup will be used to test the silicone-printed heart valves, focusing on their capacity to maintain unidirectional flow and inhibit backflow through the flexible leaflets that function in alignment with the cardiac cycle.

1. Introduction

This research paper acts as a follow-up to a prior publication in the bioengineering journal. The earlier paper sought to evaluate the capability of a 3D printer to employ UV-cured silicone in the fabrication of aortic heart valves. The printing apparatus was improved for the use of UV silicone, allowing us to produce a heart valve of satisfactory dimensional and geometric quality. However, one of the objectives of this paper is to examine the essential factors affecting Direct Ink Writing (DIW) machines’ performance that have not been previously addressed. Furthermore, this paper provides valuable insights into the ways in which changes in size and leaflet thickness of the heart valve influence its performance and functionality.
In the United States, the prevalence of valvular diseases stands at 2.5% [1], making it a common cardiovascular ailment. The affected valves lose their functional mobility, negatively affecting cardiovascular health. For severe cases, treatment options include the implantation of mechanical or bio-inspired prosthetic heart valves. These bio-inspired valves possess the capability to replicate the characteristics of native valves; however, their operational lifespan is constrained [2].
Additive manufacturing is transforming the realm of intricate medical engineering. Progress in medical 3D printing technology has significantly impacted healthcare by minimizing surgery duration and anesthesia exposure, enhancing pre-surgical planning, producing patient-specific custom replicas of bones and tissues, facilitating bioprinting, and providing alternatives for human organ transplants [3,4]. The potential applications are vast. Integrating X-rays, CT scans, and MRI with 3D printing has proven revolutionary [5].
Researchers engaged in additive manufacturing are keenly focused on exploring innovative processes and materials appropriate for 3D printing applications. In the field of medical engineering, for instance, existing heart valve solutions are not only expensive and labor-intensive to produce but also possess relatively limited lifespans. These solutions often incorporate animal-derived tissues (bioprosthetic) or metallic components that necessitate immunosuppressive or anti-thrombogenic medications, which can lead to significant adverse side effects. Additionally, the currently utilized replacement valves are typically circular, which may not provide an optimal fit for each patient’s aorta, given the existing anatomical variations [6].
A significant number of elderly patients are not in optimal health to undergo open-heart surgeries. As an alternative, they receive artificial valves through a procedure known as transcatheter aortic valve replacement (TAVR), which involves the deployment of the valve via a catheter that is inserted into the aorta. This procedure presents several challenges, notably the necessity of selecting an appropriately sized valve without direct visualization of the patient’s heart. If the valve is too small, it may become dislodged or result in leakage around its edges; conversely, if it is too large, it poses a risk of tearing through the heart, which could lead to fatal consequences [6].
Similar to other medical procedures, individuals undergoing TAVR may experience postoperative complications, such as paravalvular leak (PVL) and conduction disturbances. PVL occurs due to an inadequate seal and the existence of gaps between the bioprosthetic valve frame and the native aortic annulus, resulting in the backflow of blood from the aorta into the left ventricle [6,7,8].
CT imaging of the patient’s heart is employed to reconstruct the unique configuration of the aortic root region precisely, facilitating the production of a tailored artificial heart valve via 3D printing, which effectively mitigates the risk of leakage at the valve margins [6,9].
To create a 3D print of a heart valve utilizing CT or MRI technology [10], one must obtain a comprehensive 3D image of the patient’s heart through one of these imaging techniques (see Figure 1a). Subsequently, specialized software segments the heart valve anatomy from the adjacent tissues (see Figure 1b), resulting in a digital 3D model. Then, the segmented data is converted into a heart valve three-dimensional mesh that precisely represents the complex 3D configuration of the valve. This process defines the edges of the valve, generating a three-dimensional outline (see Figure 1c). To achieve a smooth and printable surface, the mesh will be refined, addressing any irregularities or artifacts that may have emerged during the segmentation process. Thereafter, the 3D model is converted into a digital format known as an STL file. This indicates that the design is preserved in a particular file format referred to as “STL,” which stands for “Stereolithography.” An STL file includes data regarding the surface geometry of the 3D model (see Figure 1d). Once you possess a converted STL file, it is possible to create G-code by dividing it into layers through the slicing software (see Figure 1e). Figure 1f depicts the concluding phase of the process involved in printing the heart valve through the use of G-code.
The current focus on the development of 3D-printed heart valves seeks to improve their operational efficiency, personalization, and compatibility with biological systems. The existing literature indicates that 3D printing technology remains in its early stages regarding both biological and technological requirements. A major challenge persists in ensuring the biocompatibility of heart valves produced through 3D printing techniques.
The heart consists of four primary valves. There is the mitral valve, often known as the bicuspid valve, and the tricuspid valve, both classified as atrioventricular valves. Additionally, there is the aortic valve, situated in the aorta, and the pulmonary valve, found in the pulmonary trunk; these function as the two semilunar valves located within the arteries.
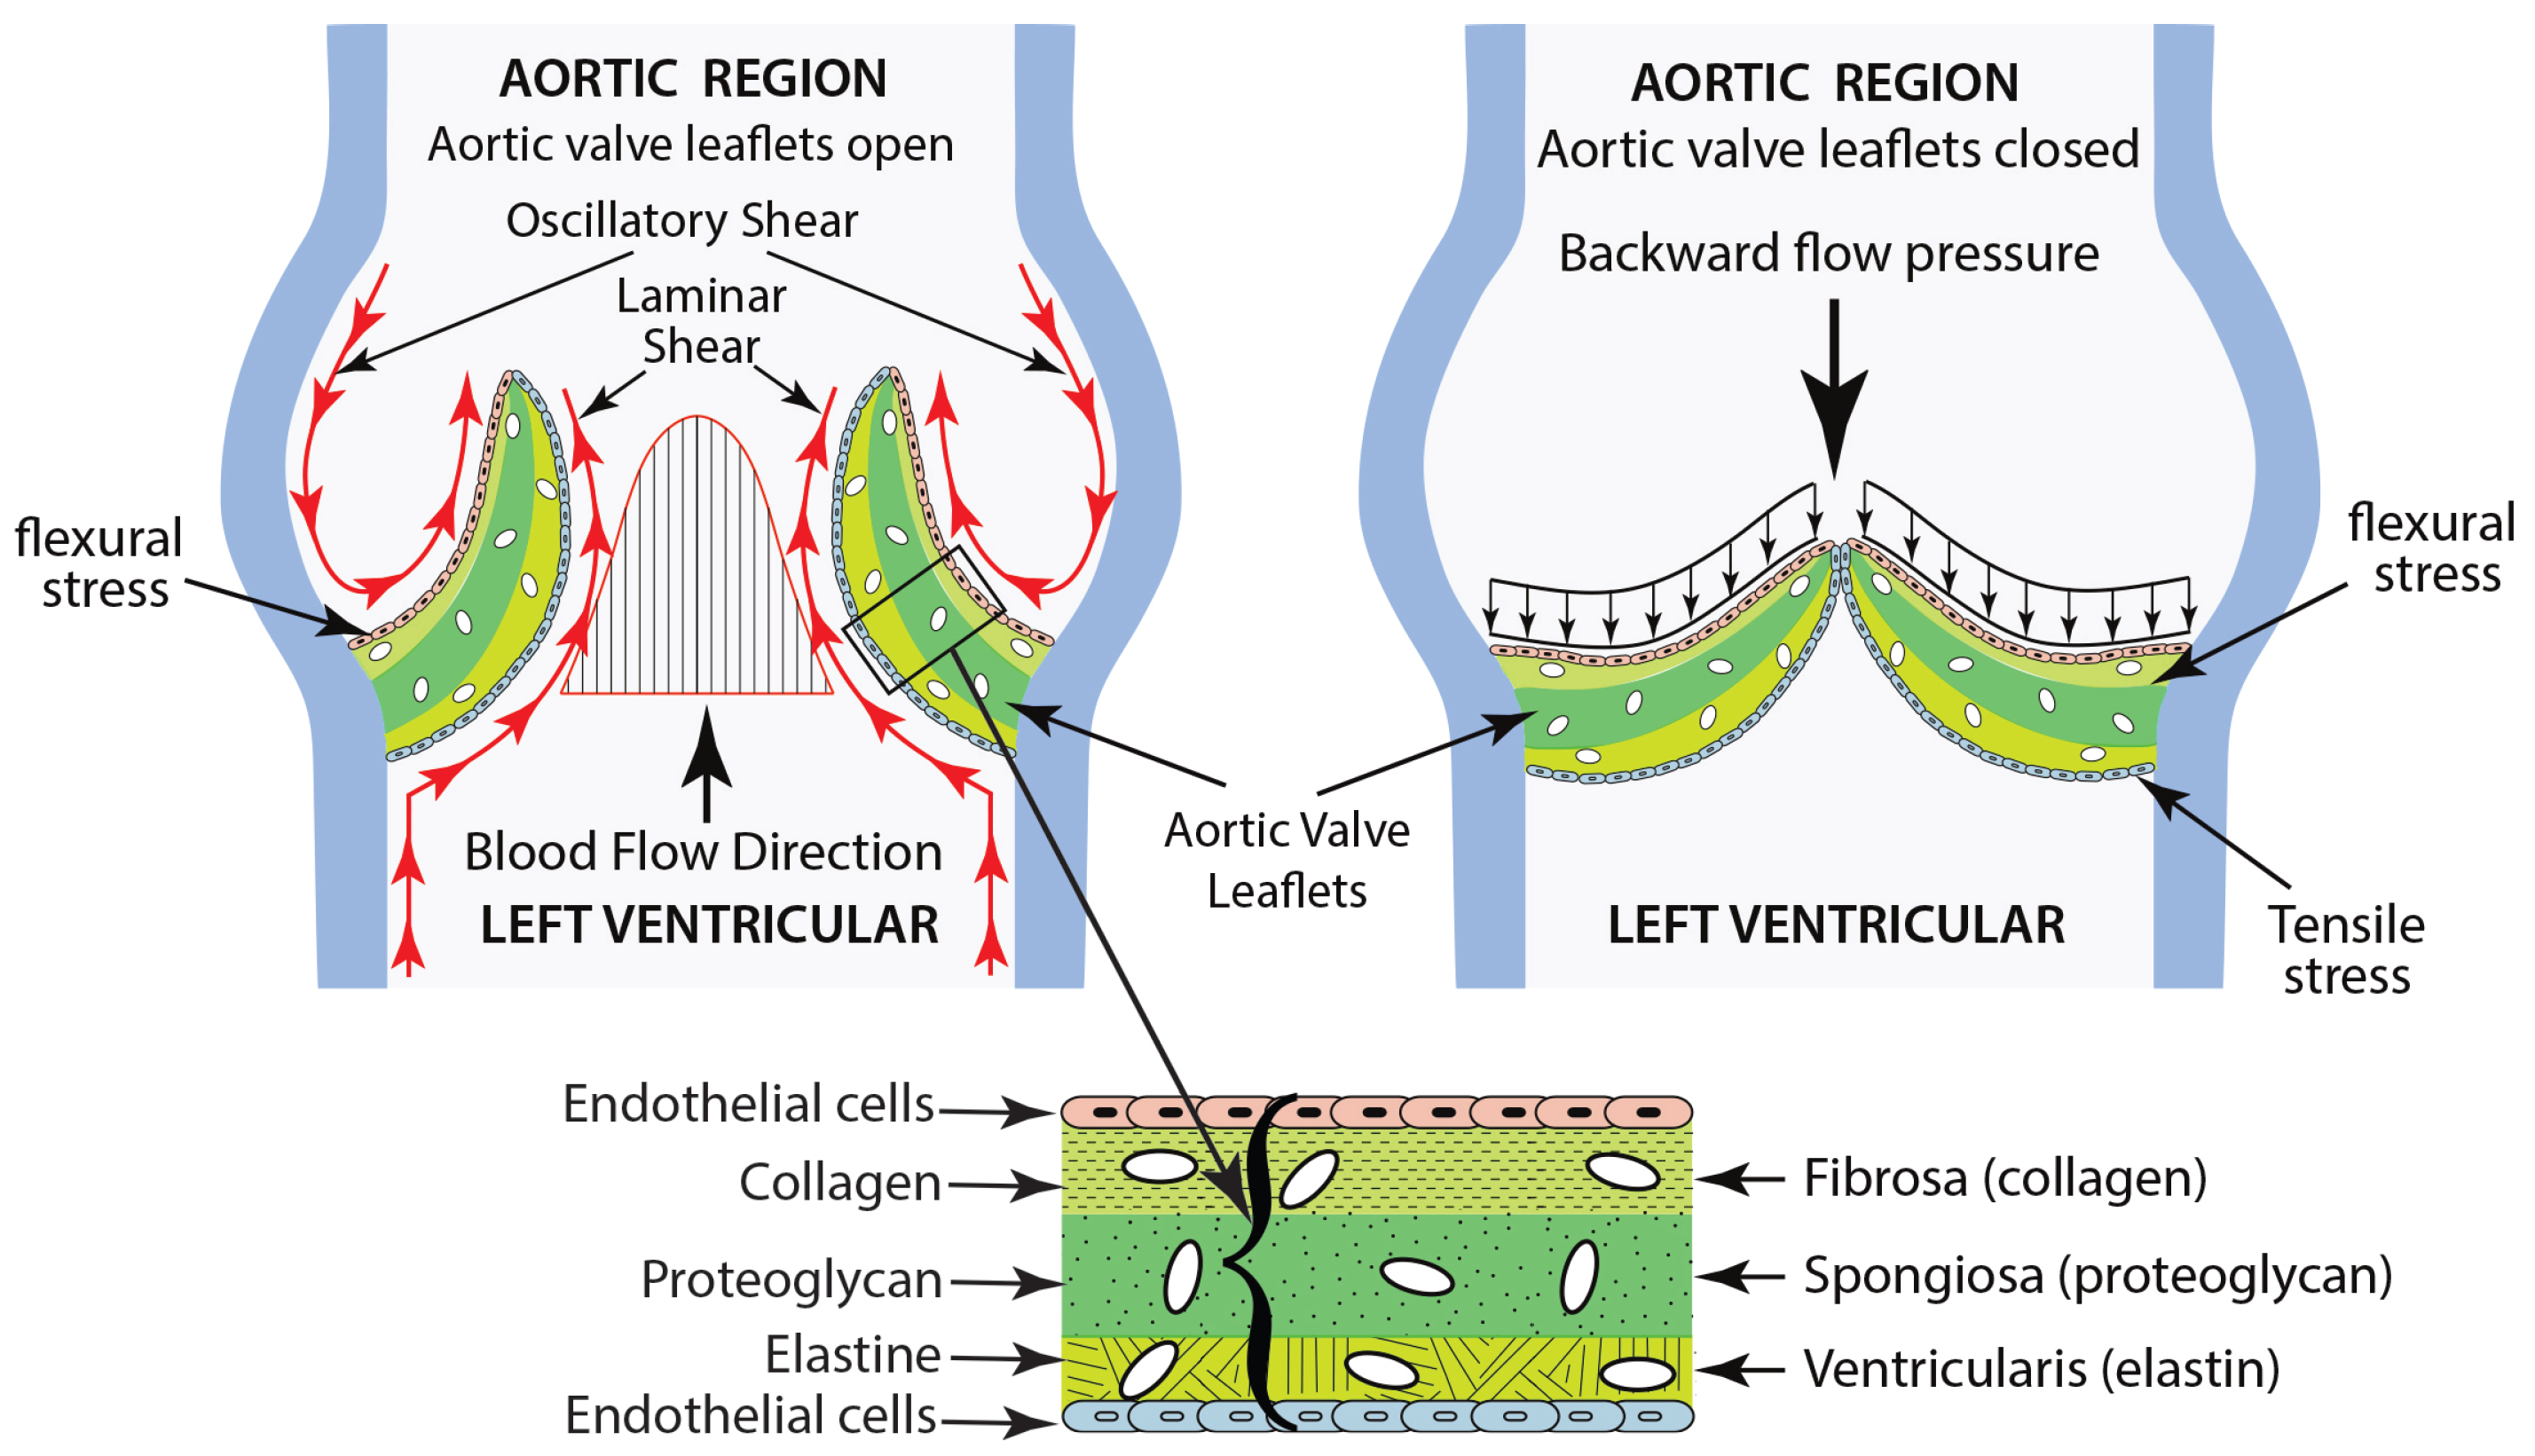
Aortic valves feature a complex architecture made up of three distinct layers, as depicted in Figure 2 [11]. These layers are meticulously designed to handle the varying mechanical stresses that arise throughout the cardiac cycle. The specifics of these three layers are discussed in detail by Amindari et al. [12].
  • The fibrosa layer, located on the outflow surface, is composed of collagen fibers that improve its structural integrity.
  • The ventricularis layer, situated on the inflow surface, is made up of elastin, which facilitates the expansion and contraction of the valve throughout the cardiac cycle.
  • The spongiosa layer is found at the center and is made up of loose connective tissue, permitting the relative movement of the adjacent layers.
The endothelial cells covering both surfaces of the valve are essential for its proper operation. Furthermore, they are thought to protect against calcific disease. The aortic valves, which facilitate the flow of blood from the left ventricle into the aorta, are made up of flexible, thin tissue structures referred to as leaflets. These leaflets operate by opening and closing in accordance with the heart’s pumping action. This mechanism generates dynamic loading, resulting in the following [13,14]:
  • Shear stresses caused by blood flow, which manifest when the valve is in the systolic (open) state.
  • Flexural stress, which is generated by transvascular pressure during the opening and closing phases.
  • Tensile stresses, which develop when the valve is closed during diastole.
This research primarily seeks to examine the critical parameters and their relationships that impact the “Direct Ink Writing” (DIW) 3D printing process, specifically aimed at employing UV-cured silicone in the production of aortic heart valves. Two distinct sizes of aortic heart valves, specifically 23 mm and 36 mm, will be produced using UV-cured silicone, with both sizes featuring identical leaflet thicknesses of 0.8 mm and 1.6 mm. An investigation will be conducted to assess the impact of valve size on its performance and functionality.

2. Materials and Methods

2.1. Factors Affecting the Direct Ink Writing 3D Silicone Printing Process

A “silicone direct ink writing 3D printer” denotes a 3D printing system that harnesses the DIW approach to layer silicone material precisely, thereby allowing for the complex three-dimensional designs constructed from silicone. A detailed account of the design process for a silicone 3D printing machine was presented by Moran et al. [15]. This research study aims to re-evaluate the parameters influencing the factors affecting the DIW 3D silicone printing process. The analysis will employ two integrated methodologies: the House of Quality (HOQ) and Interpretive Structural Modeling (ISM).

2.1.1. House of Quality

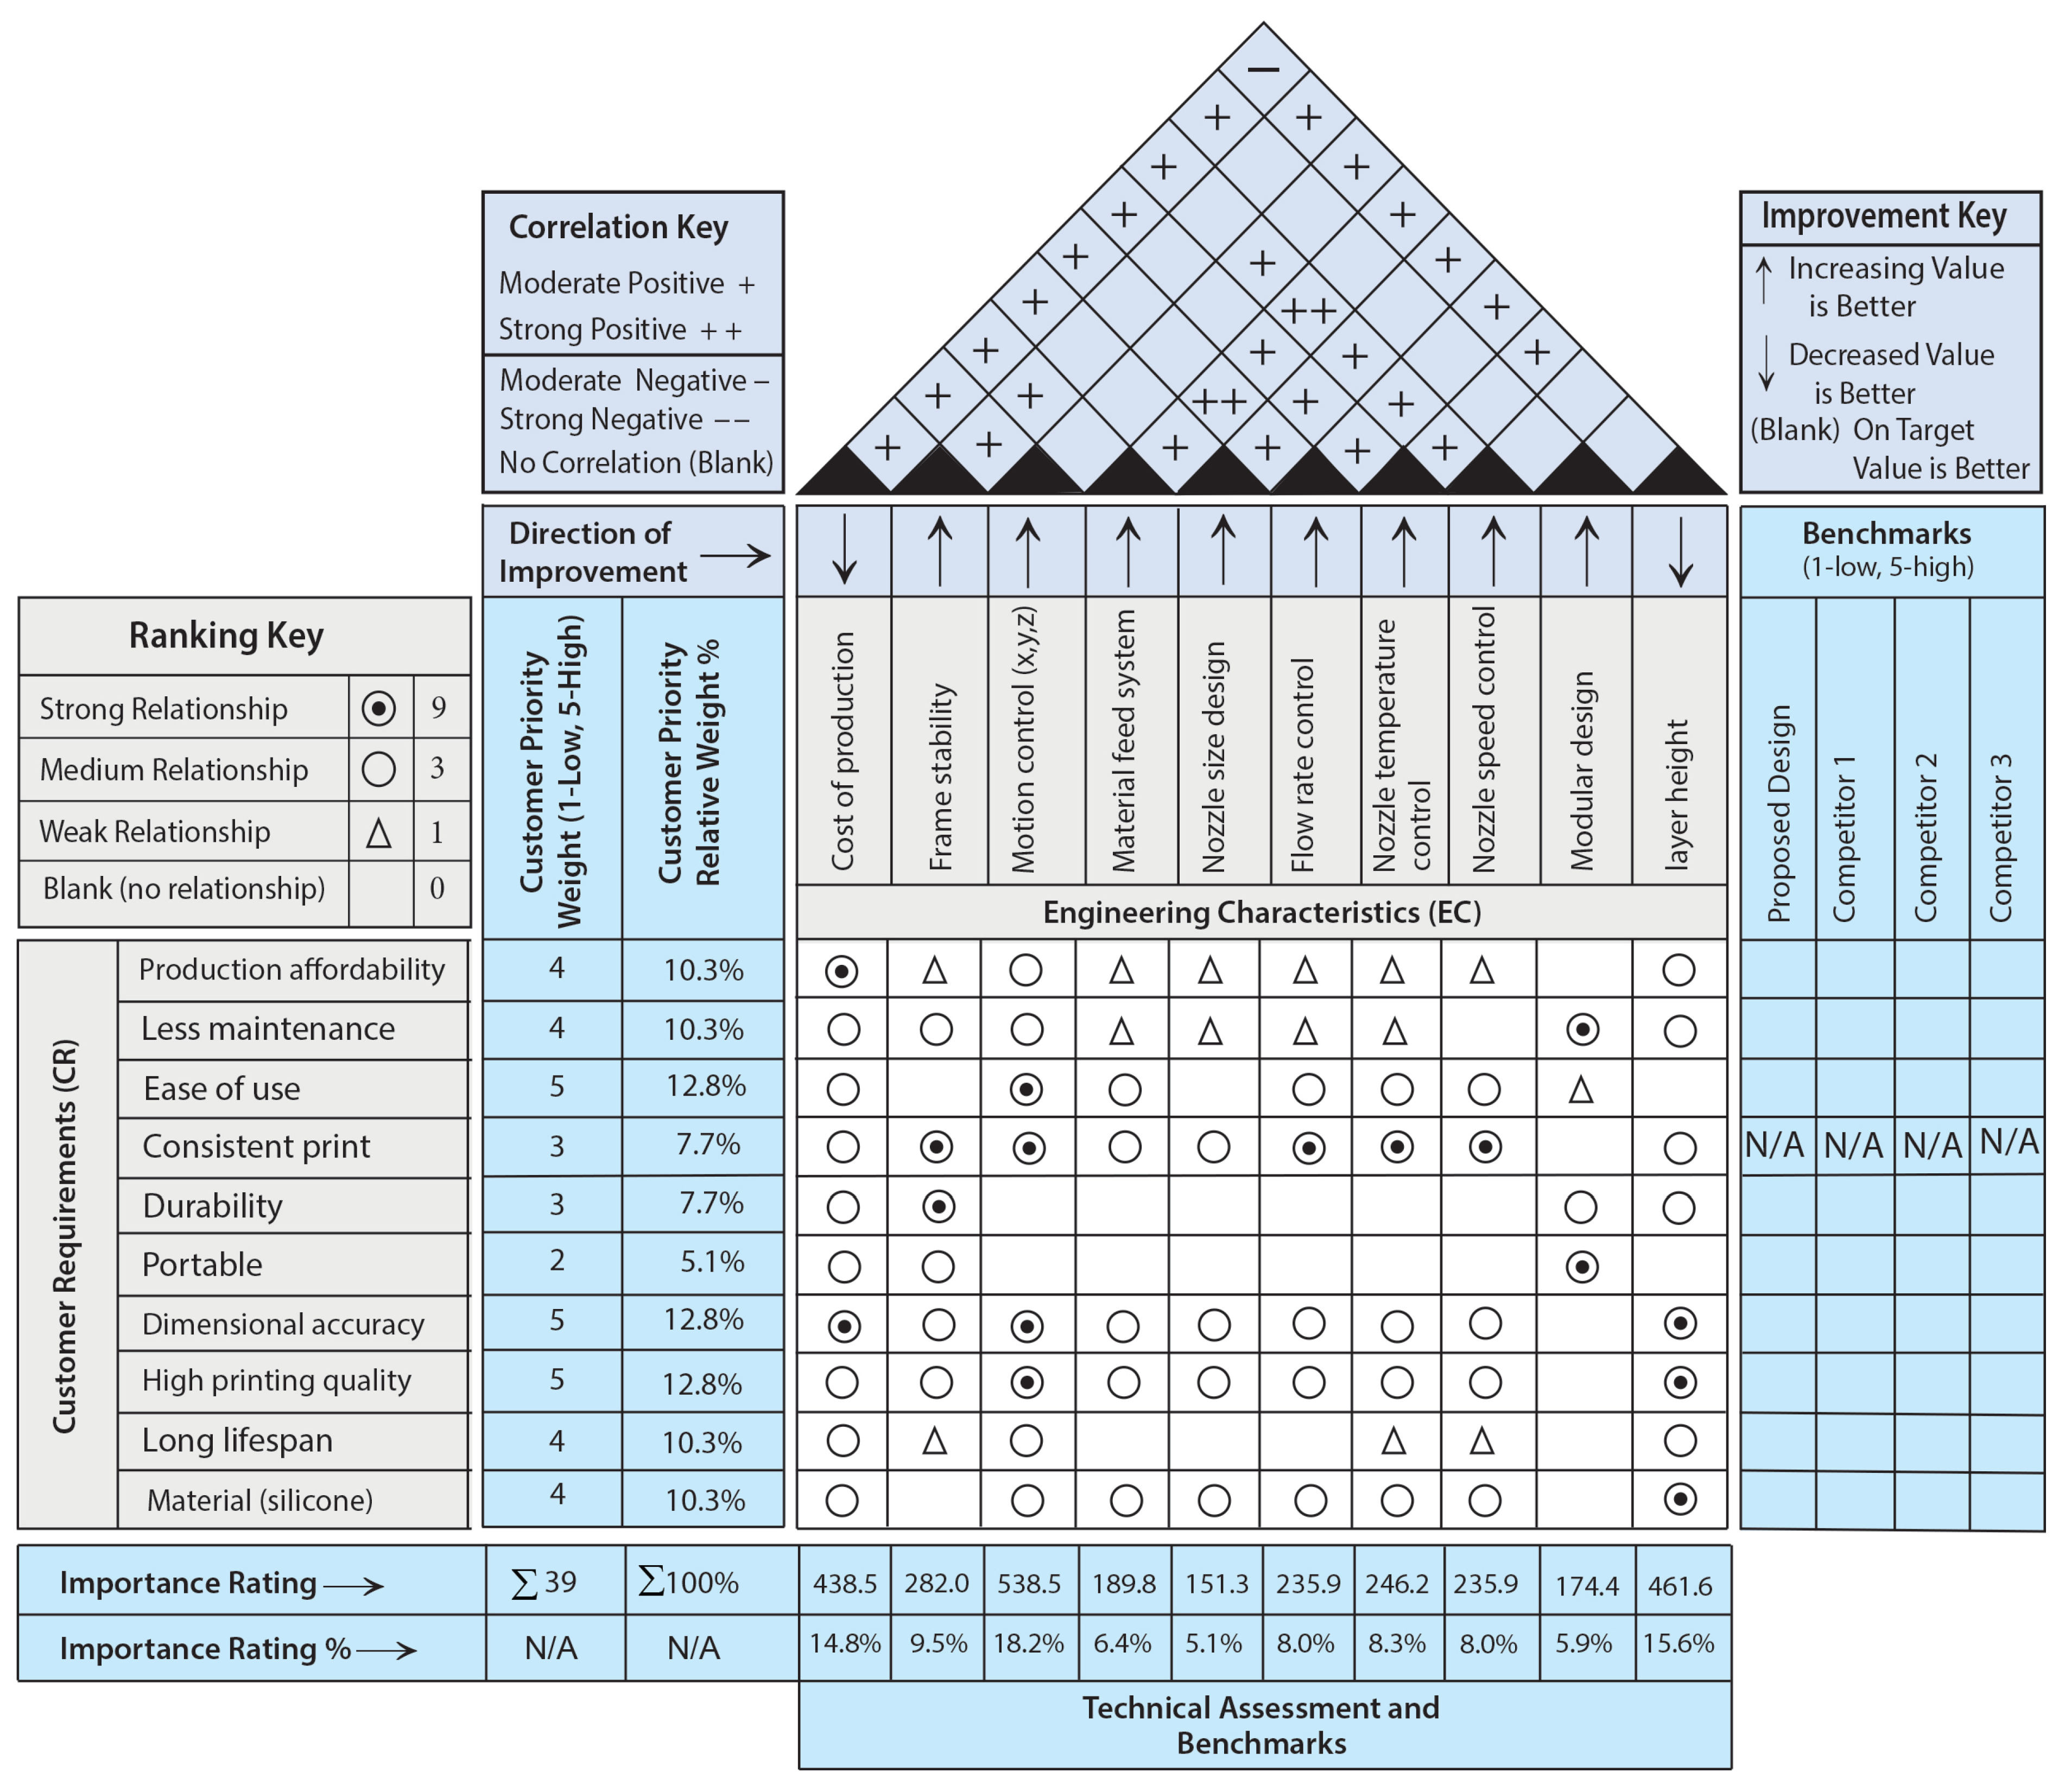
Figure 3 presents the HOQ matrix, structured in the shape of a house, with a correlation matrix positioned at the top. This configuration includes a relationship matrix that links customer needs to the engineering characteristics designed to address those needs. As illustrated in Figure 3, the authors have identified a total of ten engineering characteristics (design parameters) that align with customer requirements, along with the relationships among them (see Appendix A).

2.1.2. Interpretive Structural Modeling (ISM)

A structural model is defined as an assembly of components (elements) that illustrate their interconnections through a diagram composed of nodes and the links that join them. By employing structural modeling, one can achieve a comprehensive understanding of the entire system by analyzing the structural model of its constituent components [16,17].
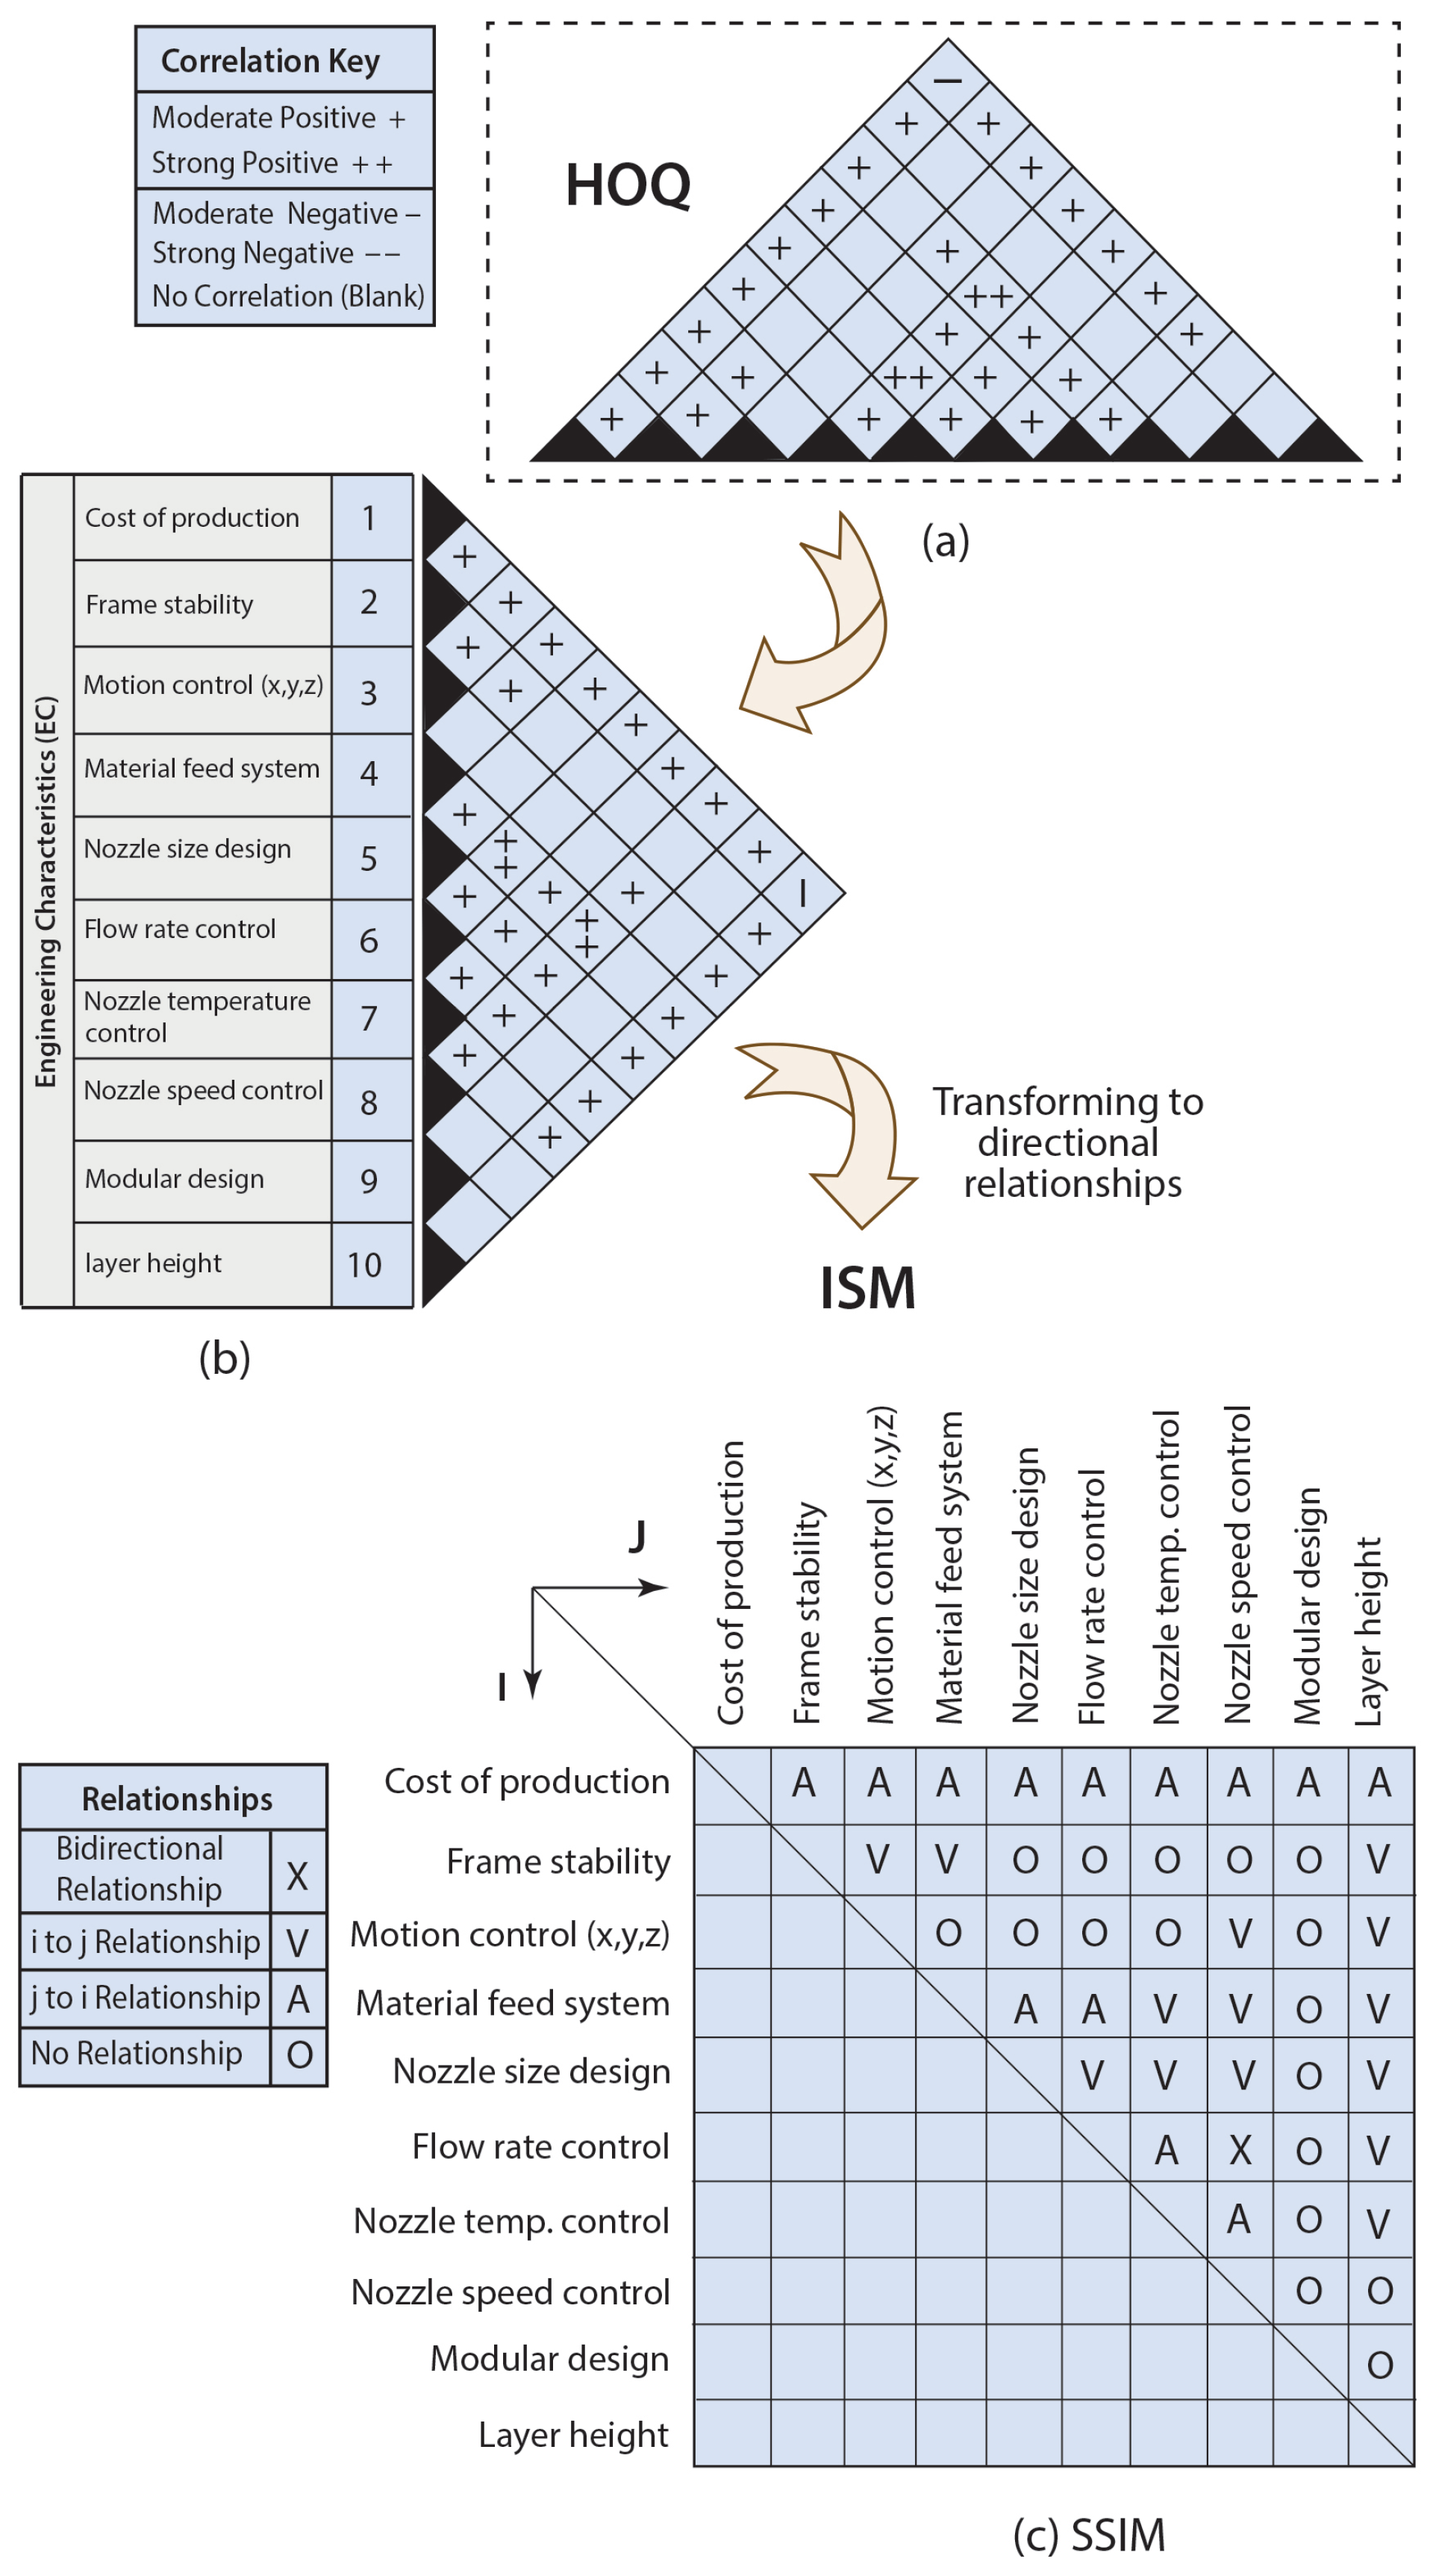
The engineering attributes obtained from the HOQ were employed as the factors affecting the performance of the 3D printing process, acting as input for Interpretive Structural Modeling (see Figure 4). After identifying the parameters, the next phase involved developing a Structural Self-Interaction Matrix (SSIM) to depict the contextual relationships among these parameters (Figure 4c). The directional relationships between the parameters “I” and “J” are illustrated using four distinct symbols.
  • “V” represents the relationship from column (i) to row (j), but not in both directions;
  • “A” denotes the relationship from row (j) to column (i), also not in both directions;
  • “X” signifies bidirectional relationships: from column (i) to row (j) and from row (j) to column (i);
  • “O” indicates the absence of any relationships between the parameters.
It is important to note that, based on the research findings (refer to Appendix), the determination of the directional relationships (V, A, X, 0) among the parameters was informed by the insights of the three authors of this paper.
Subsequently, the final reachability matrix ( R f ), which incorporates transitivity as illustrated in Figure 5, was created by converting the SSIM into a binary matrix, where the variables V, A, X, and O were replaced with 1 and 0.

2.2. Silicone Material

Silicone, a novel material in the realm of 3D printing, possesses a flexible chemical composition that can be tailored to a wide range of industrial applications. These applications encompass wearables, medical instruments, robotic manipulators, culinary implements, thermal and electrical insulators, as well as sealing solutions [18,19]. A new method now allows for the use of silicone as a material in 3D printing. Liquid silicone rubber (LSR), known for its resilience and capacity to endure extreme temperatures and conditions, offers considerable prospects for manufacturers in the field of 3D printing.
The silicone employed in this study is RTV 800-245 UV Cure Silicone, provided by NOVAGARD (Cleveland, OH, USA). This silicone cures through UV light, with the cross-linking process initiated by a photochemical reaction instead of heat. RTV 800-245 was selected for its unique UV curing chemistry, a curing time of 3–5 s, and a viscosity of 4.4 (Pa-sec) as detailed in Table 1 [11]. The rapid curing time and low viscosity make it ideal for use in the design of silicone 3D printers.
In this study, silicone is employed in the production of heart valves due to its compatibility with tissue and biocompatibility. Despite being acknowledged for its biocompatibility, these silicone valves will serve primarily as models to imitate bioprosthetic valves. Subsequent enhancements may allow for their application as implantable synthetic heart valves [5,20]. Three-dimensional printing technology facilitates the creation of heart valve models that accurately mimic the specific shape and texture of a patient’s valve. These models are essential for physicians in determining the ideal size and positioning of the valve during surgical procedures.

2.3. Tensile Testing of Silicone

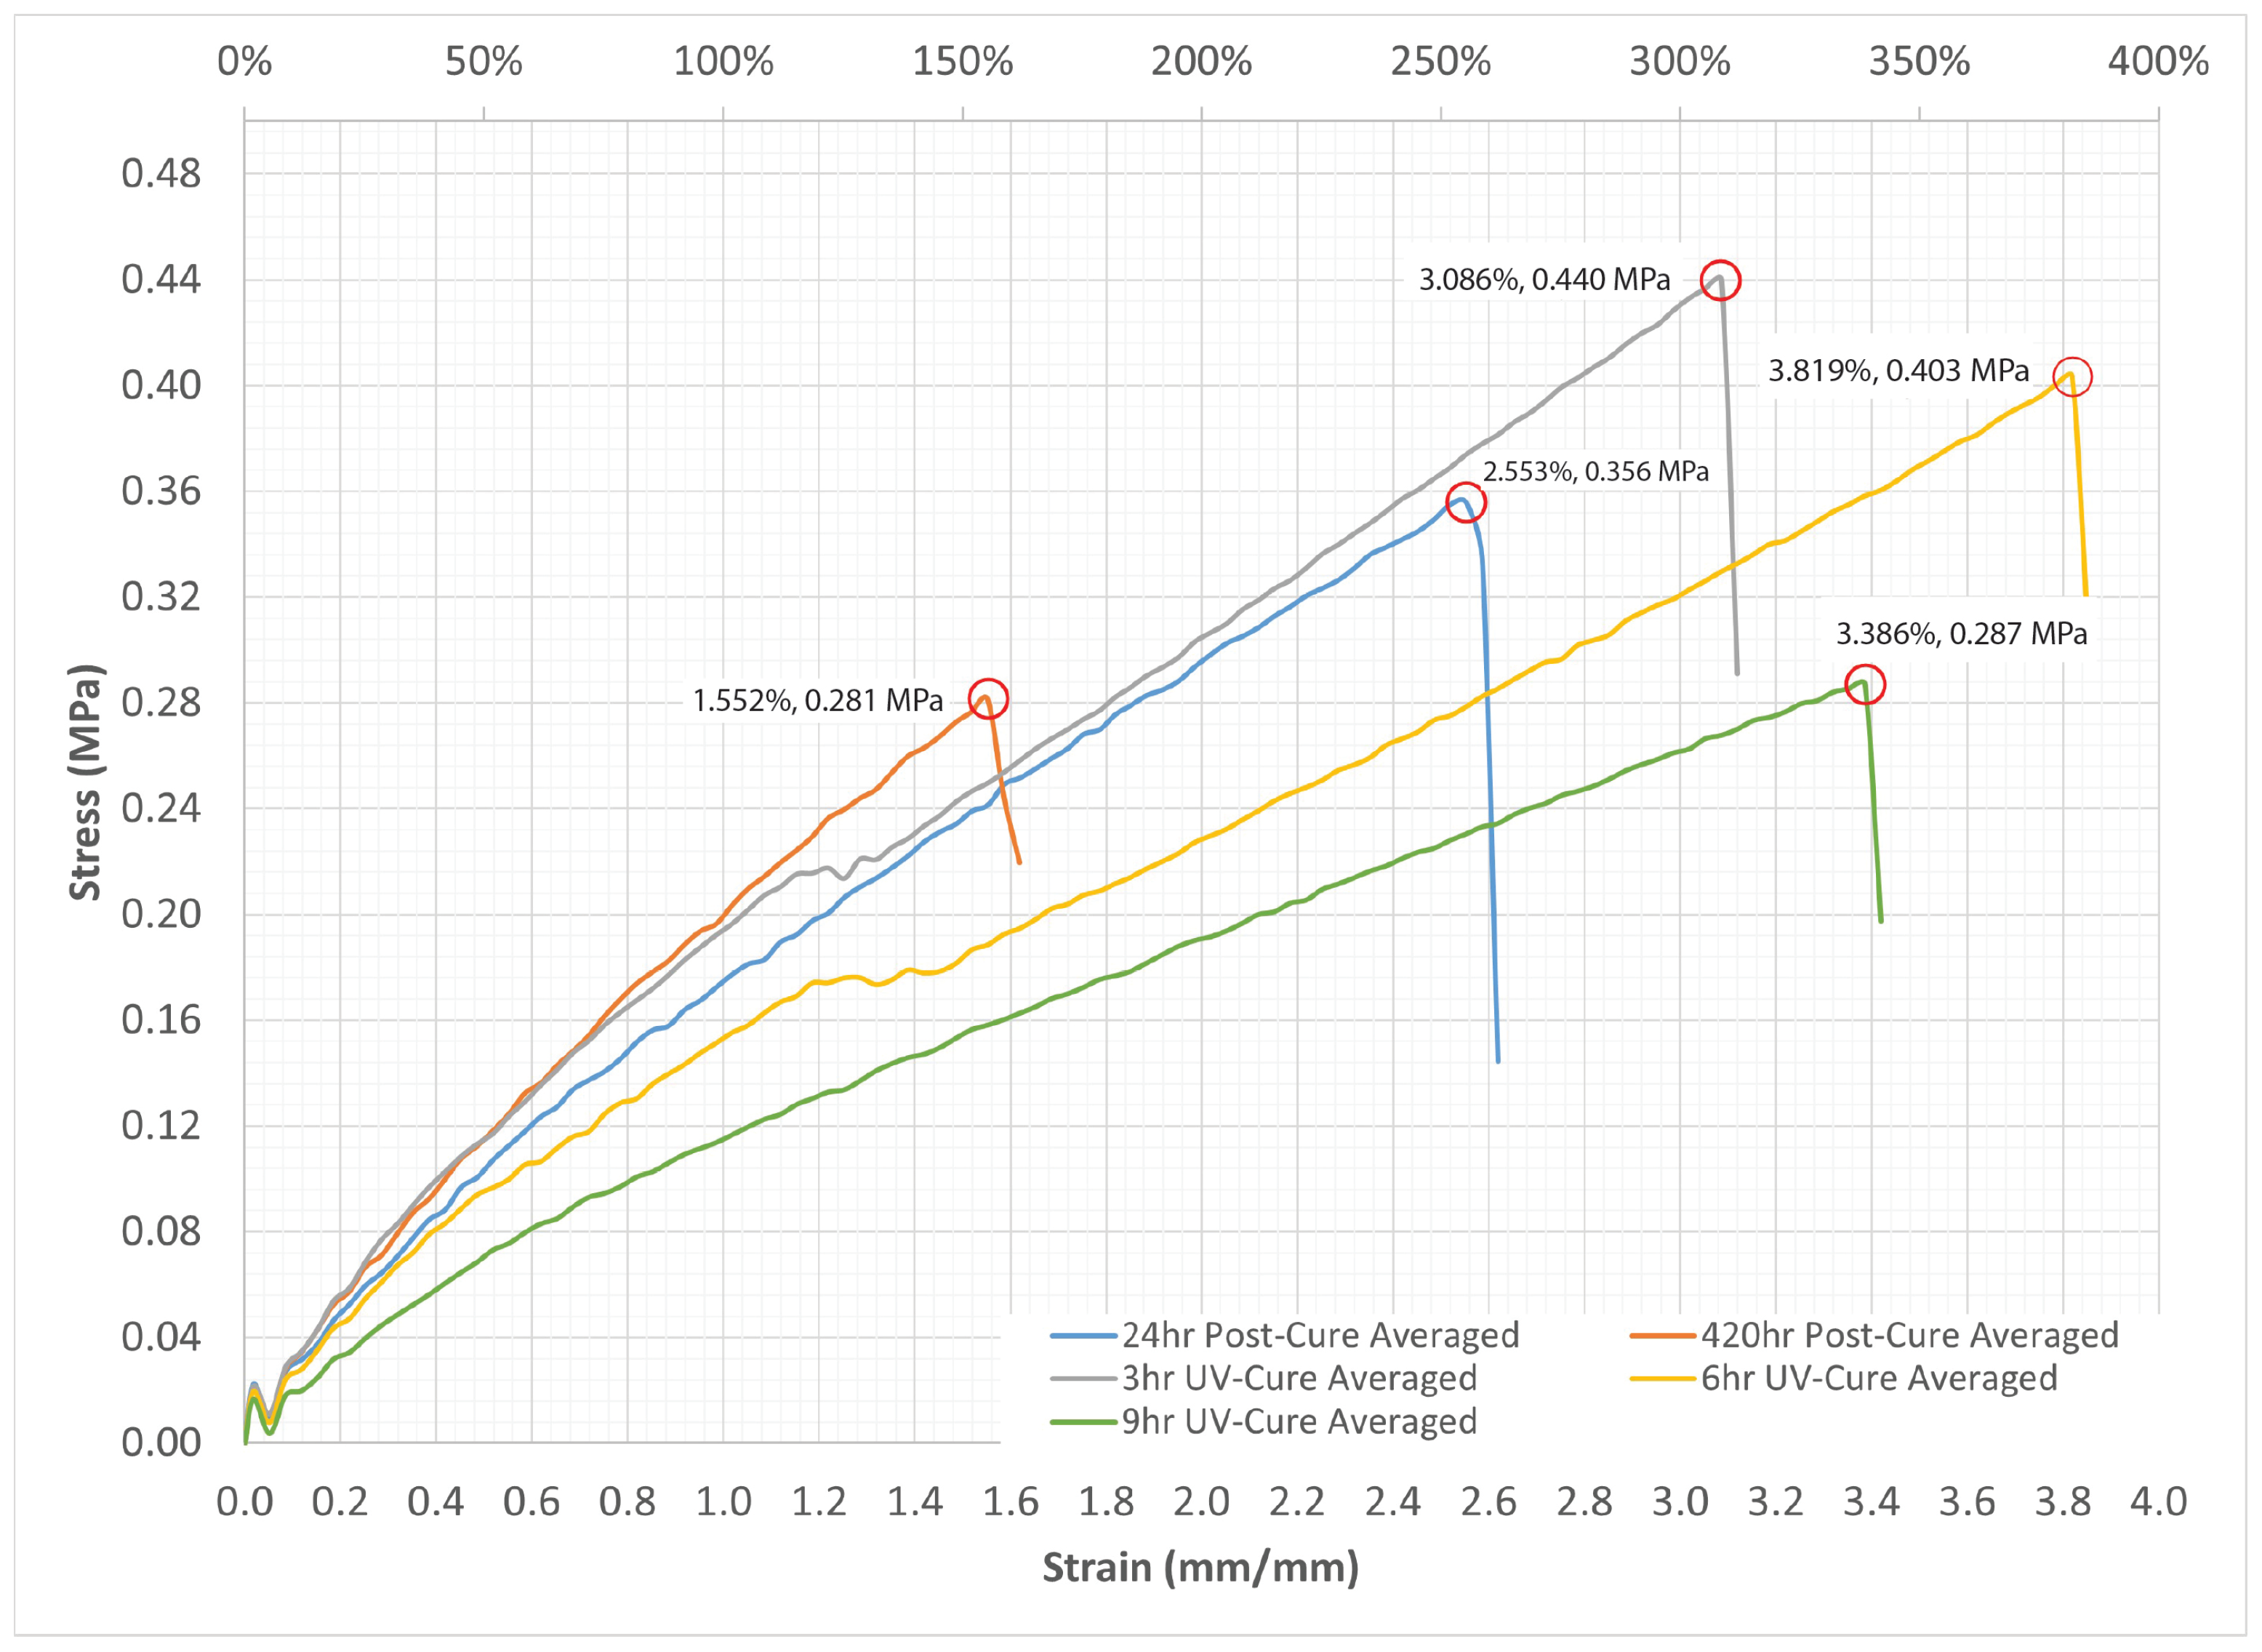
The flexibility and mechanical properties of silicone materials are essential for their application in the printing of heart valves. Nevertheless, as indicated in Table 1, the tensile strength of these silicone materials is relatively low, ranging from 0.207 to 0.621 MPa. Ertas et al. [11] aimed to investigate the effects of different durations of UV pre-curing and post-curing on the mechanical properties of the silicone utilized in their research. The ASTM D412 tensile testing standards were used to assess the stress–strain region.
The examination depicted in Figure 6 demonstrates the impact of UV curing and the duration of the post-curing phase on the mechanical properties of the silicone studied in their research. The findings revealed that a 6-h UV curing procedure is more effective for manufacturing heart valves, resulting in enhanced strength, improved elongation, and increased material flexibility. As a result, this paper utilizes the same curing method to create the silicone material outlined in Table 2 [11].

2.4. Geometry Generation for the Heart Valve and the Aorta

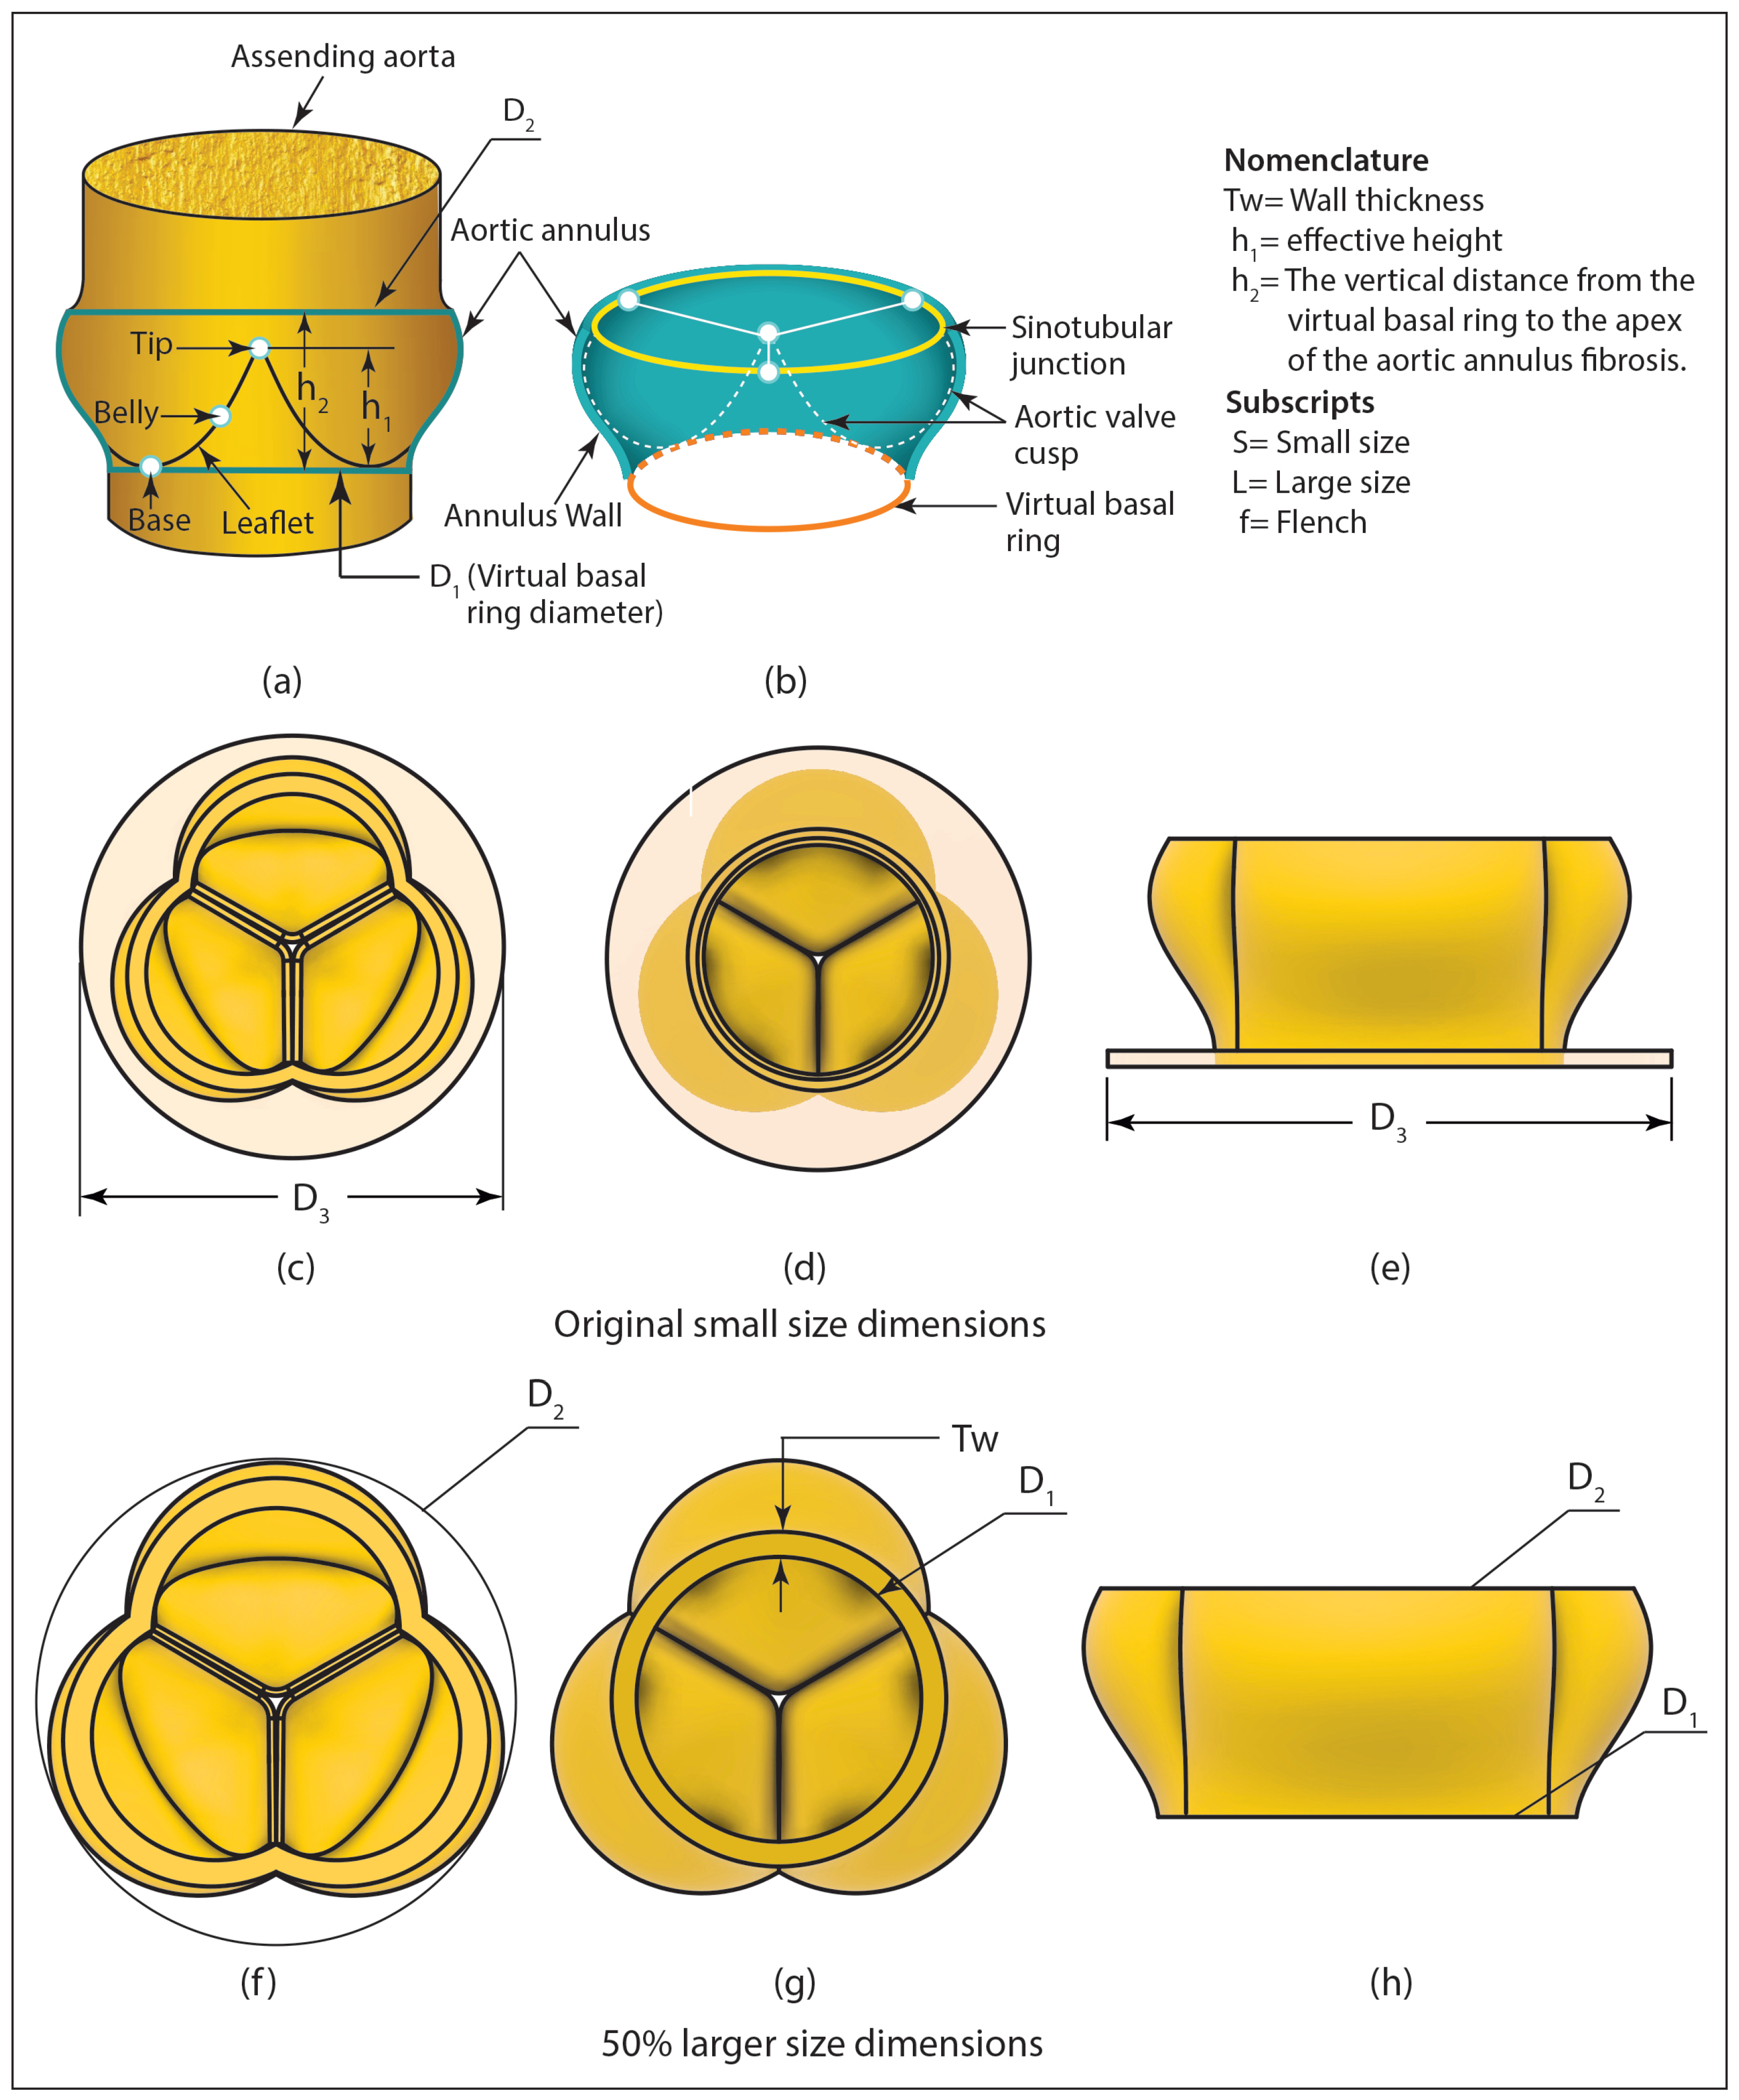
The geometry of the heart valve was designed based on the Sapien XT valve (Edwards Lifesciences, Irvine, California), with dimensions closely approximated as shown in Figure 7 and Table 3. The diameter and height of the valve were established before the fixed coordinates of the leaflet surfaces were determined.
The analysis includes two varying sizes: a smaller size with a diameter of 23 mm and a larger variant that is roughly 50% greater, at 36 mm, with both sizes having the same leaflet thickness of 0.8 mm and 1.6 mm. Achieving a precise 50% increase in size proved challenging due to certain dimensions. For instance, the thickness of the heart valve wall for the larger size was set at 3.7 mm to ensure stable printing, whereas the wall thickness for the smaller size was 2 mm. This resulted in a thickness increase of more than 50%, leading to the larger size being approximately 50% greater overall.
The aortic annulus is situated at the aortic orifice, which serves as the opening between the left ventricle and the ascending aorta. Its somewhat crown-like shape (see Figure 7a,b offers a stable foundation for the attachment of the aortic valve leaflets, thereby ensuring optimal valve function. The ‘aortic annulus virtual basal ring’ refers to an imaginary line that links the lowest points (nadir) of the three leaflets of the aortic valve, signifying the ’true’ aortic valve annulus. The sinotubular junction signifies the connection between the aortic root and the ascending aorta (see Figure 7b).
The surfaces of the leaflet were formed utilizing three main curves: the attachment curve, the free edge, and the belly curve. The attachment curve denotes the fixed side of the leaflet. Conversely, the free edge connects the commissures of the leaflet and allows for movement as the valve opens. Finally, the belly curve is defined by its concave shape located on the midplane of the leaflet.
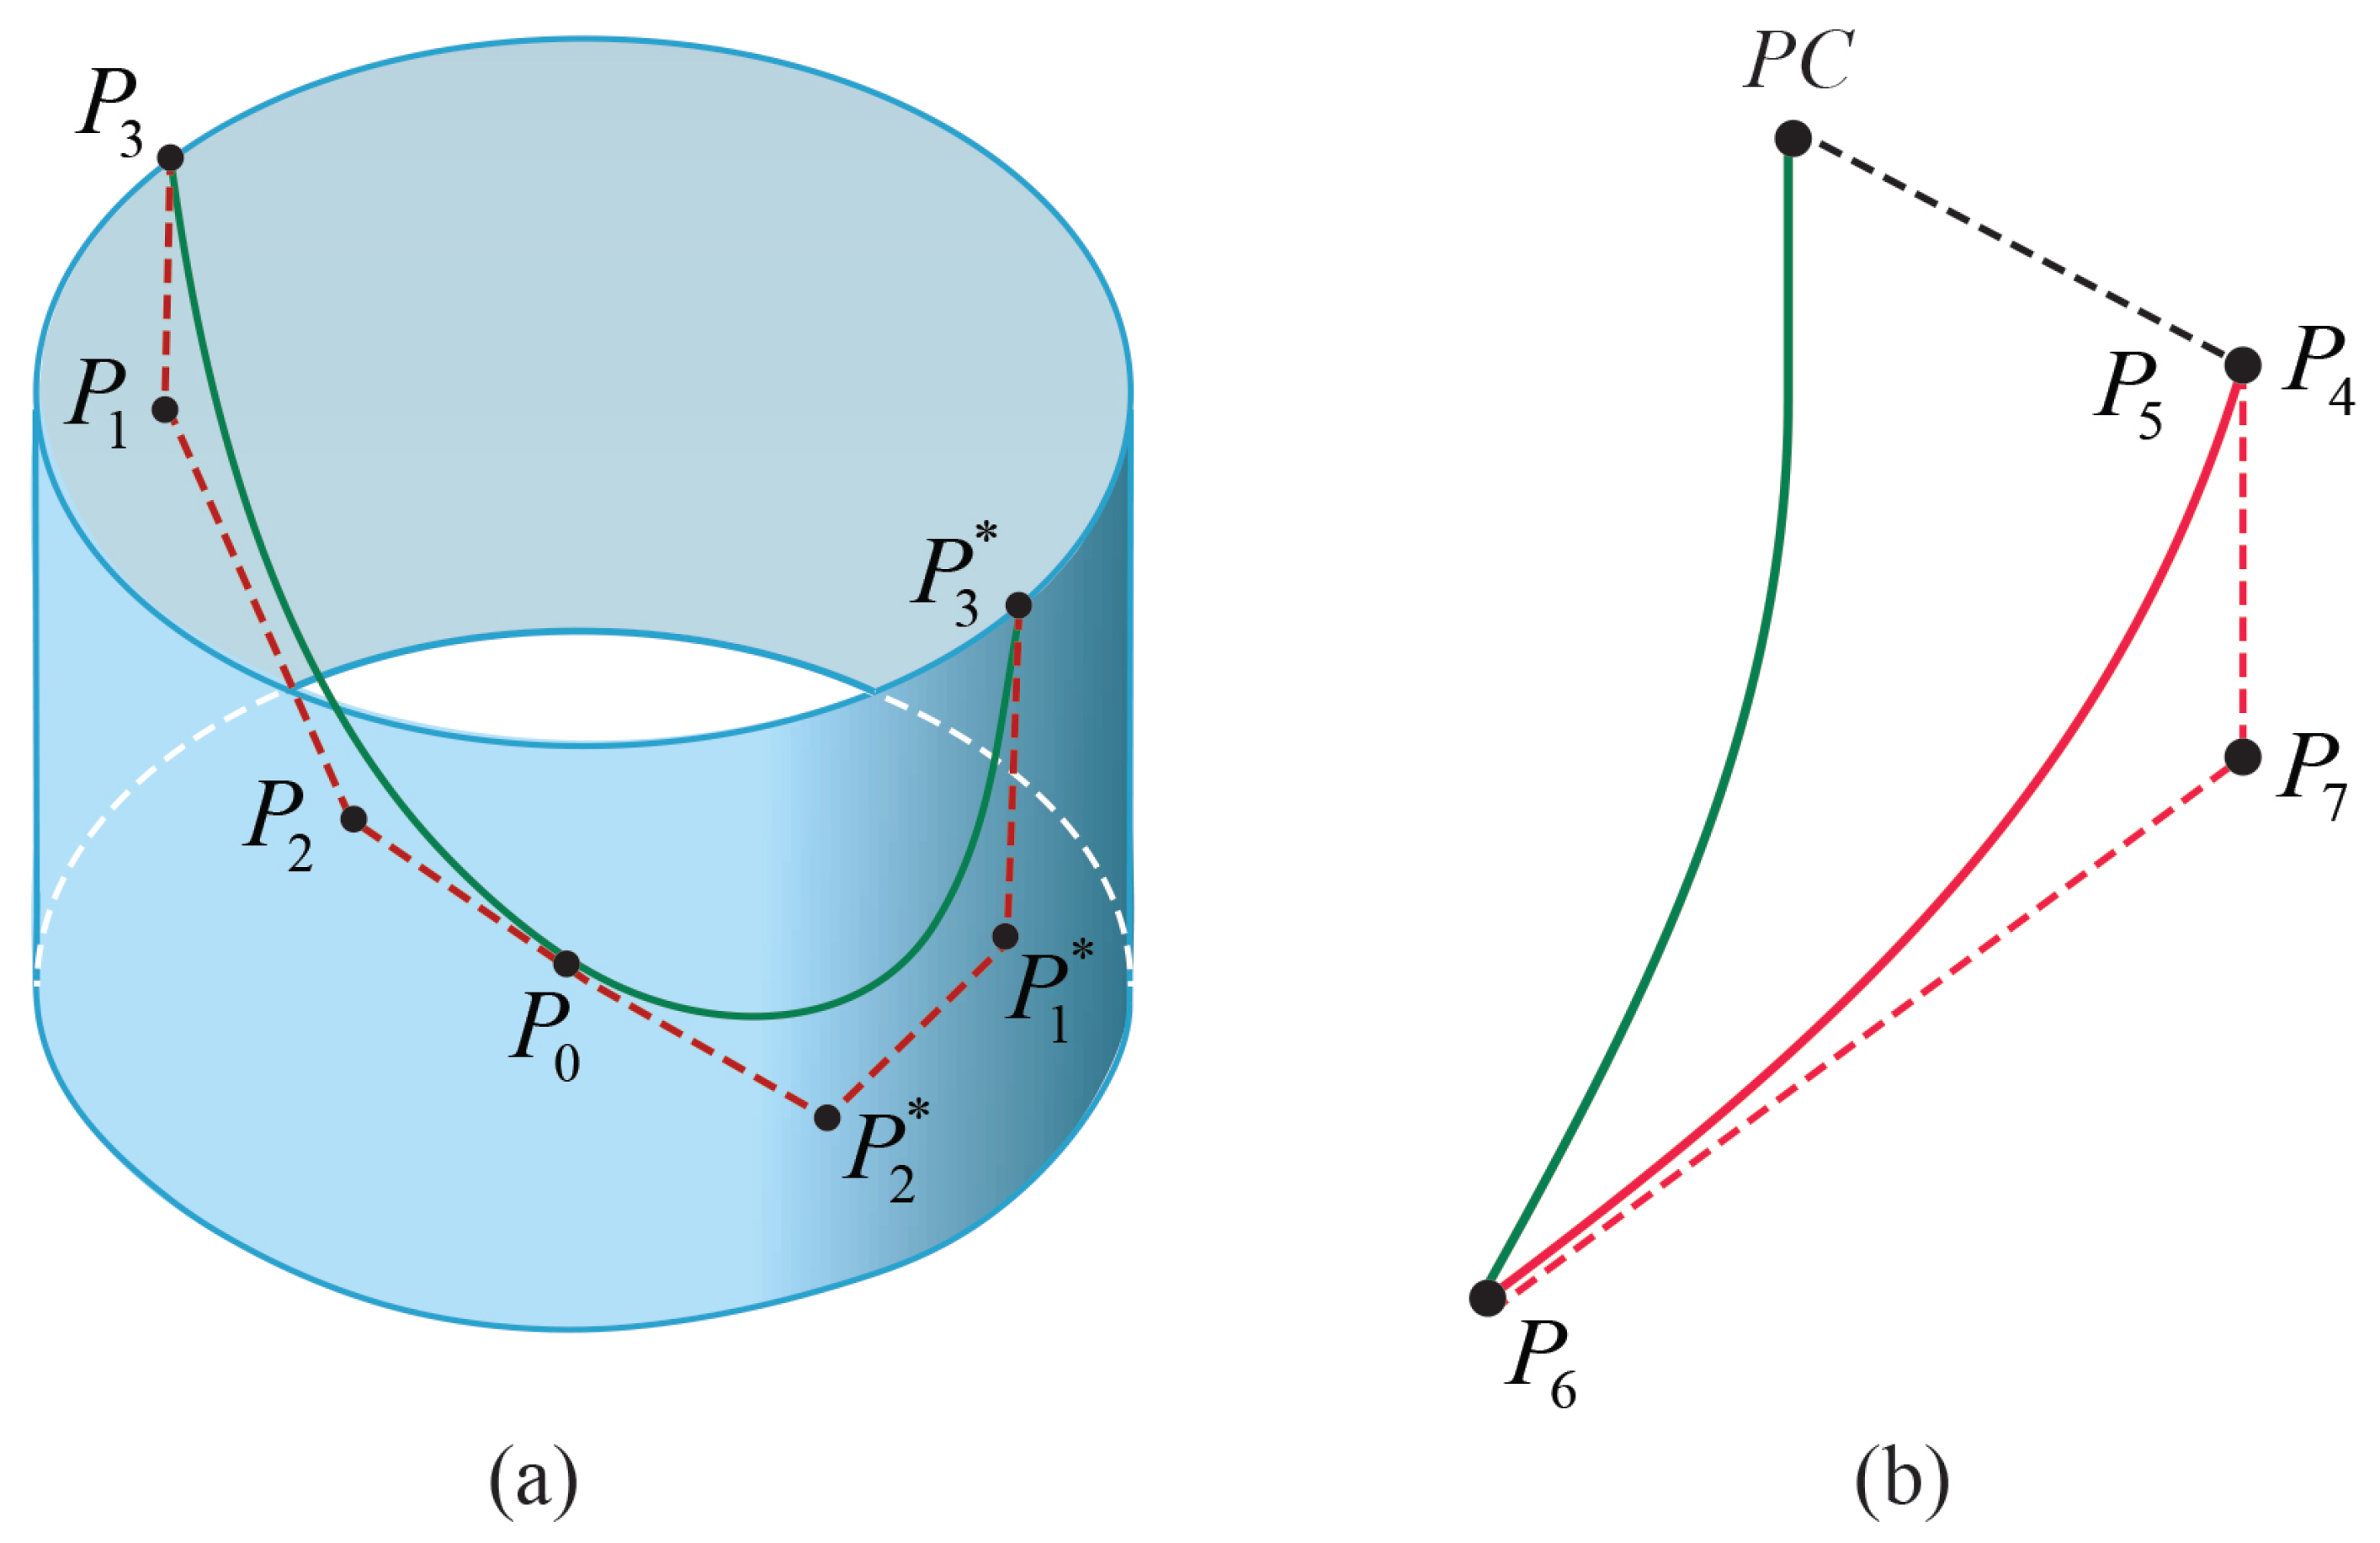
A cubic Bézier curve was employed to create the two-dimensional spline for the attachment curve [21,22,23,24]. The notion of a 2D spline encompasses four unique points. In Figure 8a, P1 and P2 serve as the control points, while P0 and P3 are recognized as the fixed endpoints. Asterisks indicate mirrored coordinates.
As depicted in Figure 8a, a three-dimensional curve was created by encircling the two-dimensional attachment curve around a cylinder with a diameter of 23 mm for the smaller model and 36 mm for the larger model. The commissural points of the three-dimensional attachment curve, designated as PC, along with the center of the valve, known as P4, were employed to establish the free edge (see Figure 8b). Furthermore, P6 and P5 were identified as the defined endpoints, while P7 served as the sole control point for outlining the belly curve (refer to Figure 8b). This belly curve serves as a benchmark for molding the concave arrangement of the valve geometries. The surface of the valve leaflets was crafted as boundary patches, encompassing both the attachment and free edges. By adjusting the control points P1, P2, and P7, various geometries of heart valves can be produced. For further detailed information, consult references [25,26].

2.5. Experimental Setup

The experimental configuration illustrated in Figure 9 is employed to collect data on cardiac cycles (RPM), pressure measurements recorded before and following the heart valve insertion, as well as flow rate information.
In this research experiment, water functions as the circulating fluid within the Mock Circulatory Loop (MCL). The depiction of the LV simulator is a crucial component of the mock circulation arrangements illustrated in Figure 9. The experimental setup utilized Tygon S3 E-3603 NSF-51 tubing, which has an inner diameter of 1 inch, along with an open-air reservoir that acts as a replacement for the left atrium. The Extech laser photo tachometer counter was utilized to measure the heartbeat. Two distinct types of sensors were employed in this experiment: a pressure sensor and an ultrasonic flow rate sensor. The aortic valve was positioned immediately following the outlet of the left ventricle simulator, which was powered by a diaphragm pump. To manage the variations in atrial pressure during the experiments, the left atrium tank was connected to an adjustable aluminum framework. The data acquisition system used for the experiment was the NI-cDAQ-9178, which included an NI 9215 module from National Instruments Labs Inc. [11].
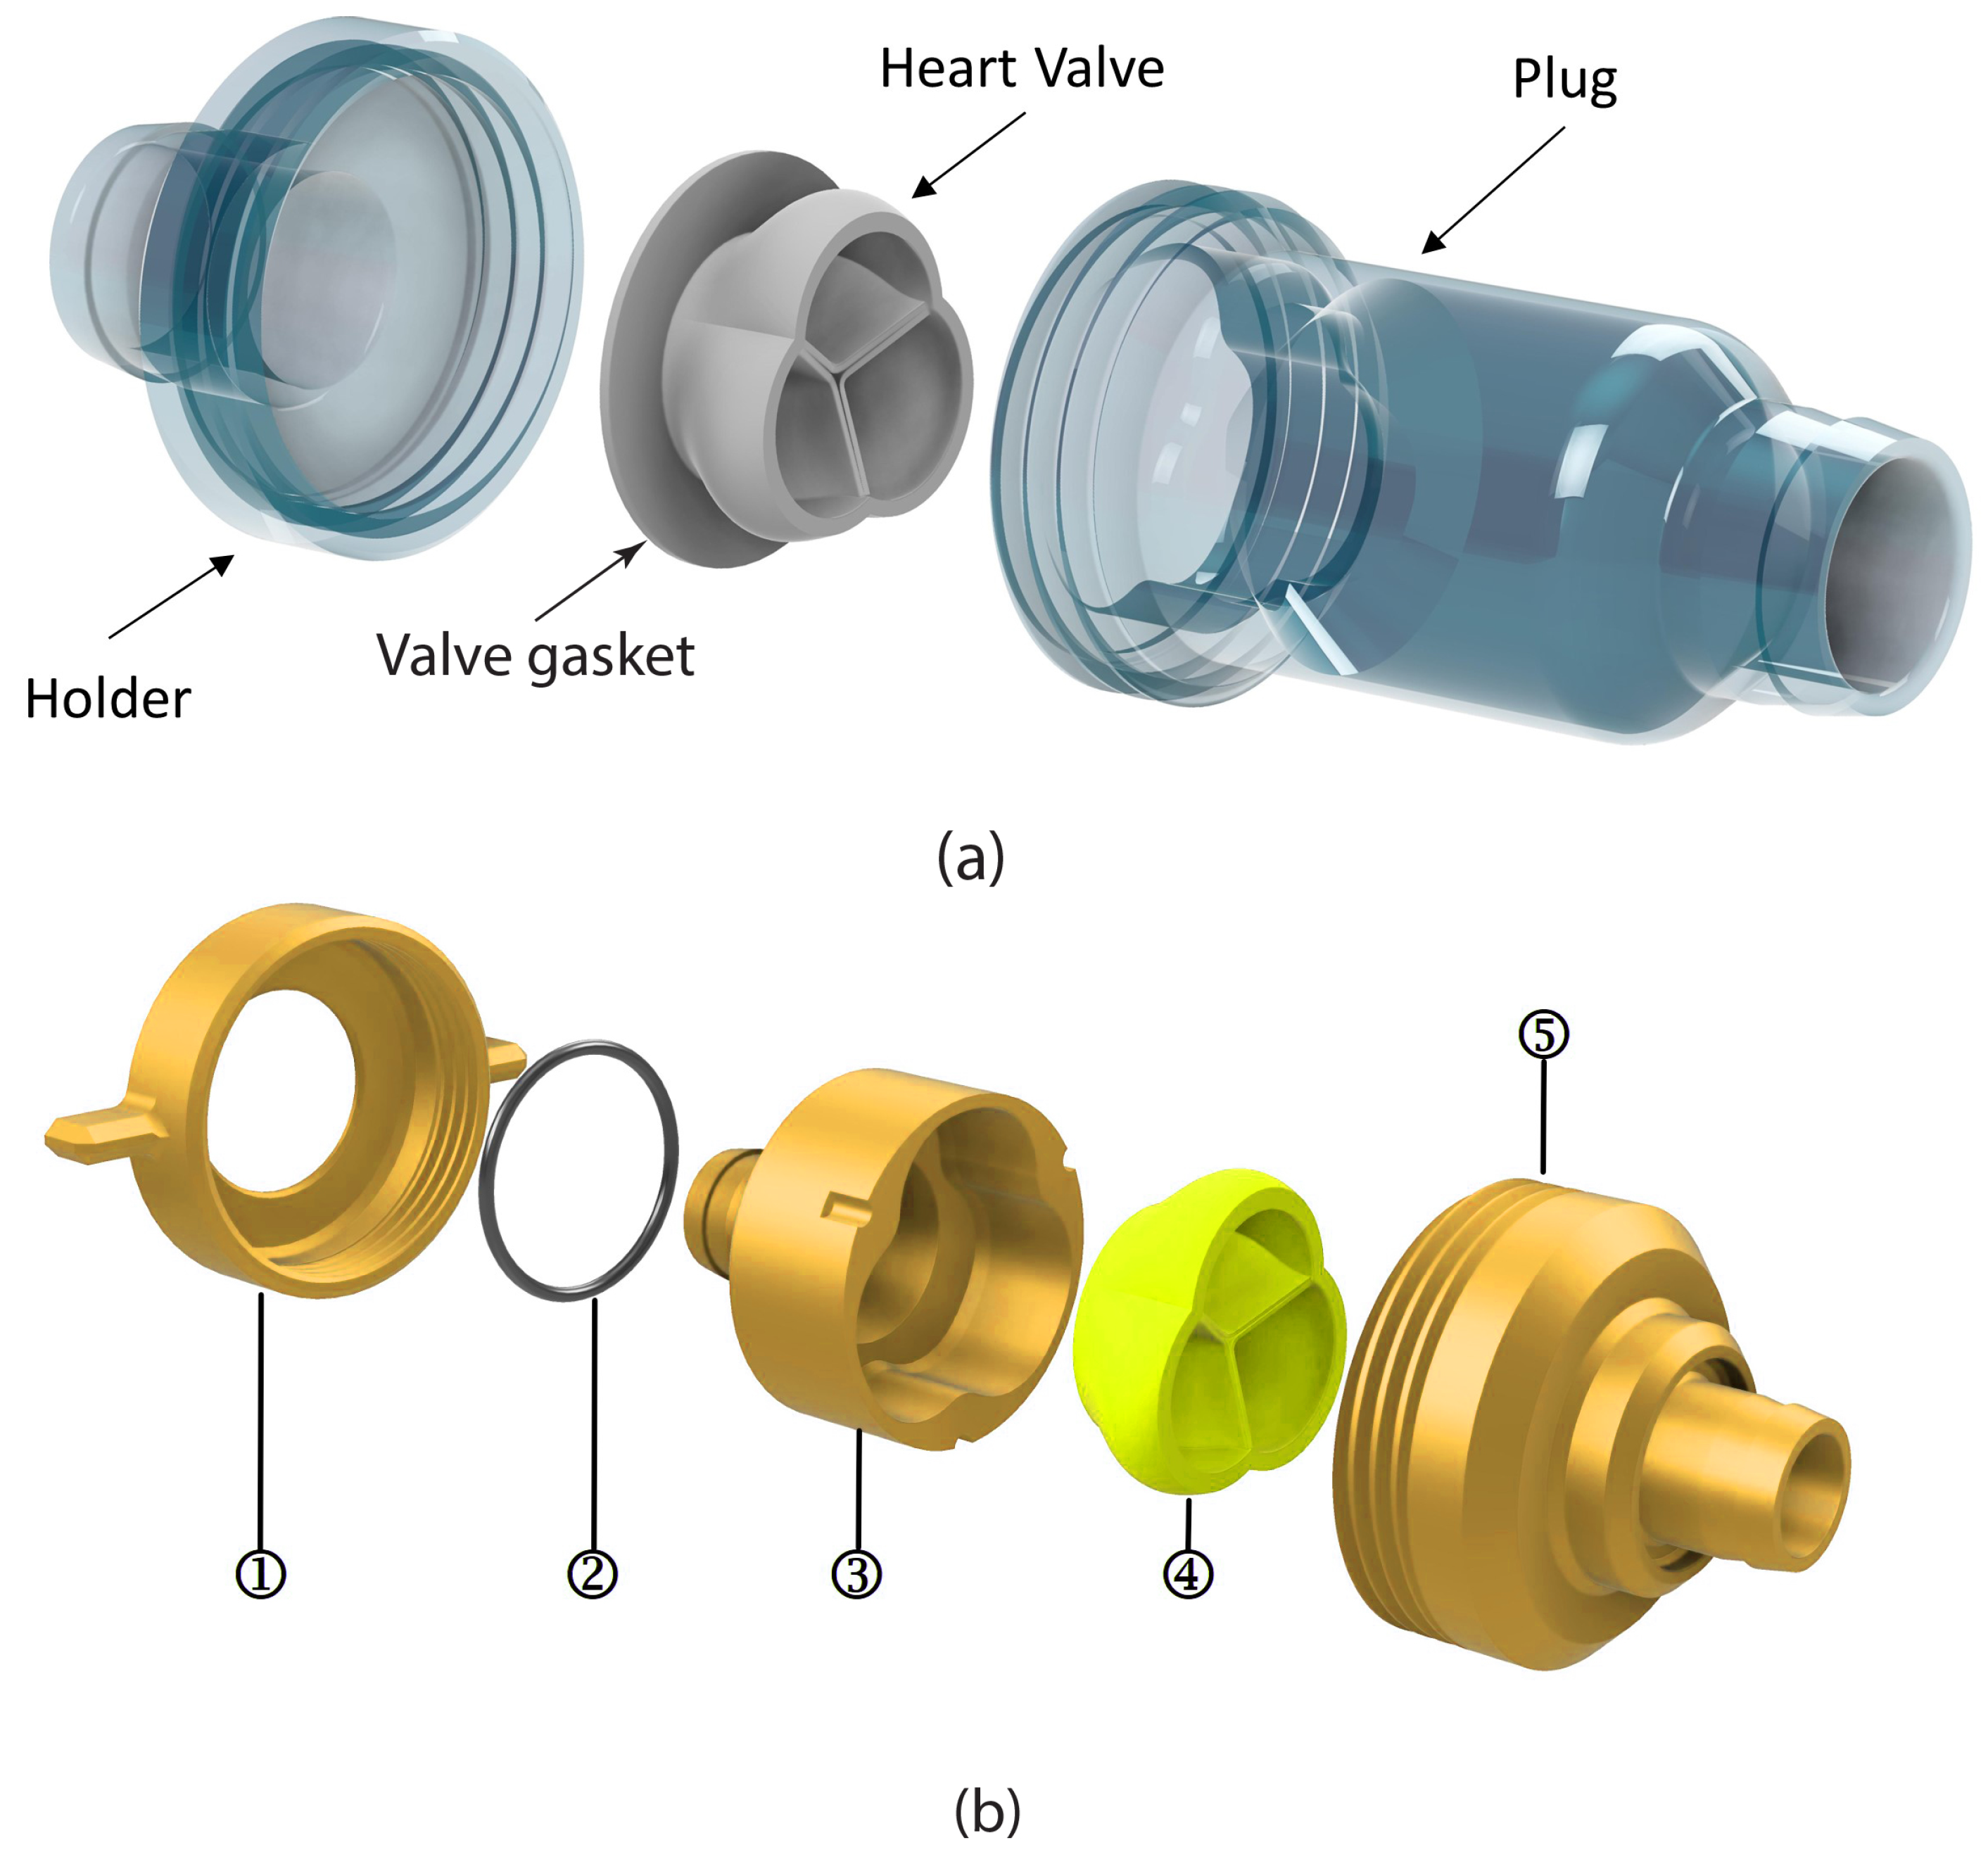
Two distinct designs were created for the valve chamber, as illustrated in Figure 10: one designed for a smaller size and the other for a larger size of heart valve.
The heart valve chamber, depicted in Figure 10a for the small-sized heart valve, comprises two main components: the plug, which applies pressure to the heart valve to inhibit its movement, and the heart valve holder, which ensures the correct alignment of the heart valve. It is important to note that the valve gasket is printed in conjunction with the heart valve to prevent leakage.
Figure 10b presents a unique heart valve chamber design that ensures the heart valve remains securely positioned without torsional rotation during the tightening process. This innovation significantly reduces the time required when inserting a heart valve into the chamber for simulation purposes and minimizes the risk of heart valve damage during the tightening process. The proper execution of this tightening process is essential to prevent fluid leakage in the heart valve chamber during mock circulation loops.
The Chamber Fastening Cap (No. 1) of the heart valve chamber is depicted in Figure 10b. This component features internal threading, which secures the Valve Securing Chamber (No. 3) to the Chamber Cavity (No. 5). By applying pressure to the O-Ring (No. 2) and the Valve Securing Chamber (No. 3) as it tightens onto the external threads of the Chamber Cavity (No. 5), creating a waterproof seal.
Figure 10b shows the Valve Securing Chamber, which is internally contoured to align with the shape of the heart valve (No. 4). This design provides support and helps maintain the fixed position of the heart valve during testing. Three distinct semi-cylinder slots can be seen on the outside of No. 3 in Figure 1b, these slots slide into three semi-cylinders in No. 5, keeping the Valve Securing Chamber in place and preventing any twisting during the tightening process.
Polymeric heart valves represent a potentially more cost-effective option compared to mechanical and bioprosthetic valves. For an extended period, investigations into prosthetic heart valves have concentrated on materials that exhibit excellent durability and biocompatibility, with the thickness of the leaflets being a vital aspect of the design [21].

3. Results and Discussions

3.1. Design Analysis of the 3D Printing Machine for Heart Valve Production

The findings from the HOQ analysis reveal that motion control, layer height, and production costs hold the highest importance ratings. Therefore, it is important to prioritize these essential design features in the 3D printing process.
Conflicts among engineering characteristics are common. Figure 3 demonstrates that the correlation matrix (the roof of the house) is utilized to determine the relationships where these characteristics either align or conflict in the design process of the 3D printing.
For instance, we can examine the engineering characteristics of “motion control” and “production costs”. A well-functioning quality “motion control” system can significantly reduce production costs by minimizing waste, rework, and scrap, which are major factors influencing the “cost of production”. By identifying defects early in the production process, a strong quality control system eliminates the necessity for extensive repairs or the disposal of defective products, thereby conserving materials, labor, and production time. This indicates that both engineering characteristics, “motion control” and “cost of production”, affect each other positively.
In 3D printing, selecting a “lower layer” height often leads to increased production costs. This is because it requires a longer printing time, given the larger quantity of layers required to fabricate the object. This situation results in greater material consumption and may also elevate the wear and tear on the 3D printing machine. On the positive side, this method yields a substantially improved print quality, featuring finer details and a smoother surface finish. This reveals a conflict between the “cost of production” and “layer height”, where each adversely affects the other (refer to Figure 3). This situation represents a trade-off between two parameters, demonstrating how much one parameter can be improved without negatively impacting another parameter.

3.1.1. Formation of Digraph

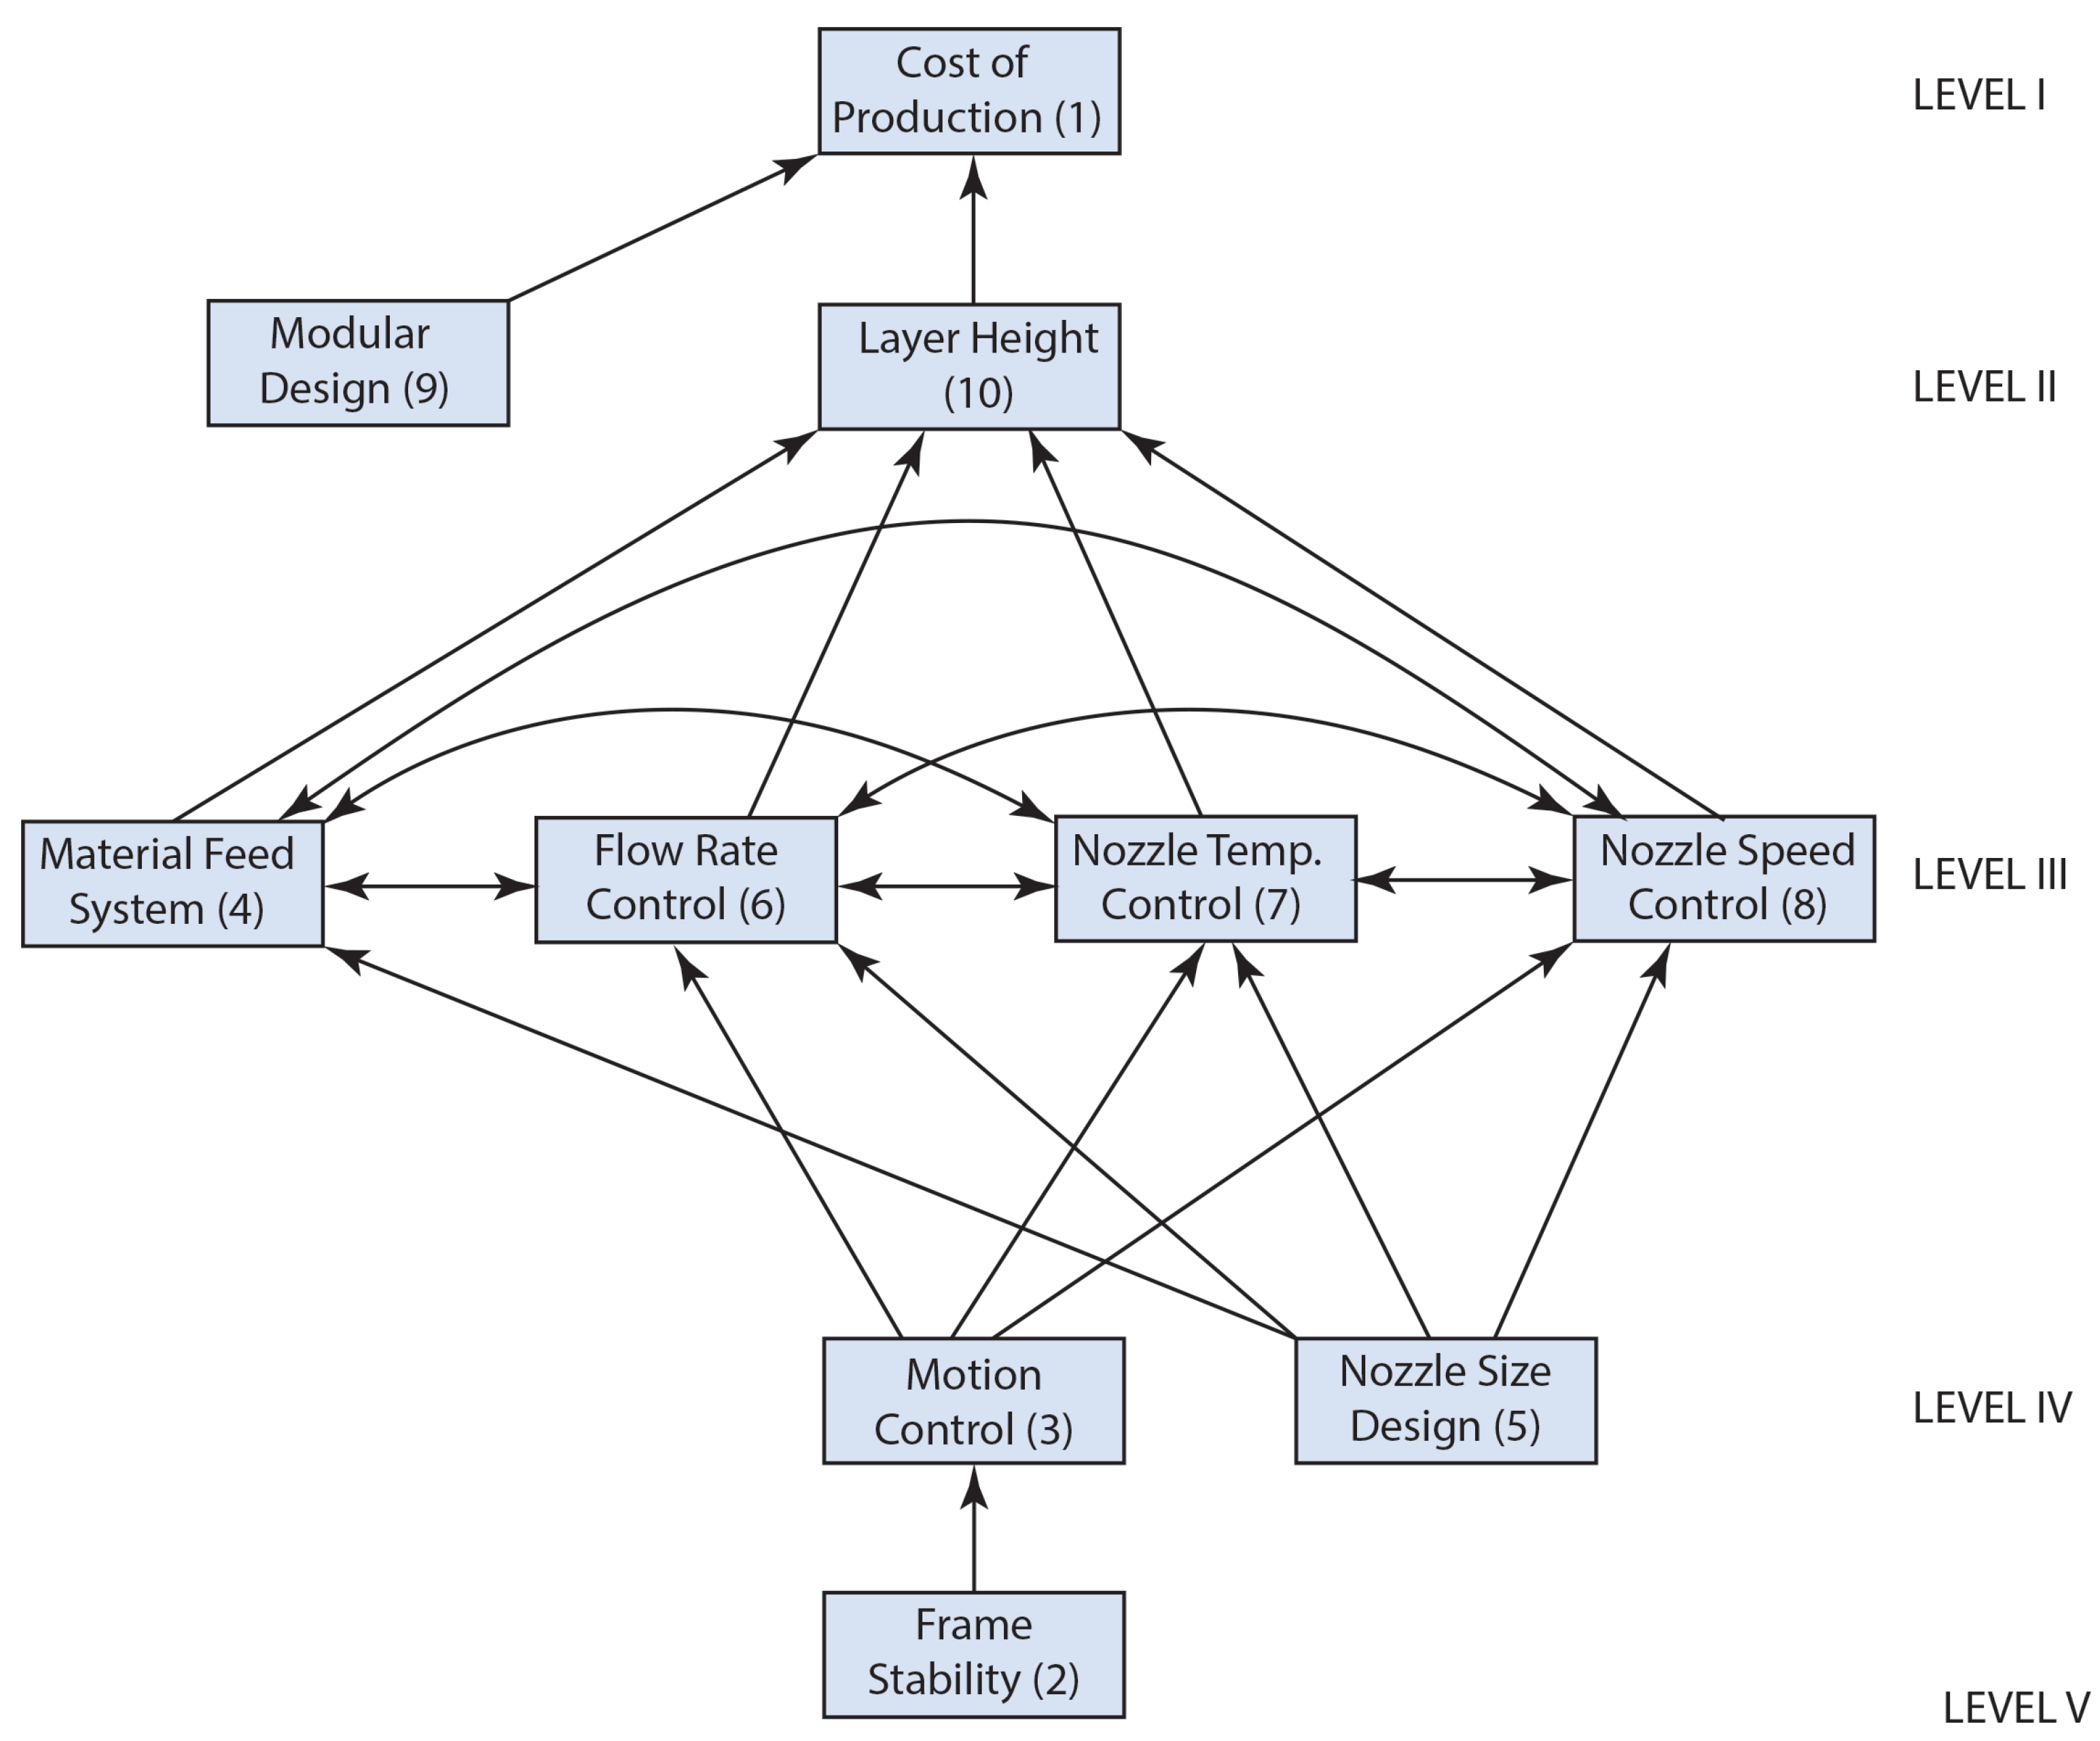
A digraph is a visual representation that illustrates the relationships between various parameters. The relationships among the parameters can now be illustrated graphically by utilizing digraph theory, as shown in Figure 11 [22].
This illustration represents the direct and indirect relationships among the parameters that influence the performance of the 3D printing process. As indicated in Figure 11, Level III exhibits the highest complexity due to its numerous interactions with other levels. The four primary parameters—material feed system (4), flowrate control (6), nozzle temperature control (7), and nozzle speed control—highlighted in Figure 11 are essential for achieving optimal printing performance and should be prioritized in analysis, as the factors at the higher levels are contingent upon these critical parameters.
Figure 11 illustrates that the 3D printing process is organized in a hierarchical structure. Parameters 2 (frame stability), 5 (nozzle size design), and 9 (modular design) are identified as source parameters due to their exclusive outgoing paths. Parameters 10 and 11 depict the linear mapping within the 3D printing process. Notably, parameter 9 (modular design) influences only parameter 1 (cost of production).
The digraph illustrated in Figure 11 serves as a tool for assessing the complexity of the 3D silicone printing process through the cyclomatic complexity measure [23].
Mathematically, the cyclomatic complexity, M is calculated by
M = E N + 2 P
where
E represents the total count of edges within the graph;
N denotes the total number of nodes present in the graph;
P indicates the quantity of connected components in the graph.
In Figure 11, there are 20 edges and 10 nodes, while the number of connected components, represented as P, is 1. Consequently, the cyclomatic complexity, M, of the directed graph illustrated in Figure 11 can be determined to be 12.
M = 20 10 + 2 × 1 = 12
The comprehension of an issue’s complexity is hindered when the cyclomatic complexity number is significantly high. McCabe established a standard for cyclomatic complexity, indicating that the widely accepted minimum threshold is 10 for a problem to be considered complex. In this instance, the computed M value was 12, slightly exceeding the threshold. Consequently, it can be concluded that the 3D printing process illustrated in Figure 11 is complicated, if not complex.
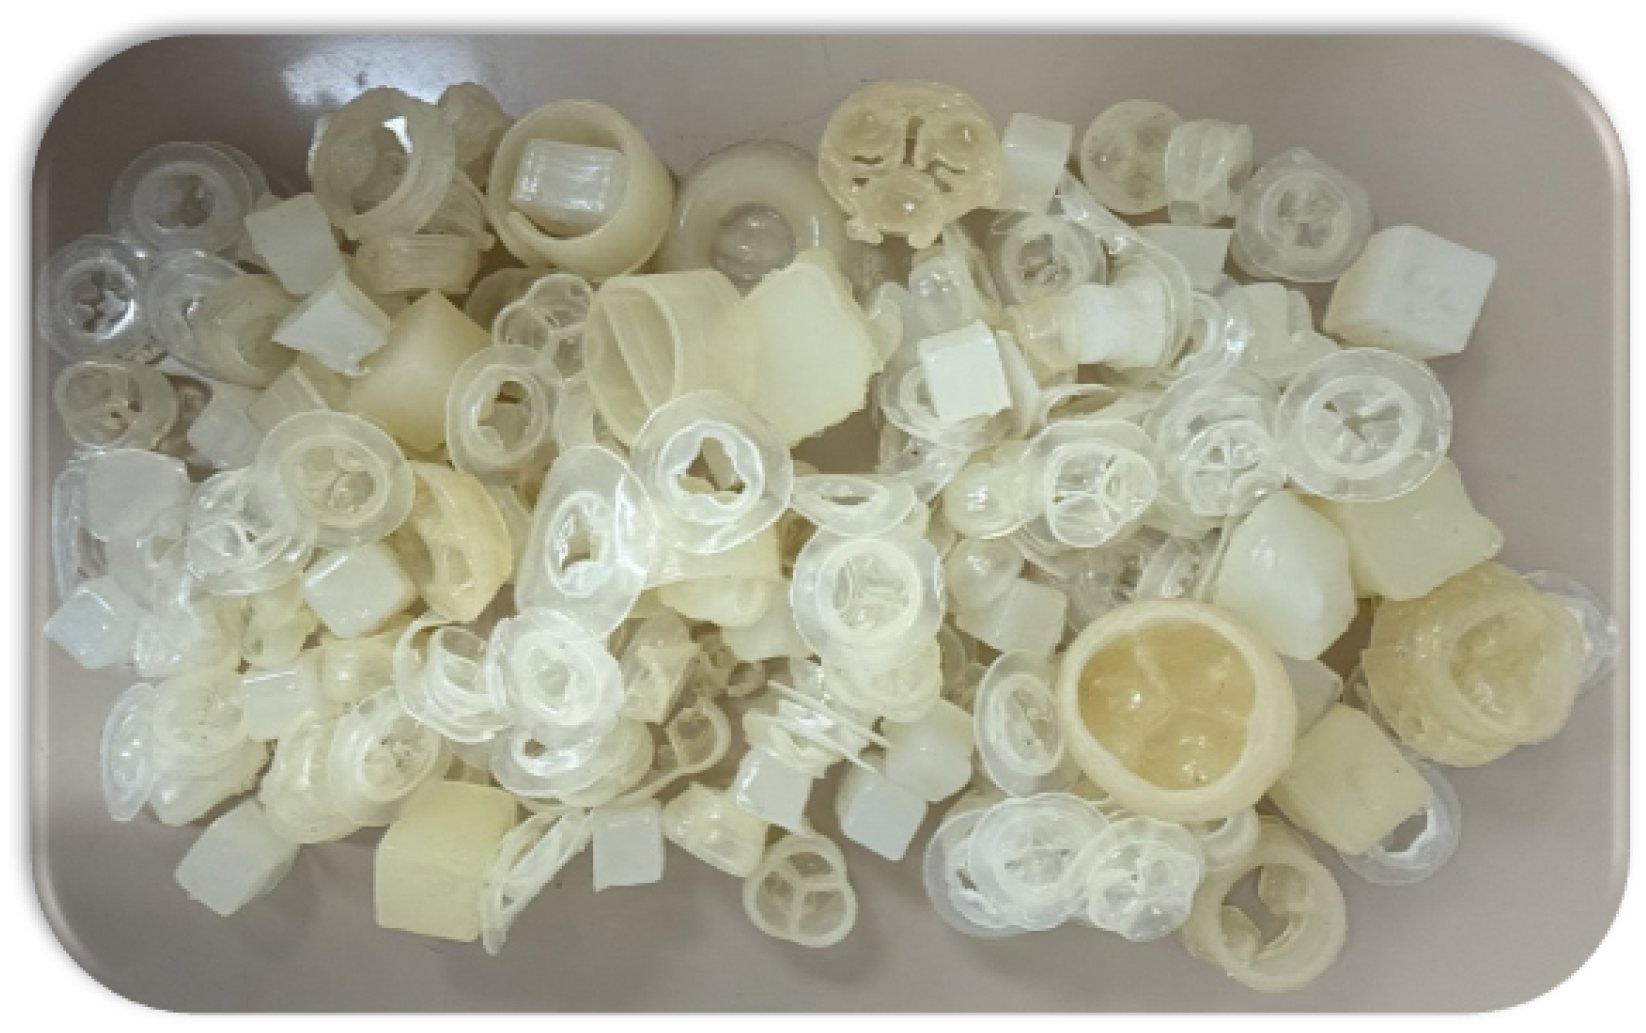
The complexity of this process is further depicted in Figure 12. After conducting numerous trials and assessing hundreds of printed heart valves (see Figure 12) that conformed to the necessary dimensional accuracy, we spent several months optimizing the ten parameters relevant to the 3D printing process. Consequently, we achieved the production of the aortic heart valve with an acceptable quality level.

3.1.2. MICMAC Analysis

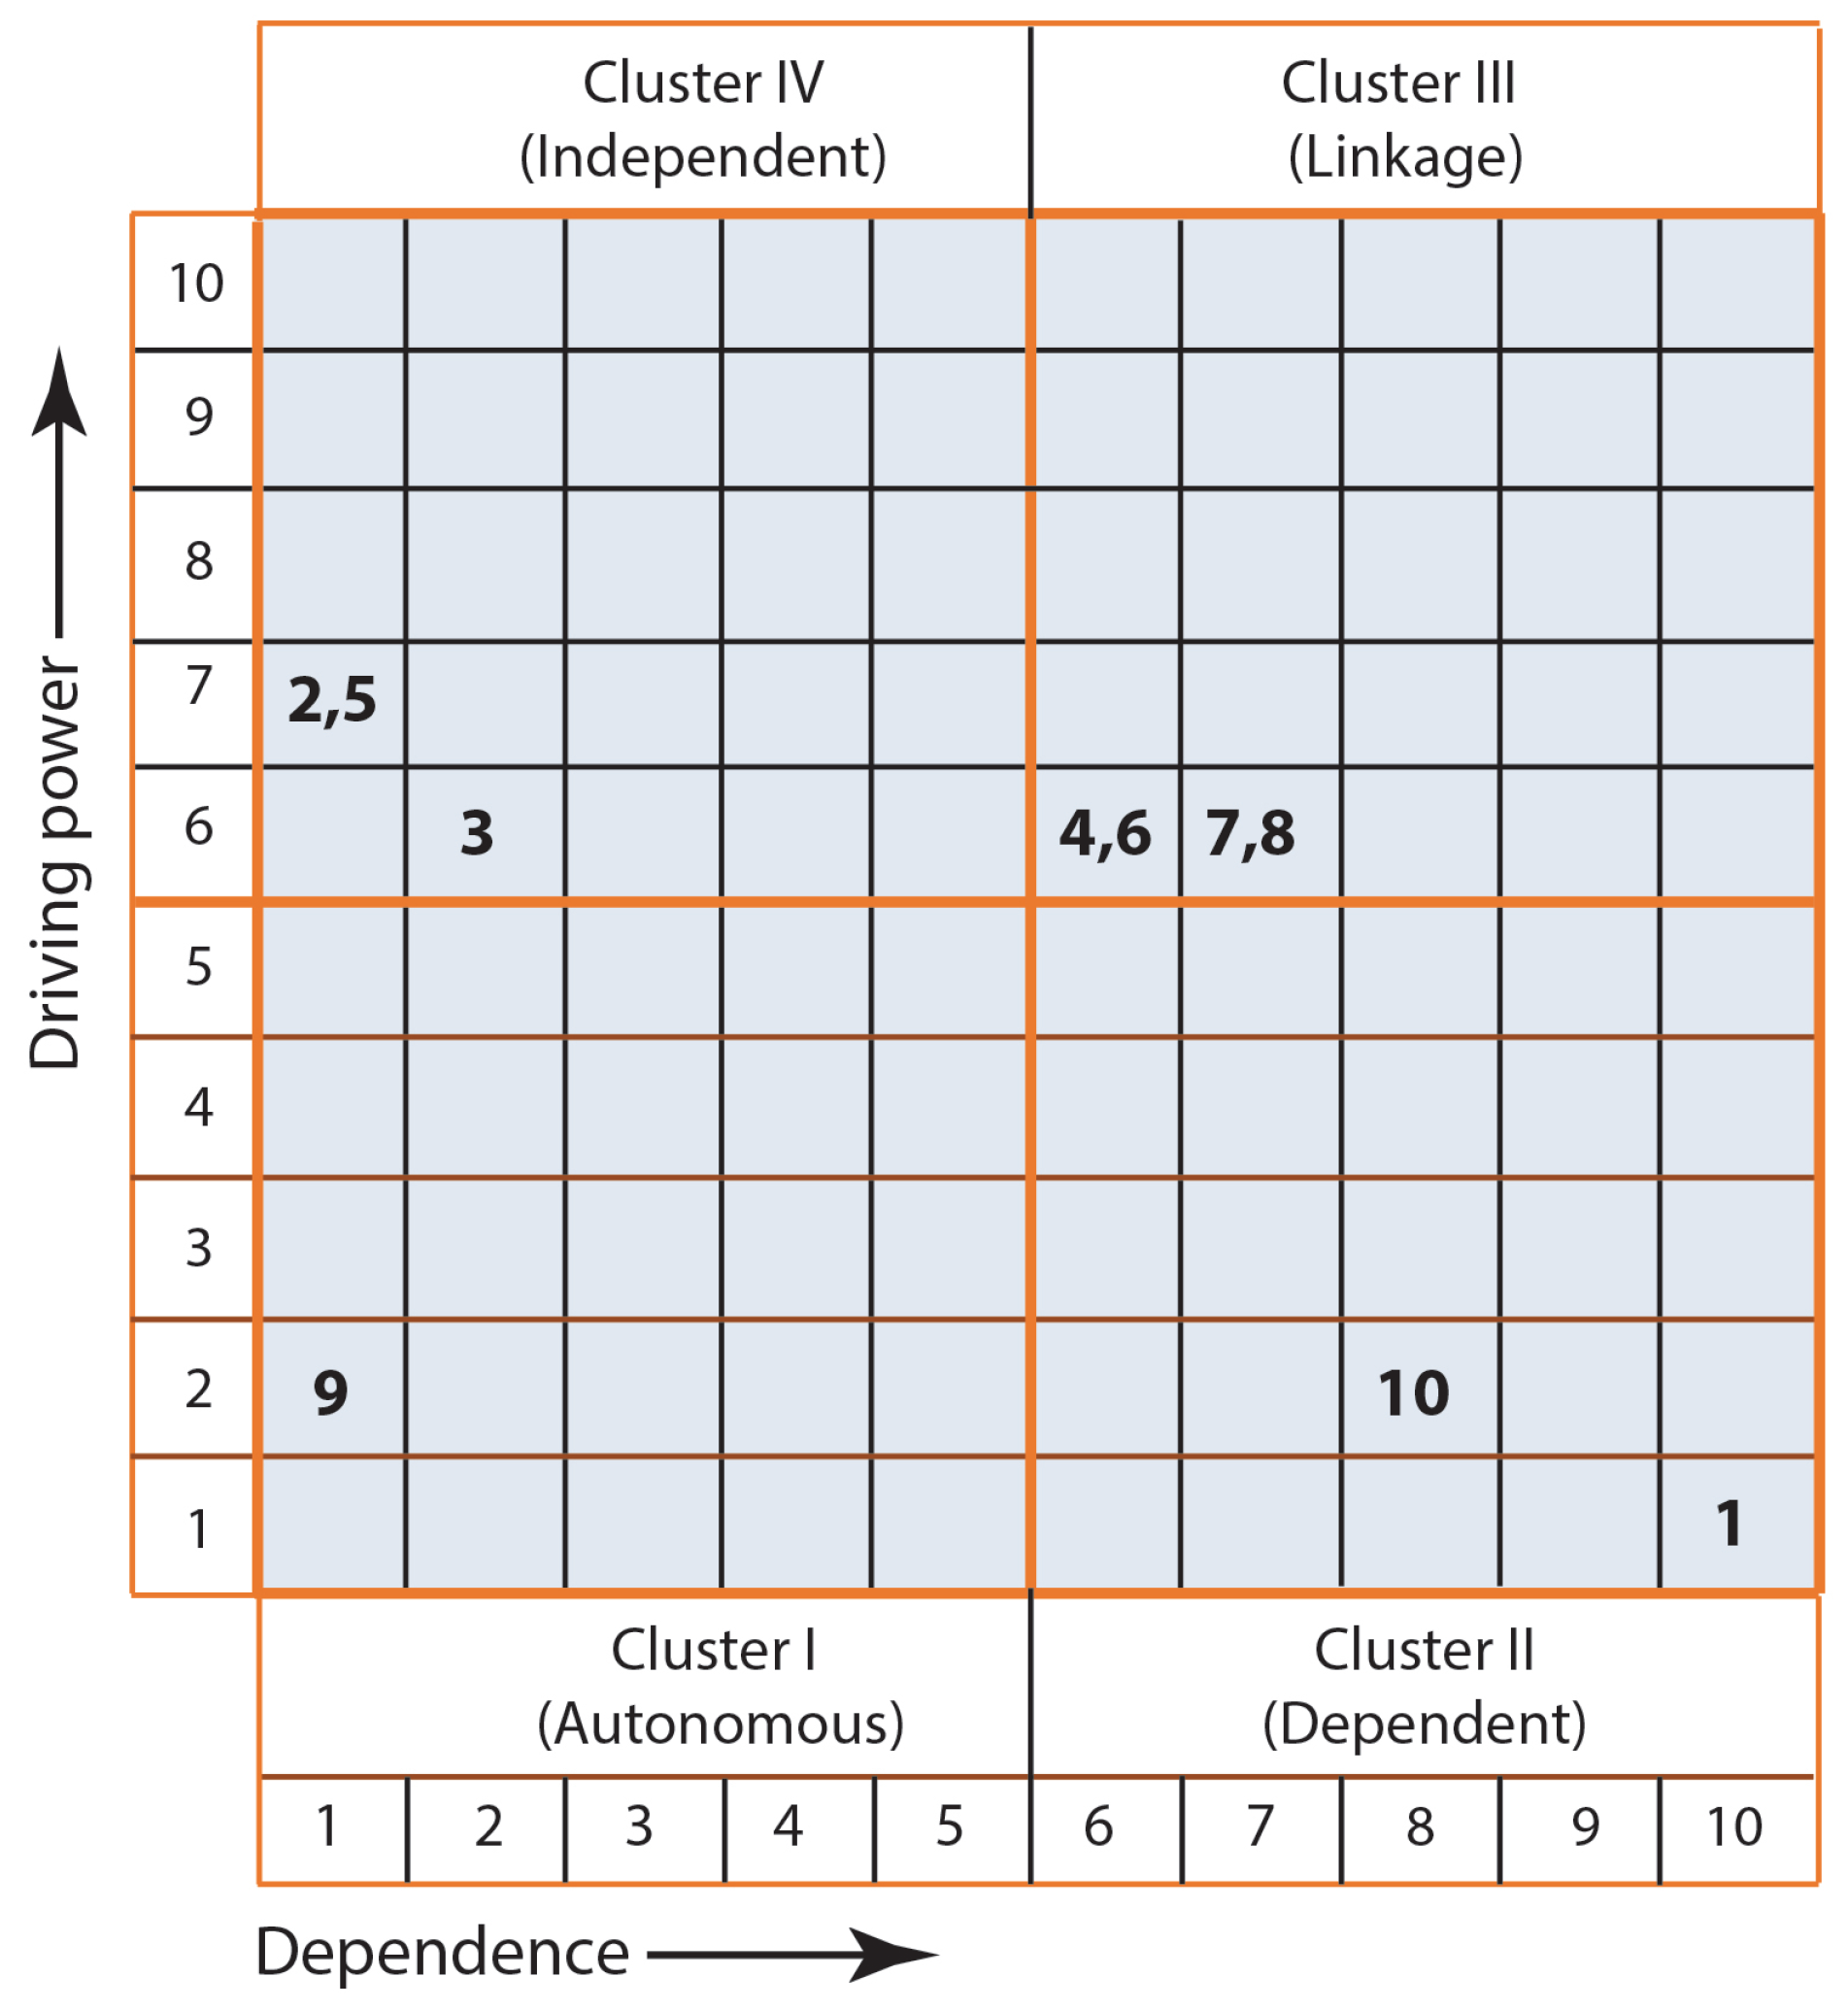
The MICMAC (Matrice d’Impacts Croisés Multiplication Appliquée á un Classement) analysis, introduced by Duperrin and Godet in 1973, serves to evaluate the driving power and interdependence of various parameters influencing the subject matter. As illustrated in Figure 13, the parameters that impact 3D printing performance are categorized into four distinct clusters based on their driving power and dependence: (1) autonomous factors, (2) dependent factors, (3) linkage factors, and (4) independent factors. The driving power and dependence of each of the parameters (factors) are imported from Figure 5.
The MICMAC chart illustrated in Figure 13 offers valuable insights regarding the relative significance and interconnections among the parameters that influence the performance of the 3D printing process. This figure categorizes all performance measures related to the parameters affecting the 3D printing process into four distinct groups.
Cluster I comprises autonomous factors characterized by low driving power and low dependence, resulting in their diminished significance during the 3D printing process. In this context, the only identified autonomous factor is “modular design.” This suggests that modular design is the least critical consideration in the printing process. Furthermore, the modular design factor is isolated from the printing process and does not impact other variables, having only a single connection to production cost, measure (1), which may not significantly affect printing performance.
In Figure 13, Cluster II is made up of dependent parameters that exhibit low driving power and high dependence. This cluster features two parameters, layer height (10) and cost of production (1), as represented in the figure. Although these parameters may not have a direct effect on others, they are still affected by several factors that influence the overall performance of the 3D printing process. Generally, the parameters identified in Cluster II are related to the desired performance targets. As demonstrated in Figure 13, these factors are linearly connected to achieve the specified objective constraints.
In Cluster III, the linkage parameters exhibit both significant driving power and a high degree of dependence. The interrelated nature of these parameters leads to instability; any alteration in one will influence the others and create feedback effects. As illustrated in Figure 13, the four parameters identified—material feed system, flow rate control, nozzle temperature control, and nozzle speed control—are the primary contributors to the complexity of the printing process. As indicated in Figure 12, considerable effort and time were invested in fine-tuning these four parameters to achieve an acceptable level of print quality.
Cluster IV comprises three distinct parameters: frame stability (2), motion control (3), and nozzle size (5). These parameters exhibit significant driving power while demonstrating a weak interdependence. As illustrated in Figure 11, frame stability and nozzle size are positioned at the lower end of the digraph, indicating their strong influence on the 3D printing process. The efficacy of the 3D printing operation is contingent upon the initial decision-making step, which involves selecting an advanced motion control system and the appropriate nozzle size. It is crucial to ensure that the 3D printing apparatus maintains frame stability.
In light of the analysis discussed above, we have efficiently designed and constructed a functional 3D silicone printing machine. The 3D printing machine is specifically tailored to create an aortic heart valve with the use of UV-cured silicone.

3.2. The Effect of Heart Valve Size on Cardiac Performance

3.2.1. Assessment of 3D-Printed Polymeric Heart Valve Performance

The development of the heart valve was founded on the findings from earlier design assessments reported by Etas et al. [11]. These assessments included the formulation of heart valve geometry, ANOVA analysis, and the results of a 6-h UV curing procedure.
Polymeric heart valves represent a potentially more cost-effective option compared to mechanical and bioprosthetic valves. For an extended period, investigations into prosthetic heart valves have concentrated on materials that exhibit excellent durability and biocompatibility, with the thickness of the leaflets being a vital aspect of the design [24].
In this study, two distinct sizes of heart valves, along with two varying flow rates and two different leaflet thicknesses, were analyzed. The experimental findings are presented in Table 4. Table 4 displays the collected data regarding cardiac cycles (RPM). Measurements of pressure were recorded before and after the heart valve, along with flow rate information relevant to each thickness.
In Table 4, the first test displays results that represent the functioning of the human heart: a heart rate of 75.5 RPM and a pressure gradient of 27.75 mmHg (86.5874–58.8349). Although the pressure gradient result is somewhat higher than that of an actual human, this relative value is notably less than the results from other tests. These closely aligned results are attributed to parameters such as a flow rate of 5 L/min and a leaflet thickness of 0.8 mm, which are akin to those of a human heart valve. It is important to highlight that the material used for the heart valve (silicone) under examination does not possess the same material properties as those of a human heart valve. Consequently, it is anticipated that the results will differ slightly, particularly in terms of the measured pressure gradient.
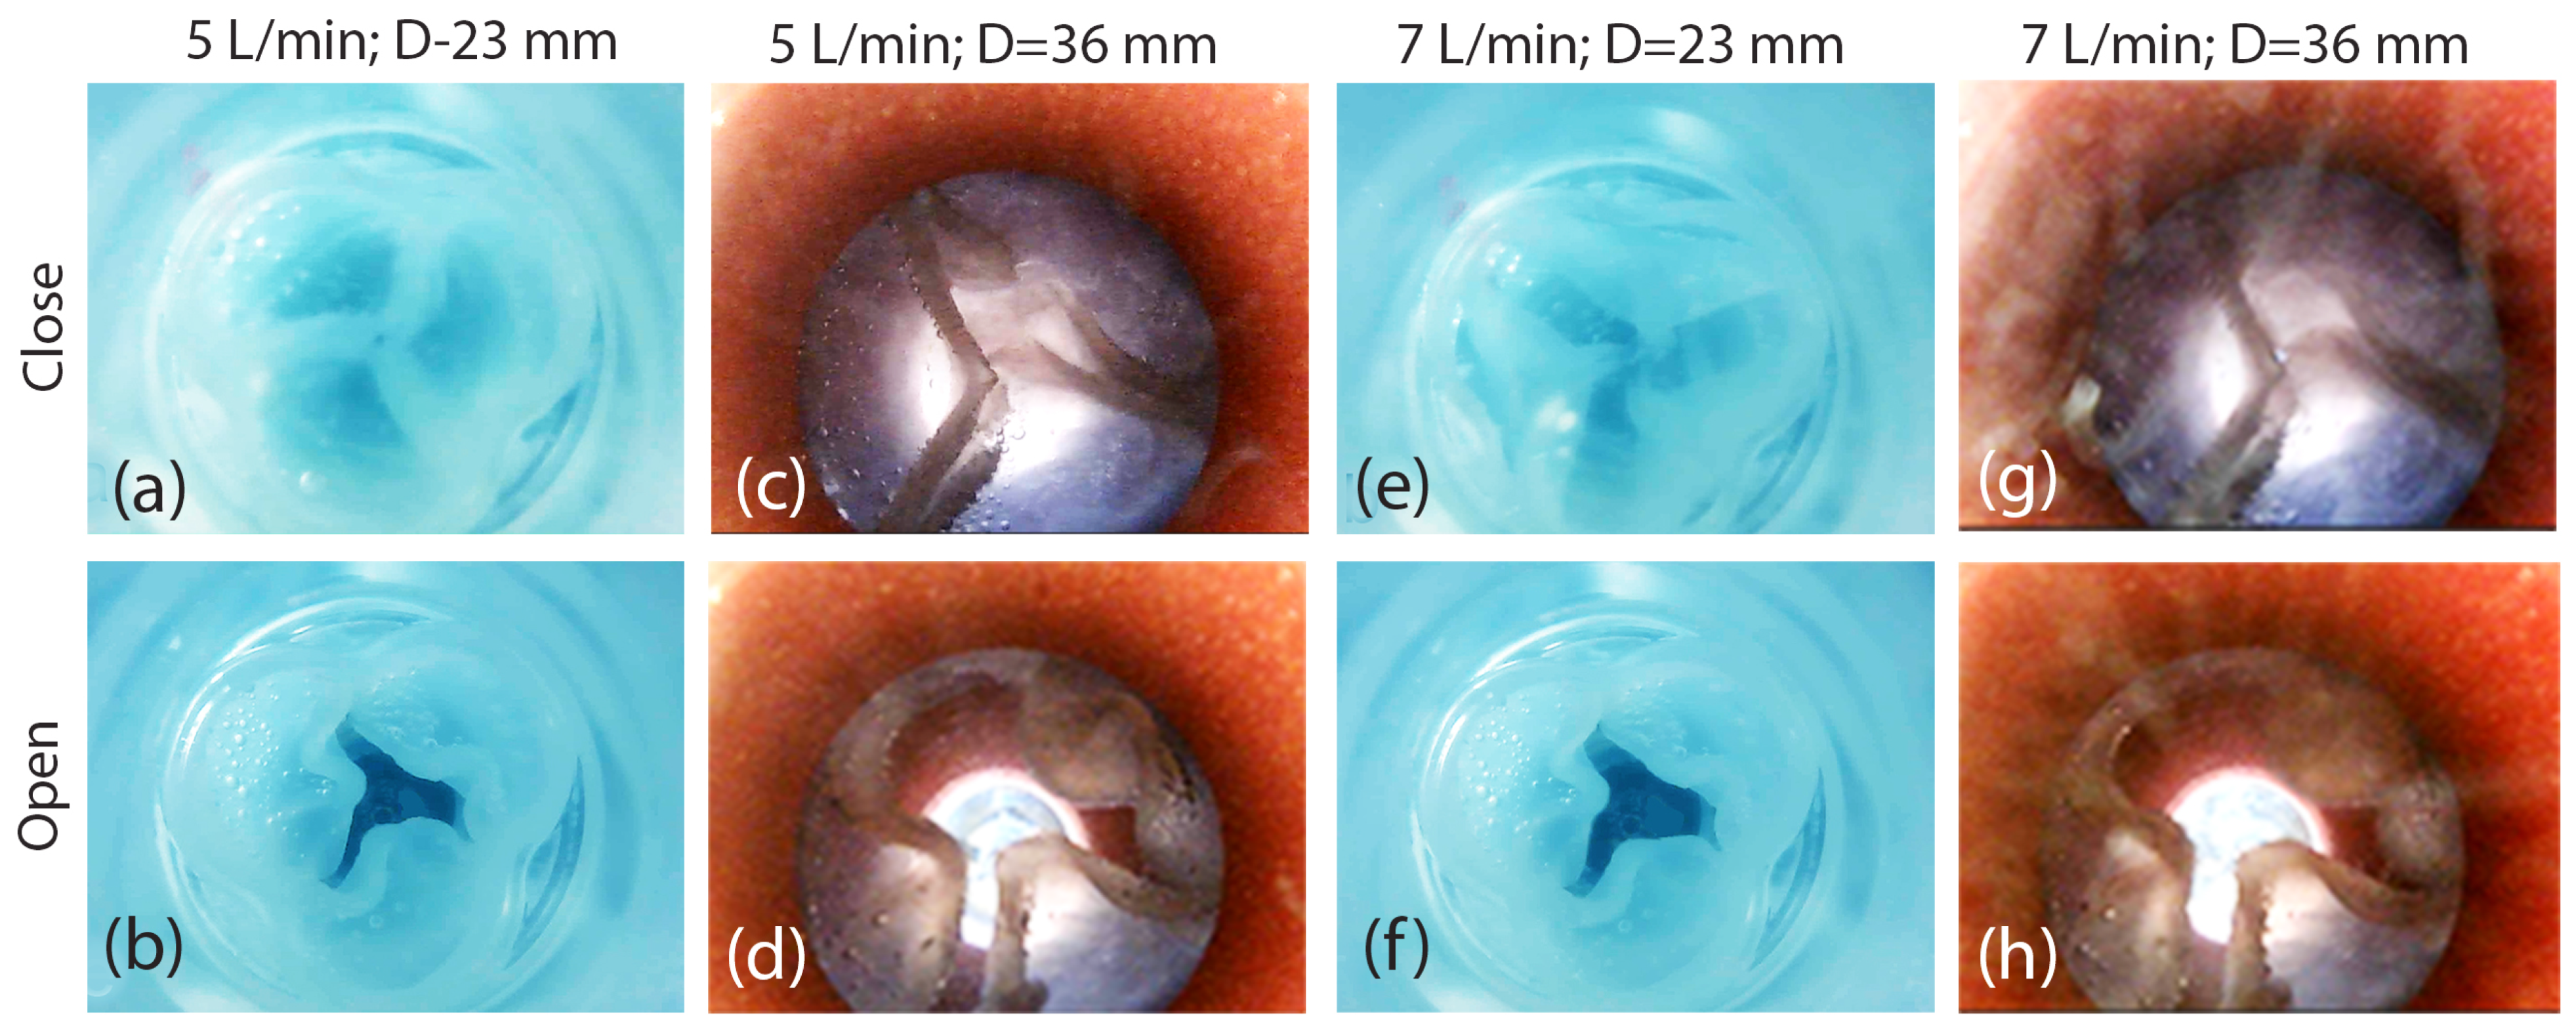
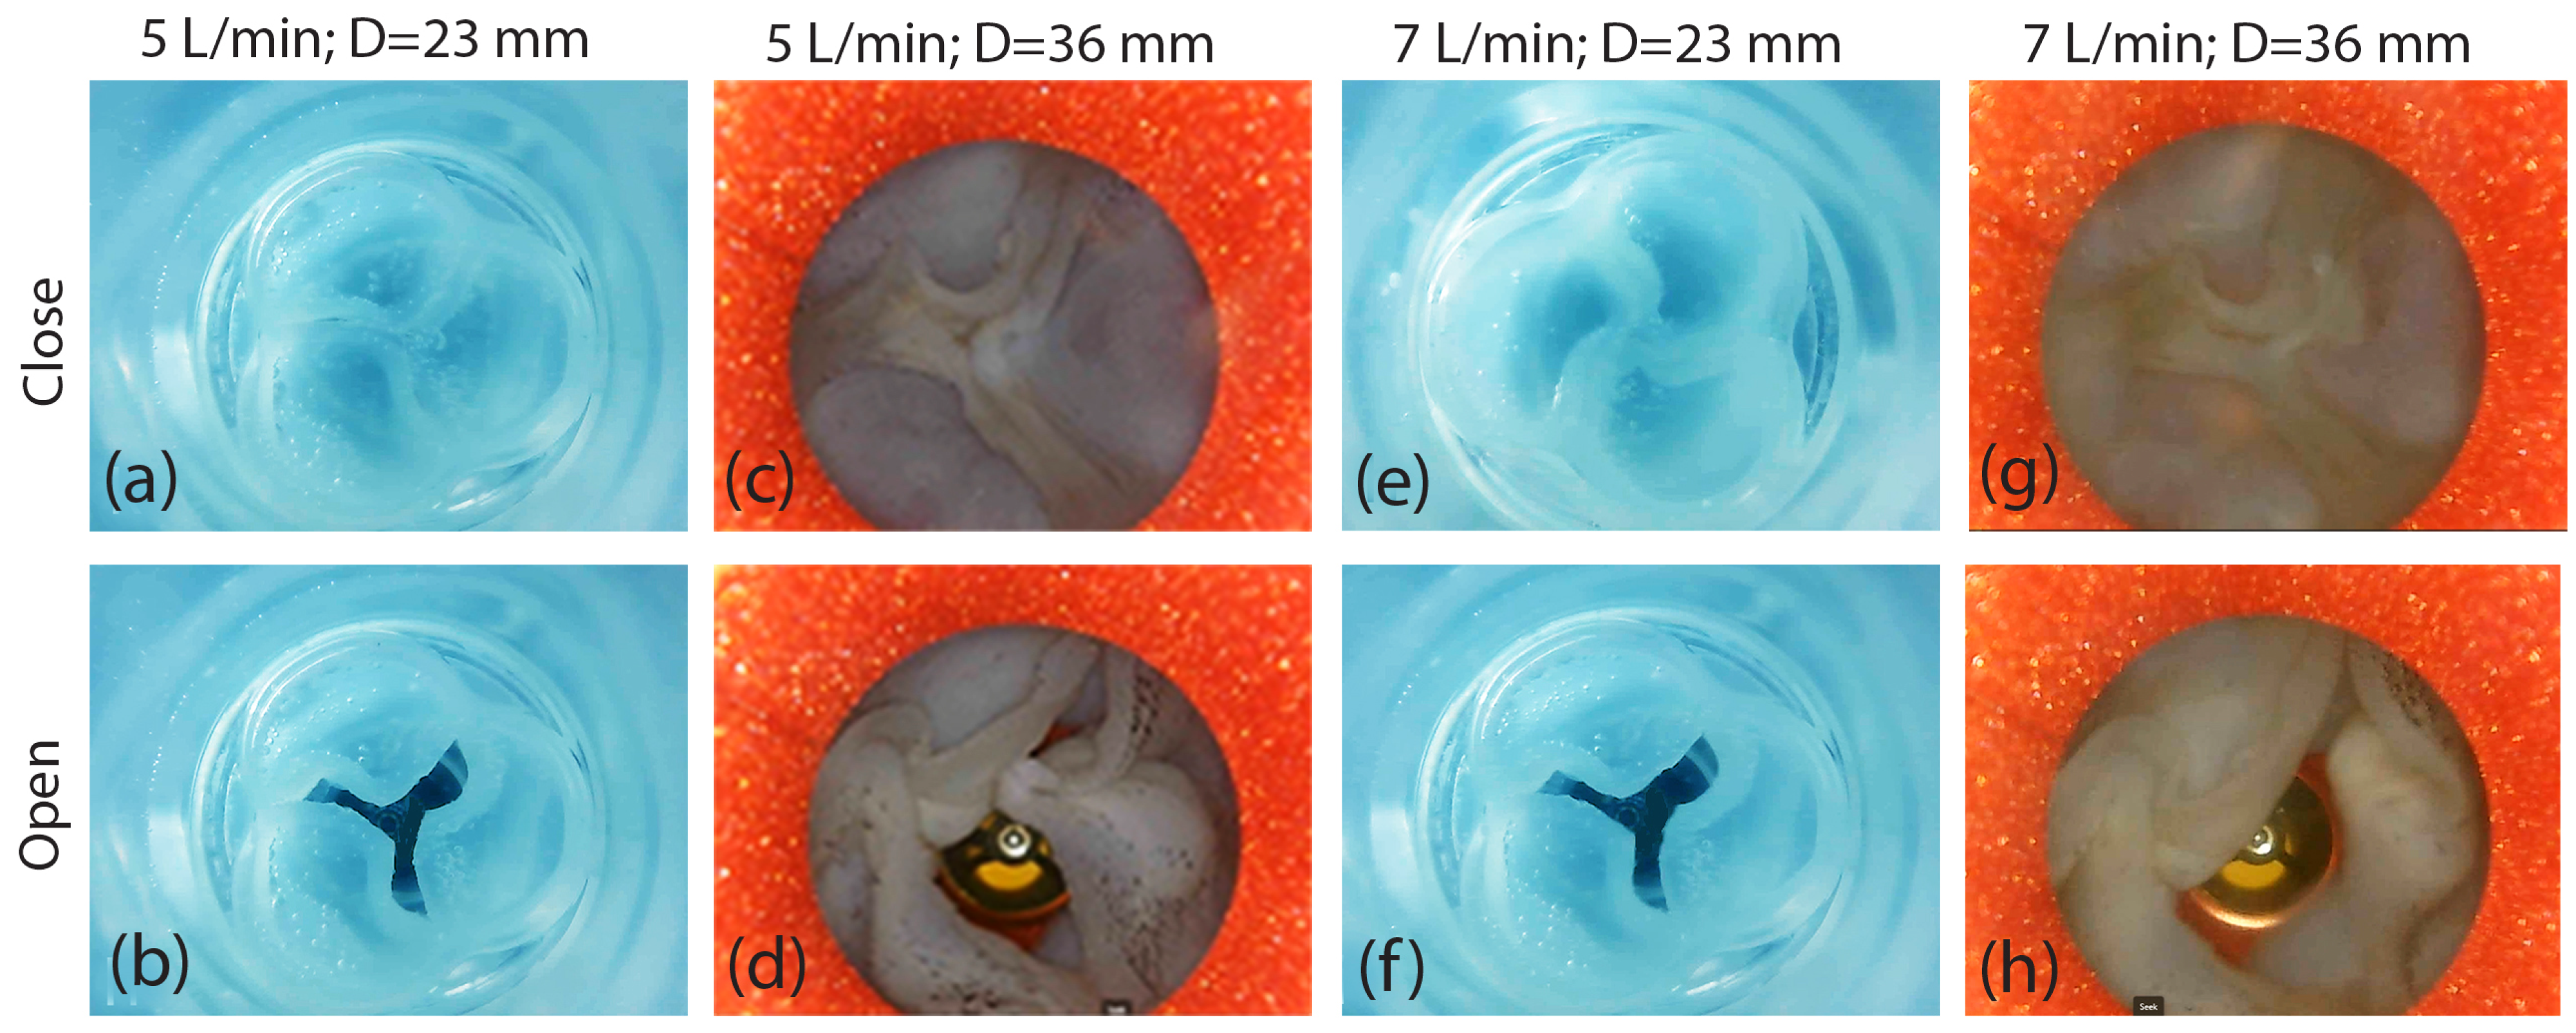
Calcium can accumulate on the leaflets of the heart valves, causing these structures to thicken or stiffen. This buildup may lead to decreased blood flow and can result in a condition referred to as stenosis. Changes in leaflet thickness alter the bending rigidity, which impacts the valve’s functionality. Very low stiffness encourages leaflet flapping, potentially compromising valve performance. On the other hand, excessive stiffness hinders the opening and closing of the valve, leading to increased resistance and reduced flow [27,28]. This situation is clearly illustrated in Figure 15b,f, which shows that thicker leaflets result in a relatively smaller valve opening compared to the thinner leaflets shown in Figure 14b,f, thereby causing a decrease in blood flow. It is crucial to highlight that a small-sized valve 23 mm in diameter successfully closed completely without any leakage (refer to Figure 14a,e and Figure 15a,e) [11]. The heart valve, measuring 23 mm in diameter and featuring leaflet thicknesses of 0.8 mm and 1.6 mm, operated effectively, attaining the target flow rates of 5 L/min and 7 L/min.
The heart valve with a small diameter of 23 mm exhibits a symmetrical opening for both flow rates of 5 L/min and 7 L/min, as well as for the two thicknesses of the valve leaflets. Naturally, the valve opening is larger at the flow rate of 7 L/min.
The heart valve with a larger diameter of 36 mm also exhibits no leakage during its operation (refer to Figure 15c,g). It further displays a similar and symmetrical valve opening with the small leaflet thickness (Figure 14d,h). The same figure shows that an increased flow rate results in a larger valve opening, as anticipated.
The enlargement of the aortic valve, characterized by the presence of thicker leaflets, causes a decrease in valve opening and an asymmetrical pattern of valve opening and closing. This notable finding indicates that a larger aortic valve with thicker leaflets, often due to the thickening and stiffening of these leaflets, can lead to a constricted valve opening (aortic stenosis) and irregularities in the valve’s opening and closing (see Figure 15d,h). These conditions can have a significant effect on cardiac function and overall health [29,30].

3.2.2. Evaluation of Heart Valve Inlet and Outlet Pressures Plots

The experimental findings related to the pressure graphs at both the inlet and outlet of the heart valve, considering various design parameters, are illustrated in Figure 16, Figure 17, Figure 18, Figure 19 and Figure 20. While these plots offer significant insights and information, this section will discuss some of the key findings.
The interval between one heartbeat and the commencement of the subsequent heartbeat is known as the cardiac cycle. This cycle consists of two distinct phases:
  • The period of contraction in the ventricles, termed systole;
  • The period of relaxation in the ventricles, identified as diastole.
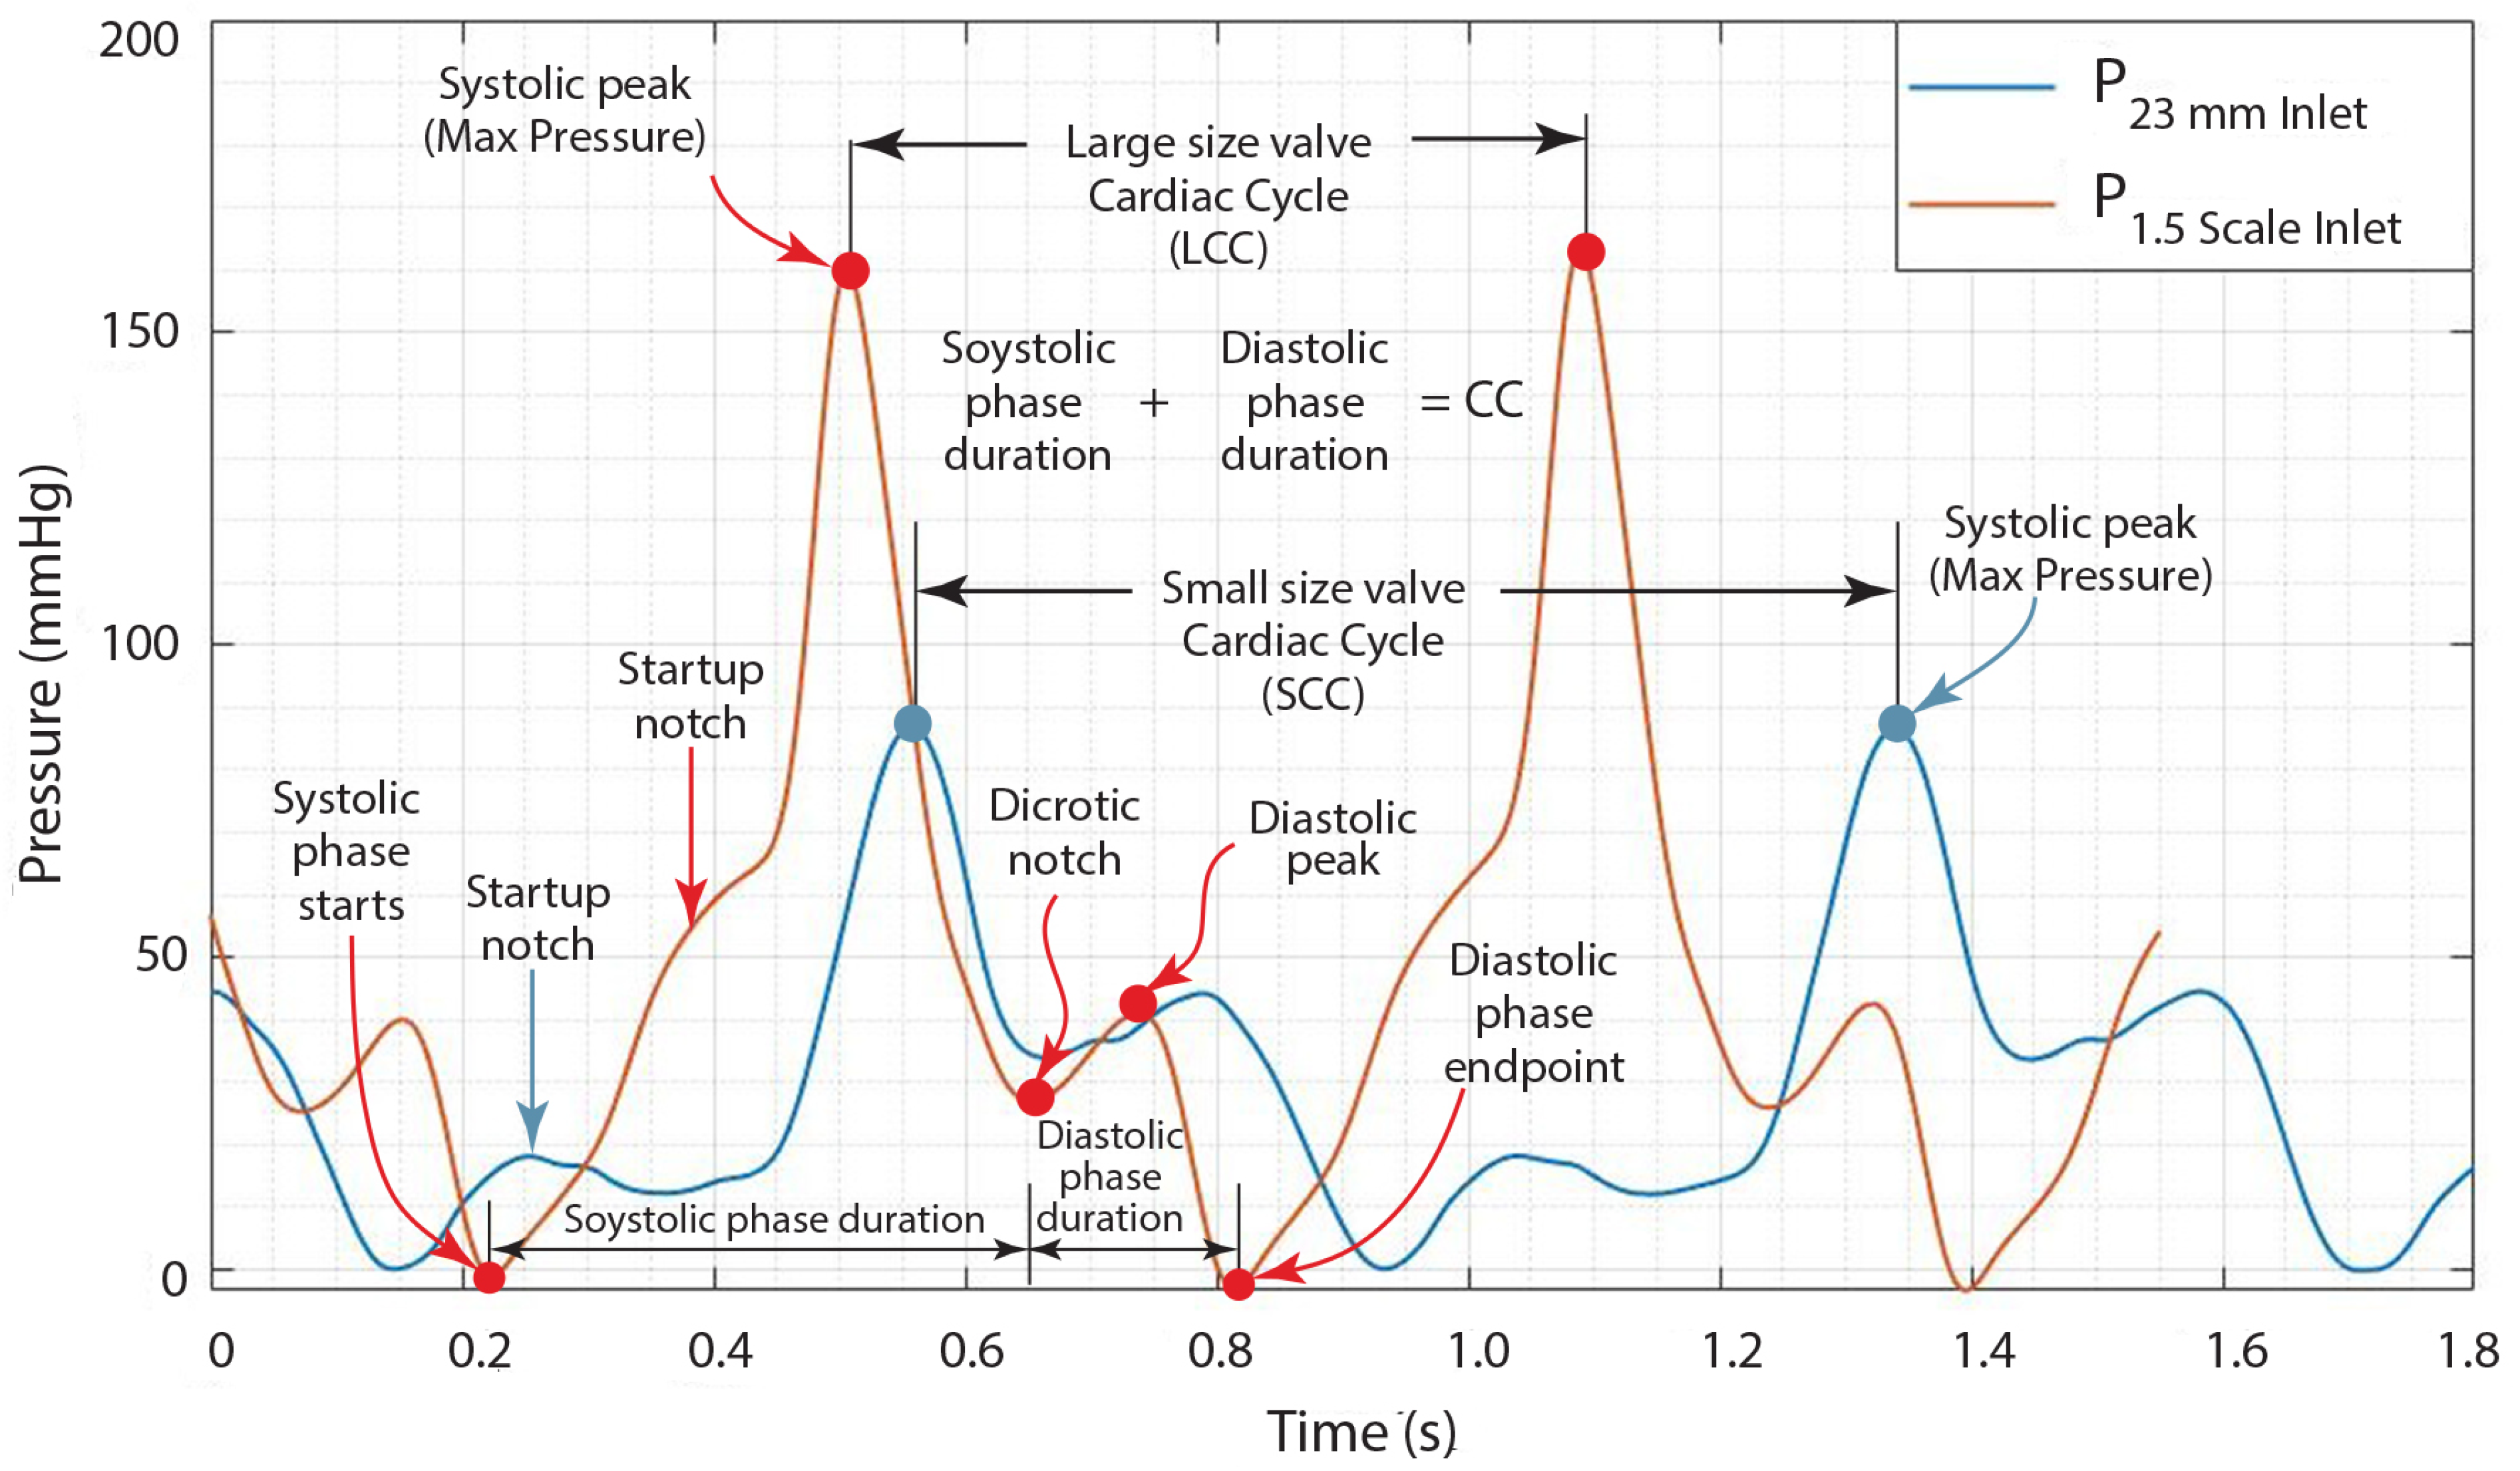
In Figure 16, a comparison is made between the inlet pressure for the 23 mm and 36 mm valve sizes, with the leaflet thickness established at 0.8 mm and a flow rate of 5 L/min. The peak pressure in the arterial system, termed systolic pressure, occurs during the contraction phase of the cardiac cycle, known as systole, as illustrated in Figure 16. Following the end of systole, the ventricles relax, leading to a rapid decline in ventricular pressure. The “dicrotic notch” depicted on the heart valve pressure graph in Figure 16 represents a brief reduction in pressure following systole, which indicates the closure of the aortic valve. The term “diastolic peak” indicates the peak pressure obtained during the cardiac cycle’s relaxation phase. This peak typically takes place soon after the aortic valve closes and before a significant pressure drop, resulting in the lowest level recorded during diastole (the endpoint of the diastolic phase).
A phenomenon known as the “startup notch” is noted right after the initiation of systolic pressure at the 23 mm valve inlet. This event can be linked to the motor consuming a significant amount of current during startup, leading to a minor amplitude notch. Following this, the graph becomes stable as the systolic pressure increases until it attains its maximum. As illustrated in the figure, this startup notch is only marginally perceptible for the 36 mm valve.
It is evident from Figure 16 that a larger valve size results in a shorter cardiac cycle, indicating an increased heart rate; the heart beats more quickly as it completes each cycle at a faster pace, reaching its peak. Figure 16 also indicates that a 1.5 times enlargement (50% increase in size) of the heart valve causes an almost 100% increase in maximum inlet pressure (systolic peak). This implies that the pressure in the arteries is elevated above normal during heartbeats, a risk factor for heart disease and strokes, even though the diastolic value (lower pressure number) remains healthy.
In Figure 17, the outlet pressure for the 23 mm and 36 mm valve sizes is compared, with the leaflet thickness set at 0.8 mm and a flow rate of 5 L/min. While increasing the size of the valve leads to a decrease in the cardiac cycle duration and almost doubles the peak pressure, the startup notch located at the valve inlet (as illustrated in Figure 16) amplifies the notch observed at the valve outlet (as shown in Figure 17). This occurrence is attributed to the significant resistance experienced when attempting to open the valve at the inlet, as opposed to the considerably reduced resistance at the outlet, which facilitates a larger notch amplitude.
The outlet pressure graphs for the heart valve depicted in Figure 17 exhibit a trend that is comparable to that of the inlet pressure, albeit at a lower pressure level. Our analysis indicated that the pressure drop from inlet to outlet for the small-sized heart valve is 32%, and for the larger-sized heart valve, it is 28%. The significant reduction in pressure observed at the outlet of the heart valve can be attributed to the characteristics of the UV-cured silicone material. In a healthy heart valve, the typical pressure drop at the outlet is usually minimal, around ten millimeters of mercury (mmHg) [31]. The average pressure gradients that exceeded 10 mmHg were attained to simulate aortic stenosis [31].
This study suggests that the observed pressure drop is not linked to severe aortic stenosis, which is characterized by the constriction of the valve. Instead, this phenomenon is related to the heart valve material (UV-cured silicone) utilized in this investigation. However, it is important to emphasize that the characteristics of the heart valve material employed in this research do not precisely replicate those of a natural heart valve. Additional factors that could contribute to a pressure drop encompass flow rate and the rigidity of the leaflets.
It is crucial to note that Figure 19 and Figure 20 illustrate that an increase in the thickness of the leaflet leads to a decrease in the energy generated during the motor’s initial startup, which subsequently reduces the notch effect. The peak notch pressure at the valve inlet for a flow rate of 5 L/min and a leaflet thickness of 0.8 mm, as shown in Figure 16, is approximately 18 mmHg. Conversely, the highest notch pressure for the inlet valve falls below 10 mmHg when the leaflet thickness increases to 1.6 mm, as demonstrated in Figure 19a A similar impact of leaflet thickness on the peak initial notch pressure amplitude can be seen in Figure 18a and Figure 20a. When the flow rate is set at 7 L/min, the maximum inlet notch pressure reduces from 28 mmHg, as depicted in Figure 18a, to approximately 12 mmHg, as shown in Figure 20a.

4. Conclusions

The notable limitations linked to current mechanical and biological heart valve replacements highlight the need for alternative solutions. This study concentrated on the design, development, and evaluation of a 3D printer capable of utilizing UV-cured silicone for the production of aortic heart valves. To analyze the relationships among the various parameters recognized in the 3D printing process, the House of Quality (HOQ) and Interpretive Structural Modeling (ISM) methodologies were employed. Four design parameters have been identified that contribute to the complexity of the printing process: the material feed system, flow rate control, nozzle temperature control, and nozzle speed control. Substantial effort and time were dedicated to optimizing these four parameters to attain a satisfactory level of print quality. Based on the analysis detailed in this paper, a functional 3D silicone printing machine was engineered and assembled, specifically intended to fabricate an aortic heart valve from UV-cured silicone.
Two distinct sizes of aortic heart valves, specifically 23 mm and 36 mm, were produced utilizing UV-cured silicone, with both sizes featuring an identical leaflet thickness of 0.8 mm and 1.6 mm. The evaluation of silicone-printed heart valves, differing in size and leaflet thickness, was conducted at two flow rates, and the results were compared to assess the influence of heart valve size and other design parameters on cardiac performance.
The following is a summary of the key findings and insights derived from this research.
  • The small-sized valve successfully closed completely without any leakage.
  • The heart valve with a small diameter of 23 mm and leaflet thicknesses of 0.8 mm and 1.6 mm functioned effectively, achieving the desired flow rates of 5 L/min and 7 L/min.
  • The heart valve with a small diameter of 23 mm exhibited a symmetrical opening for both flow rates of 5 L/min and 7 L/min, as well as for the two different leaflet thicknesses. Naturally, the valve opening was larger at the flow rate of 7 L/min.
  • An increase in valve size leads to a reduction in the duration of the cardiac cycle, signifying a higher heart rate; the heart accelerates its beats as it finishes each cycle more swiftly, achieving its maximum rate.
  • A 1.5 times enlargement (a 50% increase in size) of the heart valve results in an almost 100% increase in maximum pressure (systolic peak). This indicates that the pressure in the arteries rises above normal levels during heartbeats, which is a risk factor for heart disease and strokes.
  • The heart valve with a diameter measuring 36 mm demonstrated no leakage throughout its operation, and it exhibited symmetrical and similar characteristics at the reduced thickness of the leaflets. A higher flow rate led to a wider valve opening, as expected.
  • The enlargement of the aortic valve, characterized by the presence of thicker leaflets, commonly results from the thickening and stiffening of these leaflets, causing a decrease in valve opening and an asymmetrical pattern of valve opening and closing.

Concluding Remarks on Influencing Performance

The quality of the heart valve print is primarily affected by layer height, with print speed and nozzle temperature following closely behind. It was noted that optimal print quality was attained with a low print speed, elevated nozzle temperature, and reduced layer height, utilizing a silicone flow rate of 152 steps per millimeter. An increase in nozzle temperature resulted in improved quality of the heart valve print. Throughout all experiments, a nozzle size of 0.4 mm was employed, as it demonstrated the most effective performance. The optimal parameters, including print speed, layer height, and nozzle temperature, are influenced by various factors such as geometry size, print duration, and the complexity of the layer being produced. Through extensive experimentation, we have determined that the optimum parameters remain constant (layer height: 0.2 mm, nozzle temperature: 25 C, print speed: 20 mm/s) irrespective of geometry size for the initial layer. The parameters for the subsequent layers changed according to the geometry size, print duration, and the complexity of the layer being produced. The range of parameter values was as follows: layer height: 0.05–0.10 mm, nozzle temperature: 105 115   e x t C , and print speed: 20–30 mm/s. The size and complexity of geometric shapes play a crucial role in determining the best parameters. For instance, the process of printing a 36 mm heart valve introduced different challenges to that of a 23 mm heart valve, which requires parameter adjustments based on the geometry’s complexity and size. Consequently, due to these variations, the ideal parameters for subsequent layers are presented as ranges rather than fixed values.
As previously stated, the process of 3D printing an aortic heart valve is complex, and it can take several weeks to fine-tune the appropriate parameters necessary for the manufacturing of the newly redesigned valve that achieves an acceptable quality level.

Author Contributions

Conceptualization, paper writing, and review, A.E.; experimentation, data collection, and analysis, E.F.-T.; design of the experimental setup, O.C. All authors have read and agreed to the published version of the manuscript.

Funding

This research received no external funding.

Institutional Review Board Statement

Not applicable.

Informed Consent Statement

Not applicable.

Data Availability Statement

The data will be made available by the corresponding author on request.

Acknowledgments

The authors express their gratitude to Utku Gulbulak for his valuable insights.

Conflicts of Interest

The authors declare no conflicts of interest.

Appendix A

The following are the research findings that will inform the determination of the directional relationships between parameters.
  • The nozzle is the last element of the material feeding system; the stability of the frame in a 3D printing machine plays a crucial role in determining the achievable layer height. A frame that lacks stability may induce vibrations during the printing process, leading to irregular layer deposition and ultimately resulting in poor print quality.
  • The motion control system’s performance, and consequently its precision, can be affected by the stability and rigidity of the 3D printer’s frame and its components.
  • The motion control of a 3D printer, particularly along the X, Y, and Z axes, has a direct influence on the speed at which the nozzle deposits material, thereby affecting both the overall printing speed and the quality of the finished product.
  • The motion control of a 3D printer, specifically along the Z axis, directly affects the layer height. The Z axis controls the vertical movement of the printhead, determining how thickly each layer of material is deposited, essentially defining the layer height.
  • A larger nozzle diameter on a 3D printer directly impacts the material feed system, necessitating an increased material flow rate for extrusion. In contrast, a smaller nozzle demands a reduced flow rate.
  • In a 3D printer, the regulation of flow rate is crucial as it determines the volume of material extruded from the nozzle. This is achieved by adjusting the speed at which the filament is fed through the extruder, thereby influencing the “thickness” of the material being deposited.
  • The material feed system plays a crucial role in regulating the temperature of the 3D printer nozzle. The speed at which material is fed through the nozzle has a direct influence on the amount of heat dissipated from the heating element.
  • The material feed system plays a crucial role in regulating the nozzle speed of a 3D printer. The speed at which material is fed into the extruder directly determines the amount of material that can be extruded through the nozzle. This, in turn, affects the required printing speed to ensure consistent material deposition.
  • The material feed system in a 3D printer significantly influences the layer height, as it regulates the quantity of material extruded with each motion of the print head. This regulation directly affects the thickness of each layer that is deposited throughout the printing process.
  • The size of a 3D printer’s nozzle significantly influences its flow rate. A larger nozzle allows for an increased flow rate, thereby enabling faster printing speeds by extruding a larger volume of material with each pass. In contrast, a smaller nozzle results in a reduced flow rate, which improves the detail and precision of the printed items.
  • Additionally, the size of the nozzle affects the nozzle temperature required for optimal operation. Generally, a larger nozzle demands a slightly higher temperature to effectively melt and extrude the material. Furthermore, the nozzle size is a critical factor in determining printing speed. While a larger nozzle can lead to quicker print times, this benefit may come at the expense of print quality and detail. Moreover, the size of the nozzle directly influences the layer height achievable during printing; a larger nozzle permits the use of thicker layers, whereas a smaller nozzle allows for the creation of thinner layers.
  • The regulation of nozzle temperature is essential for managing the flow rate in a 3D printer. This is attributed to the direct impact that temperature has on the viscosity of the printing material. Specifically, an elevation in temperature produces a more fluid filament, which can improve the flow rate. In contrast, a reduction in temperature results in a thicker, less fluid filament, consequently diminishing the flow rate.
  • The regulation of flow rate has a direct influence on the rate at which material is extruded from the nozzle of a 3D printer, effectively determining the “deposition speed” of the material. This, in turn, affects the overall printing speed while ensuring the quality of the print is preserved. Conversely, the control of nozzle speed has a significant impact on the flow rate of the 3D printer, as the velocity at which the printing material is advanced through the nozzle dictates the volume of material extruded per unit of time. Consequently, an increase in nozzle speed leads to a corresponding rise in flow rate, and the reverse is also true.
  • The flow rate control on a 3D printer has a direct impact on the layer height, as it dictates the volume of material extruded for each unit of movement.
  • Increased printing speeds necessitate elevated temperatures to enhance heat transfer, as the printing material will have a reduced duration in the melt chamber.
  • The temperature of the nozzle on a 3D printer has a direct effect on the layer height, as it regulates the melting and flow of the material, thereby affecting the volume of material deposited in each layer.

References

  1. Chandrasekhar, J.; Dangas, G.; Mehran, R. Valvular Heart Disease in Women, Differential Remodeling, and Response to New Therapies. Curr. Treat. Options Cardiovasc. Med. 2017, 19, 74. [Google Scholar] [CrossRef]
  2. Pibarot, P.; Dumesnil, J.G. Prosthetic Heart Valves Selection of the Optimal Prosthesis and Long-Term Management. Circulation 2009, 119, 1034–1048. [Google Scholar] [CrossRef]
  3. Mirsky, N.A.; Ehlen, Q.T.; Greenfield, J.A.; Antonietti, M.; Slavin, B.V.; Nayak, V.V.; Pelaez, D.; Tse, D.T.; Witek, L.; Daunert, S. Three-Dimensional Bioprinting: A comprehensive review for applications in tissue engineering and regenerative medicine. Bioengineering 2024, 11, 777. [Google Scholar] [CrossRef] [PubMed]
  4. Shai, S.-E.; Lai, Y.-L.; Hung, Y.-W.; Hsieh, C.-W.; Su, K.-C.; Wang, C.-H.; Chao, T.-H.; Chiu, Y.-T.; Wu, C.-C.; Hung, S.-C. Long-term survival and regeneration following transplantation of 3d-printed biodegradable pcl tracheal grafts in large-scale porcine models. Bioengineering 2024, 11, 832. [Google Scholar] [CrossRef] [PubMed]
  5. Fergal, B.; Coulter, F.B.; Schaffner, M.; Faber, J.A.; Rafsanjani, A.; Smith, R.; Appa, H.; Zilla, P.; Bezuidenhout, D.; Studart, A.R. Bioinspired heart valve prosthesis made by silicone additive manufacturing. Matter 2019, 1, 266–279. [Google Scholar] [CrossRef]
  6. Brownell, L. Size a Concern When Replacing Heart Valves. The Harvard Gazete, Wyss Institute Communications. Available online: https://news.harvard.edu/gazette/story/2018/12/cardiologists-can-reduce-leaky-heart-valves-with-3-d-printing/ (accessed on 4 March 2025).
  7. Eleid, M. Interventional management of paravalvular leak. Heart 2018, 104, 1797–1802. [Google Scholar] [CrossRef]
  8. Dalby, M.; Panoulas, V. Transcatheter Aortic Valve Implantation: Complications. UpToDae. Available online: https://www.uptodate.com/contents/transcatheter-aortic-valve-implantation-complications (accessed on 24 May 2025).
  9. Tretter, J.T.; Burbano-Vera, N.H.; Najm, H.K. Multi-modality imaging evaluation and pre-surgical planning for aortic valve-sparing operations in patients with aortic root aneurysm. Ann. Cardiothorac. Surg. 2023, 12, 295–317. [Google Scholar] [CrossRef]
  10. Myerson, S.G. CMR in Evaluating Valvular Heart Disease: Diagnosis, Severity, and Outcomes. JACC 2021, 14, 2020–2032. [Google Scholar]
  11. Ertas, A.; Farley-Talamantes, E.; Cuvalci, O.; Gecgel, O. 3D-Printing of Artificial Aortic Heart Valve Using UV-Cured Silicone: Design and Performance Analysis. Bioengineering 2025, 12, 94. [Google Scholar] [CrossRef]
  12. Amindari, A.; Kirkkopru, K.; Saltik, L.; Sunbuloglu, E. Effect of non-linear leaflet material properties on aortic valve dynamics—A coupled fluid-structure approach. Eng. Solid Mech. 2021, 9, 123–136. [Google Scholar] [CrossRef]
  13. Alavi, H.; Ruiz, V.; Krasieva, T.; Botvinick, E.L.; Kheradvar, A. Characterizing the collagen fiber orientation in pericardial leaflets under mechanical loading conditions. Ann. Biomed. Eng. 2013, 41, 547–561. [Google Scholar] [CrossRef]
  14. Stella, J.A.; Liao, J.; Sacks, M.S. Time-dependent biaxial mechanical behavior of the aortic heart valve leaflet. J. Biomech 2007, 40, 3169–3177. [Google Scholar] [CrossRef]
  15. Moran, D.; Ertas, A.; Gulbulak, U. A Unique Transdisciplinary Engineering-Based Integrated Approach for the Design of Temporary Refugee Housing Using Kano, HOQ/QFD, TRIZ, AD, ISM, and DSM Tools. Designs 2021, 5, 31. [Google Scholar] [CrossRef]
  16. Warfield, J. Structuring Complex Systems; Battelle Monograph, No. 3; Battelle Memorial Institute: Columbus, OH, USA, 1974. [Google Scholar]
  17. Mandal, A.; Deshmukh, S.G. Vendor Selection Using Interpretive Structural Modelling (ISM). Int. J. Oper. Prod. Manag. 1994, 14, 52–59. [Google Scholar] [CrossRef]
  18. Formlabs, C.Y. 3D Print Silicone? Best Silicone 3D Printers and Alternatives. 2024. Available online: https://formlabs.com/global/blog/silicone-3d-printing/ (accessed on 28 April 2024).
  19. O’Neill, B. Ultimate Guide to Silicone 3D Printing. Aniwaa. 2023. Available online: https://www.aniwaa.com/guide/3d-printers/silicone-3d-printing/ (accessed on 28 April 2024).
  20. Artificial Heart Valves from Silicone. Available online: https://healthcare-in-europe.com/en/news/artificial-heart-valves-from-silicone.html (accessed on 28 April 2024).
  21. Zhou, J.; Li, Y.; Li, T.; Tian, X.; Xiong, Y.; Chen, Y. Analysis of the effect of thickness on the performance of polymeric heart valves. J. Funct. Biomater. 2023, 14, 309. [Google Scholar] [CrossRef] [PubMed]
  22. Harary, F.; Norman, R.V.; Cartwright, D. Structural Models: An Introduction to the Theory of Directed Graphs; Willey: New York, NY, USA, 1965. [Google Scholar]
  23. McCabe, T.J. Describing Cyclomatic Complexity. IEEE Trans. Softw. Eng. 1976, 308, 1976. [Google Scholar]
  24. Lee, A.; Hudson, A.R.; Shiwarski, D.J.; Tashman, J.W.; Hinton, T.J.; Yerneni, S.; Bliley, J.M.; Campbell, P.G.; Feinberg, A.W. 3D bioprinting of collagen to rebuild components of the human heart. Science 2019, 365, 482–487. [Google Scholar] [CrossRef]
  25. Gulbulak, U.; Ertas, A.; Baturalp, T.B.; Pavelka, T. The effect of fundamental curves on geometric orifice and coaptation areas of polymeric heart valves. J. Mech. Behav. Biomed. Mater. 2020, 112, 104039. [Google Scholar] [CrossRef]
  26. Park, K.S. Stents for Transcatheter Aortic Valve Replacement. Master’s Thesis, Division of Biomedical Engineering, Department of Human Biology, University of Cape Town, Cape Town, South Africa, 2017. [Google Scholar]
  27. Chen, Y.; Haoxiang, L. Pressure distribution over the leaflets and effect of bending stiffness on fluid—Structure interaction of the aortic valve. J. Fluid Mech. 2020, 883, A52. [Google Scholar] [CrossRef]
  28. Aortic Valve Regurgitation. Mayo Clinic. Available online: https://www.mayoclinic.org/diseases-conditions/aortic-valve-regurgitation/symptoms-causes/syc-20353129 (accessed on 21 May 2025).
  29. Boskovski, M.T.; Gleason, T.G. Current Therapeutic Options in Aortic Stenosis. Circ. Res. 2021, 128, 1398–1417. [Google Scholar] [CrossRef]
  30. Lee, J.H.; Scotten, L.N.; Hunt, R.; Caranasos, T.G.; Vavalle, J.P.; Griffith, B.E. Bioprosthetic aortic valve diameter and thickness are directly related to leaflet fluttering: Results from a combined experimental and computational modeling study. JTCVS Open 2021, 6, 60–81. [Google Scholar] [CrossRef]
  31. Hatoum, H.; Moore, B.L.; Dasi, L.P. On the Significance of Systolic Flow Waveform on Aortic Valve Energy Loss. Ann Biomed. Eng. 2018, 46, 2102–2111. [Google Scholar] [CrossRef] [PubMed] [PubMed Central]
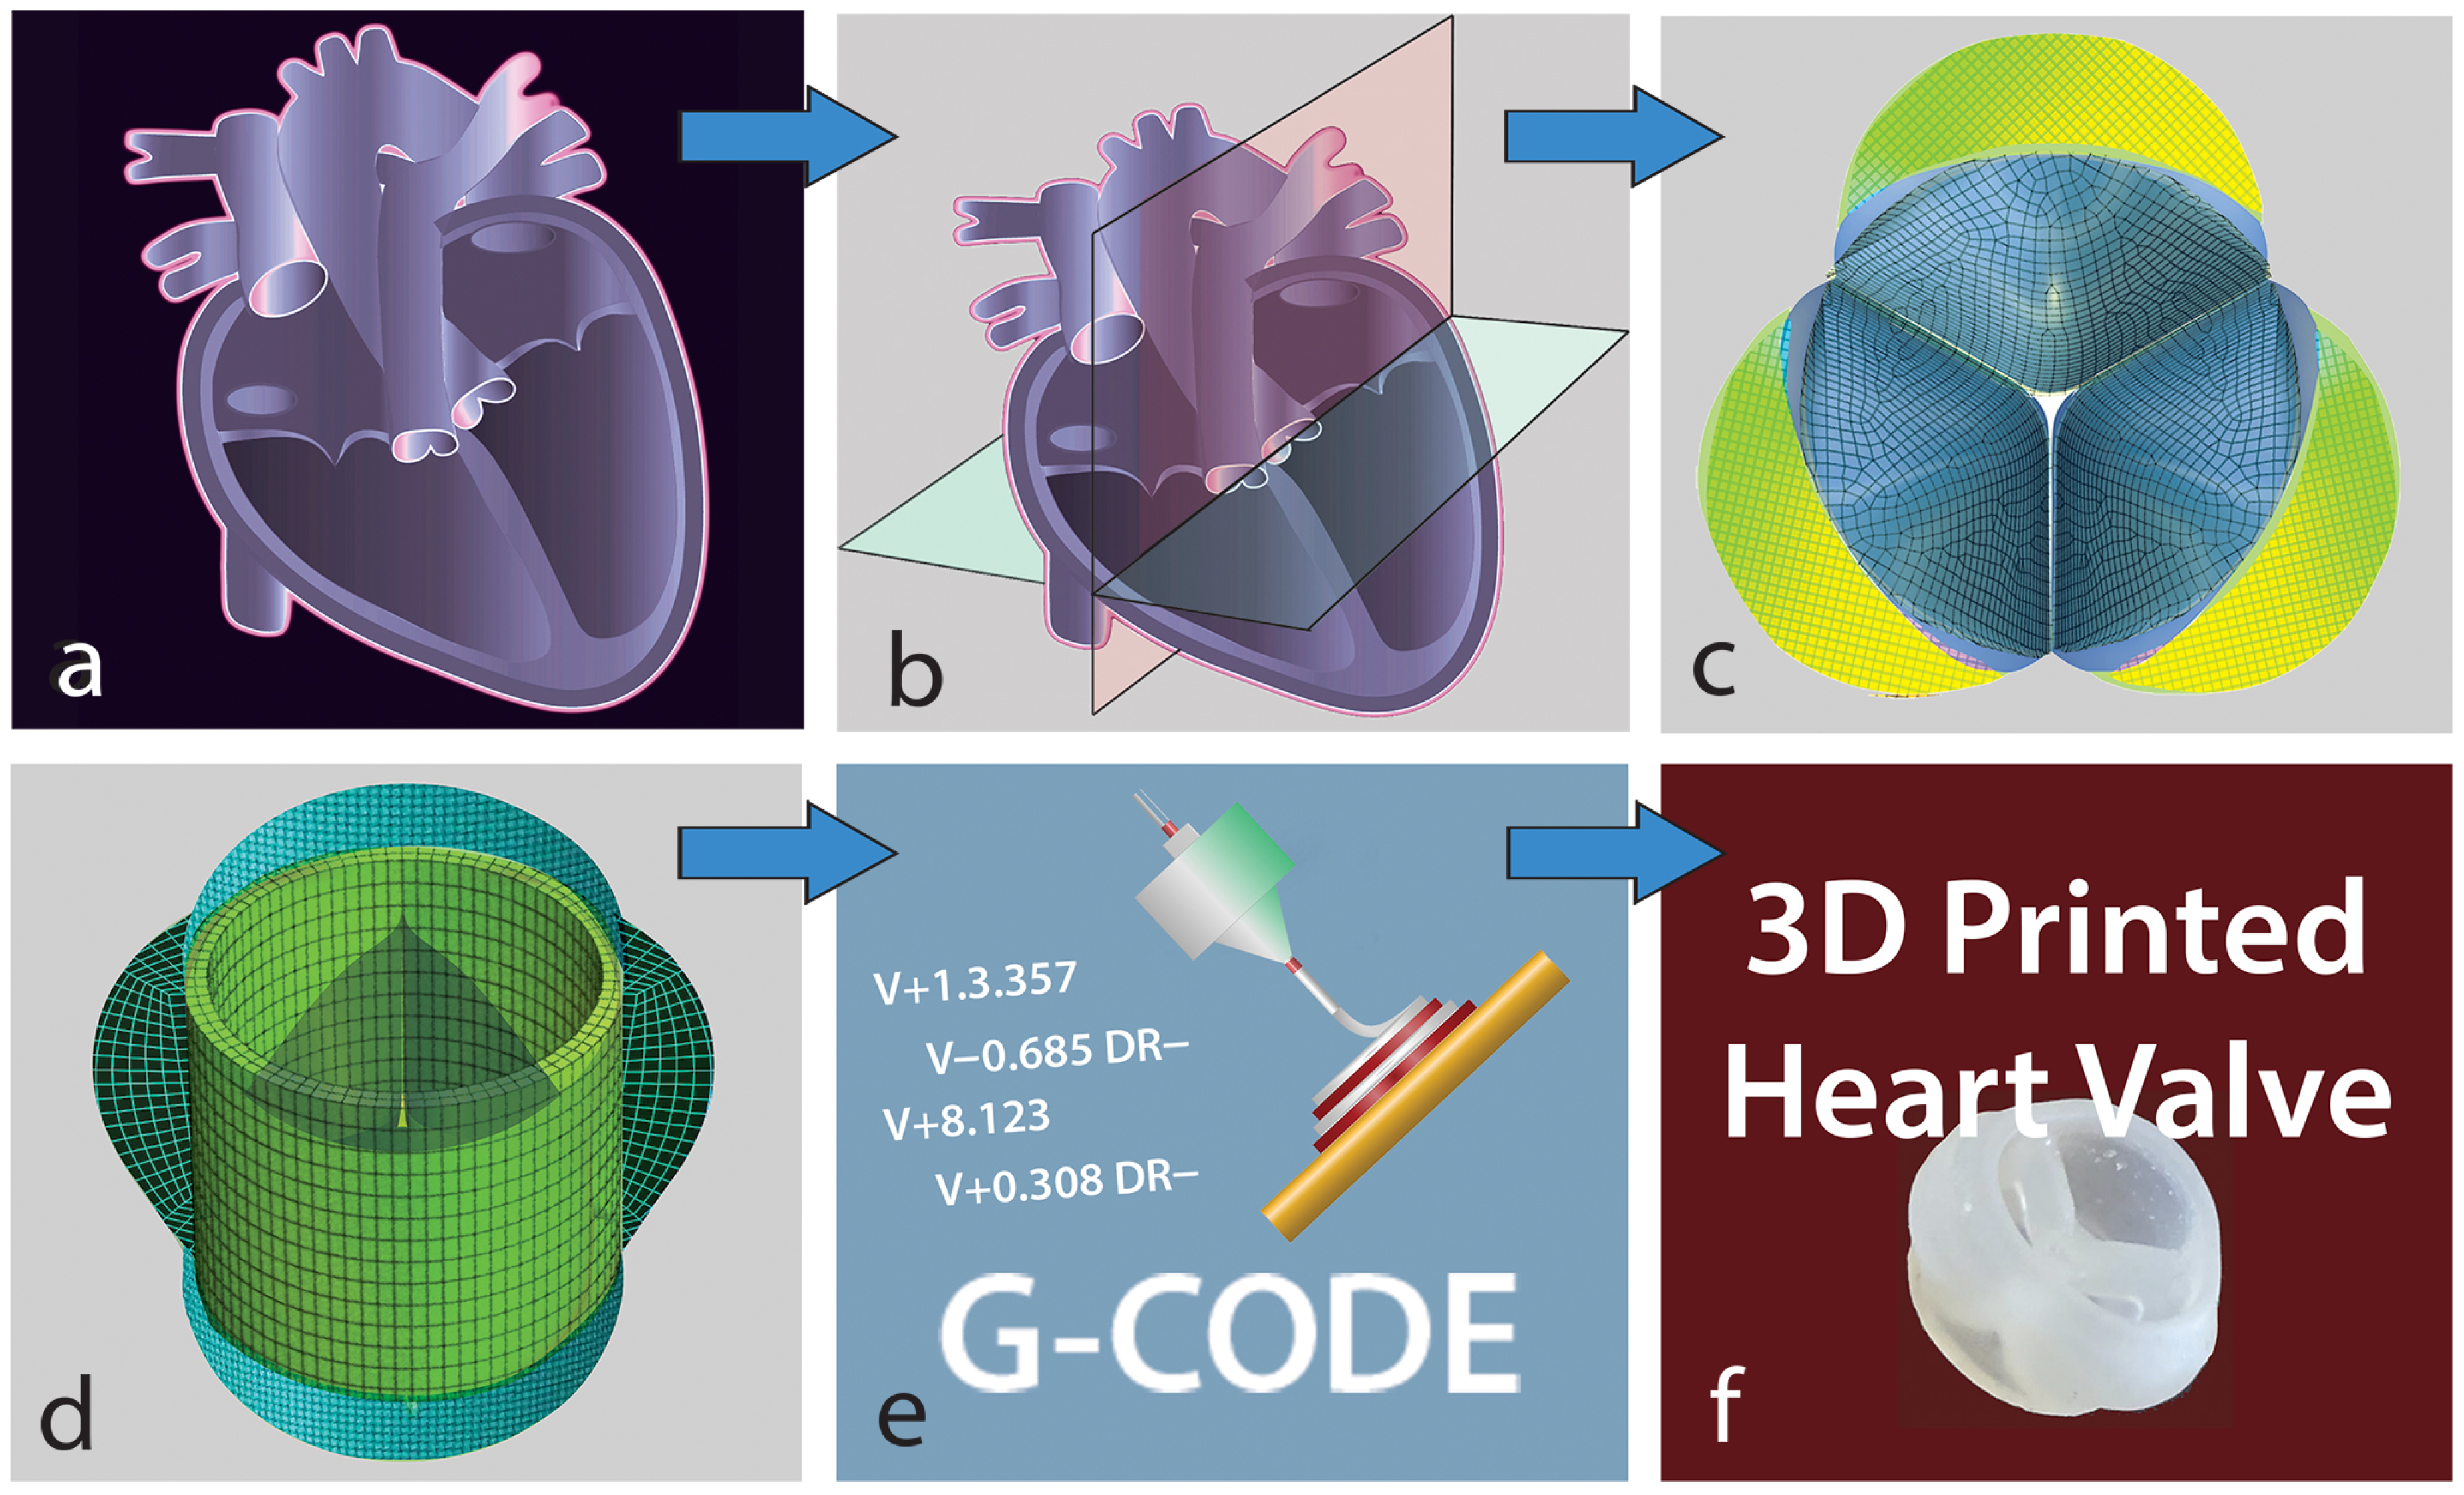
Figure 1. Process of creating a 3D-printed heart valve utilizing CT or MRI technology. (a): Heart valve imaging; (b): segmentation of the heart valve; (c): Three-dimensional mesh of the heart valve; (d): Surface geometry of the 3D model; (e): Creating G-code; (f): 3D printed heart valve.
Designs 09 00098 g001
Figure 2. Stresses on aortic heart valve leaflets [adapted from Ertas et al. [11]).
Designs 09 00098 g002
Figure 3. House of Quality for the 3D silicone printing machine design.
Designs 09 00098 g003
Figure 4. Transforming HOQ to directional relationships. (a): Roof of HOQ; (b): ISM directional relationships; (c): Structural Self-Interaction Matrix (SSIM).
Designs 09 00098 g004
Figure 5. Final reachability matrix ( R f ).
Designs 09 00098 g005
Figure 6. Average stress–strain graphs of UV-cured and post-cured silicone (Ertas et al. [11]).
Designs 09 00098 g006
Figure 7. Dimensions of the models for 3D aortic heart valve printing (Inventor 3D modeling software was used to generate the models in Figure 7). (a,b) Heart valve Aortic annulus wall; (ce) small-sized heart valve dimensions; (fh) Larger size dimensions.
Designs 09 00098 g007
Figure 8. Geometry generation for the heart (adapted from Ertas, et al. [11]). (a) Control points and fixed endpoints of the 2D spline; (b) Belly curve.
Designs 09 00098 g008
Figure 9. Mock Circulatory Loop experimental setup for blood circulation (recreated from [11]).
Designs 09 00098 g009
Figure 10. Heart valve chamber design: (a) for small size valve (Ertas et al. [11]), (b) larger size valve.
Designs 09 00098 g010
Figure 11. Digraph for the 3D printing process.
Designs 09 00098 g011
Figure 12. Poor- quality printed aortic heart valve.
Designs 09 00098 g012
Figure 13. MICMAC analysis.
Designs 09 00098 g013
Figure 14. Experimental results of aortic heart valve openings for different design parameters at a leaflet thickness of 0.8 mm. (a,c,e,g) close positions. (b,d,f,h) open positions.
Designs 09 00098 g014
Figure 15. Experimental results of aortic heart valve openings for different design parameters at a leaflet thickness of 1.6 mm. (a,c,e,g) close positions. (b,d,f,h) open positions.
Designs 09 00098 g015
Figure 16. Inlet pressure comparison of the cardiac cycles related to valve sizes of 23 mm and 36 mm, with a leaflet thickness of 0.8 mm and a flow rate of 5 L/min.
Designs 09 00098 g016
Figure 17. Outlet pressure comparison of the cardiac cycles related to valve sizes of 23 mm and 36 mm, with a leaflet thickness of 0.8 mm and a flow rate of 5 L/min.
Designs 09 00098 g017
Figure 18. A comparison of the cardiac cycles related to valve sizes of 23 mm and 36 mm, with a leaflet thickness of 0.8 mm and a flow rate of 7 L/min: (a) inlet pressure and (b) outlet pressure.
Designs 09 00098 g018
Figure 19. A comparison of the cardiac cycles related to valve sizes of 23 mm and 36 mm, with a leaflet thickness of 1.6 mm and a flow rate of 5 L/min: (a) inlet pressure and (b) outlet pressure.
Designs 09 00098 g019
Figure 20. A comparison of the cardiac cycles related to valve sizes of 23 mm and 36 mm, with a leaflet thickness of 1.6 mm and a flow rate of 7 L/min: (a) inlet pressure and (b) outlet pressure.
Designs 09 00098 g020
Table 1. UV-cured silicone specifications.
DescriptionAppearanceViscositySpecificTensile StrengthElongationShore A
GravityASTM D412ASTM D412ASTM D2240
Pa-sec MPa%
UV CureHazy2.5–6.00.950–1.0500.207–0.621100–40015–25
Viscous Fluid
Table 2. Standard deviation with the averaged results [11].
DATASETShore A HardnessTensile Strength (MPa)Elongation (%)
AvgStdAvgStdAvrStd
6hr UV-Cure12.330.2890.4030.026381.9%28.3%
Table 3. Model dimensions for 3D aortic heart valve printing.
DesignDimensionsDesignDimensions
Parameters(mm)Parameters(mm)
T wL 3.7 h 1 S 13.0
T wS 2.0 h 2 S 17.0
D 1 S 23.0 h 1 L 17.5
D 2 S 38.0 h 2 L 23.0
D 1 L 36.0 D 3 Sf 42.0.0
D 2 L 56.0
Table 4. Four different design parameters of aortic heart valve experimental results.
ScaleFlowrateHeartbeatInlet PressureOutlet Pressure
(L/min)(RPM)(mmHg)(mmHg)
1(LT = 0.8 mm) 5.075.586.587458.8349
1.5(LT = 0.8 mm) 5.098.2163.3345116.9414
1(LT = 1.6 mm) 5.072.192.759860.6161
1.5(LT = 1.6 mm) 5.0102.5144.9092109.0776
1(LT = 0.8 mm) 7.0112.9123.354987.2601
1.5(LT = 0.8 mm) 7.0136.7242.8402187.3273
1(LT = 1.6 mm) 7.0108.5126.143686.5931
1.5(LT = 1.6 mm) 7.0160.1265.6598200.2076
Disclaimer/Publisher’s Note: The statements, opinions and data contained in all publications are solely those of the individual author(s) and contributor(s) and not of MDPI and/or the editor(s). MDPI and/or the editor(s) disclaim responsibility for any injury to people or property resulting from any ideas, methods, instructions or products referred to in the content.