Article

Towards Smart Wildfire Prevention: Development of a LoRa-Based IoT Node for Environmental Hazard Detection

1
Department of Electrical Engineering, Telecommunications and Computers (DEETC), Instituto Superior de Engenharia de Lisboa (ISEL), 1959-007 Lisbon, Portugal
2
Technologies and Engineering School (EET), Instituto Politécnico da Lusofonia (IPLuso), 1700-098 Lisbon, Portugal
3
UNINOVA-CTS, NOVA University of Lisbon, Campus de Caparica, 2829-516 Monte de Caparica, Portugal
*
Authors to whom correspondence should be addressed.
Designs 2025, 9(4), 91; https://doi.org/10.3390/designs9040091
Submission received: 28 May 2025 / Revised: 24 July 2025 / Accepted: 4 August 2025 / Published: 5 August 2025

Abstract

The increase in the number of wildfires in recent years in different parts of the world has caused growing concern among the population, since the consequences of these fires go beyond the destruction of the ecosystem. With the growing relevance of the Internet of Things (IoT) industry, developing solutions for the early detection of fires is of critical importance. This paper proposes a low-cost network based on Long-Range (LoRa) technology to autonomously assess the level of fire risk and the presence of a fire in rural areas. The system consists of several LoRa nodes with sensors to measure environmental variables such as temperature, humidity, carbon monoxide, air quality, and wind speed. The data collected is sent to a central gateway, where it is stored, processed, and later sent to a website for graphical visualization of the results. In this paper, a survey of the requirements of the devices and sensors that compose the system was made. After this survey, a market study of the available sensors was carried out, ending with a comparison between the sensors to determine which ones met the objectives. Using the chosen sensors, a study was made of possible power solutions for this prototype, considering the expected conditions of use. The system was tested in a real environment, and the results demonstrate that it is possible to cover a circular area with a radius of 2 km using a single gateway. Our system is prepared to trigger fire hazard alarms when, for example, the signals for relative humidity, ambient temperature, and wind speed are below or equal to 30%, above or equal to 30 °C, and above or equal to 30 m/s, respectively (commonly known as the 30-30-30 rule).

1. Introduction

The increasing frequency and severity of wildfires, largely driven by climate change, represents a growing threat to both natural ecosystems and human settlements. These events not only cause environmental degradation but also pose significant socio-economic risks. To mitigate these impacts, there is a critical need for early detection systems that can monitor key environmental variables and alert authorities in real time, ideally before fires become unmanageable. Recent advances in Internet of Things (IoT) technologies offer promising solutions thanks to their low cost, energy efficiency, and ability to operate autonomously in remote forested regions [1,2,3].
Wildfires have become increasingly frequent and severe in recent decades, partly due to climate change and human factors. These events pose serious threats to ecosystems, public safety, and infrastructure. Recent reviews highlight that early detection and real-time monitoring are critical to mitigate their impact.
In Portugal, forest fires remain a perpetual threat, especially during summer when the severity of the heat and prolonged precipitation increase the risk of these events. From 2012 to 2021, 15,522 rural fires were recorded on average per year, with an average burned area of 126.091 thousand hectares: 62,639 hectares (50%) belonged to forest stands, 54,682 hectares (43%) covered scrubland and natural pastures, and another 8770 hectares (7%) contained agricultural land. In this context, the European Union has expressed increasing concern regarding forest conservation, emphasizing the importance of implementing both fire prevention strategies and monitoring systems. A key priority involves deploying advanced technologies to enable early fire detection and facilitate timely preventive actions aimed at mitigating potential impacts. Interest in the development of IoT technologies and systems for monitoring forest fires is increasing, but there are various obstacles to deploying wireless networks over forestry land. Because there are no energy sources, batteries and other alternative energy sources, such as solar panels, must be used. Long-Range (LoRa) wireless systems have increased costs and more necessary infrastructure than shorter-range wireless technologies. However, technologies such as WiFi, Bluetooth, or mobile communications could be a potential option for fire detection systems closer to residential areas [4]. Because of the size of the areas that require coverage, long-range wireless technologies are the best option. LoRa technology is particularly well-suited for this type of application, offering communication ranges of several kilometers while maintaining ultra-low power consumption. Other types of Low-Power Wide-Area Network (LPWAN) technology may also be used for Wireless Sensor Network (WSN) systems in rural and forested areas, such as SigFox, Long-Term Evolution (LTE), or 5G [5]. LoRa is increasingly gaining popularity for use in low-cost gateways, and is attracting increasing interest in the design of projects and applications that require wireless coverage of huge areas that are difficult to access.
LoRa concentrates on Chirp Spread Spectrum (CSS) modulation, working in unlicensed bands in the sub-GHz range—868 MHz and 433 MHz band in Europe, and 915 MHz and 433 MHz bands in the US [6]. The CSS modulation is a broad-spectrum technique using chirp signals—linearly frequency-modulated pulses, where frequency varies continuously, with either an increase or decrease over time. This method hence offers a high degree of immunity against noise and interference while being very suitable for long-range-type low-power communication systems. CSS modulation is characterized by four fundamental parameters, from which it derives its distinctive properties and behavior:
  • Transmission Frequency: This specifies the center channel within the Industrial, Scientific and Medical (ISM) band.
  • Bandwidth (BW): This impacts the transmission rate and sensitivity of the system; typical values are 125 kHz, 250 kHz, and 500 kHz.
  • Code Rate (CR): This refers to the ratio of data bits to the total number of bits transmitted, including error correction bits. LoRa uses Forward Error Correction (FEC) coding at a variable rate between 4/5 and 4/8, allowing for better noise immunity.
  • Spreading Factor (SF): This represents the encoded bits per chirp, ranging from 7 to 12. A higher SF means a larger chirp time and smaller bit rate, but higher sensitivity and range.
These parameters adjust the complex balance between range, robustness of communications, and data rate according to the application and its characteristics.
In this sense, the main goal of this work is the experimental elaboration of a monitoring system based on IoT technologies, using LoRa devices and a set of sensors that allow for the real-time monitoring of environmental variables such as temperature, humidity, wind speed, carbon monoxide, and air quality. These variables are transmitted from the node to a gateway, where they are subsequently processed and visualized through a dashboard designed for intuitive interaction and optimized user experience. This experiment is important given that the incorporation of IoT technologies in forest monitoring provides several benefits, such as cost reductions and the potential to detect fires more efficiently so that firefighting teams can act quickly and effectively.
Key contributions of this work include the following:
  • A low-cost and energy-efficient environmental monitoring node, using LoRa communication, for deployment in remote wildfire prevention.
  • The integration of multiple environmental sensors capable of capturing critical parameters related to wildfire prevention.
  • Designing a modular and easy-to-use dashboard for real-time data visualization and analysis.
  • Machine-to-Machine (M2M) communication, focusing on Message Queuing Telemetry Transport (MQTT) and Node Red.
  • The existence of a proof-of-concept demonstrating the relevance of this system in providing early wildfire prevention capabilities and ultimately aiding in wildfire protection.
  • Firmware implementation of wildfire safety rule: 30-30-30 [7].
This article begins by presenting the state of the art and related works in Section 2. In Section 3 presents the materials and methods and Section 4 presents the results achieved. Section 5 presents the conclusion of the study, along with considerations and directions for future work. The manuscript includes two Appendix A for sensors specifications and Appendix B for algorithm overview

2. State of the Art and Related Works

This section presents the current state of the art in Section 2.1 and Section 2.2, along with some related works about the topic of study.

2.1. State of the Art

IoT is referred to as connecting physical objects such as vehicles, instruments, consumer devices, buildings, and industrial facilities through integrated electronics, circuits, software, and sensors that can gather, transmit, and communicate remotely on the Internet [8]. This model transforms common things into smarter networked systems that can execute actions, either autonomously or in combination, as part of bigger digital infrastructures.
IoT is changing people’s, industries’, and societies’ interactions with their environment by enabling the construction of intelligent infrastructures. These infrastructures uphold innovative services with increased flexibility, increased efficiency, the optimization of resources, and the development of new business models [9].
The concept of intelligent networked devices can be traced back to as early as 1982, when a reprogrammed Coca-Cola vending machine at Carnegie Mellon University was the first device to proclaim its stock and beverage temperatures on the Internet [10]. Kevin Ashton subsequently coined the term “Internet of Things” as a vision of a world in which the physical and digital worlds are linked in a seamless way through pervasive sensing and communications technologies.
Currently, IoT deployment is on a dizzying trajectory. More than 25 billion IoT devices are currently in use globally, and 25% annual growth is anticipated. Almost 30 billion devices will be connected by 2030, and these will find use in industrial automation, healthcare, agriculture, urban infrastructure, and environmental monitoring [11].
This exponential growth in IoT deployments goes hand in hand with a similar growth in data volumes, and thus requires advanced tools for data storing, data processing, and data analysis. Big Data technologies have emerged as a keystone technology for scalable data handling in such a scenario. The relationship between IoT and Big Data is inherently two-fold. IoT is itself a principal data generator, producing constant amounts of structured and unstructured data from distributed sources. Big Data Analytics (BDA) makes it possible to extract information from this data, enabling improved decision-making, predictive maintenance, and intelligent system adaptation [12]. Big data are high volume and varied data sets accumulated over time from a wide assortment of sources, e.g., sensors, business transactions, and social media sources. BDA uses analysis procedures to infer patterns, correlations, and trends that define operational and strategic value [13].
The integration of these technologies opens a window of opportunity for, for example, active accident management systems and rescue authorities equipped with tools to help them predict, understand, or monitor disaster situations [14]. The increase in the amount of information being fed to BDAs comes from a variety of applications in which IoT is implemented:
  • Smart Cities: The implementation of IoT in cities has helped to improve the efficiency and quality of services at an urban level, improving quality of life for its citizens. It has uses in areas such as waste management, public safety, mobility, and energy saving [15]. Smart cities are one of the “children” of the IoT, playing a key role in the development of smarter and more sustainable cities.
  • Digital Health: Monitoring biomedical sensors has been one of the areas of greatest applicability for IoT. Biomedical sensors can measure various physiological parameters of patients and send this data to a central monitoring unit. This revolution has allowed, for example, patients with chronic illnesses or recovering from surgery to be monitored remotely [16].
  • Industrial IoT: The Industrial Internet of Things (IIoT) is an extension of the IoT that focuses on the interconnection of industrial assets with Information Technology (IT). Through IIoT, sensors and devices are being incorporated into industrial machinery and equipment to collect data in real time, which can be analyzed and used to improve the efficiency and productivity of industry. Some examples of where IIoT is already being applied in industry include machine monitoring and equipment maintenance forecasting [17].
  • Smart Earth: As an integral part of the IoT, Smart Earth technologies aim to collect environmental data from a wide variety of sensors, including land, water, and air sensors, satellites, and monitoring devices [18]. The primary objective is to conserve and protect the planet, as well as to prevent potential human disasters, including tsunamis, floods, earthquakes, and fires [19].
Early fire detection is critical for disaster prevention, as it enables a rapid and effective response to potential catastrophic events. Therefore, it is essential to examine the range of available fire detection techniques.
According to [20], the huge number of detection systems being operated at present has been classified into four categories: Human Observation, Satellite Surveillance Systems, Camera Surveillance Systems, and WSN.
After analyzing and studying these systems, the author rates them based on factors such as cost of implementation, efficiency, the dissemination of false alarms, localization accuracy, delay in detection, and applicability. It is concluded that WSNs are the most suitable among the systems evaluated, largely because they cover large areas, are scalable, and consume less energy. WSNs, or Wireless Sensor Networks, are used for collecting and transmitting data in real-time, enabling the early detection of fires in remote areas. Other features of this technology are discussed in detail in the subsequent section.

2.2. Related Works

In [21], Subashini proposes developing a system to monitor and warn of flooding in flood-prone areas in India using WSN and IoT technologies, particularly LoRa. The flood warning system ecosystem consists of a network of sensor nodes strategically deployed along riverbanks to monitor key environmental parameters such as temperature, water level, and flow rate. These sensors transmit real-time data to a central server for storage and analysis. Complementing this monitoring network, a user-facing application alerts the public when water levels reach critical thresholds. Real-time monitoring plays a vital role in mitigating flood damage, particularly in developing countries where access to advanced technologies is limited. A low-cost, energy-efficient system with reliable long-range communication can be lifesaving and significantly improve the responsiveness of local authorities.
The researchers in [22] developed an advanced system designed to detect, predict, and analyze the behavior of forest fires. Their approach leverages an IoT framework, utilizing a WSN distributed across forested regions. Notably, the system incorporates parallel processing, which enables it to analyze multiple data streams concurrently and provide real-time responses. Key environmental variables that are monitored include temperature, relative humidity, and the Chandler combustion index (CBI), with the latter being a crucial indicator of fire risk. The system is designed to trigger alarms automatically when any measured value exceeds predefined thresholds. Field evaluations conducted in northern Jordan demonstrated the system’s rapid detection capabilities; for instance, it identified potential fire events in as little as 0.477 min. Throughout these trials, temperature readings ranged from 28 °C to 48.6 °C, relative humidity fluctuated between 53% and 22%, and CBI values reached up to 97.92. The authors suggest that future enhancements, such as the integration of General-Purpose Computing on Graphics Processing Units (GPGPU) technology, could further expand the system’s analytical power and accuracy. Overall, the results indicate strong potential for both timely fire detection and scalable deployment.
Reference [23] offers an in-depth examination of IoT technologies designed for the early detection of forest fires. The study systematically reviews various sensor types and ground camera systems, delves into detection algorithms including computer vision, environmental sensing, and anomaly detection, and critically assesses key performance metrics such as energy consumption, response latency, and overall system accuracy. The analysis provides valuable insights for researchers and practitioners aiming to enhance fire prevention strategies through technological innovation.
Reference [24] introduces a sophisticated cyber-physical system intended for the early identification and effective management of forest fires. The proposed approach integrates ground-based IoT sensors, unmanned aerial vehicles (UAVs), and unmanned ground vehicles (UGVs), all coordinated via Robot Operating System (ROS) and Internet of Robotic Things (IoRT) communications. The network of IoT nodes continuously monitors key environmental parameters including temperature, relative humidity, visual (RGB), infrared, and carbon monoxide levels to detect thermal irregularities and abnormal gas concentrations indicative of pre-ignition conditions. Upon detection of potential fire activity, the system autonomously deploys a UAV to survey the affected area, pinpoint the precise location, and, if necessary, deploy extinguishing devices or transmit critical data to facilitate rapid response decisions. Both UAVs and UGVs operate on ROS, utilizing protocols such as MQTT and Node-RED for M2M communication, autonomous navigation, telemetry, and remote operation via a real-time web-based dashboard. The system’s efficacy was validated through simulations replicating near-real-fire scenarios, which demonstrated prompt detection, seamless coordination among mobile units, and comprehensive environmental and visual monitoring. Ultimately, the aim is to deliver a practical, open-source platform applicable to diverse domains, including surveillance, precision agriculture, and forestry management.
Reference [25] introduces a sophisticated system that leverages low-power IoT devices alongside artificial intelligence for the proactive detection of forest fires. This initiative exemplifies the convergence of environmental monitoring with advanced predictive technologies. The system employs BME280 sensors, which measure temperature, humidity, and atmospheric pressure. These sensors are integrated into IoT nodes utilizing LoRa communication protocols. Data is collected at high frequency every 30 s and transmitted through a gateway to The Things Network (TTN) via MQTT, resulting in a detailed temporal data set. Collected data is not merely archived. The system applies temporal analysis models capable of discerning significant patterns and forecasting environmental shifts. When these models detect anomalous trends such as sudden temperature increases or humidity drops, the system promptly raises alerts, enabling early intervention long before wildfire escalates.
Reference [26] discusses the creation of a new-generation early warning system for forest fires, comprising a network of intelligent CO2 sensors. This network has been termed intelligent as it has been coupled with AI algorithms, particularly Long Short-Term Memory (LSTM) networks, enabling it to analyze sensor data in a time-dependent manner instead of employing a simple threshold. It is a cloud-based application, so the system connects with the sensors, manages them, and simulates the data received from many sensors. For validation purposes, researchers installed 44 sensors in a controlled environment and deliberately placed them varying distances from the fire source to obtain different smoke dispersion patterns from different wind directions. In this study, the efficiency of the three Artificial Intelligence models, LSTMs, was explored and compared to a set fixed-threshold approach. The results show that the LSTM significantly outperforms the conventional approach, activating up to 56% more sensors within a much shorter time and better tracking the overall movement of the fire front, being influenced by meteorological conditions. In general, this intelligent system not only enhances initial fire detection in terms of speed and accuracy but also aids fighting operations, signifying an important step forward in wildfire monitoring technology.
While several studies have proposed LoRa-based wildfire detection systems, our approach presents a set of distinctive features. First, we integrate a wider range of environmental indicators, including carbon monoxide (CO) and fine particulate matter (PM2.5), enhancing the ability to detect early-stage and smokeless fires. Second, our system applies the 30-30-30 rule [7] (30 °C temperature, 30% humidity, and 30 km/h wind speed) as a formal criterion for fire hazard alerts, a methodology seldom formalized in the prior literature. Third, a custom-made anemometer was used to reduce hardware costs without significantly sacrificing performance. Fourth, extensive field tests in both Line-Of-Sight (LOS) and Non-Line-Of-Sight (NLOS) scenarios were conducted, validating the system’s robustness under realistic environmental conditions. Finally, our end-to-end system includes an intuitive monitoring dashboard and MQTT protocols, contributing to its practical usability in remote contexts. Regarding the dashboard, we implemented a graphical user interface using Node-Red, a flow-based development tool widely used in IoT applications for integrating hardware, APIs, and online services. Node-Red enables intuitive dashboard creation and supports MQTT communication, allowing for seamless data transfer between the IoT node, the gateway, and the end-user interface. This platform was chosen for its ease of use, low resource footprint, and strong community support.
Table 1 summarizes all the relevant research discussed.

3. Materials and Methods

This section is divided into subsections and provides a concise and precise description of the experimental system, hardware integration, and algorithms developed for the transmitter (node) and receiver.

3.1. System Implementation and Hardware Setup

The main emphasis of the article is to develop a node capable of being interlinked with the LoRa network, extending its coverage to an extensive forest area with maybe a few dozen to hundreds of identical nodes to ensure system reliability.
A block diagram of the proposed system is presented in Figure 1. It illustrates that each node is equipped with a range of sensors, including an air-quality sensor, a temperature and humidity sensor, and a carbon monoxide (CO) gas sensor. These sensors continuously monitor environmental conditions in real time, enabling the detection of any deviations from normal parameters. The transmission unit consists of a microcontroller integrated with a LoRa module, which transmits the sensor data to a central gateway for further processing. The gateway consists of a microprocessor and a receiving module, which is also LoRa, to receive data coming from the node and process such information, so that Node-RED can use the processed information for an easy and intuitive display to ensure that the parameters are monitored properly and to trigger fire hazard alarms when, for example, the signals for relative humidity, ambient temperature, and wind speed are below or equal to 30%, above or equal to 30 °C, and above or equal to 30 m/s, respectively (commonly known as 30-30-30 [7]). Figure 1 presents the system architecture for the experiment. The node (transmitter) system is composed of Arduino Mega [27], a LoRa module RFM95 [28], and four sensors (humidity and temperature—DHT11 [29], air-quality PM2.5 [30], CO—MQ7 [31], a home-made anemometer model [32]). The Gateway system is composed of a Raspberry Pi 3 [33], a LoRa module RFM95, and seven-inch Thin-Film Transistor (TFT) display [34].

3.1.1. Controllers

An Arduino Mega microcontroller development board was built around the ATmega2560, the selected microcontroller for the node. It has 54 digital input/output pins, 16 analog inputs, 4 Universal Asynchronous Receiver/Transmitter (UART) ports, a 16 MHz clock frequency, and 256 kB in flash memory.
The gateway, on the other hand, consists of a Raspberry Pi 3 microprocessor. Being equipped with a 1.4 GHz 64-bit Broadcom BCM2837B0 and 1 GB RAM, the Raspberry Pi 3 offers countless processing possibilities, from communicating with the sensors and devices connected to it to processing the received data to eventually transmitting it to a cloud or other target device. It also features wireless connectivity, along with Ethernet, Bluetooth, a set of four USB ports, and an HDMI port to which the touch display is connected.

3.1.2. Sensors

A wide variety of substances harmful to the environment are emitted by smoke from forest fires or any kind of prescribed burning. Therefore, it is necessary to have an appropriate set of sensors for their detection and monitoring. Regarding particles, which form one of the major components of emitted substances, higher density means lower visibility and an increase in toxic gases. The particles can be classified into two categories:
  • PM10—particles whose aerodynamic diameter is less than 10 µm; coarse inhalable particles (2.5 to 10 µm).
  • PM2.5 particles are fine inhalable particles (<2.5 µm).
An air-quality sensor capable of determining the concentrations of the pollutants mentioned above will provide important information on pollution in the vicinity of forest fires or help to detect their existence. Like aerodynamic particles, another substance that has higher concentrations during and after fire activity is carbon monoxide [35]. As mentioned in [35], by measuring carbon monoxide concentration in air, it is possible to quickly find the Critical Noxious Concentration (CNC) at which the carbon monoxide level becomes a menace to life.
Temperature, humidity, and wind speed are among the key environmental factors considered in forest monitoring. Elevated temperatures promote the rapid spread of flames, and high daytime temperatures, even in the absence of human activity, increase the likelihood of fire ignition from environmental causes. Under low-relative-humidity conditions, the vegetation is also more prone to fire ignition and propagation. On the other hand, wind speed plays a crucial role in fire development, as strong winds significantly increase the rate at which a fire spreads. Once temperature, humidity, and wind speed have been gathered, the 30-30-30 rule can be resorted to, a commonly known guideline in assessing forest fire risk. This rule states that a fire is more likely to occur under conditions that include a temperature above 30 °C, a relative humidity below 30%, and a wind speed above 30 km/h.
A test was carried out in which temperature and relative humidity data were collected from the environment using DHT11 sensors [29]. They provide temperature measurements ranging from 0 to 50 degrees Celsius with an error of +/−2 degrees and a humidity ranging from 20 to 95%, with an accuracy of ±5%. They also offer digital output, which makes it easier to integrate them with a microcontroller, as they send data via a single data pin; hence, they are quite simple to connect and configure. The primary goal of developing this system is to enable the early detection of environmental conditions that may lead to forest fires. For this purpose, the resolution of the DHT11 sensor is adequate, as minor temperature variations of 1 to 2 °C are unlikely to indicate abnormal thermal trends or critical risk conditions. The temperature will, therefore, not have to be measured with high precision; it will be sufficient to identify a few patterns that are, to some extent, dangerous, such as a slow increase in the ambient temperature or a drop in relative humidity.
The PM2.5 air-quality sensor [30] was selected for its ability to detect and analyze fine particulate matter with a small diameter, specifically particles measuring 2.5 μm or less. It works on the principle of light scattering, wherein an internal laser generates a very intense beam of light directed toward a detection chamber. When airborne particles of PM2.5 cross the path of the light beam, the light is scattered in various directions. All the directions of scattered light are detected by some light-sensitive sensors located in the detection chamber. These sensors determine the quantity and size of PM2.5 particles in the air based on the patterns and intensity of light scattering. This numerical representation is then converted into electrical signals and PM2.5 particle concentration is displayed accurately. Armed with this data, the situation can be evaluated regarding the air-quality measures that must be taken to secure a safe environment.
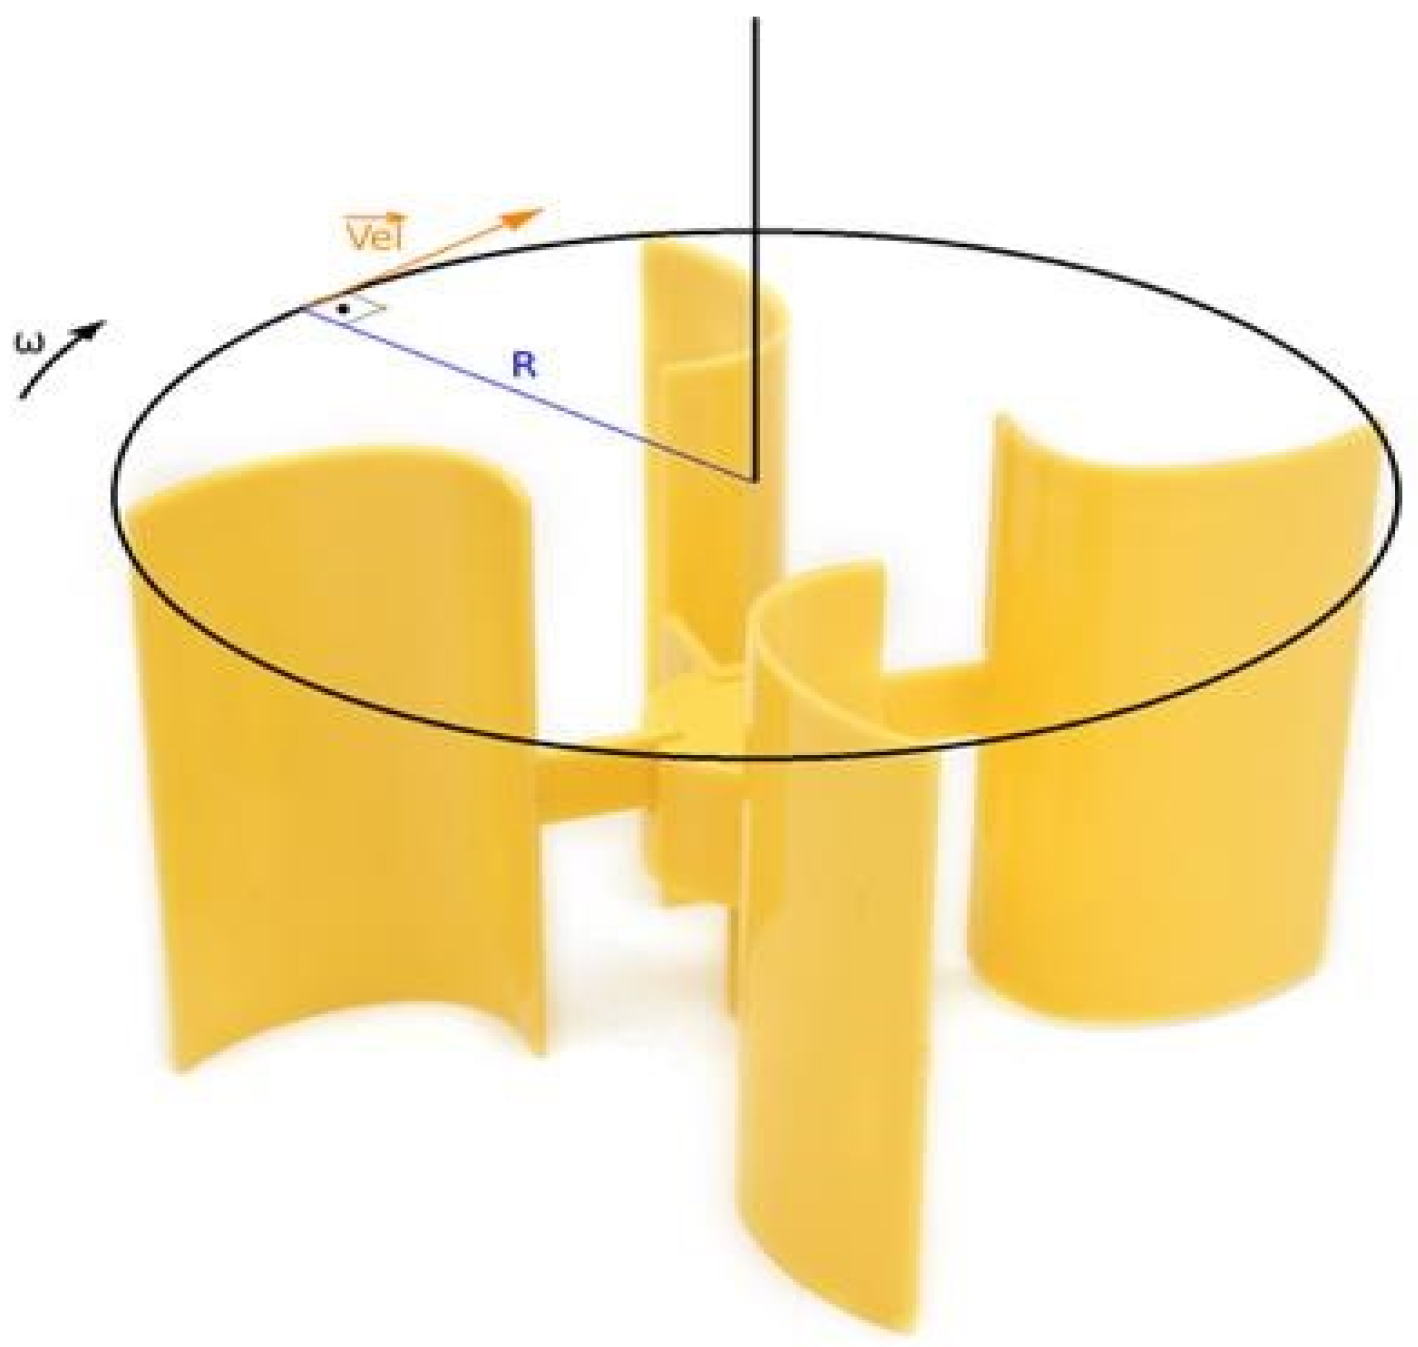
An anemometer from a teaching kit [32] was used to measure the wind velocity (Figure 2). The working principle of this anemometer is the relationship between wind velocity and the action of a DC motor, which is either an actuator or a generator. The wind over the propellers makes them start to rotate, thereby driving the motor. When rotating, the motor produces a potential difference at its terminals that proportionally relates to the velocity of the propellers.
To obtain the wind velocity, one must first calculate the motor constant (Kv). According to the manufacturer [32], the maximum voltage at the terminal is 5.5 V, while the highest revolutions per minute (RPM) score is 6000:
K v = V ω = 5.5   6000 = 0.0009
where the following hold:
  • Kv, is the motor constant, V/RPM;
  • V is the voltage applied to the motor (maximum), V;
  • ω is the angular velocity, RPM.
Therefore, the instantaneous rotational speed can be obtained from the following equation:
ω = V m e a s u r e m e n t K v
where V m e a s u r e m e n t is the voltage measurement in the terminal of the DC motor, in Volt. As can be seen in Figure 2, the rotational speed of the propellers (ω) is tangential to the wind velocity (Vwind) at the propellers, as a function of their radius.
Therefore, we have the following:
V w i n d = ω · R
where R is the radius of the propellers in meters and Vwind is wind velocity in m/s.
Finally, considering a propeller radius of 5 cm, and using the previous equations, we can calculate the wind velocity from the voltage at the motor terminals with the following calculations:
V w i n d = ω · R = V m e a s u r e m e n t K v · 0.05 = 0.926 · V m e a s u r e m e n t
This anemometer can be used to determine wind velocity in real time and will provide the node with another essential environmental parameter.
The carbon monoxide sensor chosen was the MQ7 [31], which works by detecting gases through the heating effect. The sensor consists of a platinum filament heated to a constant temperature. When carbon monoxide is detected, a chemical reaction occurs that alters the electrical resistance of the filament. This variation in resistance is directly proportional to the concentration of carbon monoxide present in the environment. However, the sensor’s output is analog, sending values between 0 and 1023 depending on the concentration of gas present, and prior calibration is required for correct data capture. The sensitivity characteristics are shown in Figure 3 on the sensor’s datasheet. From the graph, it is possible to determine the CO particles per million (ppm) using the resistance ratio ( R S R 0 ) of the sensor. RS is the sensor surface resistance at various CO concentrations and R0 is the sensor resistance in clean air.
According to the graph, (Figure 3), we can see that the ratio between the resistances (RCAF) is approximately 25.75. Thus,
R C A F = R S R 0 = 25.75  
So,
R 0 = R S 25.75
To determine the value of RS, it is necessary to measure the value of the variable resistance (RL) built into the sensor using an ohmmeter. After this measurement, RS can be determined using Equation (7):
V O = V C · R L R S + R L
So, manipulating (7) we have the following:
R S = V C V 0 · R L V 0
where the following hold:
  • RS is the surface resistance of the sensor at concentrations of various gases.
  • RL is the variable resistance.
  • VC corresponds to the input voltage (5V).
  • VO corresponds to the output voltage.
The value of R0 was defined within the developed firmware to ensure proper calibration of the sensor.
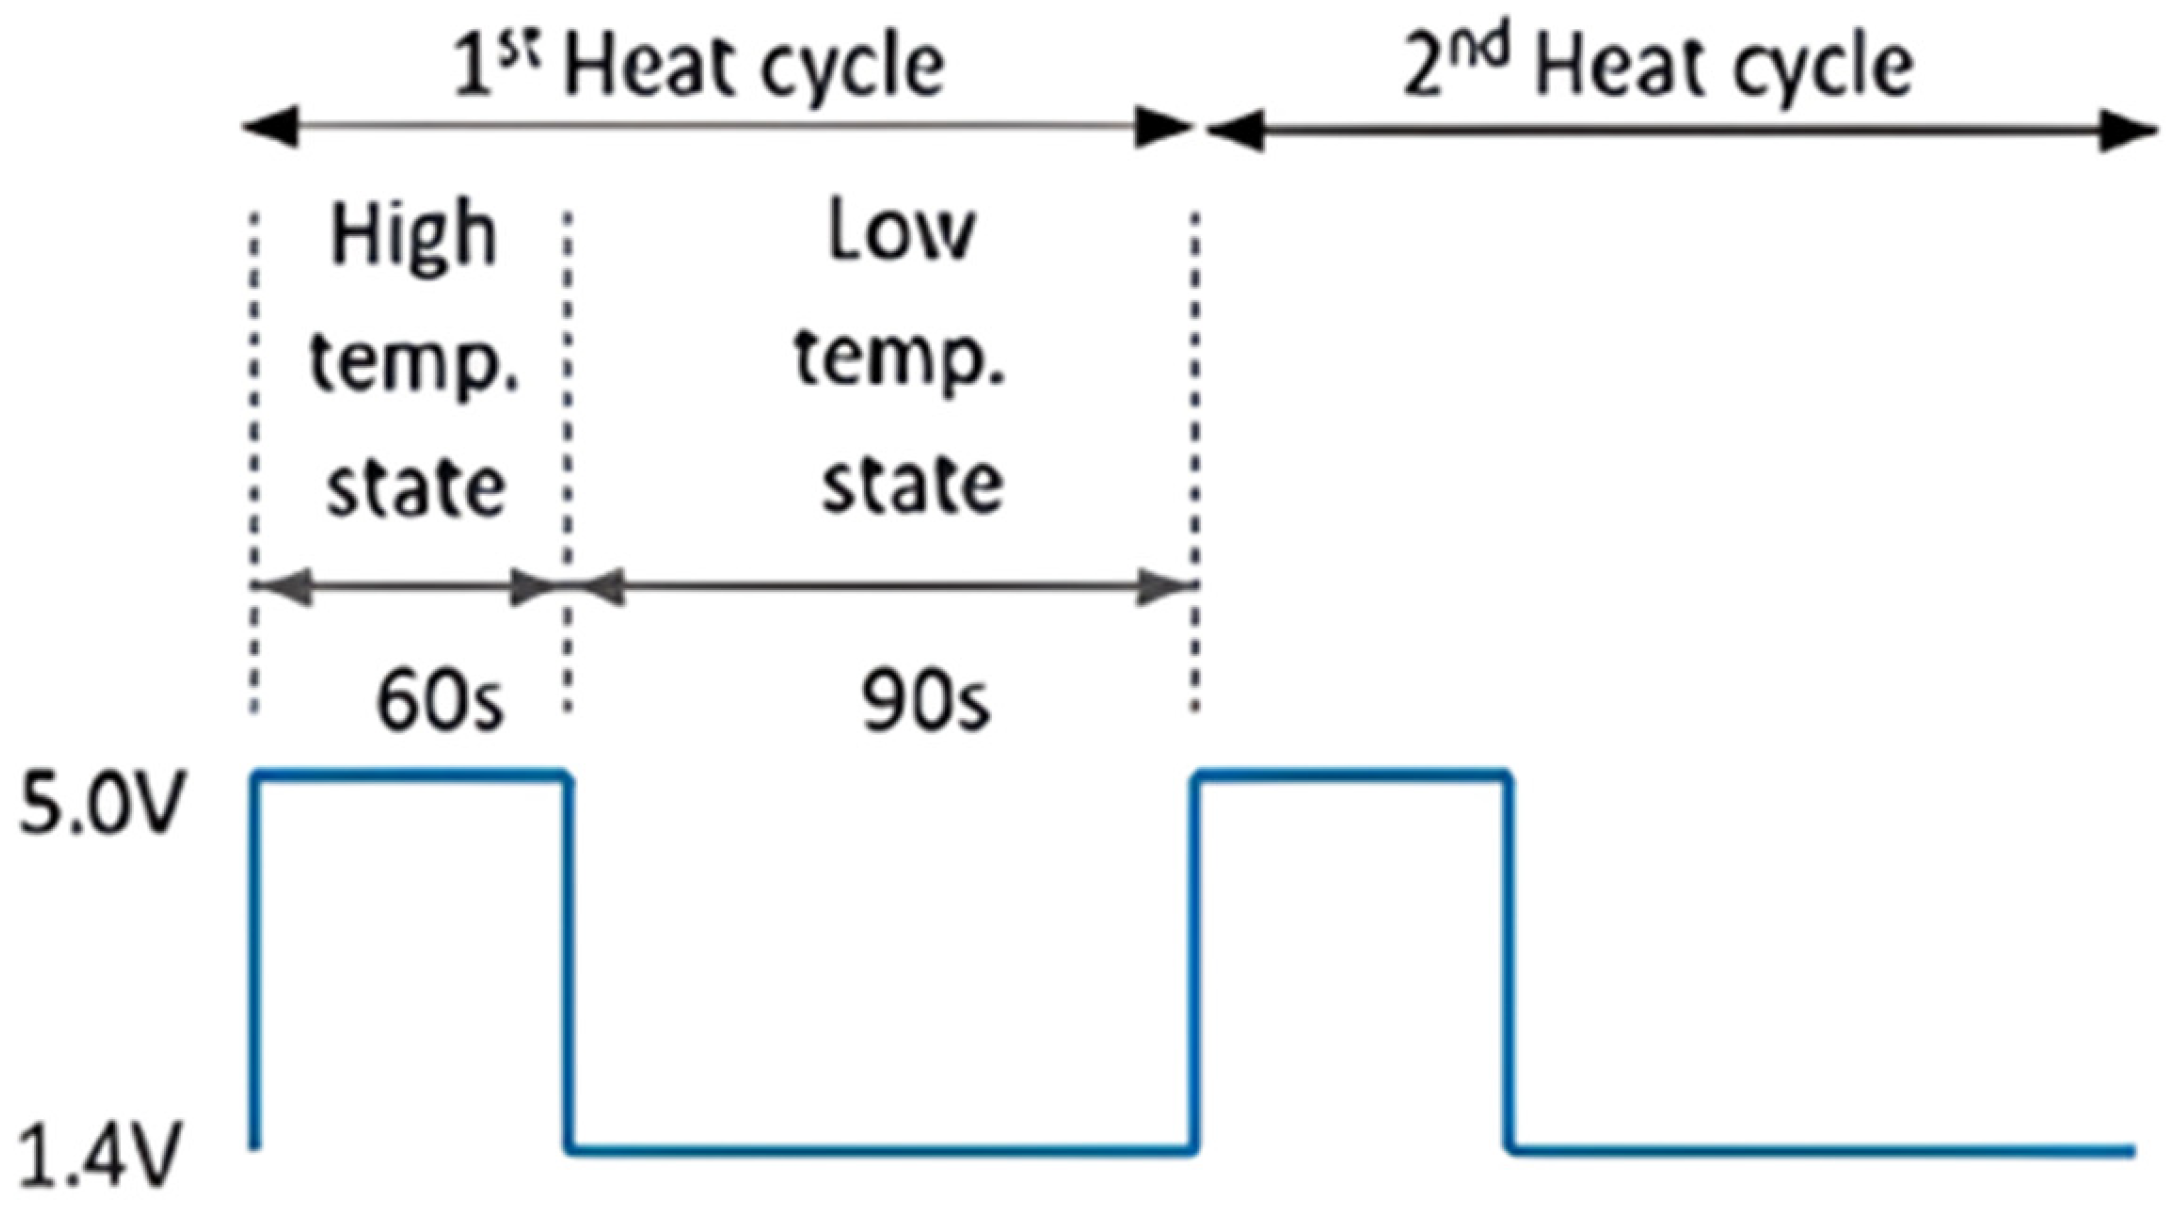
After calibration, there is one more specific feature of the sensor to consider. The internal resistance needs heating cycles to be implemented to collect the samples correctly. As illustrated in Figure 4, the heating cycles consist of alternating high-temperature and low-temperature states. Applying 1.4 V to the sensor for 90 s results in the low-temperature state, and it is in this state that the CO concentration is measured. The high-temperature mode involves applying 5 V to the sensor for 60 s to clear residues of absorbed gases.

3.1.3. LoRa Transceivers

LoRa technology was developed by the company Semtech [36]. This is the name given to a long-range wireless data technology that uses radio frequencies to transmit information between devices. LoRa uses CSS modulation [6,37], which, combined with different SF [6,37] and short bandwidths, enables it to meet the range specifications required for geographically distributed applications.
LoRa is ideal for applications that transmit small amounts of data with low bit rates. Data can be transmitted over a longer range compared to technologies such as WiFi, Bluetooth, or ZigBee. These features make the technology suitable for sensors operating at low power. From a technical point of view, LoRa supports the 433, 868, and 915 MHz frequencies, which are ISM frequency bands [6] reserved internationally for industrial, scientific, and medical use. In short, LoRa is a technology suitable for situations where long-range wireless communication is required, with low energy consumption, low cost, security, a low bandwidth, and no need for real-time data transmissions.
CSS is a spectral spreading technique that employs broadband linear frequency-modulated chirp pulses [6] for information-encoding. A chirp pulse is a signal in which the frequency increases (up-chirp) or decreases (down-chirp) over time.
The data transmission rate in the LoRa network is impacted by two factors: the Bandwidth (BW) of the channel used, and the SF used by the transmitting device. Depending on the region or frequency plan, LoRa allows for the use of channels with bandwidths of 125 kHz, 250 kHz, or 500 kHz. The spreading factor selected by the transmitting device affects the time needed to transmit data.
SF controls the chirp rate and, consequently, the speed of data transmission in LoRa communication. Lower spreading factors correspond to faster chirps and higher data rates, while each increment in SF halves the chirp modulation rate and the data transmission rate. However, lower SFs also reduce the transmission range by decreasing the processing gain and increasing the bit rate. Importantly, spreading factors are orthogonal, meaning that signals modulated with different SFs on the same frequency channel can coexist without interference, which helps conserve battery life. The network supports six spreading factors, ranging from SF7 to SF12. These factors affect the data rate, time on air (ToA), battery consumption, and receiver sensitivity. Essentially, the spreading factor determines the chirp duration: higher SFs produce longer chirps that carry more bits per chirp. ToA refers to the total transmission time of the channel. Additionally, the bandwidth (BW) parameter defines the frequency range used by the network. Equation (9) [6] details the nominal bit rate calculation, as follows:
R b = S F 4 4   +   C R 2 S F B W
where the following hold:
  • Rb is the nominal bit rate, shown in bits/s.
  • SF is the spreading factor from 7 to 12 (based on the environmental conditions between the communication device and the gateway).
  • BW is the modulation bandwidth in Hz.
  • CR (code rate) is (4/5, 4/6, 4/7 or 4/8).
The symbol period is given by
T S = 2 S F B W
ToA depends on the SF, BW, and payload size. The equation for the transmission time (ToA) of a LoRa frame is
T o A = T p r e a m b l e + T p a y l o a d
where the following hold:
  • T p r e a m b l e is the preamble transmission time.
  • T p a y l o a d is the payload transmission time.
Preamble transmission time, T p r e a m b l e , is given by
T p r e a m b l e = n p r e a m b l e + 4.25 · 2 S F B W
Payload transmission time, T p a y l o a d , is given by
T p a y l o a d = 8 + m a x ( N , 0 ) · C R + 4 B W · 2 S F
where the following hold:
  • N = 8 · P L 4 · S F + 28 + 16 20 · H 4 · S F 2 · D E .
  • P L is the payload size in bytes.
  • H is the header (0 explicit and 1 implicit).
  • D E is the low data rate optimization (1 for SF11 or SF12 and 0 for the other SFs).
Reducing the SF or decreasing the payload size directly reduces the ToA, decreasing the time the radio is on, which results in lower energy consumption. The energy consumed by a LoRa node during transmission is as follows:
E = P t x · T o A
Since ToA increases exponentially with the spreading factor (SF), using a higher SF results in significantly greater energy consumption. Therefore, selecting the lowest possible SF reduces transmission time and, consequently, conserves energy. However, collisions or packet losses may require retransmission, which increases overall power usage. If the packet loss rate is denoted by P_loss, then the total energy consumption can be expressed as follows:
E t o t a l = E · 1 + P l o s s
where Ploss depends on network congestion and interference. Reducing collisions and retransmissions minimizes Ploss, decreasing the network’s energy consumption. Therefore, the following hold:
  • Lower SF → lower ToA → lower E → less energy consumption.
  • Smaller payload → lower ToA → less consumption.
  • Fewer retransmissions → lower Ploss → greater energy efficiency.
The preamble begins with a sequence of constant upchirps that cover the entire frequency band. The last two upchirps encode the synchronization word. The word consists of 1 byte and is used to differentiate between LoRa networks operating on the same frequency bands. This synchronous word is followed by two downchirps and a fourth downchirp, with a duration of 2.25 symbols. The total duration of this preamble can be set between 10.25 and 65,539.25 symbols [38,39].
Following the preamble, the packet header is defined, consisting of the coding rate and payload size information, which together occupy 2 bytes. This is followed by the Cyclic Redundancy Check (CRC) header used for error detection.
Finally, there is the plot data, and at the end of the information there may be another field called the CRC payload, which, in this case, was not defined. Figure 5 shows how the physical network used in this work’s LoRa communication was constructed.
To clarify and detail this plot, a more detailed description of its various fields is given below.
Preamble: The preamble contains eight symbols, which were previously defined by default; to this value, the two symbols (synchronous word) mentioned above are added. The 2.25 downchirps are added to these, giving the preamble a total of 12.25 symbols.
Header and Header CRC: The header contains information on the total size of the payload. This field takes up 1 byte; the CRC definition is added to this, which, in this case, is 4/5, making the header a total of 2 bytes. The CRC header contains the error detection code, which is the same size as the header, so the CRC header has 2 bytes.
Payload: The payload contains the data transmitted over the network, which, in this experiment, consisted of 40 bytes. This payload contains the information provided by this experiment’s constituent sensors, and its order is described as follows:
Temperature|Humidity|Wind Velocity|Air Quality—PM2.5|Air Quality—PM10|CO.
Given the above order, the temperature and humidity fields occupy a total of 8 bytes and are separated by a pipe; for example, 23.2|91|(4 + 1 + 2 + 1 bytes). The fields associated with wind velocity readings occupy 4 bytes; for example, 09.1| (4 + 1 bytes). The PM2.5, PM10, and CO air-quality reading fields are always 6 bytes each (with a total of 9 bytes each); for example, 120.31|(6 + 1 bytes).
It can therefore be concluded that the data sent by the LoRa node is 40 bytes.
That said, it is important to consider two important metrics for assessing signal quality in the LoRa network: RSSI and SNR.
The Received Signal Strength Indicator (RSSI) is a relative measure that helps determine whether the received signal is strong enough to achieve good wireless communication from the transmitter [39,40]. As LoRa supports two-way communication, RSSI is an important measure for gateways and end devices. RSSI is measured in dBm, and the closer the value is to zero, the stronger the signal received.
In addition to the transmitter’s output power, the following factors influence RSSI:
  • Attenuation in free space, obstacles, and vegetation.
  • Antenna gain.
Signal-to-Noise-Ratio (SNR) is the ratio between the received signal power and the noise level and is used to determine the quality of the received signal [40].
This can be calculated using the following equation and is usually expressed in dB:
S N R d B = P R X d B m P N O I S E [ d B m ]
A positive SNR means that the signal power is greater than the noise power, i.e., the receiver will be able to demodulate the signal. If the RSSI is below the noise level, it is impossible to demodulate the signal. However, LoRa can demodulate signals that are below the noise level.
In a LoRa network, RSSI and SNR are important because the technology is designed to work in environments with high signal interference and noise and for this reason, the quality of the signal can vary greatly, depending on factors such as distance, obstacles, and atmospheric conditions. Based on standard LoRa [39] parameters (Tx power 14 dBm; Rx sensitivity −130 dBm; antenna gain 2 dBi), the theoretical communication range can exceed 10 km in LOS conditions, though real-world performance is terrain-dependent.
Two RFM95 transceivers were used to establish communication between the node and the gateway: one in the node and one in the gateway. RFM95 is a transceiver that allows the user to send data and enables transmission in multiple modes, working at a frequency of 868 MHz, thus supporting the LoRa networks’ spread spectrum technology and supporting I/O voltage values of 3.3 V.

3.1.4. Power Supply

The IoT node is powered by a solar energy setup created to ensure autonomy and sustainability in remote or difficult-to-access places without electricity. The system consists of a 3-watt solar panel measuring 138 mm by 160 mm, supplied by Arrow Electronics [41]; this typically has 5.5 V and 540 mA, which makes it compatible with low-energy applications such as IoT. This power supply circuit includes a load-manager module responsible for directing the energy flow between the solar panel, battery, and IoT node. Its main function is to ensure a stable voltage is carried to the load while protecting the battery from overcharging or deep discharge, thereby extending battery lifespan and system reliability.
The energy coming from the solar panel and its distribution to the load are managed by a Lithium Polymer (LiPo) Rider Pro module from Seeedstudio [42]. The module outputs 5 V in all conditions, irrespective of whether the energy source is a solar panel or a USB port. It supports a maximum output load of one ampere and integrates an algorithm to manage the charging and discharging of the lithium polymer battery, whether by solar or USB. There are also two USB ports on the mainboard, so the system can be programmed while the battery is charged, a feature which is useful during development or maintenance.
The power pack comprises a high-energy-density lithium polymer battery [43] that consists of three cells connected in series, providing a total capacity of 6000 mAh (6 Ah) at a nominal voltage of 11.1 V. A single cell has a nominal voltage of 3.7 V with a capacity of 2000 mAh. The standard two-pin Japan Solderless Terminal (JST) connector has a 2.0 mm pin spacing, making it easy to hook the battery up to the power management module. Such a power supply ensures that the IoT node runs uninterrupted, even under varying solar insolation conditions, providing the kind of reliability and robustness expected of environmental monitoring, precision agricultural applications, etc. With an average current drawing of ~50 mA and a 6600 mAh battery, the system can operate autonomously for over 5 days without sunlight. The solar panel recharges the battery at ~500–700 mAh/day under normal conditions.

3.1.5. Monitoring System

To make the reception of sensor data more intuitive and facilitate the processing and visualization of this information, a solution was developed using Node-RED in conjunction with Raspberry Pi. Node-RED is a virtual development platform that allows data flows to be created simply and intuitively, making it ideal for IoT projects. Using suitable libraries, it was possible to establish a connection between the Arduino and the Raspberry Pi. In addition, it was necessary to install the MQTT library [44].
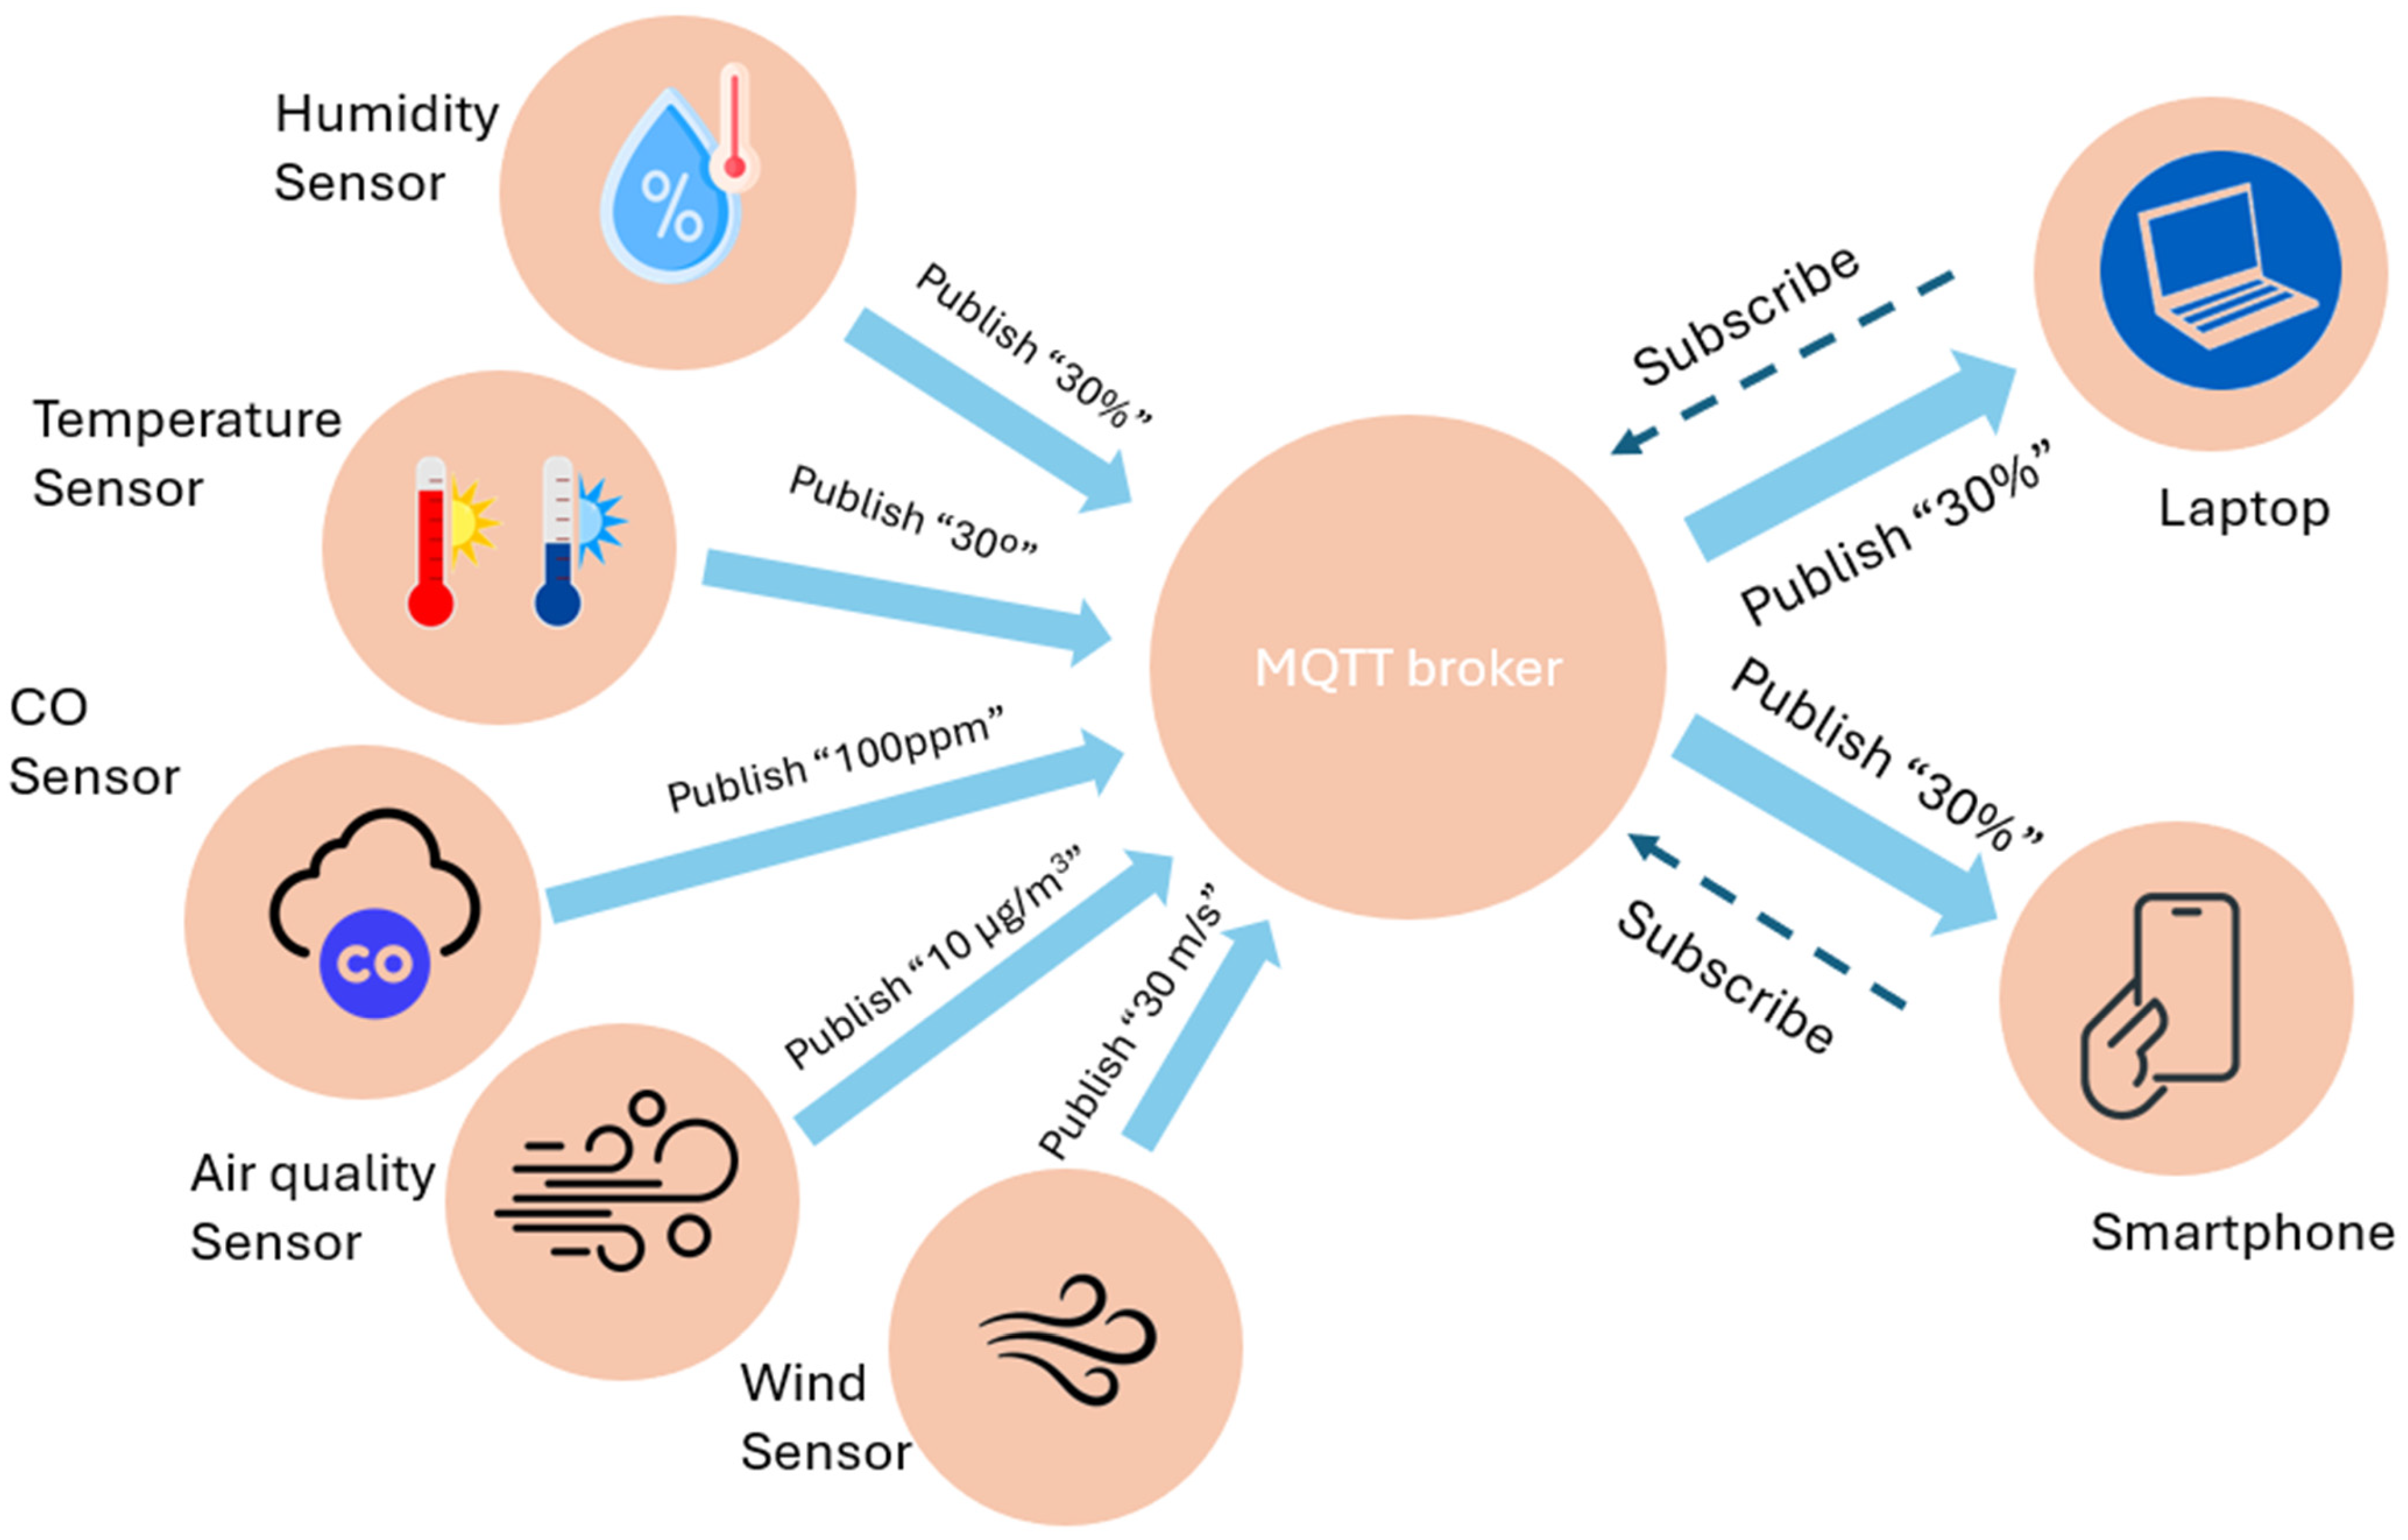
MQTT is a protocol that aims to provide connectivity for IoT environments and machine-to-machine communications, loosely translated from the M2M concept. This protocol was designed to be extremely lightweight and to operate with low energy consumption and minimal data packets, in addition to efficiently distributing information to one or more receivers, making it ideal for mobile applications and situations where energy consumption and limited processing resources are critical points of the operation. This protocol was designed to work on the publish/subscribe principle for transporting messages, as illustrated in Figure 6. This concept consists of connecting several clients to a central element, called a broker. To receive messages from certain areas, topics and hierarchical divisions of subjects are subscribed to, which is the principle responsible for optimizing the delivery of one-to-one or one-to-many messages. The broker functions as an interface that connects everyone on the network. Its mode of operation makes it easy for new sensors to join the network without the need to create a topic, since the broker organizes them by hierarchy, using a slash as a separator, similarly to the organization of folders in commercially available operating systems. For example, in a network of temperature sensors, divided into areas of a house, the temperatures collected can be published in the following topic: sensors/area1/temperature/sensor1. MQTT is a lightweight protocol designed to provide connectivity in IoT environments and machine-to-machine (M2M) communications. It operates with low energy consumption and minimizes the data packet size, making it ideal for mobile applications and scenarios where energy-efficiency and limited processing power are critical. MQTT uses a publish/subscribe model for message transport, as illustrated in Figure 6. In this model, multiple clients connect to a central broker, which manages message distribution. Clients subscribe to specific topics—organized hierarchically—to receive relevant messages, optimizing one-to-one or one-to-many communication. The broker acts as an interface connecting all network participants and simplifies the addition of new sensors without requiring manual topic creation. Topics are structured using slashes as separators, like folder organization in operating systems. For example, temperature data from sensors in different areas of a house might be published under the following topic: sensors/area1/temperature/sensor1. If any other device wishes to obtain this information, the customer must subscribe to the topic.
A 7-inch TFT display [34] was used for the graphical representation of the data.
In the current prototype, a pure LoRa point-to-point communication model was adopted to ensure full control over transmission parameters and reduce overhead during the system’s experimental validation. However, it is acknowledged that this setup does not include built-in encryption or advanced authentication mechanisms. For large-scale and mission-critical deployments, transitioning to a LoRaWAN-based architecture would provide improved robustness and security, including AES-128 encryption, device authentication, and network-level integrity verification. Future iterations of the system are expected to integrate these features to enhance data confidentiality and communication resilience in real-world environments.

3.2. Hardware Integration

Initially, to create a suitable physical structure for the project, the different structures were technically designed using AutoCAD software, 2025 version [45] as a design tool. These structures were developed to accommodate and organize the project’s components, providing a safe and functional environment for the system.
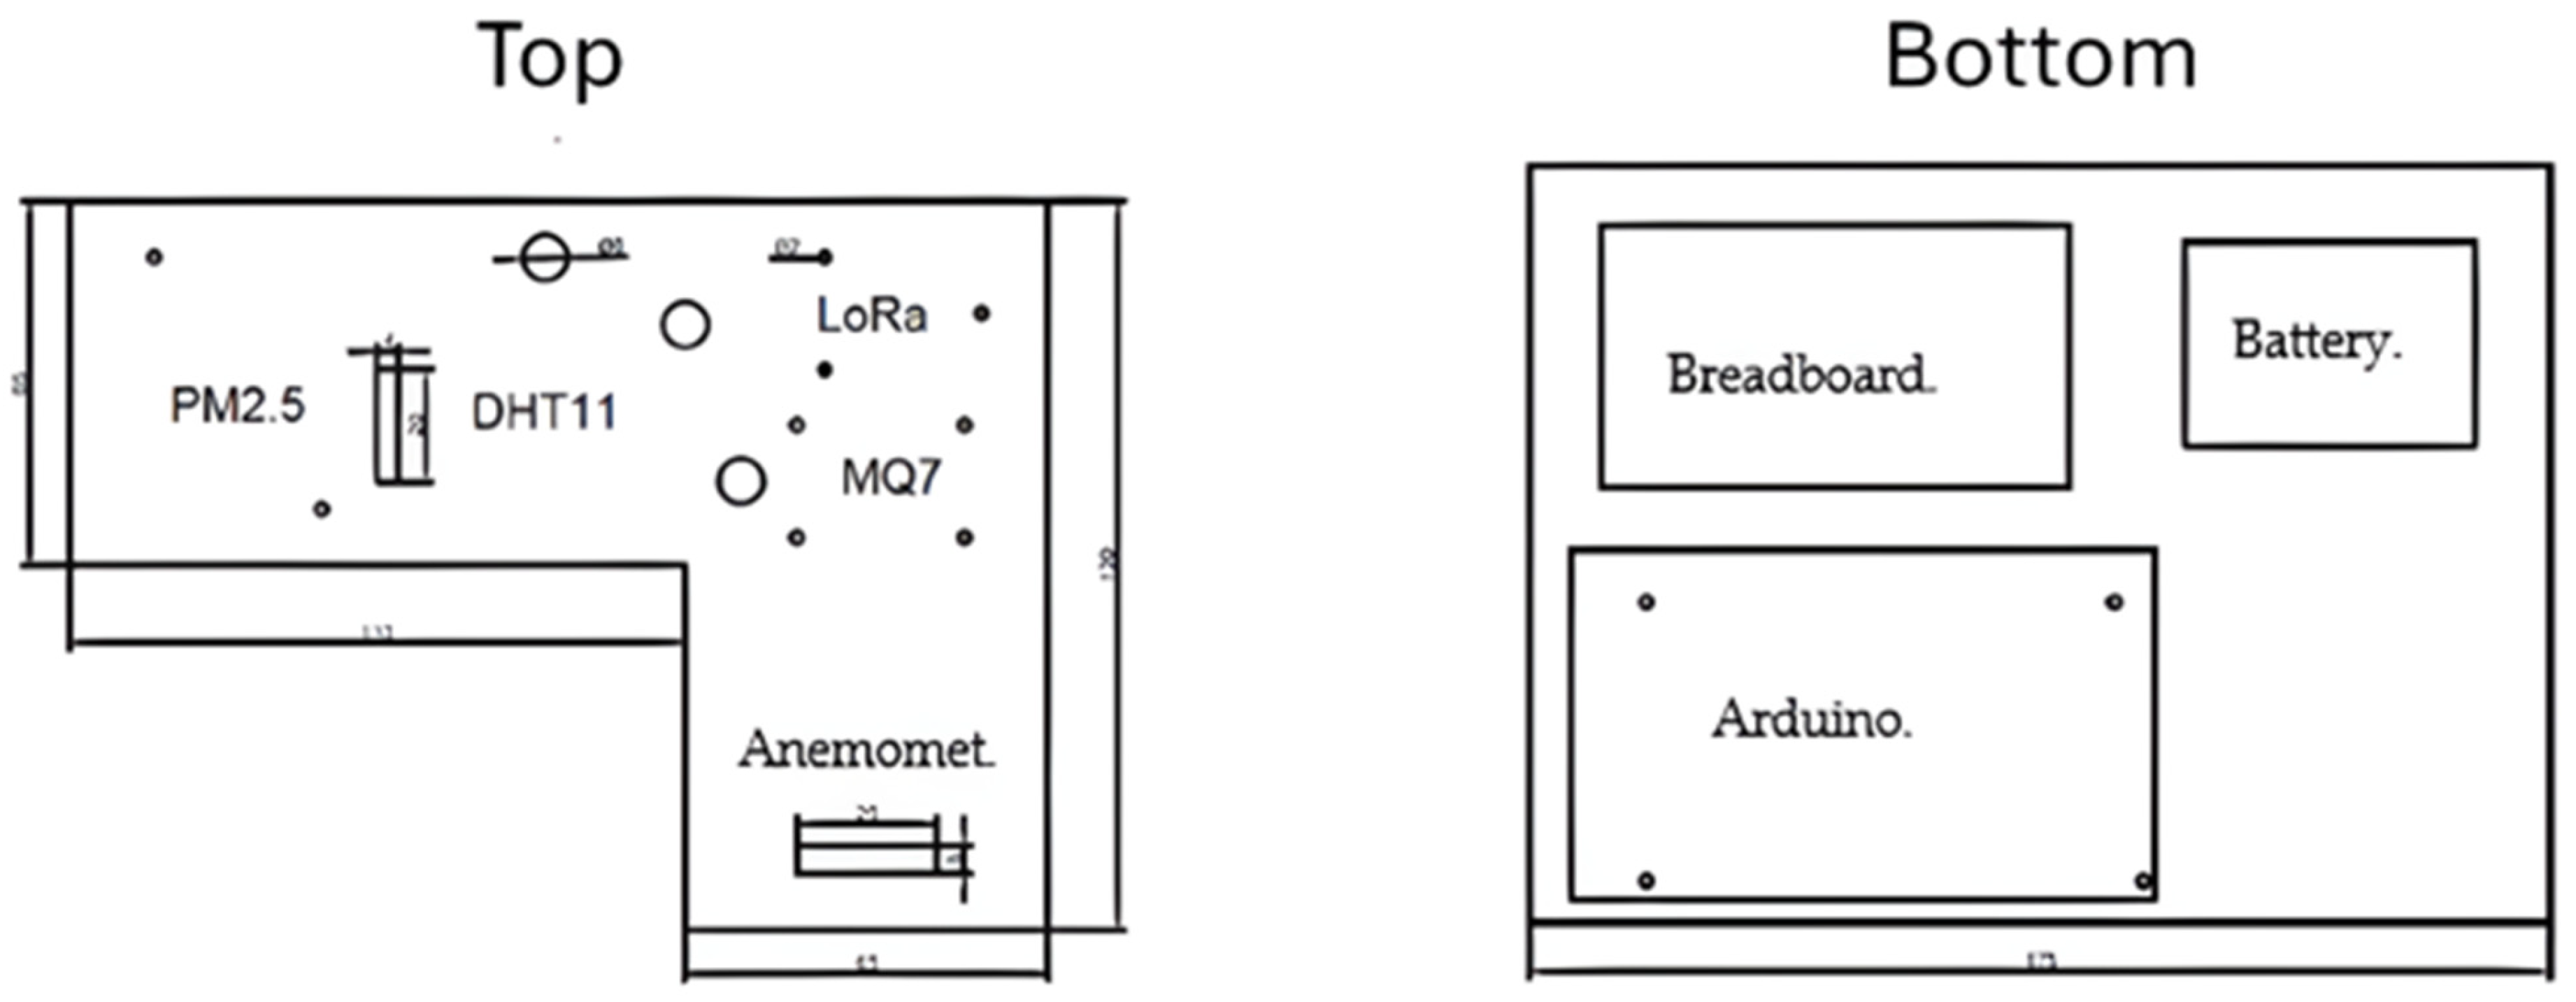
The first structure was the sender node. This was the most complex because it must accommodate several sensors, a microcontroller, a breadboard, and a battery. Figure 7 shows how the sensors, Arduino, breadboard, and battery were installed.
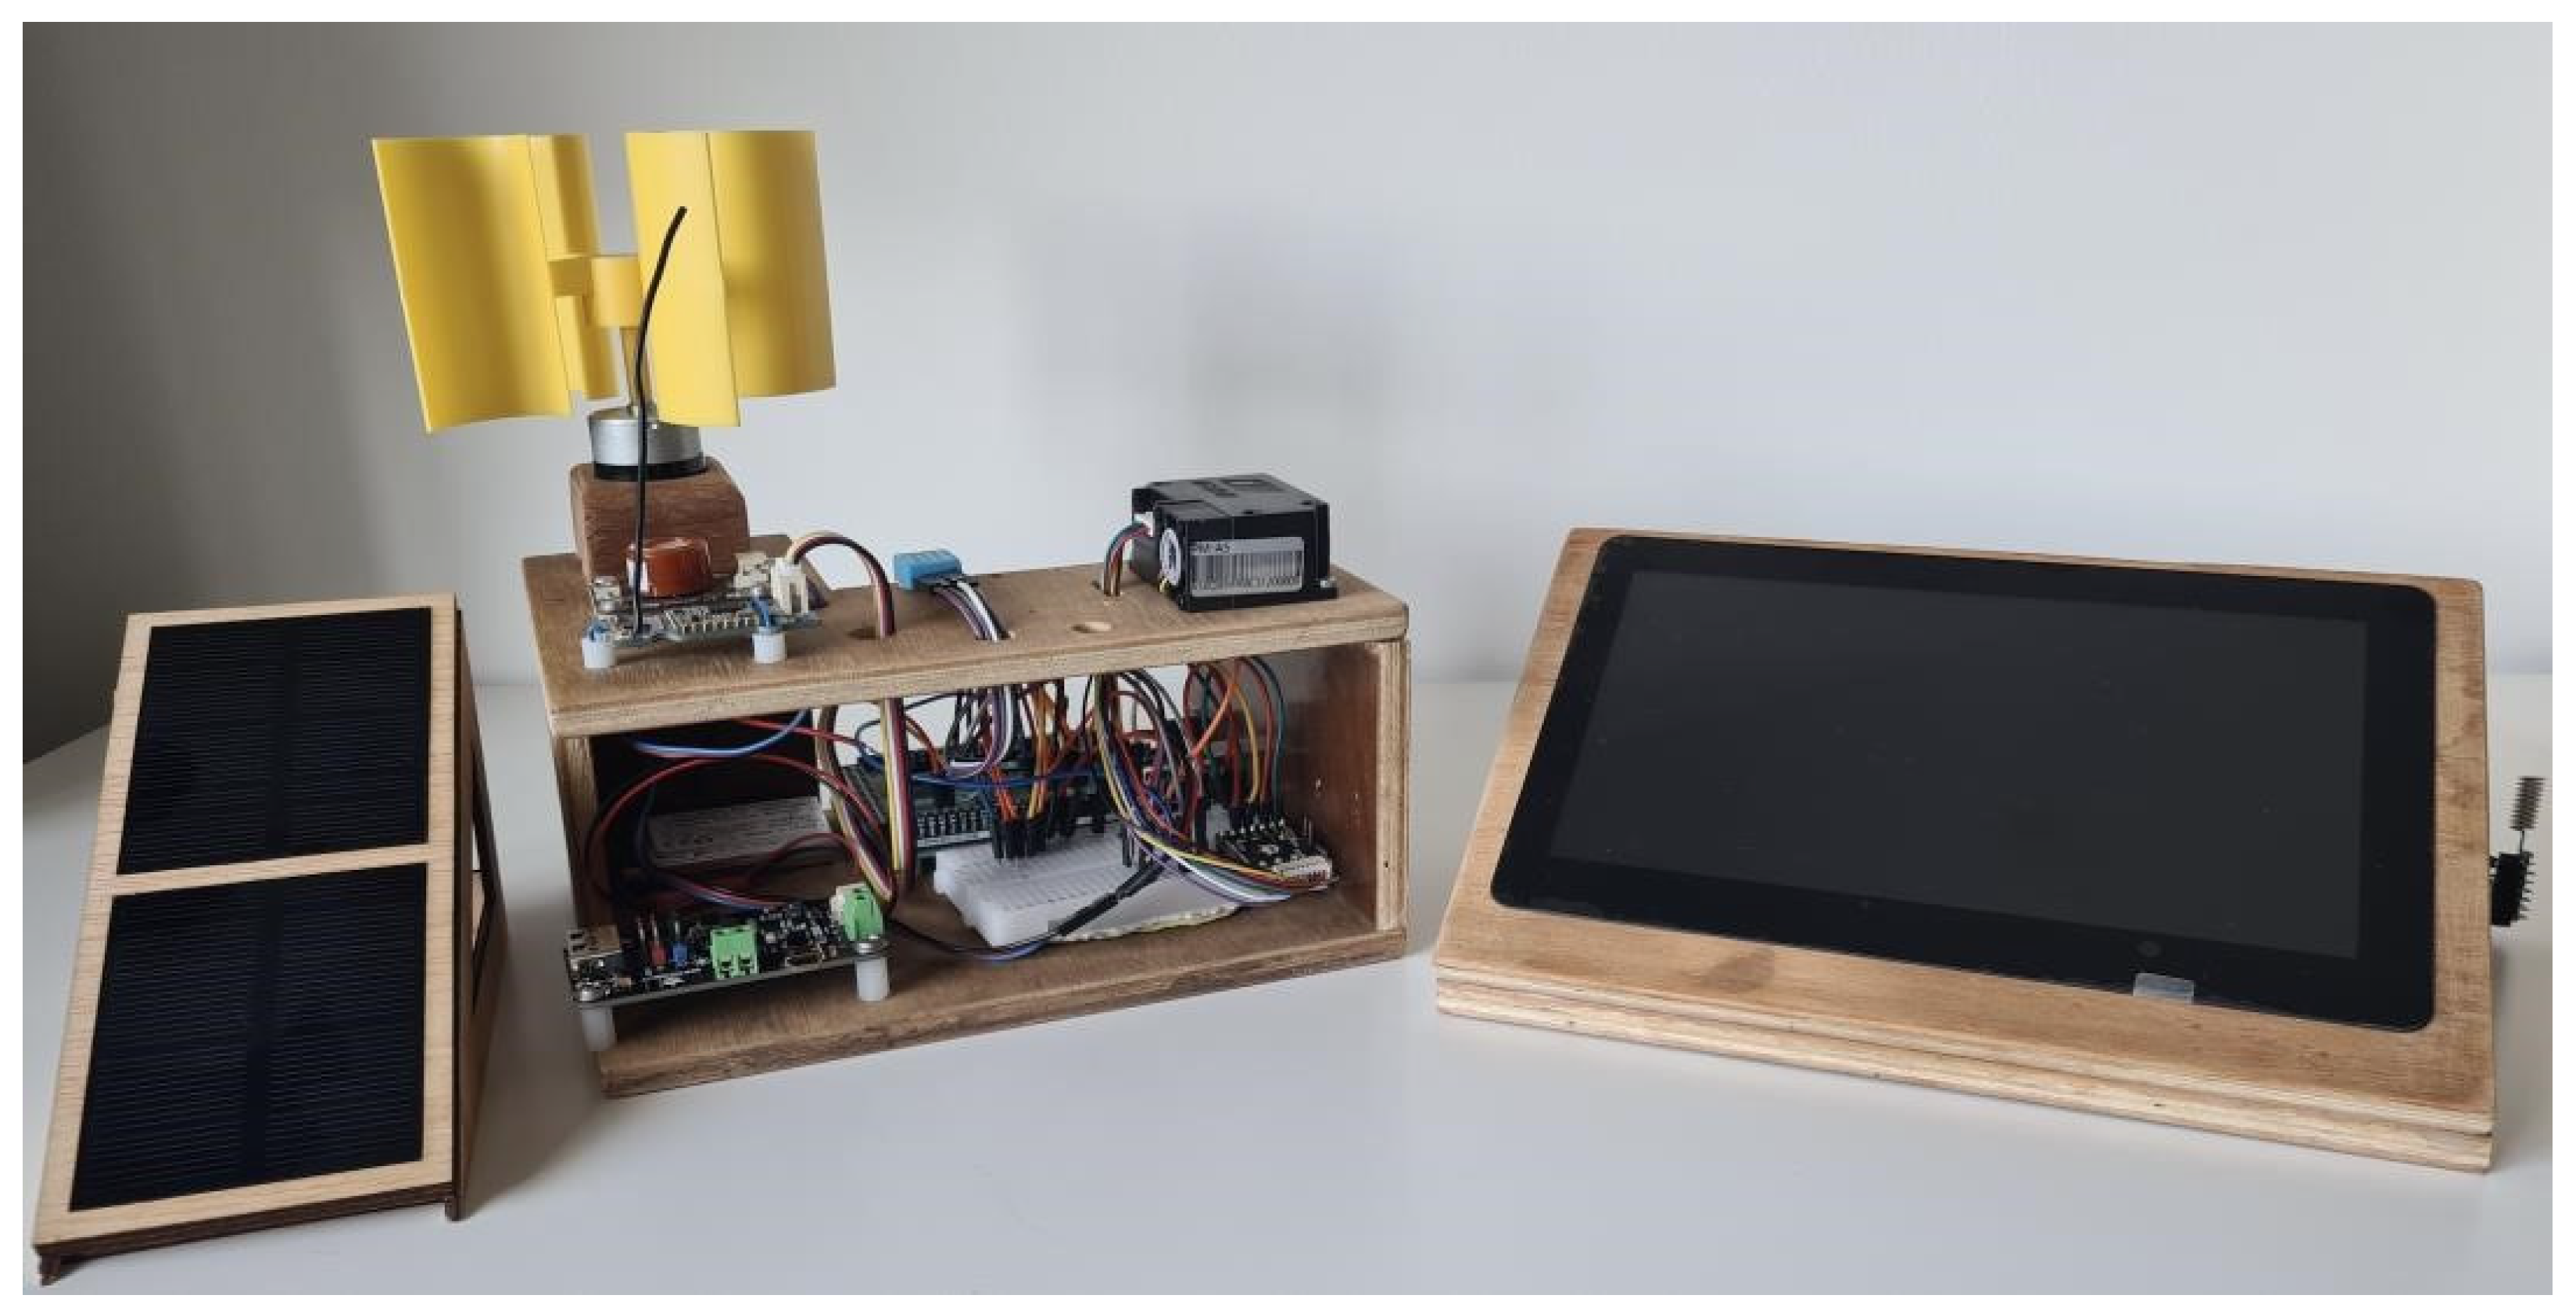
Figure 8 illustrates the final prototype’s physical setup, featuring both the IoT node and the gateway.

3.3. Algorithms Developed

To determine the fire risk status, rule-based logic is used, based on the commonly known 30-30-30 criterion. The IoT node checks whether at least two out of the three conditions are met: ambient temperature ≥ 30 °C, relative humidity ≤ 30%, and wind speed ≥ 30 km/h. This conditional strategy helps avoid false positives due to isolated anomalies. Furthermore, the system incorporates basic validation to reject sensor readings that fall outside predefined physical limits (e.g., negative wind speeds, temperature readings <−10 °C or >60 °C). While advanced anomaly detection techniques (e.g., Kalman filters or machine learning-based fusion) are not yet implemented, these are planned as part of future work.
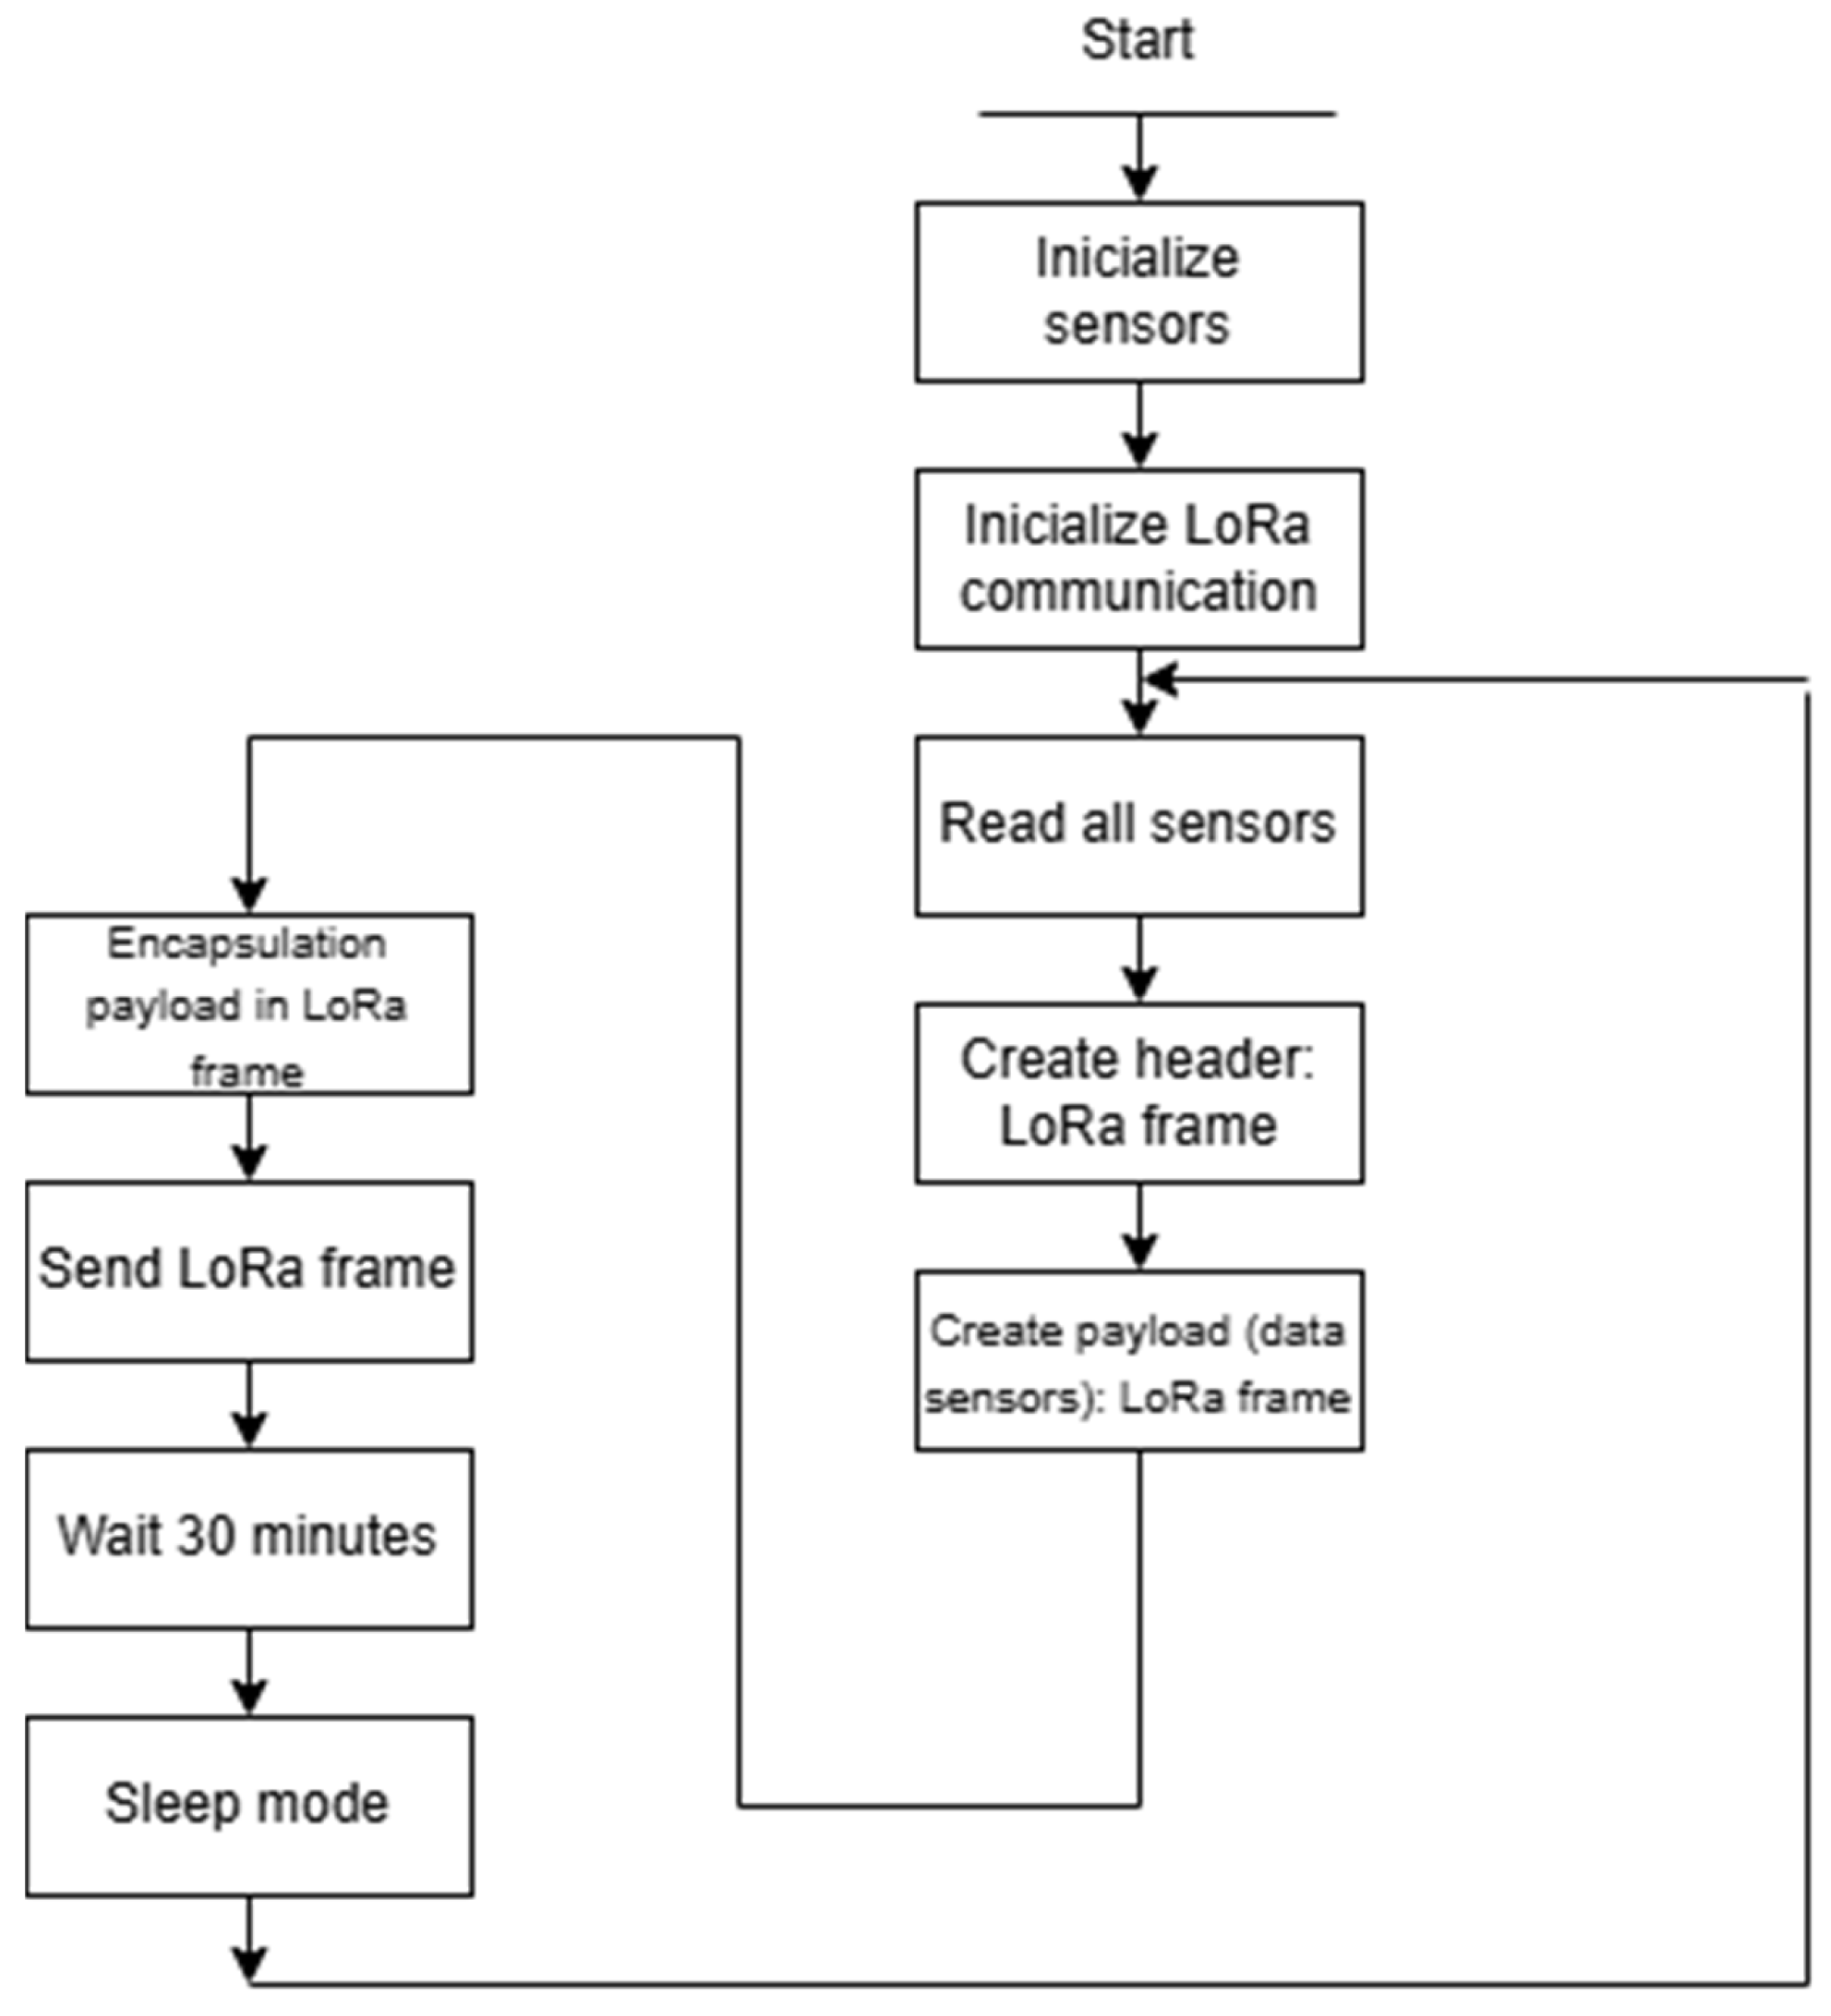
Firmware was developed in the C programming language for the MCU used within the IoT-Edge node; the operational flow of the IoT-Temp node is illustrated in Figure 9.
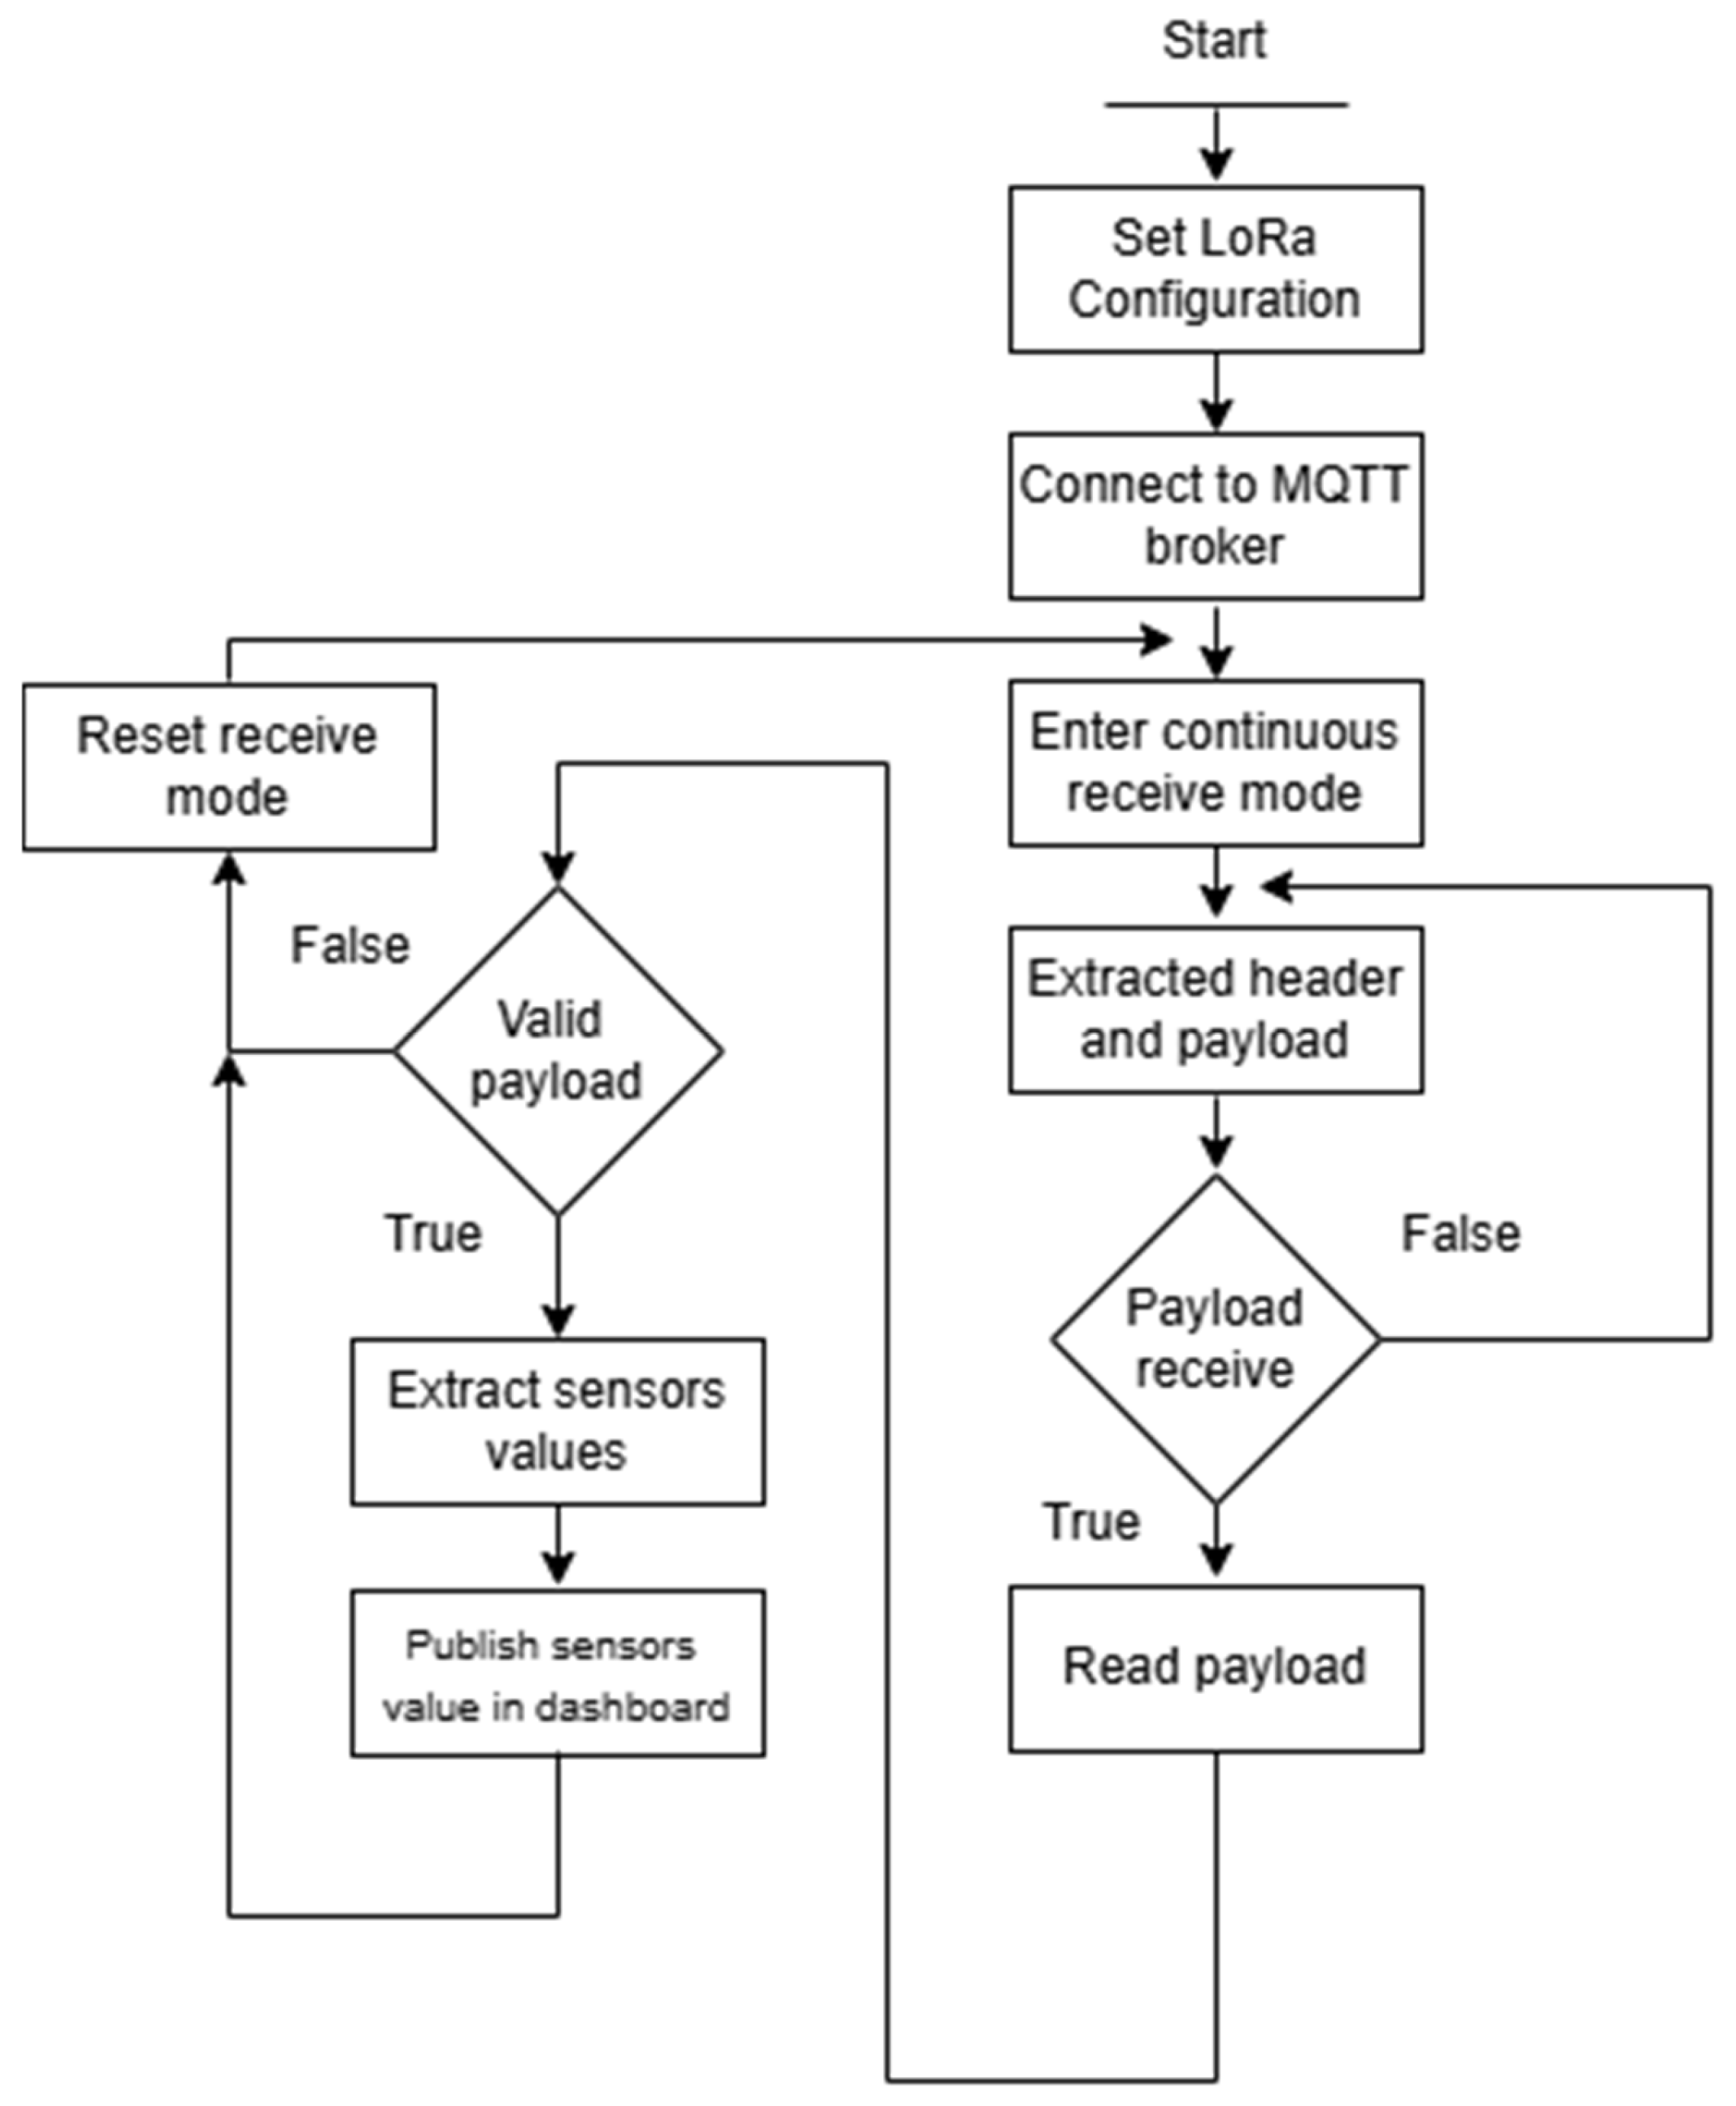
The firmware for the gateway was developed using the Python programming language (Python 3.13.5 version) and deployed on a Raspberry Pi 3. The operational flow of the IoT-Edge node is depicted in Figure 10.
Algorithm 1 represents the firmware developed for the IoT node, and Algorithm 2 represents the firmware developed for the gateway.
Algorithm 1: IoT node
   FUNCTION Setup
   Configure I/O pins
   Initialize Air Quality Sensor
   Initialize CO sensor
   Initialize DHT sensor
   Configure LoRa modem parameters
   Initialize LoRa Communication
   END_FUNCTION
   FUNCTION Loop
   Get current time in milliseconds
   IF 30 min have passed since last data transmission THEN
   REPEAT
   Read Air Quality Sensor
   UNTIL data is valid
   Read analog value from anemometer
   Convert analog reading to voltage
   Calculate wind velocity in m/s
   Read temperature and humidity from DHT sensor
   IF MQ07 heating cycle not yet executed THEN
   Turn ON MQ07 sensor (heating) for 60 s
   Turn OFF MQ07 sensor (cooling) for 90 s
   Set MQ07 heating cycle flag to TRUE
   END_IF
   Read analog value from MQ07 sensor (CO)
   Reset MQ07 heating cycle flag to FALSE (for next loop)
   Read PM2.5 and PM10 PM100 values from Air Quality sensor
   Compose data string: temperature, humidity, wind velocity, MQ07 ppm,     PM2.5, PM10
   Send data via LoRa module
   Wait for transmission to complete
   Update last transmission timestamp
   END_IF

   Enter low-power sleep mode (IDLE)

END_FUNCTION
Algorithm 2: Gateway
   IMPORT necessary modules:
   INITIALIZE LoRa board configuration
   DEFINE class LoRaReceiver (inherits from LoRa):
   METHOD Constructor:
   - Call superclass constructor
   - Set LoRa module to SLEEP mode
   - Configure digital IO mapping

   - Set MQTT broker IP address
   - Set MQTT topic
   - Create MQTT client instance
   - Define callback for MQTT connection
   METHOD on_mqtt_connect:
   - Subscribe to the predefined MQTT topic
   METHOD on_rx_done:
   - Clear IRQ flags for RxDone event
   - Read received payload from LoRa (raw bytes)
   - Clean payload string (remove non-printable characters)
   - Split cleaned payload by comma (expect 5 values)
   IF the payload has at least 6 values:
   - Extract and clean:
   - Temperature
   - Humidity
       - Wind velocity
   - CO value
   - PM10
   - PM2.5
   ELSE:
   - Print “Invalid payload” with the raw string
   - Set LoRa mode to SLEEP
   - Reset receive pointer
   - Set LoRa to continuous receive mode (RXCONT)
   METHOD start:
   - Connect MQTT client to broker
   - Start MQTT background loop
   - Reset LoRa RX pointer
   - Set LoRa to continuous receive mode
   LOOP forever:
   - Sleep for 0.5 s
   - Get current RSSI value
   - Get modem status
   - Flush output buffer
   Main Program Execution
   CREATE instance of LoRaReceiver
   SET LoRa configurations:
   TRY:
   CALL start() method on LoRaReceiver instance
   CATCH KeyboardInterrupt:
   - Print interruption message
   FINALLY:
   - Set LoRa to SLEEP mode

4. Results

In Section 4.1, we present the tests carried out to verify the efficiency, reliability, and operating capacity of the system in different scenarios and situations. In Section 4.2, we write about the energy consumption of the IoT node.

4.1. Experiment Scenarios

We tested our system in different scenarios, which are explained in the manuscript. Through these tests, it was possible to obtain objective data and analyze the behavior of the components, sensors, and communication in different environmental and operating conditions. The results obtained in these tests provide a comprehensive view of this experiment’s performance and serve as a basis for possible improvements and optimizations.

4.1.1. Results from DHT11 Sensor

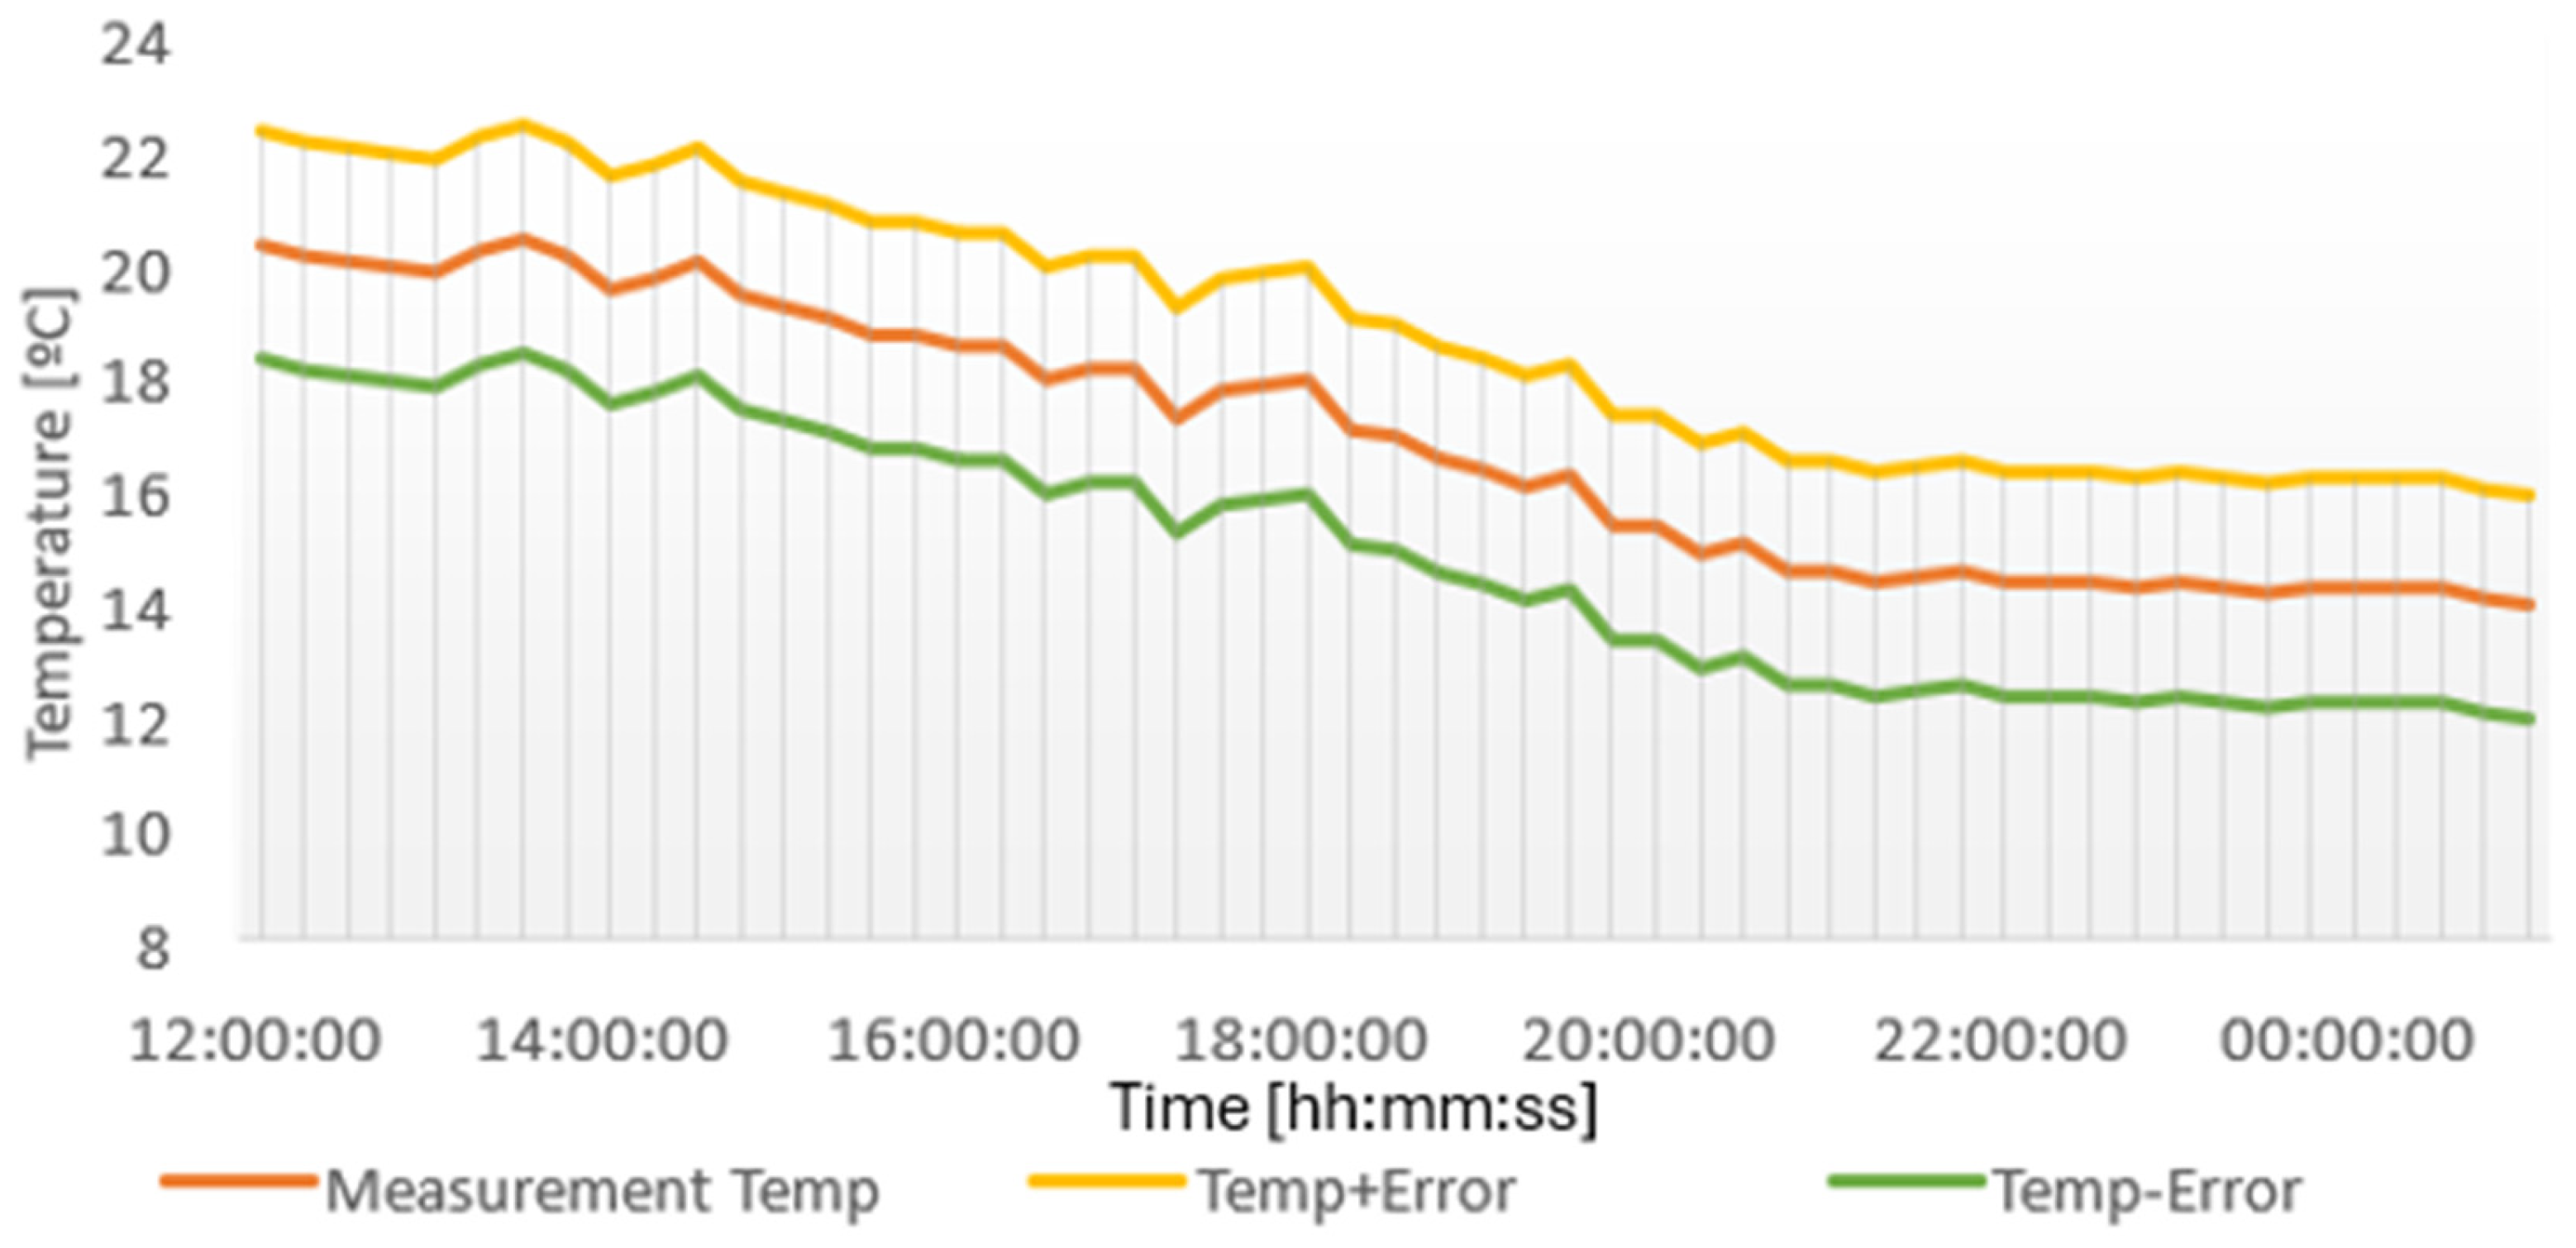
To prove the reliability of the chosen temperature sensor, the data collected by the DHT11 was recorded on 13 and 14 May 2025 for 13 h, at the highest point of the Montejunto Mountains, in the municipality of Cadaval, Alenquer, Portugal. The system was configured to take a measurement every 15 min. Figure 11 shows the temperature values measured during the test, considering the sensor’s margin of error. The maximum temperature recorded on this test day was 23 °C. These values can be considered satisfactory compared to those collected by the nearest weather station, as shown in Table 2.
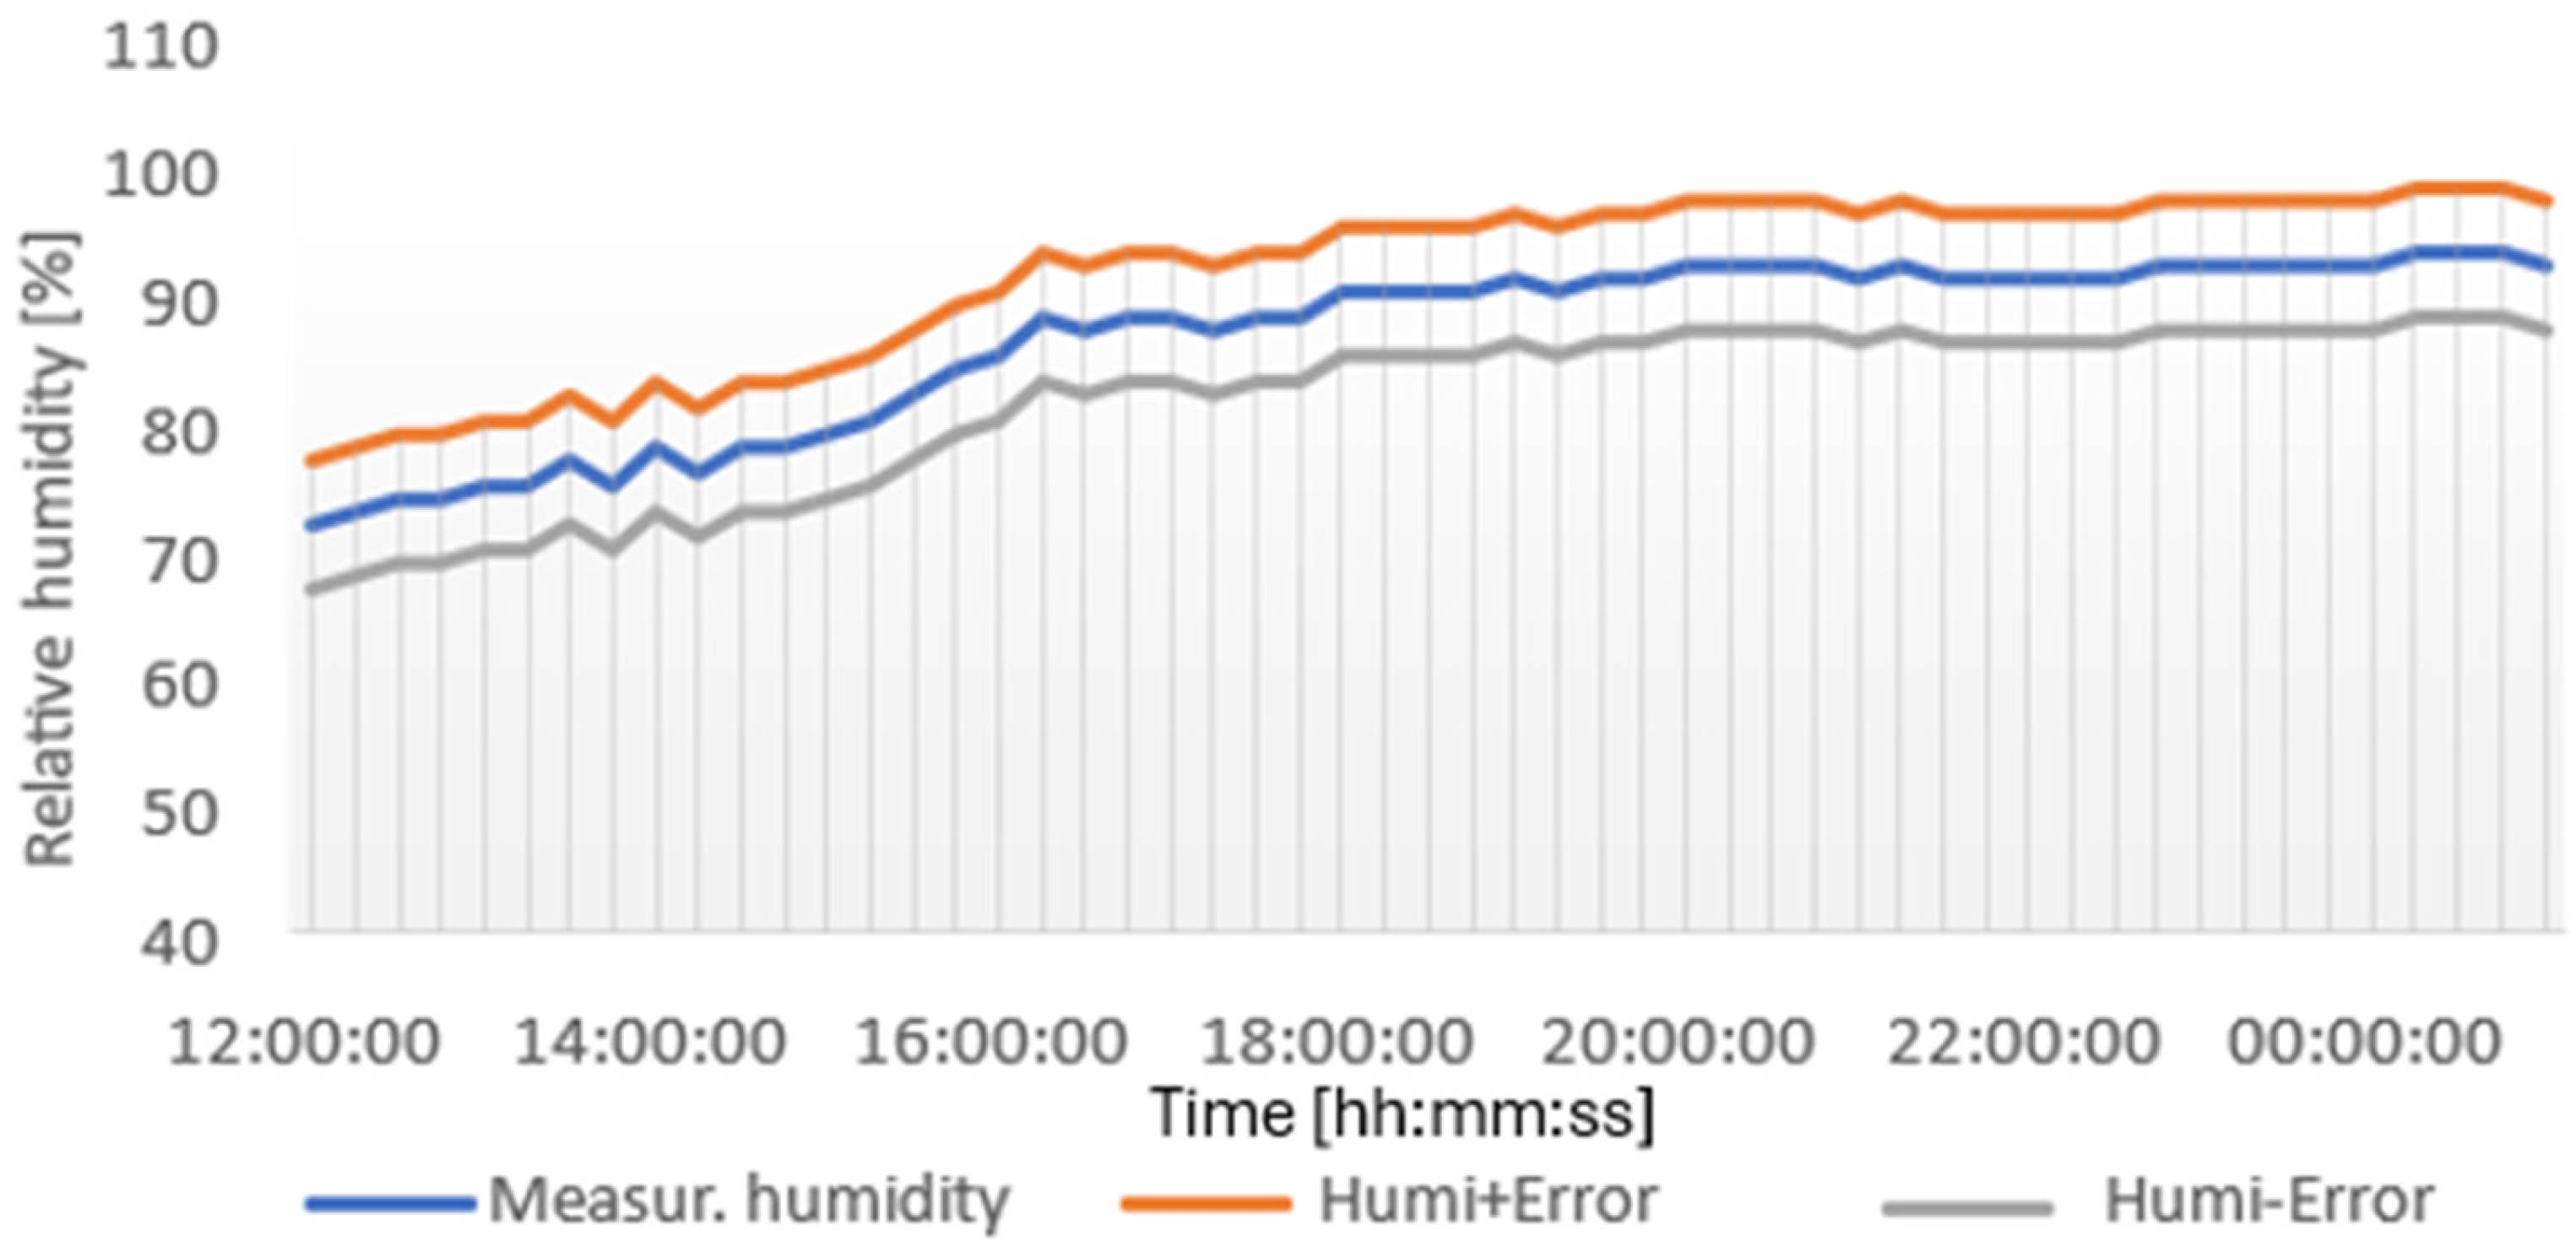
The evaluation was also positive for the relative humidity samples collected by the sensor. As can be seen in Figure 12, the relative humidity data collected by DHT11 had a maximum of around 90%, while the station’s highest value was 95%, within the sensor’s margin of error. The DHT11 temperature readings showed a typical deviation of ±1.5 °C compared to a reference station, with minimal short-term variability under stable conditions.

4.1.2. Results from CO (MQ7 Sensor)

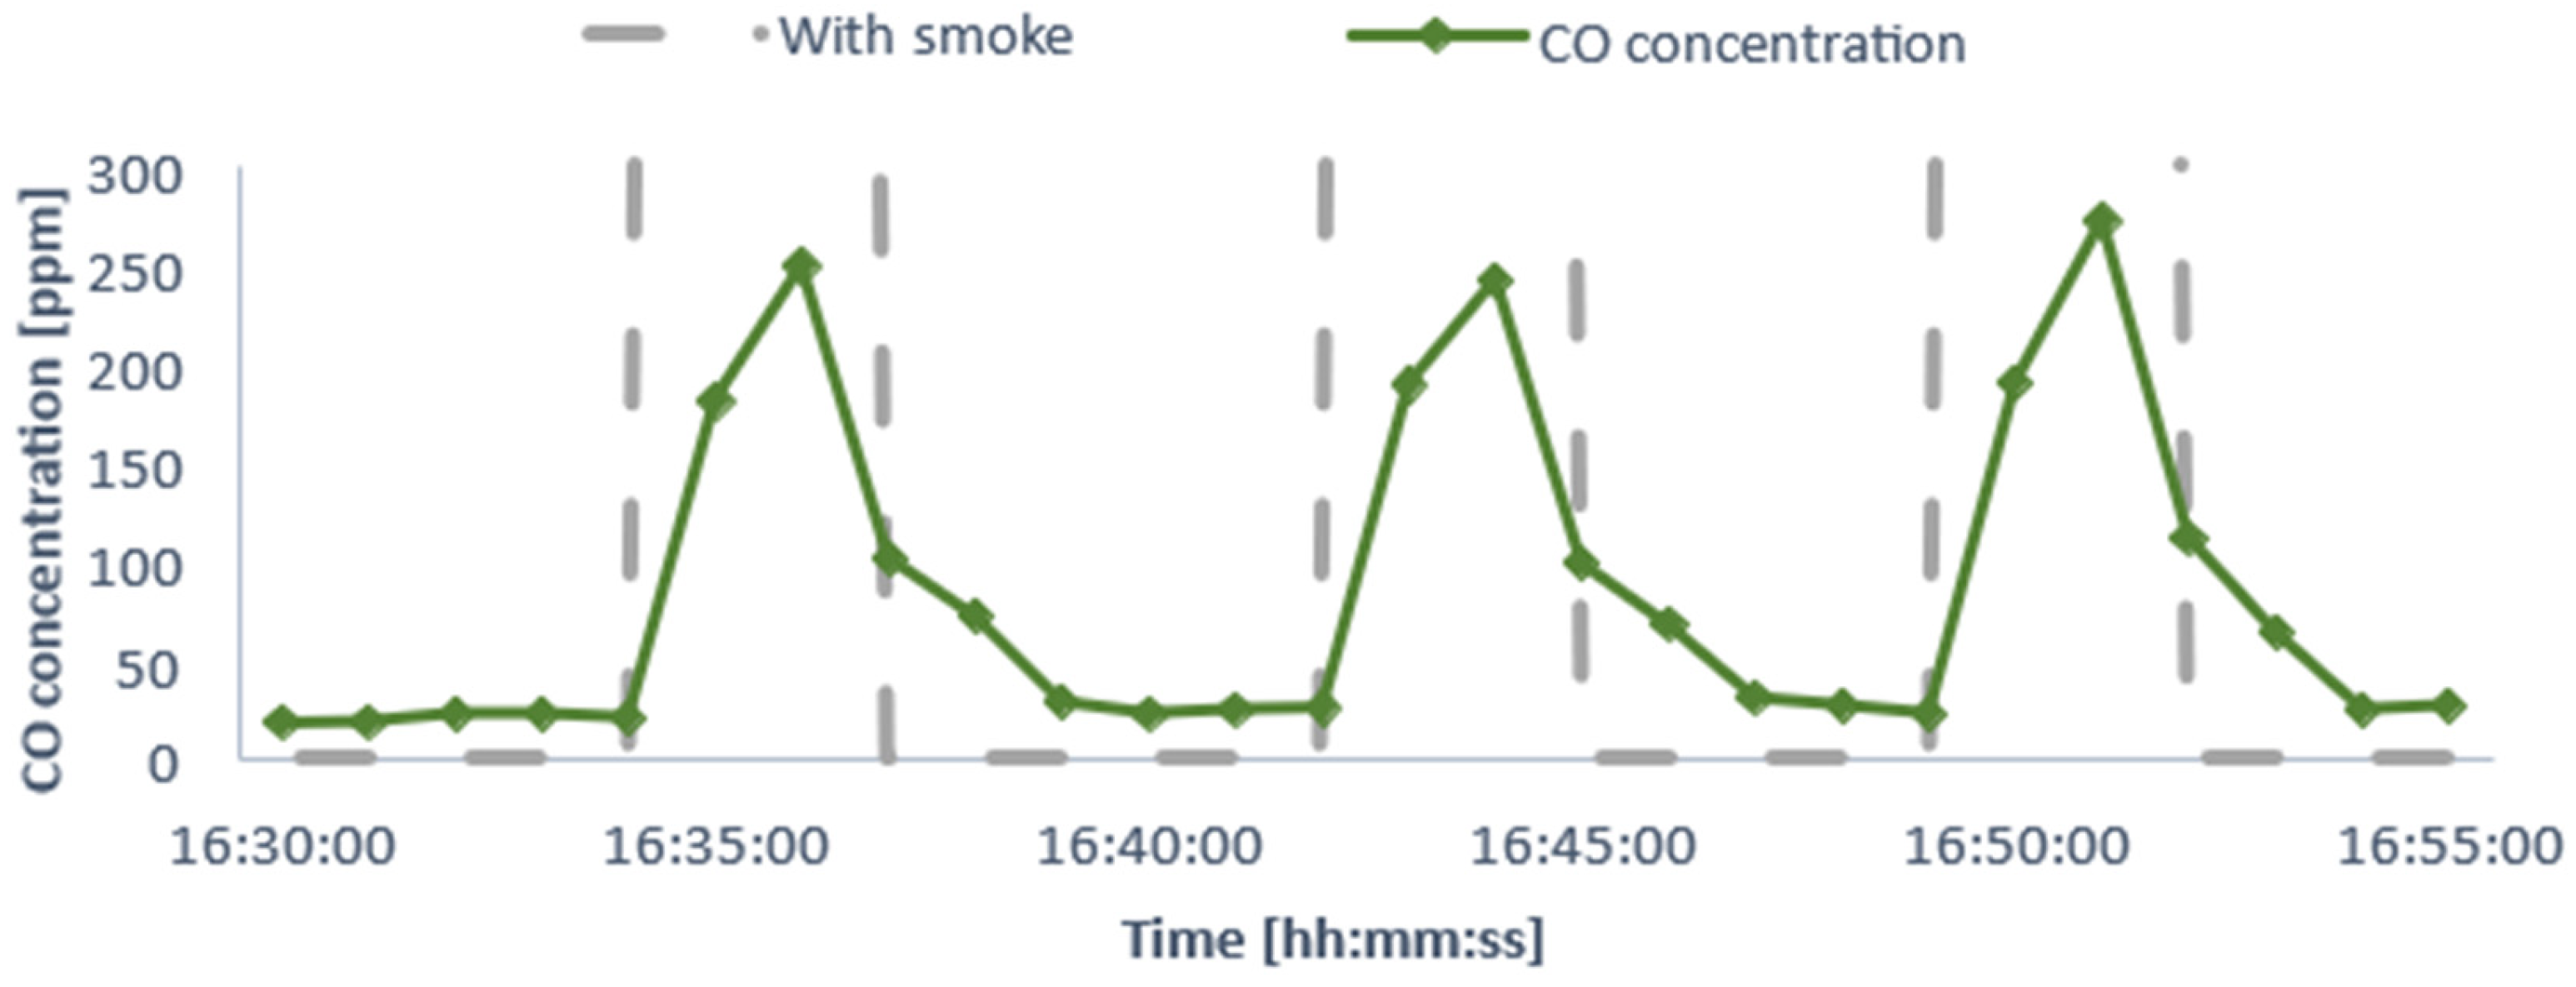
To test the MQ7 carbon monoxide sensor, it was necessary to follow the manufacturer’s recommendations, which are discussed in Section 3. The device’s datasheet also recommends an initial preheat to “burn in” the resistance for a period of approximately 48 h. After this period, the samples were recorded; see Figure 13. The test involved successive approaches to a controlled fire to check the CO concentration peaks present in the surrounding environment.

4.1.3. Results from PM2.5 and PM10 Sensors

Finally, to test the operation of the PM2.5 air-quality sensor, the Air Quality Index (IQA) was used as a reference. Table 3 shows how dangerous it is to breathe the air concerning the quantity of various pollutants, such as the PM2.5 and PM10 particles present in wildfire smoke.
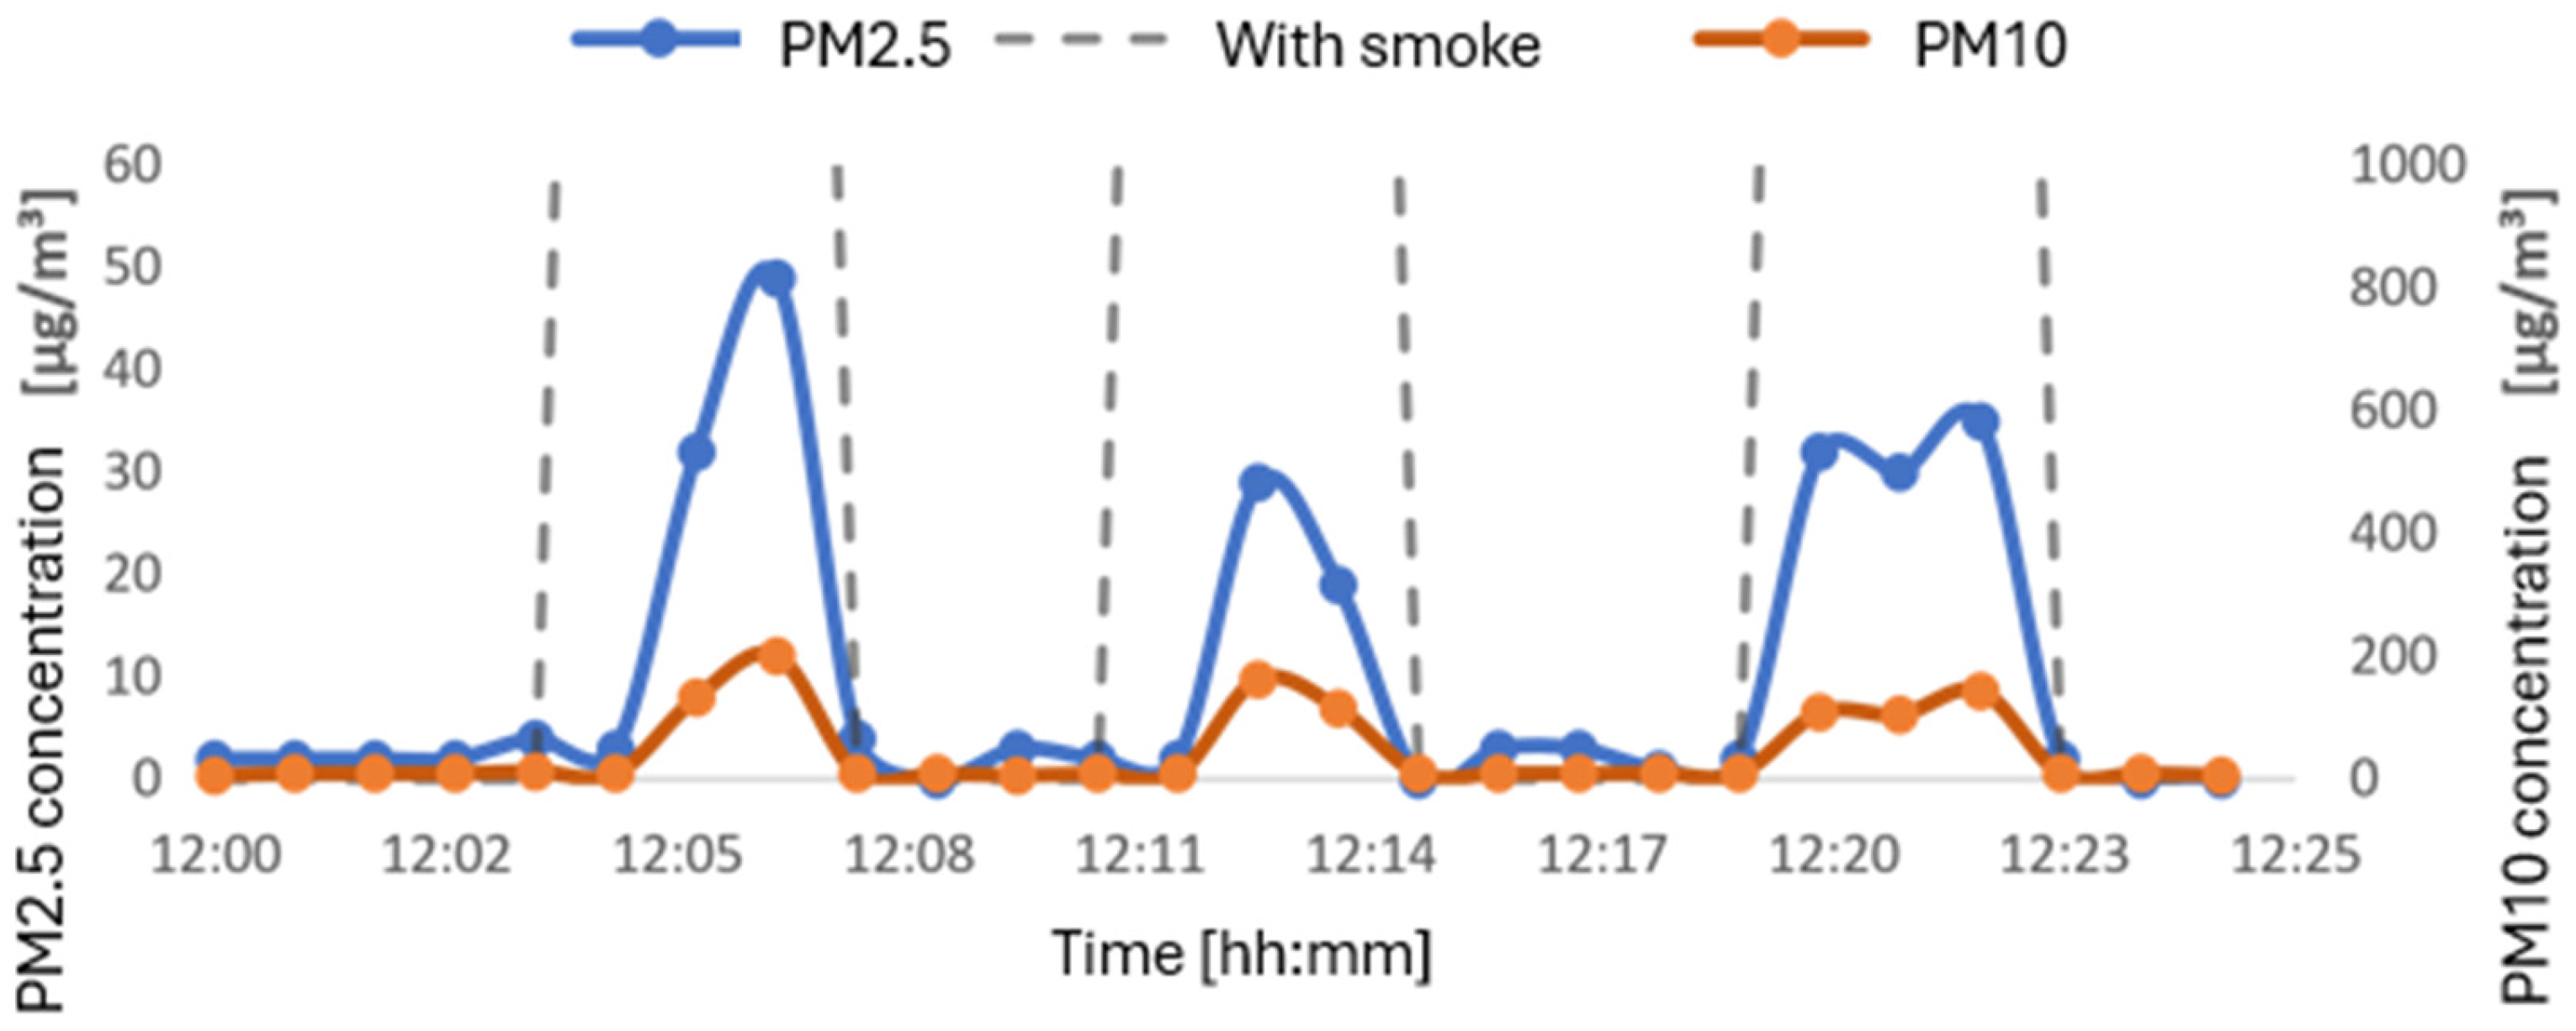
As with the CO sensor test, successive approaches were made to a controlled fire source to check the fluctuations in the sampled values by comparing them with the IQA table, as can be seen in Figure 14.

4.1.4. Results from the Anemometer

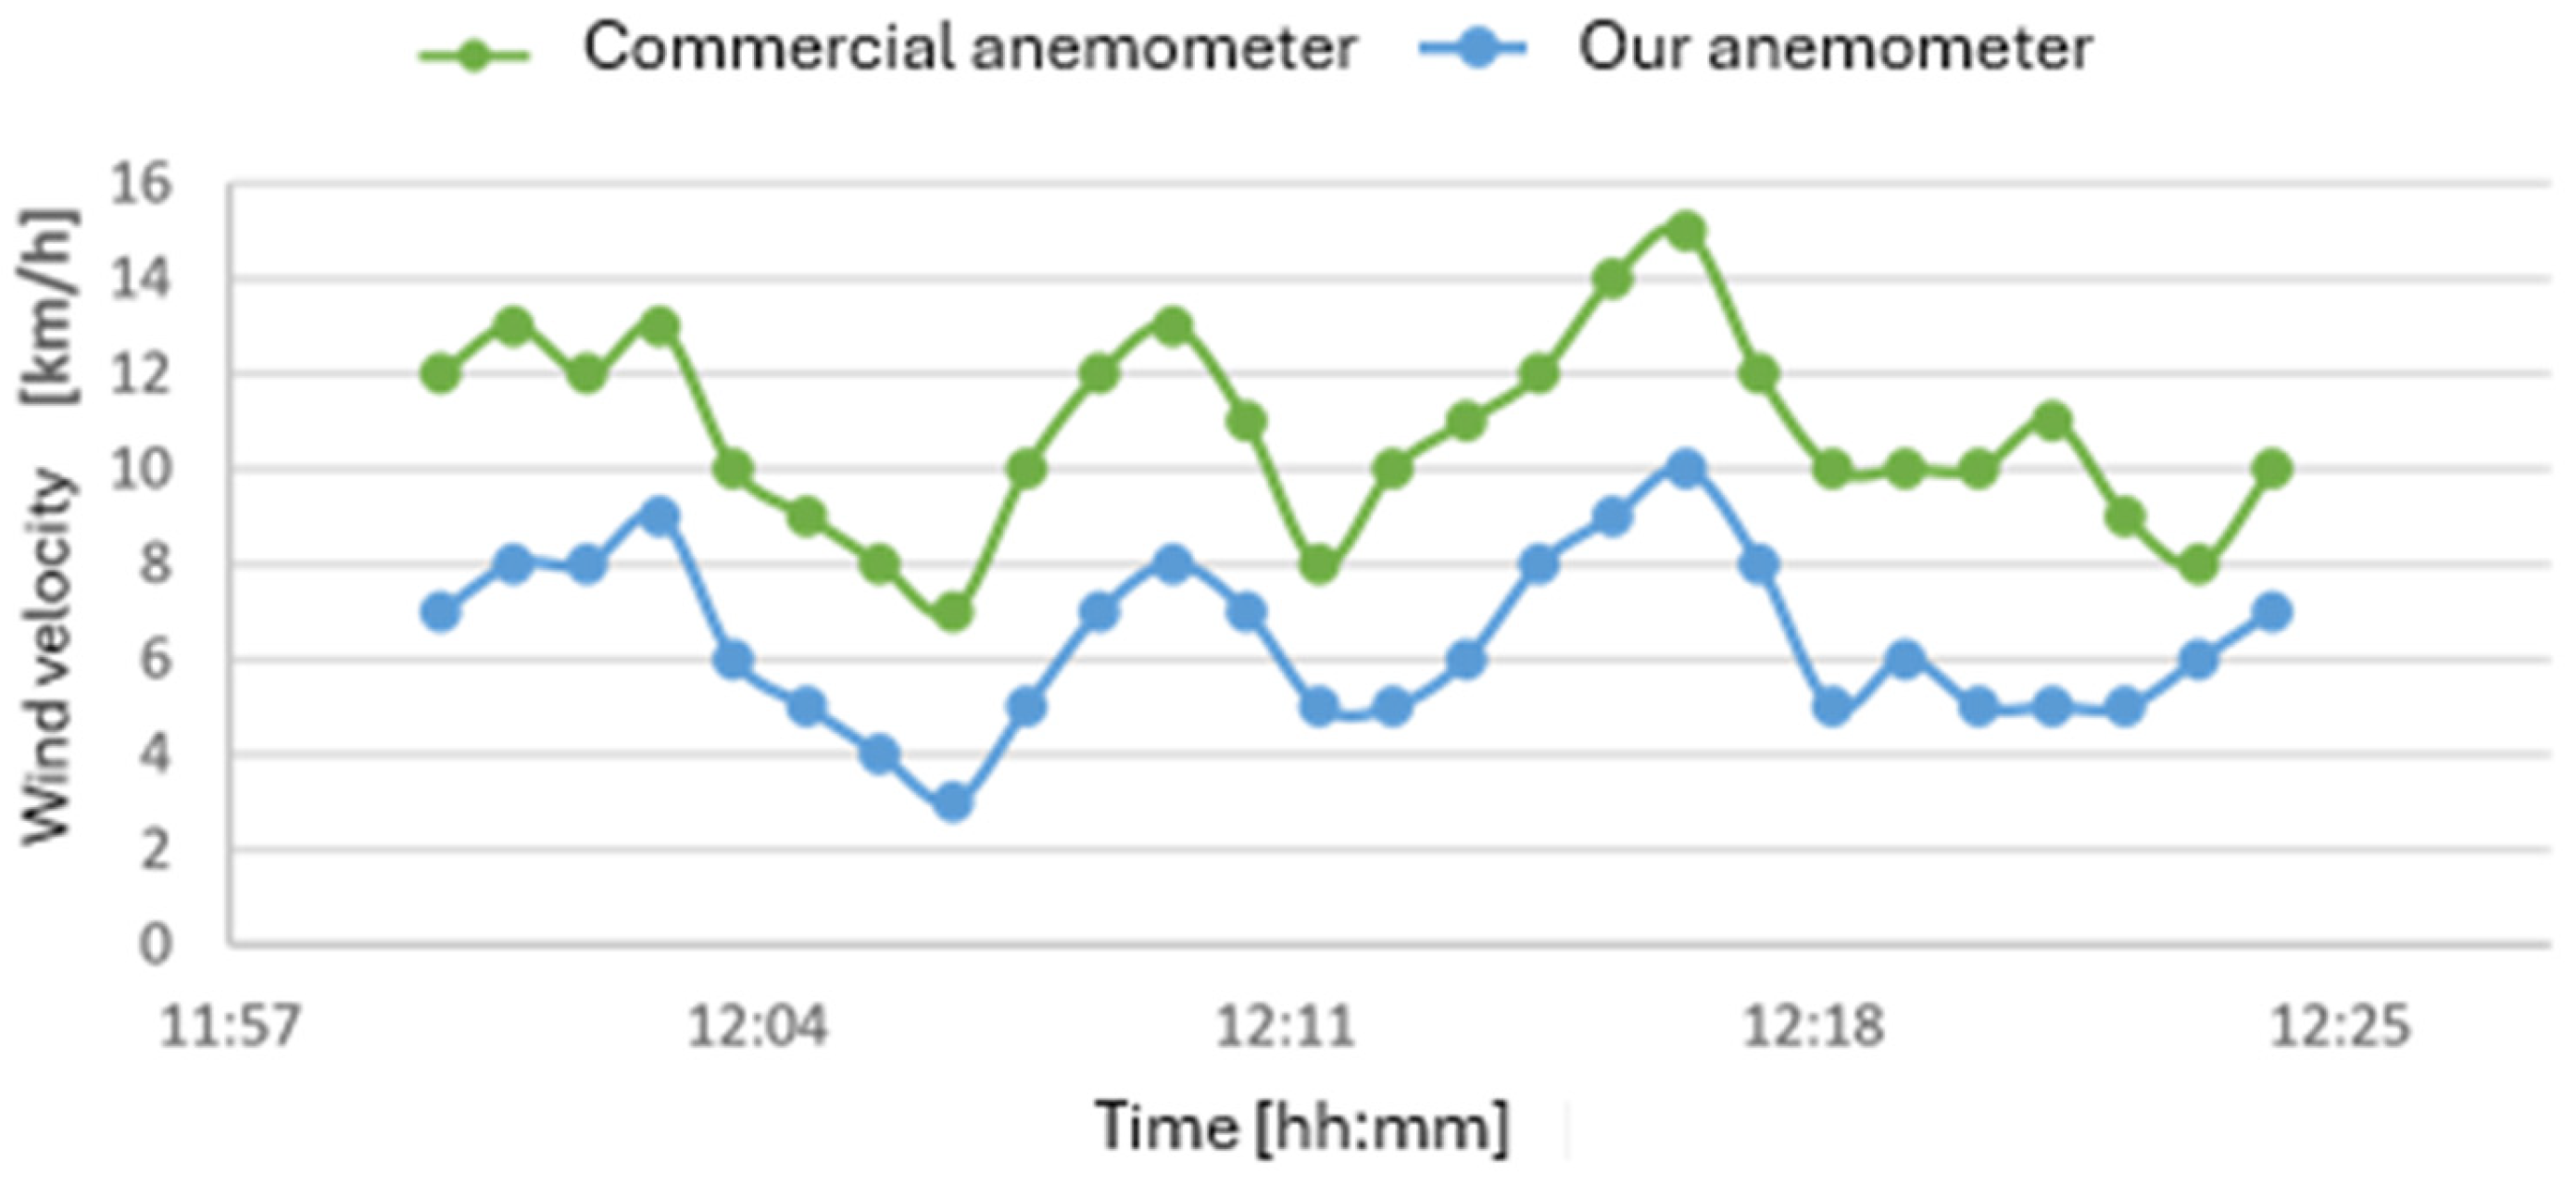
To validate the accuracy and performance of the anemometer developed, a comparative test was carried out on 7 May 2025 with a commercial anemometer (Lutron AM-4202 [31]).
The anemometers were installed for a period of 30 min in an open area exposed to the same wind conditions, where wind speed readings were simultaneously collected. Figure 15 shows a comparative graph of both measurements.
The high correlation (r ≈ 0.91) indicates a strong linear relationship between the two anemometers. The RMSE of 4.42 km/h reveals a moderate discrepancy in absolute terms. The significantly negative MFB (–52.16%) indicates that, on average, the custom-built anemometer underestimates wind speed compared to the commercial device.
The results obtained showed consistency between the anemometer readings. There was an error of approximately 4 km/h from the developed anemometer to the reference anemometer.

4.1.5. Results from LoRa Coverage

To ensure proper planning and dimensioning of the LoRa network, one of the most critical parameters evaluated was the communication range of the system.
Firstly, an NLOS test was carried out in Aldeia do Meco in the municipality of Sesimbra, in Portugal, on 15 May 2025, for 12 h. To carry it out, a mixed environment—rural and urban—was chosen that most closely resembled an environment that the system would be applied to in the future, as can be seen in Figure 16. The gateway was placed on top of a tall building and the node was moved to various points in the test area, at varying distances from the gateway. At each test point, the node sent a packet every five minutes, up to a total of ten packets, for each SF under study (SF7, SF10, SF12) at a power of 23 dBm, with a bandwidth of 125 kHz and a CR of 4/5.
Table 4 shows the testing results. For shorter distances, such as P1 (100 m), all packets were received with a success rate of 10/10. The average RSSI varied between −57 dBm and −60 dBm, indicating a strong and reliable signal.
As the distance increases, as in P2 (300 m) and P3 (350 m), there is a decrease in the number of packets received, indicating a lower success rate. The average RSSI also decreases, varying between −73 dBm and −85 dBm, indicating a weaker signal due to attenuation. It can also be seen that P2, despite being at a shorter distance than P3, has lower receptivity, due to the greater presence of vegetation between the test point and the gateway.
At longer distances, such as P4 (500 m) and P5 (850 m), the number of packets received drops significantly, reaching 0/10 in P5. This indicates that LoRa communication was not successfully established in these cases. The average RSSI at these distances is quite low, ranging from −93 dBm to −99 dBm, indicating a very weak signal that was probably subject to a lot of attenuation.
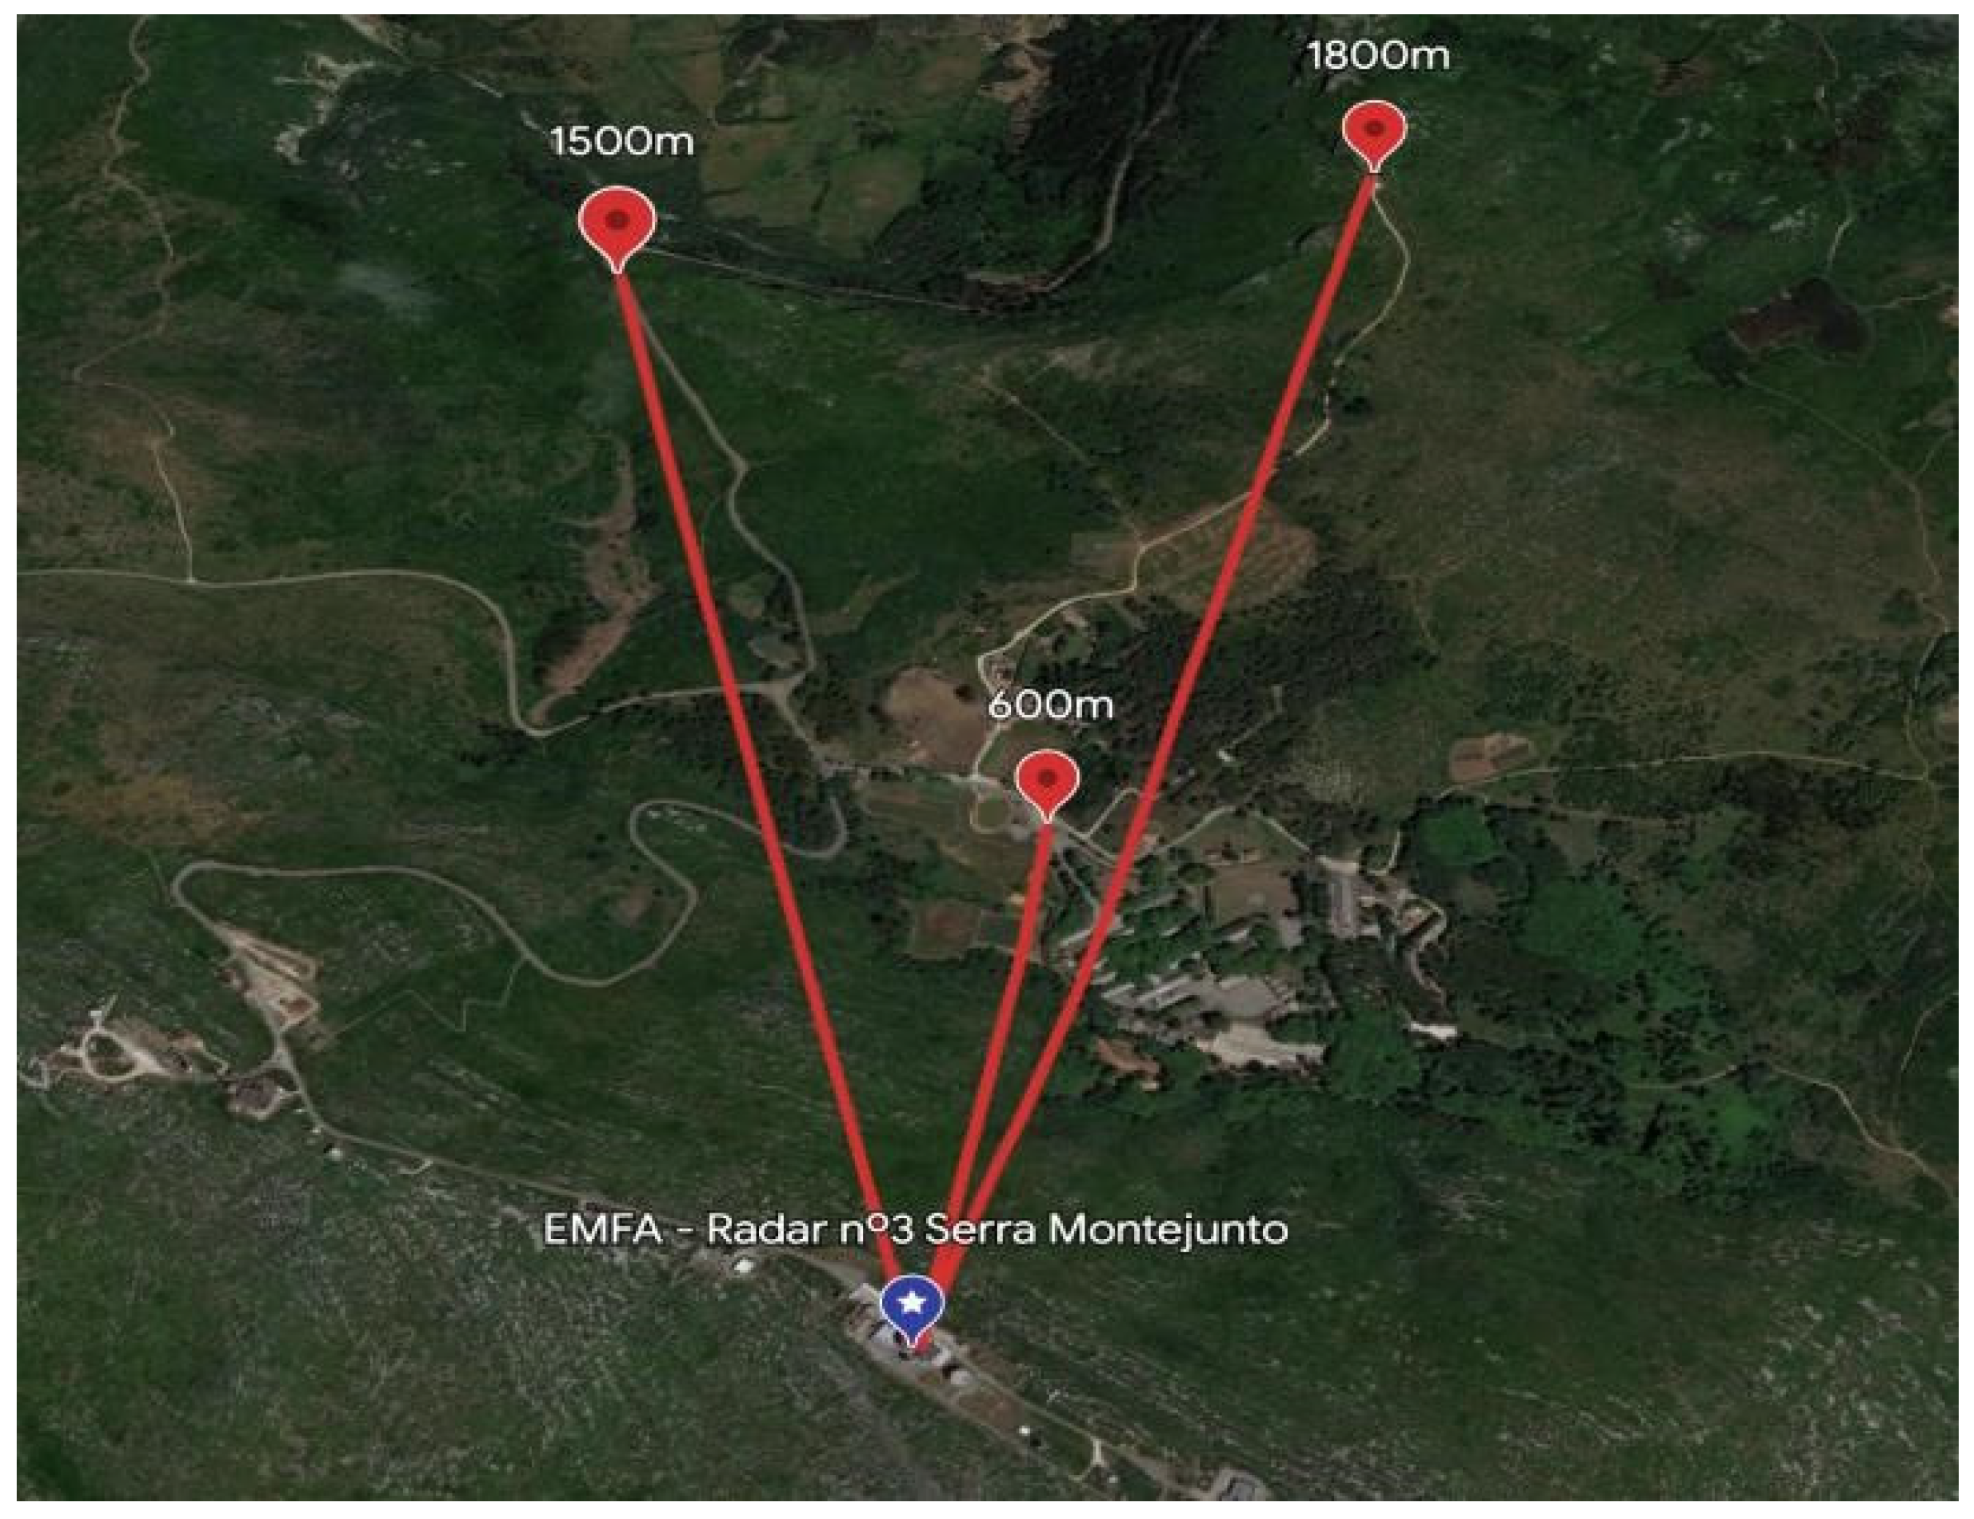
The second test, conducted to assess the performance of the LoRa module, is a continuation of the one previously carried out, this time under LOS conditions. In this test, the gateway was positioned at the highest point of the Serra de Montejunto, while the LoRa node was moved to the different points depicted in Figure 17. The idea was to check how LoRa communication behaved when there were no significant obstacles between the gateway and the node.
Table 5 shows the results of the LOS tests. As with the NLOS test, data packets with a different SF were sent at each point, with a BW of 125 kHz and a CR of 4/5.
Table 5 depicts the LoRa technology efficiency in LOS environments, even at distances greater than 1 km. The use of different SFs shows that, in general, the larger the SF, the more robust the signal—except for cases such as P3, where SF12 showed the worst practical performance. This anomaly could be of great interest in further research; perhaps optimum performance depends not just upon distance and SF, but some external or operational systems parameters.
At all test locations and across all evaluated distances, the packets were successfully received, irrespective of the SF employed.
We can also see that the average RSSI remained relatively stable, indicating good signal quality. The measured average RSSI values, ranging between −74 dBm and −86 dBm, reflect a satisfactory level of signal reception quality.
These results suggest that the LoRa system performs well in LOS conditions, guaranteeing reliable and stable communication over different distances.

4.1.6. Dashboard Results

On Node-Red [48], the initial configuration of the MQTT node involved defining the server and port for establishing the connection. The server was configured with the IP address LocalHost and with port 1883, which is widely accepted for use in MQTT communication. The MQTT topic had to be configured on the MQTT node. The Topic is a string that identifies the destination to which the data will be sent or the direction from which it will be received. For instance, to receive temperature data, a topic named results_temp was created. This topic is responsible for receiving and processing the temperature values transmitted by the Arduino.
By configuring the server, port, and topic on the MQTT node, a communication bridge is established between Node-Red and the MQTT broker, allowing MQTT messages to be sent and received. This configuration is essential to ensure that the Arduino data processed by Python can be sent and received by Node-Red.
We then proceeded to implement the flow of our application. A flow is a visual representation of a set of connected nodes working to accomplish a specific task. You can think of a flow as a program or script that executes a sequence of actions in response to specific events or inputs.
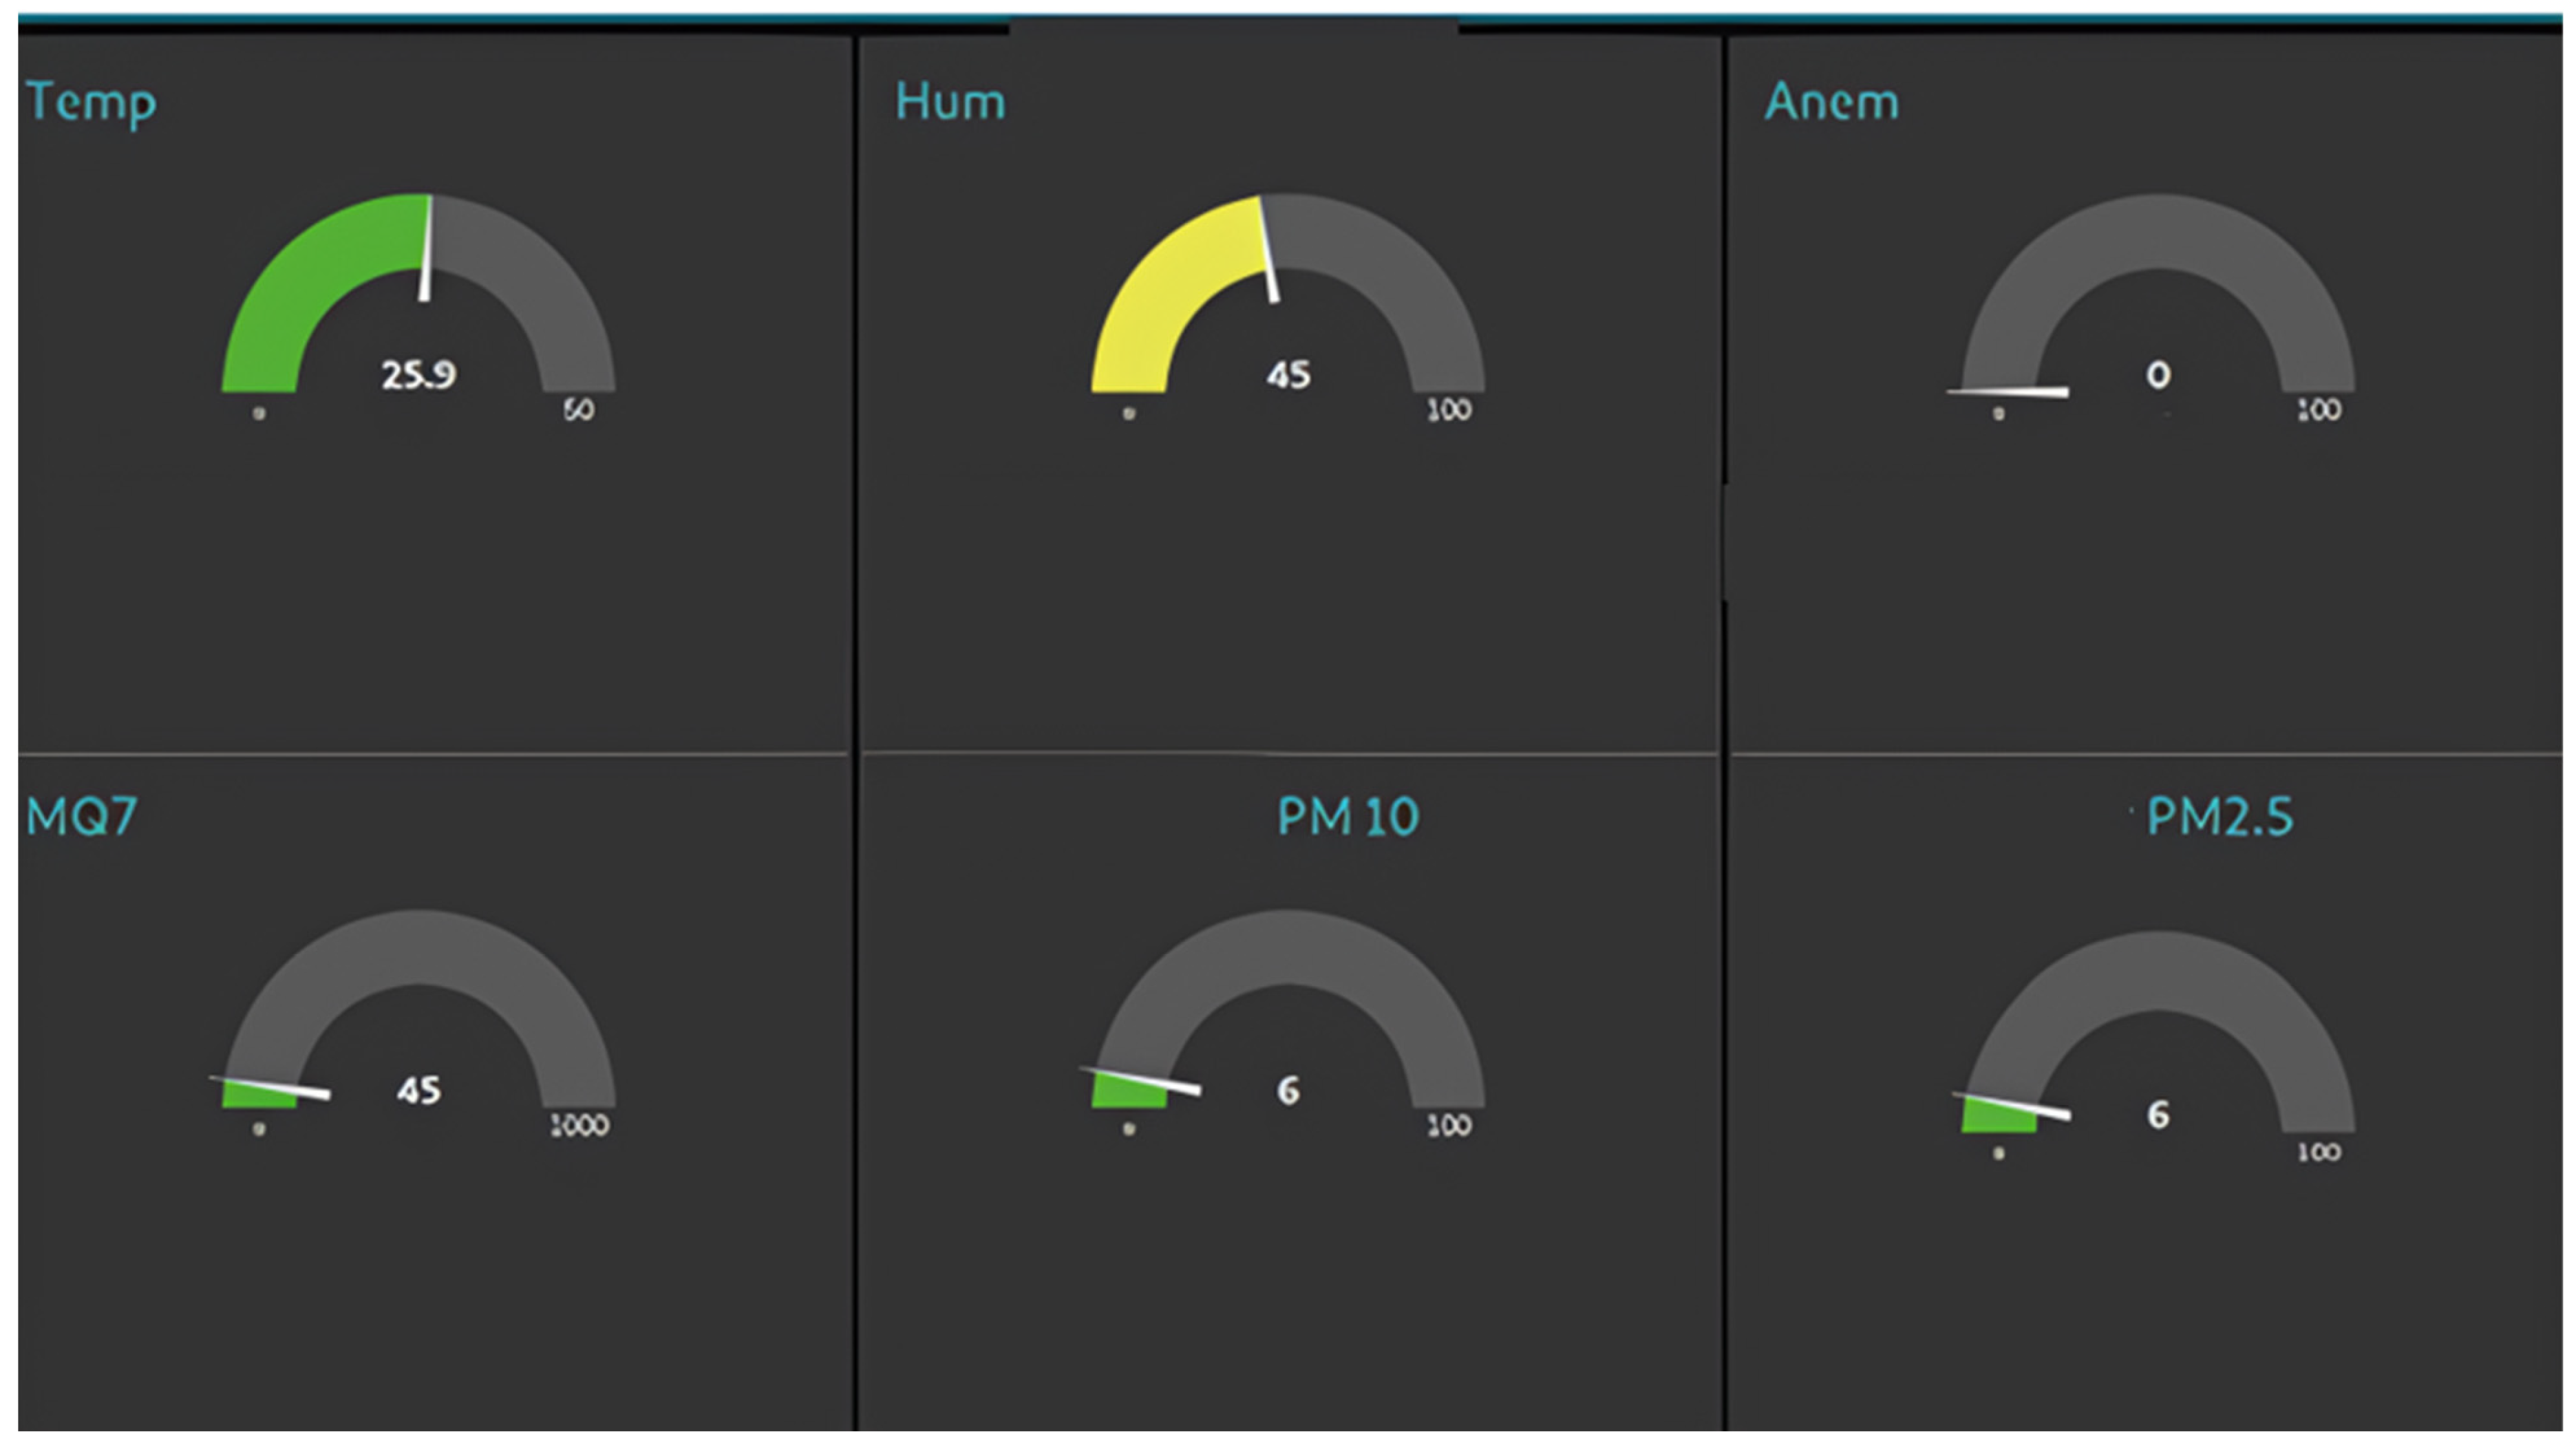
After establishing a connection with the MQTT node, we began to receive data from the sensor. This data was shared in a graph called a gauge, which makes it possible to monitor the temperature values intuitively and visually. The function 2 node is responsible for reading the sensor data, storing the last five readings, and calculating their average. Finally, the template node created a “Details” button where we could view the average and a line graph that allowed us to see the trend of the data that was collected over time, helping us to identify patterns and variations throughout the day. Figure 18 shows the results.
Figure 18 shows the constructed dashboard interface developed on Node-RED for the real-time visualization of data acquired from the IoT node. The interface brings together sensor readings related to wildfire risk—temperature, relative humidity, wind speed, CO, and particulate matter (PM10 and PM2.5). Each parameter is presented in a dynamic gauge indicator to allow for a quick visualization of the abnormality or condition in the field at a given moment. This dashboard is incorporated into the data pipeline of the system and other important aspects to validate sensors that are in operation, monitor any abnormal conditions, and provide situational awareness during field deployments. This is a proof-of-concept, demonstrating that these are low-cost, open-source platforms for real-time environmental hazard detection in remote or forested areas.

4.2. Extended 168-Hour Test

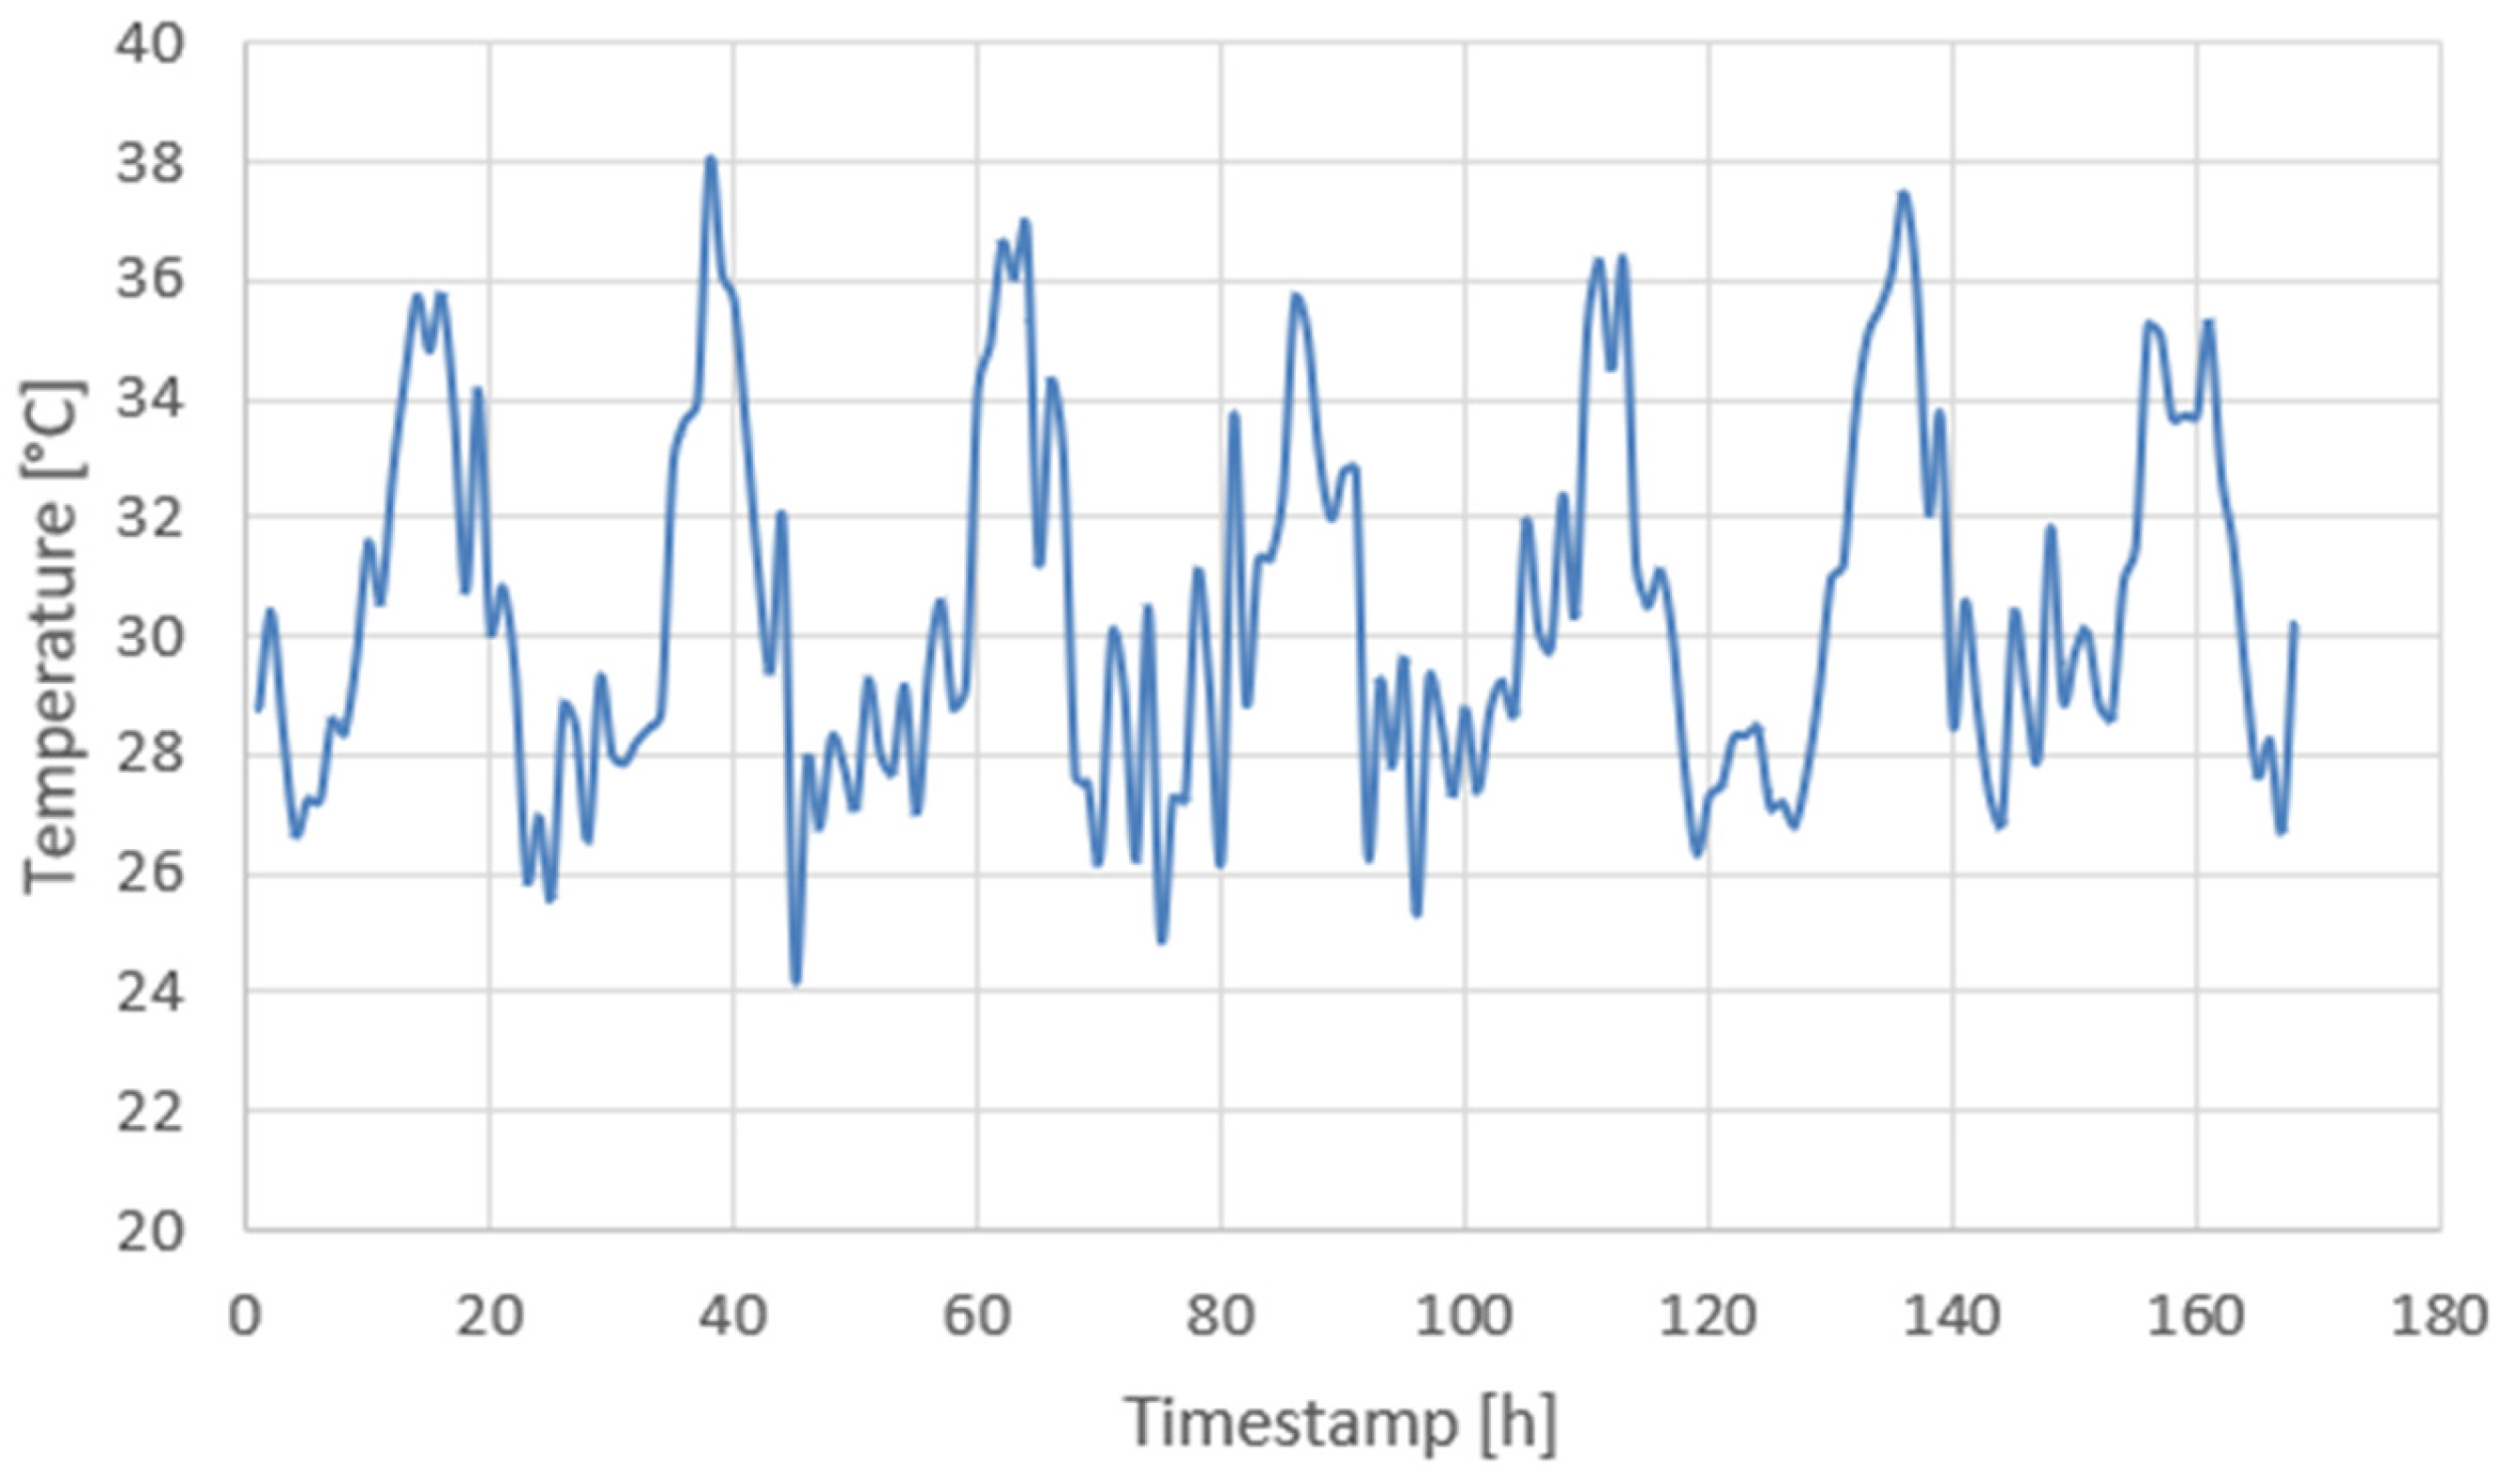
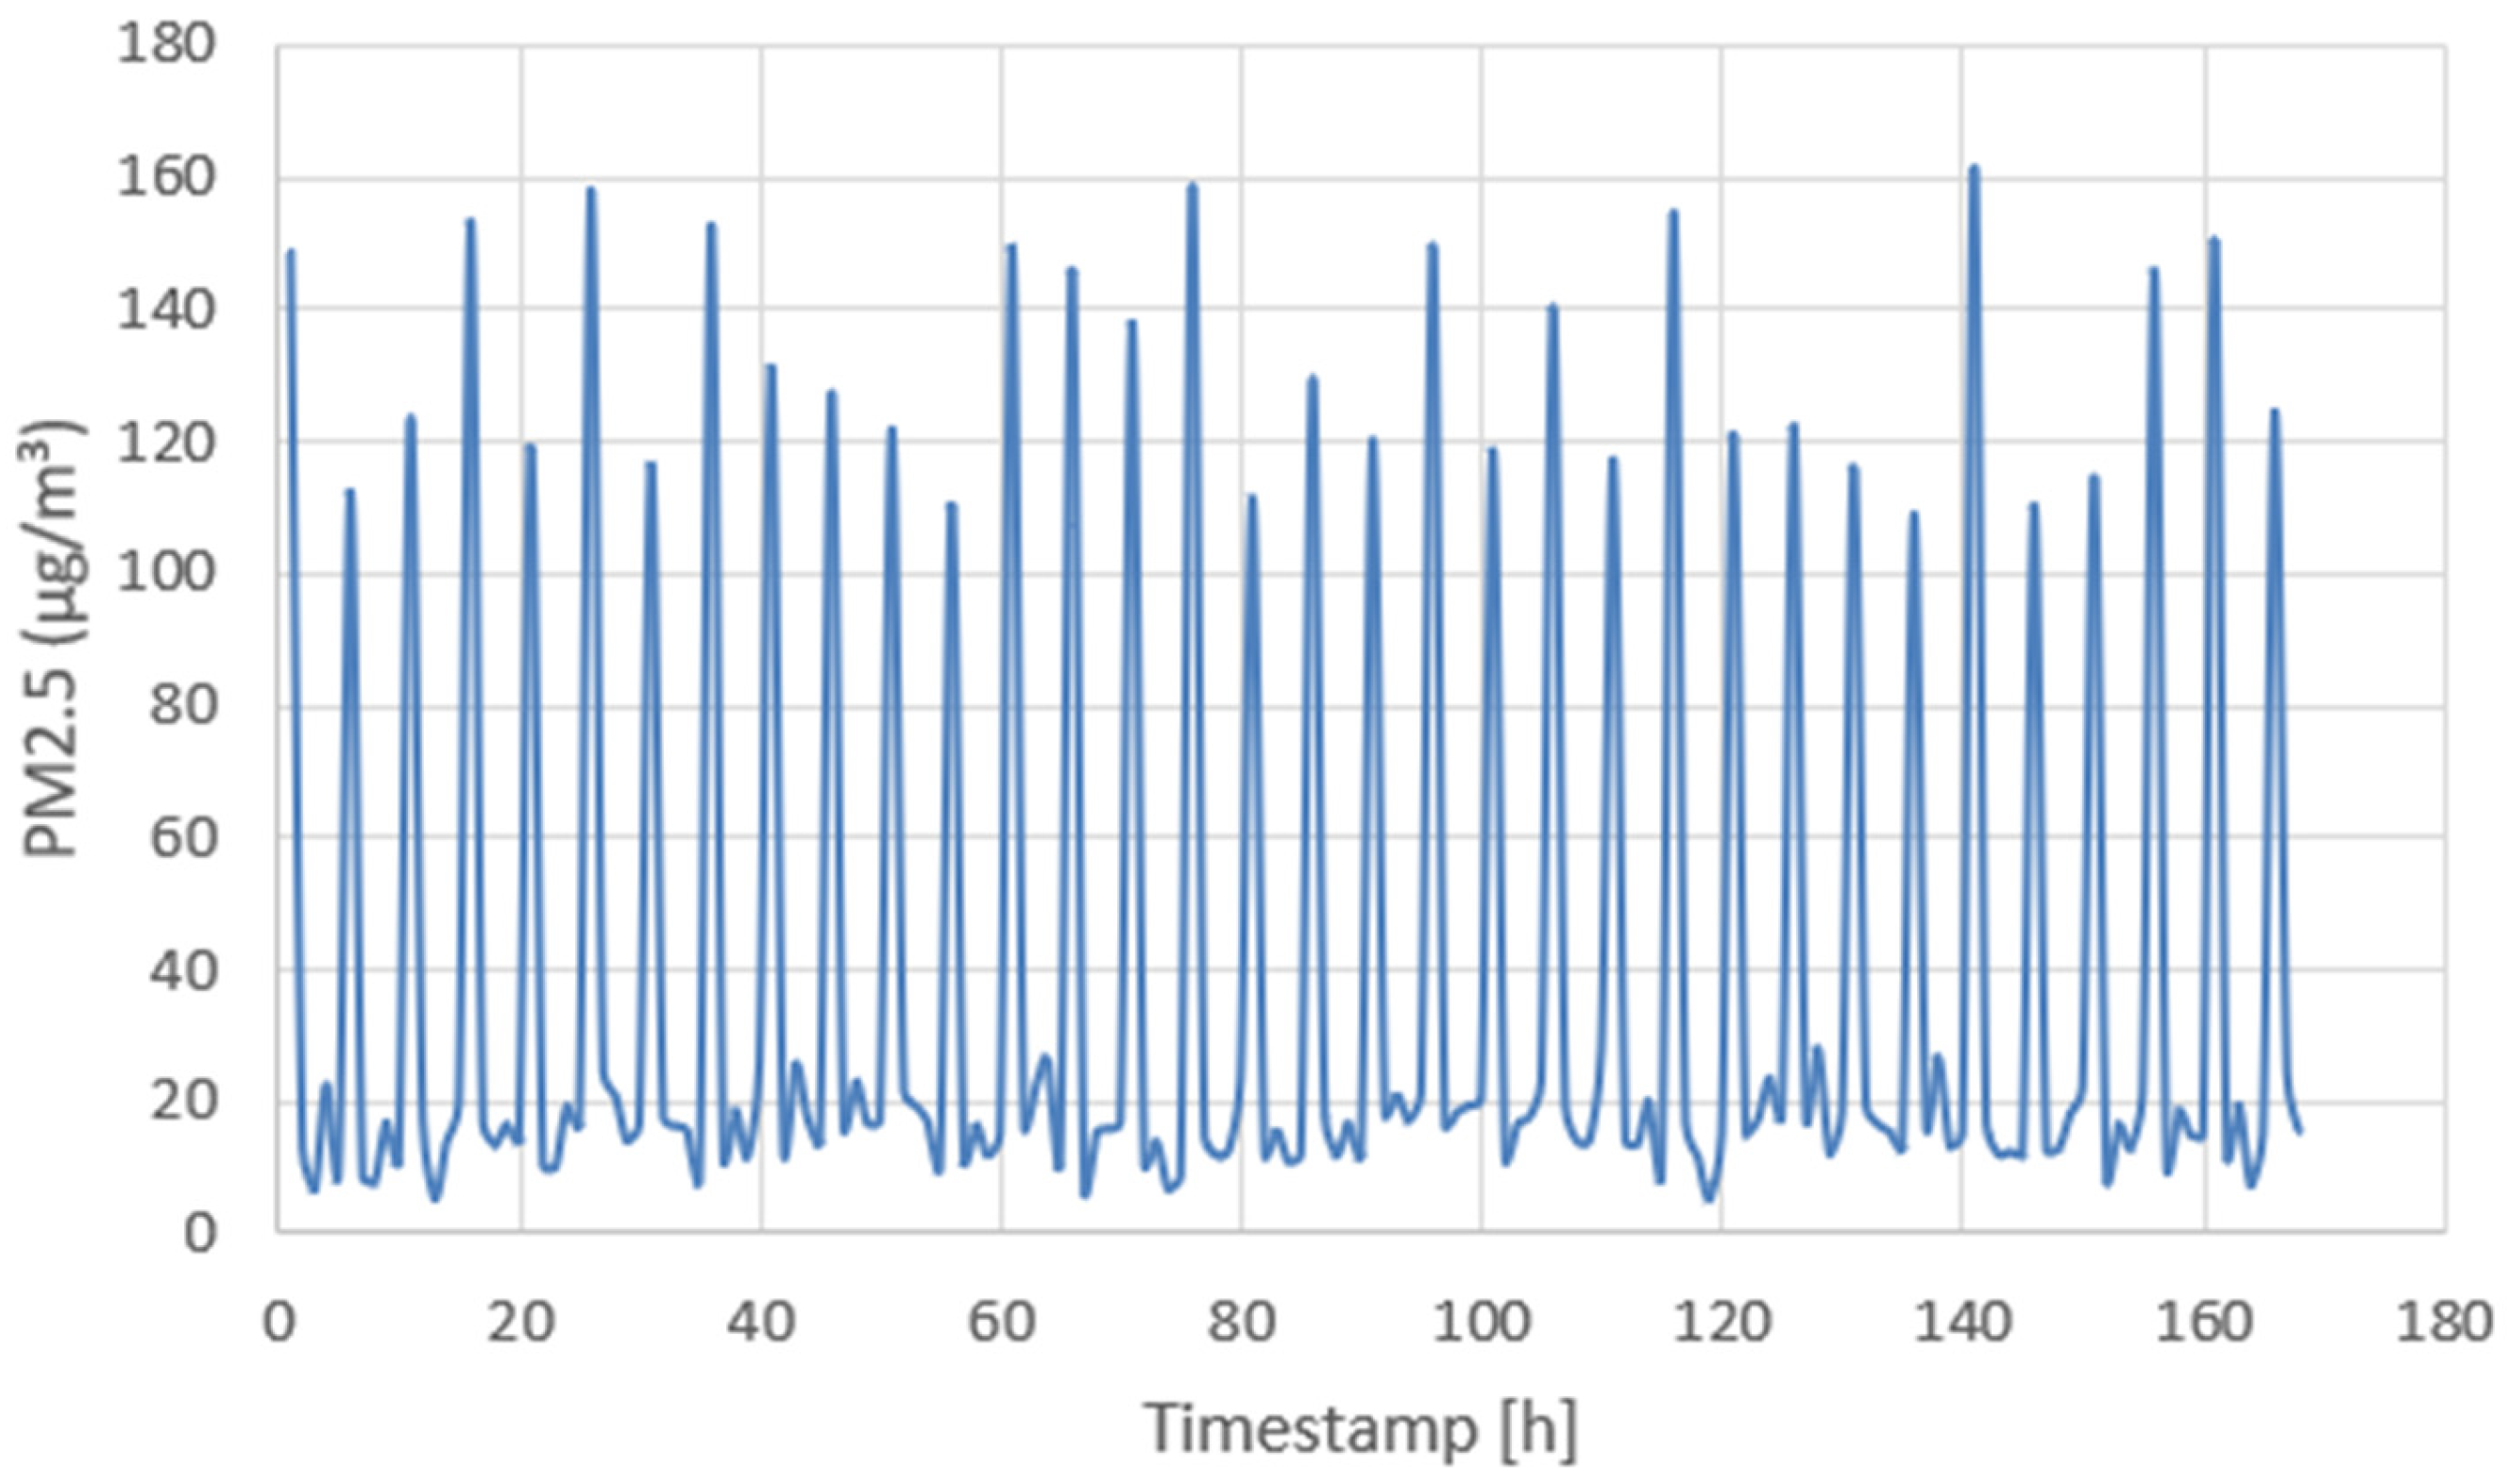
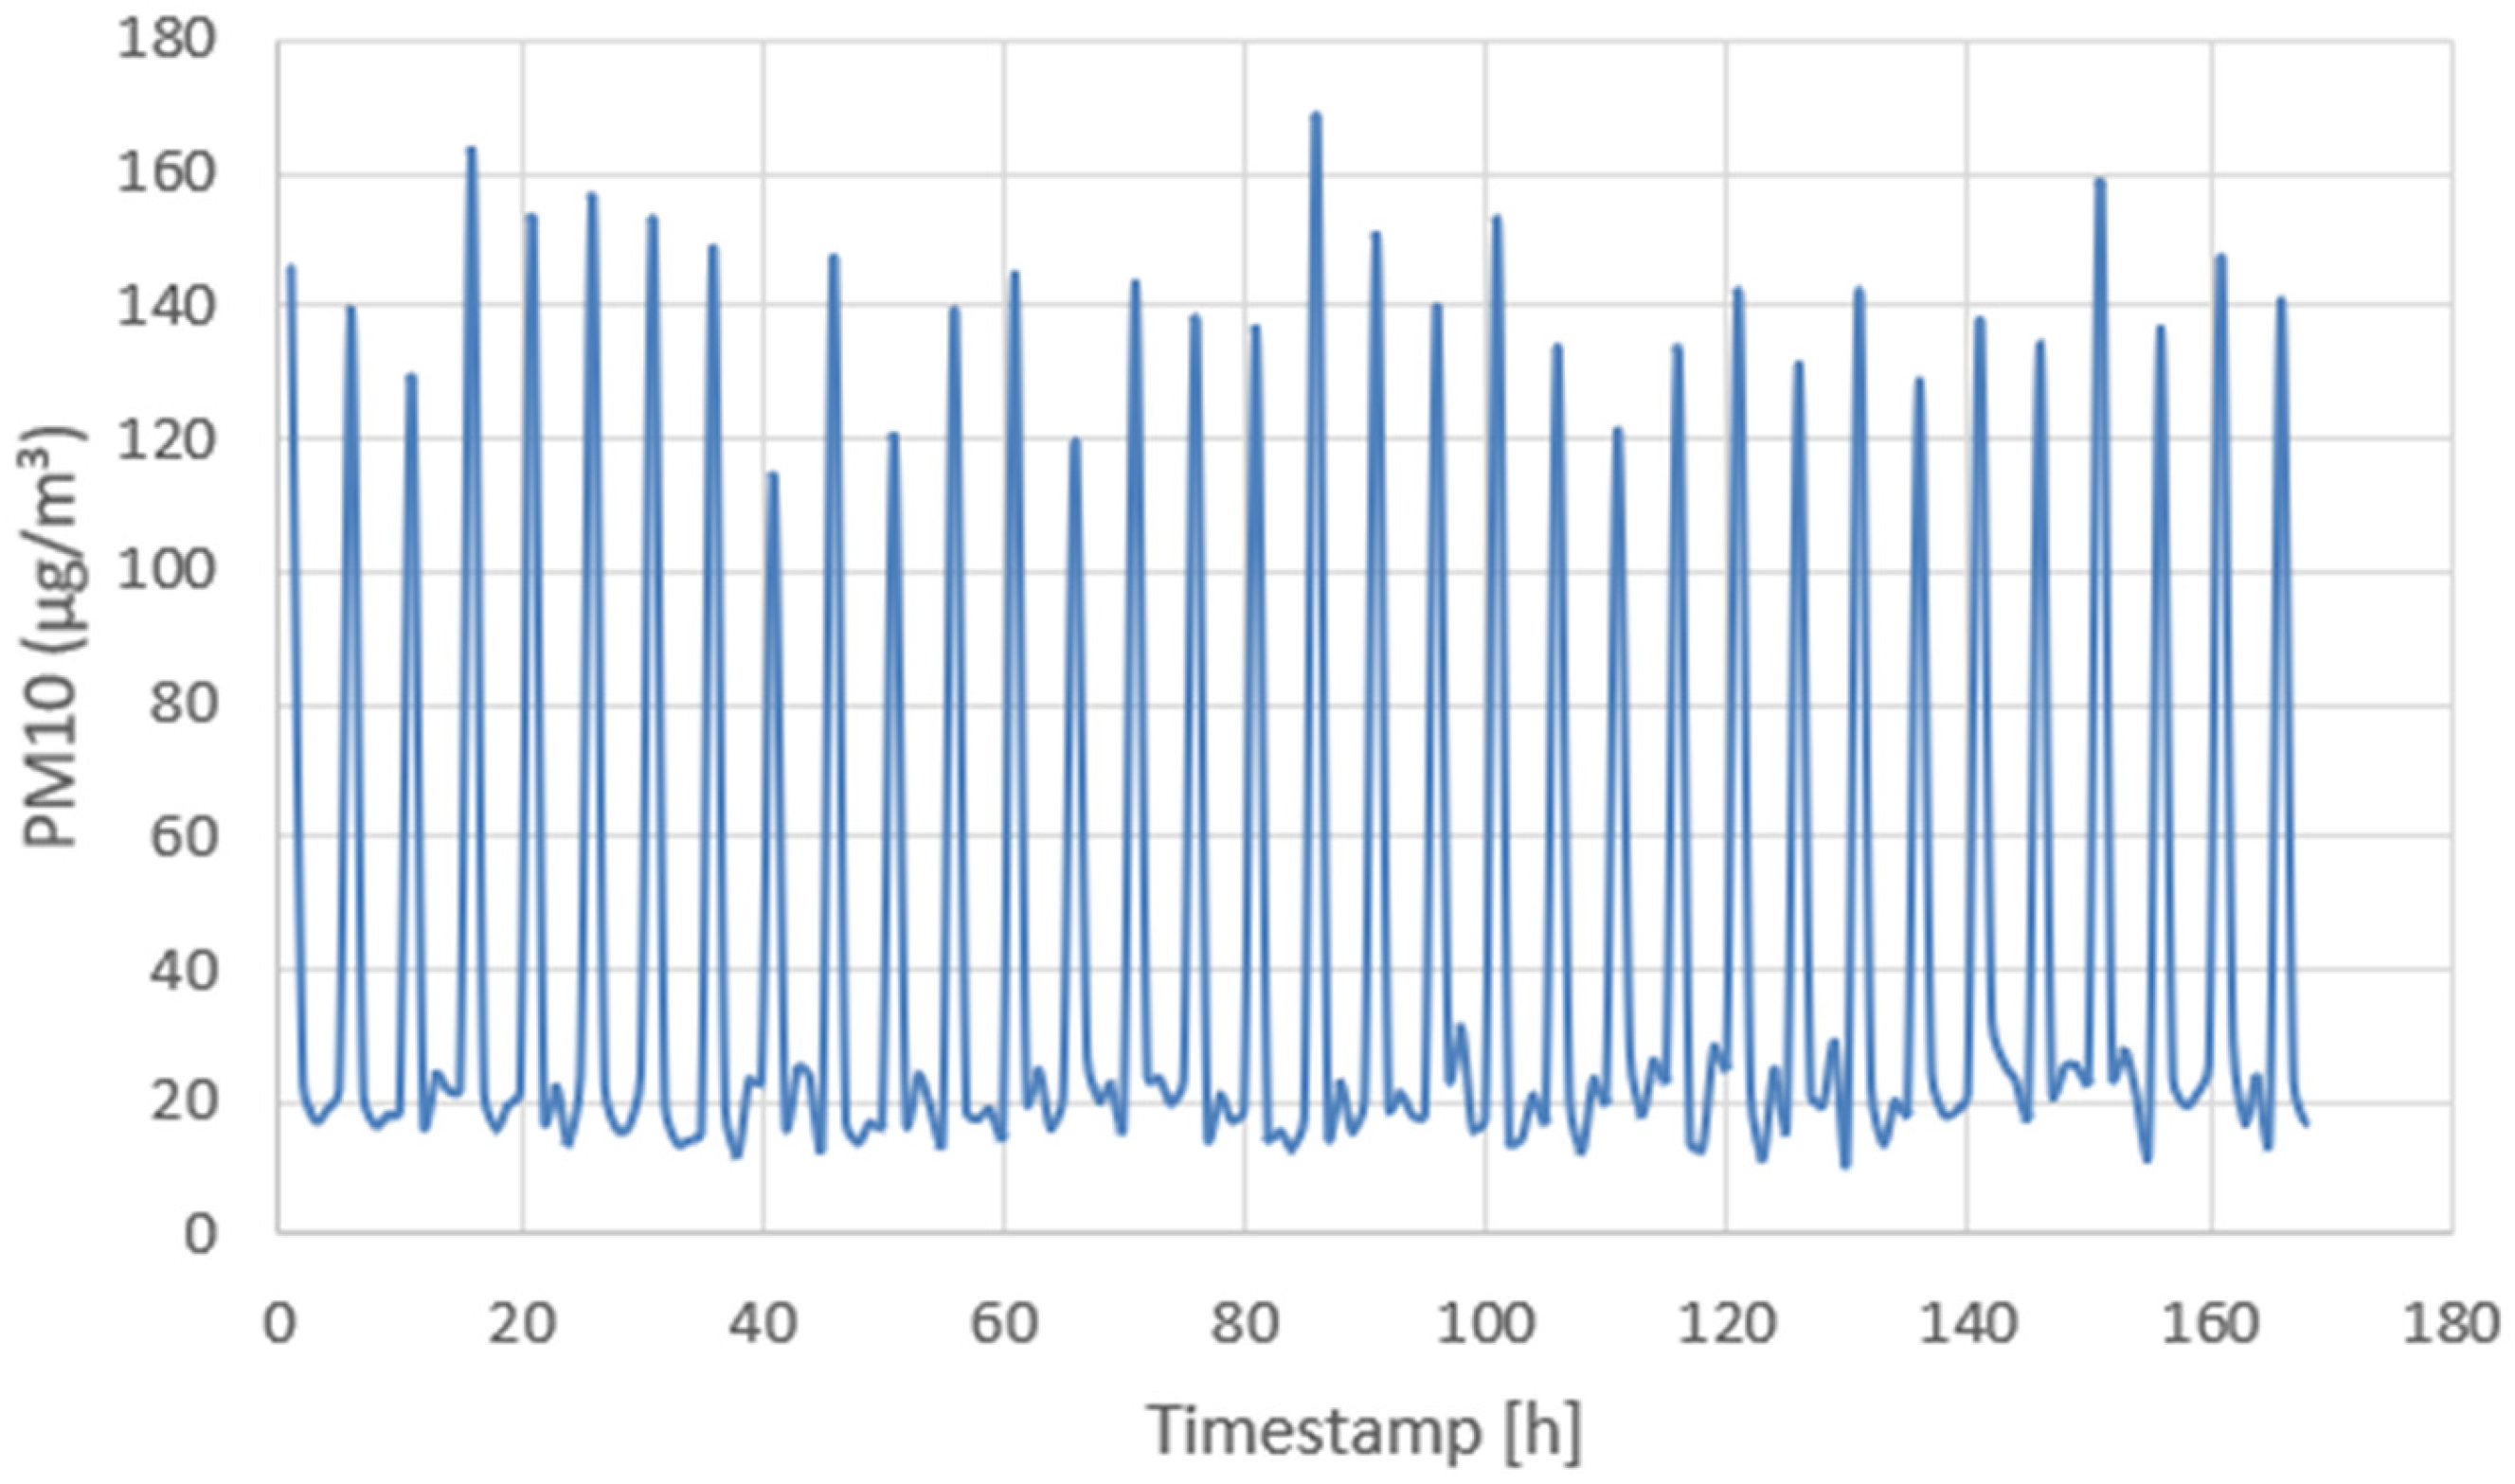
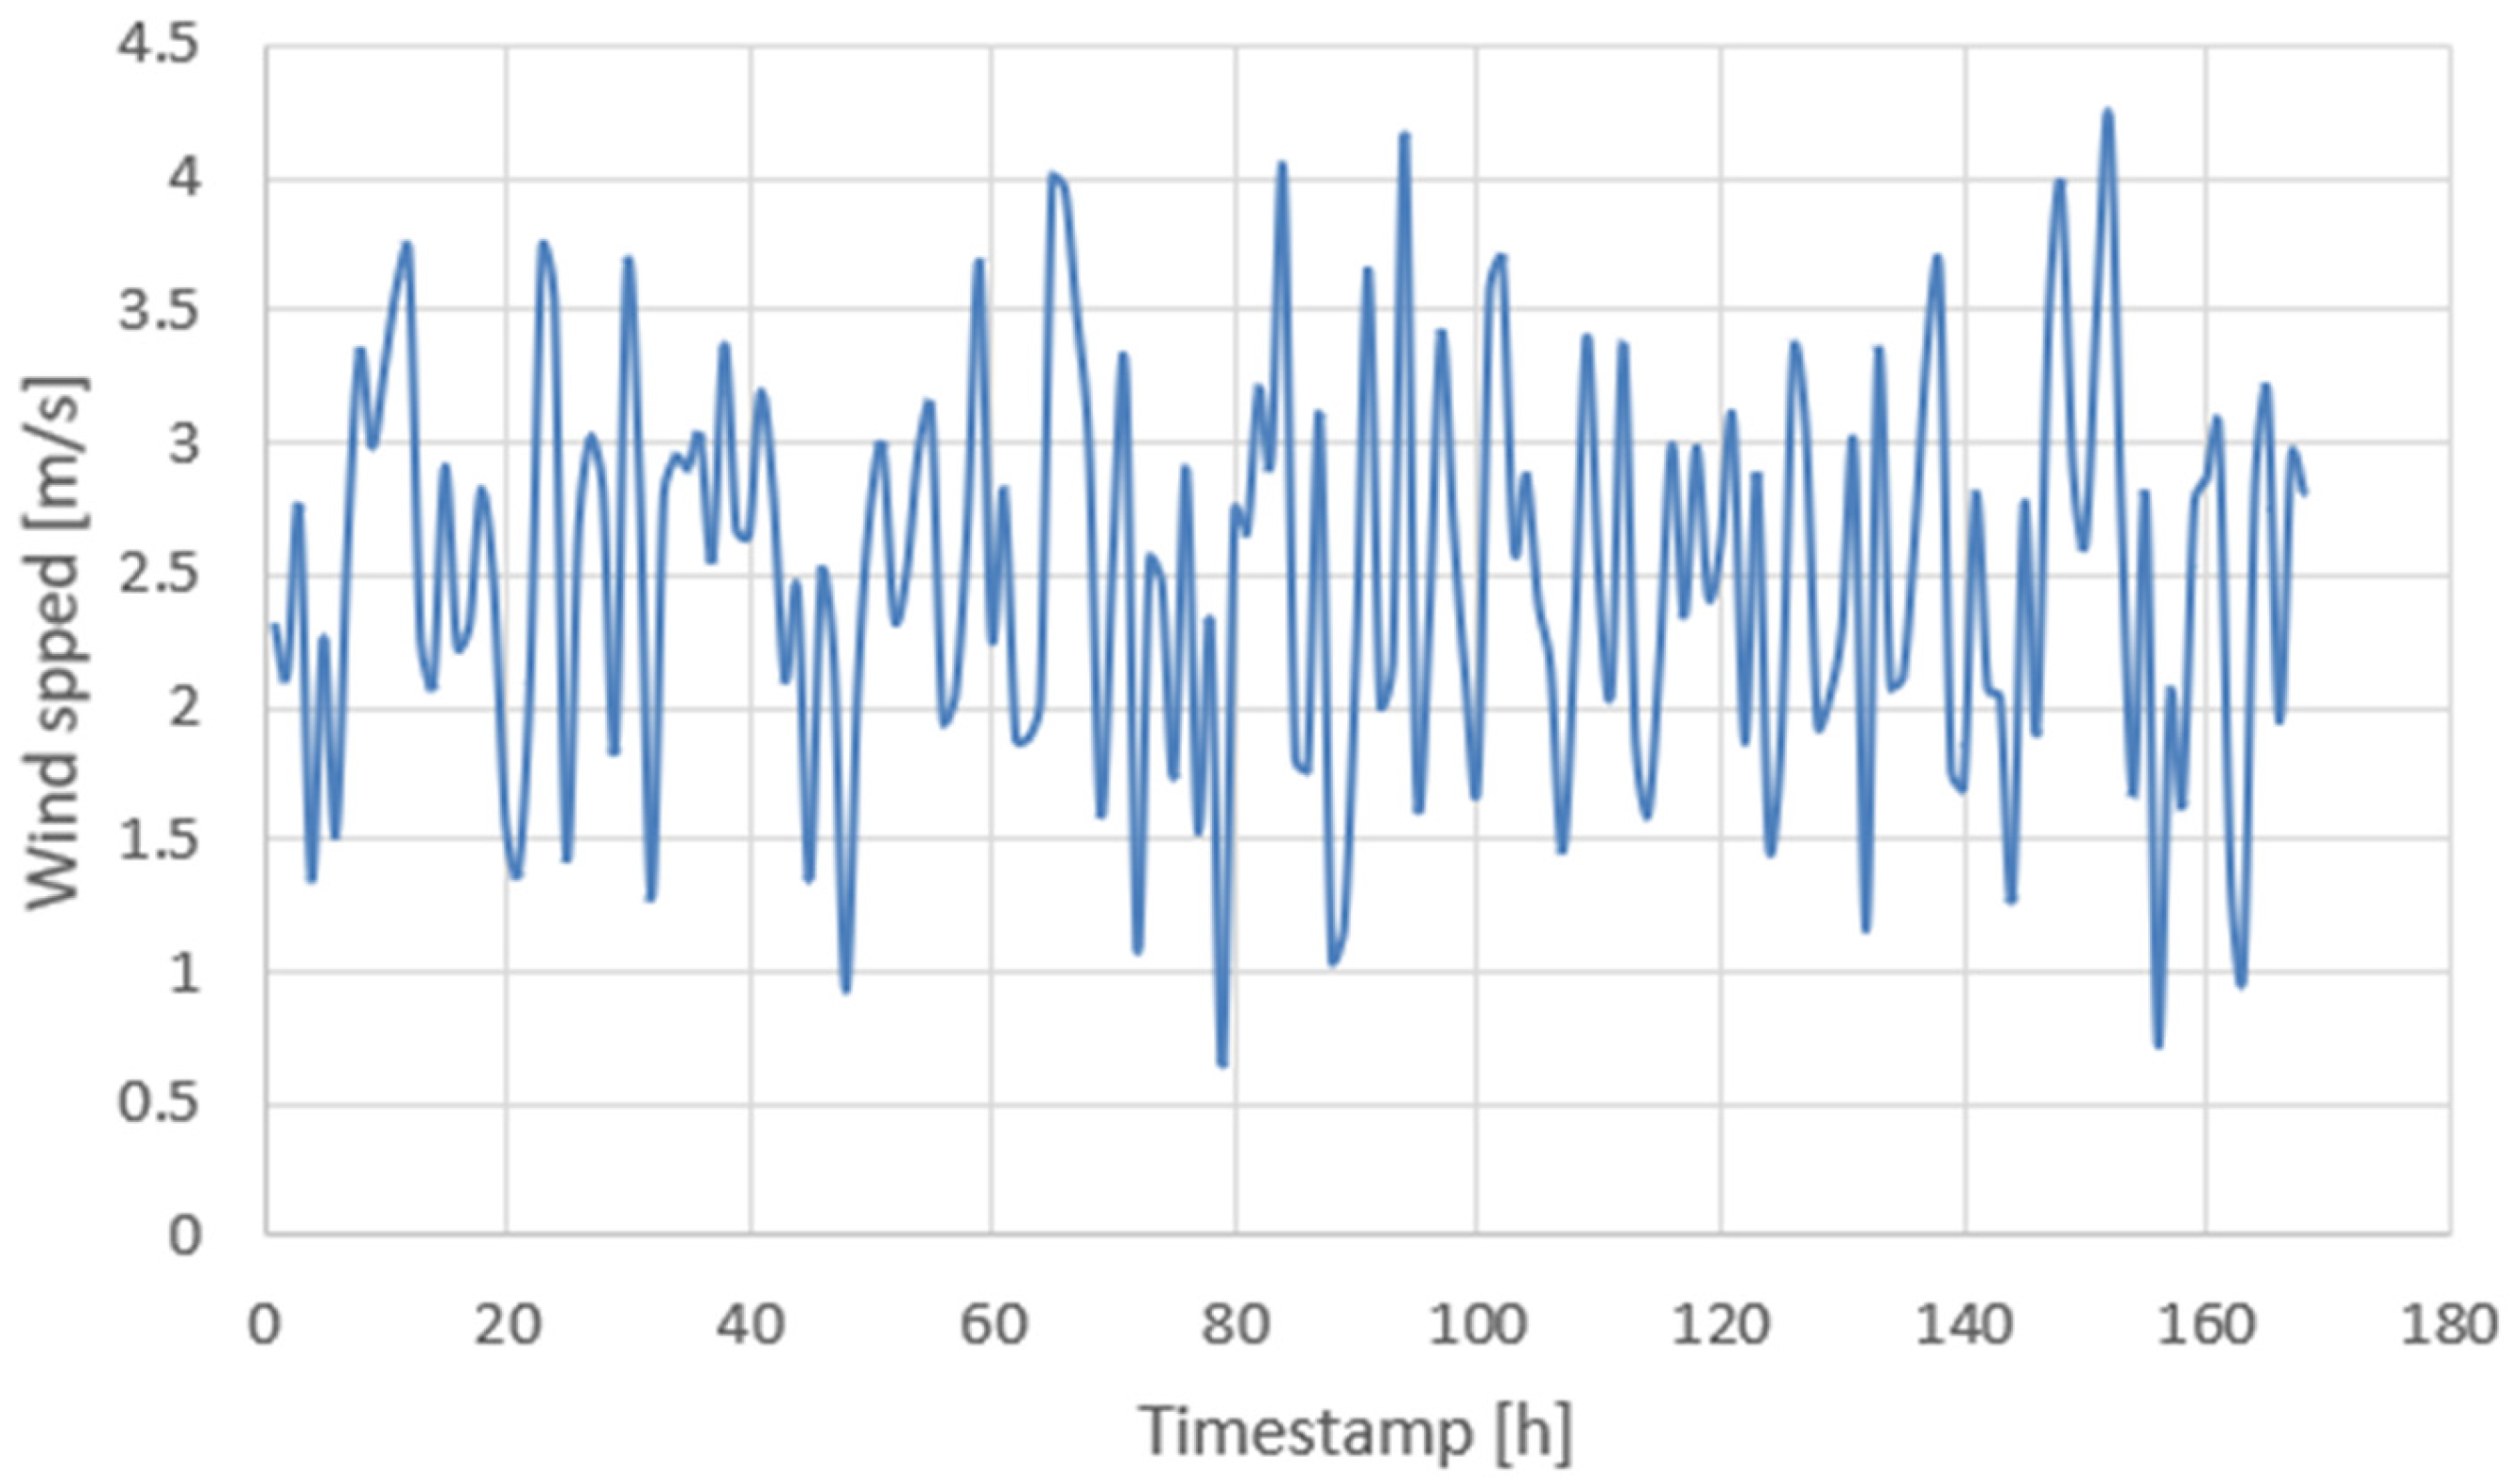
To validate the reliability of the selected temperature sensor, a 168 h test was conducted, starting on 13 July 2025 at 12 PM at the highest point of Montejunto Mountains, located in the municipality of Cadaval, Alenquer, Portugal. Throughout this period, data from all sensors were recorded at 30 min intervals, ensuring continuous monitoring under real-world environmental conditions. All the results are presented in Figure 19, Figure 20, Figure 21, Figure 22, Figure 23 and Figure 24.
Figure 19 illustrates the temperature profile recorded for seven days, or 168 h. The data reflects variations with time, with temperatures varying between close to 22 °C and 38 °C, typical of the diurnal cycle wherein temperatures rise during the day and fall during the night. Short-term variations, which were expected to fall between 2 and 3 °C, also come into play here, influenced by local environmental factors.
Figure 19. Outdoor temperature recorded in Montejunto Mountains over 168 h. Detailed temperature values are provided.
Designs 09 00091 g019
The relative humidity observations for a day and over the full 168 h are shown in Figure 20. The humidity levels range between 43% and 63%, exhibiting short-term fluctuations that are erratic but do not form a clear daily pattern. These variations could represent the outcome of one or several contrasting environmental factors, such as temperature, local microclimate, and transient atmospheric states.
Figure 20. Outdoor humidity recorded in Montejunto Mountains over 168 h. Detailed humidity values are provided.
Designs 09 00091 g020
Figure 21 plots the PM2.5 concentration (in µg/m3) for the 7 days (168 h). The data show regular and sharp spikes occurring every 5 to 6 h, with values exceeding 140 µg/m3. These spikes correspond to controlled smoke-exposure events designed to simulate polluted conditions. Between the smoke events, background PM2.5 concentrations remained below 30 µg/m3; thus, the air can be considered clean in the absence of forced contamination.
Figure 21. Outdoor PM2.5 recorded in Montejunto Mountains over 168 h. Detailed PM2.5 values are provided.
Designs 09 00091 g021
Figure 22 shows the PM10 concentrations (in µg/m3) measured over 7 days (168 h). The data shows very sharp periodic increases, within periods of 5 to 6 h, with peak values exceeding 150 µg/m3. These peaks correspond to intentional smoke exposure events during testing. Whenever there are no intentional emissions of smoke, PM10 levels remain quite low, generally below 30 µg/m3, thus providing a relatively stable baseline.
Figure 22. Outdoor PM10 recorded in Montejunto Mountains over 168 h. Detailed PM10 values are provided.
Designs 09 00091 g022
The wind speed variations observed over the seven days (168 h) are presented in Figure 23. As with nature, fluctuations were observed in the data, with values mostly ranging from 1.0 to 4.0 m/s. Variations appeared unequal, as locally driven atmospheric dynamics caused natural changes in wind intensity. No external disturbances, such as smoke-exposure testing, were introduced during the measurement period.
Figure 23. Outdoor wind speed recorded in Montejunto Mountains over a 168 h period. Detailed wind speed values are provided.
Designs 09 00091 g023
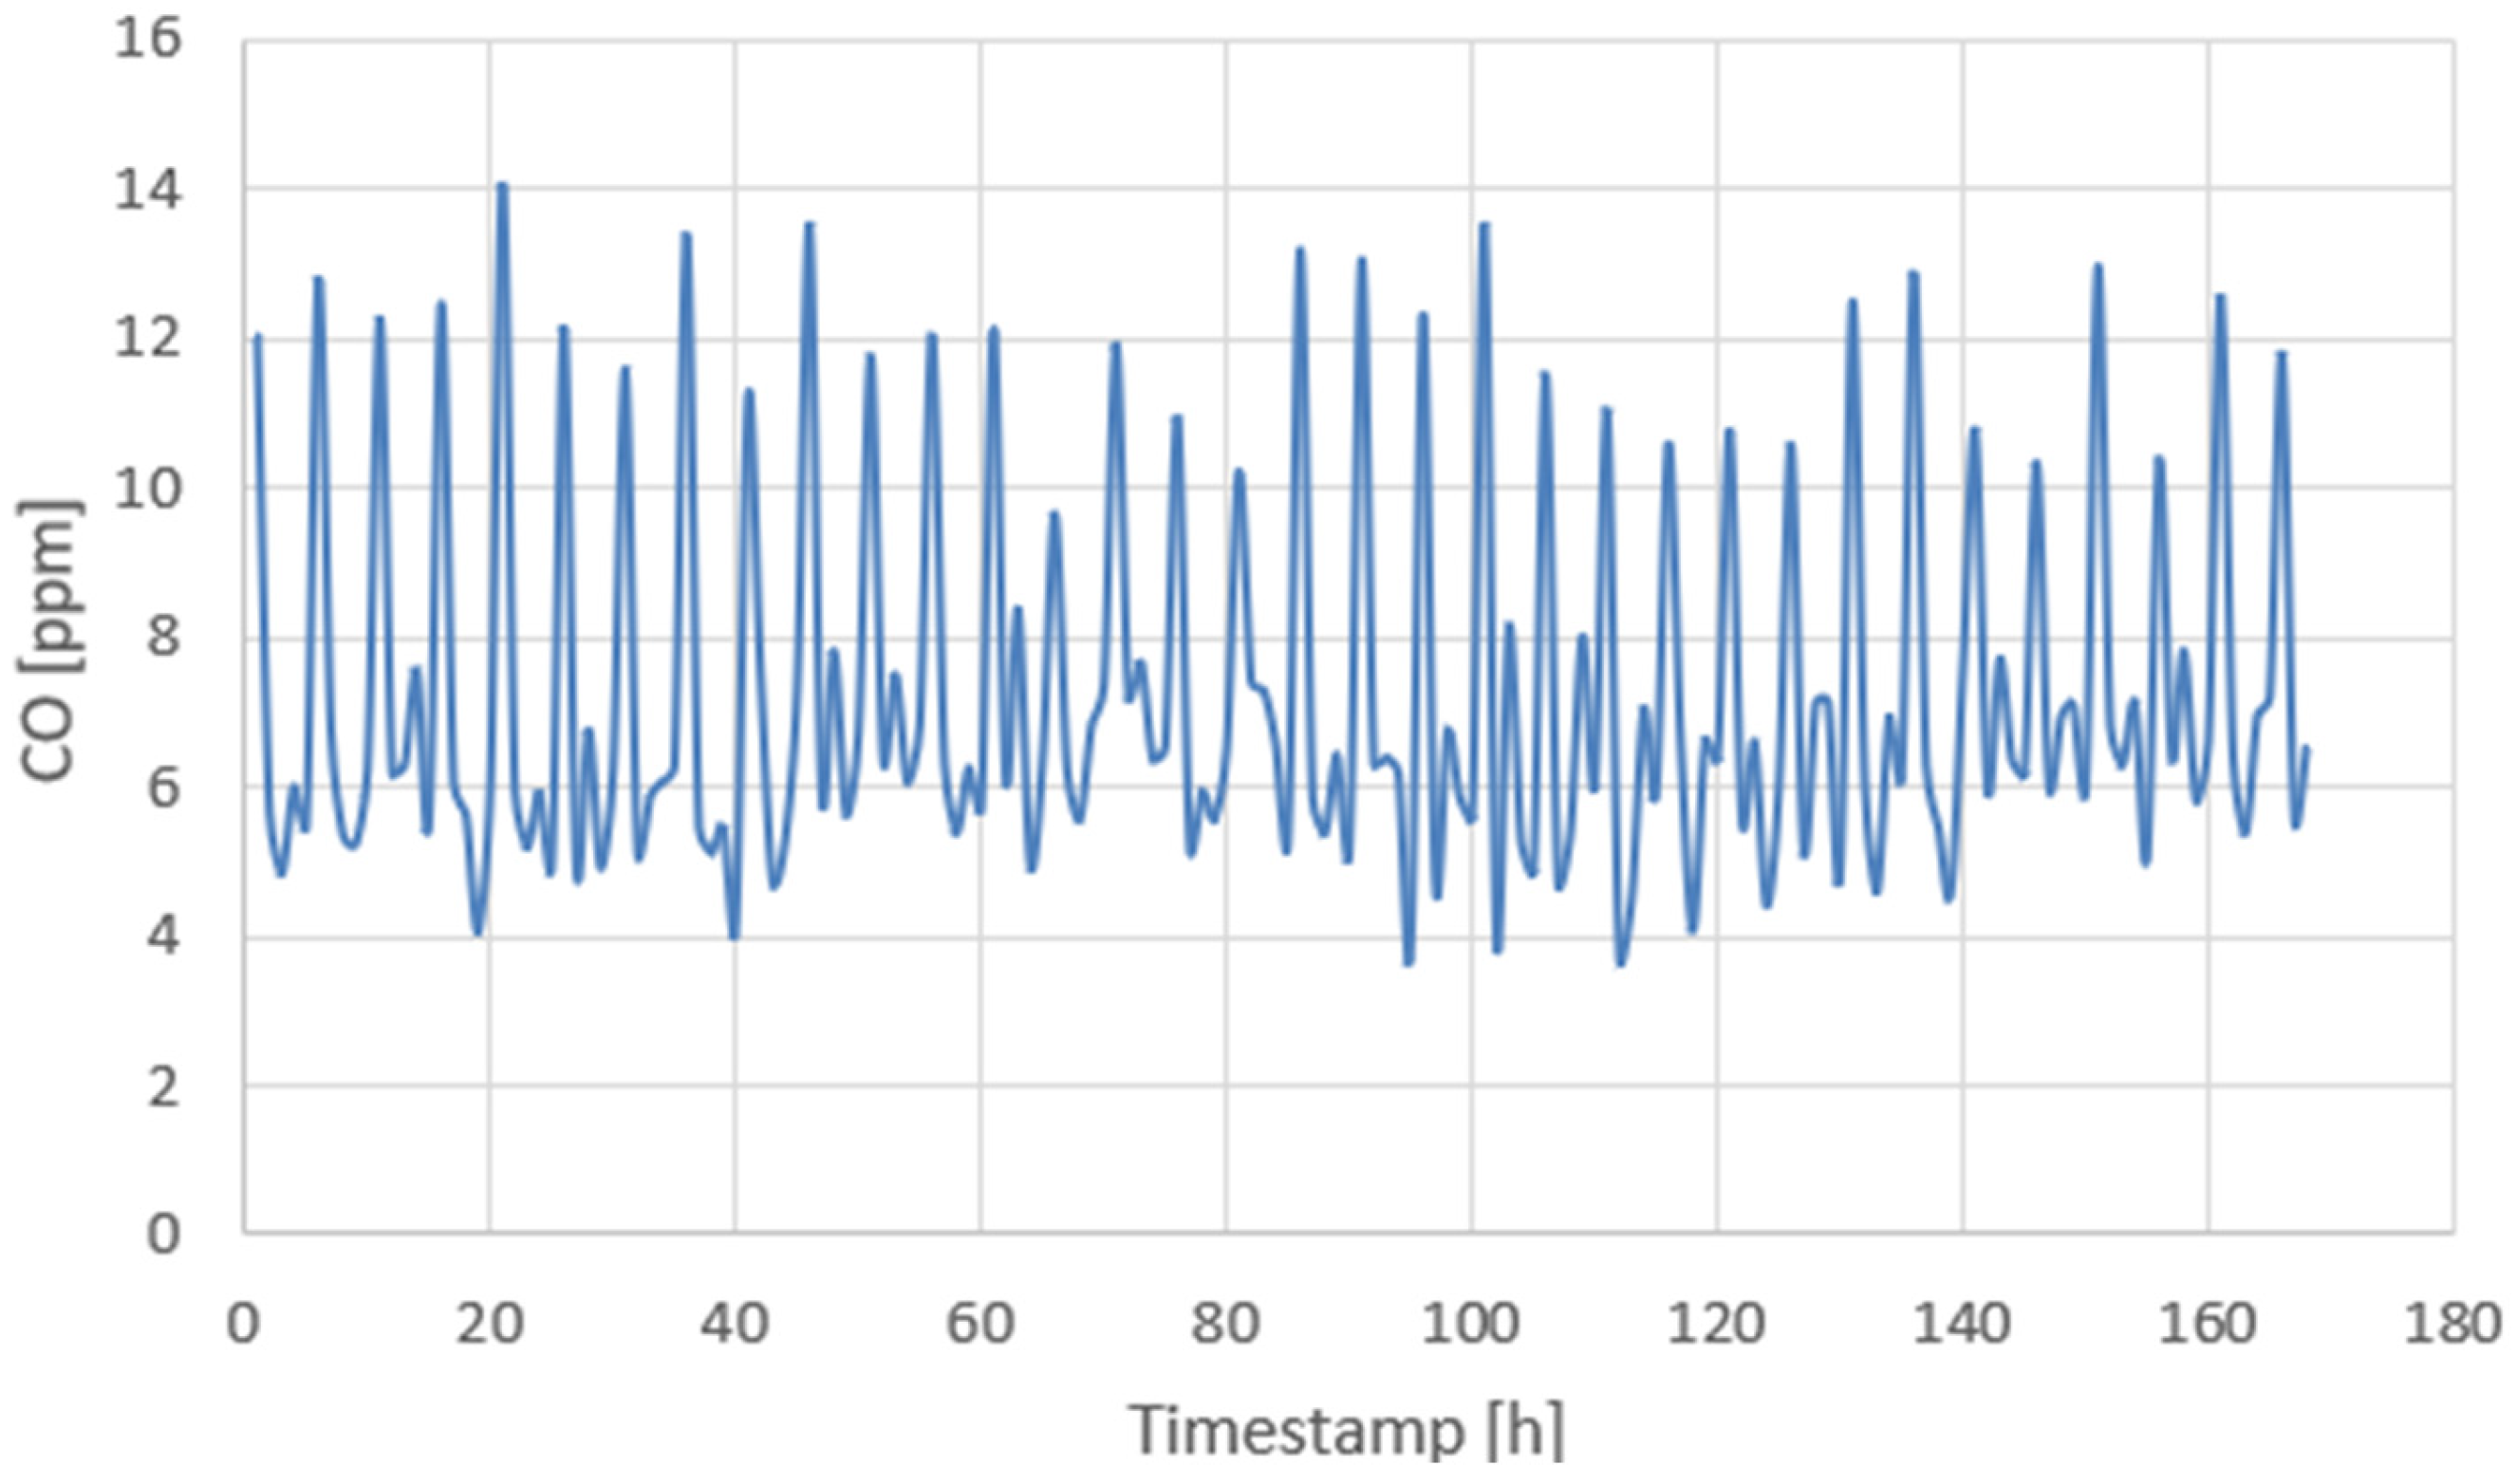
Regarding CO concentration (ppm) over 7 days (168 h), the data shows frequent and irregular peaks, with values reaching 14 ppm, as shown in Figure 24. These are associated with instances of controlled smoke-exposure events administered during the week. In the absence of smoke, the baseline CO levels varied from 5 to 7 ppm. The pattern shown here presents the effects of combustion on CO levels and the natural environmental variability.
Figure 24. Outdoor CO recorded in Montejunto Mountains over a 168 h period. Detailed CO values are provided.
Designs 09 00091 g024

4.3. Energy Consumption

Installing the LoRa node in a forest environment, where there is no energy available, presents an added challenge in terms of energy consumption. One of the sizing concerns will be to guarantee their autonomy, without the need to connect them to the electricity grid. As batteries str the system’s main energy source, their autonomy must be sufficient to withstand night-time periods when solar energy is low or non-existent.
The battery life of the node can be estimated by analyzing the instantaneous current consumption provided in the respective device datasheets. Firstly, four operational stages were defined for the node, which characterize each mode of operation, making it possible to estimate the current consumed in each mode:
  • Stage 0: MQ7 preheating phase. In this mode, the microcontroller is active, and the CO sensor begins its heating cycle. This process takes 60 s.
  • Stage 1: Sensor sampling phase. In this mode, the microcontroller is active and activates the sensors to take environmental samples.
  • Stage 2: Data transmission phase. Only the microcontroller and transceiver are turned on, and the data is sent at full power.
  • Stage 3: Hibernation phase. This is the mode in which the node will spend most of its time. In this phase, all the devices are in hibernation mode.
Table 6 summarizes the status of the devices at each stage.
By analyzing the equipment’s technical data sheets, Table 7 summarizes the energy consumption in each state—ON and OFF—for each device.
Next (Table 8), the consumption at each stage was added up according to the data shown in Table 7.
Finally, to estimate the amount of energy needed to power the node in one hour, a diagram was drawn showing the operating time at each operating stage—Table 9. It should be noted that the diagram was not drawn to scale, as stages 0, 1, and 2 are very small compared to the third stage.
By sending messages every 30 min, which adds up to one cycle, you can see that the node is in sleep mode for around 1,704,025 milliseconds, or 28 min. The time shown in Stage 2 corresponds to the estimated air-time for a payload of 55 bytes with an SF12 and BW of 125 kHz.
Finally, it is possible to calculate the capacity (in mAh) that the node needs in two cycles (one hour):
  • Stage 0: 4.17 mAh.
  • Stage 1: 0.55 mAh.
  • Stage 2: 0.08 mAh.
  • Stage 3: 32.43 mAh.
Based on the results presented above, the module requires approximately 37 mAh to execute two operational cycles per hour. Considering the 1600 mAh battery used in the test, the estimated autonomy is approximately 43 h until complete discharge.
The possibility of powering the node solely with solar energy was also analyzed. Considering that the solar panels provide an average current output of approximately 100 mA, it was concluded that the node can be powered only during periods of maximum sunlight exposure.
The experimental evaluation produced several quantitative performance indicators: temperature readings from the DHT11 sensor deviated by less than ±1 °C compared to a nearby weather station, while relative humidity measurements varied by less than ±5%. The custom anemometer showed an average deviation of ~4 km/h compared to a commercial unit. The CO and PM2.5 sensors registered significant increases near controlled fire sources. The communication tests denoted 90% packet delivery within 300 m (NLOS) and up to 2 km (LOS). The system maintained autonomous operation for multiple days under typical solar exposure with a 30 min sampling interval.
The test concluded positively, confirming that the node can be powered by either the batteries or the solar panels through the solar load manager, at least during the night period.

5. Conclusions and Future Work

The main experiment in this study focused on the design and implementation of a fully autonomous, cheap, and low-power IoT system geared toward the early detection of wildfire risks in rural domains. The system incorporates sensors with features focusing on temperature, humidity, CO, PM2.5, and wind speed, interfaced with LoRa communication and a real-time dashboard through Node-RED. The test results, carried out under LOS as well as NLOS conditions, revealed a communication range of up to 2 km, with RSSI values considered acceptable and favorable; the results were particularly encouraging in terms of the higher-than-90% packet delivery rates obtained at distances of up to 300 m under NLOS conditions and distances of up to 2 km under LOS conditions. These findings support the robustness of the LoRa communication channel and the overall viability of the proposed system. The environmental sensors recorded within their stated ranges of accuracy, thereby confirming the functional validity of the system. Although the system showed a reliable performance during the field trials, some limitations are worthy of consideration. The short campaign period limited assessment of the longevity of the sensor’s stability and reproducibility. Different terrains, obstacles, vegetation density, and weather variability could lead to different impacts.
Additionally, when using cheap sensors, drift and noise continue to creep in. Hence, experiments aiming to compare sensor calibration could not obtain any comprehensive validation over longer periods. The physical structure of the prototype was also built using less-than-ideal materials (e.g., wood), and thus was not suitable for permanent deployment outdoors. Currently, there is no wind direction measurement in the system, nor does it implement advanced data-filtering or security arrangements, limiting its application when high accuracy and robustness are required.
The focus of any future research should be on several factors that could refine the reliability and scalability of the system. Firstly, long-term field deployments should be conducted to study the degradation of sensors, their communication resilience, and their energy behavior under seasonal variability. Furthermore, the statistical analysis of sensor performance should be extended, with the inclusion of confidence intervals and anomaly patterns.
A complete deployment would require an orographic analysis of the terrain to decide on the best placements for nodes and gateways, which involves assessing signal propagation models and possibly considering the use of aerial platforms such as drones to cover inaccessible areas. Power optimization methods like sleep-scheduling and adaptive sampling rates should be applied to extend battery life and increase autonomy. Mechanical upgrades to outdoor enclosures (Acrylonitrile Butadiene Styrene (ABS), 3D-printed weather-resistant polymers, etc.) could improve operational robustness. On a software level, the introduction of AI will undoubtedly enhance system decision-making: supervised methods (e.g., Random Forests) could classify fire risk from historical data, while unsupervised ones (e.g., autoencoders) could be used for anomaly detection. Sensor fusion methods would likely reduce false positives and increase response times.

Author Contributions

Conceptualization, L.M.P., V.F. and T.P.; methodology, L.M.P., V.F., T.P. and A.M.; software, A.M. and T.P.; validation, L.M.P. and V.F.; formal analysis, L.M.P. and V.F.; investigation, L.M.P., T.P., V.F. and A.M.; resources, L.M.P., T.P. and A.M.; data curation, L.M.P., V.F., A.M. and T.P.; writing—original draft preparation, L.M.P., V.F., A.M. and T.P.; writing—review and editing, L.M.P. and V.F.; visualization, A.M. and T.P.; supervision, L.M.P. All authors have read and agreed to the published version of the manuscript.

Funding

This research received no external funding.

Data Availability Statement

Data are contained within the article.

Conflicts of Interest

The authors declare no conflicts of interest.

Abbreviations

The following abbreviations are used in this manuscript:
ABSAcrylonitrile Butadiene Styrene
BWBandwidth
COCarbon Monoxide
CNCCritical Noxious Concentration
CRCode Rate
CSSChirp Spread Spectrum
DHTDigital Humidity and Temperature
IoTInternet of Things
IoRTInternet of Robotic Things
LoRaLong Range
LOSLine of Sight
LSTMLong Short-Term Memory
M2MMachine-to-Machine
MFBMean Fractional Bias
MQTTMessage Queuing Telemetry Transport
NLOSNon-Line of Sight
PM2.5Particulate Matter less than 2.5 µm
PM10Particulate Matter less than 10 µm
RMSERoot Mean Square Error
ROSRobot Operating System
RSSIReceived Signal Strength Indicator
SFSpreading Factor
SNRSignal-to-Noise Ratio
TFTThin-Film Transistor
ToATime on Air
WSNWireless Sensor Network

Appendix A. Sensor Specification

DHT11—Temperature and Humidity Sensor, a low-cost digital sensor used for basic ambient monitoring:
  • Temperature range: 0–50 °C (accuracy: ±2 °C).
  • Relative humidity: 20–95 % (accuracy: ±5 %).
  • Single-wire digital output, sampling every 1 s; suitable for trend detection rather than precision measurement.
MQ-7—Carbon Monoxide Sensor, an electrochemical gas sensor for CO detection:
  • Detection range: 20–2000 ppm.
  • Analog output based on resistance change.
  • Heating cycle: 60 s at 5 V (high), 90 s at 1.4 V (low).
  • Requires calibration via RS/R0 ratio based on datasheet curve [31].
PM2.5/PM10 Sensor—Optical Air-Quality Sensor, a laser scattering-based sensor for particulate matter detection:
  • PM2.5 (<2.5 µm) and PM10 (<10 µm) detection.
  • UART digital output.
  • Internal laser and photodiode configuration.
  • Accuracy typically ±10 µg/m3; effective for identifying smoke and pollution concentrations.
Custom-Built Anemometer, a DIY anemometer based on a DC motor from a teaching kit:
  • Wind speed, derived from output voltage and known motor constant.
  • Radius of propeller: 5 cm.
  • Voltage-to-speed conversion obtained using Equation (4).

Appendix B. Algorithm Overview

Node Firmware:
  • Developed in C language.
  • Rule-based logic using 30-30-30 wildfire threshold.
  • Discards values outside physical limits (e.g., temperature < −10 °C or wind < 0 m/s).
  • Integrates the MQ-7 heating/cooling cycle control.
Gateway Firmware:
  • Implemented in Python on a Raspberry Pi.
  • Decodes LoRa payload, publishes to MQTT topics.
  • Feeds Node-RED for real-time visualization.
Communication Stack:
  • LoRa: SF7–SF12, BW = 125 kHz, CR = 4/5.
  • MQTT: lightweight publish/subscribe protocol.
  • Node-RED: dashboard creation and data display.

References

  1. European Research Executive Agency. The EU-Funded Projects Helping to Fight Forest Fires. Available online: https://rea.ec.europa.eu/news/fighting-flames-eu-funded-projects-protecting-forests-fire-destruction-2024-07-23_en (accessed on 5 October 2024).
  2. Kobziar, L.N.; Hiers, J.K.; Belcher, C.M.; Bond, W.J.; Enquist, C.A.; Loudermilk, E.L.; Miesel, J.R.; O’bRien, J.J.; Pausas, J.G.; Hood, S.; et al. Principles of Fire Ecology. Fire Ecol. 2024, 20, 39. [Google Scholar] [CrossRef]
  3. Divisão de Gestão do Programa de Fogos. 3.º Relatório Provisório de Incêndios Rurais (3.º RPIR/DGPFR/2022). 1 August 2022. Available online: https://www.icnf.pt/api/file/doc/282a0e22f28cc3c7 (accessed on 5 October 2024).
  4. Lloret, J.; Garcia, M.; Bri, D.; Sendra, S. A Wireless Sensor Network Deployment for Rural and Forest Fire Detection and Verification. Sensors 2009, 9, 8722–8747. [Google Scholar] [CrossRef] [PubMed]
  5. Navarro-Ortiz, J.; Sendra, S.; Ameigeiras, P.; Lopez-Soler, J.M. Integration of LoRaWAN and 4G/5G for the Industrial Internet of Things. IEEE Commun. Mag. 2018, 56, 60–67. [Google Scholar] [CrossRef]
  6. Semtech. LoRa Modulation Basics; AN1200.22. 2015. Available online: https://www.semtech.com/uploads/technology/LoRa/lora-and-lorawan.pdf (accessed on 10 January 2025).
  7. Soderholm, B. How the 30-30-30 Rule Is Essential for Wildfire Safety; The Weather Network: Oakville, ON, Canada, 2024; Available online: https://www.theweathernetwork.com/en/news/weather/severe/how-the-30-30-30-rule-is-essential-for-wildfire-safety (accessed on 12 March 2025).
  8. Gokhale, P.; Bhat, O.; Bhat, S. Introduction to IoT. Int. Adv. Res. J. Sci. Eng. Technol. 2018, 5, 41–44. [Google Scholar]
  9. Farooq, M.U.; Waseem, M.; Mazhar, S.; Khairi, A.; Kamal, T. A Review on Internet of Things (IoT). Int. J. Comput. Appl. 2015, 113, 1–7. [Google Scholar] [CrossRef]
  10. Gaitan, N.C.; Hojbota, P. Forest Fire Detection System Using LoRa Technology. Int. J. Adv. Comput. Sci. Appl. 2020, 11, 18–21. [Google Scholar] [CrossRef]
  11. Statista. IoT Connected Devices Worldwide 2019–2030. Available online: https://www.statista.com/statistics/1183457/iot-connected-devices-worldwide/ (accessed on 9 April 2025).
  12. Mohammadi, M.; Al-Fuqaha, A.; Sorour, S.; Guizani, M. Deep Learning for IoT Big Data and Streaming Analytics: A Survey. IEEE Commun. Surv. Tutor. 2018, 20, 2923–2960. [Google Scholar] [CrossRef]
  13. Sagiroglu, S.; Sinanc, D. Big Data: A Review. In Proceedings of the 2013 International Conference on Collaboration Technologies and Systems (CTS), San Diego, CA, USA, 20–24 May 2013; pp. 42–47. [Google Scholar] [CrossRef]
  14. Shah, S.A.; Seker, D.Z.; Hameed, S.; Draheim, D. The Rising Role of Big Data Analytics and IoT in Disaster Management: Recent Advances, Taxonomy and Prospects. IEEE Access 2019, 7, 54595–54614. [Google Scholar] [CrossRef]
  15. Arasteh, H.; Hosseinnezhad, V.; Loia, V.; Tommasetti, A.; Troisi, O.; Shafie-khah, M.; Siano, P. IoT-Based Smart Cities: A Survey. In Proceedings of the 2016 IEEE 16th International Conference on Environment and Electrical Engineering (EEEIC), Florence, Italy, 7–10 June 2016; pp. 1–6. [Google Scholar]
  16. Riazul Islam, S.M.; Kwak, D.; Kabir, M.H.; Hossain, M.; Kwak, K.-S. The Internet of Things for Health Care: A Comprehensive Survey. IEEE Access 2015, 3, 678–708. [Google Scholar] [CrossRef]
  17. Sisinni, E.; Saifullah, A.; Han, S.; Jennehag, U.; Gidlund, M. Industrial Internet of Things: Challenges, Opportunities, and Directions. IEEE Trans. Ind. Inf. 2018, 14, 4724–4734. [Google Scholar] [CrossRef]
  18. Bakker, K.; Ritts, M. Smart Earth: A Meta-Review and Implications for Environmental Governance. Glob. Environ. Change 2018, 52, 201–211. [Google Scholar] [CrossRef]
  19. González García, C.; Meana-Llorián, D.; Pelayo G-Bustelo, B.C.; Cueva Lovelle, J.M.; Garcia-Fernandez, N. Midgar: Detection of People through Computer Vision in the Internet of Things Scenarios to Improve the Security in Smart Cities, Smart Towns, and Smart Homes. Future Gener. Comput. Syst. 2017, 76, 301–313. [Google Scholar] [CrossRef]
  20. Alkhatib, A.A.A. A Review on Forest Fire Detection Techniques. Int. J. Distrib. Sens. Netw. 2014, 10, 597368. [Google Scholar] [CrossRef]
  21. Subashini, M.J.; Sudarmani, R.; Gobika, S.; Varshini, R. Development of Smart Flood Monitoring and Early Warning System Using Weather Forecasting Data and Wireless Sensor Networks—A Review. In Proceedings of the Third International Conference on Intelligent Communication Technologies and Virtual Mobile Networks (ICICV), Tirunelveli, India, 4–6 February 2021; pp. 132–135. [Google Scholar] [CrossRef]
  22. Al-Nawafleh, A.; Al-Sarayreh, K.; Al-Rababah, A.; Al-Tarawneh, M.; Alshraideh, H. EFFSIP: Efficient Forest Fire System Using IoT and Parallel Computing. Egypt. Inform. J. 2025, 29, 100631. [Google Scholar] [CrossRef]
  23. Chan, C.C.; Alvi, S.A.; Zhou, X.; Durrani, S.; Wilson, N.; Yebra, M. A Survey on IoT Ground Sensing Systems for Early Wildfire Detection: Technologies, Challenges and Opportunities. IEEE Access 2024, 12, 172785–172819. [Google Scholar] [CrossRef]
  24. Battistoni, P.; Cantone, A.A.; Martino, G.; Passamano, V.; Romano, M.; Sebillo, M.; Vitiello, G. A Cyber-Physical System for Wildfire Detection and Firefighting. Future Internet 2023, 15, 237. [Google Scholar] [CrossRef]
  25. Üremek, İ.; Leahy, P.; Popovici, E. A System for Efficient Detection of Forest Fires through Low Power Environmental Data Monitoring and AI. Eng. Proc. 2024, 68, 38. [Google Scholar] [CrossRef]
  26. De Rango, A.; Furnari, L.; Cortale, F.; Senatore, A.; Mendicino, G. Wildfire Early Warning System Based on a Smart CO2 Sensors Network. Sensors 2025, 25, 2012. [Google Scholar] [CrossRef] [PubMed]
  27. Arduino. Arduino Mega ADK Rev3. Available online: https://docs.arduino.cc/retired/boards/arduino-mega-adk-rev3/ (accessed on 12 March 2025).
  28. RFM95. RFM95 LoRa Module. Available online: https://www.botnroll.com/pt/lora-868/2600-rfm95-m-dulo-lora-868mhz.html (accessed on 12 March 2025).
  29. DHT11. DHT11 Sensor. Available online: https://www.botnroll.com/pt/temperatura/471-sensor-de-temperatura-e-humidade-dht11.html (accessed on 12 March 2025).
  30. Air Quality. Air Quality Sensor SDS011. Available online: https://botland.store/air-quality-sensors/8332-laser-dustair-sensor-pm25-pm10-sds011-5v-uartpwm-5904422375829.html (accessed on 12 March 2025).
  31. CO. CO MQ7 Sensor. Available online: https://elcereza.com/mq7/ (accessed on 12 March 2025).
  32. Anemometer. Anemometer Manufacturer TopHomer. Available online: https://www.walmart.com/ip/Vertical-Wind-Turbines-Small-Motor-Blades-Generator-for-DIY-Teaching/8760510557?classType=REGULAR (accessed on 12 March 2025).
  33. Raspberry Pi. Raspberry Pi 3 Model B+. Available online: https://www.raspberrypi.com/products/raspberry-pi-3-model-b-plus/ (accessed on 12 March 2025).
  34. TFT Display. 7 Inch HDMI LCD (C). Available online: https://www.waveshare.com/wiki/7inch_HDMI_LCD_%28C%29 (accessed on 12 March 2025).
  35. NASA Earth Observatory. Carbon Monoxide & Fire. 31 August 2022. Available online: https://earthobservatory.nasa.gov/global-maps/MOP_CO_M/MOD14A1_M_FIRE (accessed on 10 December 2024).
  36. Semtech Semiconductor. IoT Systems and Cloud Connectivity. Available online: https://www.semtech.com (accessed on 10 February 2025).
  37. Semtech. Understanding LoRa Adaptive Data Rate. Available online: https://lora-developers.semtech.com/uploads/documents/files/Understanding_LoRa_Adaptive_Data_Rate_Downloadable.pdf (accessed on 10 February 2025).
  38. Rabaça, A.F.B. Aplicação de Tecnologia LoRaWAN à Monitorização de Redes de Distribuição de Energia. 2018. Available online: https://fenix.tecnico.ulisboa.pt/cursos/meec/dissertacoes (accessed on 20 February 2025).
  39. The Things Network. Spreading Factors | The Things Network. Available online: https://www.thethingsnetwork.org/docs/lorawan/spreading-factors/ (accessed on 12 December 2024).
  40. Etiabi, Y.; Jouhari, M.; Amhoud, E.M. Spreading Factor and RSSI for Localization in LoRa Networks: A Deep Reinforcement Learning Approach. arXiv 2022, arXiv:2205.11428. [Google Scholar] [CrossRef]
  41. Arrow Electronics. Solar Panel. Available online: https://www.arrow.com/ (accessed on 12 March 2025).
  42. Seeedstudio. LiPo Rider Pro. Available online: https://wiki.seeedstudio.com/Lipo_Rider_Pro/ (accessed on 12 March 2025).
  43. Seeedstudio. Lithium-Ion Polymer Battery Pack 6A. Available online: https://www.seeedstudio.com/Lithium-Ion-polymer-Battery-pack-6A-p-602.html (accessed on 12 March 2025).
  44. OASIS Standard. MQTT Version 5.0. Available online: https://docs.oasis-open.org/mqtt/mqtt/v5.0/mqtt-v5.0.html (accessed on 12 March 2025).
  45. Autodesk. Autodesk AutoCAD 2024. Available online: https://www.autodesk.pt/products/autocad/overview (accessed on 12 March 2025).
  46. Wambebe, N.; Duan, X. Air Quality Levels and Health Risk Assessment of Particulate Matters in Abuja Municipal Area, Nigeria. Atmosphere 2020, 11, 817. [Google Scholar] [CrossRef]
  47. Google. Google Maps. Available online: https://maps.google.com (accessed on 22 June 2025).
  48. OpenJS Foundation. Node-RED. Available online: https://nodered.org/ (accessed on 12 March 2025).
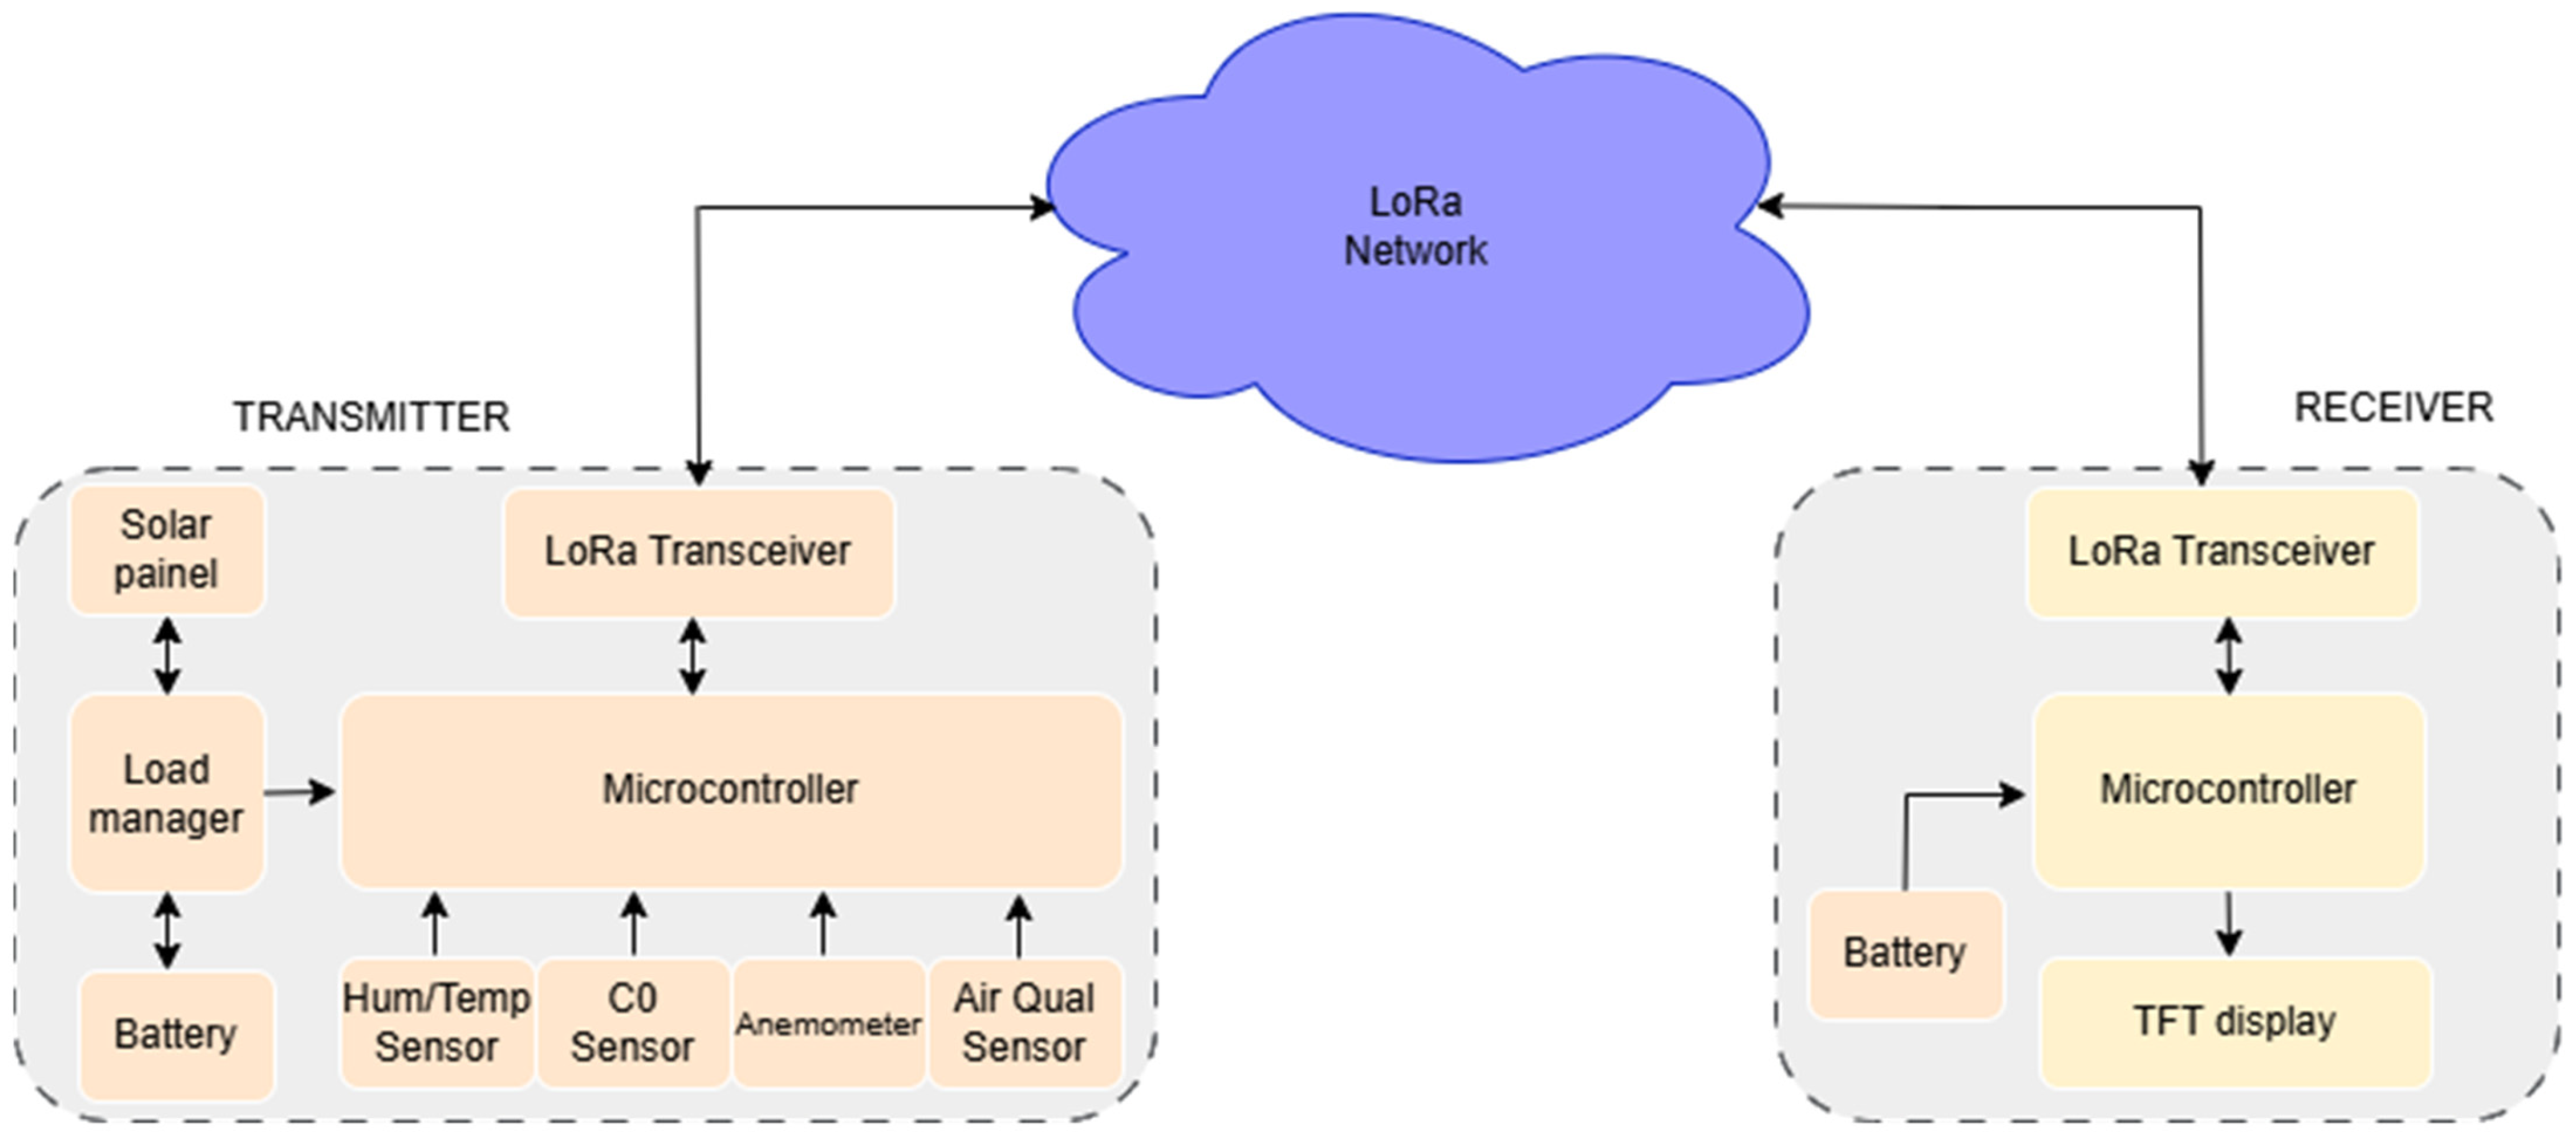
Figure 1. Schematic overview of the complete wildfire monitoring system architecture.
Designs 09 00091 g001
Figure 2. View of the custom-built anemometer, showing the 3D-printed propellers used to capture wind speed.
Designs 09 00091 g002
Figure 3. Sensitivity characteristics of the CO sensor (extracted from [31]).
Designs 09 00091 g003
Figure 4. MQ7 heating cycles (extracted from [31]).
Designs 09 00091 g004
Figure 5. The physical data frame used in LoRa communication.
Designs 09 00091 g005
Figure 6. Example of MQTT functionality (adapted from [45]).
Designs 09 00091 g006
Figure 7. IoT node top and bottom view.
Designs 09 00091 g007
Figure 8. Final prototype: the solar panel is shown on the left; the IoT node in the middle; and the right gateway on the right.
Designs 09 00091 g008
Figure 9. IoT-Edge node flowchart.
Designs 09 00091 g009
Figure 10. Gateway flowchart.
Designs 09 00091 g010
Figure 11. Outdoor temperature measurements.
Designs 09 00091 g011
Figure 12. Outdoor relative humidity measurements.
Designs 09 00091 g012
Figure 13. CO measurements.
Designs 09 00091 g013
Figure 14. Air-quality measurements.
Designs 09 00091 g014
Figure 15. Comparison between the commercial anemometer and the custom-built anemometer over a 28 min interval. The plot shows wind velocity measurements [km/h] for both sensors. Performance metrics: Root Mean Square Error (RMSE): 4.42 km/h; Pearson correlation coefficient (r): 0.91; Mean Fractional Bias (MFB): –52.16%.
Designs 09 00091 g015
Figure 16. NLOS test site (adapted from [47]).
Designs 09 00091 g016
Figure 17. LOS test site (adapted from [47]).
Designs 09 00091 g017
Figure 18. Node-RED dashboard developed for the real-time monitoring of key environmental parameters related to wildfire risk. The interface displays sensor data collected by the deployed IoT node, including temperature (25.9 °C), relative humidity (45%), wind speed (0 km/h), carbon monoxide concentration (MQ-7 sensor, raw value: 45), and particulate matter levels (PM10 and PM2.5, both 6 µg/m3). The color-coded gauges enable an intuitive interpretation of the monitored variables, supporting early detection and response strategies for environmental hazard conditions.
Designs 09 00091 g018
Table 1. Summary of the relevant research discussed.
ArticleTechnologies UsedFocusSensor Used
[21]Wi-Fi and
Cloud
Flood monitoring and early warning systemRain, ultrasonic, temperature, and level
[22]LoRa transceivers and Gateway with multiple interfaces: Wi-Fi, LoRa, 3G/GPRS, and BluetoothEarly fire detection, prediction of fire spread and behavior, energy efficiency, and testing and validation in a real environmentTemperature and
humidity
[23]LoRa/LoRaWAN and IoT
Camaras
Early detection of forest fires, with emphasis on the latency, accuracy, and energy efficiency of IoT devicesThis article is a survey identifying multiple types of sensors: pressure, wind speed, soil moisture, gas, smoke, and flame detectors.
[24]IoT UAVs and autonomous UGVs with ROS
M2M communication (MQTT) and Node-Red
Early detection and automatic response to fires, integration between sensors and collaborative robotics, and autonomous operation and remote monitoring in real timeTemperature, humidity
RGB and infrared camera, CO sensor, and UAV equipped with location and extinguishing sensors
[25]LoRa node equipped with BME280, Gateway, and MQTT for data transmissionEarly detection of fires based on environmental anomalies, optimizing communication and energy with LoRa/MQTT, with predictive modelsBME280
[26]LoRaWAN and CloudEarly detection of forest fires through changes in CO2 levels, increasing sensitivity, and temporal coverage with the use of AI.Smart CO2 sensors
This workLoRa, Gateway,
M2M, based on MQTT, Node-RED dashboard
Smart detection of wildfire prevention
Fire risk conditions
Firmware implementation of wildfire safety rule: 30-30-30
Temperature, wind, humidity, CO, air quality (PM2.5 and PM10)
Table 2. Temperature and Humidity Rio Maior, Portugal weather station—13 June 2024.
Max.
Temperature [°C]
Min.
Temperature
[°C]
Max. Relative
Humidity
[%]
Min. Relative
Humidity
[%]
23.714.39555
Table 3. Typical air-quality values [46].
IQAPM2.5 (µg/m3)PM10 (µg/m3)Level of Health Concern
0–50 0–12 0–54 Good
51–100 12.1–35.4 55–154 Moderate
101–150 35.5–55.4 155–254 Dangerous for sensitive groups
151–200 55.5–150.4 255–354 Dangerous
201–300 150.5–250.4 355–424 Very dangerous
301 e -high 250.5–high 425–high Toxic
Table 4. NLOS results.
LocalDistance (m)SFReceived PacketAverage RSSI (dBm)
P1 100 7, 10 and 12 For SF7: 10/10
For SF10: 10/10
For SF12: 10/10
For SF7 10/10: −59
For SF10 10/10: −60
For SF12 10/10: −57
P2 300 7, 10 and 12For SF7: 8/10
For SF10: 7/10
For SF12: 10/10
For SF7 10/10: −83
For SF10 10/10: −85
For SF12 10/10: −79
P3 350 7, 10 and 12For SF7: 8/10
For SF10: 10/10
For SF12: 10/10
For SF7 10/10: −77
For SF10 10/10: −73
For SF12 10/10: −93
P4 500 7, 10 and 12For SF7: 3/10
For SF10: 4/10
For SF12: 7/10
For SF7 10/10: −93
For SF10 10/10: −93
For SF12 10/10: −94
P5 850 7, 10 and 12For SF7: 0/10
For SF10: 0/10
For SF12: 3/10
For SF7 10/10: no RSSI
For SF10 10/10: no RSSI
For SF12 10/10: −99
Table 5. LOS results.
LocalDistance (m)SFReceived PacketAverage RSSI (dBm)
P1 600 7, 10, and 12 For SF7: 10/10
For SF10: 10/10
For SF12: 10/10
For SF7 10/10: −74
For SF10 10/10: −73
For SF12 10/10: −73
P2 1500 7, 10, and 12For SF7: 10/10
For SF10: 10/10
For SF12: 10/10
For SF7 10/10: −86
For SF10 10/10: −84
For SF12 10/10: −83
P3 1800 7, 10, and 12For SF7: 10/10
For SF10: 10/10
For SF12: 7/10
For SF7 10/10: −77
For SF10 10/10: −77
For SF12 10/10: −77
Table 6. Summary of each stage.
StageMCUSensorsLoRA Module RX
Preheating MQ7ONOnly MQ7 OFF
SamplingONON OFF
Data transmission ONOFF ON
Sleep mode OFFOFF OFF
Table 7. Energy consumption ON and OFF.
DeviceConsumption ON State [mA]Consumption Idle State [mA]
Arduino Mega 2560 R3 45 24
RFM9524 10
DHT11 0.3 0.06
MQ7 70 -
PM2.5 120 0.2
Table 8. Summary of each stage.
StageArduino Mega
[mA]
Sensors
[mA]
LoRa Module
Tx [mA]
Total
[mA]
Preheating MQ745 70 10 125
Sampling45 190.3 10 245.3
Data transmission 45 0.26 24 69.26
Sleep mode 24 0.26 10 34.26
Table 9. Operating time and consumption in each stage.
Stage 0Stage 1Stage 2Stage 3
Air-time [ms]60,000400019751,704,025
Consumption [mA]125245.369.2634.26
Disclaimer/Publisher’s Note: The statements, opinions and data contained in all publications are solely those of the individual author(s) and contributor(s) and not of MDPI and/or the editor(s). MDPI and/or the editor(s) disclaim responsibility for any injury to people or property resulting from any ideas, methods, instructions or products referred to in the content.