
Emerging Insights into the Durability of 3D-Printed Concrete: Recent Advances in Mix Design Parameters and Testing


Abstract
1. Introduction
2. Durability Properties
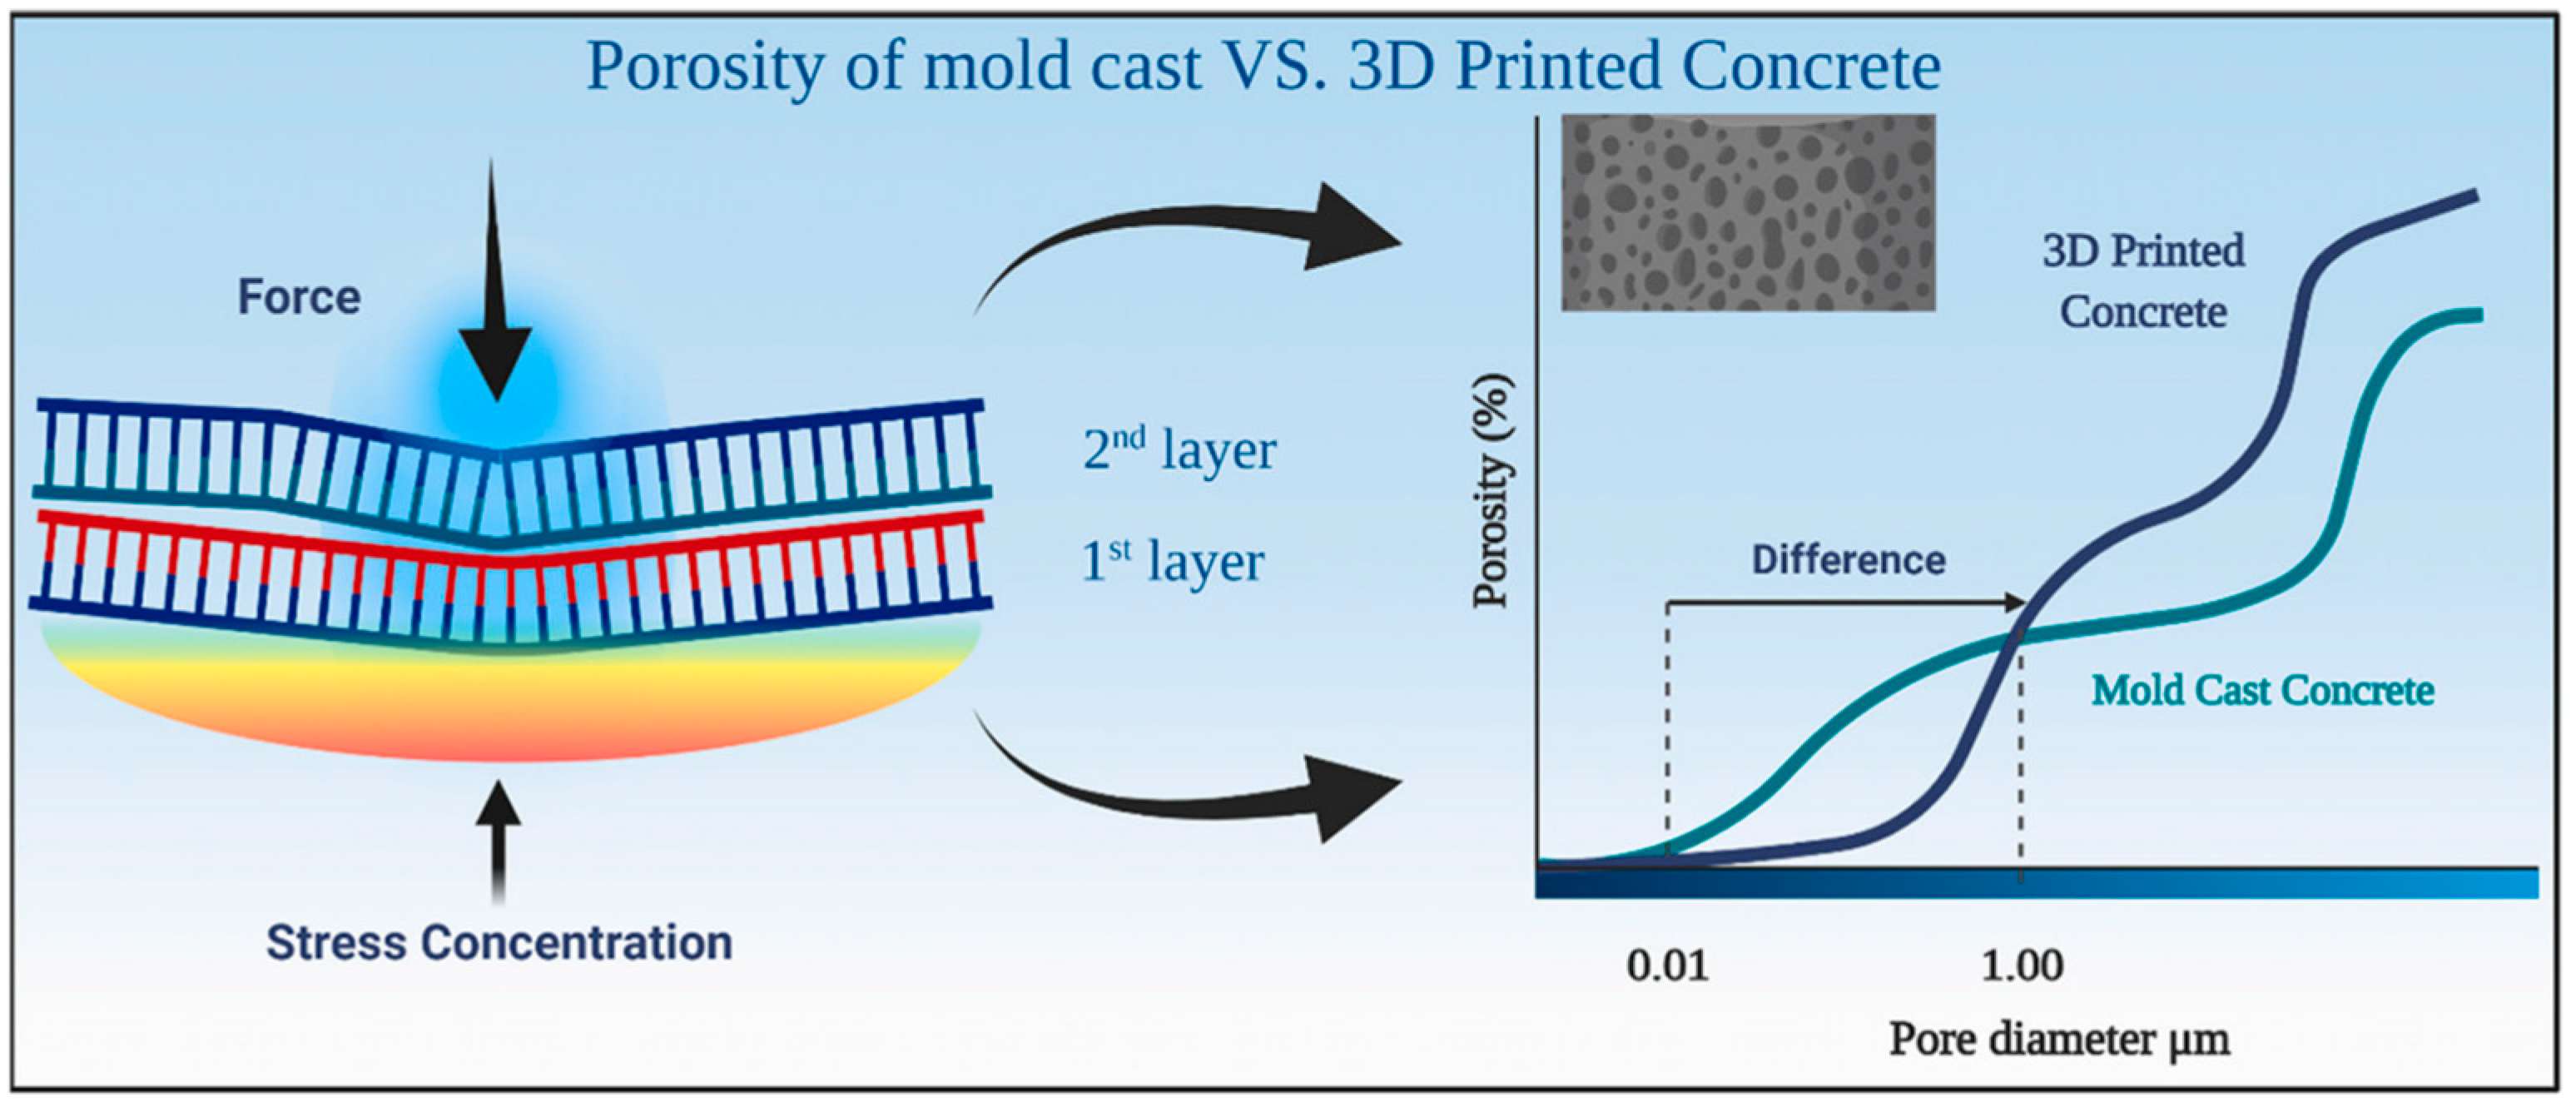
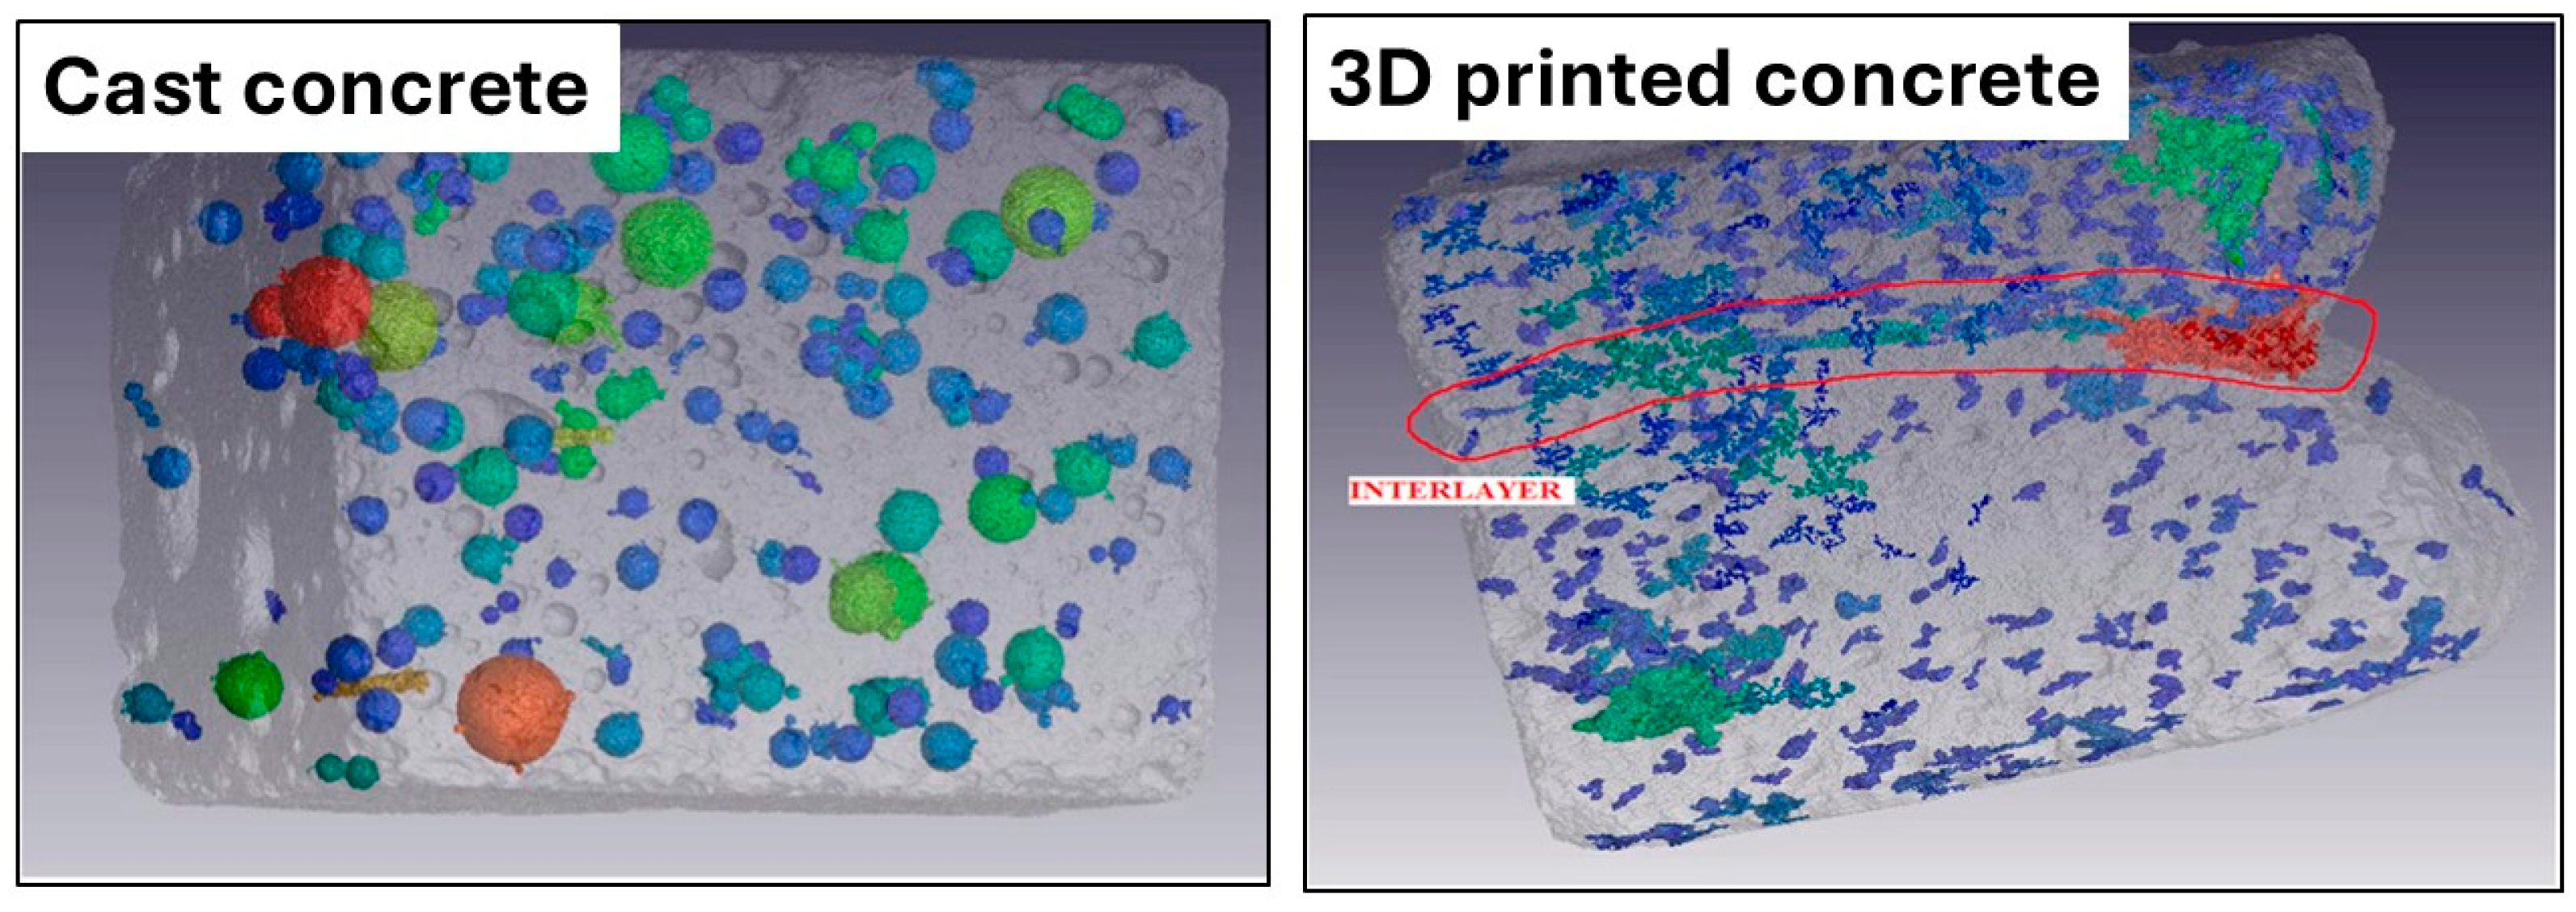
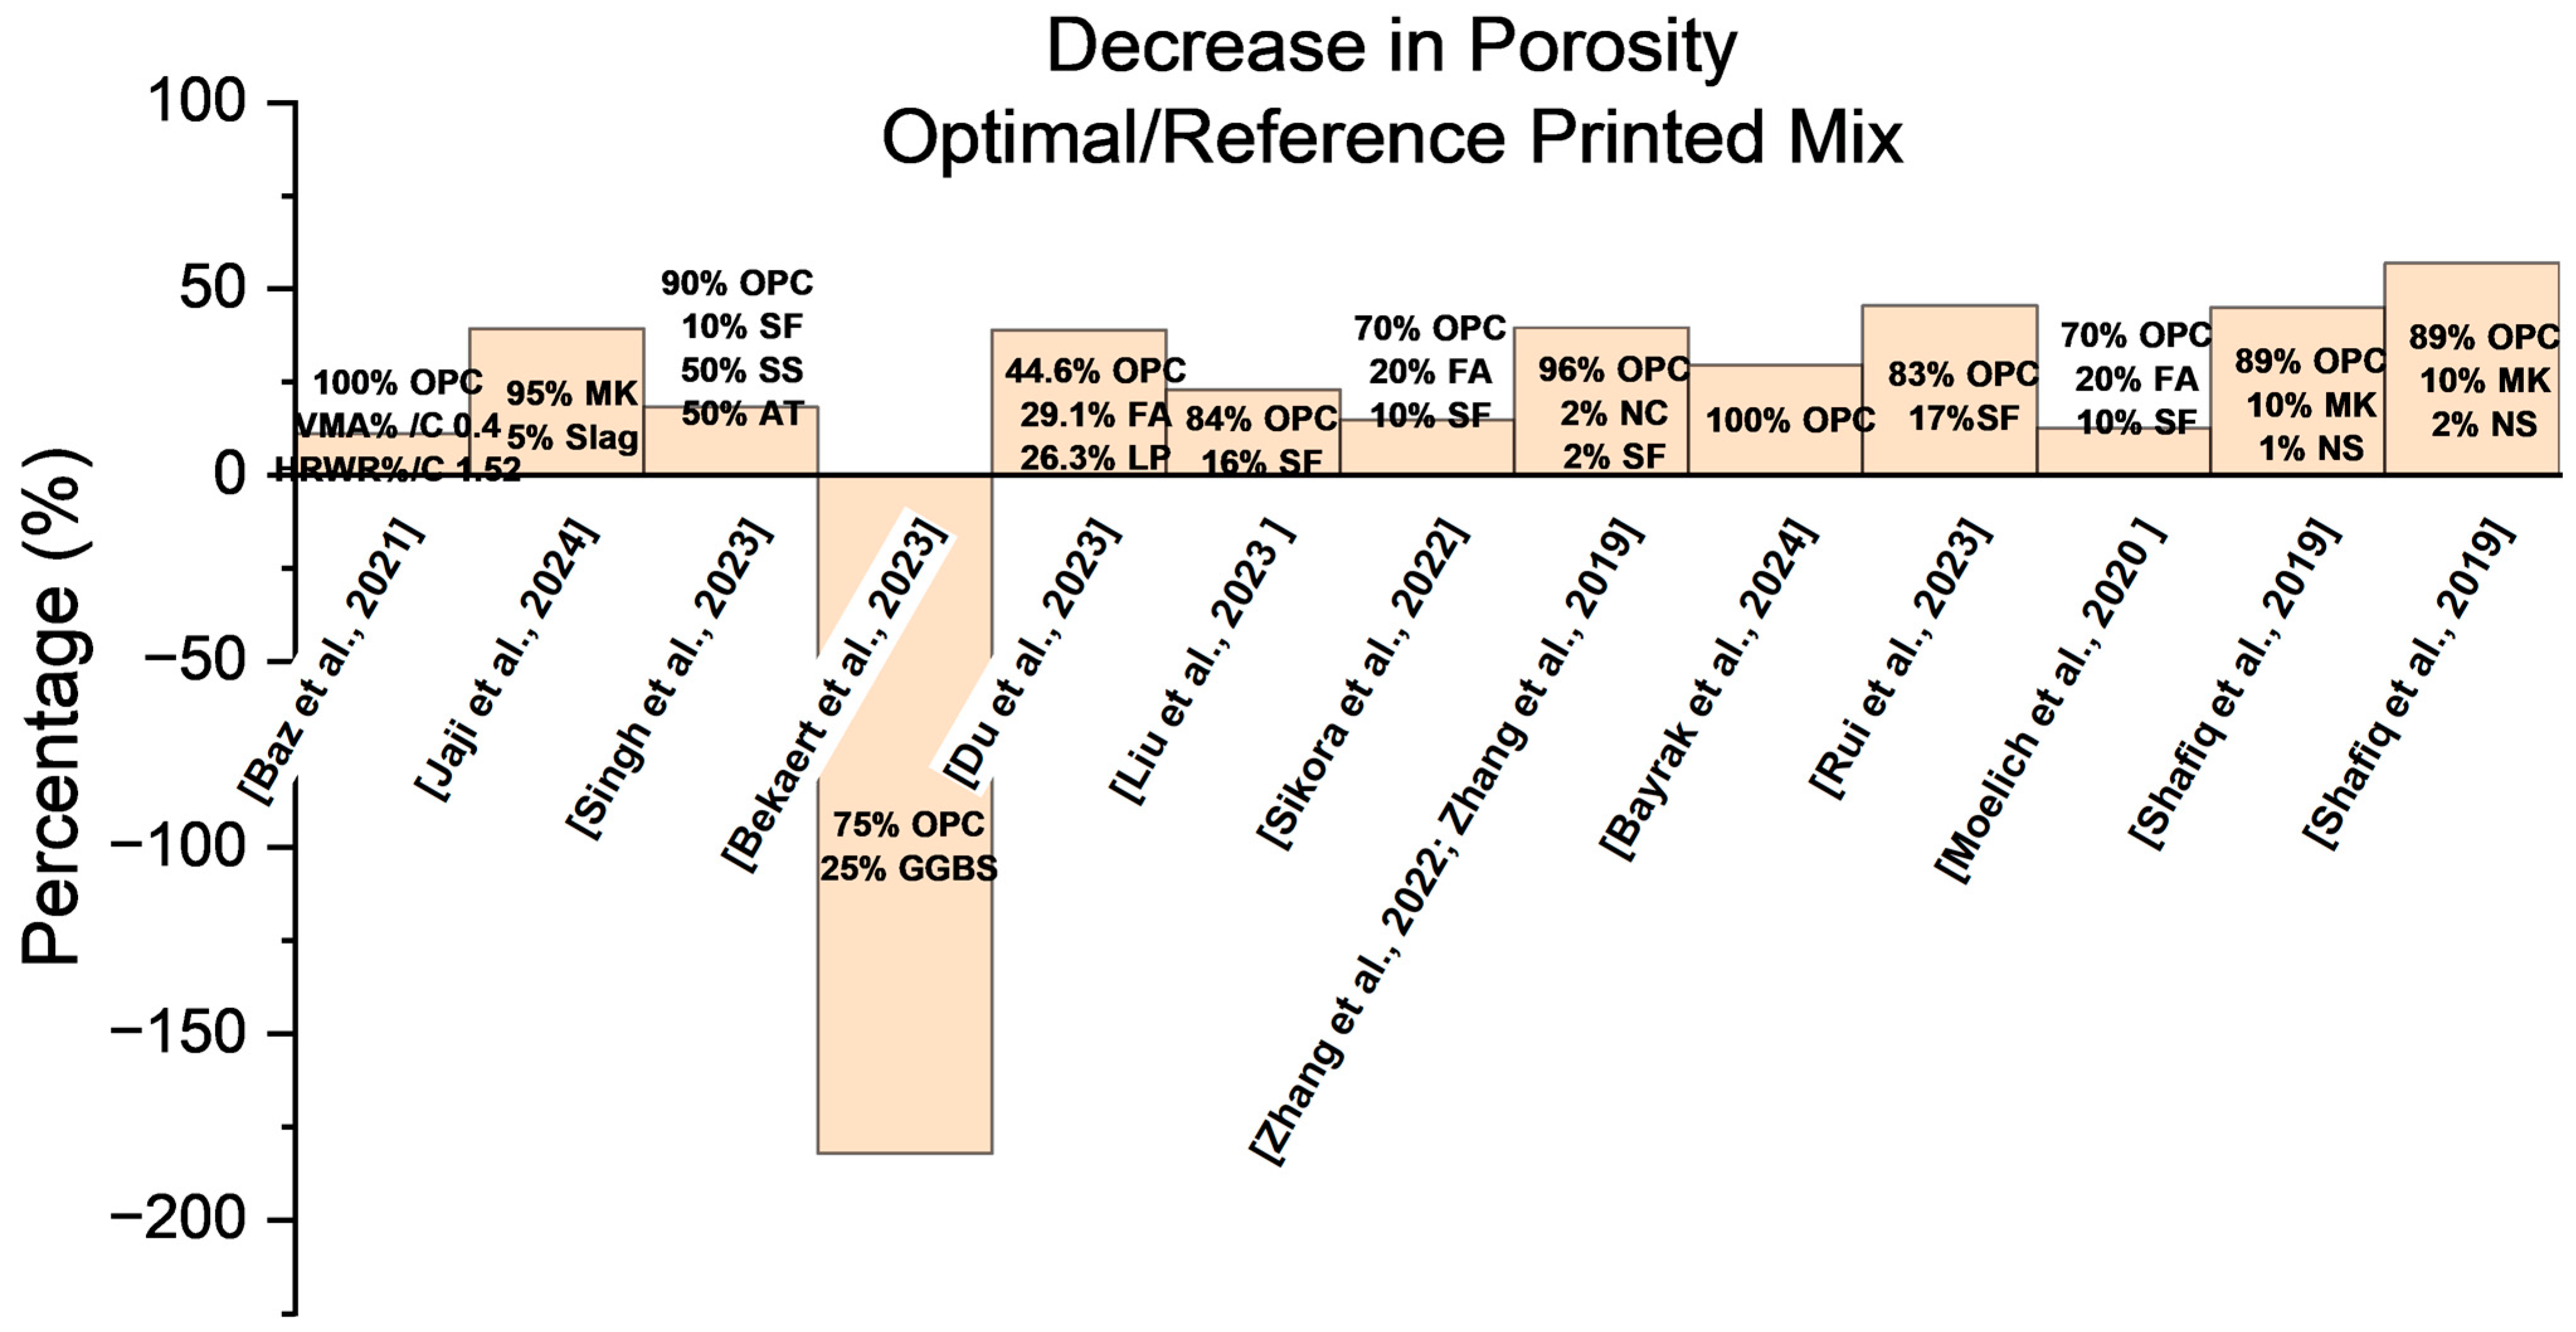
2.1. Porosity
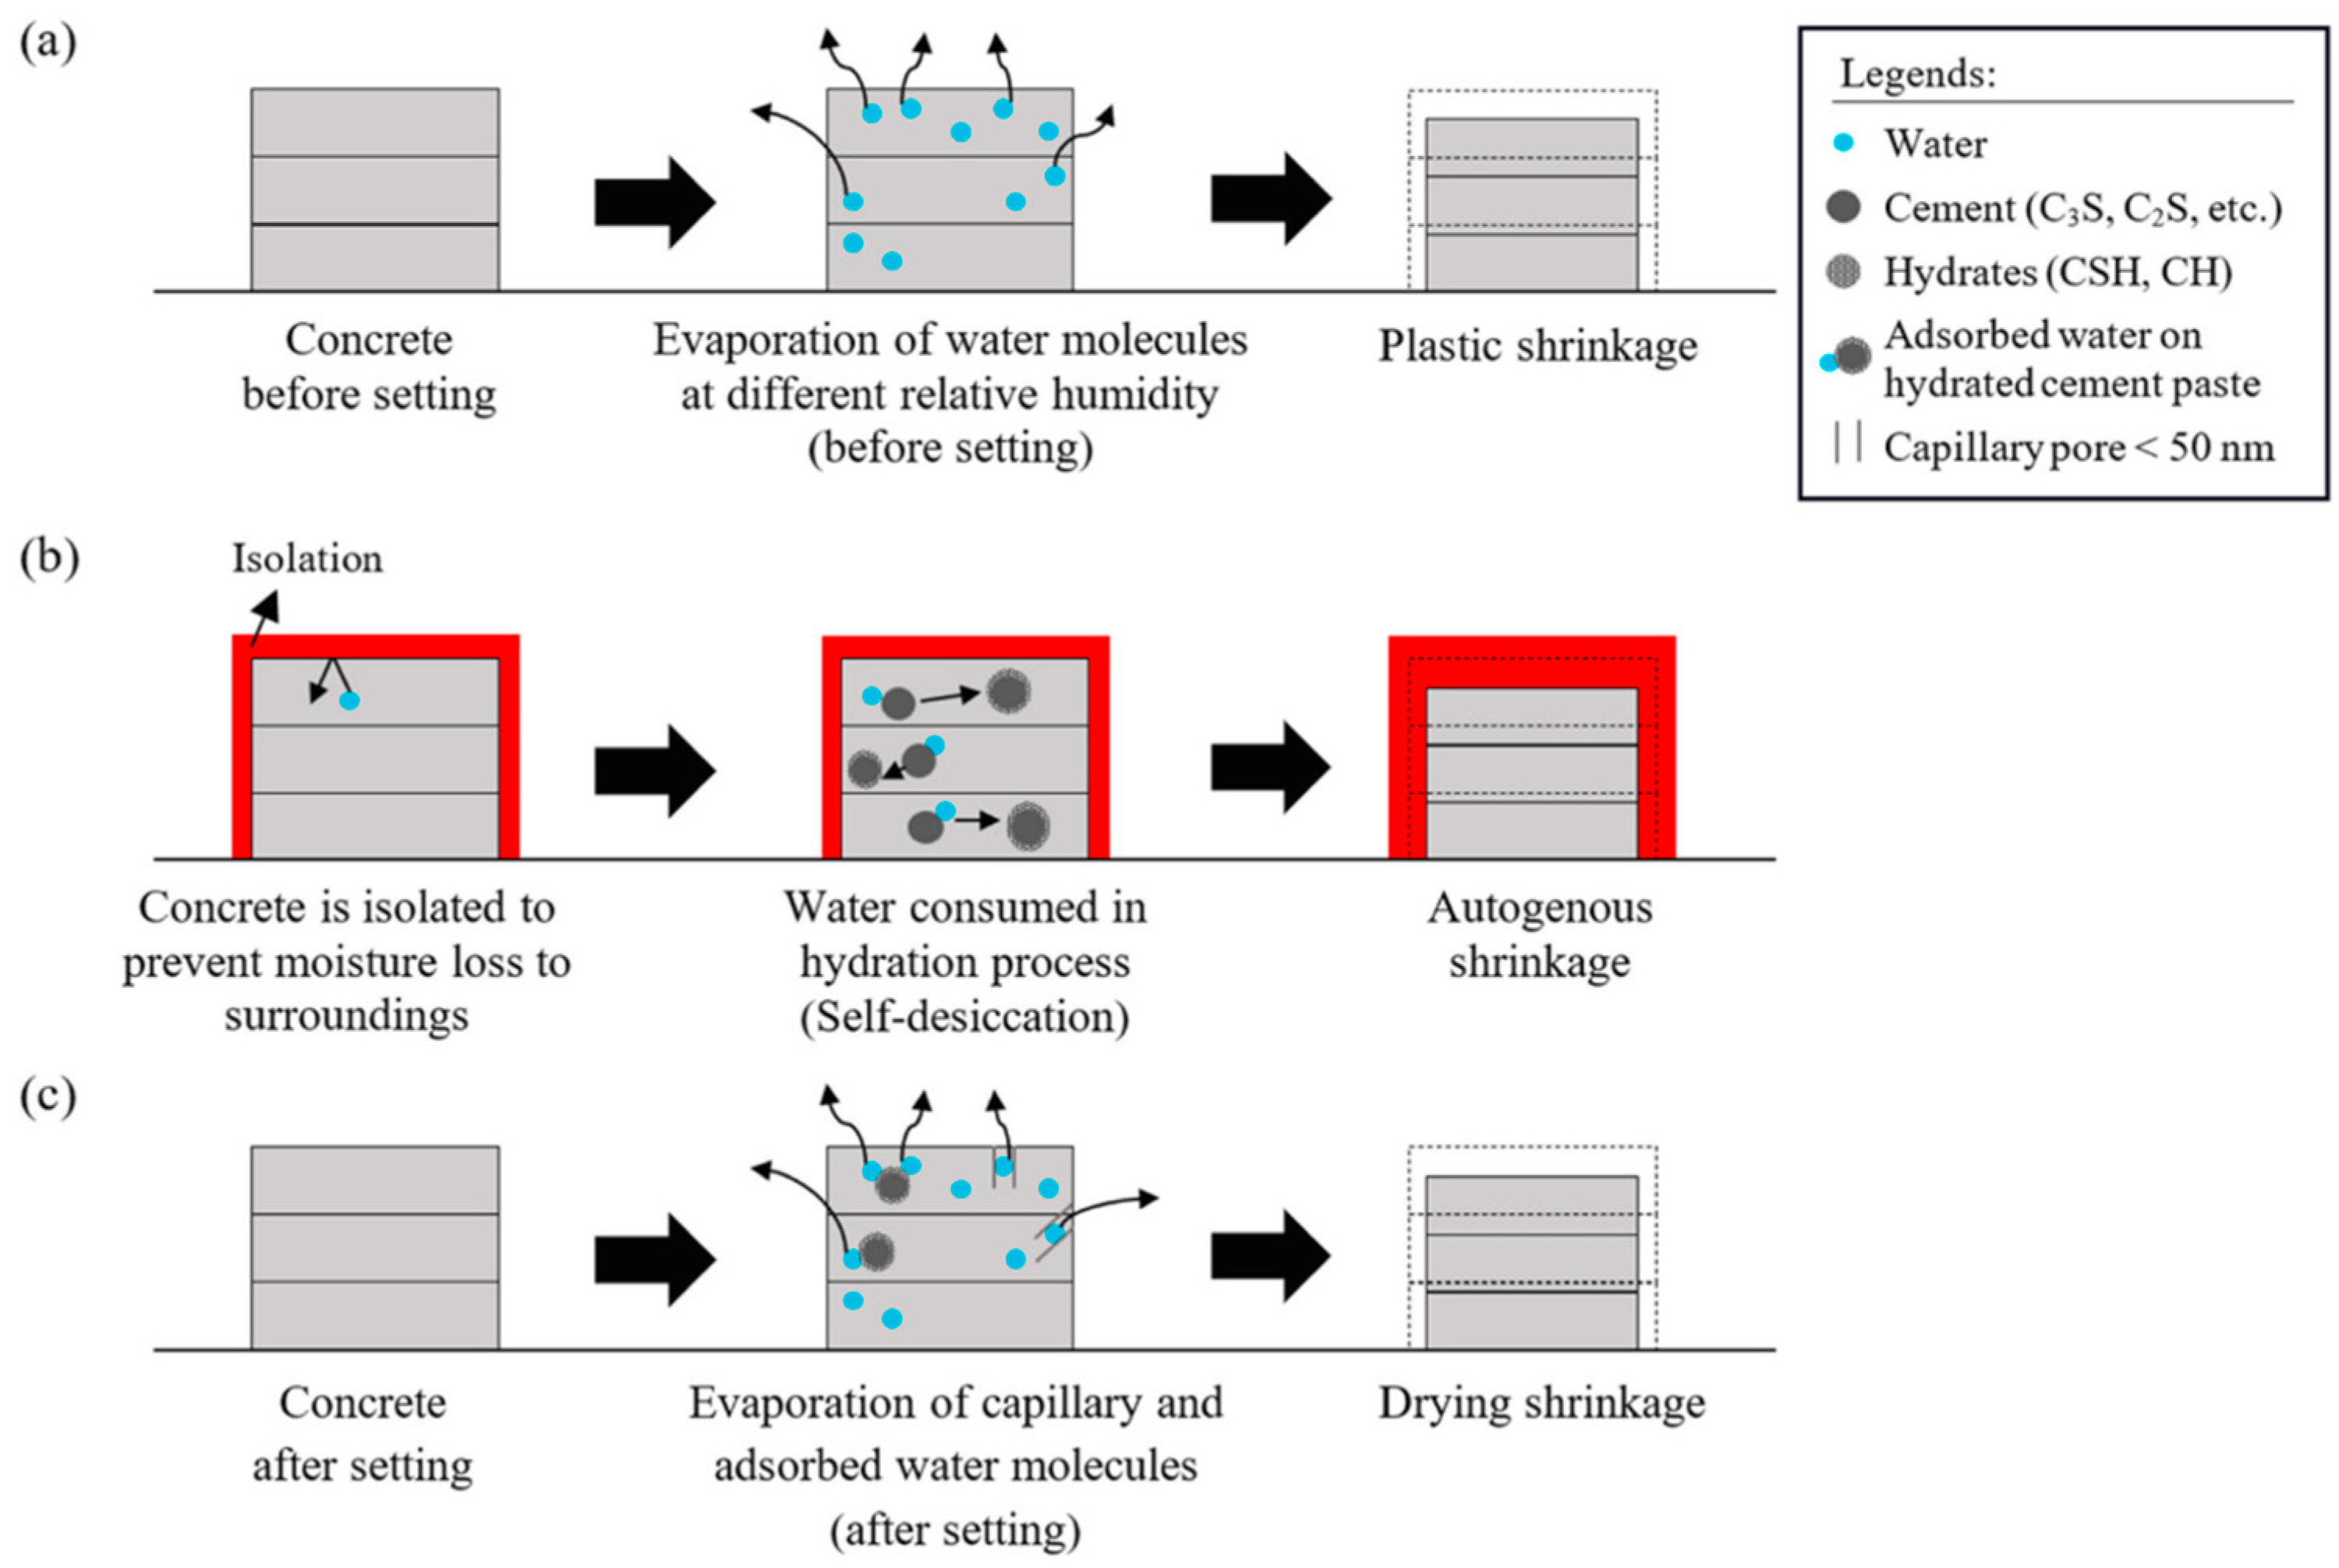
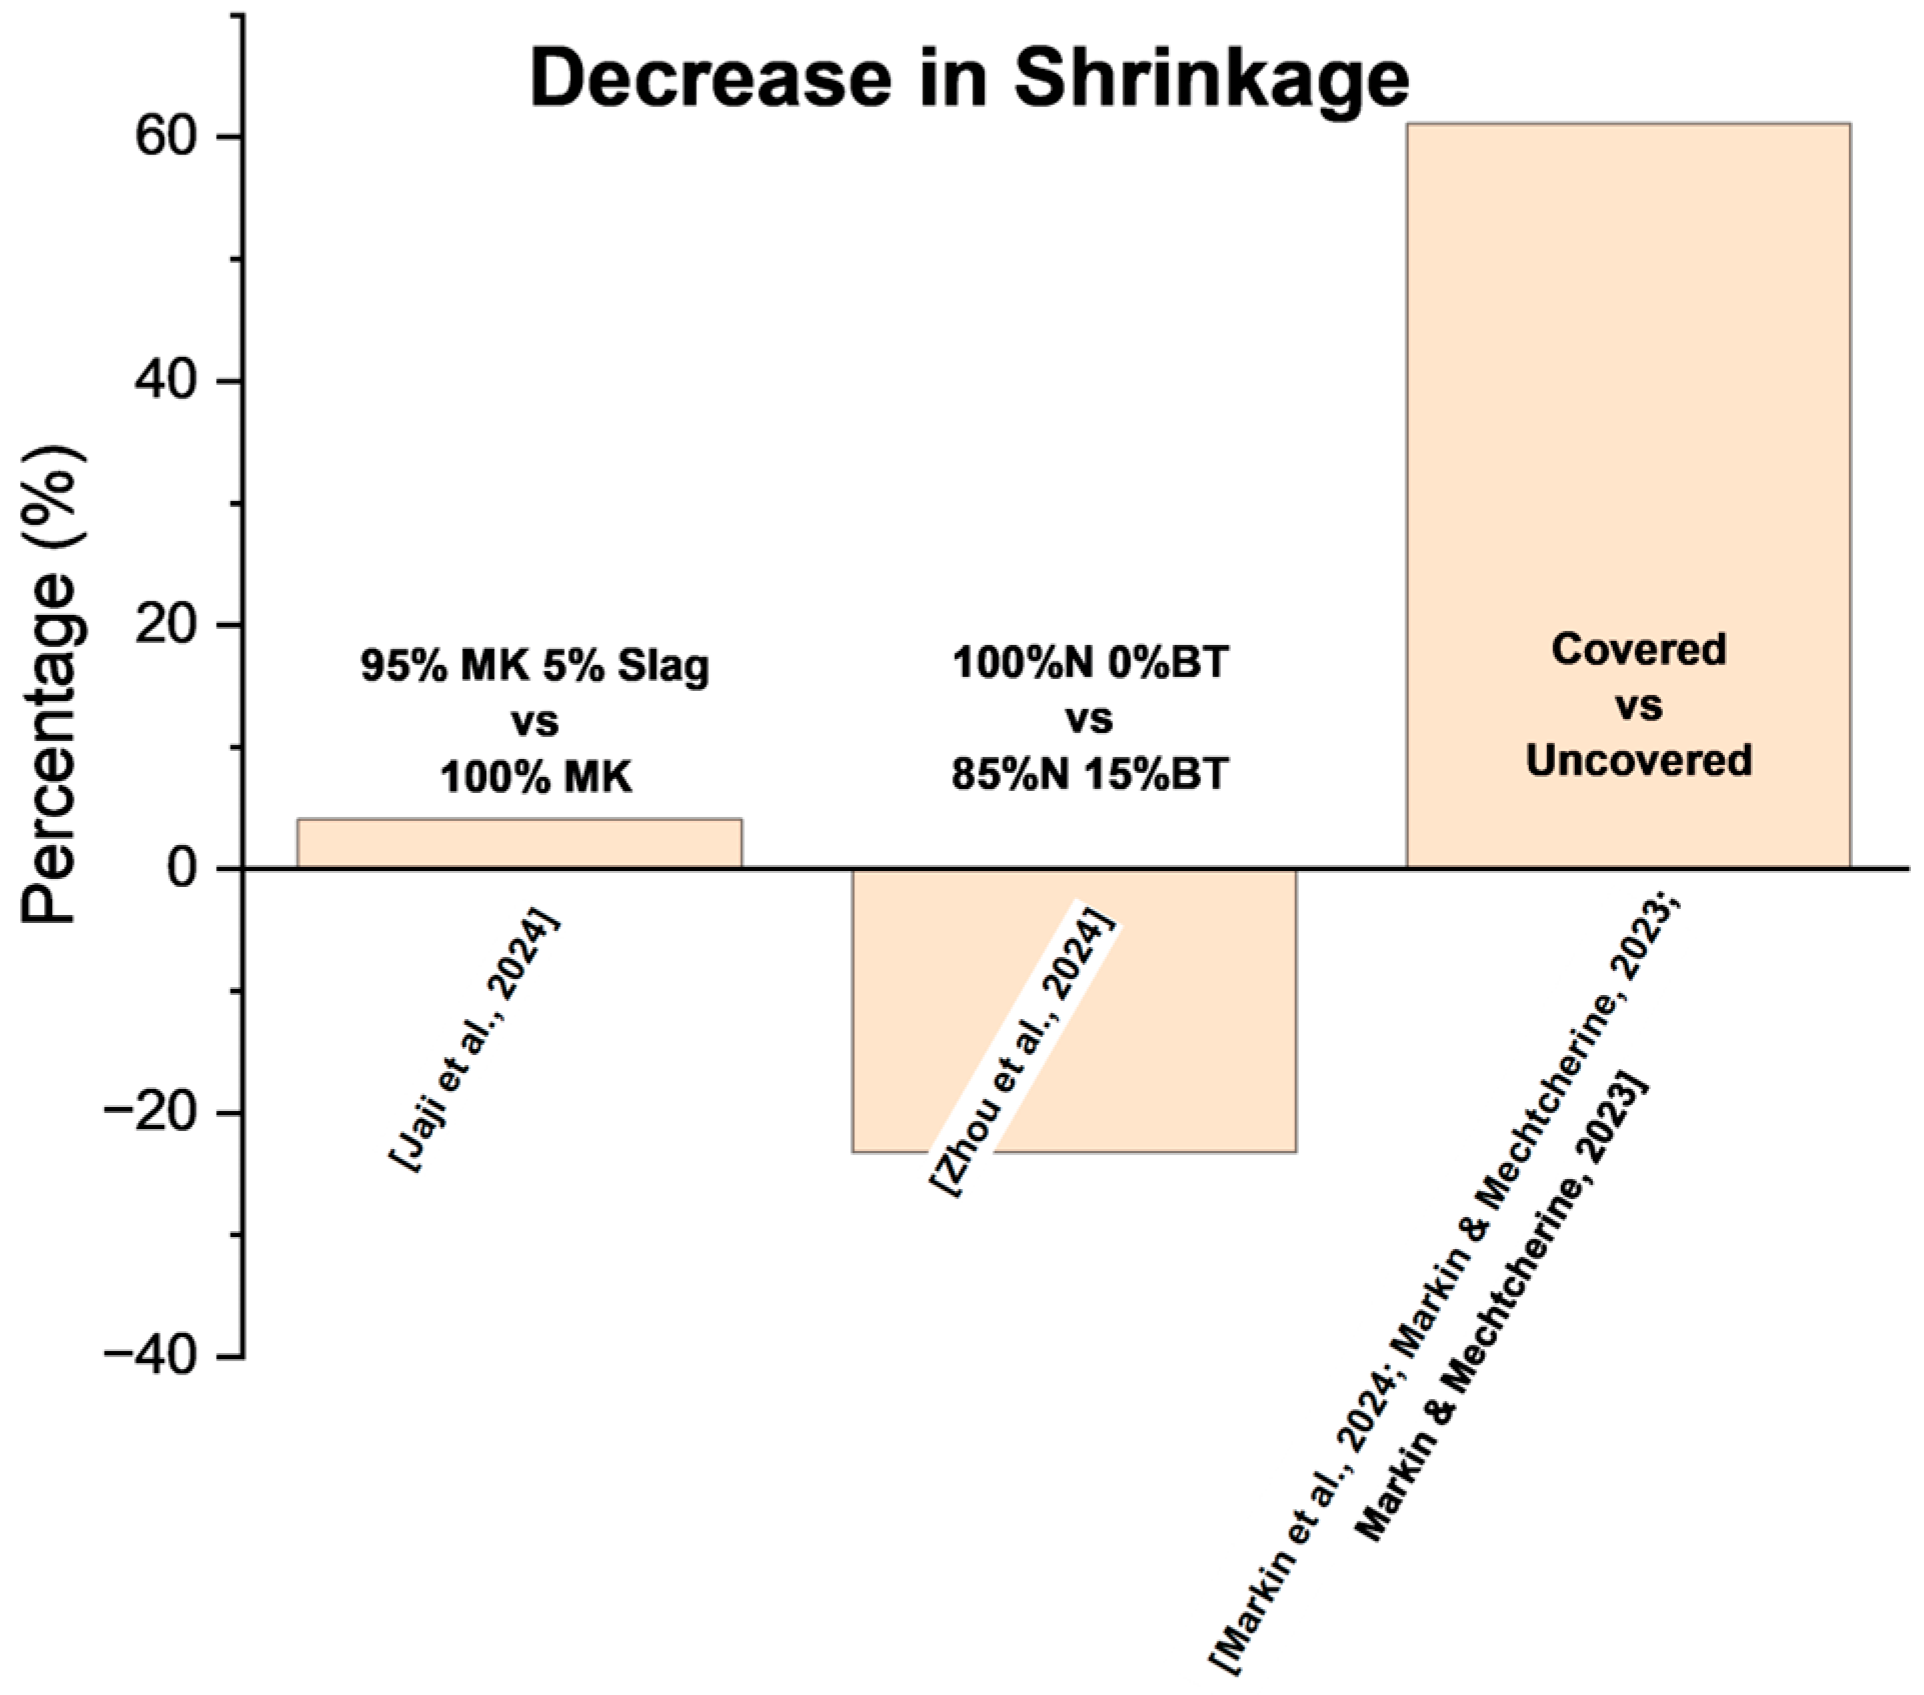
2.2. Shrinkage
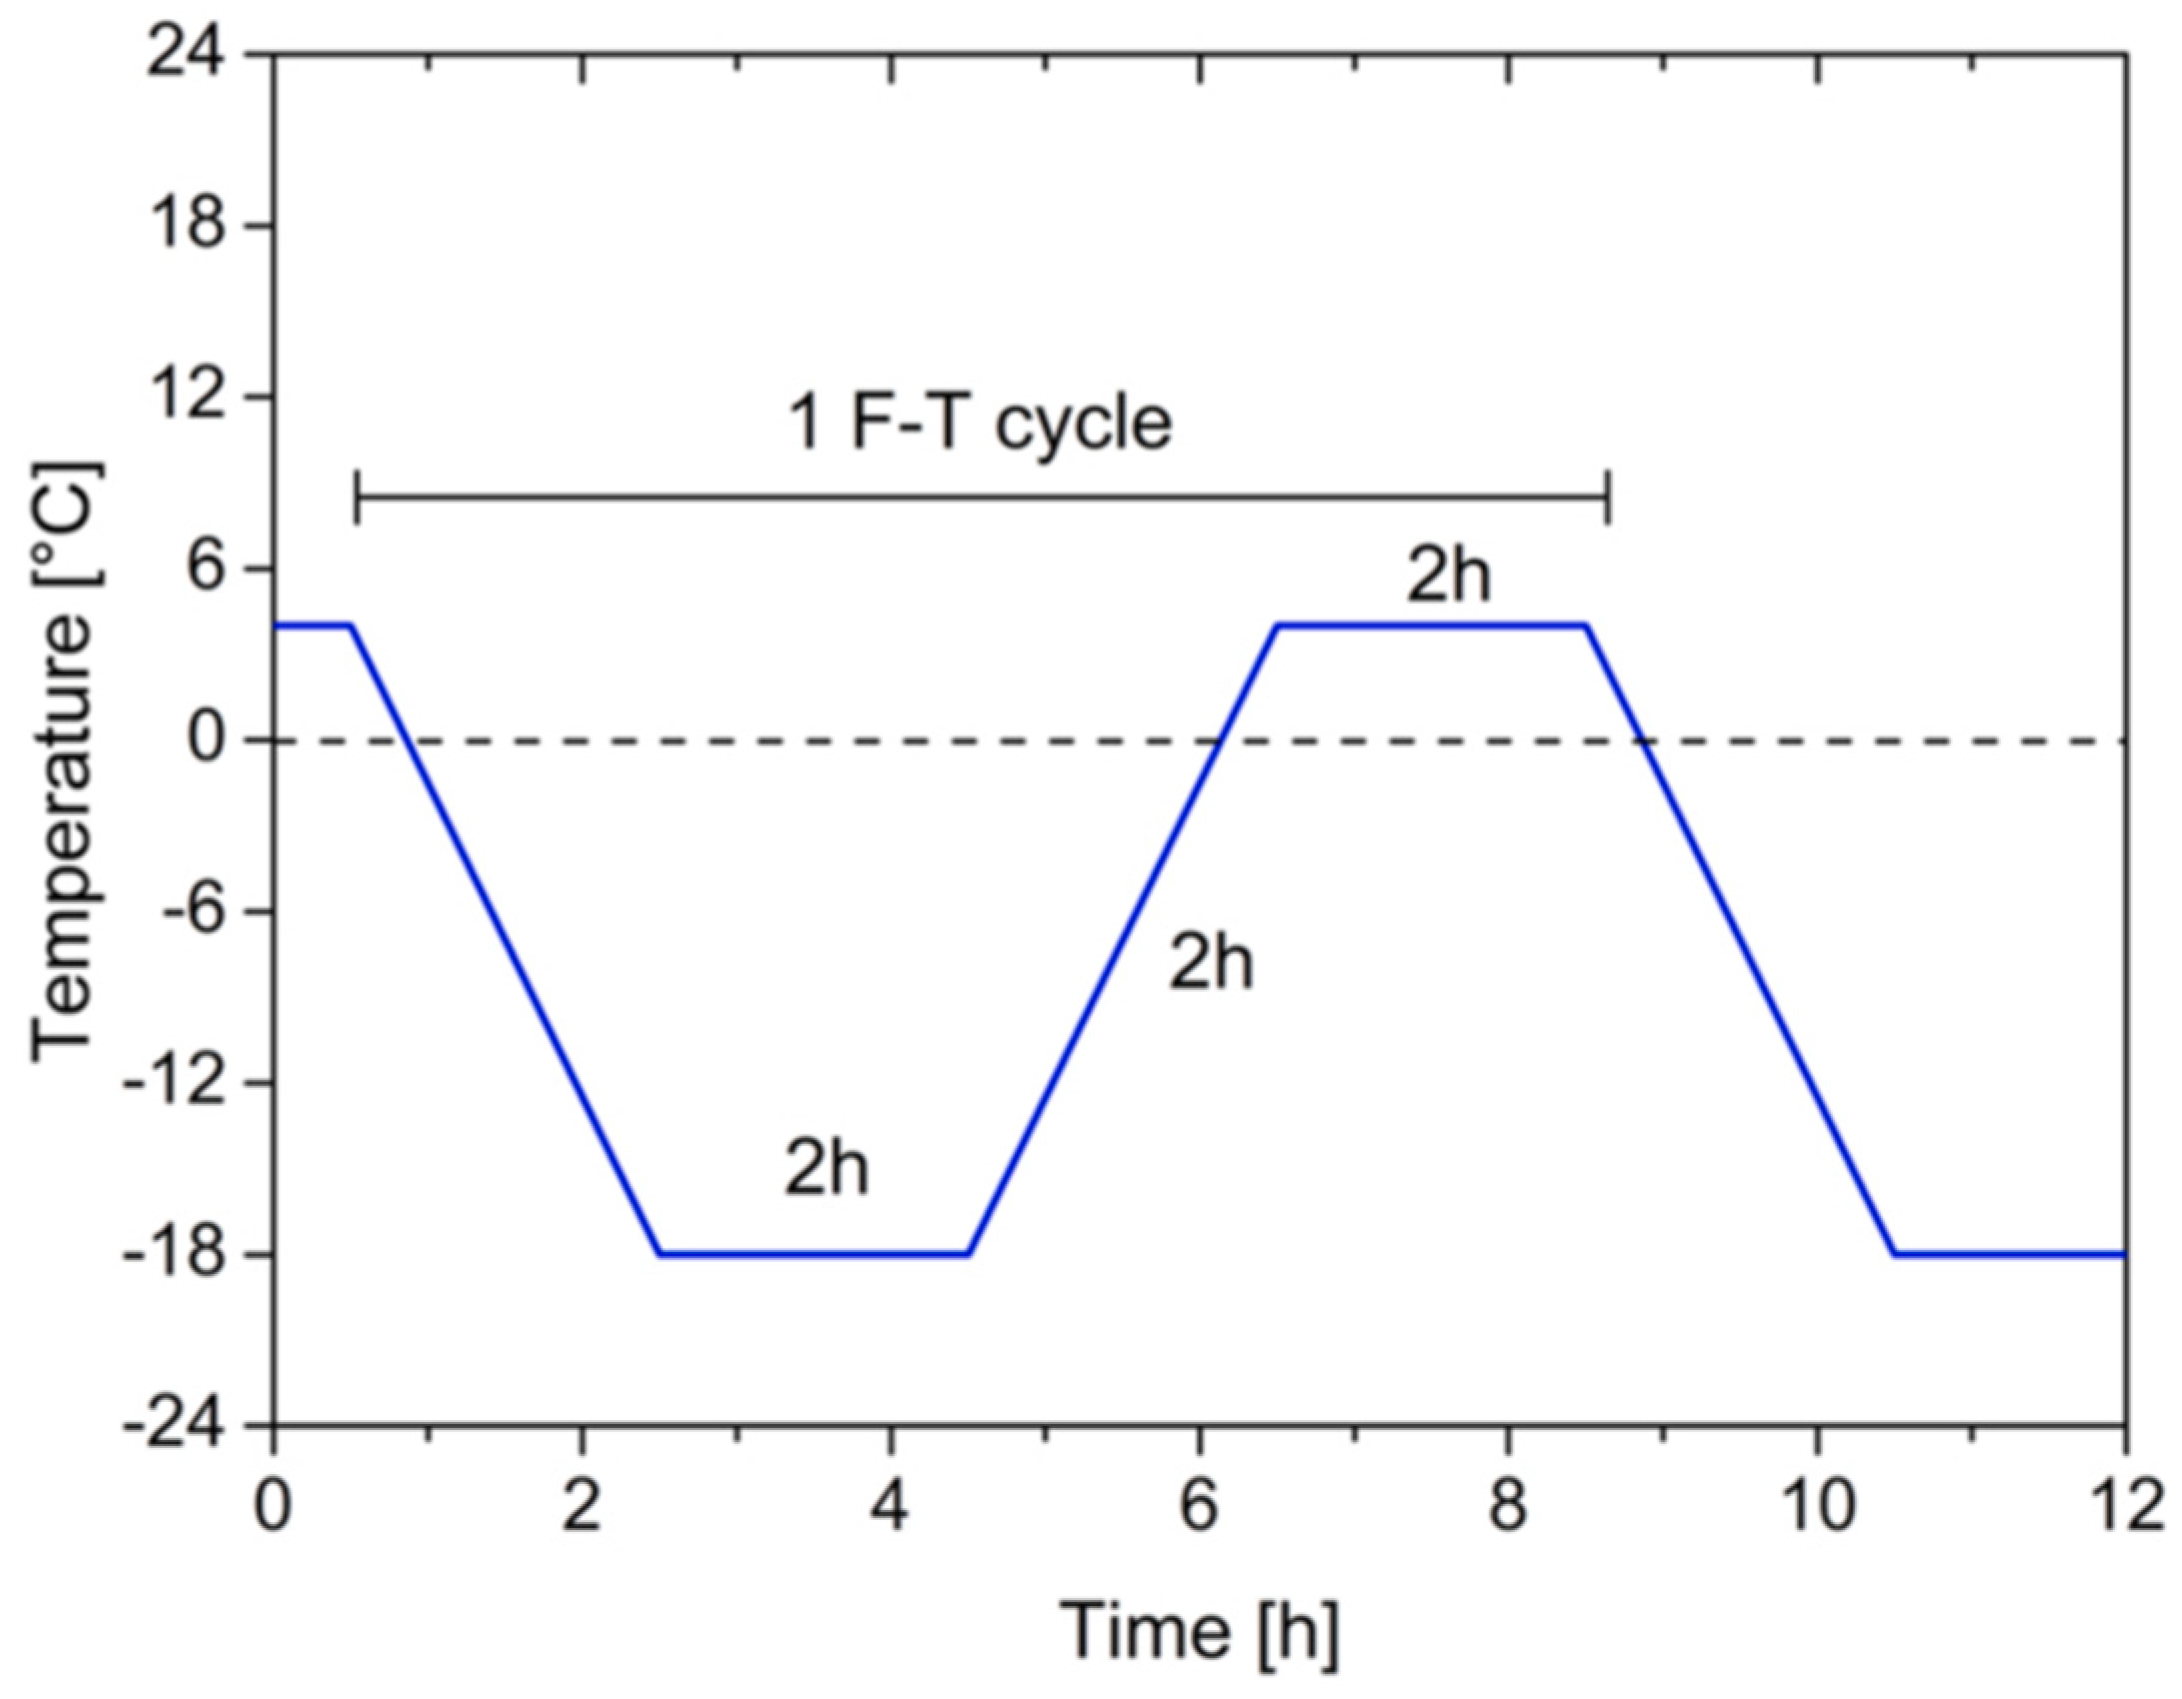
2.3. Freeze–Thaw Resistance
2.4. Chemical Resistance
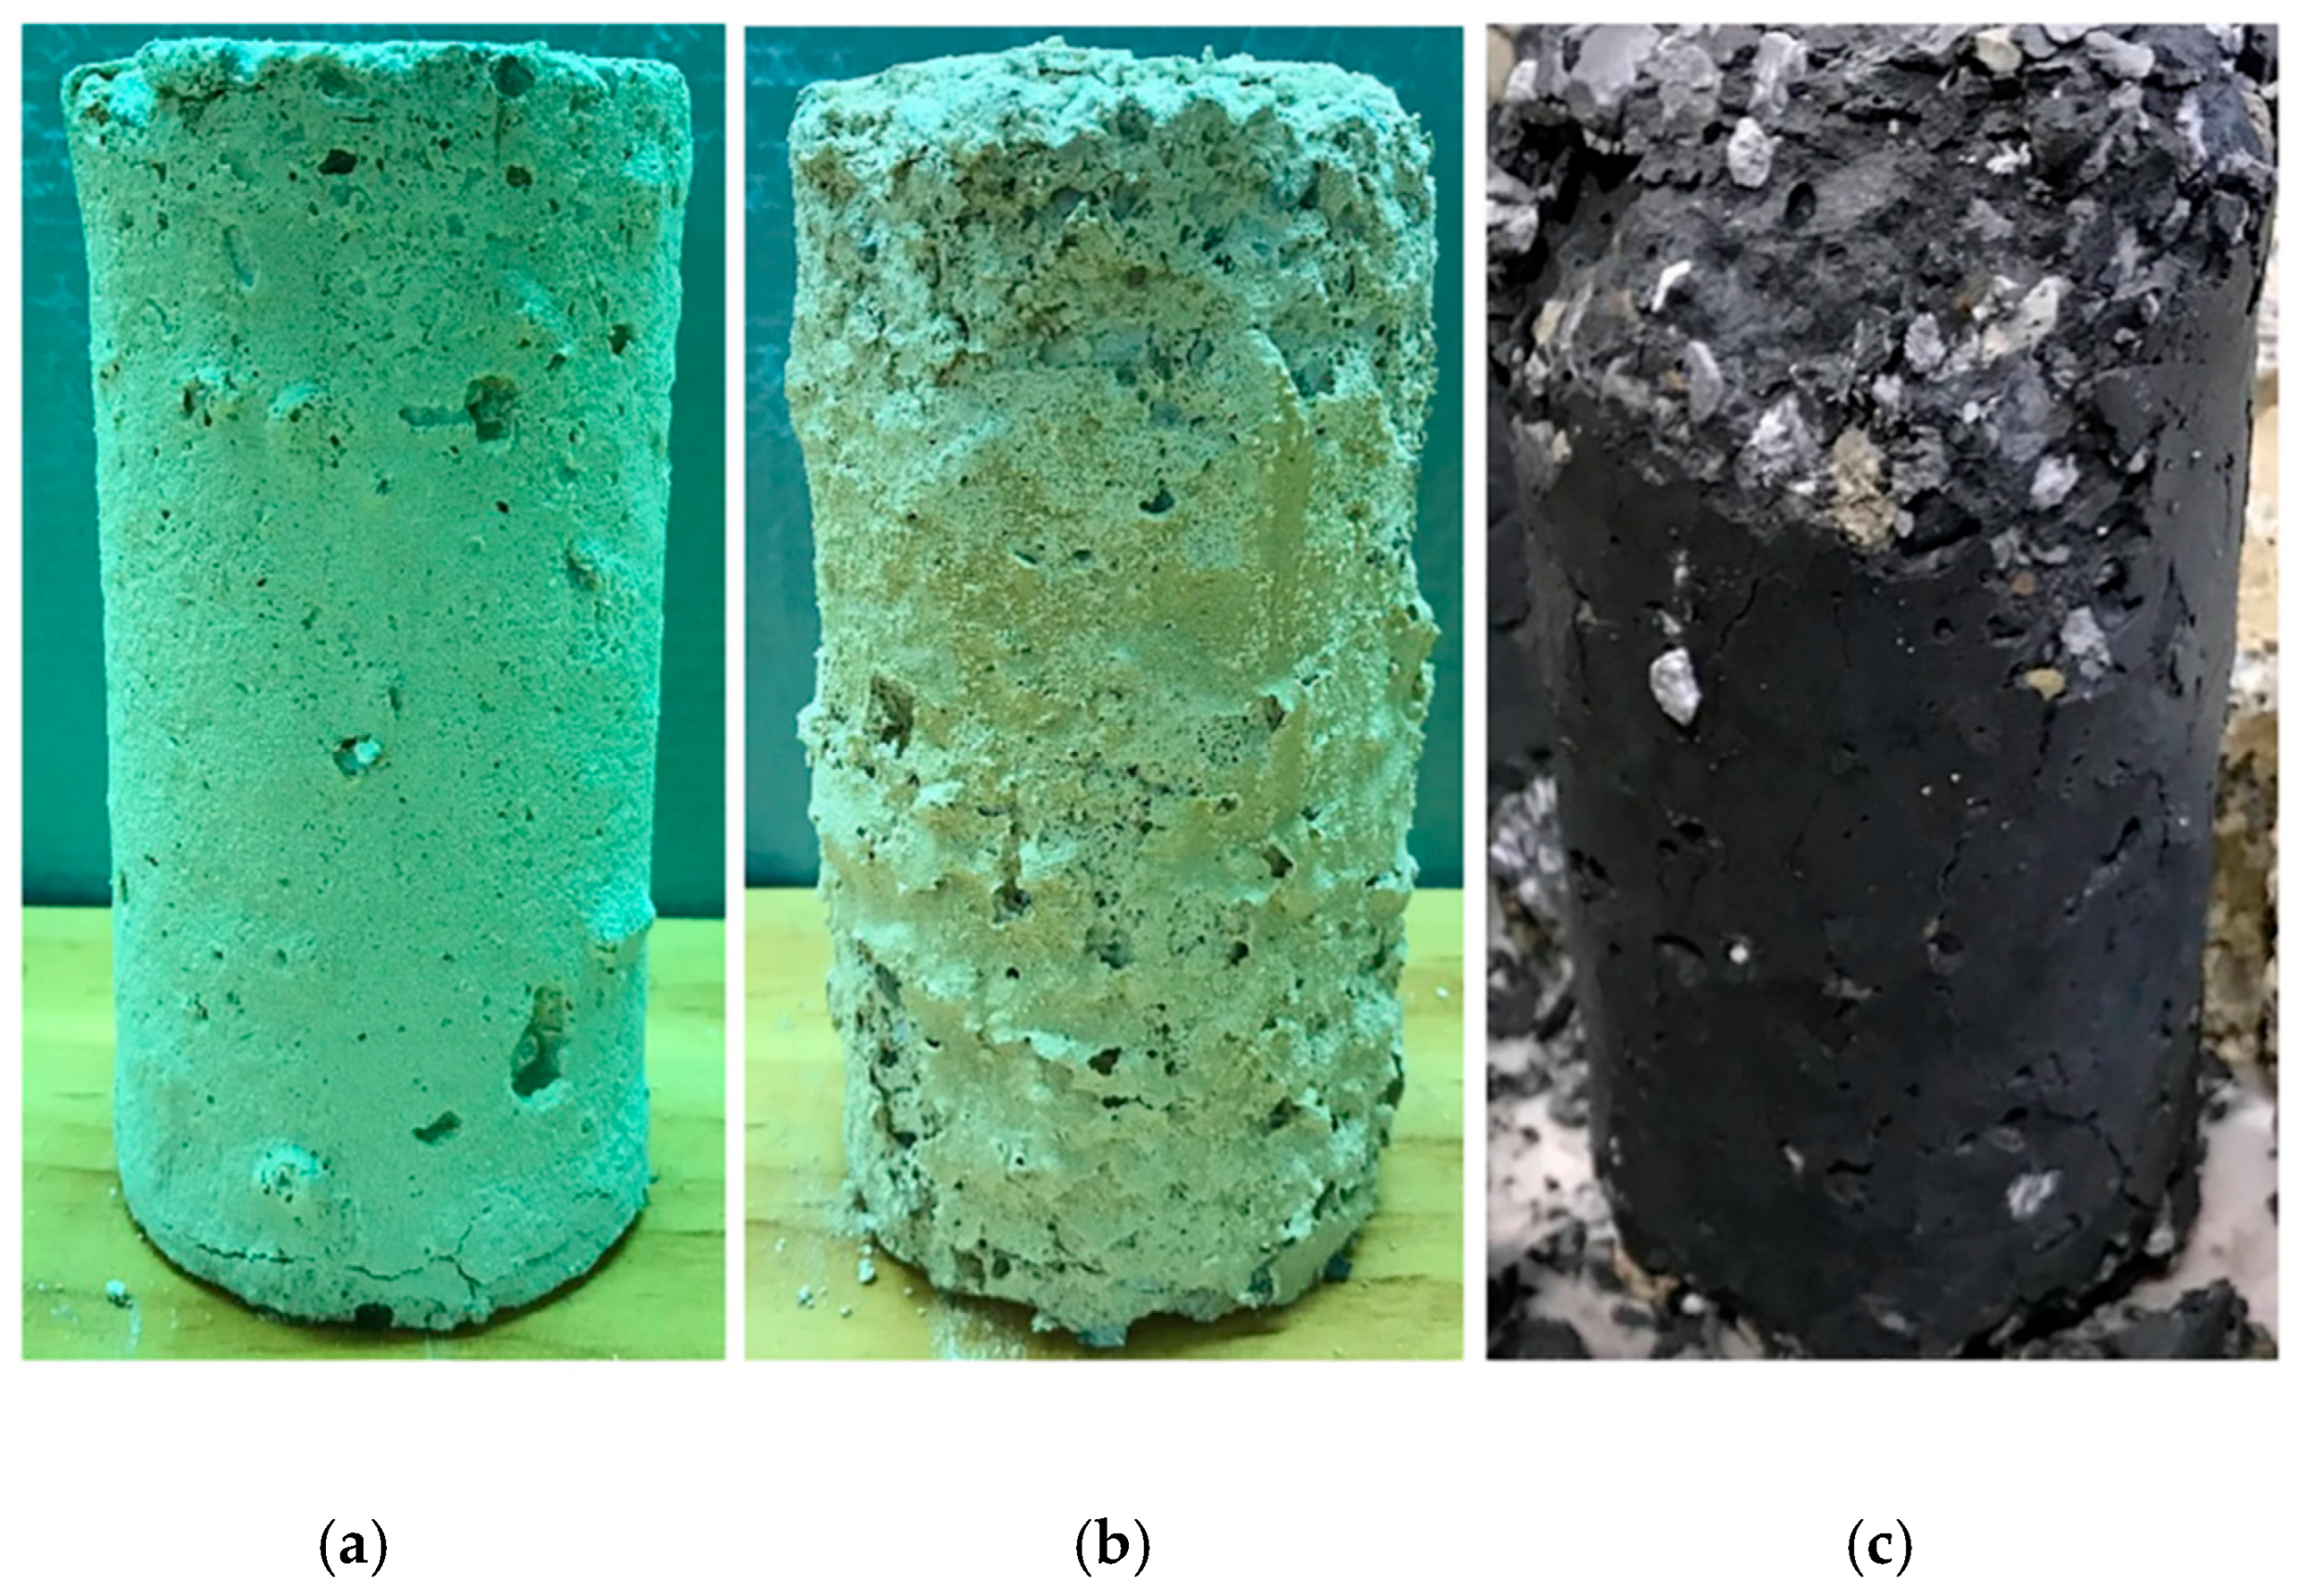
2.4.1. Sulfuric Acid
2.4.2. Chloride
2.5. Carbonation
3. Discussion and Future Work
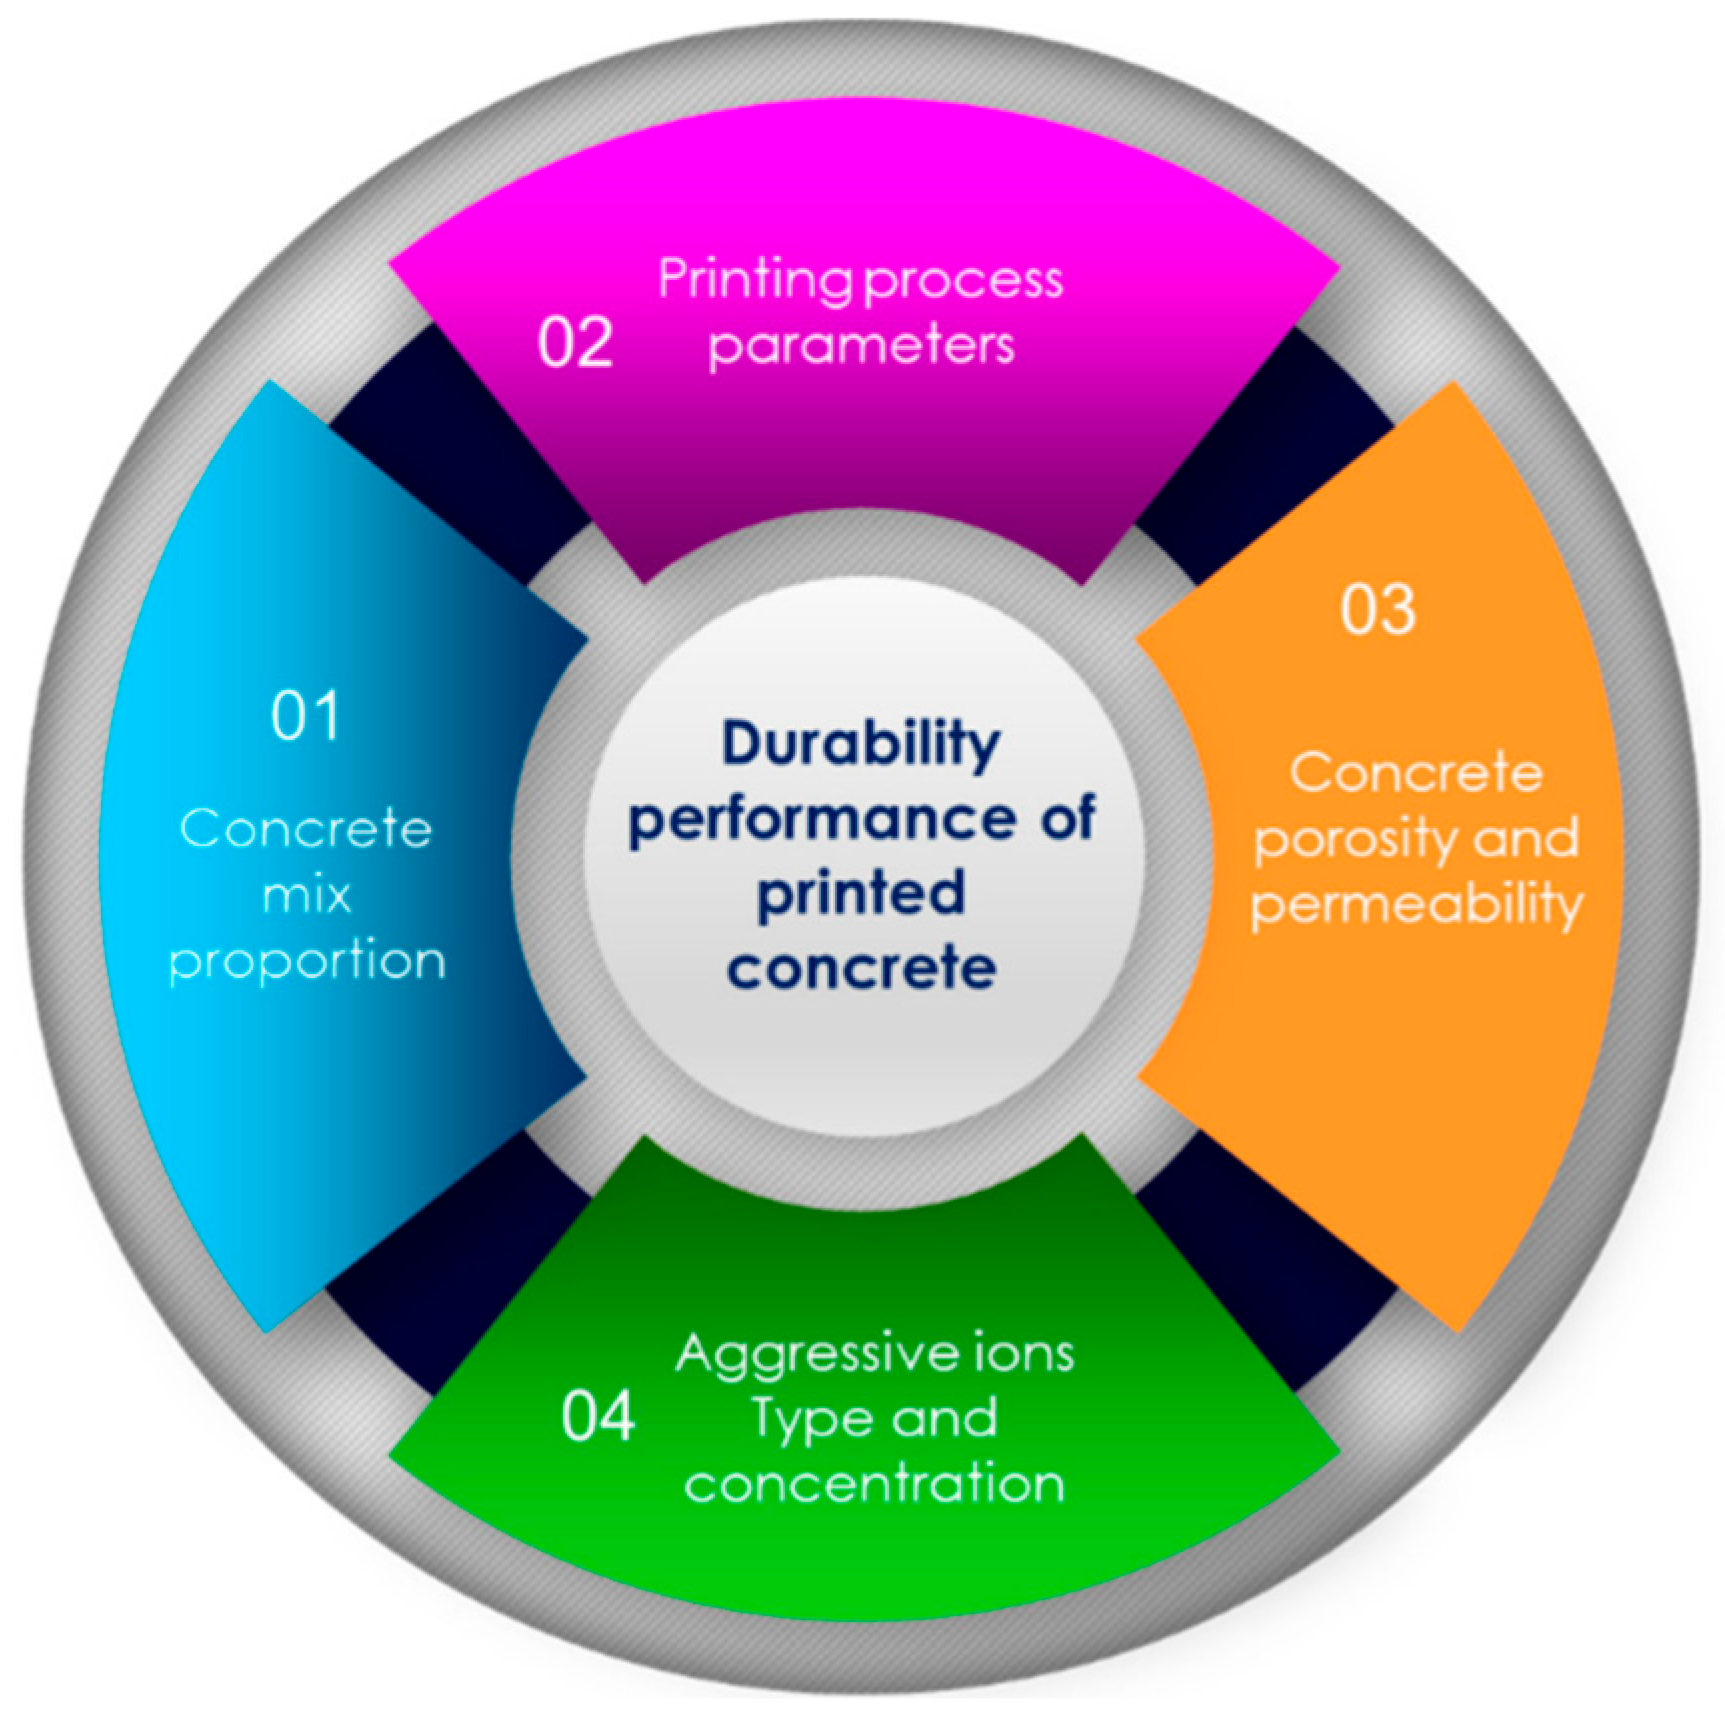
- Reducing porosity, particularly at interlayer regions, is essential for enhancing durability. Future studies should optimize the incorporation of nano-materials (e.g., nano-silica) and supplementary cementitious materials (SCMs) to improve pore structure uniformity and reduce overall permeability.
- Plastic and autogenous shrinkage remain critical durability concerns due to rapid moisture loss and the absence of formwork. Research should explore advanced curing techniques, such as controlled humidity environments and the use of internal curing agents or fiber reinforcements to limit early-age shrinkage cracking.
- While air-entraining agents and silica fume have shown positive effects, the long-term freeze–thaw durability of 3DPC under variable field conditions remains uncertain. Further investigation should focus on optimizing compaction quality, print parameters, and mix designs to ensure stable performance.
- Sulfuric acid poses a major threat to 3DPC durability. The development of acid-resistant binder systems using geopolymer formulations, hybrid cements, or surface treatments is necessary to withstand aggressive chemical environments.
- The anisotropic pore structure of 3DPC increases vulnerability to chloride penetration and steel reinforcement corrosion. Future work should design mixes with enhanced microstructural continuity and investigate admixtures such as corrosion inhibitors.
- Because 3DPC has shown higher susceptibility to carbonation than cast concrete, future experiments should employ accelerated carbonation testing across different mix designs, curing conditions, and print orientations to better understand and control carbonation depth.
- Currently, there is no dedicated durability standard for 3DPC. Adapting and validating existing ASTM, ISO, or EN test methods specifically for 3D-printed structures is crucial for establishing reliable long-term performance benchmarks.
- Most current assessments are based on accelerated laboratory testing. Long-term field monitoring of printed structures under varying environmental conditions and loading is needed to evaluate real-world performance.
- Parameters such as layer height, interlayer time gap, and print speed can significantly affect the formation of interfacial defects and long-term durability. Future studies should develop guidelines that balance durability with print efficiency.
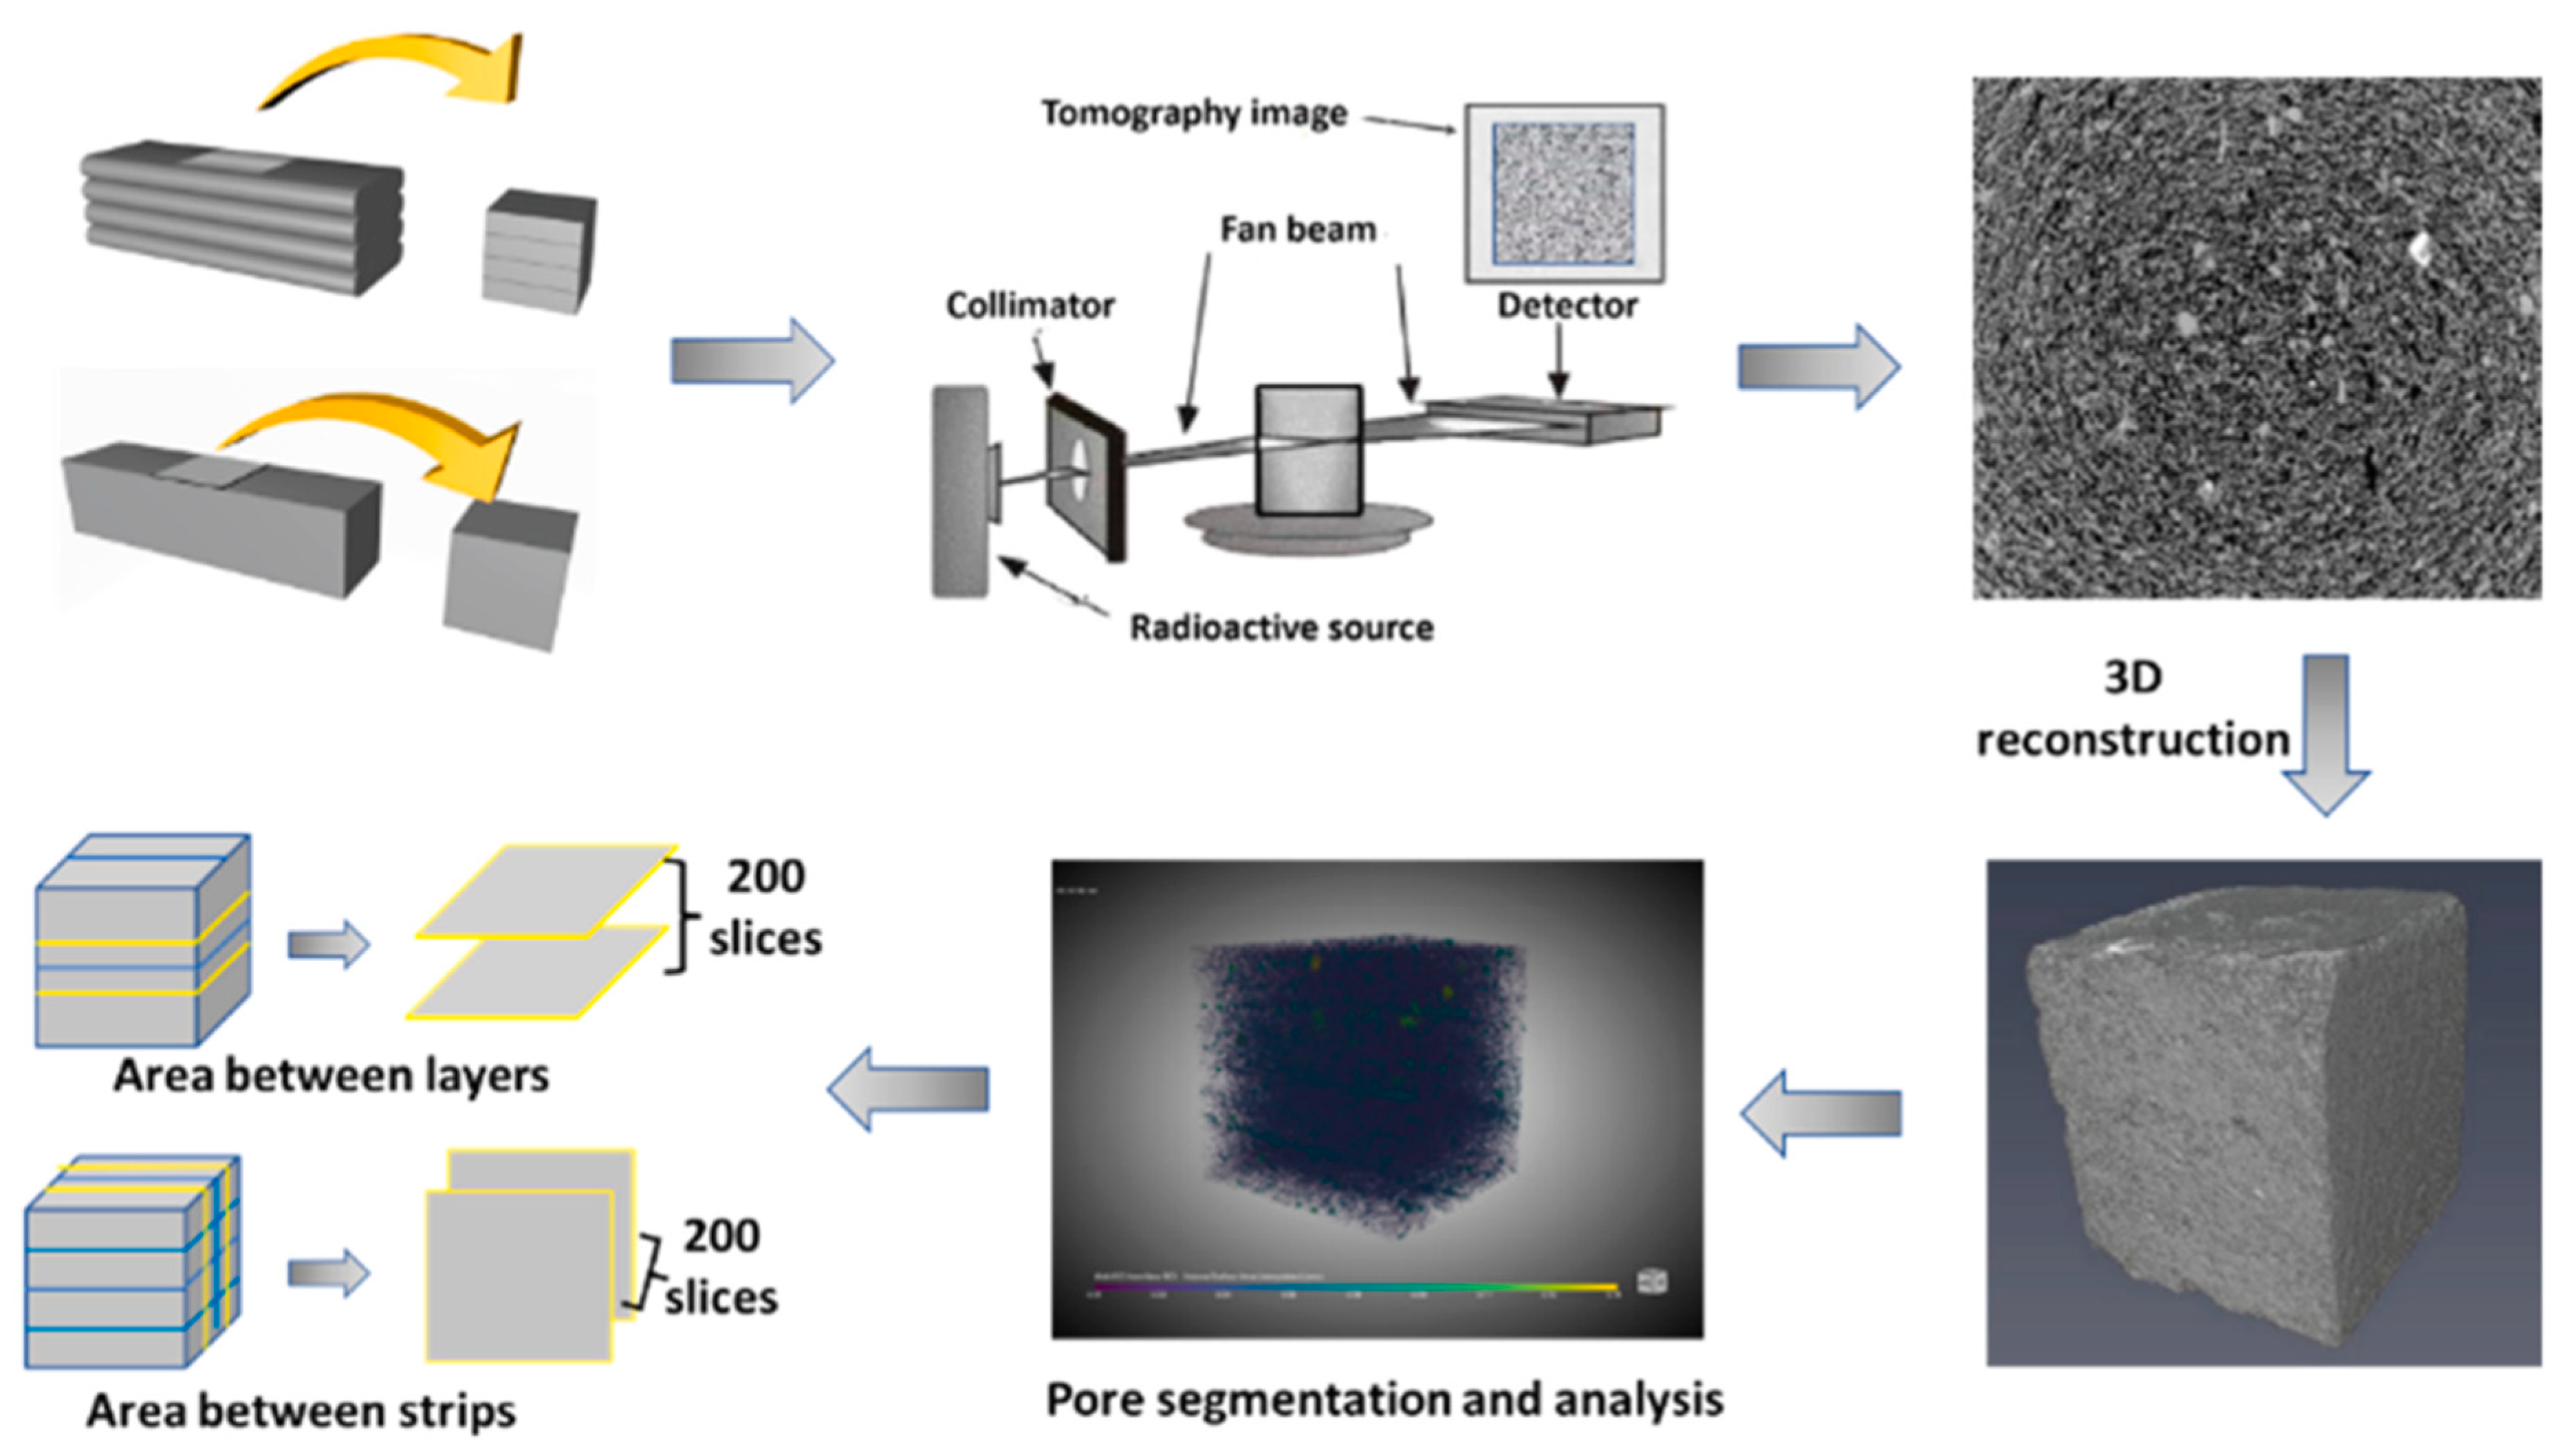
- High-resolution synchrotron X-ray computed tomography (CT) is recommended for mapping CO2 diffusion pathways in 3DPC, particularly across interlayer interfaces and anisotropic pore networks, enabling accurate correlation between microstructure and carbonation behavior.
- Future work should also focus on developing durability prediction models that account for anisotropic transport behavior, evolving interlayer bonding, and environmental influences over time. These models should incorporate the effects of creep, shrinkage, and temperature–humidity cycles to reflect realistic service conditions.
- Although several studies have reported promising durability results for geopolymer 3DPC, future research should systematically compare geopolymer and OPC-based systems under identical exposure conditions. Investigating their differences in pore structure evolution, interlayer bonding, and degradation mechanisms will help clarify their respective advantages and limitations in long-term durability performance.
4. Conclusions
- The durability of 3DPC significantly depends on optimized mix design, precise printing parameters, effective interlayer bond strength, controlled porosity, and environmental exposure conditions. The anisotropic behaviour and high interlayer porosity necessitate careful material and process optimization to achieve robust performance.
- The high porosity at layer interfaces poses a durability risk, which can be effectively mitigated by incorporating supplementary cementitious materials (SCMs) such as nano-silica, metakaolin, silica fume, and fly ash, significantly improving porosity and overall durability.
- Shrinkage-induced cracking, particularly plastic and autogenous shrinkage due to the absence of formwork, remains a critical issue. Slag and fly ash admixtures are recommended to reduce shrinkage rates and delay cracking.
- Enhanced freeze–thaw resistance is achievable through admixtures like silica fume and air-entraining agents, significantly reducing compressive strength loss and mass loss compared to traditional concrete.
- Sulfuric acid resistance in 3DPC can be notably improved by adding silica fume and nano-silica, minimizing mass loss and structural degradation in aggressive chemical environments.
- Chloride ingress is effectively controlled using optimized mixes containing metakaolin and nano-silica, significantly reducing chloride permeability.
- Carbonation depth tends to be higher in 3DPC; however, improvements through the use of SCMs like GGBS and nano-silica combined with high-humidity curing can substantially enhance resistance.
- In conclusion, while 3DPC holds substantial promise for sustainable and efficient construction, its durability needs targeted improvements. To enhance durability, it is recommended to strategically incorporate SCMs like silica fume, metakaolin, fly ash, and nano-silica, optimize printing parameters, and implement rigorous curing protocols. Standardized testing methods such as ASTM C666 [53] for freeze–thaw cycles, ASTM C1202 [65] for chloride permeability, and ASTM C1581 [42] and C1579 [43] for shrinkage assessments are essential for consistent evaluation and improvement. Future research should focus on standardizing long-term durability testing protocols, developing specialized admixtures tailored to durability needs, and exploring deeper into how print-process parameters affect microstructural evolution.
Author Contributions
Funding
Data Availability Statement
Conflicts of Interest
References
- Craveiro, F.; Craveiro, F.; Nazarian, S.; Bartolo, H.; Bartolo, P.J.; Duarte, J.P. An automated system for 3D printing functionally graded concrete-based materials. Addit. Manuf. 2020, 33, 101146. [Google Scholar] [CrossRef]
- Adaloudis, M.; Roca, J.B. Sustainability tradeoffs in the adoption of 3D Concrete Printing in the construction industry. J. Clean. Prod. 2021, 307, 127201. [Google Scholar] [CrossRef]
- Fonseca, M.; Matos, A.M. 3D Construction Printing Standing for Sustainability and Circularity: Material-Level Opportunities. Materials 2023, 16, 2458. [Google Scholar] [CrossRef]
- Firoozi, A.A. 3D Printing in Civil Engineering: Pioneering Affordable Housing Solutions. J. Civ. Eng. Urban. 2024, 14, 63–75. [Google Scholar] [CrossRef]
- El-Sayegh, S.; Romdhane, L.; Manjikian, S. A critical review of 3D printing in construction: Benefits, challenges, and risks. Arch. Civ. Mech. Eng. 2020, 20, 34. [Google Scholar] [CrossRef]
- Sakin, M.; Kiroglu, Y.C. Kiroglu, 3D Printing of Buildings: Construction of the Sustainable Houses of the Future by BIM. Energy Procedia 2017, 134, 702–711. [Google Scholar] [CrossRef]
- AlZahrani, A.A.; Alghamdi, A.A.; Basalah, A.A. Computational Optimization of 3D-Printed Concrete Walls for Improved Building Thermal Performance. Buildings 2022, 12, 2267. [Google Scholar] [CrossRef]
- Hossain, M.A.; Zhumabekova, A.; Paul, S.C.; Kim, J.R. A review of 3D printing in construction and its impact on the labor market. Sustainability 2020, 12, 8492. [Google Scholar] [CrossRef]
- Hanratty, N.; Khan, M.; McNally, C. The Role of Different Clay Types in Achieving Low-Carbon 3D Printed Concretes. Buildings 2024, 14, 2194. [Google Scholar] [CrossRef]
- Zhang, J.; Wang, J.; Dong, S.; Yu, X.; Han, B. A review of the current progress and application of 3D printed concrete. Compos. Part A Appl. Sci. Manuf. 2019, 125, 105533. [Google Scholar] [CrossRef]
- Şahin, H.G.; Mardani, A. Mechanical properties, durability performance and interlayer adhesion of 3DPC mixtures: A state-of-the-art review. Struct. Concr. 2023, 24, 5481–5505. [Google Scholar] [CrossRef]
- Chen, J.; Liu, X.; Tian, Y.; Zhu, W.; Yan, C.; Shi, Y.; Kong, L.B.; Qi, H.J.; Zhou, K. 3D-Printed anisotropic polymer materials for functional applications. Adv. Mater. 2022, 34, 2102877. [Google Scholar] [CrossRef] [PubMed]
- Liu, C.; Yue, S.; Zhou, C.; Sun, H.; Deng, S.; Gao, F.; Tan, Y. Anisotropic mechanical properties of extrusion-based 3D printed layered concrete. J. Mater. Sci. 2021, 56, 16851–16864. [Google Scholar] [CrossRef]
- Mo, Y.; Xing, J.; Yue, S.; Zhang, Y.; Zhou, Q.; Liu, X. Dynamic properties of 3D printed cement mortar based on Split Hopkinson Pressure Bar testing. Cem. Concr. Compos. 2022, 130, 104520. [Google Scholar] [CrossRef]
- Ma, G.; Li, Z.; Wang, L. Printable properties of cementitious material containing copper tailings for extrusion based 3D printing. Constr. Build. Mater. 2018, 162, 613–627. [Google Scholar] [CrossRef]
- Nodehi, M.; Aguayo, F.; Nodehi, S.E.; Gholampour, A.; Ozbakkaloglu, T.; Gencel, O. Durability properties of 3D printed concrete (3DPC). Autom. Constr. 2022, 142, 104479. [Google Scholar] [CrossRef]
- Rehman, A.U.; Kim, J.H. 3D Concrete Printing: A Systematic Review of Rheology, Mix Designs, Mechanical, Microstructural, and Durability Characteristics. Materials 2021, 14, 3800. [Google Scholar] [CrossRef]
- Zaid, O.; El Ouni, M.H. Advancements in 3D printing of cementitious materials: A review of mineral additives, properties, and systematic developments. Constr. Build. Mater. 2024, 427, 136254. [Google Scholar] [CrossRef]
- van den Heever, M.; du Plessis, A.; Kruger, J.; van Zijl, G. Evaluating the effects of porosity on the mechanical properties of extrusion-based 3D printed concrete. Cem. Concr. Res. 2022, 153, 106695. [Google Scholar] [CrossRef]
- Yuan, H.; Dong, E.; Jia, Z.; Jia, L.; Quan, S.; Ma, M.; Yang, Y.; Feng, M.; Banthia, N.; Zhang, Y. The influence of pore structure and fiber orientation on anisotropic mechanical property of 3D printed ultra-high-performance concrete. Constr. Build. Mater. 2025, 471, 140760. [Google Scholar] [CrossRef]
- Kruger, J.; du Plessis, A.; van Zijl, G. An investigation into the porosity of extrusion-based 3D printed concrete. Addit. Manuf. 2021, 37, 101740. [Google Scholar] [CrossRef]
- Mohan, M.K.; Rahul, A.V.; Van Stappen, J.F.; Cnudde, V.; De Schutter, G.; Van Tittelboom, K. Assessment of pore structure characteristics and tortuosity of 3D printed concrete using mercury intrusion porosimetry and X-ray tomography. Cem. Concr. Compos. 2023, 140, 105104. [Google Scholar] [CrossRef]
- Rui, A.; Wang, L.; Lin, W.; Ma, G. Experimental study on damage anisotropy of 3D-printed concrete exposed to sulfate attack. Constr. Build. Mater. 2023, 407, 133590. [Google Scholar] [CrossRef]
- Çevik, A.; Alzeebaree, R.; Humur, G.; Niş, A.; Gülşan, M.E. Effect of nano-silica on the chemical durability and mechanical performance of fly ash based geopolymer concrete. Ceram. Int. 2018, 44, 12253–12264. [Google Scholar] [CrossRef]
- Van Tittelboom, K.; Mohan, M.K.; Šavija, B.; Keita, E.; Ma, G.; Du, H.; Kruger, J.; Caneda-Martinez, L.; Wang, L.; Bekaert, M.; et al. On the micro- and meso-structure and durability of 3D printed concrete elements. Cem. Concr. Res. 2024, 185, 107649. [Google Scholar] [CrossRef]
- Singh, A.; Wang, Y.; Zhou, Y.; Sun, J.; Xu, X.; Li, Y.; Liu, Z.; Chen, J.; Wang, X. Utilization of antimony tailings in fiber-reinforced 3D printed concrete: A sustainable approach for construction materials. Constr. Build. Mater. 2023, 408, 133689. [Google Scholar] [CrossRef]
- Liu, C.; Zhang, Y.; Banthia, N. Unveiling pore formation and its influence on micromechanical property and stress distribution of 3D printed foam concrete modified with hydroxypropyl methylcellulose and silica fume. Addit. Manuf. 2023, 71, 103606. [Google Scholar] [CrossRef]
- Baz, B.; Aouad, G.; Kleib, J.; Bulteel, D.; Remond, S. Durability assessment and microstructural analysis of 3D printed concrete exposed to sulfuric acid environments. Constr. Build. Mater. 2021, 290, 123220. [Google Scholar] [CrossRef]
- Jaji, M.B.; van Zijl, G.P.; Babafemi, A.J. Durability and pore structure of metakaolin-based 3D printed geopolymer concrete. Constr. Build. Mater. 2024, 422, 135847. [Google Scholar] [CrossRef]
- Bekaert, M.; Van Tittelboom, K.; De Schutter, G. The Effect of Curing Conditions on the Service Life of 3D Printed Concrete Formwork. Materials 2023, 16, 6972. [Google Scholar] [CrossRef]
- Du, L.; Zhou, J.; Lai, J.; Wu, K.; Yin, X.; He, Y. Effect of pore structure on durability and mechanical performance of 3D printed concrete. Constr. Build. Mater. 2023, 400, 132581. [Google Scholar] [CrossRef]
- Sikora, P.; Techman, M.; Federowicz, K.; El-Khayatt, A.M.; Saudi, H.A.; Abd Elrahman, M.; Hoffmann, M.; Stephan, D.; Chung, S.Y. Insight into the microstructural and durability characteristics of 3D printed concrete: Cast versus printed specimens. Case Stud. Constr. Mater. 2022, 17, e01320. [Google Scholar] [CrossRef]
- Zhang, Y.; Qiao, H.; Qian, R.; Xue, C.; Feng, Q.; Su, L.; Zhang, Y.; Liu, G.; Du, H. Relationship between water transport behaviour and interlayer voids of 3D printed concrete. Constr. Build. Mater. 2022, 326, 126731. [Google Scholar] [CrossRef]
- Zhang, Y.; Zhang, Y.; She, W.; Yang, L.; Liu, G.; Yang, Y. Rheological and harden properties of the high-thixotropy 3D printing concrete. Constr. Build. Mater. 2019, 201, 278–285. [Google Scholar] [CrossRef]
- Bayrak, A.T.; Shaban, N.; Choubi, S.S.; Tuncer, E.; Yang, S.H.; Yılmaz, H.D.; Alkilani, A.Z.; Dal, H.; Unluer, C.; Dino, İ.G.; et al. Spatial variation of physical, mechanical, and thermophysical properties of 3D printed concrete across a full-scale wall. Constr. Build. Mater. 2024, 431, 136574. [Google Scholar] [CrossRef]
- Moelich, G.M.; Kruger, P.J.; Combrinck, R. The effect of restrained early age shrinkage on the interlayer bond and durability of 3D printed concrete. J. Build. Eng. 2021, 43, 102857. [Google Scholar] [CrossRef]
- Zhang, Y.; Zhang, Y.; Yang, L.; Liu, G.; Du, H. Influence of the pore feature on the water uptake in 3D printed concrete. Mater. Lett. 2023, 333, 133642. [Google Scholar] [CrossRef]
- de la Flor Juncal, L.; Loporcaro, G.; Scott, A.; Clucas, D. Influence of printing parameters on the durability of 3D-printed limestone calcined clay cement mortar: Overlap between filaments and nozzle offset. Mater. Struct. 2024, 57, 191. [Google Scholar] [CrossRef]
- Shafiq, N.; Kumar, R.; Zahid, M.; Tufail, R.F. Effects of Modified Metakaolin Using Nano-Silica on the Mechanical Properties and Durability of Concrete. Materials 2019, 12, 2291. [Google Scholar] [CrossRef]
- Ler, K.-H.; Ma, C.K.; Chin, C.L.; Ibrahim, I.S.; Padil, K.H.; Ab Ghafar, M.A.I.; Lenya, A.A. Porosity and durability tests on 3D printing concrete: A review. Constr. Build. Mater. 2024, 446, 137973. [Google Scholar] [CrossRef]
- Zhong, H.; Zhang, M. 3D printing geopolymers: A review. Cem. Concr. Compos. 2022, 128, 104455. [Google Scholar] [CrossRef]
- ASTM C1581-04; Standard Test Method for Determining Age at Cracking and Induced Tensile Stress Characteristics of Mortar and Concrete Under Restrained Shrinkage. American Society for Testing and Materials: West Conshohocken, PA, USA, 2004.
- ASTM C1579-21; Standard Test Method for Evaluating Plastic Shrinkage Cracking of Restrained Fiber Reinforced Concrete (Using a Steel Form Insert). American Society for Testing and Materials: West Conshohocken, PA, USA, 2021.
- Moelich, G.M.; Kruger, J.; Combrinck, R. Plastic shrinkage cracking in 3D printed concrete. Compos. Part B Eng. 2020, 200, 108313. [Google Scholar] [CrossRef]
- Zhou, L.; Gou, M.; Ji, J.; Hou, X.; Zhang, H. Durability and hardened properties of 3D printed concrete containing bauxite tailings. Mater. Today Sustain. 2024, 25, 100704. [Google Scholar] [CrossRef]
- JC/T 603-2004; Standard Test Method for Drying Shinkage of Mortar. China Building Materials Industry Press: Beijing, China, 2004.
- Papachristoforou, M.; Mitsopoulos, V.; Stefanidou, M. Use of by-products for partial replacement of 3D printed concrete constituents; rheology, strength and shrinkage performance. Frat. Integrità Strutt. 2019, 13, 526–536. [Google Scholar] [CrossRef]
- Markin, S.; Combrinck, R.; Mechtcherine, V. Specifics of plastic shrinkage in 3D-printed concrete elements. Cem. Concr. Res. 2024, 184, 107512. [Google Scholar] [CrossRef]
- Markin, S.; Mechtcherine, V. Quantification of plastic shrinkage and plastic shrinkage cracking of the 3D printable concretes using 2D digital image correlation. Cem. Concr. Compos. 2023, 139, 105050. [Google Scholar] [CrossRef]
- Markin, S.; Mechtcherine, V. Methods for measuring plastic shrinkage and related cracking of 3D-printed concrete. J. Phys. Conf. Ser. 2023, 2423, 012036. [Google Scholar] [CrossRef]
- Assaad, J.J.; Hamzeh, F.; Hamad, B. Qualitative assessment of interfacial bonding in 3D printing concrete exposed to frost attack. Case Stud. Constr. Mater. 2020, 13, e00357. [Google Scholar] [CrossRef]
- Mohan, M.K.; Rahul, A.V.; De Schutter, G.; Van Tittelboom, K. Extrusion-based concrete 3D printing from a material perspective: A state-of-the-art review. Cem. Concr. Compos. 2021, 115, 103855. [Google Scholar] [CrossRef]
- ASTM C666/C666M; Standard Test Method for Resistance of Concrete to Rapid Freezing and Thawing. American Society for Testing and Materials: West Conshohocken, PA, USA, 2015.
- Dong, W.; Wang, J.; Hang, M.; Qu, S. Research on printing parameters and salt frost resistance of 3D printing concrete with ferrochrome slag and aeolian sand. J. Build. Eng. 2024, 84, 108508. [Google Scholar] [CrossRef]
- GB/T 5008-2001; Method of Test for Flexural Strength of Concrete. China Architecture & Building Press: Beijing, China, 2001.
- GivKashi, M.R.; Tohidloo, M. The effect of freeze-thaw cycles and sulfuric acid attack separately on the compressive strength and microstructure of 3D-printed air-entrained concrete. Constr. Build. Mater. 2024, 440, 137411. [Google Scholar] [CrossRef]
- Gu, L.; Bennett, T.; Visintin, P. Sulphuric acid exposure of conventional concrete and alkali-activated concrete: Assessment of test methodologies. Constr. Build. Mater. 2019, 197, 681–692. [Google Scholar] [CrossRef]
- Barbhuiya, S.; Kumala, D. Behaviour of a Sustainable Concrete in Acidic Environment. Sustainability 2017, 9, 1556. [Google Scholar] [CrossRef]
- ASTM C109/C109M-20; Standard Test Method for Compressive Strength of Hydraulic Cement Mortars (Using 2-in. or [50-mm] Cube Specimens). American Society for Testing and Materials: West Conshohocken, PA, USA, 2020.
- Guo, J.-J.; Liu, P.Q.; Wu, C.L.; Wang, K. Effect of Dry-Wet Cycle Periods on Properties of Concrete under Sulfate Attack. Appl. Sci. 2021, 11, 888. [Google Scholar] [CrossRef]
- El Inaty, F.; Baz, B.; Aouad, G. Long-term durability assessment of 3D printed concrete. J. Adhes. Sci. Technol. 2022, 37, 1921–1936. [Google Scholar] [CrossRef]
- GB/T 50082-2009; Standard for Test Methods of Long-Term Performance and Durability of Ordinary Concrete. China Architecture & Building Press: Beijing, China, 2009.
- Hou, W.; Liu, J.; Liu, Z.; He, F.; Zhu, J.; Cui, Y.; Jinyang, W. Calcium transfer process of cement paste for ettringite formation under different sulfate concentrations. Constr. Build. Mater. 2022, 348, 128706. [Google Scholar] [CrossRef]
- Shumuye, E.D.; Mehrpay, S.; Fang, G.; Li, W.; Wang, Z.; Uge, B.U.; Liu, C. Influence of novel hybrid nanoparticles as a function of admixture on responses of engineered geopolymer composites: A review. J. Build. Eng. 2024, 86, 108782. [Google Scholar] [CrossRef]
- ASTM C1202-17; Standard Test Method for Electrical Indication of Concrete’s Ability to Resist Chloride Ion Penetration. American Society for Testing and Materials: West Conshohocken, PA, USA, 2017.
- Bran-Anleu, P.; Wangler, T.; Nerella, V.N.; Mechtcherine, V.; Trtik, P.; Flatt, R.J. Using micro-XRF to characterize chloride ingress through cold joints in 3D printed concrete. Mater. Struct. 2023, 56, 51. [Google Scholar] [CrossRef]
- Alexander, M.G. Durability Index Testing Procedure Manual; University of Cape Town: Cape Town, South Africa, 2018. [Google Scholar]
- Hájková, K.; Šmilauer, V.; Jendele, L.; Červenka, J. Prediction of reinforcement corrosion due to chloride ingress and its effects on serviceability. Eng. Struct. 2018, 174, 768–777. [Google Scholar] [CrossRef]
- Liu, H.; Liu, C.; Bai, G.; Zhu, C. Study on the effect of chloride ion ingress on the pore structure of the attached mortar of recycled concrete coarse aggregate. Constr. Build. Mater. 2020, 263, 120123. [Google Scholar] [CrossRef]
- Xia, J.; Chen, K.; Hu, S.; Chen, J.; Wu, R.; Jin, W. Experimental and numerical study on the microstructure and chloride ion transport behavior of concrete-to-concrete interface. Constr. Build. Mater. 2023, 367, 130317. [Google Scholar] [CrossRef]
- Surehali, S.; Tripathi, A.; Nimbalkar, A.S.; Neithalath, N. Anisotropic chloride transport in 3D printed concrete and its dependence on layer height and interface types. Addit. Manuf. 2023, 62, 103405. [Google Scholar] [CrossRef]
- ISO-1920-12-2015; Determination of the Carbonation Resistance of Concrete—Accelerated Carbonation Method. International Organization for Standardization: Geneva, Switzerland, 2015.
- Sanchez, A.M.A.; Wangler, T.; Stefanoni, M.; Angst, U. Microstructural examination of carbonated 3D-printed concrete. J. Microsc. 2022, 286, 141–147. [Google Scholar] [CrossRef] [PubMed]
- Sahana, C.M.; Soda, P.R.K.; Dwivedi, A.; Kumar, S.; Kumar, A.; Pundir, A.; Dixit, A.; Gupta, S. 3D printing with stabilized earth: Material development and effect of carbon sequestration on engineering performance. Cem. Concr. Compos. 2024, 152, 105653. [Google Scholar] [CrossRef]
- Han, J.; Liu, W.; Wang, S.; Du, D.; Xu, F.; Li, W.; De Schutter, G. Effects of crack and ITZ and aggregate on carbonation penetration based on 3D micro X-ray CT microstructure evolution. Constr. Build. Mater. 2016, 128, 256–271. [Google Scholar] [CrossRef]


| Ref. | Mix | Binder Description | Mix Description | Test Method | Curing | Cast Porosity (%) | Printed Porosity (%) |
|---|---|---|---|---|---|---|---|
| [28] | A | 100% OPC | VMA%/C 0.4, HRWR%/C 0.81 | MIP | 38 days @ 20 °C, 6 days @ 50 °C | 13.58 | 13.11 |
| B | 100% OPC | VMA%/C 0.47, HRWR%/C 0.95 | MIP | 38 days @ 20 °C, 6 days @ 50 °C | 13.74 | 12.89 | |
| C | 100% OPC | VMA%/C 0.4, HRWR%/C 1.52 | MIP | 38 days @ 20 °C, 6 days @ 50 °C | 11.23 | 11.67 | |
| [29] | M1 | 100% MK | - | XCT | 28 days | 4.48 | 2.98 |
| C + G | 90 days | 10 | 14.5 | ||||
| M2 | 95% MK 5% Slag | - | XCT | 28 days | 4.07 | 1.81 | |
| C + G | 90 days | 8 | 10.9 | ||||
| [26] | Control | 100% OPC | 100% SS | XCT | - | - | 0.11 |
| AT50 | 90% OPC 10% SF | 50% SS 50% AT | XCT | - | - | 0.09 | |
| AT100 | 90% OPC 10% SF | 100% AT | XCT | - | - | 0.3 | |
| [30] | REF | 50% OPC 50% GGBS | S/B 1 | VS | 28 days @RH = 60 | - | 19.75 |
| 28 days @RH > 95 | - | 9 | |||||
| M1 | 100% OPC | S/B 1.5 | VS | 28 days @RH = 60 | - | 4.25 | |
| 28 days @RH > 95 | - | 4.5 | |||||
| M2 | 75% OPC 25% GGBS | S/B 1.5 | VS | 28 days @RH = 60 | - | 12 | |
| 28 days @RH > 95 | - | 8.5 | |||||
| [31] | P | 44.6% OPC 29.1% FA 26.3% LP | S/B 1 W/B 0.3 | XCT | - | - | 1.1 |
| H | 61.7%OPC 32.7% FA 5.6% SF | S/B 1 W/B 0.2 | XCT | - | - | 1.8 | |
| [27] | REF | 100% OPC | - | XCT | 28 days @ 20 °C RH > 95% | 38.9 | 30.1 |
| H012 | 100% OPC | 0.6 g HPMC | XCT | 28 days @ 20 °C RH > 95% | 39.4 | 34.2 | |
| H02 | 100% OPC | 1 g HPMC | XCT | 28 days @ 20 °C RH > 95% | 41.2 | 36.4 | |
| H03 | 100% OPC | 1.5 g HPMC | XCT | 28 days @ 20 °C RH > 95% | 45.1 | 40.6 | |
| S6 | 94% OPC 6% SF | - | XCT | 28 days @ 20 °C RH > 95% | 36.2 | 27.7 | |
| S10 | 90% OPC 10% SF | - | XCT | 28 days @ 20 °C RH > 95% | 35.1 | 25.7 | |
| S16 | 84% OPC 16% SF | - | XCT | 28 days @ 20 °C RH > 95% | 33.8 | 23.2 | |
| S012 + S6 | 94% OPC 6% SF | 0.6 g HPMC | XCT | 28 days @ 20 °C RH > 95% | 38.5 | 34 | |
| [32] | Cast | 70% OPC 20% FA 10% SF | S/B 1.5 W/B 0.25 | MIP | 28 days | 8.16 | - |
| XCT | - | 8.07 | - | ||||
| 1Layer | 70% OPC 20% FA 10% SF | S/B 1.5 W/B 0.25 | MIP | 28 days | - | 7.86 | |
| XCT | - | - | 5.1 | ||||
| 3 Layer | 70% OPC 20% FA 10% SF | S/B 1.5 W/B 0.25 | MIP | 28 days | - | 6.7 | |
| XCT | - | - | 5.09 | ||||
| [33,34] | Cast | 96% OPC 2% NC 2% SF | 0.26% HRWR | XCT | - | 4.89 | - |
| T1 | 96% OPC 2% NC 2% SF | 0.26% HRWR | XCT | - | - | 2.52 | |
| T2 | 96% OPC 2% NC 2% SF | 0.26% HRWR | XCT | - | - | 2.73 | |
| T3 | 96% OPC 2% NC 2% SF | 0.26% HRWR | XCT | - | - | 1.65 | |
| [35] | Cast | 100% OPC | SS/B 1.5 W/B 0.32 | XCT | 28 days | 14.6 | - |
| UT5 | 100% OPC | SS/B 1.5 W/B 0.32 | XCT | 28 days | - | 17.6 | |
| LT14 | 100% OPC | SS/B 1.5 W/B 0.32 | XCT | 28 days | - | 12.4 | |
| [23] | Cast | 83% OPC 17%SF | S/B 1.78 W/B 0.47 | XCT | Ambient | 2.67 | - |
| Sulfuric Acid | 2.24 | - | |||||
| 3DP-6-X | 83% OPC 17%SF | S/B 1.78 W/B 0.47 | XCT | Ambient | - | 1.26 | |
| Sulfuric Acid | - | 1.1 | |||||
| 3DP-12-X | 83% OPC 17%SF | S/B 1.78 W/B 0.47 | XCT | Ambient | - | 2.31 | |
| Sulfuric Acid | - | 1.97 | |||||
| [36] | Mold | 70% OPC 20% FA 10% SF | S/B 1.4 W/B 0.45 | VS | 28 days | 6.05 | - |
| Lab | 70% OPC 20% FA 10% SF | S/B 1.4 W/B 0.45 | VS | 28 days | - | 7.025 | |
| R-Site | 70% OPC 20% FA 10% SF | S/B 1.4 W/B 0.45 | VS | 3 h @ 6.3 m/s airflow, 28 days | - | 6.15 | |
| U-Site | 70% OPC 20% FA 10% SF | S/B 1.4 W/B 0.45 | VS | 3 h @ 6.3 m/s airflow, 28 days | - | 6.5 | |
| [32,37], | M | 70% OPC 20% FA 10% SF | S/B 1 W/B 0.35 | XCT | 90 days @ 20 °C RH > 95% | 2.15 | 1.83 |
| [38] | Cast/BM | 55% OPC 30% MK 12% CaCO3 3%G | PVA%/B 0.225 S/B 1.5 W/B 0.4 | VS | 90 days @ 20 °C, 7 days @ 50 °C | 7.5 | 14.9 |
| OL2 | 55% OPC 30% MK 12% CaCO3 3%G | PVA%/B 0.225 S/B 1.5 W/B 0.4 | VS | 90 days @ 20 °C, 7 days @ 50 °C | - | 9 | |
| OL4 | 55% OPC 30% MK 12% CaCO3 3%G | PVA%/B 0.225 S/B 1.5 W/B 0.4 | VS | 90 days @ 20 °C, 7 days @ 50 °C | - | 8.2 | |
| Z’ | 55% OPC 30% MK 12% CaCO3 3%G | PVA%/B 0.225 S/B 1.5 W/B 0.4 | VS | 90 days @ 20 °C, 7 days @ 50 °C | - | 8.9 | |
| [39] | CM | 100% OPC | S/B 1.47 W/B 0.35 | MIP | 28 days | - | 10.2 |
| C-NS-1% | 99% OPC 1% NS | S/B 1.47 W/B 0.35 | MIP | 28 days | - | 7.6 | |
| C-NS-2% | 98% OPC 2% NS | S/B 1.47 W/B 0.35 | MIP | 28 days | - | 8.5 | |
| C-MK-5% | 95% OPC 5% NS | S/B 1.47 W/B 0.35 | MIP | 28 days | - | 7.45 | |
| C-MK-10% | 90% OPC 10% MK | S/B 1.47 W/B 0.35 | MIP | 28 days | - | 6 | |
| C-MK-10%-NS-1% | 89% OPC 10% MK 1% NS | S/B 1.47 W/B 0.35 | MIP | 28 days | - | 4.4 | |
| C-MK-10%-NS-2% | 88% OPC 10% MK 2%NS | S/B 1.47 W/B 0.35 | MIP | 28 days | - | 5.45 |
| Ref. | Mix | Binder Description | Mix Description | Test Method | Curing | Shrinkage (%) | Time to Cracking (Days) |
|---|---|---|---|---|---|---|---|
| [29] | M1 | 100% MK | - | ASTM C596—Drying Shrinkage | 90 days | 2.98 | - |
| M2 | 95% MK 5% Slag | - | ASTM C596—Drying Shrinkage | 90 days | 2.86 | - | |
| [44] | L1-200 | 70% OPC 20%FA 10% SF | Layers 1, Length 200 mm | ASTM C1579—Plastic Shrinkage | - | - | - |
| L3-200 | 70% OPC 20%FA 10% SF | Layers 3, Length 200 mm | ASTM C1579—Plastic Shrinkage | - | - | - | |
| L1-300 | 70% OPC 20% FA 10% SF | Layers 1, Length 300 mm | ASTM C1579—Plastic Shrinkage | - | - | - | |
| L3-300 | 70% OPC 20% FA 10% SF | Layers 3, Length 300 mm | ASTM C1579—Plastic Shrinkage | - | - | - | |
| [47] | CL2 | 90% OPC 10% SF | 50% SS 50% LF | ASTM C1581—Drying Shrinkage | Restrained | - | 4.88 |
| FL2 | 70% OPC 20%FA 10% SF | 50% SS 50% LF | ASTM C1581—Drying Shrinkage | Restrained | - | 7.64 | |
| F2 | 70% OPC 20% FA 10% SF | 100% SS | ASTM C1581—Drying Shrinkage | Restrained | - | 6.79 | |
| LL2 | 70% OPC 20% Slag 10% SF | 50% SS 50% LF | ASTM C1581—Drying Shrinkage | Restrained | - | 5.95 | |
| L2 | 70% OPC 20% Slag 10% SF | 100% SS | ASTM C1581—Drying Shrinkage | Restrained | - | 4.95 | |
| [45] | T0 | 100% OPC | 100% N | JC/T C603-2004—Drying Shrinkage | 90 days | 0.15 | - |
| T15 | 100% OPC | 85% N 15% BT | JC/T C603-2004—Drying Shrinkage | 90 days | 0.185 | - | |
| T25 | 100% OPC | 75% N 25% BT | JC/T C603-2004—Drying Shrinkage | 90 days | 0.205 | - | |
| T35 | 100% OPC | 65% N 35% BT | JC/T C603-2004—Drying Shrinkage | 90 days | 0.22 | - | |
| T45 | 100% OPC | 55% N 45% BT | JC/T C603-2004—Drying Shrinkage | 90 days | 0.285 | - | |
| [36] | Mold | 70% OPC 20% FA 10% SF | S/B 1.4, W/B 0.45 | ASTM C1581—Drying Shrinkage | 28 days | - | - |
| Lab | 70% OPC 20% FA 10% SF | S/B 1.4, W/B 0.45 | ASTM C1581 -Drying Shrinkage | 28 days | - | - | |
| R-Site | 70% OPC 20% FA 10% SF | S/B 1.4, W/B 0.45 | ASTM C1581—Drying Shrinkage | 3 h @6.3 m/s wind, 28 days | - | - | |
| U-Site | 70% OPC 20% FA 10% SF | S/B 1.4, W/B 0.45 | ASTM C1581—Drying Shrinkage | 3 h @6.3 m/s wind, 28 days | - | - | |
| [48,49,50] | M | 90% OPC 10% SF | S/B 1.8, W/B 0.46 | Plastic Shrinkage | 210 min covered @25 °C, @5 m/s wind | 0.14 | - |
| 210 min uncovered @25 °C, @5 m/s wind | 0.36 | - |
| Ref. | Mix | Binder Description | Mix Description | Test Method | No. F/T Cycles | f′c Loss (%) | fr Loss (%) | Mass Loss (%) |
|---|---|---|---|---|---|---|---|---|
| [51] | 550-0.45 | 92% OPC 8%SF | HRWR%/B 2.1 | 12 h @ −20 ± 4 °C 12 h @20 ± 3 °C | 112 | 24.2 | 33.8 | - |
| 550-0.45 Air | 92% OPC 8%SF | HRWR%/B 1.9, AEA%/B 0.08 | 12 h @ −20 ± 4 °C 12 h @20 ± 3 °C | 112 | 8.5 | 13.4 | - | |
| 550-0.45-SBR | 92% OPC 8%SF | HRWR%/B 1.8, SBR%/B 15 | 12 h @ −20 ± 4 °C 12 h @ 20 ± 3 °C | 112 | 15.6 | 9.4 | - | |
| 650-0.45 | 92% OPC 8%SF | HRWR%/B 0.95 | 12 h @ −20 ± 4 °C 12 h @ 20 ± 3 °C | 112 | 17.2 | 22 | - | |
| 650-0.45-Air | 92% OPC 8%SF | HRWR%/B 0.9, AEA%/B 0.1 | 12 h @ −20 ± 4 °C 12 h @ 20 ± 3 °C | 112 | 5.5 | 9.4 | - | |
| 650-0.45-SBR | 92% OPC 8%SF | HRWR%/B 0.8, SBR%/B 15 | 12 h @ −20 ± 4 °C 12 h @20 ± 3 °C | 112 | 10.1 | 9.4 | - | |
| 750-0.35 | 92% OPC 8%SF | HRWR%/B 1.25 | 12 h @ −20 ± 4 °C 12 h @ 20 ± 3 °C | 112 | 16.6 | 21 | - | |
| 750-0.35-Air | 92% OPC 8%SF | HRWR%/B 1.15, AEA%/B 0.15 | 12 h @ −20 ± 4 °C 12 h @ 20 ± 3 °C | 112 | 5.2 | 7.9 | - | |
| 750-0.35-SBR | 92% OPC 8%SF | HRWR%/B 1, SBR%/B 15 | 12 h @ −20 ± 4 °C 12 h @ 20 ± 3 °C | 112 | 10.2 | 10.6 | - | |
| [56] | C | 100% OPC | SP%/B 1.1 | 12 h F/T Cycles @ −18 to 24 °C | 50 | 5.7 | - | - |
| A0.08 | 100% OPC | SP%/B 1.1, AEA%/B 0.08 | 12 h F/T Cycles @ −18 to 24 °C | 50 | 4.3 | - | - | |
| A0.10 | 100% OPC | SP%/B 1.1, AEA%/B 0.1 | 24 h F/T Cycles @ −18 to 24 °C | 50 | 3.1 | - | - | |
| A0.12 | 100% OPC | SP%/B 1.1, AEA%/B 0.12 | 24 h F/T Cycles @ −18 to 24 °C | 50 | 0.4 | - | - | |
| [31] | P-O | 44.6% OPC 29.1% FA 26.3% LP | S/B 1 W/B 0.3, Cast | 2–4 h F/T Cycles @ −18 to 5 °C | 300 | 28.7 | 48.3 | 1.4 |
| P-Z | 44.6% OPC 29.1% FA 26.3% LP | S/B 1 W/B 0.2, Printed | 2–4 h F/T Cycles @ −18 to 5 °C | 300 | 19.5 | 41.3 | 0.2 | |
| H-O | 61.7%OPC 32.7% FA 5.6% SF | S/B 1 W/B 0.2, Cast | 2–4 h F/T Cycles @ −18 to 5 °C | 300 | 22.7 | 31.1 | 0.2 | |
| H-Z | 61.7%OPC 32.7% FA 5.6% SF | S/B 1 W/B 0.2, Printed | 2–4 h F/T Cycles @ −18 to 5 °C | 300 | 5.9 | 19.1 | 0 | |
| [32] | Cast | 70% OPC 20% FA 10% SF | S/B 1.5 W/B 0.25 | ASTM C666 | 50 | 2.7 | 11 | - |
| 1 Layer | 70% OPC 20% FA 10% SF | S/B 1.5 W/B 0.25 | ASTM C666 | 50 | 5.1 | 9 | - | |
| 3 Layer | 70% OPC 20% FA 10% SF | S/B 1.5 W/B 0.25 | ASTM C666 | 50 | 1.3 | 21 | - | |
| [54] | JZ | 93% OPC 7% SF | 60% FS 40% AS | GB/T5008—Quick Freeze | 400 | 21 | - | 3.02 |
| 3D-X | 93% OPC 7% SF | 60% FS 40% AS | GB/T5008—Quick Freeze | 400 | 22.4 | - | 3.12 | |
| 3D-Y | 93% OPC 7% SF | 60% FS 40% AS | GB/T5008—Quick Freeze | 400 | 24 | - | 3.56 |
| Ref. | Mix | Binder Description | Mix Description | Test Method | Procedure | Cast f′c Loss (%) | 3DP f′c Loss (%) | Cast Mass Loss (%) | 3DP Mass Loss (%) |
|---|---|---|---|---|---|---|---|---|---|
| [28] | A | 100% OPC | VMA%/C 0.4, HRWR%/C 0.81 | ASTM C1012/C1012M | 56 d @ 1% Sulfuric Acid | - | - | 10.9 | 10.9 |
| 56 d @ 3% Sulfuric Acid | - | - | 54.5 | 47.3 | |||||
| B | 100% OPC | VMA%/C 0.47, HRWR%/C 0.95 | ASTM C1012/C1012M | 56 d @ 1% Sulfuric Acid | - | - | 10.7 | 9.1 | |
| 56 d @ 3% Sulfuric Acid | - | - | 53.6 | 46.4 | |||||
| C | 100% OPC | VMA%/C 0.4, HRWR%/C 1.52 | ASTM C1012/C1012M | 56 d @ 1% Sulfuric Acid | - | - | 19.1 | 14.5 | |
| 56 d @ 3% Sulfuric Acid | - | - | 60.9 | 49.1 | |||||
| [56] | C | 100%OPC | SP%/B 1.1 | ASTM C349–14 | 90 d @ pH2 Sulfuric Acid | - | −5.64 | - | - |
| A0.08 | 100%OPC | SP%/B 1.1, AEA%/B 0.08 | ASTM C349–14 | 90 d @ pH2 Sulfuric Acid | - | −6.53 | - | - | |
| A0.10 | 100%OPC | SP%/B 1.1, AEA%/B 0.1 | ASTM C349–14 | 90 d @ pH2 Sulfuric Acid | - | −10.61 | - | - | |
| A0.12 | 100%OPC | SP%/B 1.1, AEA%/B 0.12 | ASTM C349–14 | 90 d @ pH2 Sulfuric Acid | - | −13.44 | - | - | |
| [61] | A | 90% OPC 10% SF | SP%/B 0.3 | ASTM C1012/C1012M | 140 d @ 0.5% Sulfuric Acid | 7.5 | 8.75 | 3.7 | 3.5 |
| B | 90% OPC 10% SF | SP%/B 0.6 | ASTM C1012/C1012M | 140 d @ 0.5% Sulfuric Acid | 8.75 | 15 | 4 | 4.2 | |
| C | 90% OPC 10% SF | SP%/B 0.6 | ASTM C1012/C1012M | 140 d @ 0.5% Sulfuric Acid | 4.75 | 5 | 3.2 | 2.7 | |
| [23] | Cast | 83% OPC 17% SF | S/B 1.78 W/B 0.47 | GB/T 50082-2009 | 150 d—15 h @ 5% Sulfuric Acid, 7 h drying | −42 | - | −1.4 | - |
| 3DP-6-Y | 83% OPC 17% SF | S/B 1.78 W/B 0.47 | GB/T 50082-2009 | 150 d—15 h @ 5% Sulfuric Acid, 7 h drying | - | −54.8 | - | −1.8 | |
| 3DP-12-Y | 83% OPC 17% SF | S/B 1.78 W/B 0.47 | GB/T 50082-2009 | 150 d—15 h @ 5% Sulfuric Acid, 7 h drying | - | −43.5 | - | −1.6 | |
| [24] | OPC | 100% OPC | S/B 3.45 W/B 0.45 | ASTM C267 | 30 d @ 5% Sulfuric Acid | 34 | - | 1 | - |
| FA1GPC | 70% FA1 30% SB | S/B 2.38 W/B 0.45 | ASTM C267 | 30 d @ 5% Sulfuric Acid | 32 | - | −0.28 | - | |
| FA1NSGPC | 68% FA1 30% SB 2% NS | S/B 2.38 W/B 0.45 | ASTM C267 | 30 d @ 5% Sulfuric Acid | 19 | - | −0.77 | - | |
| FA2GPC | 70% FA2 30% SB | S/B 2.38 W/B 0.45 | ASTM C267 | 30 d @ 5% Sulfuric Acid | 28 | - | −0.39 | - | |
| FA2NSGPC | 68% FA2 30% SB 2% NS | S/B 2.38 W/B 0.45 | ASTM C267 | 30 d @ 5% Sulfuric Acid | 17 | - | −0.74 | - | |
| [60] | M | 80% OPC 20% FA | S/B 1.8 W/B 0.54 | GB/T 50082-2009 | 231 d, 54 h @ 5% Sulfuric Acid, 18 h drying | - | - | 4.03 | - |
| 231 d, 126 h @ 5% Sulfuric Acid, 42 h drying | - | - | 5.02 | - | |||||
| 231 d, 252 h @ 5% Sulfuric Acid, 84 h drying | - | - | 3.28 | - | |||||
| 231 d, 378 h @ 5% Sulfuric Acid, 126 h drying | - | - | 2.98 | - |
| Ref. | Mix | Binder Description | Mix Description | Test Method | Procedure | Curing | D (×10−12 m/s2) | PD (mm) |
|---|---|---|---|---|---|---|---|---|
| [30] | REF | 50% OPC 50% GGBS | S/B 1 | RCM—NTBuild492 | 24 h @ 0.3 M NaOH 10% NaCl | 28 d @ RH = 60 | 7.33 | - |
| 28 d @ RH > 95 | 4.67 | - | ||||||
| M1 | 100% OPC | S/B 1.5 | RCM—NTBuild492 | 24 h @ 0.3 M NaOH 10% NaCl | 28 d @ RH = 60 | 10.33 | - | |
| 28 d @ RH > 95 | 8.33 | - | ||||||
| M2 | 75% OPC 25% GGBS | S/B 1.5 | RCM—NTBuild492 | 24 h @ 0.3 M NaOH 10% NaCl | 28 d @ RH = 60 | 20.33 | - | |
| 28 d @ RH > 95 | 10.33 | - | ||||||
| [31] | P-O | 44.6% OPC 29.1% FA 26.3% LP | S/B 1 W/B 0.3, Cast | RCM—NTBuild492, CPD | 96 h | 28 d | 56.3 | 9.45 |
| P-Z | 44.6% OPC 29.1% FA 26.3% LP | S/B 1 W/B 0.2, Printed | RCM—NTBuild492, CPD | 96 h | 28 d | 78.8 | 12.36 | |
| H-O | 61.7%OPC 32.7% FA 5.6% SF | S/B 1 W/B 0.2, Cast | RCM—NTBuild492, CPD | 96 h | 28 d | 21.3 | 3.82 | |
| H-Z | 61.7%OPC 32.7% FA 5.6% SF | S/B 1 W/B 0.2, Printed | RCM—NTBuild492, CPD | 96 h | 28 d | 52.5 | 8.91 | |
| [66] | P | 48% OPC 26% MSS 26% FA | 2, 13, 1440 min/layer | µXRF | 24 h @ 0.1 M Na OH 1 M NaCl | 28 d @ 20 °C RH = 65% | - | - |
| Q | 48% OPC 26% MSS 26% FA | 2, 13, 1440 min/layer | µXRF | 24 h @ 0.1 M NaOH 1 M NaCl | 28 d @ 20 °C RH = 65%, 3 d @ 40 °C | - | - | |
| [45] | T0 | 100% OPC | 100% N | RCM-GB/T50082-2009 [62] | 0.3 M NaOH 10% NaCl | 28 d | 5.8 | - |
| T15 | 100% OPC | 85% N 15% BT | RCM—GB/T50082-2009 | 0.3 M NaOH 10% NaCl | 28 d | 5.2 | - | |
| T25 | 100% OPC | 75% N 25% BT | RCM—GB/T50082-2009 | 0.3 M NaOH 10% NaCl | 28 d | 4.33 | - | |
| T35 | 100% OPC | 65% N 35% BT | RCM—GB/T50082-2009 | 0.3 M NaOH 10% NaCl | 28 d | 4.2 | - | |
| T45 | 100% OPC | 55% N 45% BT | RCM—GB/T50082-2009 | 0.3 M NaOH 10% NaCl | 28 d | 4.6 | - | |
| [36,67] | Mold | 70% OPC 20% FA 10% SF | S/B 1.4 W/B 0.45 | CCI-UCT Manual | 5 M NaCl | 21 d @ ambient, 7 d @ 50 °C | 0.325 mS/cm | - |
| Lab | 70% OPC 20% FA 10% SF | S/B 1.4 W/B 0.45 | CCI-UCT Manual | 5 M NaCl | 21 d @ ambient, 7 d @ 50 °C | 0.4 mS/cm | - | |
| R-Site | 70% OPC 20% FA 10% SF | S/B 1.4 W/B 0.45 | CCI-UCT Manual | 5 M NaCl | 21 d @ ambient, 7 d @ 50 °C | 0.296 mS/cm | - | |
| U-Site | 70% OPC 20% FA 10% SF | S/B 1.4 W/B 0.45 | CCI-UCT Manual | 5 M NaCl | 21 d @ ambient, 7 d @ 50 °C | 0.346 mS/cm | - | |
| [38] | Cast | 55% OPC 30% MK 12% CaCO3 3%G | PVA%/B 0.225 S/B 1.5 W/B 0.4 | RCM | - | 90 days @ 20 °C | 284.5 kΩcm | |
| BM | 55% OPC 30% MK 12% CaCO3 3%G | PVA%/B 0.225 S/B 1.5 W/B 0.4 | RCM | - | 90 days @ 20 °C | 165.5 kΩcm | ||
| OL2-Z | 55% OPC 30% MK 12% CaCO3 3%G | PVA%/B 0.225 S/B 1.5 W/B 0.4 | RCM | - | 90 days @ 20 °C | 99.6 kΩcm | ||
| OL4-Z | 55% OPC 30% MK 12% CaCO3 3%G | PVA%/B 0.225 S/B 1.5 W/B 0.4 | RCM | - | 90 days @ 20 °C | 113.3 kΩcm | ||
| Z’-Z | 55% OPC 30% MK 12% CaCO3 3%G | PVA%/B 0.225 S/B 1.5 W/B 0.4 | RCM | - | 90 days @ 20 °C | 177 kΩcm | ||
| [39] | CM | 100% OPC | S/B 1.47 W/B 0.35 | RCM—ASTM C1202 | 3% NaCl | 28 days | 1575 C | 11.83 |
| C-NS-1% | 99% OPC 1% NS | S/B 1.47 W/B 0.35 | RCM—ASTM C1202 | 3% NaCl | 28 days | 1650 C | - | |
| C-NS-2% | 98% OPC 2% NS | S/B 1.47 W/B 0.35 | RCM—ASTM C1202 | 3% NaCl | 28 days | 2600 C | - | |
| C-MK-5% | 95% OPC 5% NS | S/B 1.47 W/B 0.35 | RCM—ASTM C1202 | 3% NaCl | 28 days | 850 C | 5.8 | |
| C-MK-10% | 90% OPC 10% MK | S/B 1.47 W/B 0.35 | RCM—ASTM C1202 | 3% NaCl | 28 days | 350 C | 9 | |
| C-MK-10%-NS-1% | 89% OPC 10% MK 1% NS | S/B 1.47 W/B 0.35 | RCPT—ASTM C1202, CPD | 3% NaCl | 28 days | 311 C | 3.43 | |
| C-MK-10%-NS-2% | 88% OPC 10% MK 2%NS | S/B 1.47 W/B 0.35 | RCPT—ASTM C1202, CPD | 3% NaCl | 28 days | 318 C | 3.08 |
| Ref. | Mix | Binder Description | Mix Description | Test Method | Procedure | Curing | PD (mm) |
|---|---|---|---|---|---|---|---|
| [30] | REF | 50% OPC 50% GGBS | S/B 1 | AC | 60 d @ RH = 70% 50–90% CO2 | 28 d @ RH = 60 | 4.8/√day |
| 28 d @ RH > 95 | 2.4/√day | ||||||
| M1 | 100% OPC | S/B 1.5 | AC | 60 d @ RH = 70% 50–90% CO2 | 28 d @ RH = 60 | 7.4/√day | |
| 28 d @ RH > 95 | 1/√day | ||||||
| M2 | 75% OPC 25% GGBS | S/B 1.5 | AC | 60 d @ RH = 70% 50–90% CO2 | 28 d @ RH = 60 | 12/√day | |
| 28 d @ RH > 95 | 0.8/√day | ||||||
| [73] | C | 100% OPC | W/B 0.6 | - | 60 d @ RH = 70% 50–90% CO2 | 60 d | 0.5 |
| 3DP | 77% OPC 15% FL 8% SF | S/B 1.9 W/B 0.30 | - | 60 d @ RH = 70% 50–90% CO2 | 70 d | 1 | |
| [45] | T0 | 100% OPC | 100% N | GB/T 50082-2009 | - | 28 d | 8.25 |
| T15 | 100% OPC | 85% N 15% BT | GB/T 50082-2009 | - | 28 d | 7.75 | |
| T25 | 100% OPC | 75% N 25% BT | GB/T 50082-2009 | - | 28 d | 6.5 | |
| T35 | 100% OPC | 65% N 35% BT | GB/T 50082-2009 | - | 28 d | 5.25 | |
| T45 | 100% OPC | 55% N 45% BT | GB/T 50082-2009 | - | 28 d | 5.13 |
Disclaimer/Publisher’s Note: The statements, opinions and data contained in all publications are solely those of the individual author(s) and contributor(s) and not of MDPI and/or the editor(s). MDPI and/or the editor(s) disclaim responsibility for any injury to people or property resulting from any ideas, methods, instructions or products referred to in the content. |
© 2025 by the authors. Licensee MDPI, Basel, Switzerland. This article is an open access article distributed under the terms and conditions of the Creative Commons Attribution (CC BY) license (https://creativecommons.org/licenses/by/4.0/).
Share and Cite
Bradshaw, J.; Si, W.; Khan, M.; McNally, C. Emerging Insights into the Durability of 3D-Printed Concrete: Recent Advances in Mix Design Parameters and Testing. Designs 2025, 9, 85. https://doi.org/10.3390/designs9040085
Bradshaw J, Si W, Khan M, McNally C. Emerging Insights into the Durability of 3D-Printed Concrete: Recent Advances in Mix Design Parameters and Testing. Designs. 2025; 9(4):85. https://doi.org/10.3390/designs9040085
Chicago/Turabian StyleBradshaw, James, Wen Si, Mehran Khan, and Ciaran McNally. 2025. "Emerging Insights into the Durability of 3D-Printed Concrete: Recent Advances in Mix Design Parameters and Testing" Designs 9, no. 4: 85. https://doi.org/10.3390/designs9040085
APA StyleBradshaw, J., Si, W., Khan, M., & McNally, C. (2025). Emerging Insights into the Durability of 3D-Printed Concrete: Recent Advances in Mix Design Parameters and Testing. Designs, 9(4), 85. https://doi.org/10.3390/designs9040085