Mechanical Design of a Novel Functionally Graded Lattice Structure for Long Bone Scaffolds


Abstract
1. Introduction
2. Materials and Methods
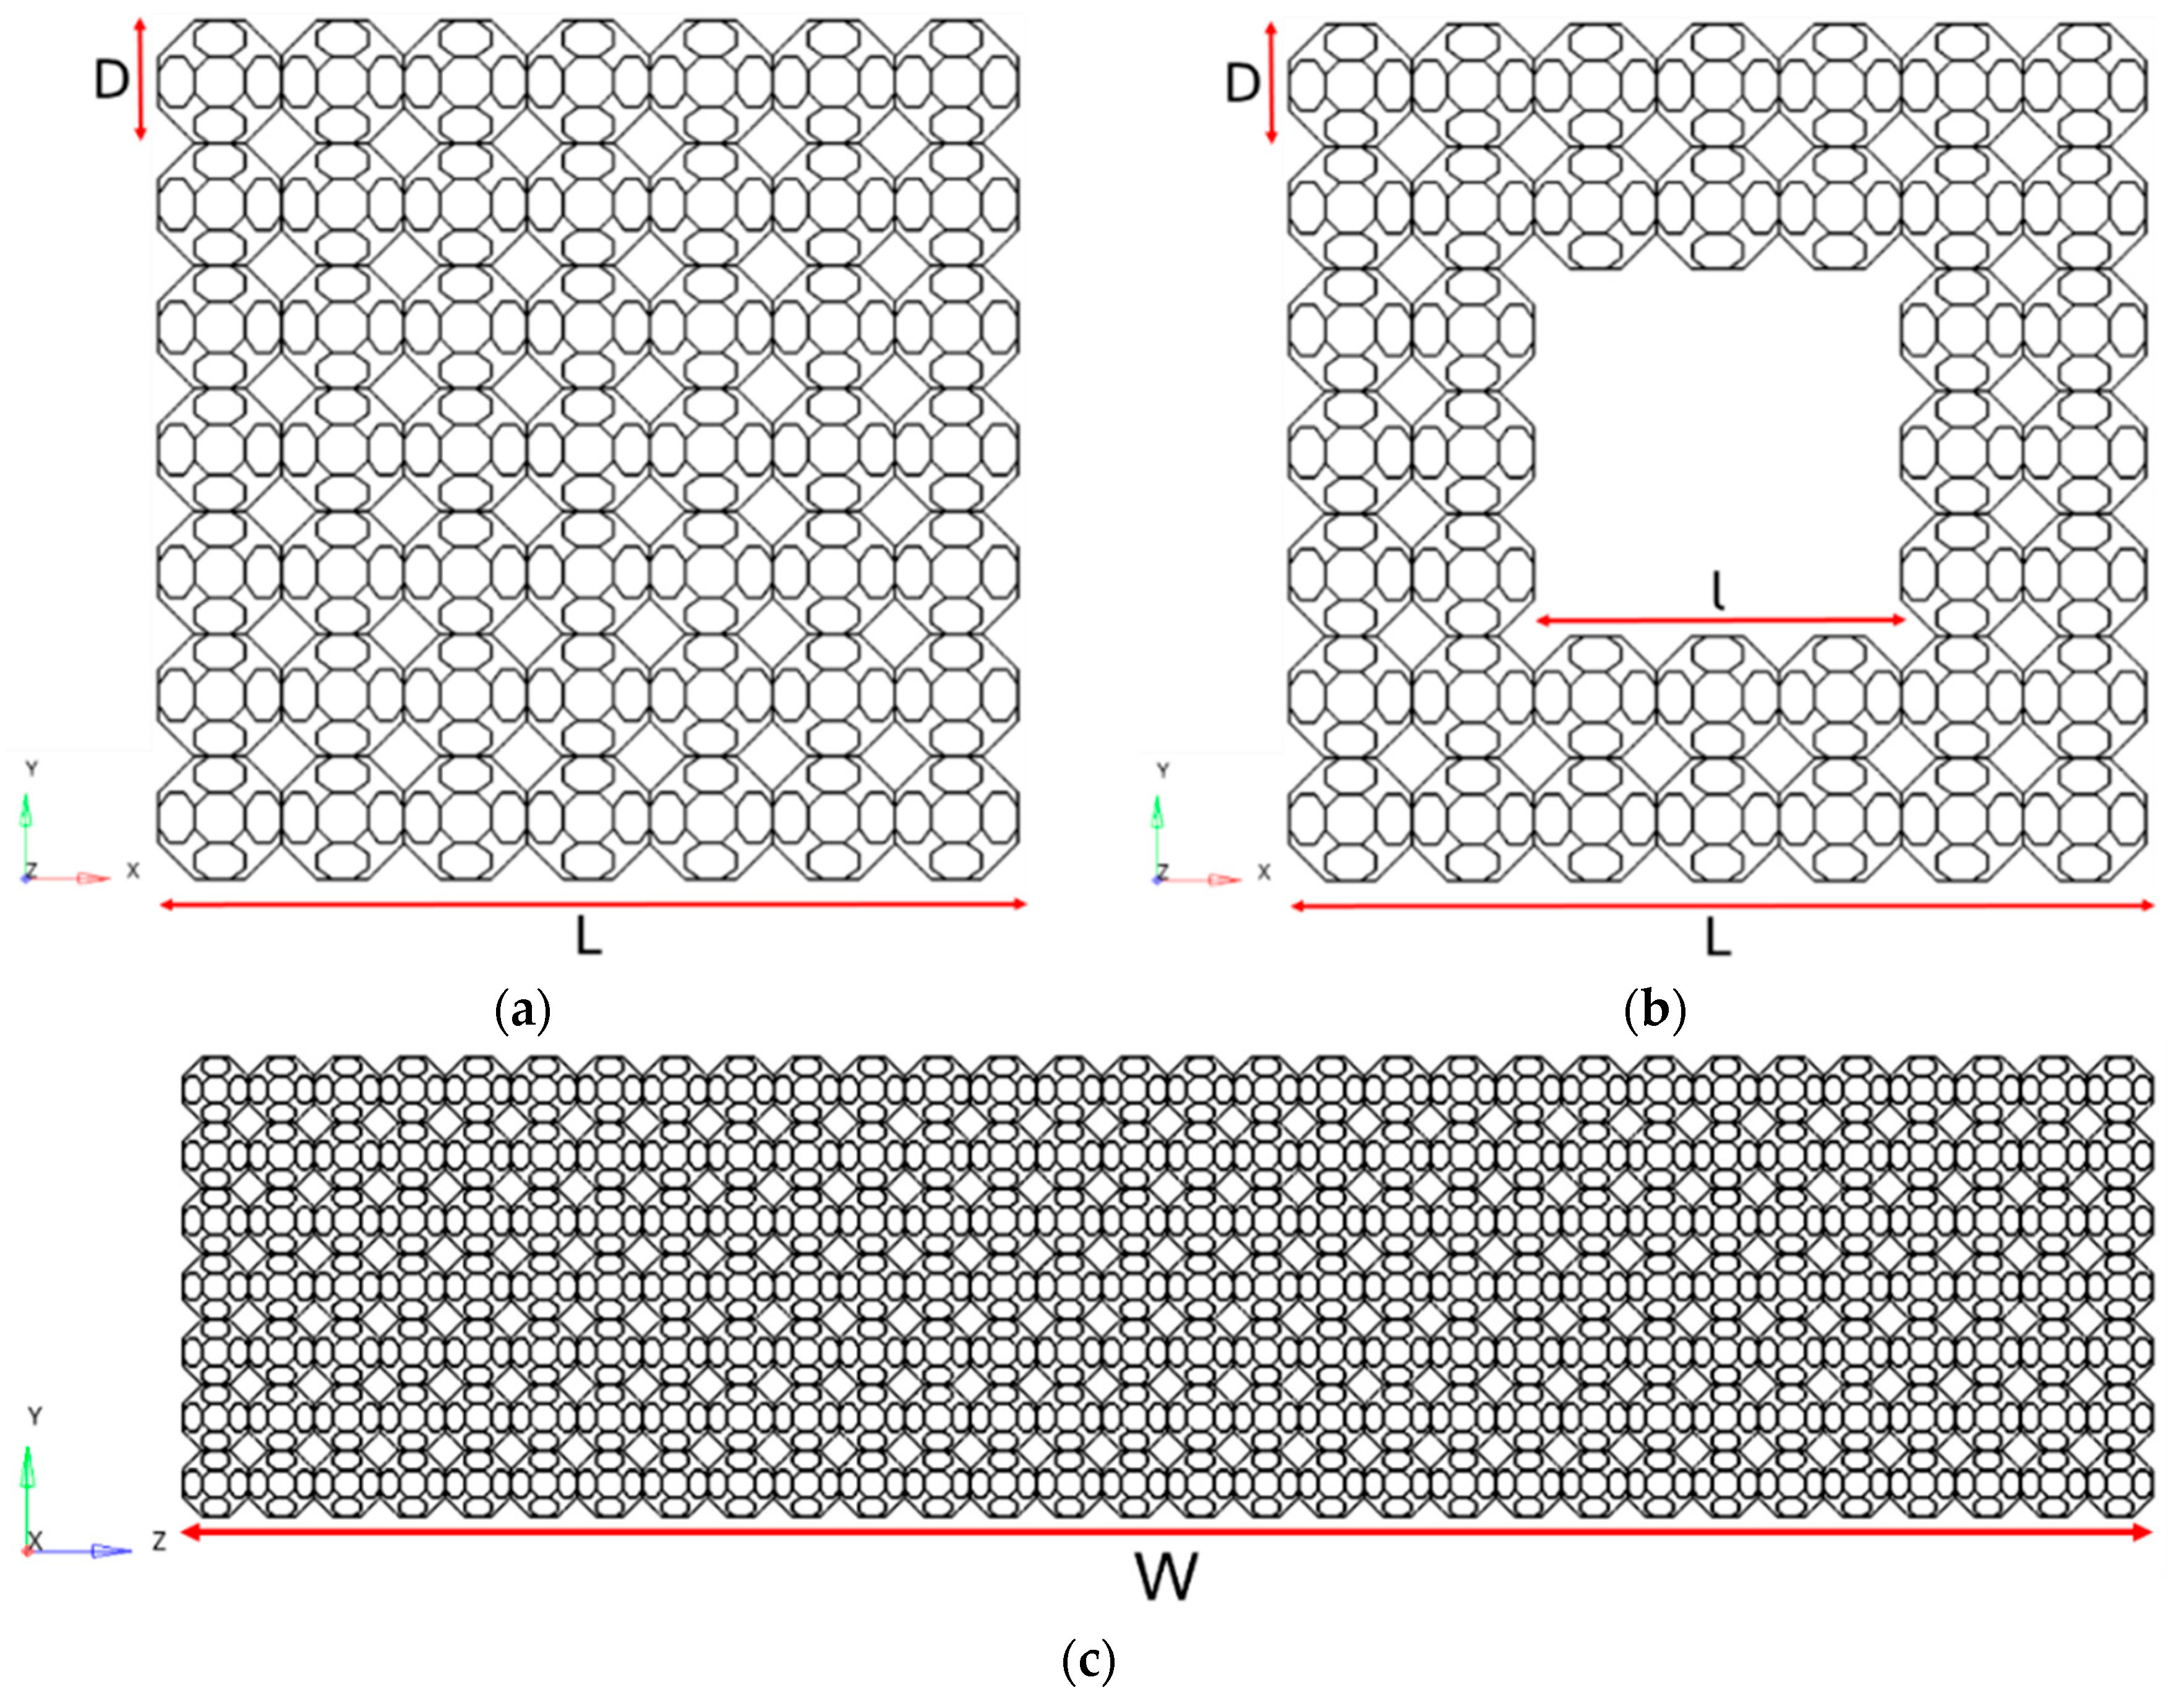
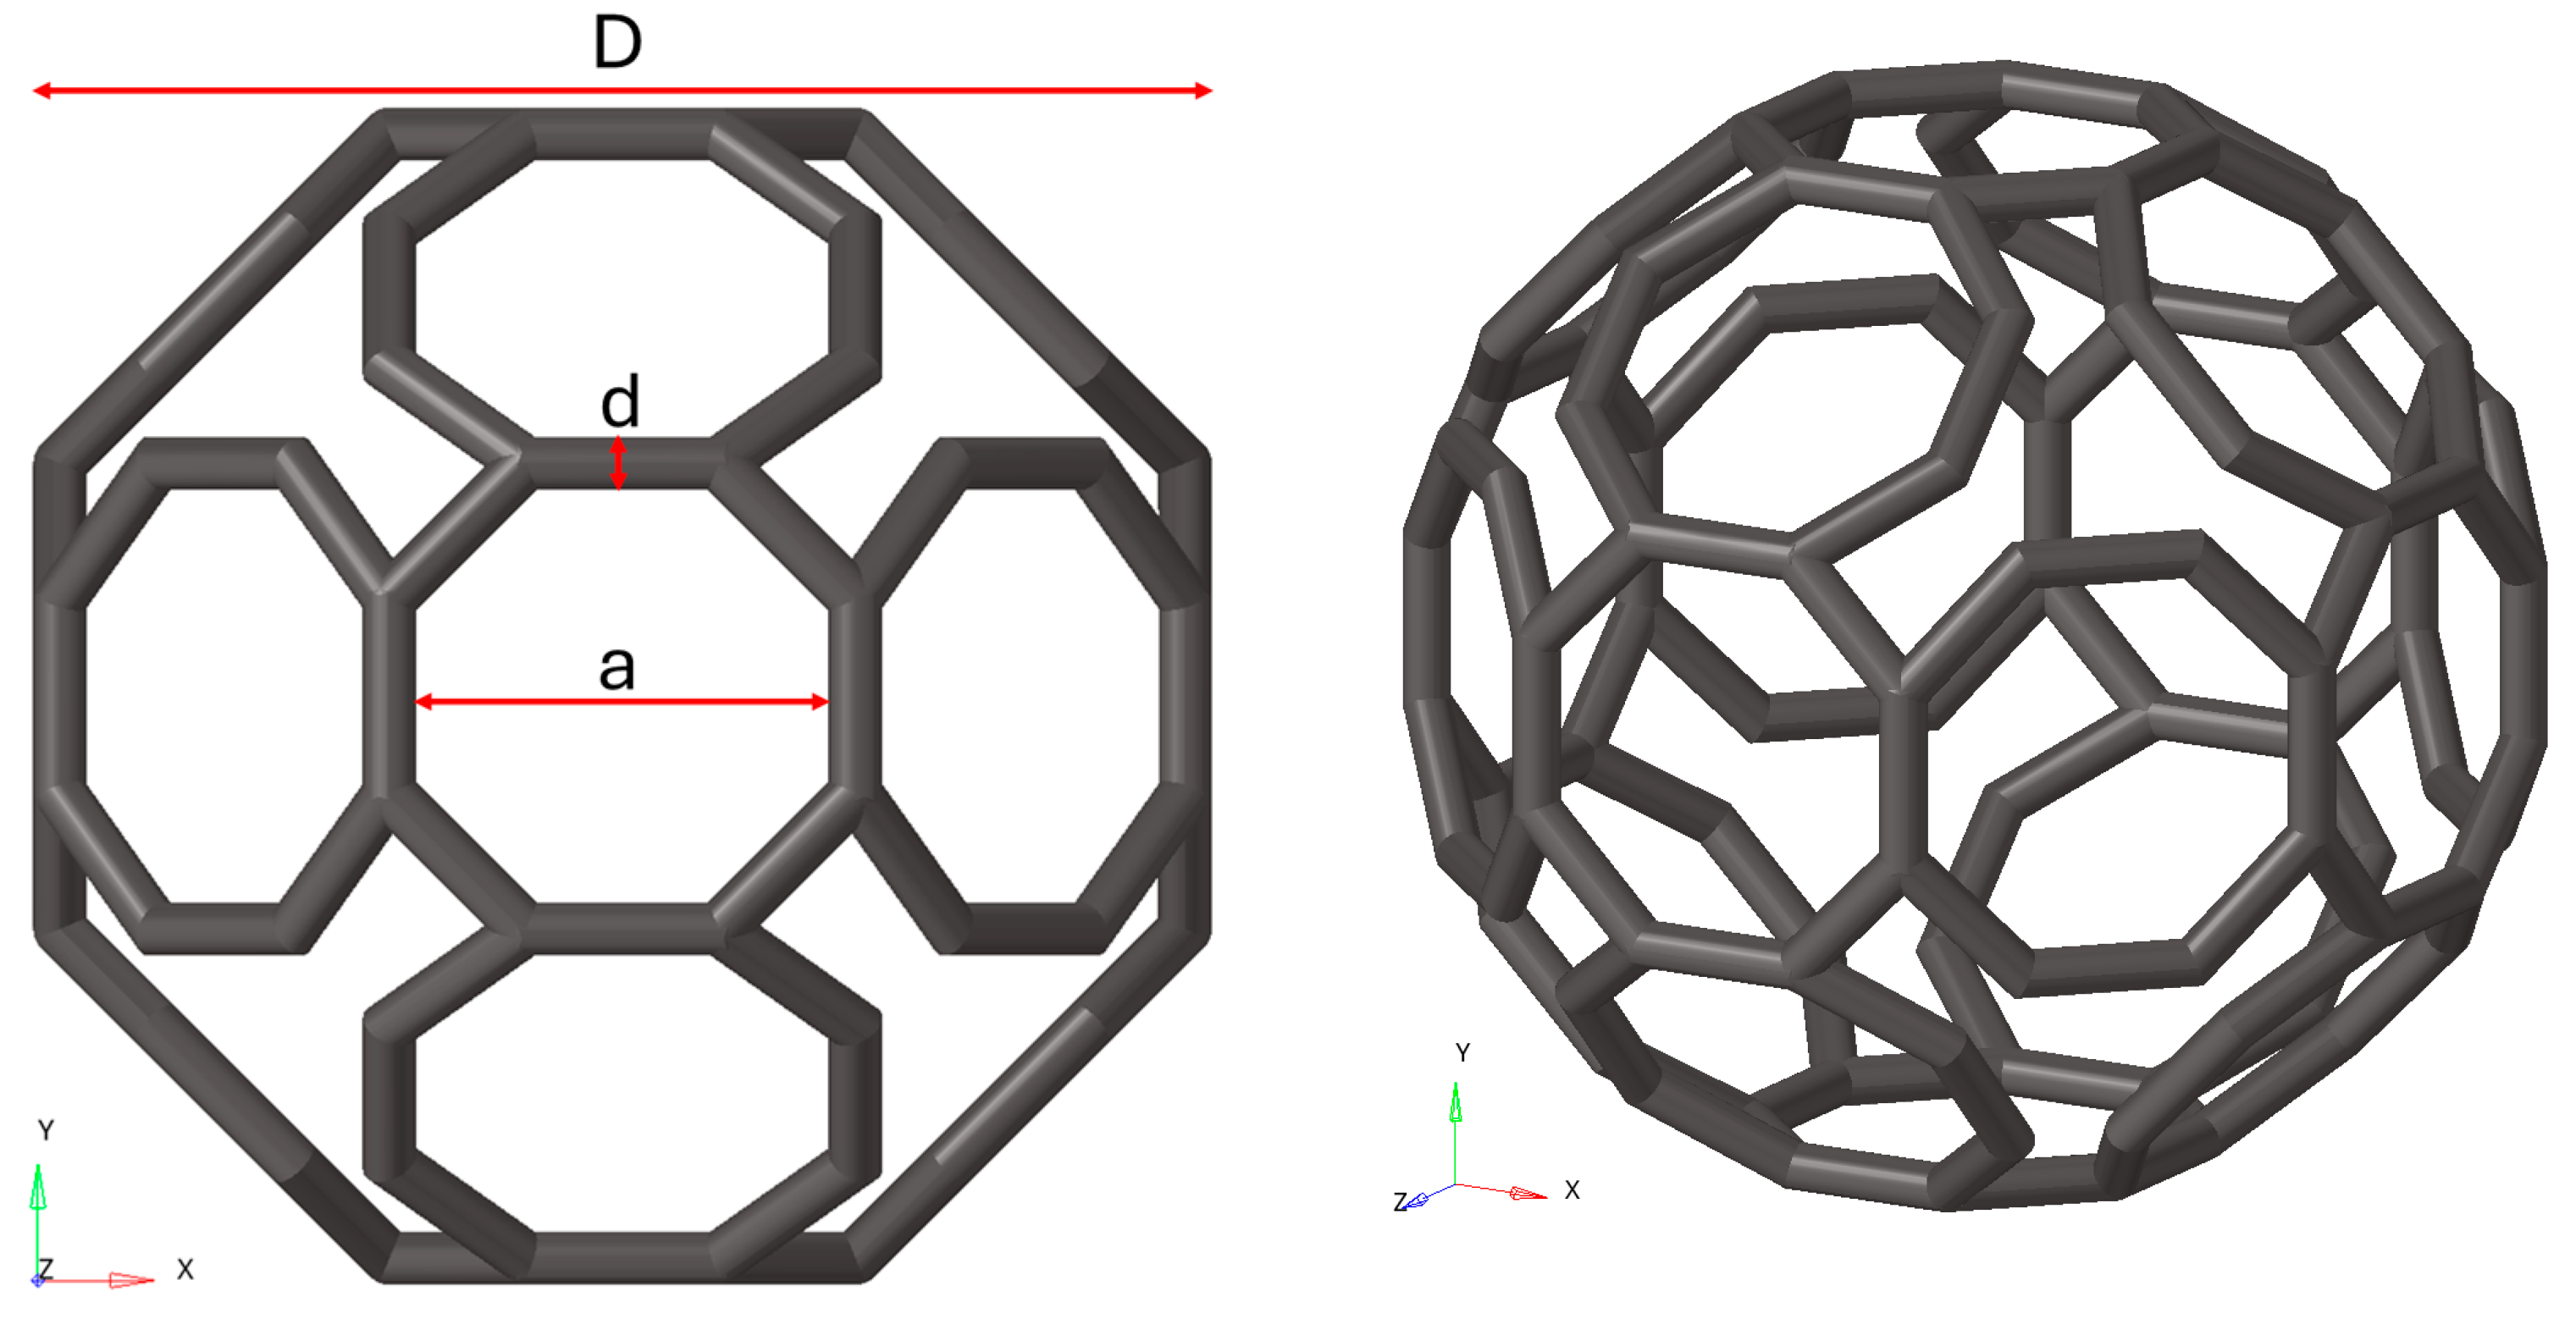
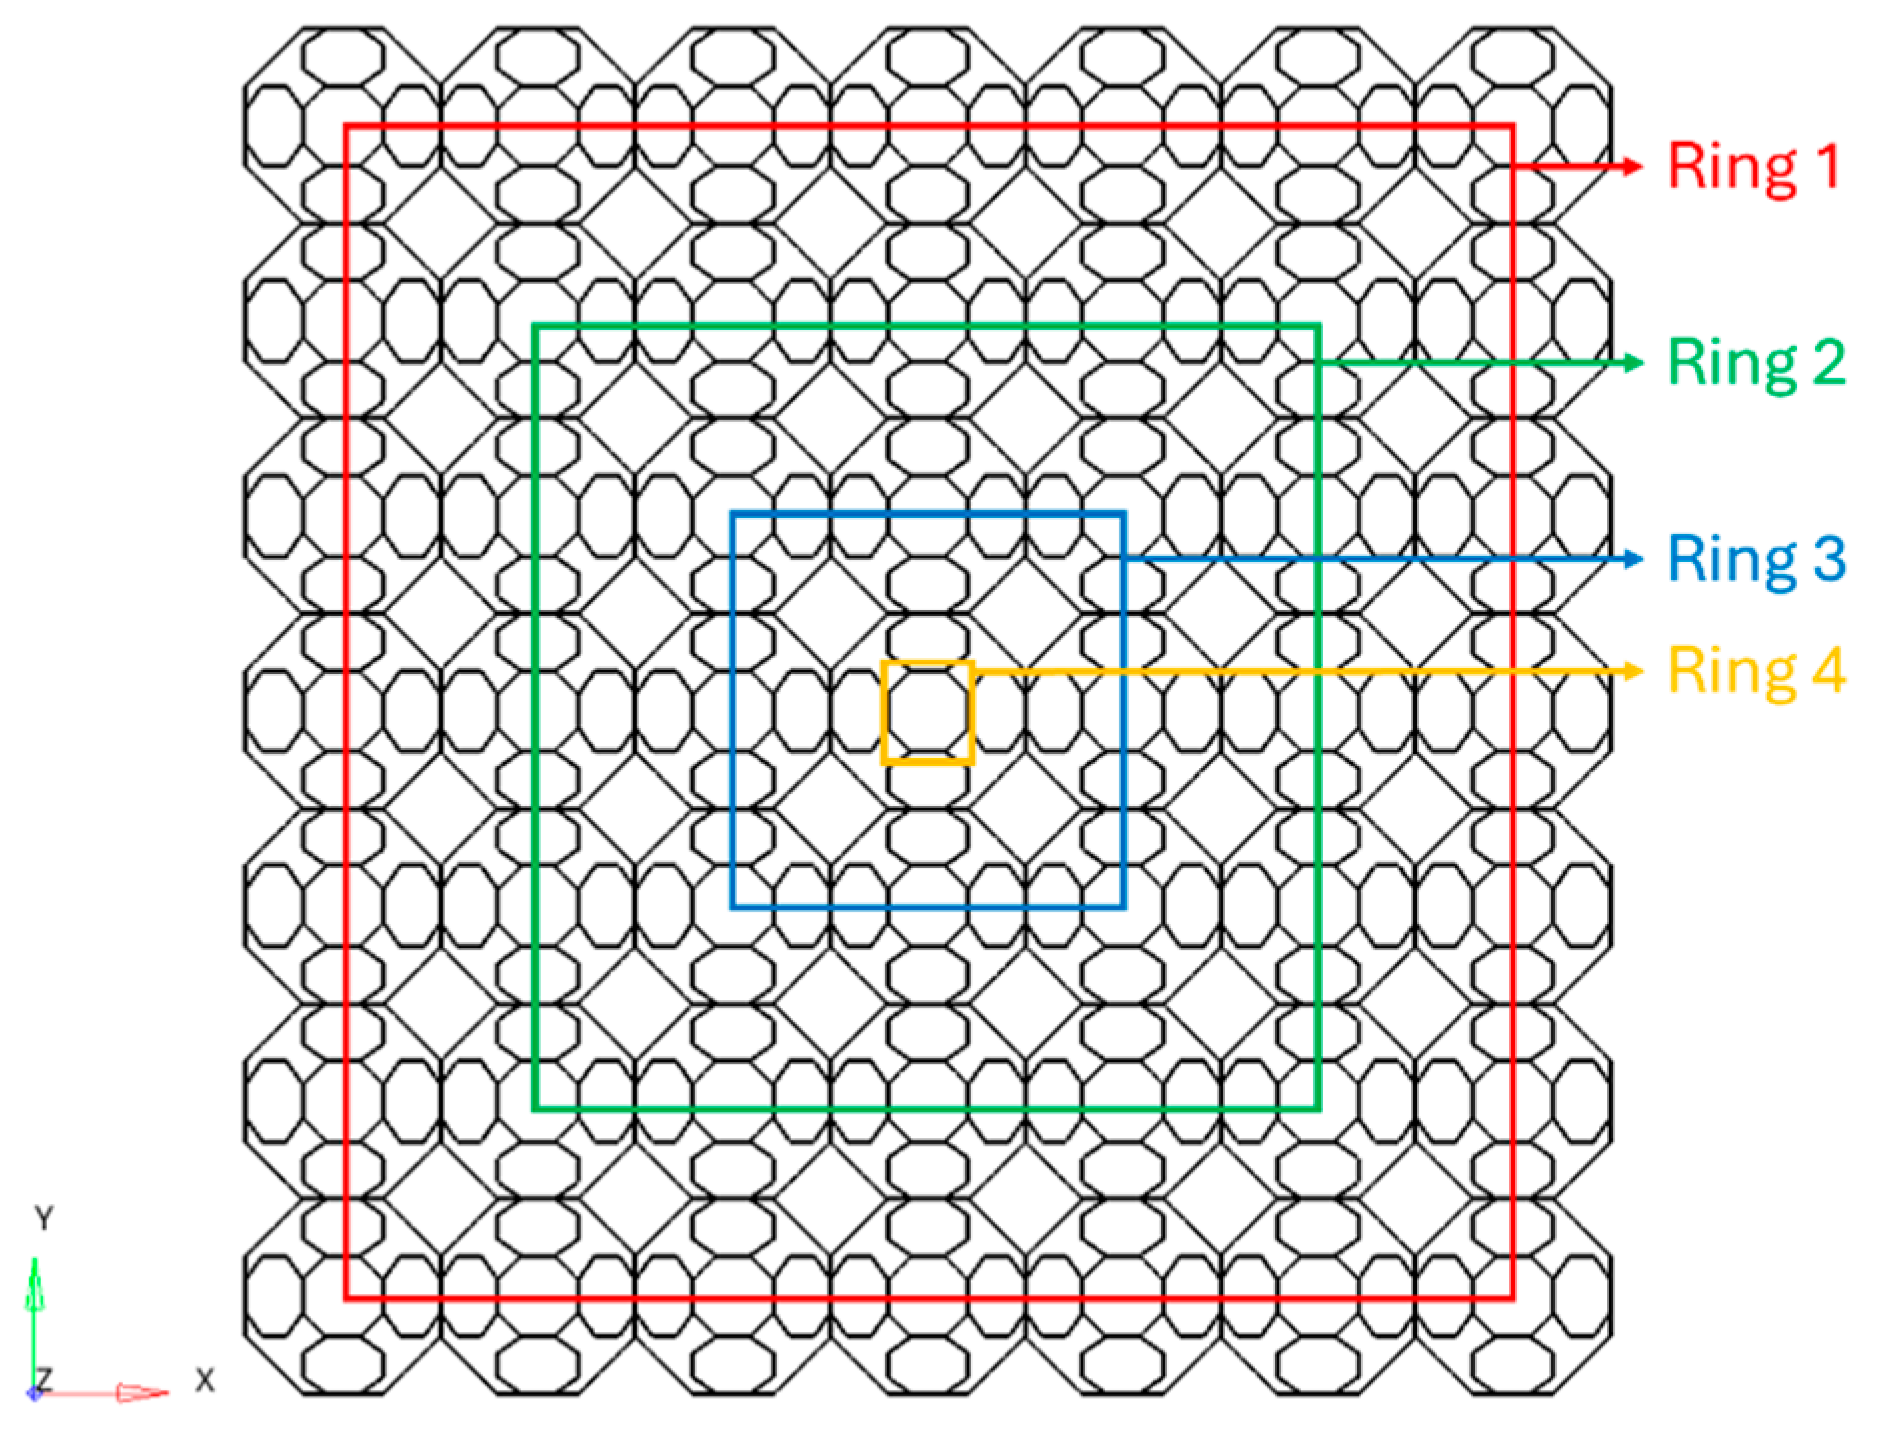
2.1. Design of TAOR Strucures
2.2. Euler–Bernoulli Beam Theory
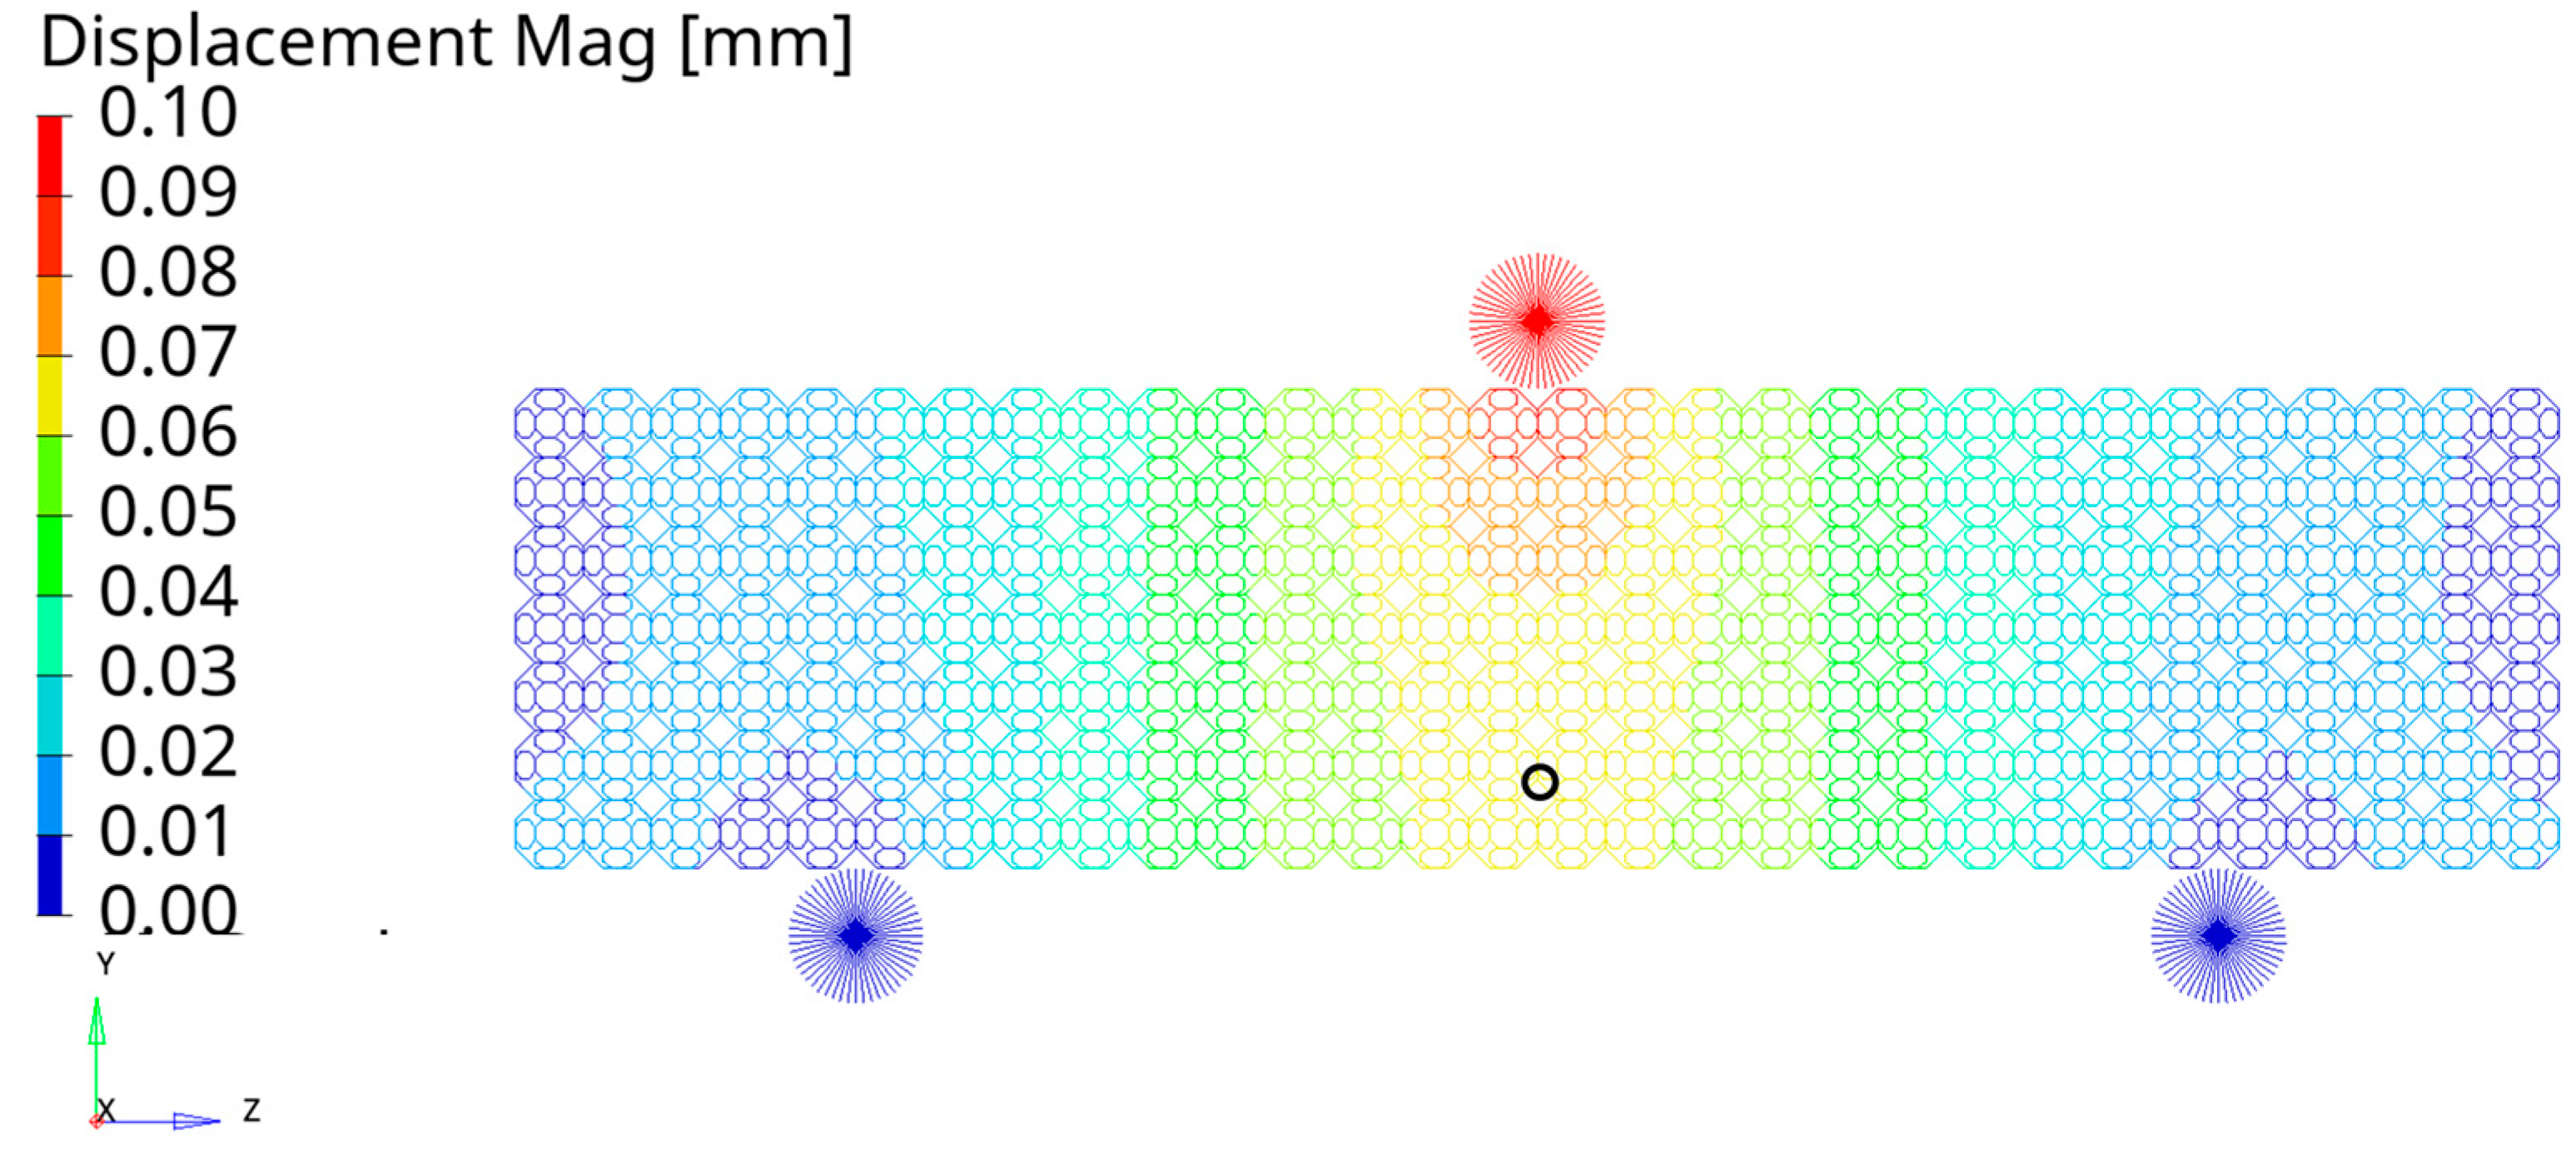
2.3. Finite Element Model
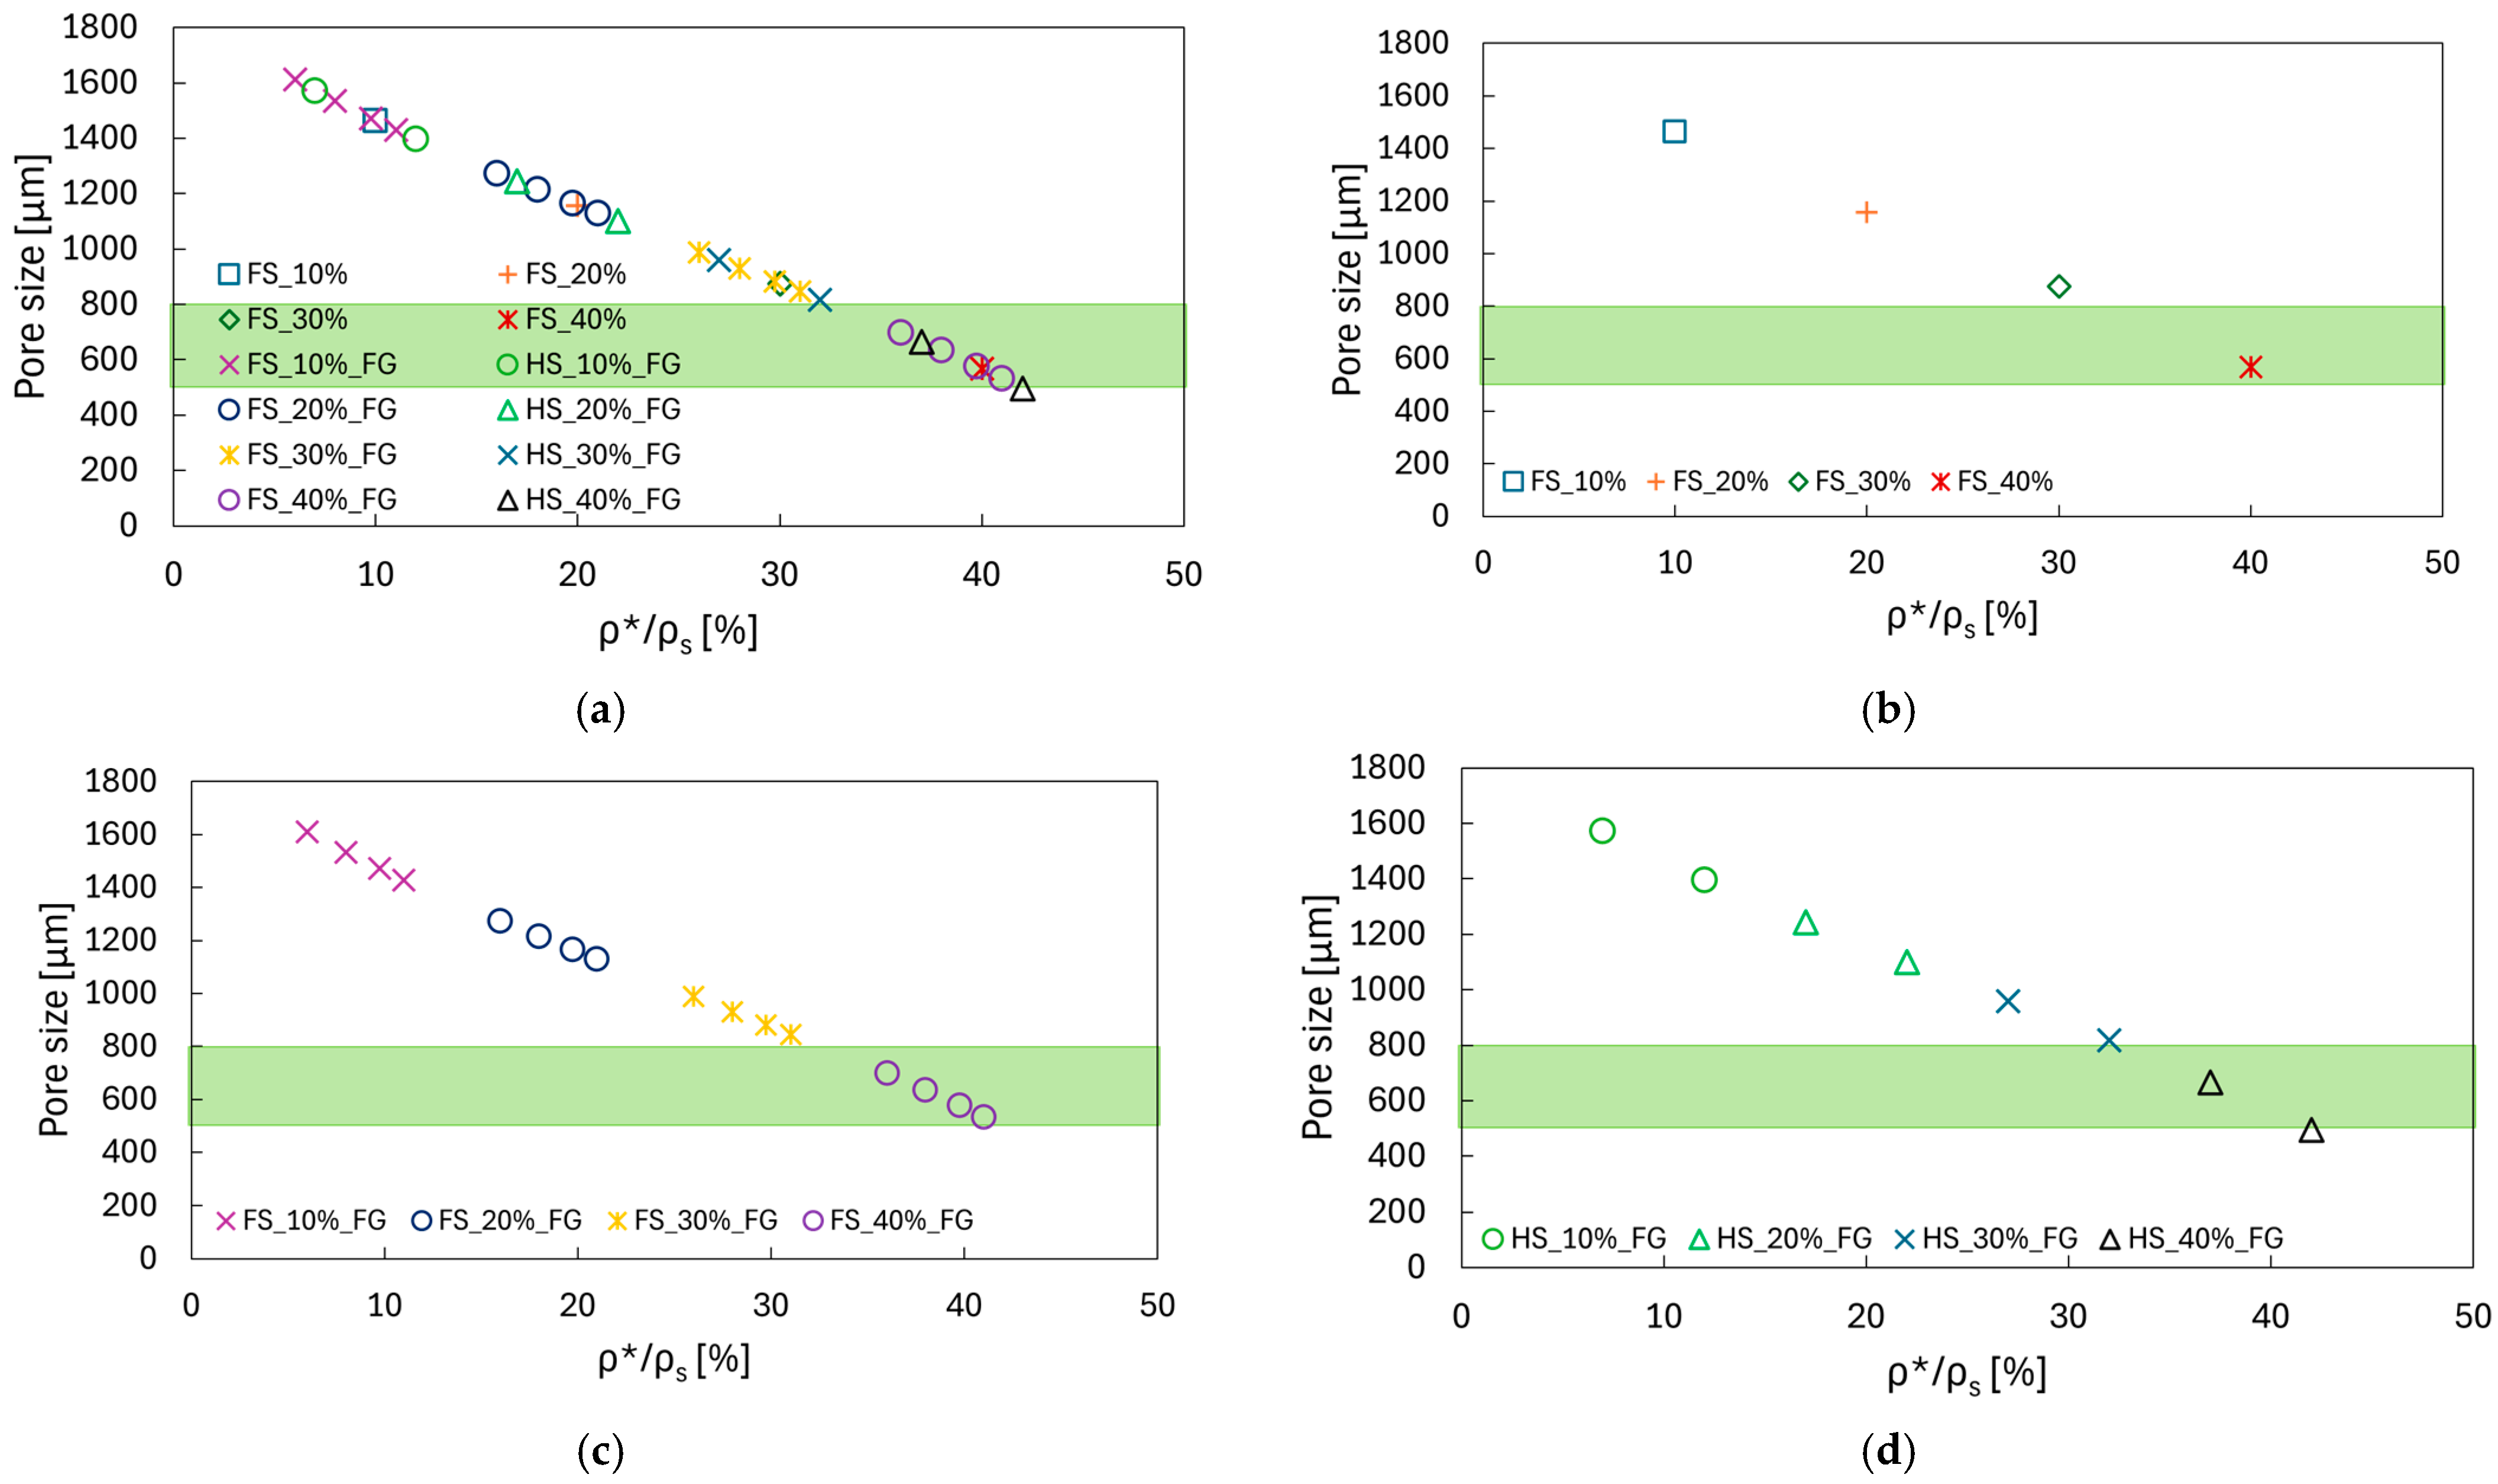
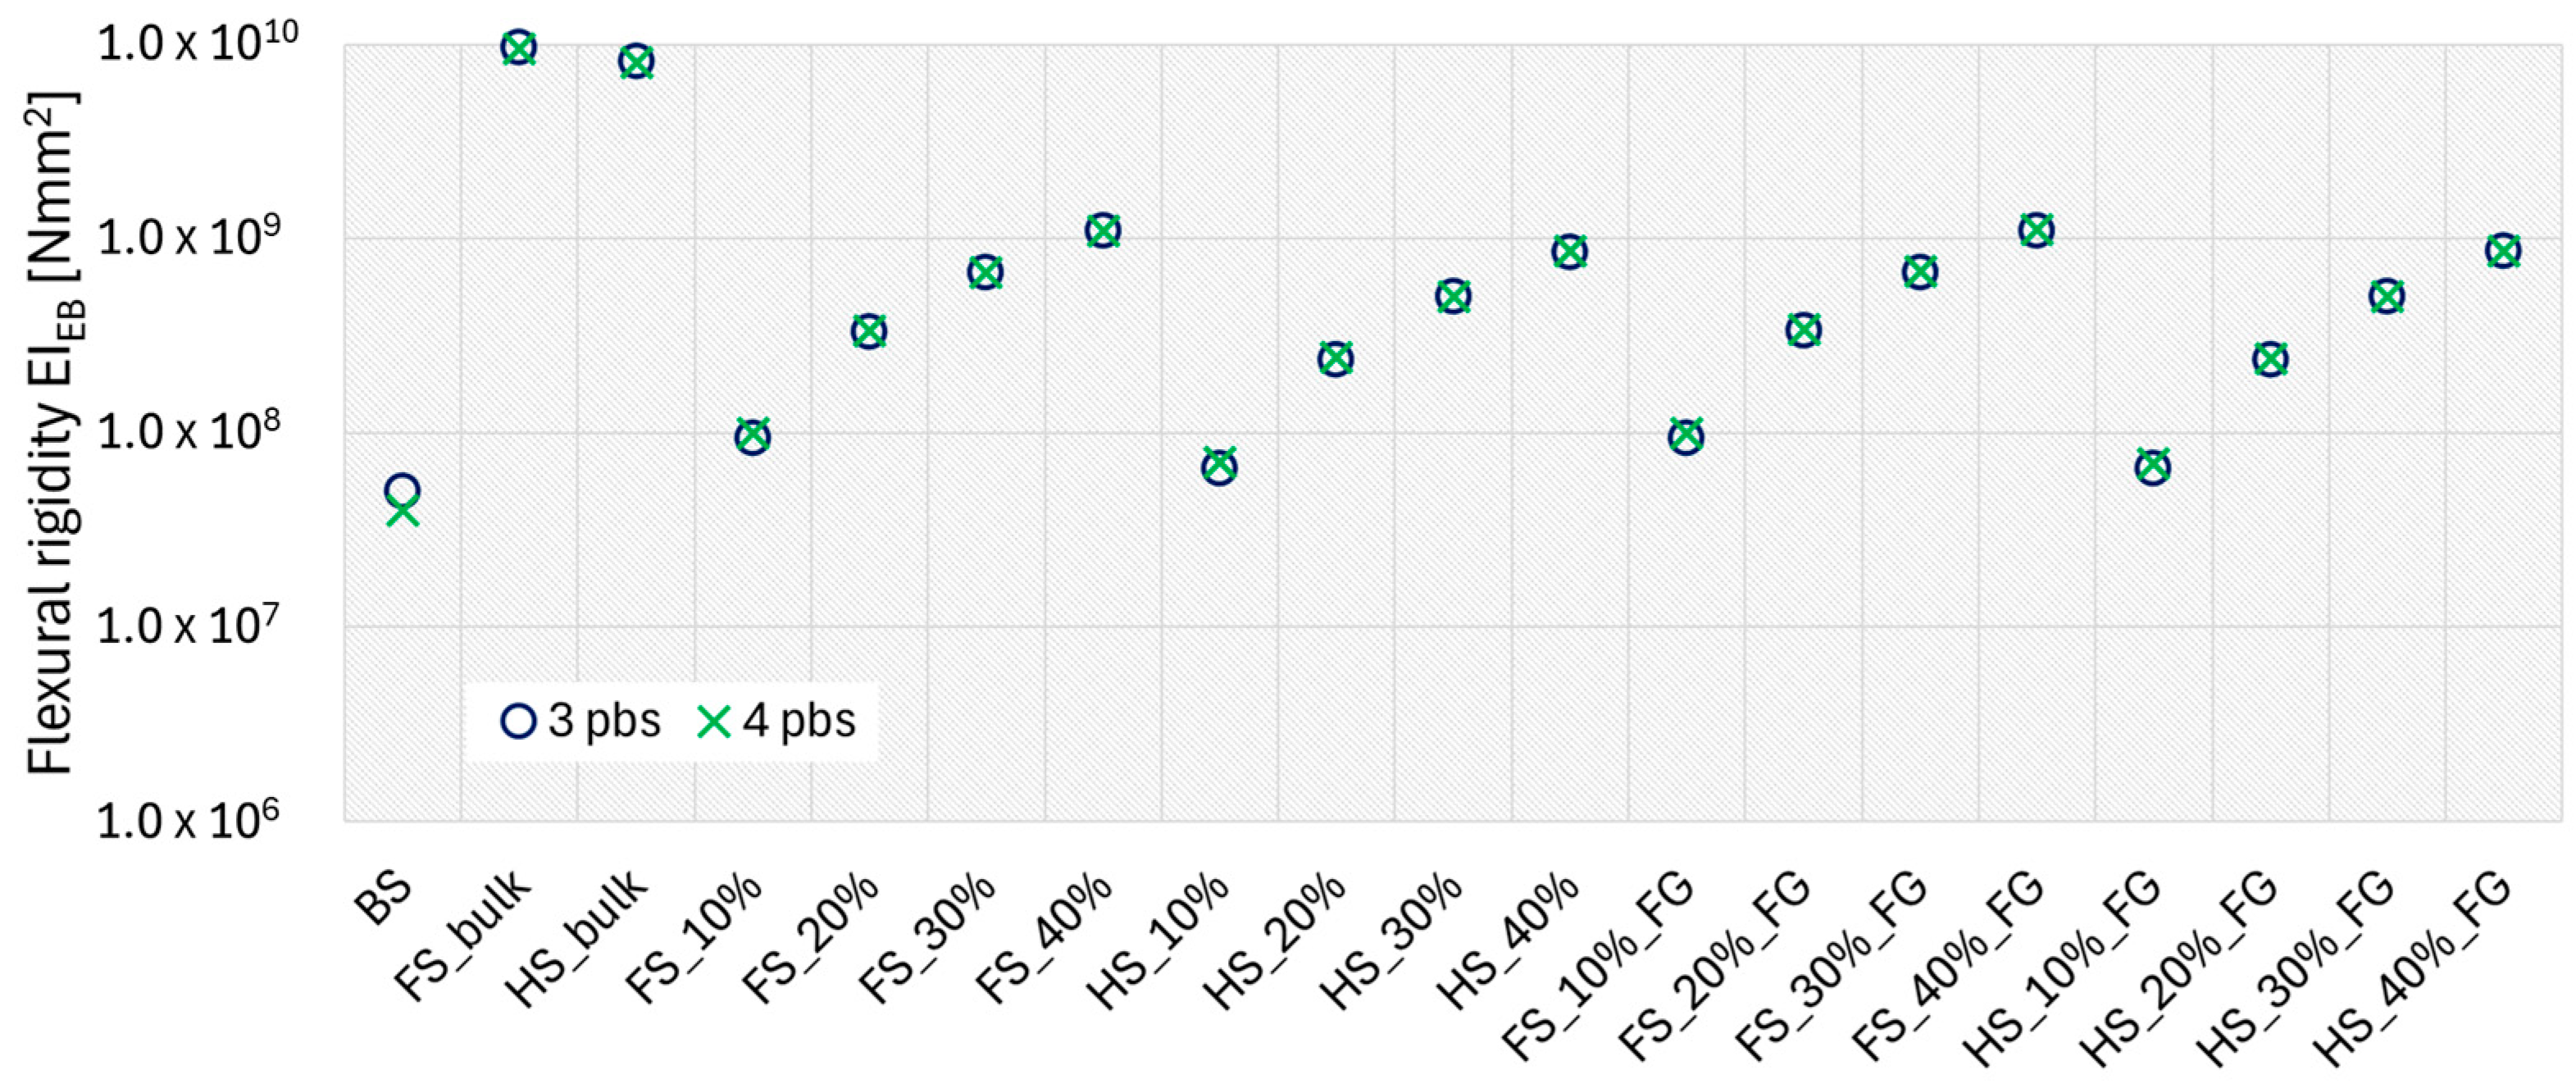
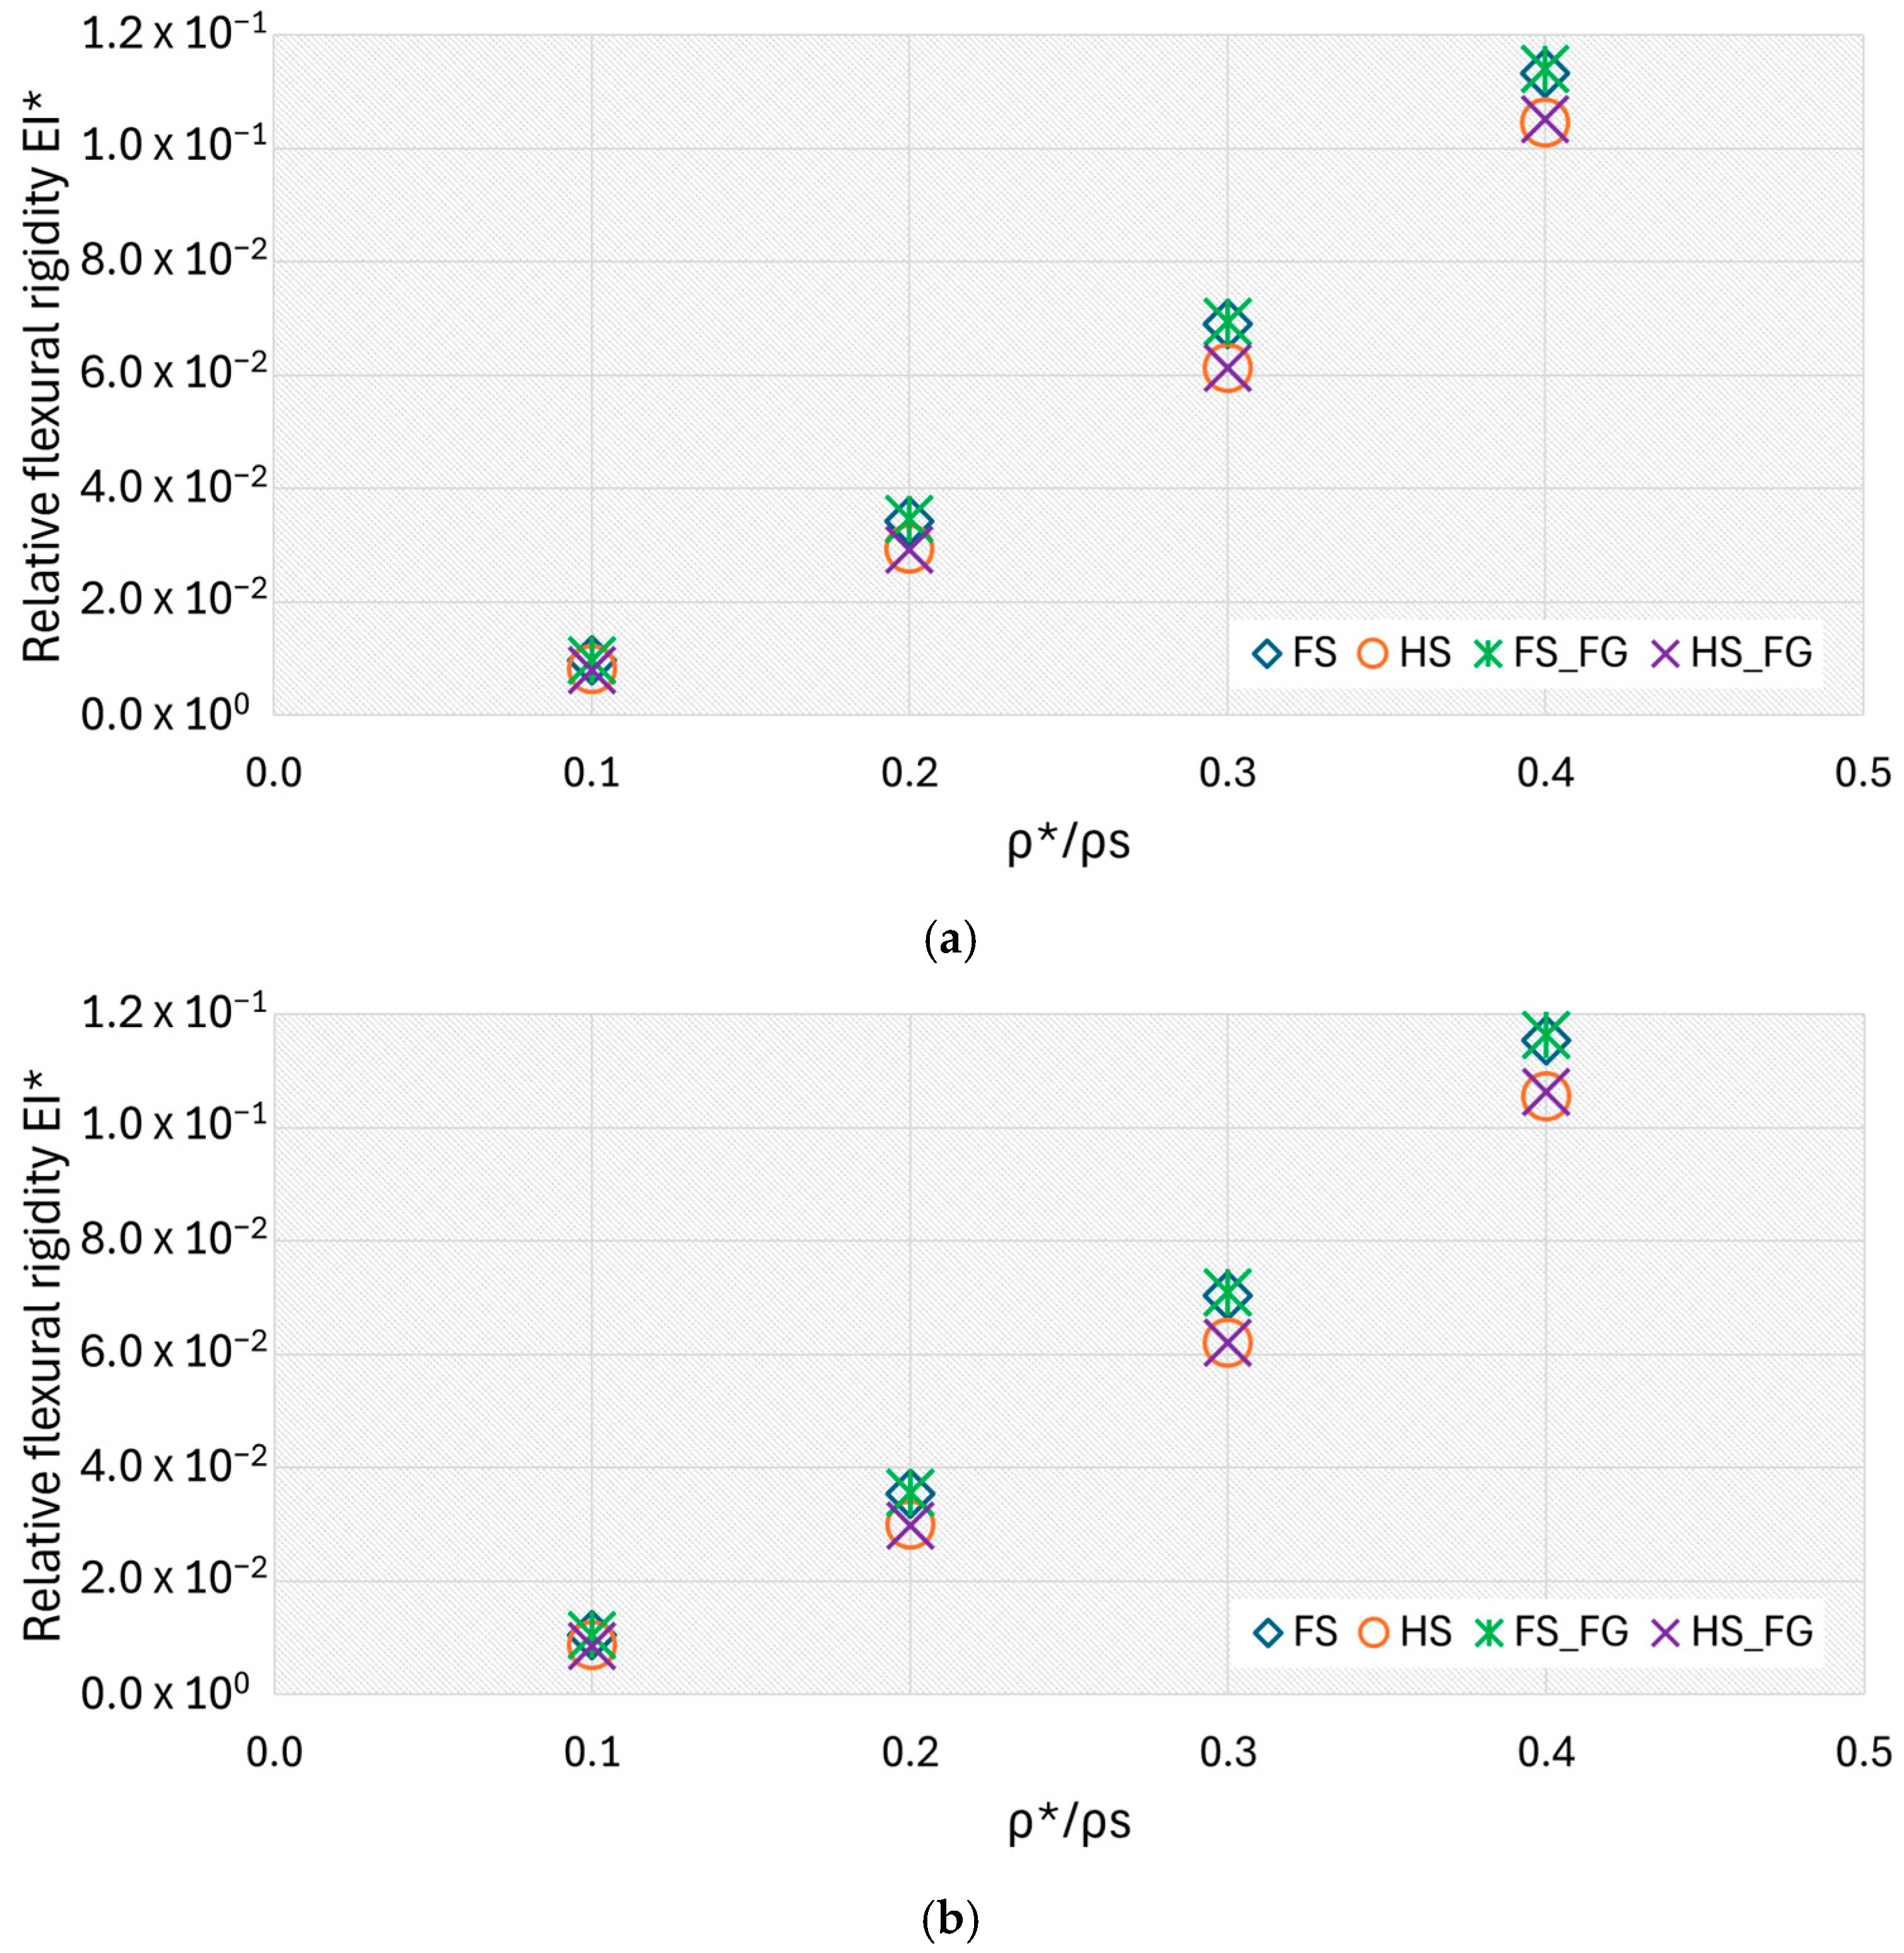
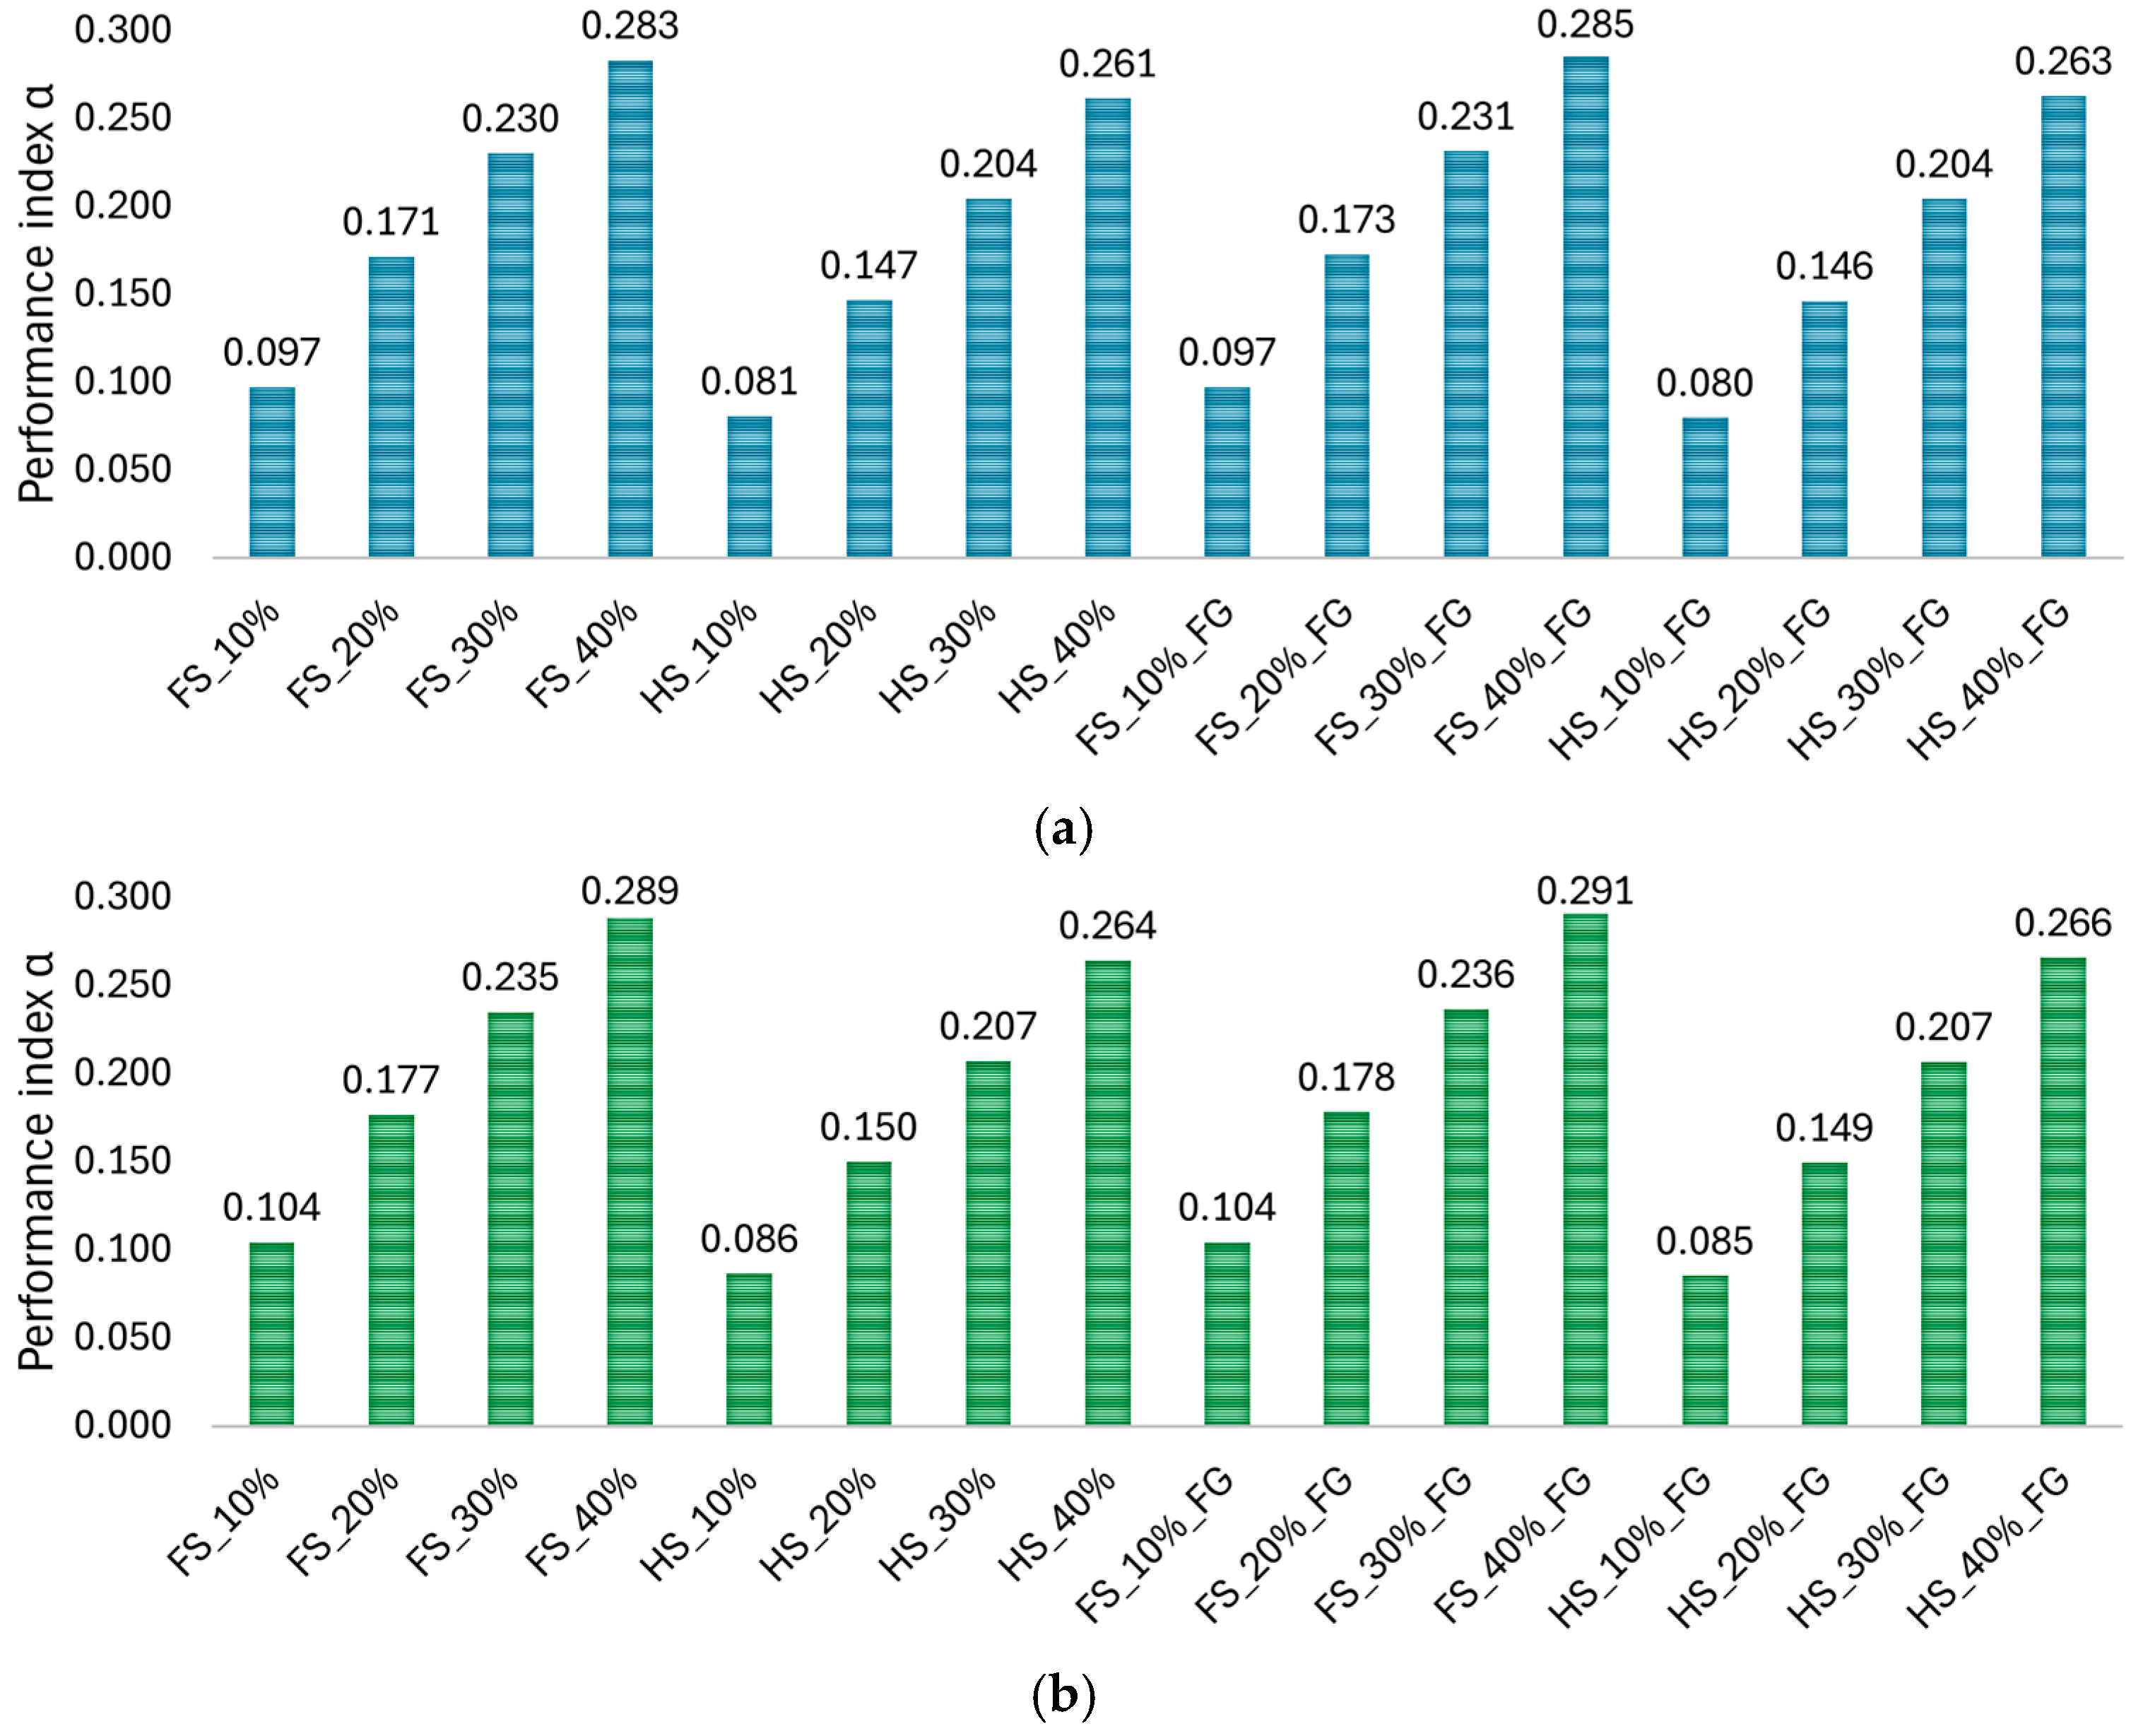
3. Results and Discussion
4. Conclusions
Author Contributions
Funding
Institutional Review Board Statement
Informed Consent Statement
Data Availability Statement
Conflicts of Interest
References
- Intravaia, J.T.; Graham, T.; Kim, H.S.; Nanda, H.S.; Kumbar, S.G.; Nukavarapu, S.P. Smart Orthopedic Biomaterials and Implants. Curr. Opin. Biomed. Eng. 2023, 25, 100439. [Google Scholar] [CrossRef] [PubMed]
- Abd-Elaziem, W.; Darwish, M.A.; Hamada, A.; Daoush, W.M. Titanium-Based Alloys and Composites for Orthopedic Implants Applications: A Comprehensive Review. Mater. Des. 2024, 241, 112850. [Google Scholar] [CrossRef]
- Oryan, A.; Alidadi, S.; Moshiri, A.; Maffulli, N. Bone Regenerative Medicine: Classic Options, Novel Strategies, and Future Directions. J. Orthop. Surg. Res. 2014, 9, 18. [Google Scholar] [CrossRef] [PubMed]
- Cheng, A.; Humayun, A.; Cohen, D.J.; Boyan, B.D.; Schwartz, Z. Additively Manufactured 3D Porous Ti-6Al-4V Constructs Mimic Trabecular Bone Structure and Regulate Osteoblast Proliferation, Differentiation and Local Factor Production in a Porosity and Surface Roughness Dependent Manner. Biofabrication 2014, 6, 045007. [Google Scholar] [CrossRef] [PubMed]
- Öhman-Mägi, C.; Holub, O.; Wu, D.; Hall, R.M.; Persson, C. Density and Mechanical Properties of Vertebral Trabecular Bone—A Review. JOR Spine 2021, 4, e1176. [Google Scholar] [CrossRef] [PubMed]
- Mahmoud, D.; Elbestawi, M.A. Lattice Structures and Functionally Graded Materials Applications in Additive Manufacturing of Orthopedic Implants: A Review. J. Manuf. Mater. Process. 2017, 1, 13. [Google Scholar] [CrossRef]
- Mirzaali, M.J.; Schwiedrzik, J.J.; Thaiwichai, S.; Best, J.P.; Michler, J.; Zysset, P.K.; Wolfram, U. Mechanical Properties of Cortical Bone and Their Relationships with Age, Gender, Composition and Microindentation Properties in the Elderly. Bone 2016, 93, 196–211. [Google Scholar] [CrossRef]
- Oftadeh, R.; Perez-Viloria, M.; Villa-Camacho, J.C.; Vaziri, A.; Nazarian, A. Biomechanics and Mechanobiology of Trabecular Bone: A Review. J. Biomech. Eng. 2015, 137, 010802. [Google Scholar] [CrossRef]
- Frost, H.M. A 2003 Update of Bone Physiology and Wolff’s Law for Clinicians. Angle Orthod. 2004, 74, 3–15. [Google Scholar]
- Bai, L.; Gong, C.; Chen, X.; Sun, Y.; Xin, L.; Pu, H.; Peng, Y.; Luo, J. Mechanical Properties and Energy Absorption Capabilities of Functionally Graded Lattice Structures: Experiments and Simulations. Int. J. Mech. Sci. 2020, 182, 105735. [Google Scholar] [CrossRef]
- Jain, T.; Sharma, G.K.; Ghosh, R. Design of Functionally Graded Porous Lattice Structure Tibial Implant for TAR. Int. J. Mech. Sci. 2024, 281, 109671. [Google Scholar] [CrossRef]
- Martin, D.E.; Severns, A.E.; Kabo, J.M. Determination of Mechanical Stiffness of Bone by PQCT Measurements: Correlation with Non-Destructive Mechanical Four-Point Bending Test Data. J. Biomech. 2004, 37, 1289–1293. [Google Scholar] [CrossRef]
- Collins, C.J.; Yang, B.; Crenshaw, T.D.; Ploeg, H.L. Evaluation of Experimental, Analytical, and Computational Methods to Determine Long-Bone Bending Stiffness. J. Mech. Behav. Biomed. Mater. 2021, 115, 104253. [Google Scholar] [CrossRef] [PubMed]
- Kharin, N.; Bolshakov, P.; Kuchumov, A.G. Numerical and Experimental Study of a Lattice Structure for Orthopedic Applications. Materials 2023, 16, 744. [Google Scholar] [CrossRef]
- Horn, T.J.; Harrysson, O.L.A.; Marcellin-Little, D.J.; West, H.A.; Lascelles, B.D.X.; Aman, R. Flexural Properties of Ti6Al4V Rhombic Dodecahedron Open Cellular Structures Fabricated with Electron Beam Melting. Addit. Manuf. 2014, 1, 2–11. [Google Scholar] [CrossRef]
- Collins, C.J.; Boyer, M.; Crenshaw, T.D.; Ploeg, H.L. Design of a Surrogate for Evaluation of Methods to Predict Bone Bending Stiffness. J. Mech. Behav. Biomed. Mater. 2018, 88, 346–351. [Google Scholar] [CrossRef] [PubMed]
- Aufa, A.N.; Hassan, M.Z.; Ismail, Z. Recent Advances in Ti-6Al-4V Additively Manufactured by Selective Laser Melting for Biomedical Implants: Prospect Development. J. Alloys Compd. 2022, 896, 163072. [Google Scholar] [CrossRef]
- Dhiman, S.; Sidhu, S.S.; Bains, P.S.; Bahraminasab, M. Mechanobiological Assessment of Ti-6Al-4V Fabricated via Selective Laser Melting Technique: A Review. Rapid Prototyp. J. 2019, 25, 1266–1284. [Google Scholar] [CrossRef]
- Aufa, A.N.; Hassan, M.Z.; Ismail, Z.; Ramlie, F.; Jamaludin, K.R.; Md Daud, M.Y.; Ren, J. Current Trends in Additive Manufacturing of Selective Laser Melting for Biomedical Implant Applications. J. Mater. Res. Technol. 2024, 31, 213–243. [Google Scholar] [CrossRef]
- Chang, B.; Song, W.; Han, T.; Yan, J.; Li, F.; Zhao, L.; Kou, H.; Zhang, Y. Influence of Pore Size of Porous Titanium Fabricated by Vacuum Diffusion Bonding of Titanium Meshes on Cell Penetration and Bone Ingrowth. Acta Biomater. 2016, 33, 311–321. [Google Scholar] [CrossRef]
- He, S.; Zhu, J.; Jing, Y.; Long, S.; Tang, L.; Cheng, L.; Shi, Z. Effect of 3D-Printed Porous Titanium Alloy Pore Structure on Bone Regeneration: A Review. Coatings 2024, 14, 253. [Google Scholar] [CrossRef]
- Distefano, F.; Pasta, S.; Epasto, G. Titanium Lattice Structures Produced via Additive Manufacturing for a Bone Scaffold: A Review. J. Funct. Biomater. 2023, 14, 125. [Google Scholar] [CrossRef] [PubMed]
- Distefano, F.; Mineo, R.; Epasto, G. Mechanical Behaviour of a Novel Biomimetic Lattice Structure for Bone Scaffold. J. Mech. Behav. Biomed. Mater. 2023, 138, 105656. [Google Scholar] [CrossRef] [PubMed]
- Distefano, F.; Epasto, G. Effect of Density Grading on the Mechanical Behaviour of Advanced Functionally Graded Lattice Structures. J. Mech. Behav. Biomed. Mater. 2024, 153, 106477. [Google Scholar] [CrossRef] [PubMed]
- Zojaji, M. Quantifying the Accuracy of Euler-Bernoulli and Timoshenko Beam Theories for Long Bones in Three- and Four-Point Bend Tests with Finite Element Analysis. Master’s Thesis, Queen’s University, Kingston, ON, Canada, 2021. [Google Scholar]
- D790-17; ASTM Standard D790-17, Standard Test Methods for Flexural 400 Properties of Unreinforced and Reinforced Plastics and Electrical Insulating Materials. ASTM International: West Conshohocken, PA, USA, 2017. [CrossRef]
- Young, W.C.; Budynas, R.G.; Sadegh, A.M. Roark’s Formulas for Stress and Strain; McGraw-Hill: New York, NY, USA, 2002; ISBN 007072542X. [Google Scholar]
- Della Ripa, M.; Paolino, D.S.; Amorese, A.; Tridello, A. Numerical Modelling of the Mechanical Response of Lattice Structures Produced through AM. Procedia Struct. Integr. 2021, 33, 714–723. [Google Scholar] [CrossRef]
- Straffelini, G.; Molinari, A. Dry Sliding Wear of Ti-6Al-4V Alloy as Influenced by the Counterface and Sliding Conditions. Wear 1999, 236, 328–338. [Google Scholar] [CrossRef]
- Chen, L.Y.; Huang, J.C.; Lin, C.H.; Pan, C.T.; Chen, S.Y.; Yang, T.L.; Lin, D.Y.; Lin, H.K.; Jang, J.S.C. Anisotropic Response of Ti-6Al-4V Alloy Fabricated by 3D Printing Selective Laser Melting. Mater. Sci. Eng. A 2017, 682, 389–395. [Google Scholar] [CrossRef]
- Shi, Y.; Han, Z. Effect of Weld Thermal Cycle on Microstructure and Fracture Toughness of Simulated Heat-Affected Zone for a 800 MPa Grade High Strength Low Alloy Steel. J. Mater. Process. Technol. 2008, 207, 30–39. [Google Scholar] [CrossRef]
- Yan, X.; Li, Q.; Yin, S.; Chen, Z.; Jenkins, R.; Chen, C.; Wang, J.; Ma, W.; Bolot, R.; Lupoi, R.; et al. Mechanical and in Vitro Study of an Isotropic Ti6Al4V Lattice Structure Fabricated Using Selective Laser Melting. J. Alloys Compd. 2019, 782, 209–223. [Google Scholar] [CrossRef]
- Cansizoglu, O.; Harrysson, O.; Cormier, D.; West, H.; Mahale, T. Properties of Ti-6Al-4V Non-Stochastic Lattice Structures Fabricated via Electron Beam Melting. Mater. Sci. Eng. A 2008, 492, 468–474. [Google Scholar] [CrossRef]
- Timoshenko, S. Strength of Materials, Part 1—Elementary Theory and Problems; D Van Nostrand Company Inc.: New York, NY, USA, 1940. [Google Scholar]
- Li, B.; Shen, C. Solid Stress-Distribution-Oriented Design and Topology Optimization of 3D-Printed Heterogeneous Lattice Structures with Light Weight and High Specific Rigidity. Polymers 2022, 14, 2807. [Google Scholar] [CrossRef] [PubMed]
- Bozkurt, Y.; Karayel, E. 3D Printing Technology; Methods, Biomedical Applications, Future Opportunities and Trends. J. Mater. Res. Technol. 2021, 14, 1430–1450. [Google Scholar] [CrossRef]
- Joshua, R.J.N.; Raj, S.A.; Hameed Sultan, M.T.; Łukaszewicz, A.; Józwik, J.; Oksiuta, Z.; Dziedzic, K.; Tofil, A.; Shahar, F.S. Powder Bed Fusion 3D Printing in Precision Manufacturing for Biomedical Applications: A Comprehensive Review. Materials 2024, 17, 769. [Google Scholar] [CrossRef] [PubMed]
- Huang, S.; Sing, S.L.; de Looze, G.; Wilson, R.; Yeong, W.Y. Laser Powder Bed Fusion of Titanium-Tantalum Alloys: Compositions and Designs for Biomedical Applications. J. Mech. Behav. Biomed. Mater. 2020, 108, 103775. [Google Scholar] [CrossRef]


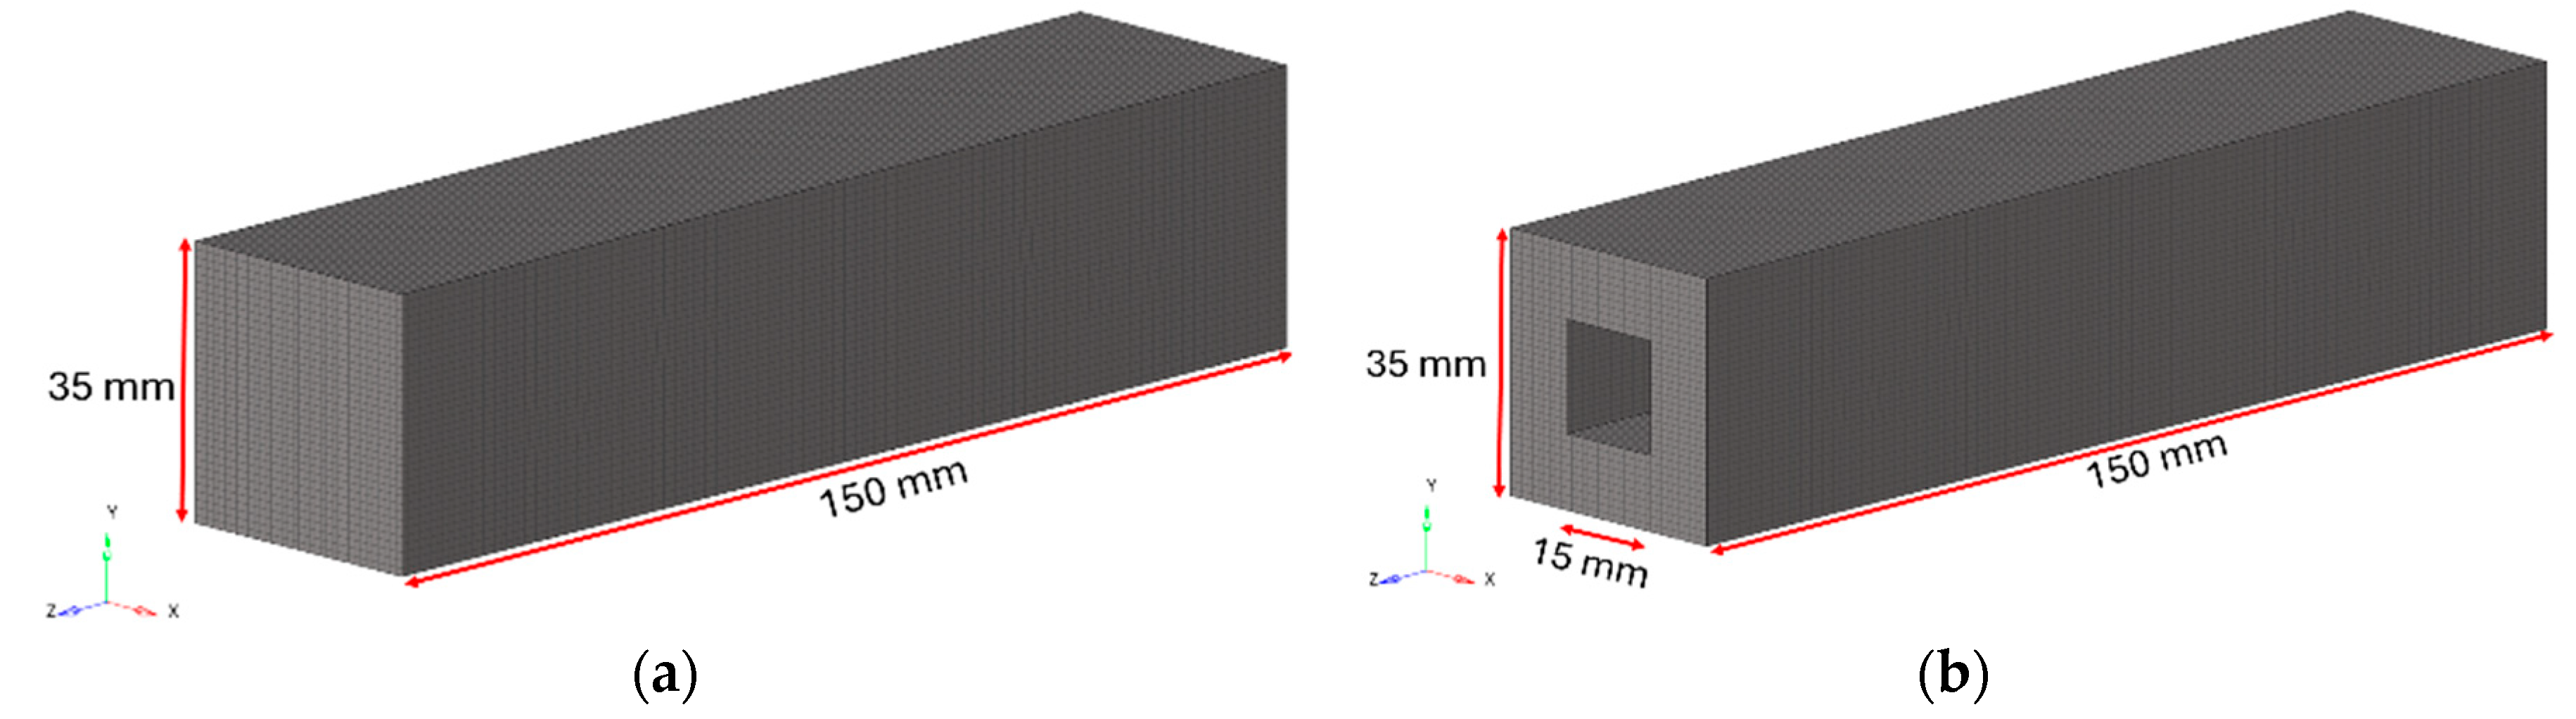
| D [mm] | L [mm] | l [mm] | W [mm] | |
|---|---|---|---|---|
| TAOR specimen | 5 | 35 | 15 | 150 |
| ρ*/ρs [%] | D [mm] | d [mm] | a [mm] | |
|---|---|---|---|---|
| FS_10% * | 10 | 5 | 0.430 | 1.463 |
| FS_20% | 20 | 5 | 0.646 | 1.157 |
| FS_30% | 30 | 5 | 0.846 | 0.875 |
| FS_40% | 40 | 5 | 1.063 | 0.568 |
| HS_10% ** | 10 | 5 | 0.430 | 1.463 |
| HS_20% | 20 | 5 | 0.646 | 1.157 |
| HS_30% | 30 | 5 | 0.846 | 0.875 |
| HS_40% | 40 | 5 | 1.063 | 0.568 |
| ρ*/ρs Mean [%] | Density Gradient [%] | ρ*/ρs Inner Ring [%] | ρ*/ρs Outer Ring [%] | |
|---|---|---|---|---|
| FS_10%_FG | 10 | 5 | 11 | 6 |
| FS_20%_FG | 20 | 5 | 21 | 16 |
| FS_30%_FG | 30 | 5 | 31 | 26 |
| FS_40%_FG | 40 | 5 | 41 | 36 |
| HS_10%_FG | 10 | 5 | 12 | 7 |
| HS_20%_FG | 20 | 5 | 22 | 17 |
| HS_30%_FG | 30 | 5 | 32 | 27 |
| HS_40%_FG | 40 | 5 | 42 | 37 |
| Ring | D [mm] | d [mm] | a [mm] | |
|---|---|---|---|---|
| FS_10%_FG | 1 | 5 | 0.454 | 1.429 |
| 2 | 5 | 0.424 | 1.471 | |
| 3 | 5 | 0.380 | 1.534 | |
| 4 | 5 | 0.325 | 1.611 | |
| FS_20%_FG | 1 | 5 | 0.667 | 1.128 |
| 2 | 5 | 0.641 | 1.165 | |
| 3 | 5 | 0.606 | 1.214 | |
| 4 | 5 | 0.564 | 1.273 | |
| FS_30%_FG | 1 | 5 | 0.866 | 0.846 |
| 2 | 5 | 0.841 | 0.882 | |
| 3 | 5 | 0.806 | 0.931 | |
| 4 | 5 | 0.766 | 0.988 | |
| FS_40%_FG | 1 | 5 | 1.088 | 0.532 |
| 2 | 5 | 1.057 | 0.576 | |
| 3 | 5 | 1.016 | 0.634 | |
| 4 | 5 | 0.971 | 0.698 | |
| HS_10%_FG | 1 | 5 | 0.477 | 1.396 |
| 2 | 5 | 0.353 | 1.572 | |
| HS_20%_FG | 1 | 5 | 0.686 | 1.101 |
| 2 | 5 | 0.585 | 1.244 | |
| HS_30%_FG | 1 | 5 | 0.887 | 0.817 |
| 2 | 5 | 0.786 | 0.959 | |
| HS_40%_FG | 1 | 5 | 1.114 | 0.496 |
| 2 | 5 | 0.994 | 0.665 |
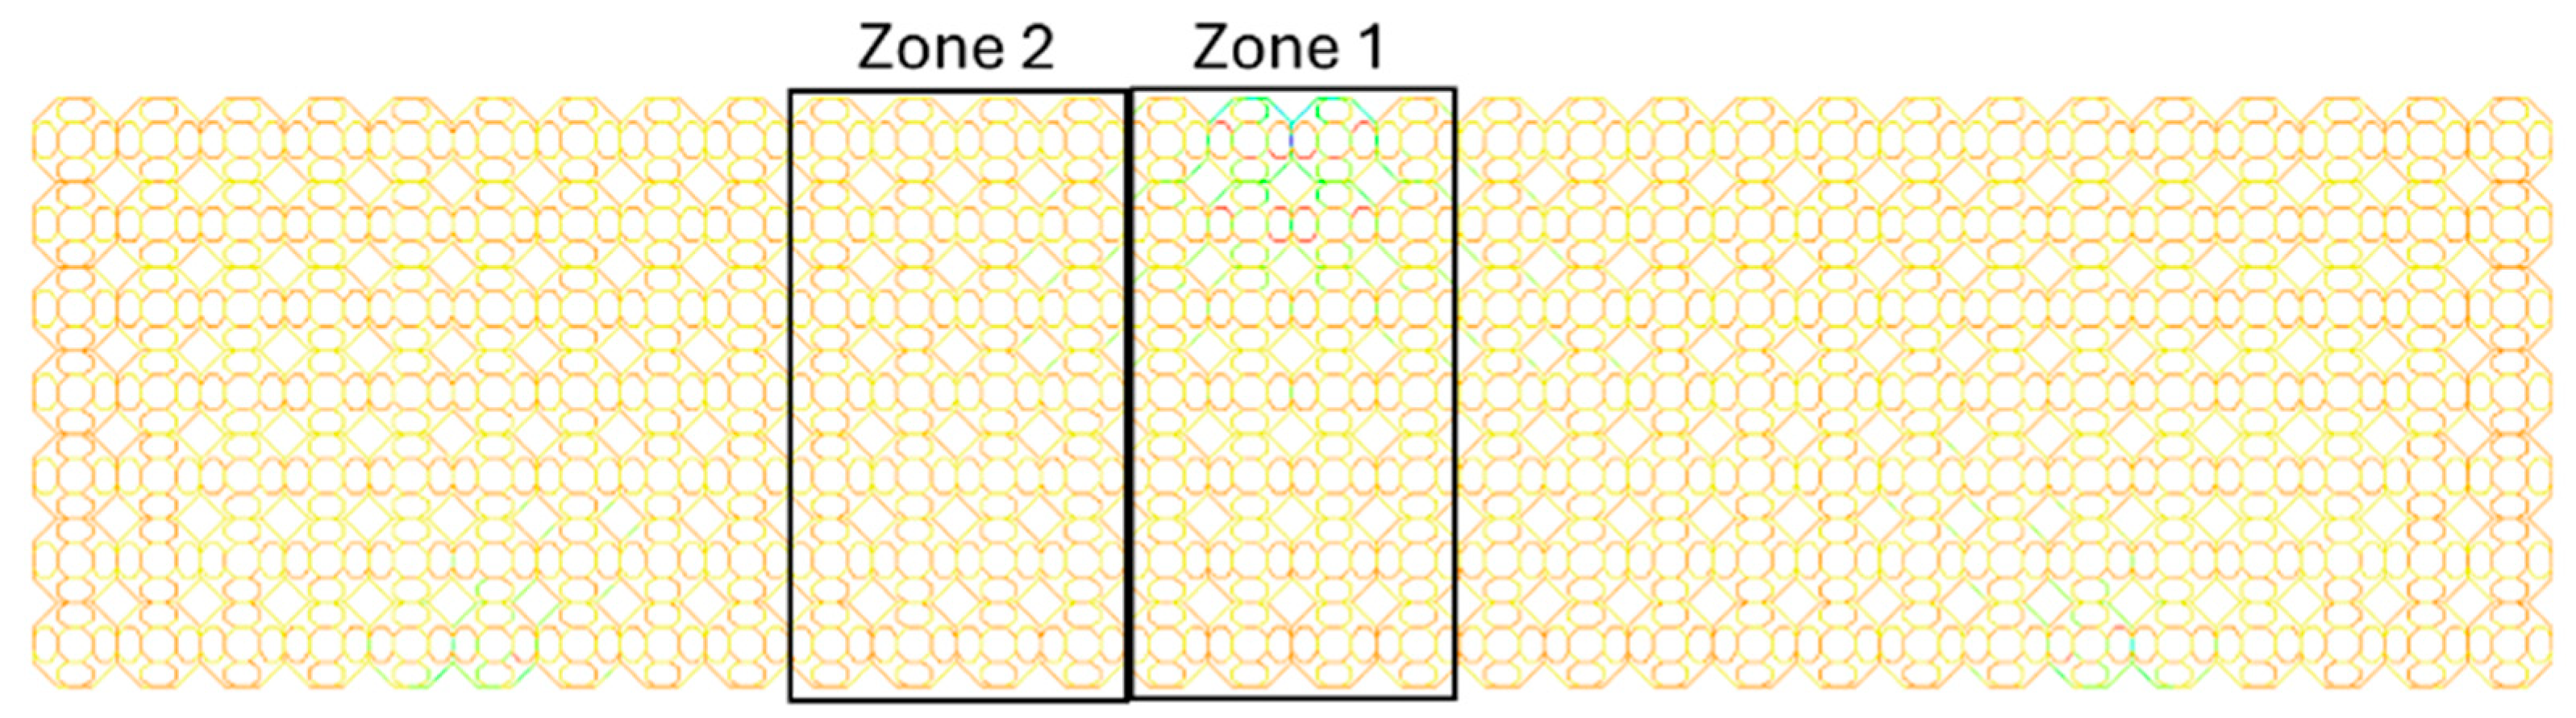
| Zone | Maximum Tensile Stress [MPa] | Maximum Compression Stress [MPa] | Deflection [mm] | |
|---|---|---|---|---|
| 2 elements | 1 | 22.3 | 62.2 | 0.06334 |
| 2 | 9.754 | 18.173 | ||
| 4 elements | 1 | 22.4 | 62.5 | 0.06336 |
| 2 | 9.770 | 18.214 | ||
| 6 elements | 1 | 22.5 | 62.8 | 0.06347 |
| 2 | 9.773 | 18.227 | ||
| 8 elements | 1 | 22.6 | 63.0 | 0.06352 |
| 2 | 9.776 | 18.236 |
| Elastic Modulus E [GPa] | Poisson’s Ratio ν | Density ρ [kg/m3] | |
|---|---|---|---|
| Ti6Al4V | 110 | 0.34 | 4430 |
| Steel | 210 | 0.3 | 7850 |
| Elastic Modulus E [GPa] | Poisson’s Ratio ν | |
|---|---|---|
| Shell | 2.85 | 0.363 |
| Core | 0.596 | 0.3 |
| δ 3 pbs [mm] | δ 4 pbs [mm] | |
|---|---|---|
| BS | 0.05492 | 0.04715 |
| FS_bulk | 0.00216 | 0.00150 |
| HS_bulk | 0.00256 | 0.00177 |
| FS_10% | 0.22390 | 0.15180 |
| FS_20% | 0.06347 | 0.04410 |
| FS_30% | 0.03152 | 0.02202 |
| FS_40% | 0.01921 | 0.01341 |
| HS_10% | 0.31870 | 0.21820 |
| HS_20% | 0.08772 | 0.06133 |
| HS_30% | 0.04195 | 0.02945 |
| HS_40% | 0.02460 | 0.01726 |
| FS_10%_FG | 0.22380 | 0.15190 |
| FS_20%_FG | 0.06301 | 0.04375 |
| FS_30%_FG | 0.03135 | 0.02188 |
| FS_40%_FG | 0.01908 | 0.01330 |
| HS_10%_FG | 0.32260 | 0.22160 |
| HS_20%_FG | 0.08795 | 0.06157 |
| HS_30%_FG | 0.04198 | 0.02951 |
| HS_40%_FG | 0.02446 | 0.01715 |
| δ 3 pbs TI [mm] | δ 3 pbs EB [mm] | δ 3 pbs FEM [mm] | δ 4 pbs TI [mm] | δ 4 pbs EB [mm] | δ 4 pbs FEM [mm] | |
|---|---|---|---|---|---|---|
| FS_bulk | 0.00207 | 0.00151 | 0.00216 | 0.00132 | 0.00104 | 0.00150 |
| HS_bulk | 0.00232 | 0.00157 | 0.00256 | 0.00146 | 0.00108 | 0.00177 |
| C 3pbt | n 3pbt | R2 3pbt | C 4pbt | n 4pbt | R2 4pbt | |
|---|---|---|---|---|---|---|
| FS | 0.58 | 1.77 | 0.999 | 0.57 | 1.73 | 1.00 |
| HS | 0.57 | 1.85 | 1.00 | 0.55 | 1.80 | 0.999 |
| FS_FG | 0.59 | 1.78 | 0.999 | 0.58 | 1.74 | 0.999 |
| HS_FG | 0.58 | 1.86 | 1.00 | 0.56 | 1.82 | 0.999 |
| 10% | 20% | 30% | 40% | 10%_FG | 20%_FG | 30%_FG | 40%_FG | |
|---|---|---|---|---|---|---|---|---|
| EIEB FS/EIEB HS 3 pbt | 1.42 | 1.38 | 1.33 | 1.28 | 1.44 | 1.40 | 1.34 | 1.28 |
| EIEB FS/EIEB HS 4 pbt | 1.42 | 1.39 | 1.34 | 1.29 | 1.44 | 1.40 | 1.35 | 1.29 |
Disclaimer/Publisher’s Note: The statements, opinions and data contained in all publications are solely those of the individual author(s) and contributor(s) and not of MDPI and/or the editor(s). MDPI and/or the editor(s) disclaim responsibility for any injury to people or property resulting from any ideas, methods, instructions or products referred to in the content. |
© 2025 by the authors. Licensee MDPI, Basel, Switzerland. This article is an open access article distributed under the terms and conditions of the Creative Commons Attribution (CC BY) license (https://creativecommons.org/licenses/by/4.0/).
Share and Cite
Distefano, F.; Epasto, G.; Zojaji, M.; Ploeg, H.-L. Mechanical Design of a Novel Functionally Graded Lattice Structure for Long Bone Scaffolds. Designs 2025, 9, 62. https://doi.org/10.3390/designs9030062
Distefano F, Epasto G, Zojaji M, Ploeg H-L. Mechanical Design of a Novel Functionally Graded Lattice Structure for Long Bone Scaffolds. Designs. 2025; 9(3):62. https://doi.org/10.3390/designs9030062
Chicago/Turabian StyleDistefano, Fabio, Gabriella Epasto, Mahsa Zojaji, and Heidi-Lynn Ploeg. 2025. "Mechanical Design of a Novel Functionally Graded Lattice Structure for Long Bone Scaffolds" Designs 9, no. 3: 62. https://doi.org/10.3390/designs9030062
APA StyleDistefano, F., Epasto, G., Zojaji, M., & Ploeg, H.-L. (2025). Mechanical Design of a Novel Functionally Graded Lattice Structure for Long Bone Scaffolds. Designs, 9(3), 62. https://doi.org/10.3390/designs9030062