Enhanced, Seamless Ultrasound Introduction Unit for Thermoplastic Melt Treatment


Abstract

1. Introduction
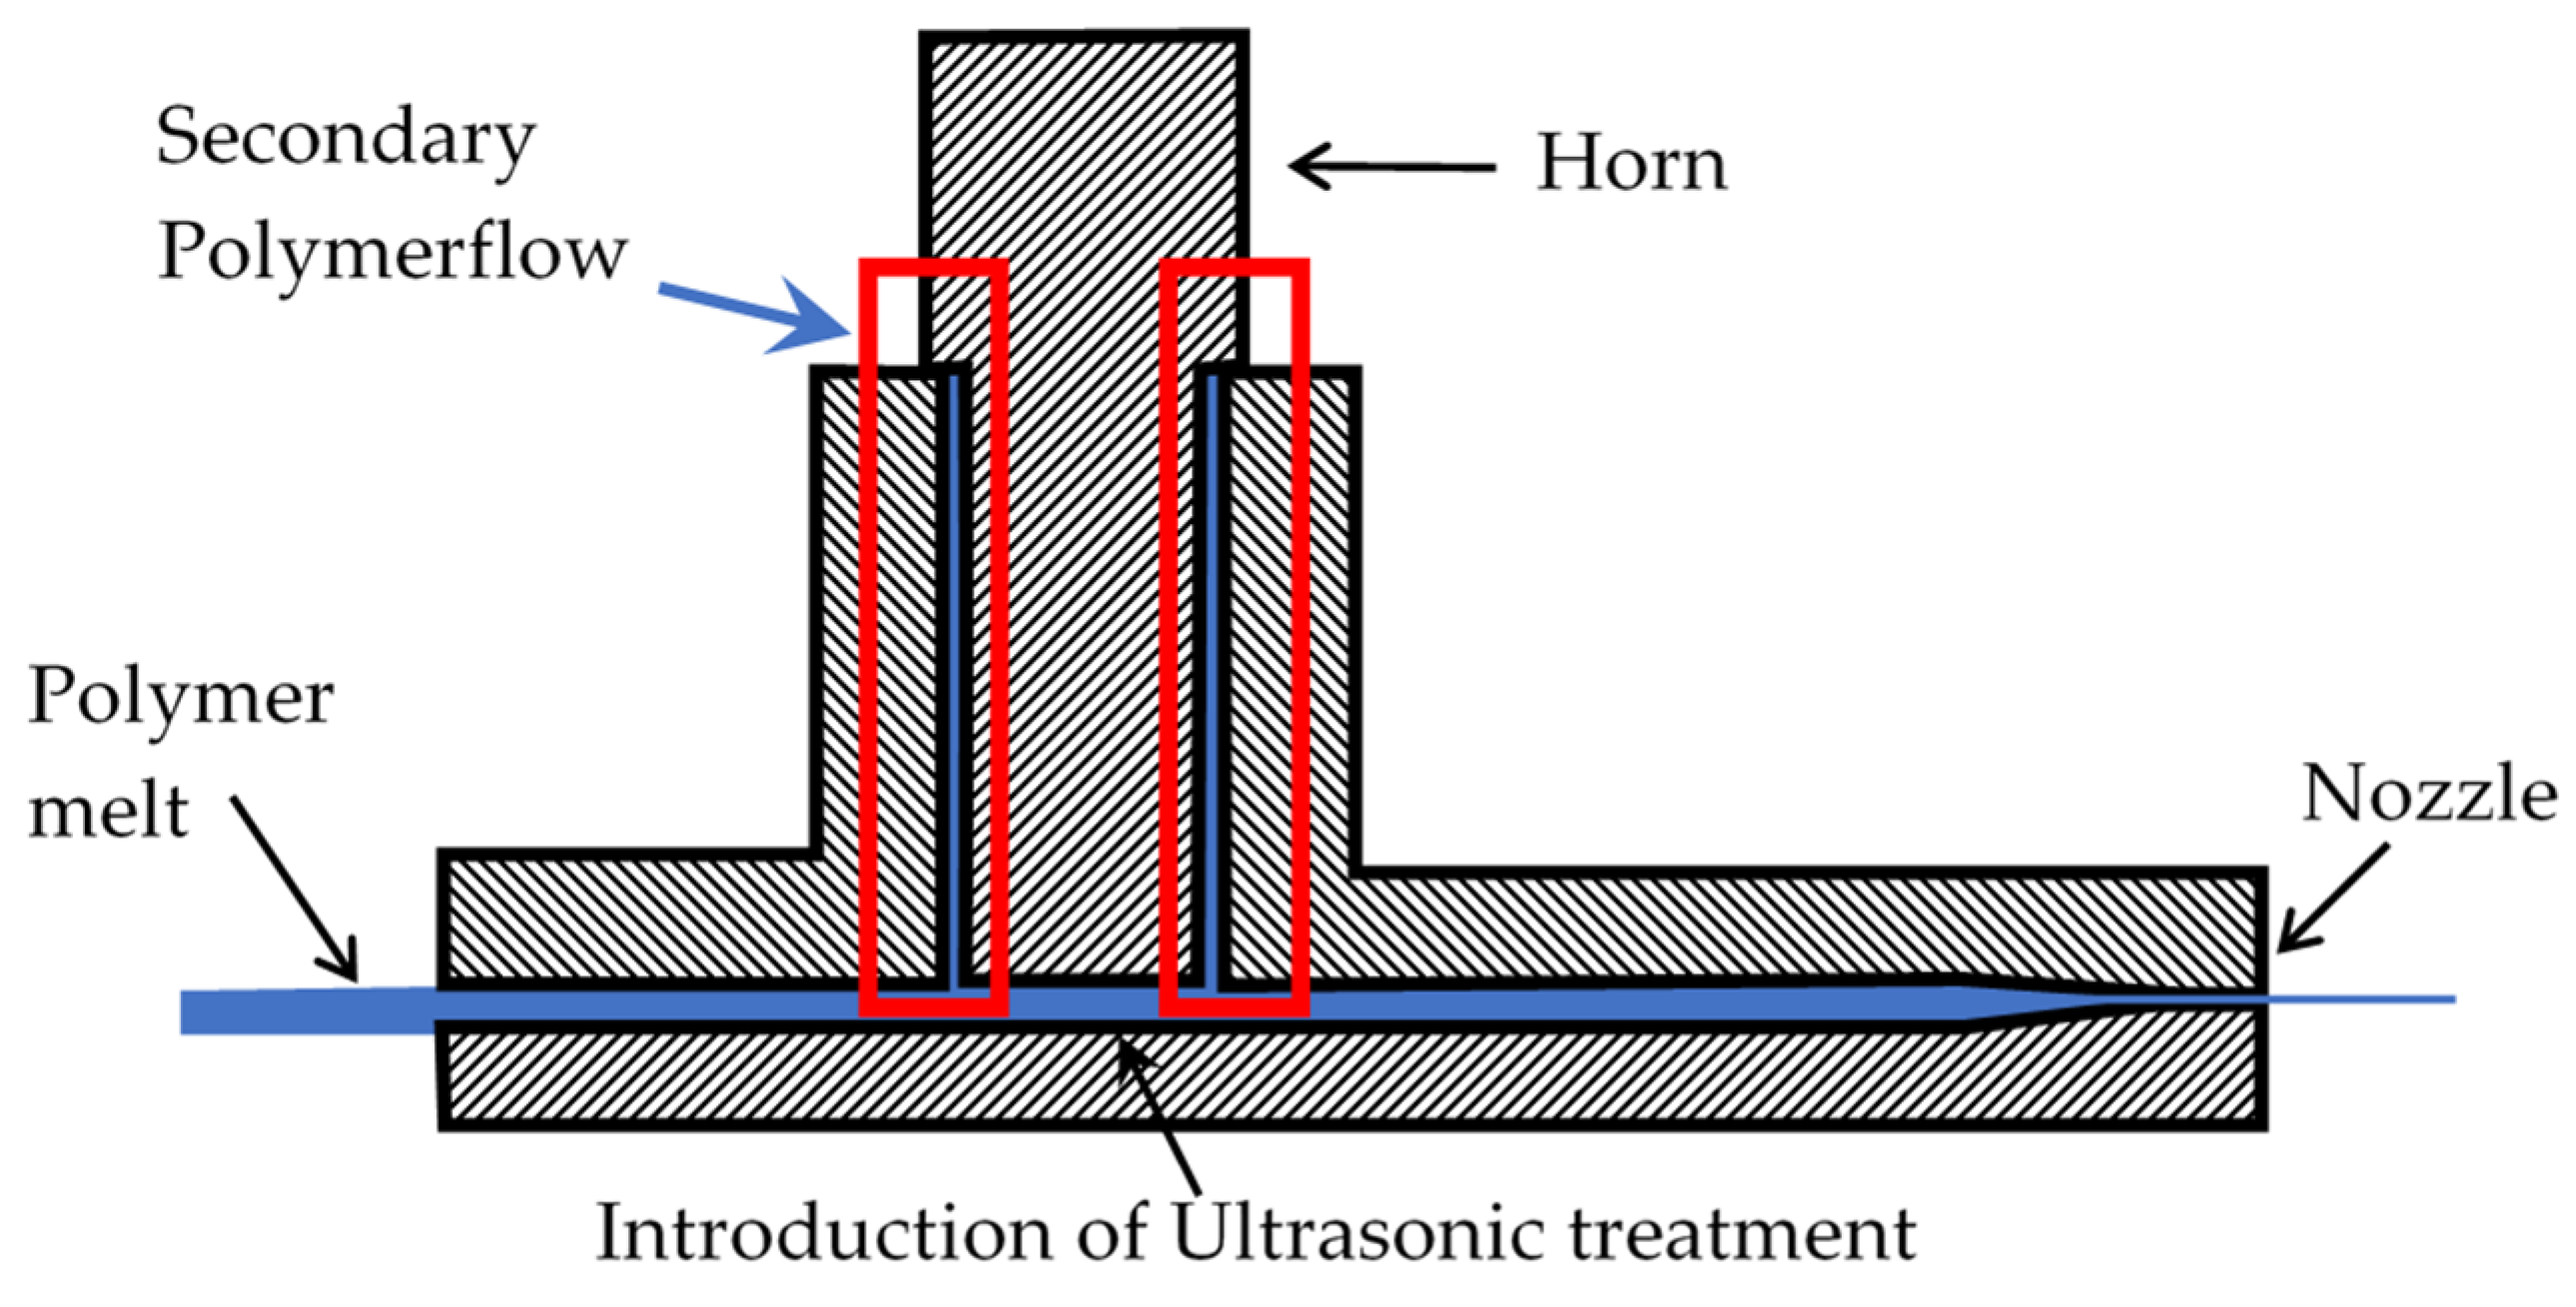
- Attempting to achieve tight seals, resulting in relatively low-amplitude movements [15].
- Creating a cavity in part of the horn and clamping it in its first wave node, resulting in the necessity of a dead space filled with the polymer. However, without the implementation of a venting system, the derogated polymer flows back into the primary melt stream [16].
2. Materials and Methods
2.1. Material
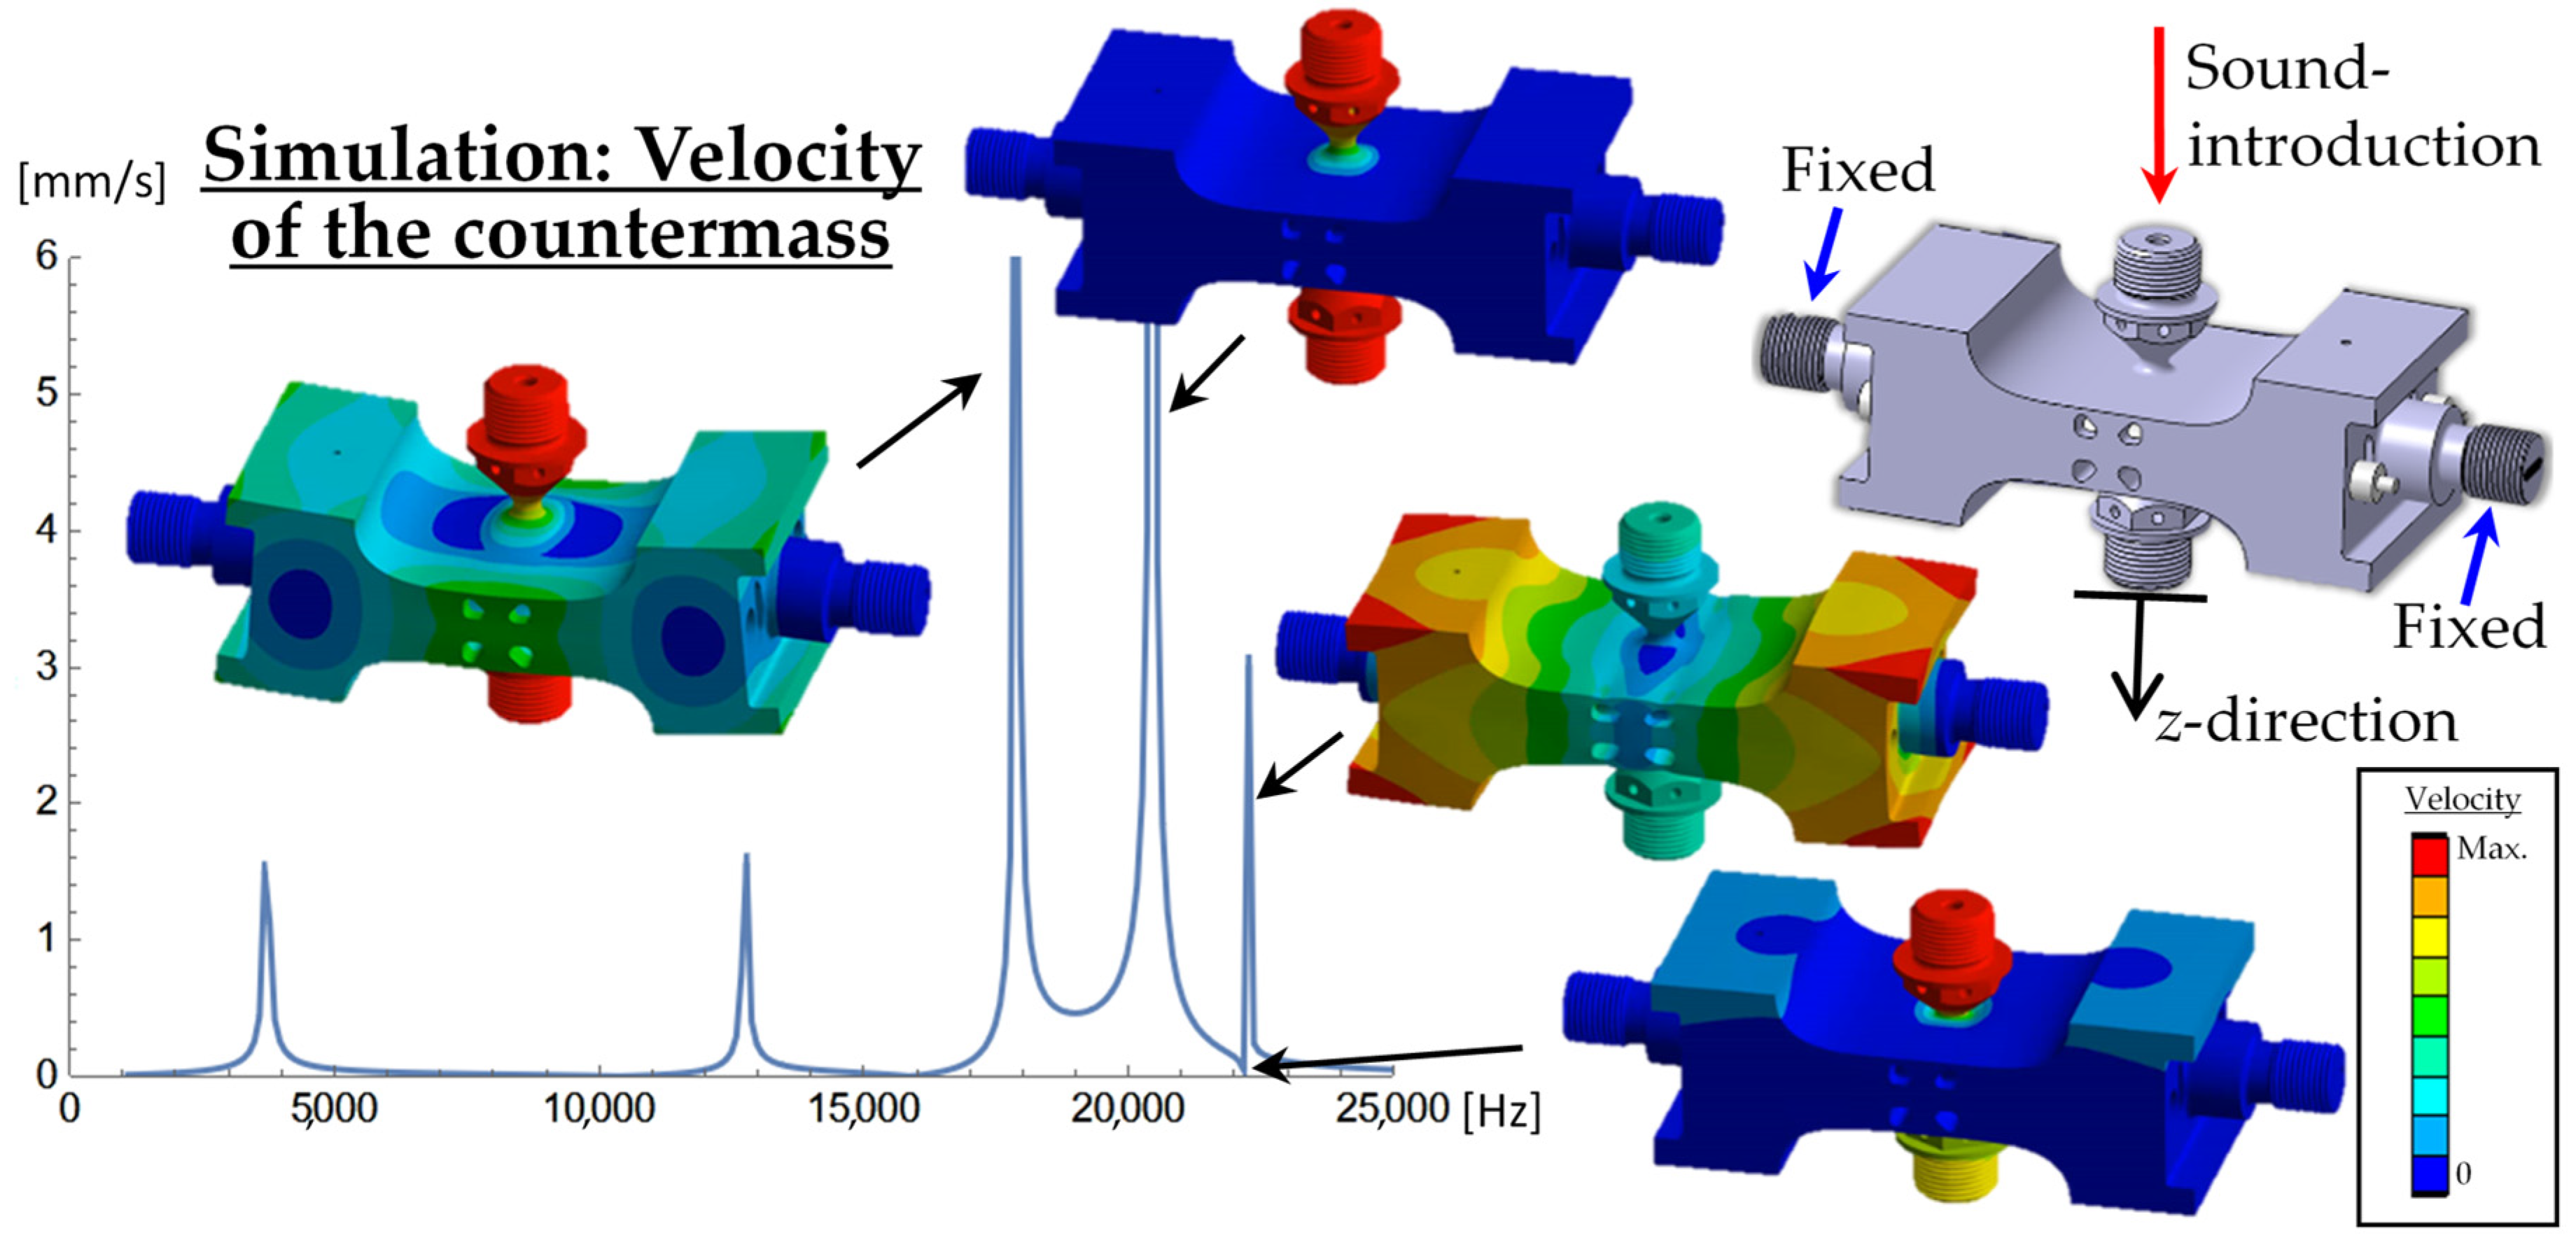
2.2. Modeling
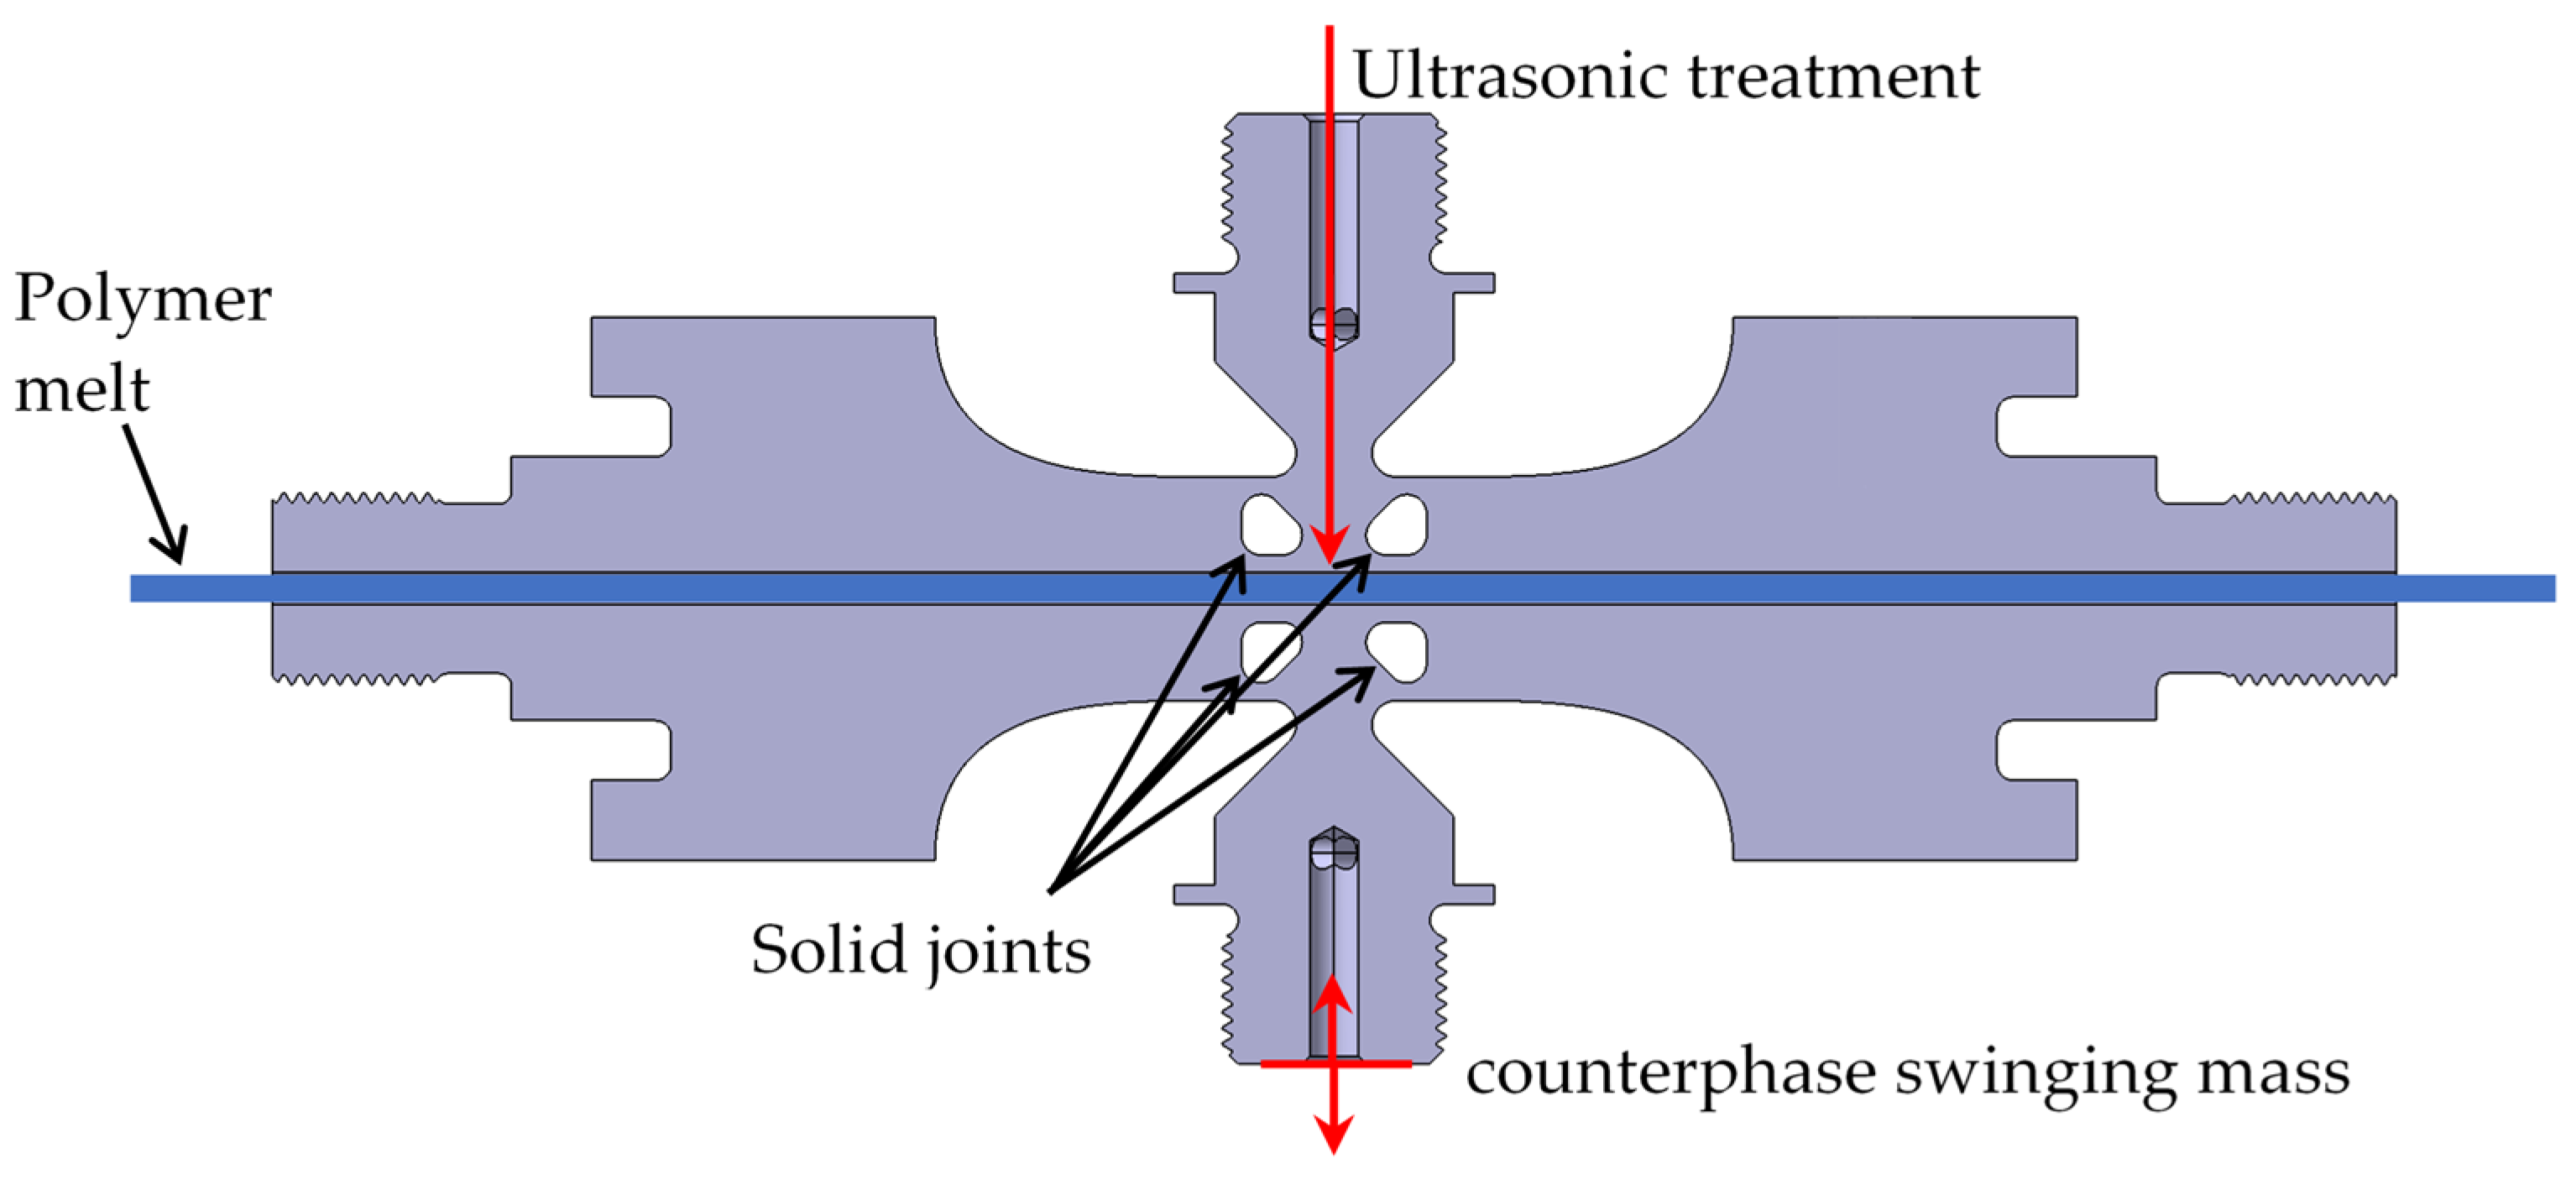
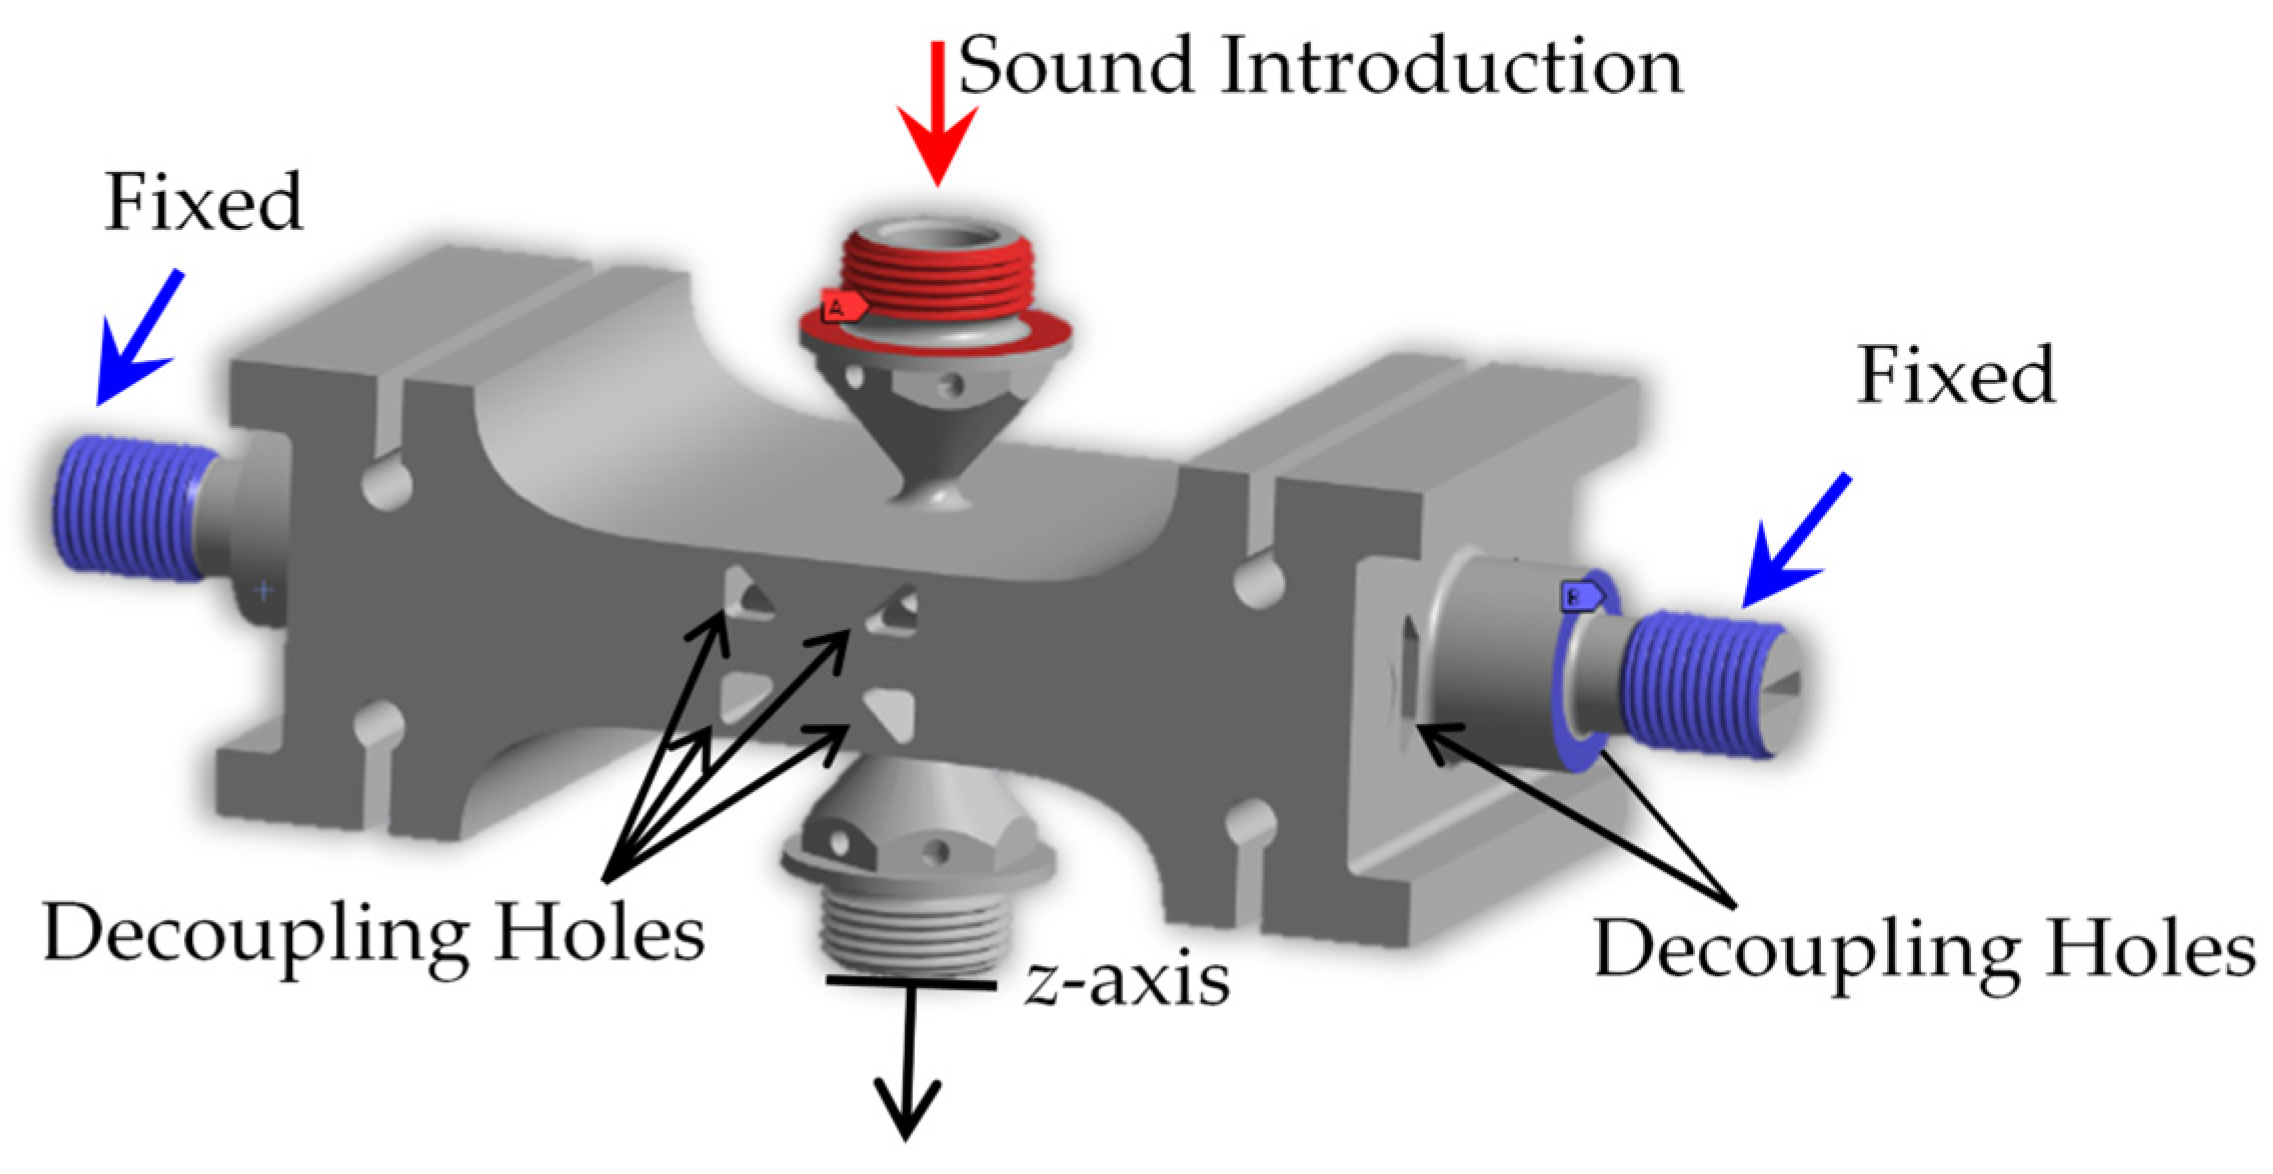
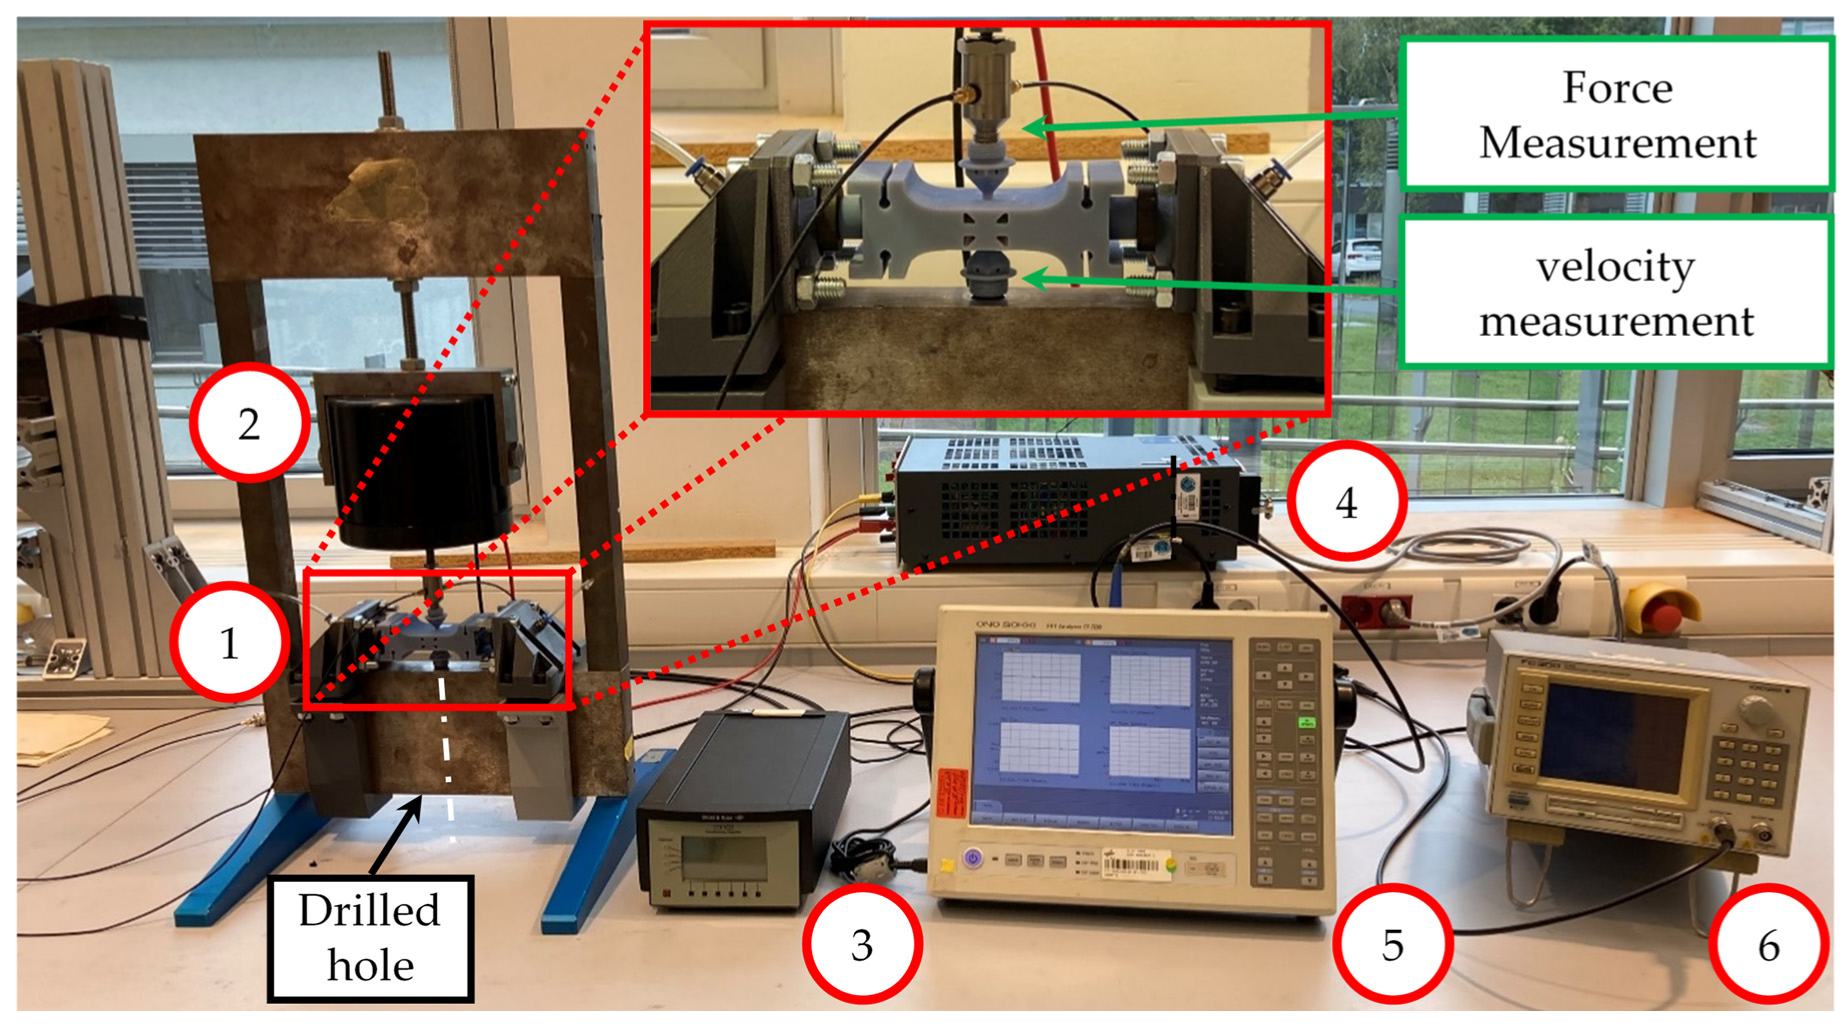
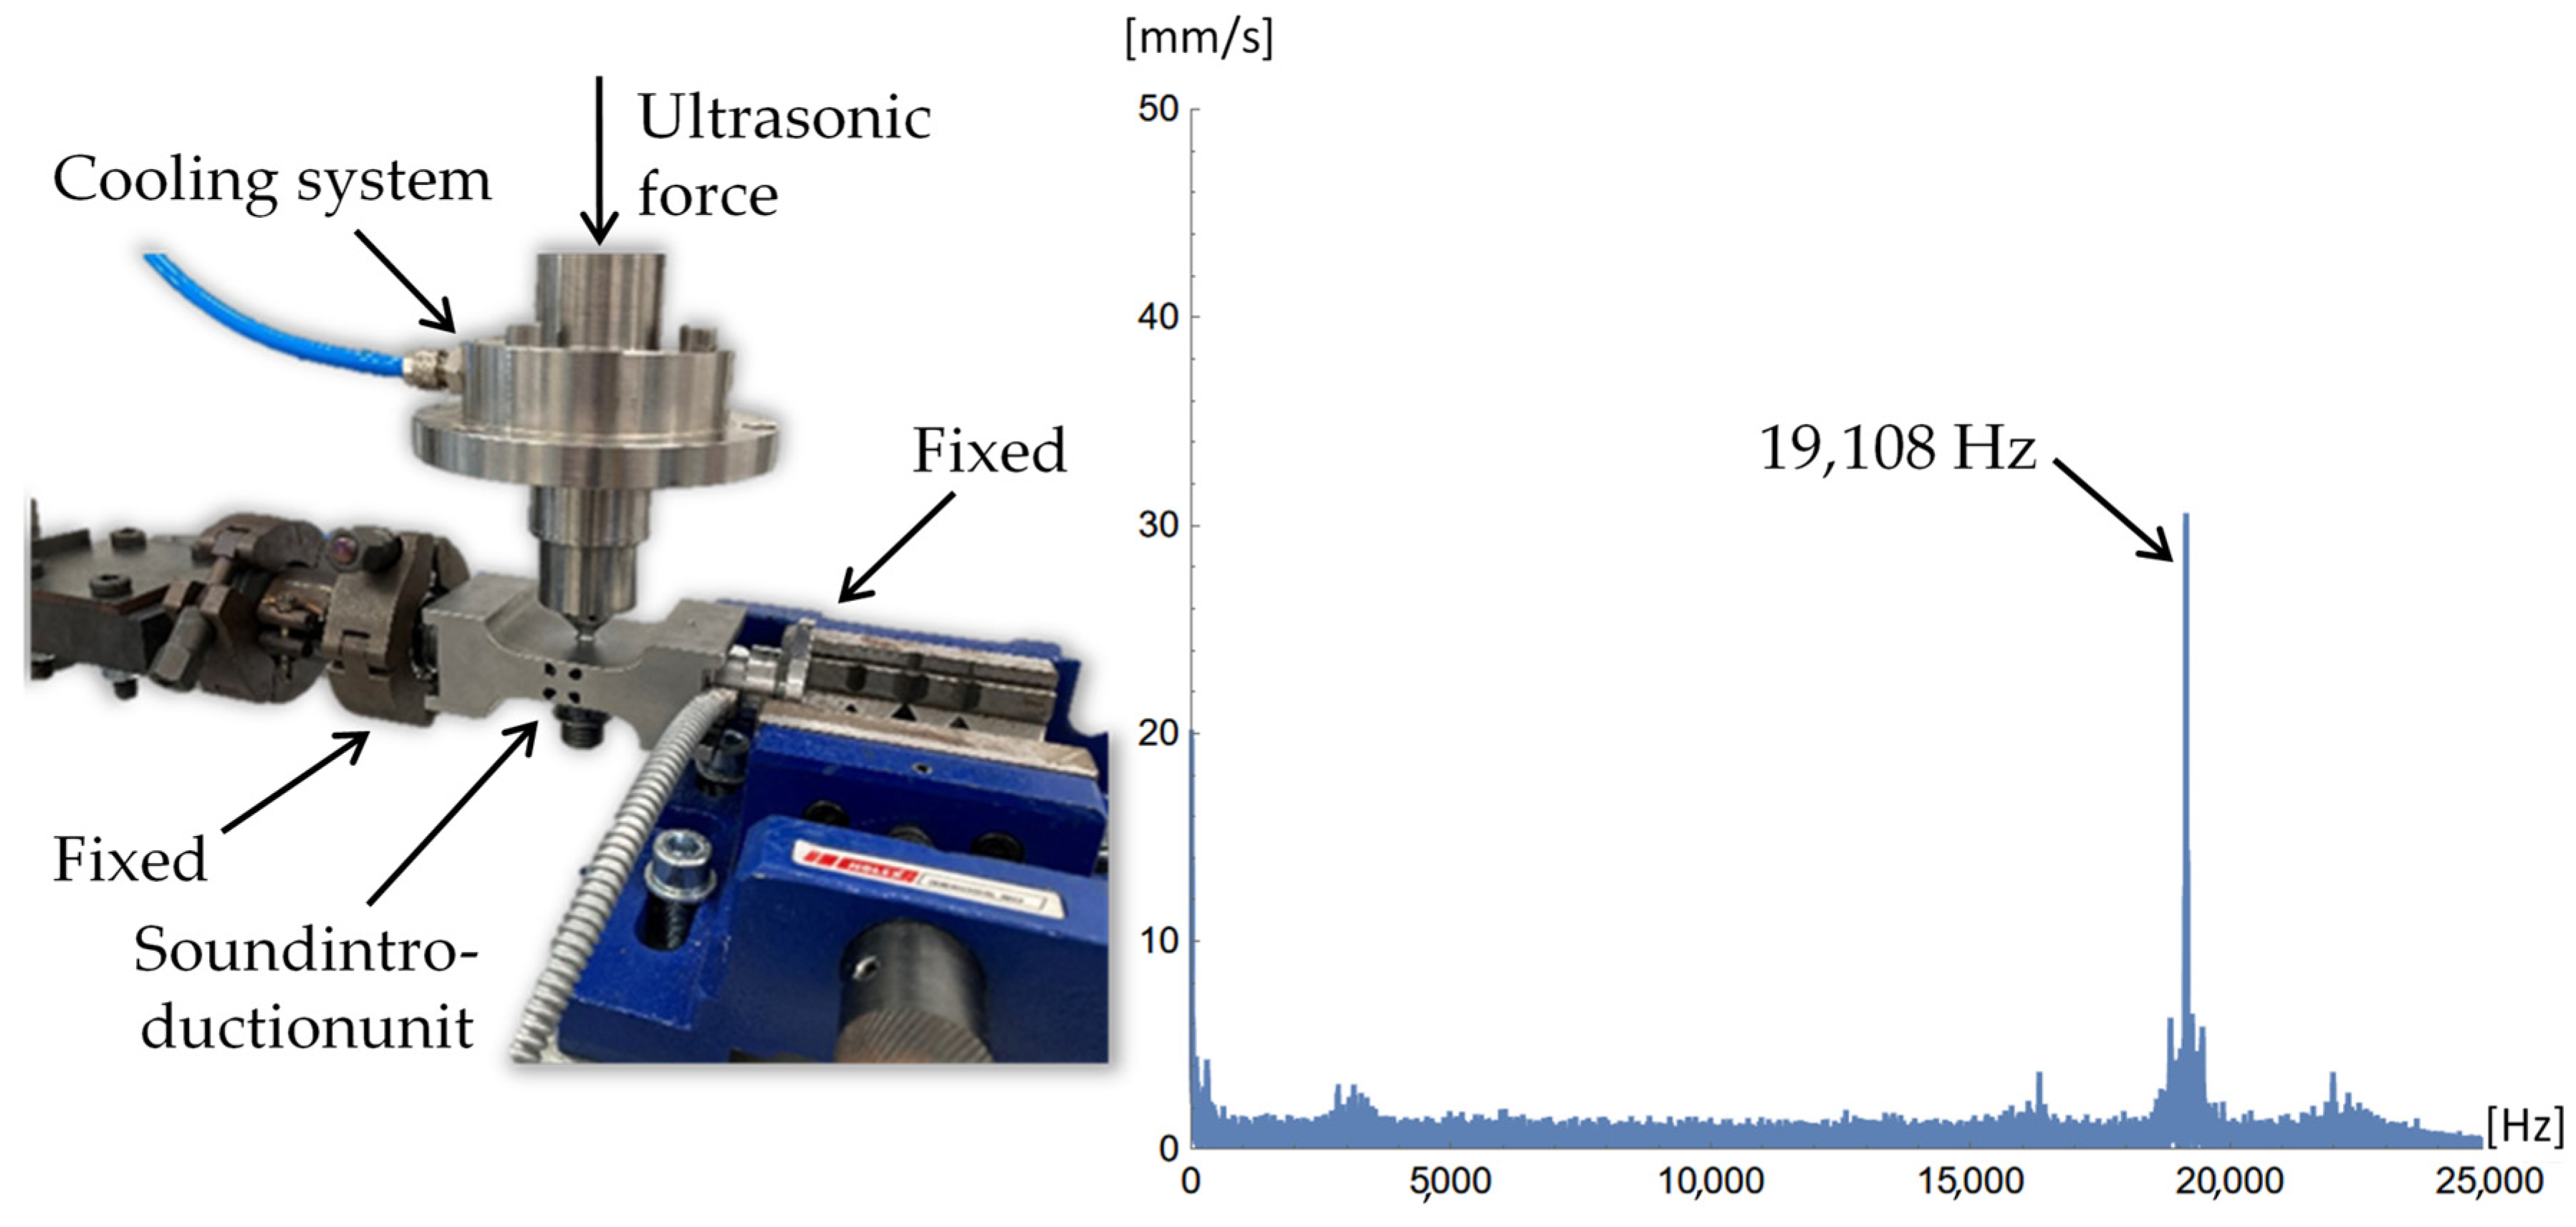
2.3. Experimental Setup
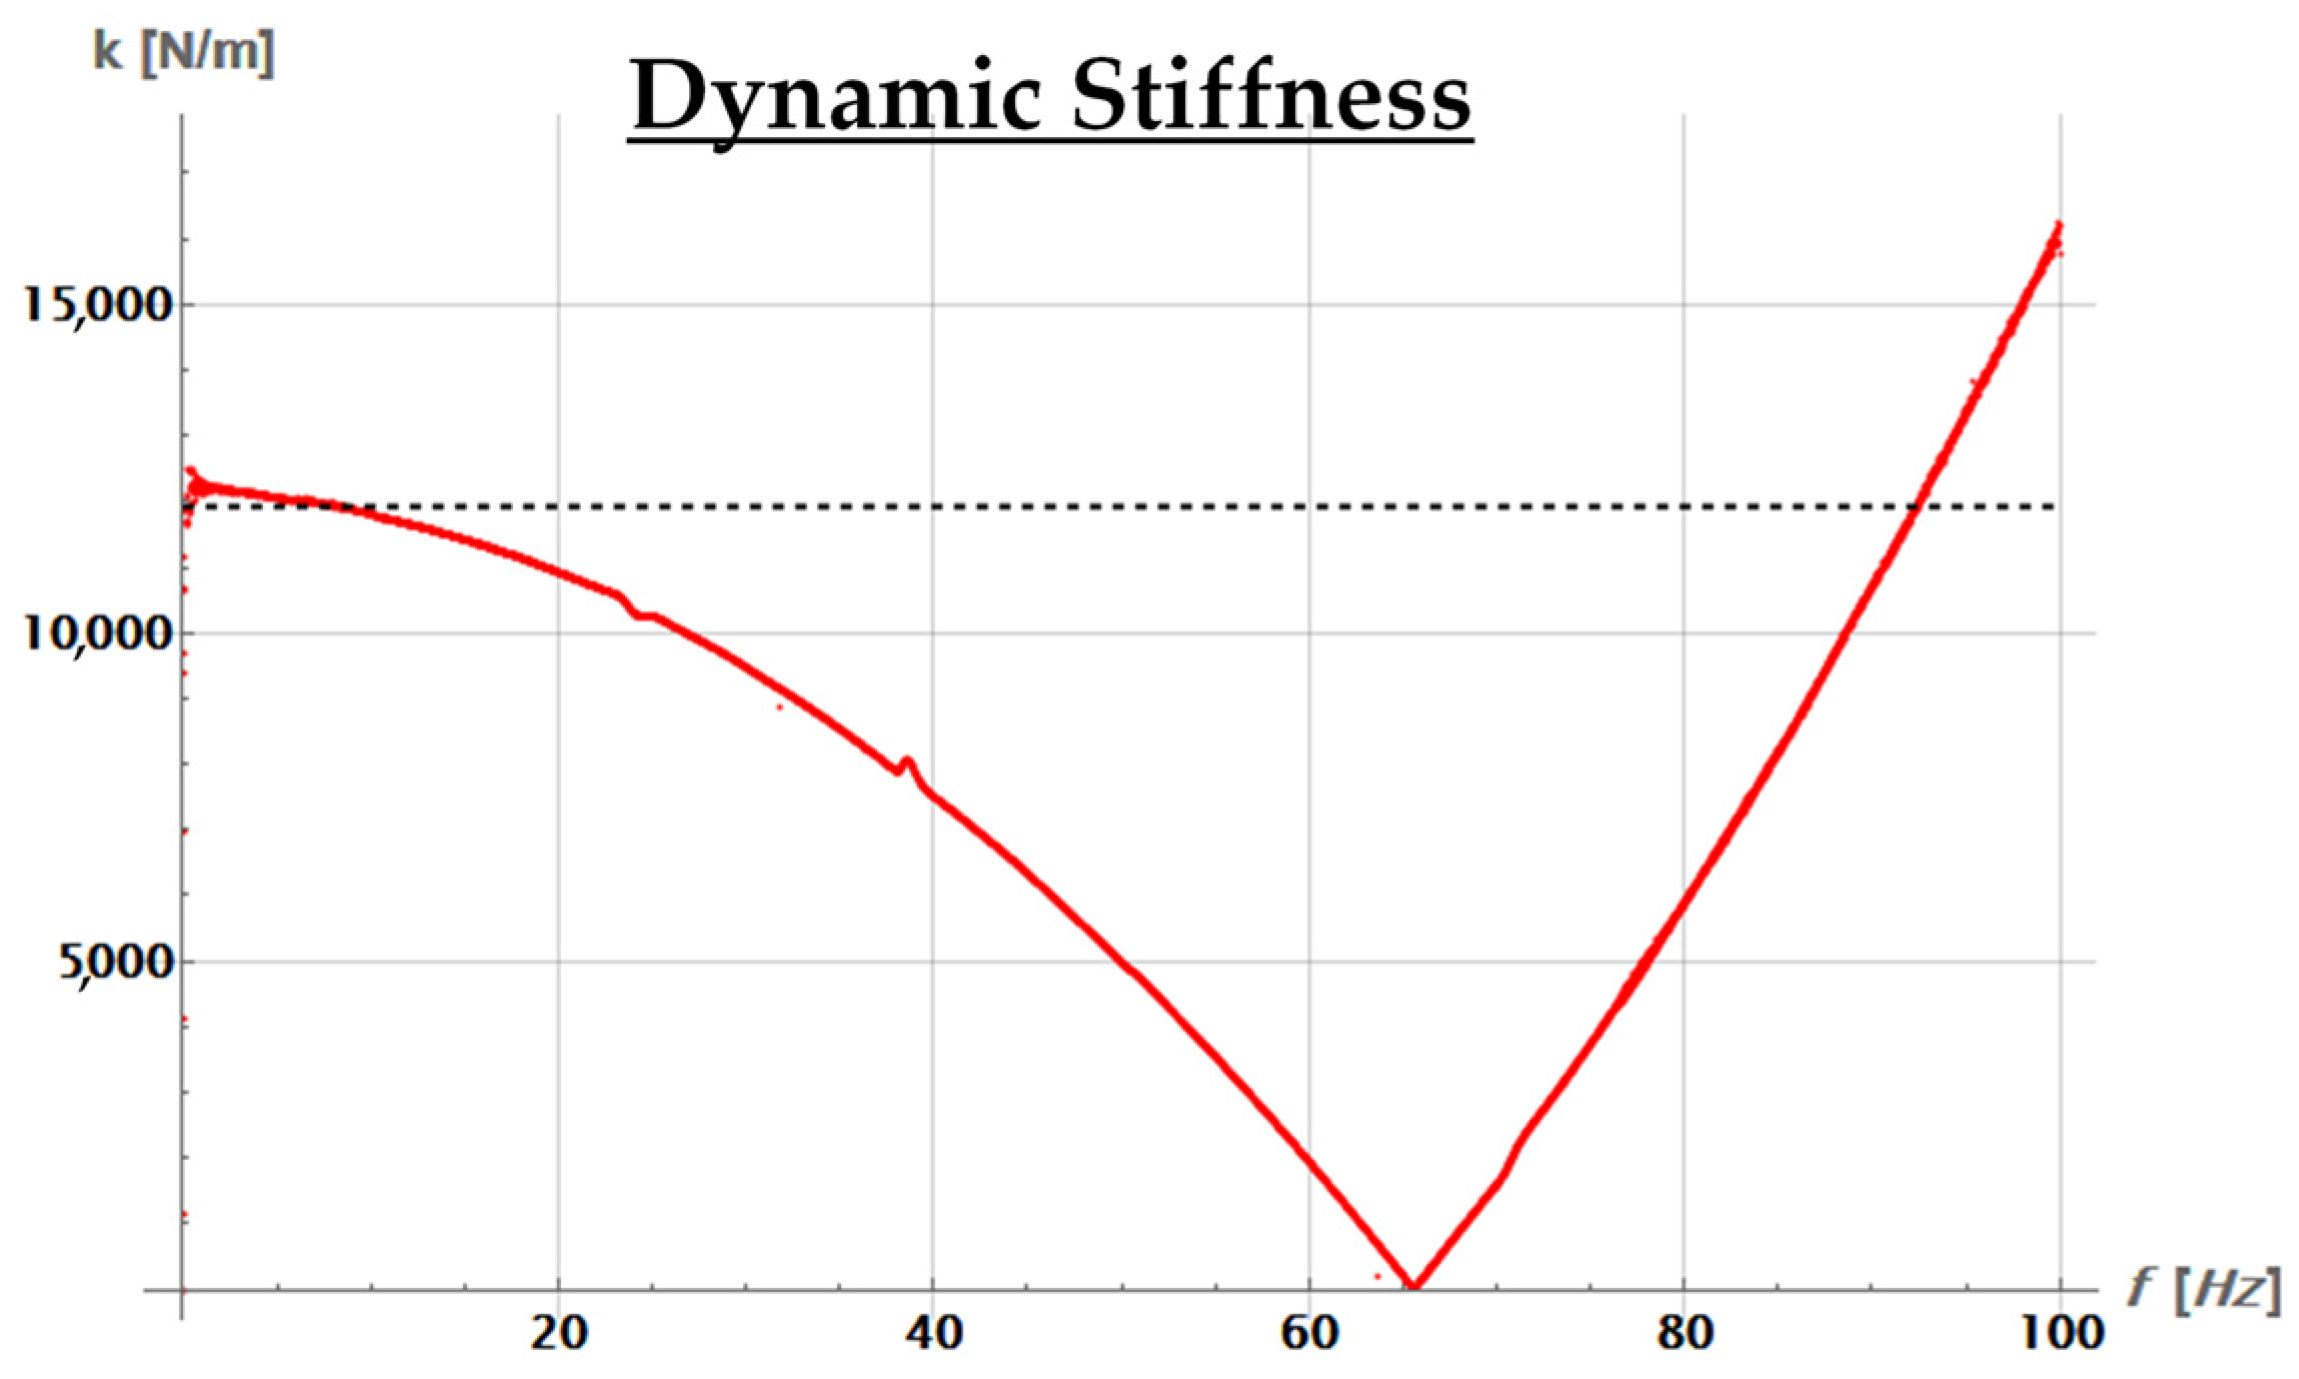
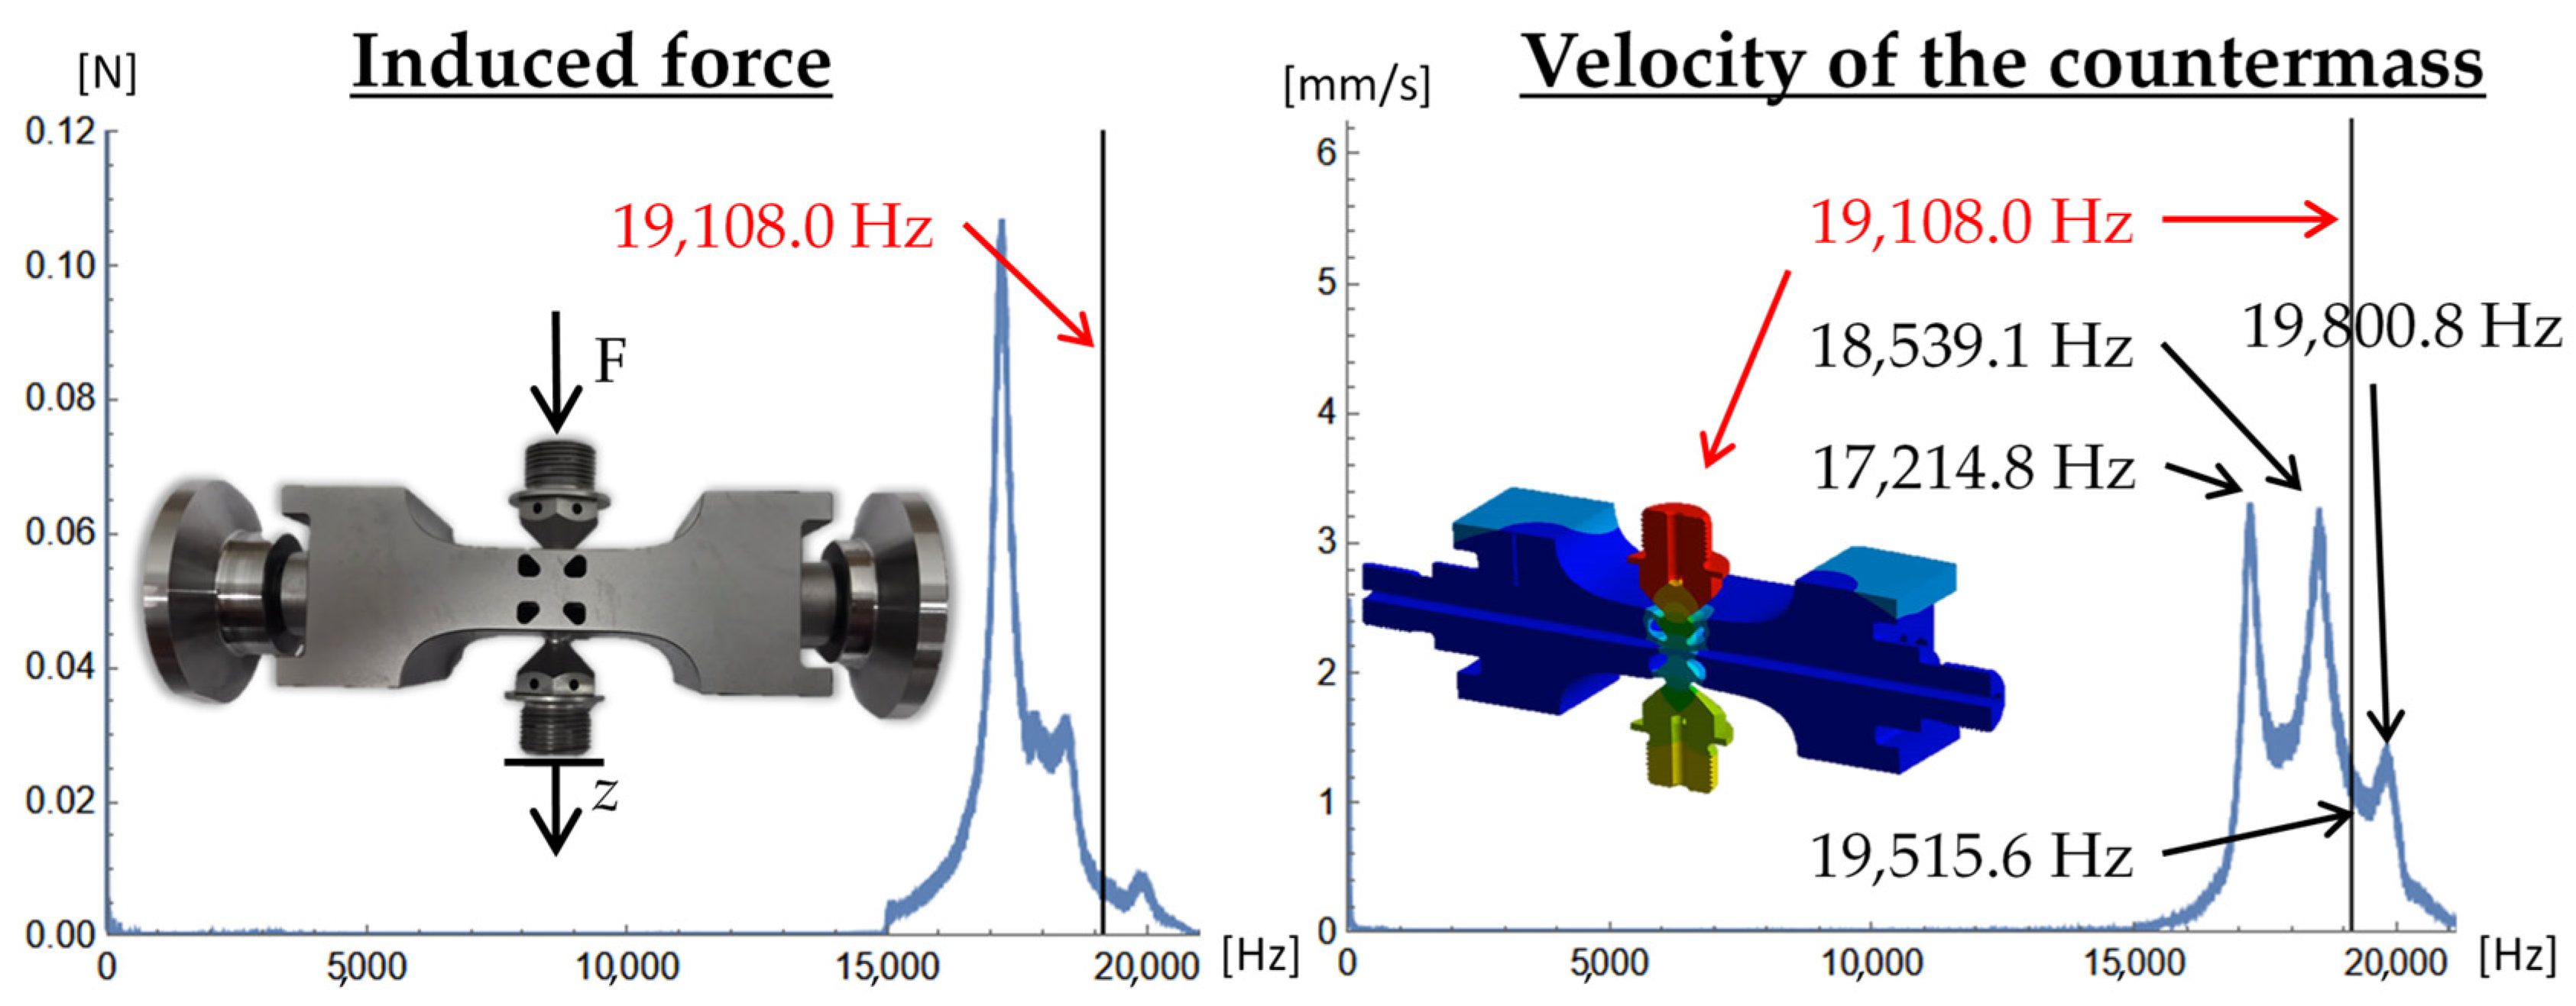
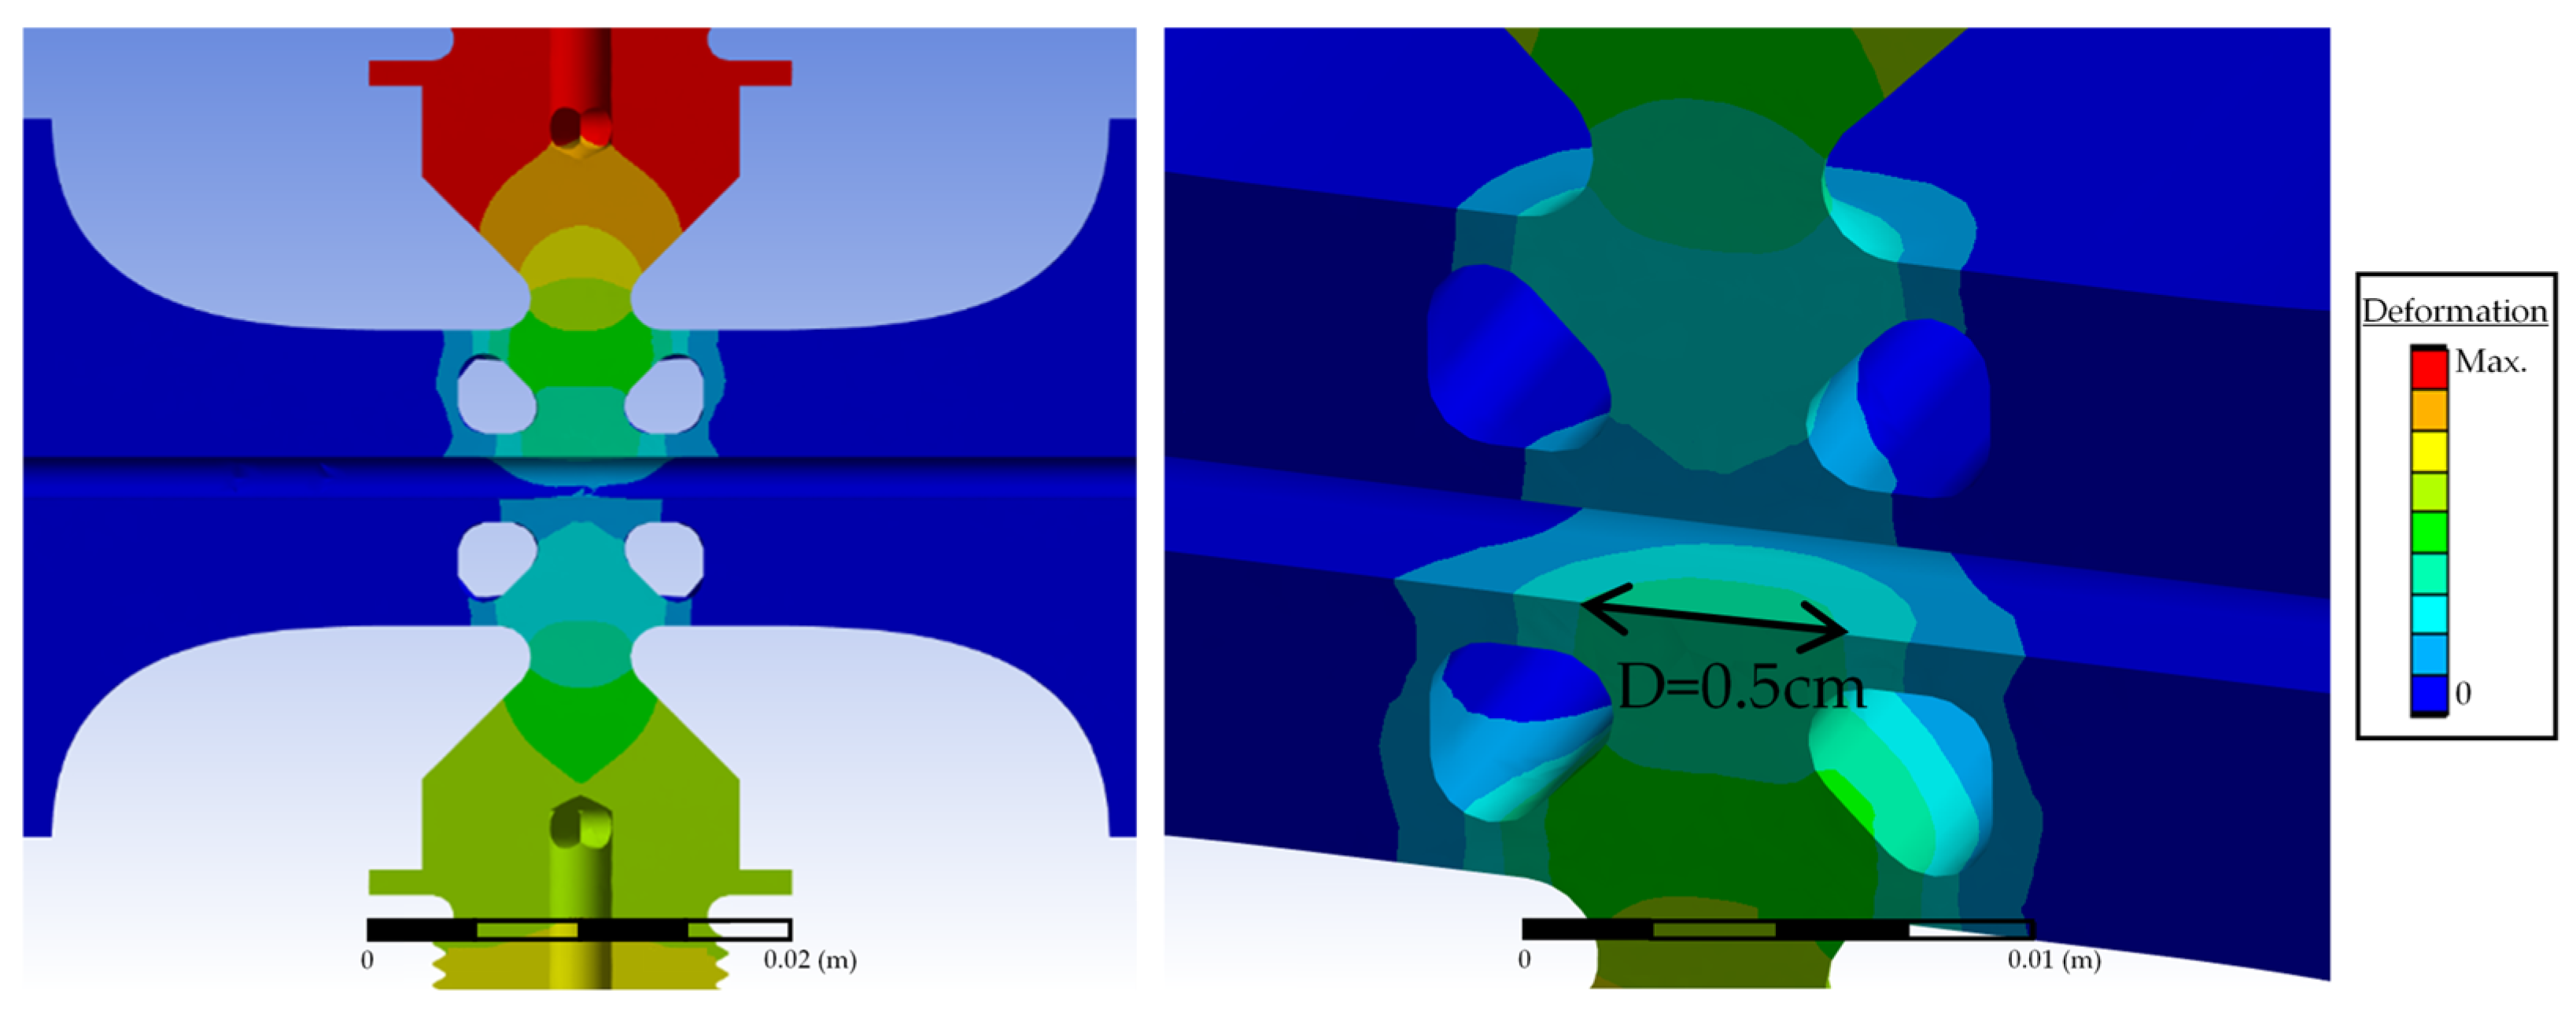
3. Results and Discussions
- 254.58 W/cm2 for the cleaning material at 50 W;
- 478.62 W/cm2 for PLA at 94 W.
4. Conclusions
Author Contributions
Funding
Data Availability Statement
Acknowledgments
Conflicts of Interest
References
- Ma, P.-C.; Siddiqui, N.A.; Marom, G.; Kim, J.-K. Dispersion and functionalization of carbon nanotubes for polymer-based nanocomposites: A review. Compos. Part A Appl. Sci. Manuf. 2010, 41, 1345–1367. [Google Scholar] [CrossRef]
- McNally, T.; Pötschke, P. Polymer-Carbon Nanotube Composites: Preparation, Properties and Applications. In Polymer–Carbon Nanotube Composites; Woodhead Publishing: Cambridge, UK, 2011; ISBN 9781845697617. [Google Scholar] [CrossRef]
- Isayev, A.I.; Kumar, R.; Lewis, T.M. Ultrasound assisted twin screw extrusion of polymer-nanocomposites containing carbon nanotubes. Polymer 2009, 50, 250–260. [Google Scholar] [CrossRef]
- Zhong, J.; Isayev, A.I. Properties of Polyetherimide/Graphite Composites Prepared Using Ultrasonic Twin-Screw Extrusion. J. Appl. Polym. Sci. 2014, 132. [Google Scholar] [CrossRef]
- Gorga, R.E.; Cohen, R.E. Toughness enhancements in poly(methyl methacrylate) by addition of oriented multiwall carbon nanotubes. J. Polym. Sci. Part B Polym. Phys. 2004, 42, 2690–2702. [Google Scholar] [CrossRef]
- Díez-Pascual, A.M.; Naffakh, M.; Marco, C.; Ellis, G.; Gómez-Fatou, M.A. High-performance nanocomposites based on polyetherketones. Prog. Mater. Sci. 2012, 57, 1106–1190. [Google Scholar] [CrossRef]
- Xu, X.; Wie, K.; Mei, M.; Li, M.; Yang, X. An ultrasound-assisted resin transfer molding to improve the impregnation and dual/scale flow for carbon fiber reinforced resin composites. Compos. Sci. Technol. 2024, 255, 110710. [Google Scholar] [CrossRef]
- Horrocks, A.R.; Kandola, B.; Milnes, G.J.; Sitpalan, A.; Hadimani, R.L. The potential for ultrasound to improve nanoparticle dispersion and increase flame resistance in fibre-forming polymers. Polym. Degrad. Stab. 2012, 97, 2511–2523. [Google Scholar] [CrossRef]
- Xia, H.; Wang, Q.; Qiu, G. Polymer-Encapsulated Carbon Nanotubes Prepared through Ultrasonically Initiated In Situ Emulsion Polymerization. Chem. Mater. 2003, 15, 3879–3886. [Google Scholar] [CrossRef]
- Tzanakis, I.; Khavari, M.; Titze, M.; Eskin, D.G. Cavitation in thermoplastic melts: New insights into ultrasound-assisted fibre-impregnation. Compos. Part B Eng. 2022, 229, 109480. [Google Scholar] [CrossRef]
- Zhau, B.; Qiang, Y.; Wu, W.; Jiang, B. Turning Power Ultrasound for Enhanced Performance of Thermoplastics Micro-Injection Molding: Principles, Methods, and Performances. Polymers 2021, 13, 2877. [Google Scholar] [CrossRef]
- Qiao, J.; Li, Y.; Li, L. Ultrasound-assisted 3D printing of continuous fiber-reinforced thermoplastic (FRTP) composites. Addit. Manuf. 2019, 30, 100926. [Google Scholar] [CrossRef]
- Chen, J.; Chen, Y.; Li, H.; Lai, S.-Y.; Jow, J. Physical and chemical effects of ultrasound vibration on polymer melt in extrusion. Ultrason. Sonochemistry 2010, 17, 66–71. [Google Scholar] [CrossRef]
- Khamsehnezhad, A. The Effects of Ultrasonic Waves Application During Extrusionon the Processing Parameters and the Properties of Polyethylene. Ph.D. Thesis, Brunel University London, Uxbridge, UK, 2014. Available online: http://bura.brunel.ac.uk/handle/2438/13956 (accessed on 30 January 2025).
- Zhong, J.; Isayev, A.I. Ultrasonic Treatment of PP/CNT Composites During Twin-Screw Extrusion: Effect of Screw Configuration. Polym. Compos. 2017, 38, 2695–2706. [Google Scholar] [CrossRef]
- Kroos, K.; Diniz, S.; Bachmann, J.; Chakraborty, S.; Kühnast, F.; Schmidt, J.-U.R.; Opitz, S. Filaments For Additive Manufacturing Reinforced with Carbon Fibers From Waste Stream. In Proceedings of the 21st European Conference on Composite Materials, Nantes, France, 2–5 July 2024; Volume 7. [Google Scholar] [CrossRef]
- Titze, M. Verfahren und Vorrichtung zum Imprägnieren eines Faserbündels sowie Verfahren und Anlage zur Herstellung Einer Dreidimensionalen Struktur. Patent: DE 10 2019 106 355.8, 2020. [Google Scholar]
- Hiller, T. Schwingungsverhalten von Abgasanlagen mit Entkoppelelementen. Ph.D. Thesis, Friedrich-Alexander-Universität, Erlangen, Germany, 2023. [Google Scholar]
- Sophianopoulos, D.S. The effect of joint flexibility on the free elastic vibration characteristics of steel plane frames. J. Constr. Steel Res. 2003, 59, 995–1008. [Google Scholar] [CrossRef]
- Seidel, M. Auslegung von Hybridtürmen für Windenergieanlagen- Lastermittlung und Nachweis der Ermüdungsfestigkeit am Beispiel einer 3,6-MW-WEA mit 100m Rotordurchmesser. Beton Und Stahlbetonbau 2002, 97, 564–575. [Google Scholar] [CrossRef]


| Measurement | 0% Ampl. [g/min] | 50% Ampl. [g/min] | Gain [%] |
|---|---|---|---|
| 1 | 6.20 | 7.00 | 12.9 |
| 2 | 6.30 | 7.20 | 14.3 |
| 3 | 6.06 | 6.88 | 13.5 |
Disclaimer/Publisher’s Note: The statements, opinions and data contained in all publications are solely those of the individual author(s) and contributor(s) and not of MDPI and/or the editor(s). MDPI and/or the editor(s) disclaim responsibility for any injury to people or property resulting from any ideas, methods, instructions or products referred to in the content. |
© 2025 by the authors. Licensee MDPI, Basel, Switzerland. This article is an open access article distributed under the terms and conditions of the Creative Commons Attribution (CC BY) license (https://creativecommons.org/licenses/by/4.0/).
Share and Cite
Sparenberg, M.R.A.; Schmidt, J.-U.R.; Titze, M.; Monner, H.P. Enhanced, Seamless Ultrasound Introduction Unit for Thermoplastic Melt Treatment. Designs 2025, 9, 18. https://doi.org/10.3390/designs9010018
Sparenberg MRA, Schmidt J-UR, Titze M, Monner HP. Enhanced, Seamless Ultrasound Introduction Unit for Thermoplastic Melt Treatment. Designs. 2025; 9(1):18. https://doi.org/10.3390/designs9010018
Chicago/Turabian StyleSparenberg, Marc René André, Jan-Uwe Reinhard Schmidt, Maik Titze, and Hans Peter Monner. 2025. "Enhanced, Seamless Ultrasound Introduction Unit for Thermoplastic Melt Treatment" Designs 9, no. 1: 18. https://doi.org/10.3390/designs9010018
APA StyleSparenberg, M. R. A., Schmidt, J.-U. R., Titze, M., & Monner, H. P. (2025). Enhanced, Seamless Ultrasound Introduction Unit for Thermoplastic Melt Treatment. Designs, 9(1), 18. https://doi.org/10.3390/designs9010018