1. Introduction
Micro- and mini-hydropower plants (HPPs) are cheap, environmentally friendly, and reliable sources of energy. This is one of the greenest ways to produce electricity today. Moreover, small hydropower plants have enormous untapped potential in most regions of the world. They can make a big contribution to meeting energy needs in the future. They are based on well-studied and proven technologies, but there is great potential for further optimization.
Currently, in the field of small damless hydropower plants, a search is underway for the most rational designs that provide maximum torque with minimum dimensions. Work is underway in the field of materials for mini-hydropower plants. Multi-component structures, according to Emmy Noether’s theorem, will not have high efficiency, since they will have high mechanical losses due to the rotation of the mechanisms. These structures have complex symmetry. Such designs can only be considered for installation in high-pressure water flows with guide vanes. For slow-moving rivers, the simplest versions of hydropower plants with the axis of rotation located normal and vertical to the river flow are promising [
1,
2,
3,
4,
5,
6,
7,
8,
9].
Damless hydropower plants, being mechanisms, are influenced by variable design parameters that affect torque. This suggests the possibility of finding the most rational design for use in shallow, slow-moving rivers. A feature of such structures, in contrast to structures installed in high-speed flows, should be the ability to convert the low speed of the river into high revolutions of the current generator [
9,
10,
11,
12]. At the same time, hydropower plants with a vertical axis of rotation should have the greatest variability, since the length of the lever is not limited by the depth of the river. The limitation on the depth of the river can be overcome by changing the geometry of the blade, reducing its height and increasing its width [
13,
14,
15].
The development and optimization of HPP designs are made using modern tools and techniques in hydropower plant modeling. These tools help the researchers and developers to ensure that the plant operates at maximum efficiency by selecting the optimal location, turbine type, and size; to minimize the ecological footprint by analyzing the potential effects on local ecosystems and water resources; to conduct cost–benefit analyses to ensure the project is financially feasible and sustainable over the long term; and to identify and mitigate potential risks such as flooding, structural failures, and maintenance issues.
Hydropower plant design is a complex and multifaceted process that necessitates a thorough understanding of hydrology, structural engineering, environmental science, and economics. To achieve a successful and efficient hydropower plant design, engineers and researchers rely on a variety of advanced tools and techniques. These tools and techniques facilitate the simulation, analysis, and optimization of different aspects of the plant, from water flow to structural integrity and environmental impact. Modern tools and techniques in hydropower plant modeling include a variety of models and software. Among them, computational fluid dynamics, finite element analysis, hydrological modeling, optimization algorithms, and specialized simulation software are emphasized.
Computational fluid dynamics (CFD) is a crucial tool in hydropower plant modeling, offering a detailed simulation and analysis of fluid flow within hydraulic structures. By utilizing advanced numerical methods and algorithms, CFD provides in-depth insights into water behavior as it interacts with turbines, spillways, and other components. This allows engineers to optimize design parameters, enhance energy conversion efficiency, and minimize hydraulic losses. Furthermore, CFD helps identify potential issues such as cavitation and flow separation, ensuring the structural integrity and longevity of the plant. However, CFD has several disadvantages, such as high computational demand, complexity, data sensitivity, initial costs, simplifications, and assumptions [
8,
16,
17,
18,
19].
Hydrological modeling is a critical tool in the design and optimization of hydropower plants, offering valuable insights into water flow, site selection, and environmental impacts. While it provides numerous benefits such as accurate water flow prediction and flood risk assessment, challenges like data requirements, model complexity, and inherent uncertainties must be carefully managed. Balancing these advantages and disadvantages is essential for effectively utilizing hydrological modeling in the development of efficient and sustainable hydropower systems [
20,
21,
22].
Optimization algorithms are tools in hydropower plant modeling, having significant advantages in terms of efficiency, cost reduction, and complex problem-solving. They facilitate the identification of optimal solutions for various design and operational challenges, contributing to the development of more efficient and sustainable hydropower systems. However, the high computational demands, data dependence, and complexity of these algorithms present challenges in using these tools [
23,
24,
25].
Specialized software tools like HEC-RAS (Hydrologic Engineering Center’s river analysis system), SWMM (storm water management model), and HOMER (hybrid optimization of multiple energy resources) are used for various aspects of hydrological and energy modeling. They provide comprehensive platforms for simulating and analyzing complex hydropower systems, supporting detailed design and planning. By enabling the virtual testing of various scenarios, it helps optimize design and operational parameters, contributing to the development of efficient and reliable hydropower systems. However, the high initial cost, complexity, and dependence on accurate data pose challenges [
26,
27,
28,
29].
Finite element analysis (FEA) is a computational tool used in the design and assessment of hydropower plants. It involves breaking down complex structures into smaller, manageable elements and analyzing their behavior under various physical conditions. FEA is particularly valuable in evaluating the structural integrity and performance of dams, turbines, and powerhouses, ensuring that they can withstand different stresses and loads. FEA provides precise insights into the stress, strain, and deformation of complex structures, helping engineers identify potential weaknesses and optimize designs. Accurate prediction of how components will behave under various loads and conditions using FEA ensures that hydropower structures are safe and reliable, reducing the risk of failures and accidents. By enabling precise analysis of complex geometries and material behaviors, FEA helps engineers design robust and reliable hydropower systems. Its versatility and ability to solve complex problems make it an essential component in the development of efficient and durable hydropower infrastructure [
30,
31,
32]. Due its ability to provide the most accurate calculation of volumetric mechanisms using hydrodynamic equations, FEA was chosen as a research tool in this study.
The goal is to study the design features of damless hydropower plants by resolving the contradiction between the low speed and depth of rivers on the one hand, and the need for high torque on the shaft from the turbine, by comparing the efficiency of a radial turbine and a pendulum hydropower plant on the other hand, and choosing the most promising design.
To eliminate the above gaps, it is necessary to solve specific problems:
- (1)
theoretical studies of the influence of variable design parameters on the efficiency of radial and pendulum hydropower plants;
- (2)
comparison of the efficiency of radial turbines and pendulum hydropower plants.
3. Results and Discussion
3.1. Calculation Results for a Pendulum Hydropower Plant
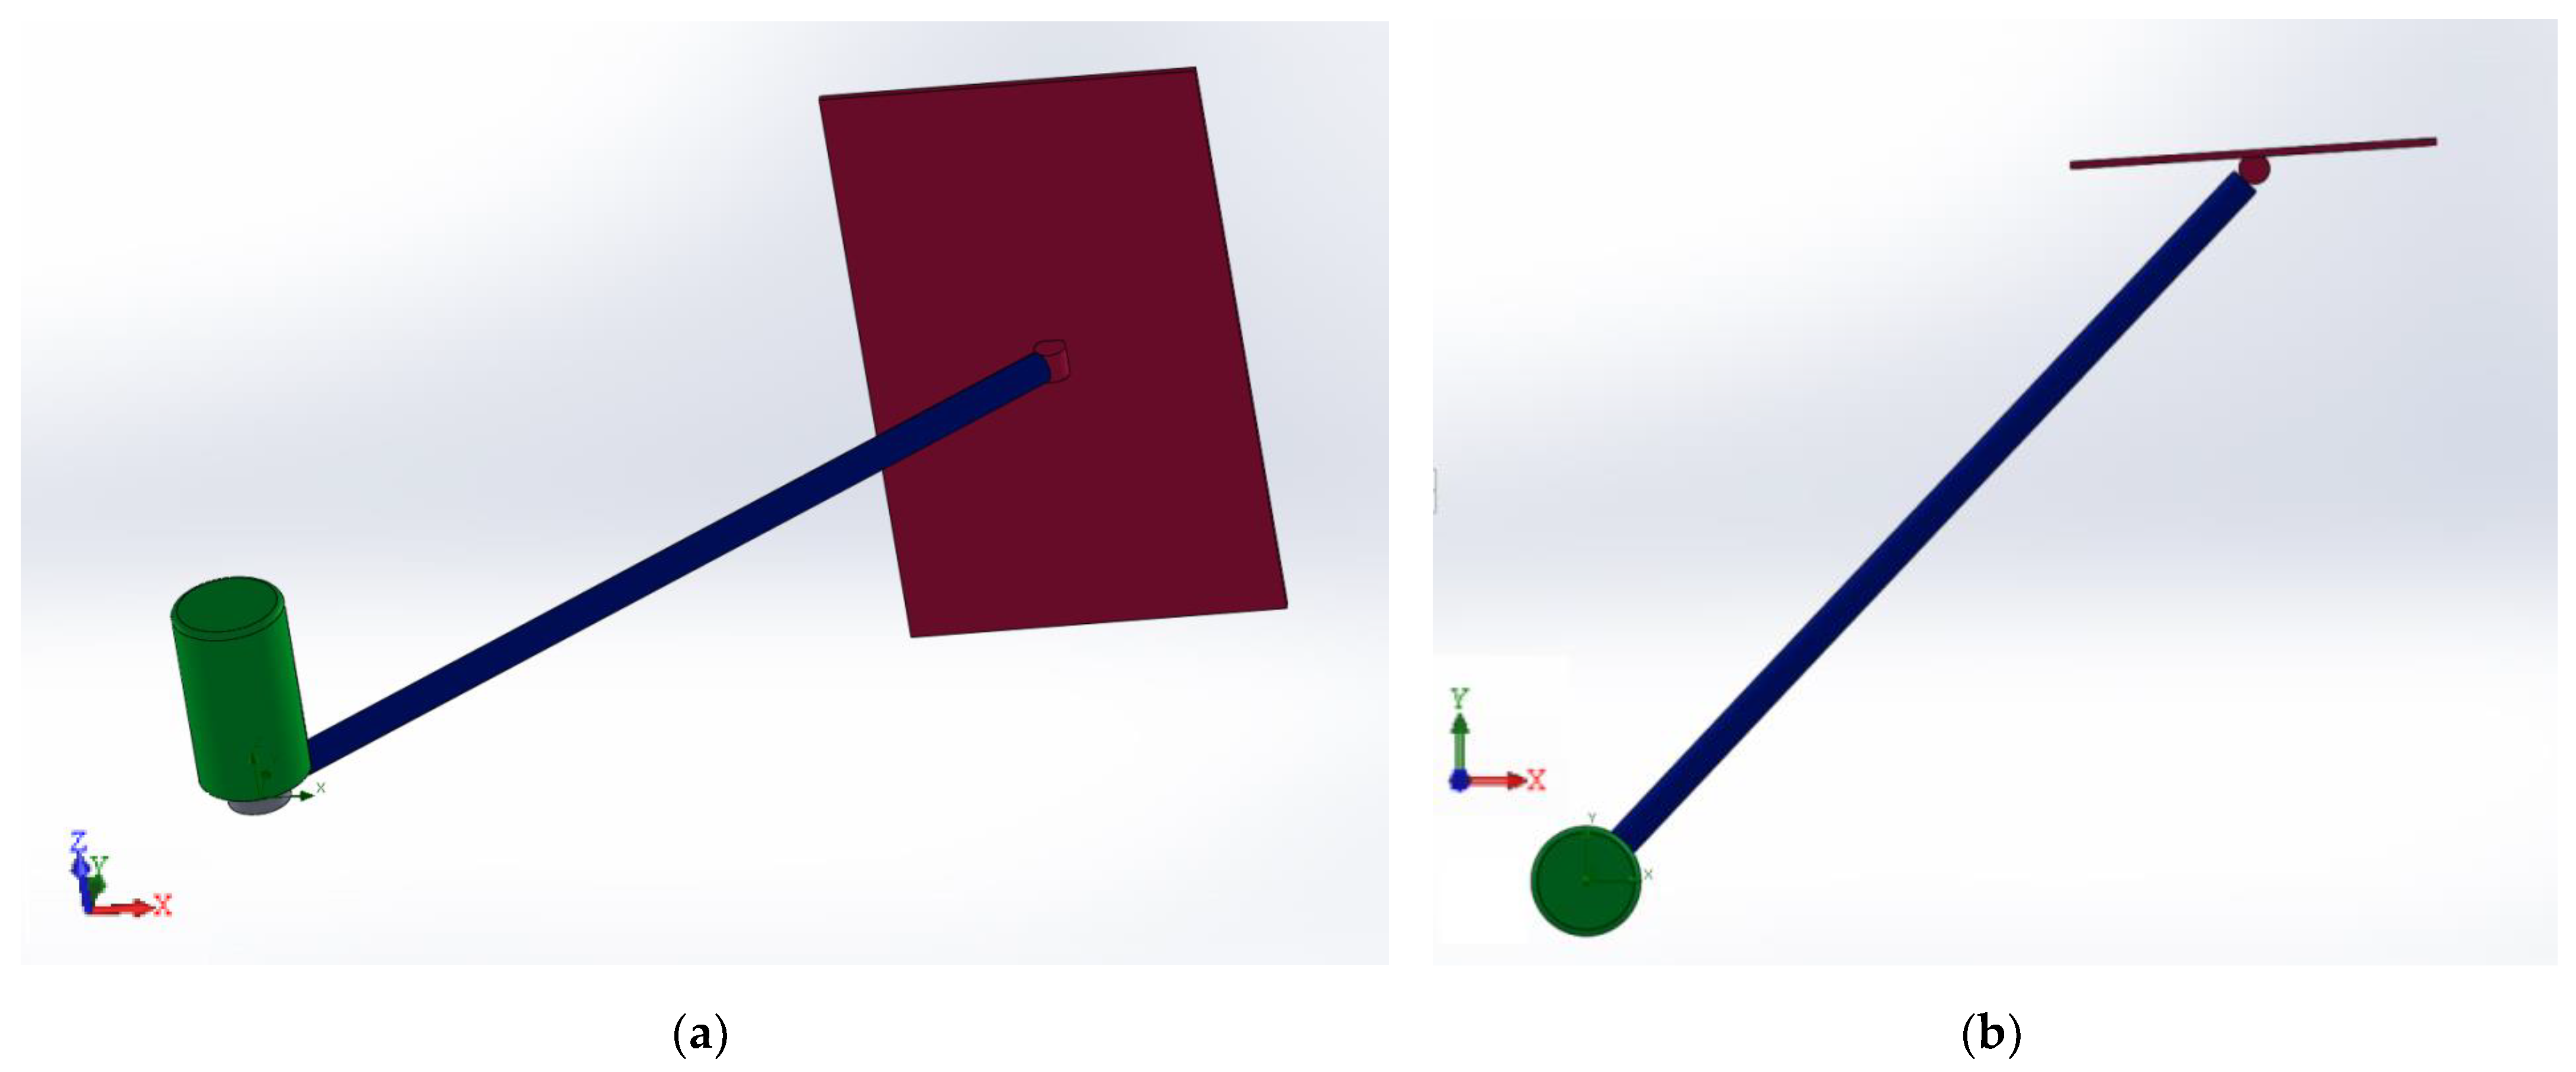
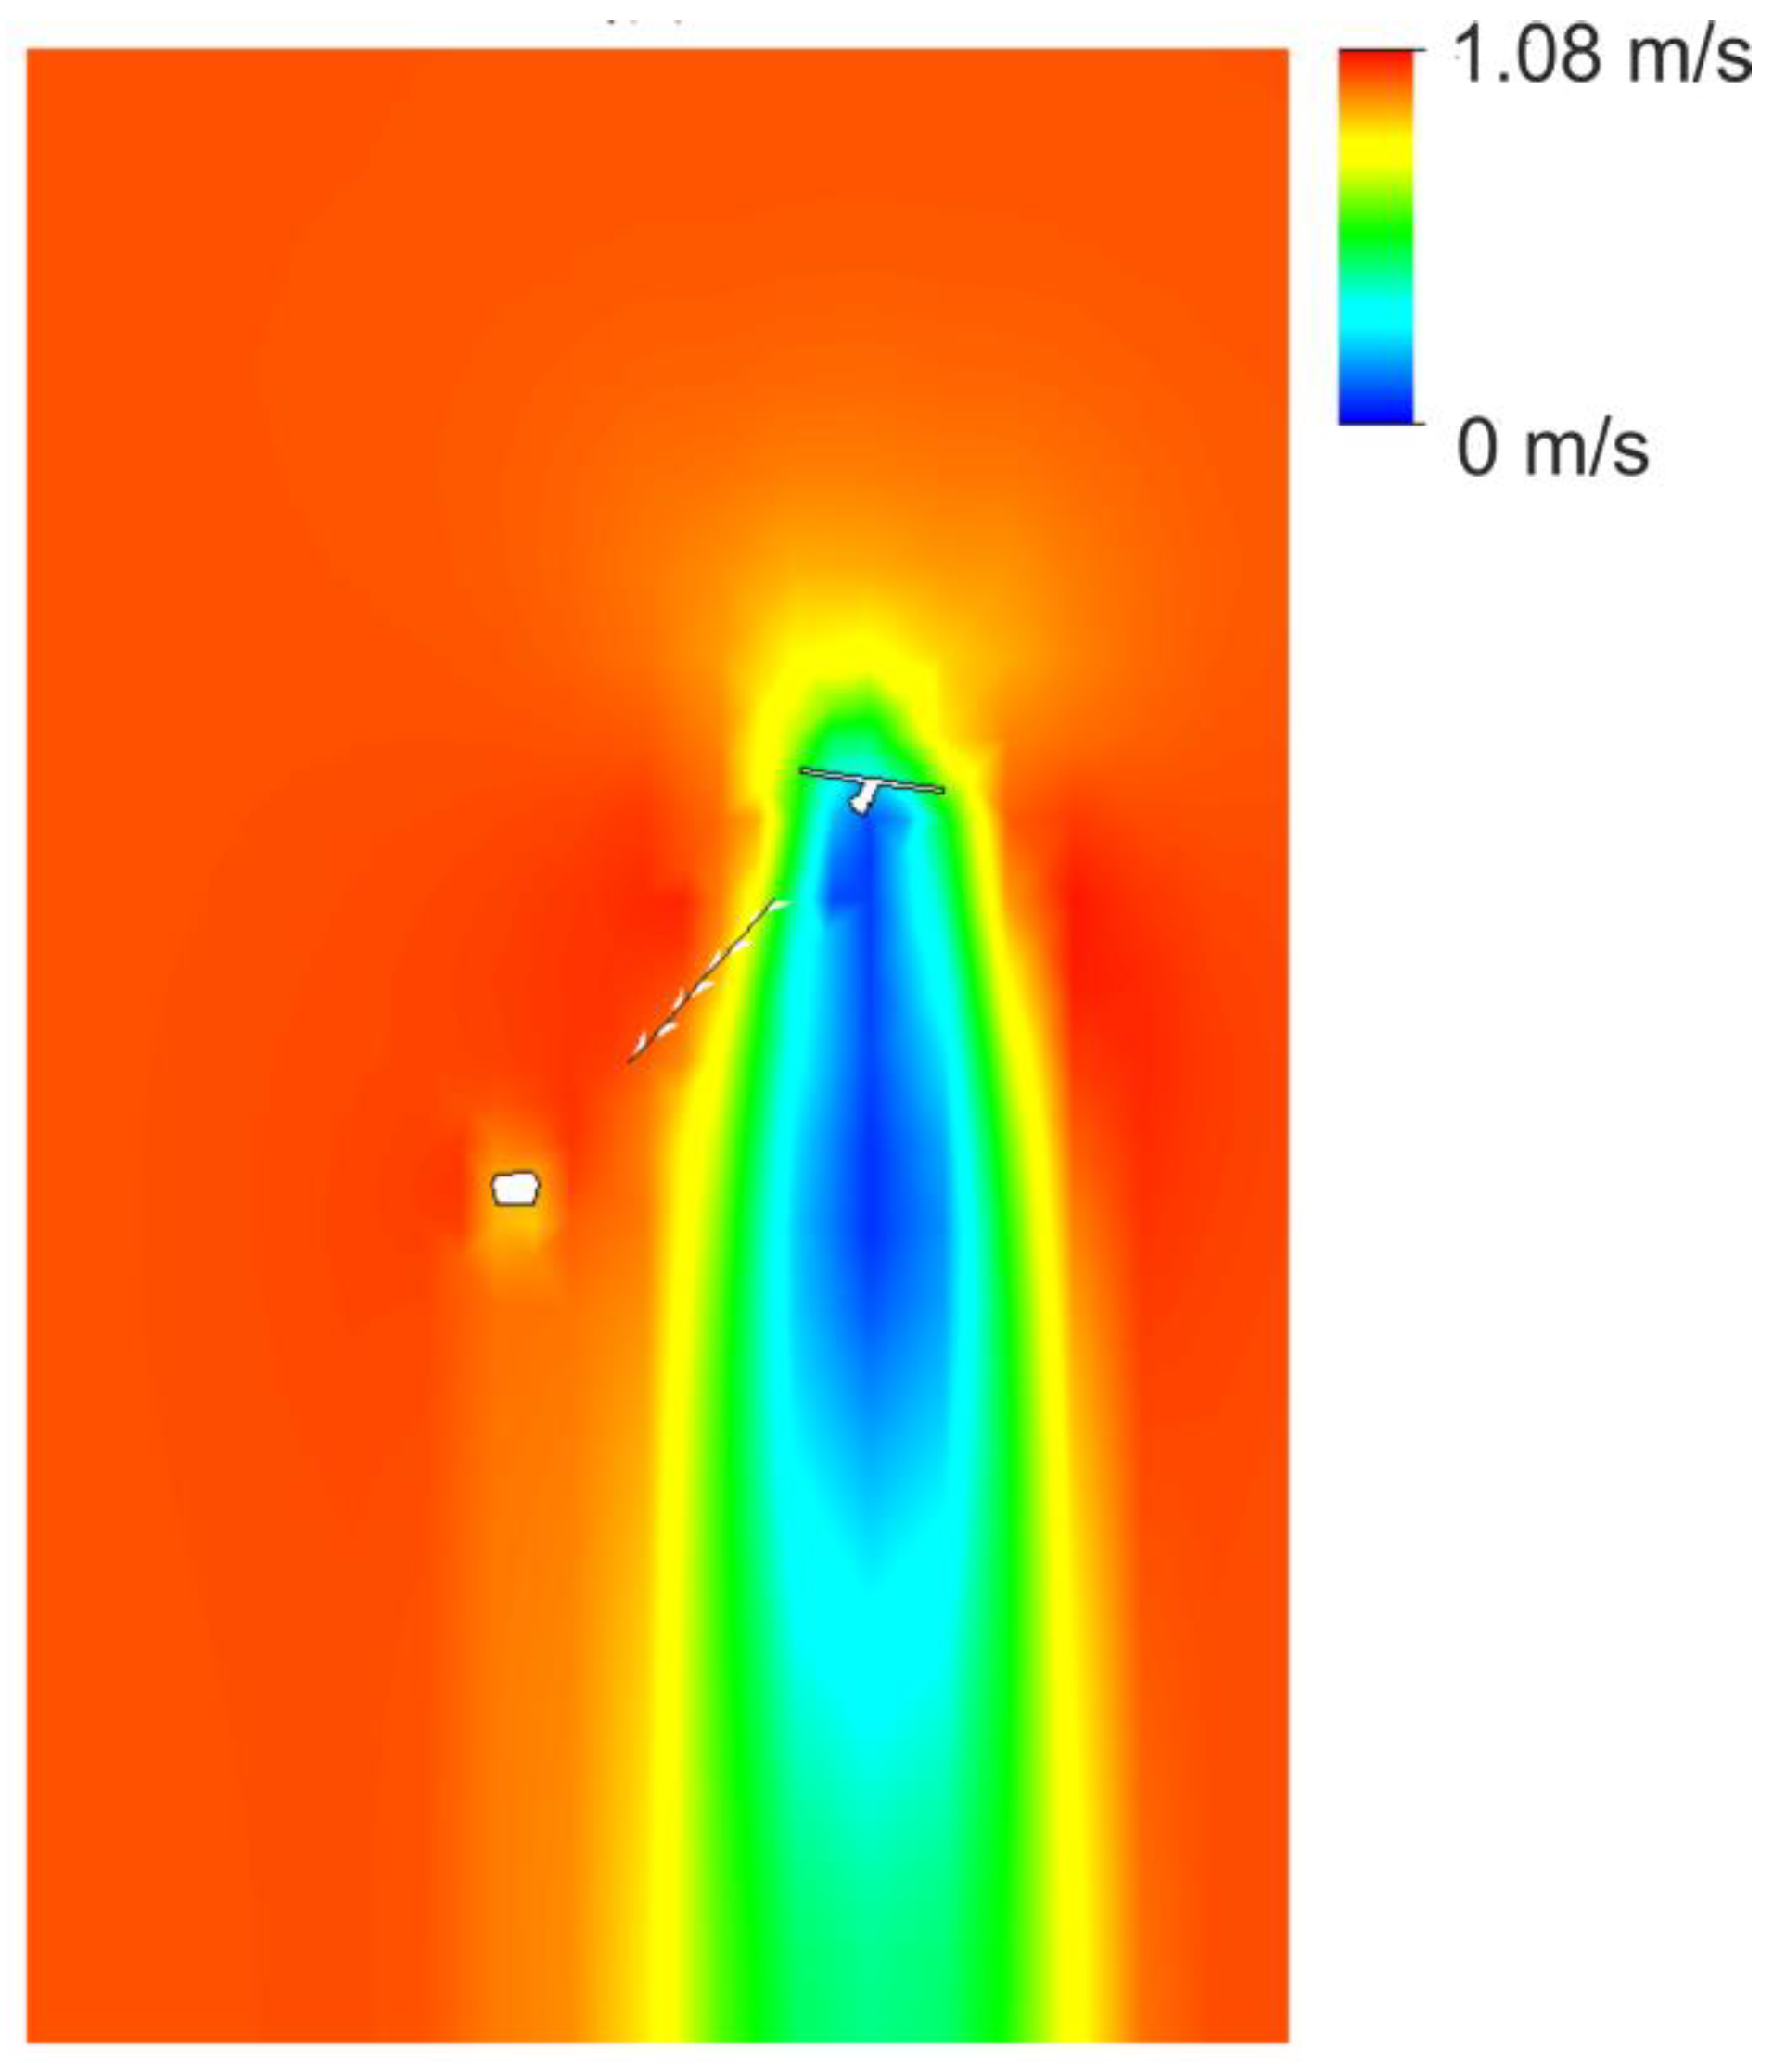
Figure 9 shows the velocity field during swelling of the blade of a pendulum hydropower plant. The figure shows that in front of the blade, the speed drops, and behind the blade, the water speed is zero, which indicates that pressure is created on the blade. The color gradient represents different velocity magnitudes, with blue indicating lower velocities (0 m/s) and red indicating higher velocities (up to 1.08 m/s). The area immediately downstream of the blade shows a significant reduction in velocity, represented by the blue color. This indicates that the blade is effectively slowing down the water flow in this region. Moving away from the blade, the velocity increases, transitioning from blue to green, yellow, and eventually red. This gradient indicates the acceleration of water as it moves past the blade and resumes a more natural flow pattern. The highest velocities, depicted in red and orange, are concentrated around the edges of the blade and downstream, suggesting that water is forced to accelerate as it bypasses. This acceleration could be due to the narrowing of the flow path around the blade. The white arrow indicates the direction of flow, which appears to be deflected by the blade. This deflection creates a wake region behind the blade, characterized by lower velocities (blue area). The presence of such a wake is typical in fluid dynamics when a solid object obstructs the flow of a fluid. The blade causes a significant variation in the velocity field, which can have several implications. These include increased energy extraction efficiency in certain regions due to higher velocities and potential areas of turbulence and vortices in the wake region.
The regions with higher velocities (yellow to red) are likely the most efficient for energy extraction. Placing turbines or other energy-harvesting devices in these areas could maximize the efficiency of the hydropower plant. The wake region (blue area) behind the blade may experience lower pressures and potential flow recirculation. This should be considered in the structural design of the plant to ensure stability and durability. The flow deflection and wake formation could lead to turbulence and vortex shedding, which might affect the performance and lifespan of the hydropower equipment. These factors should be analyzed further to mitigate adverse effects.
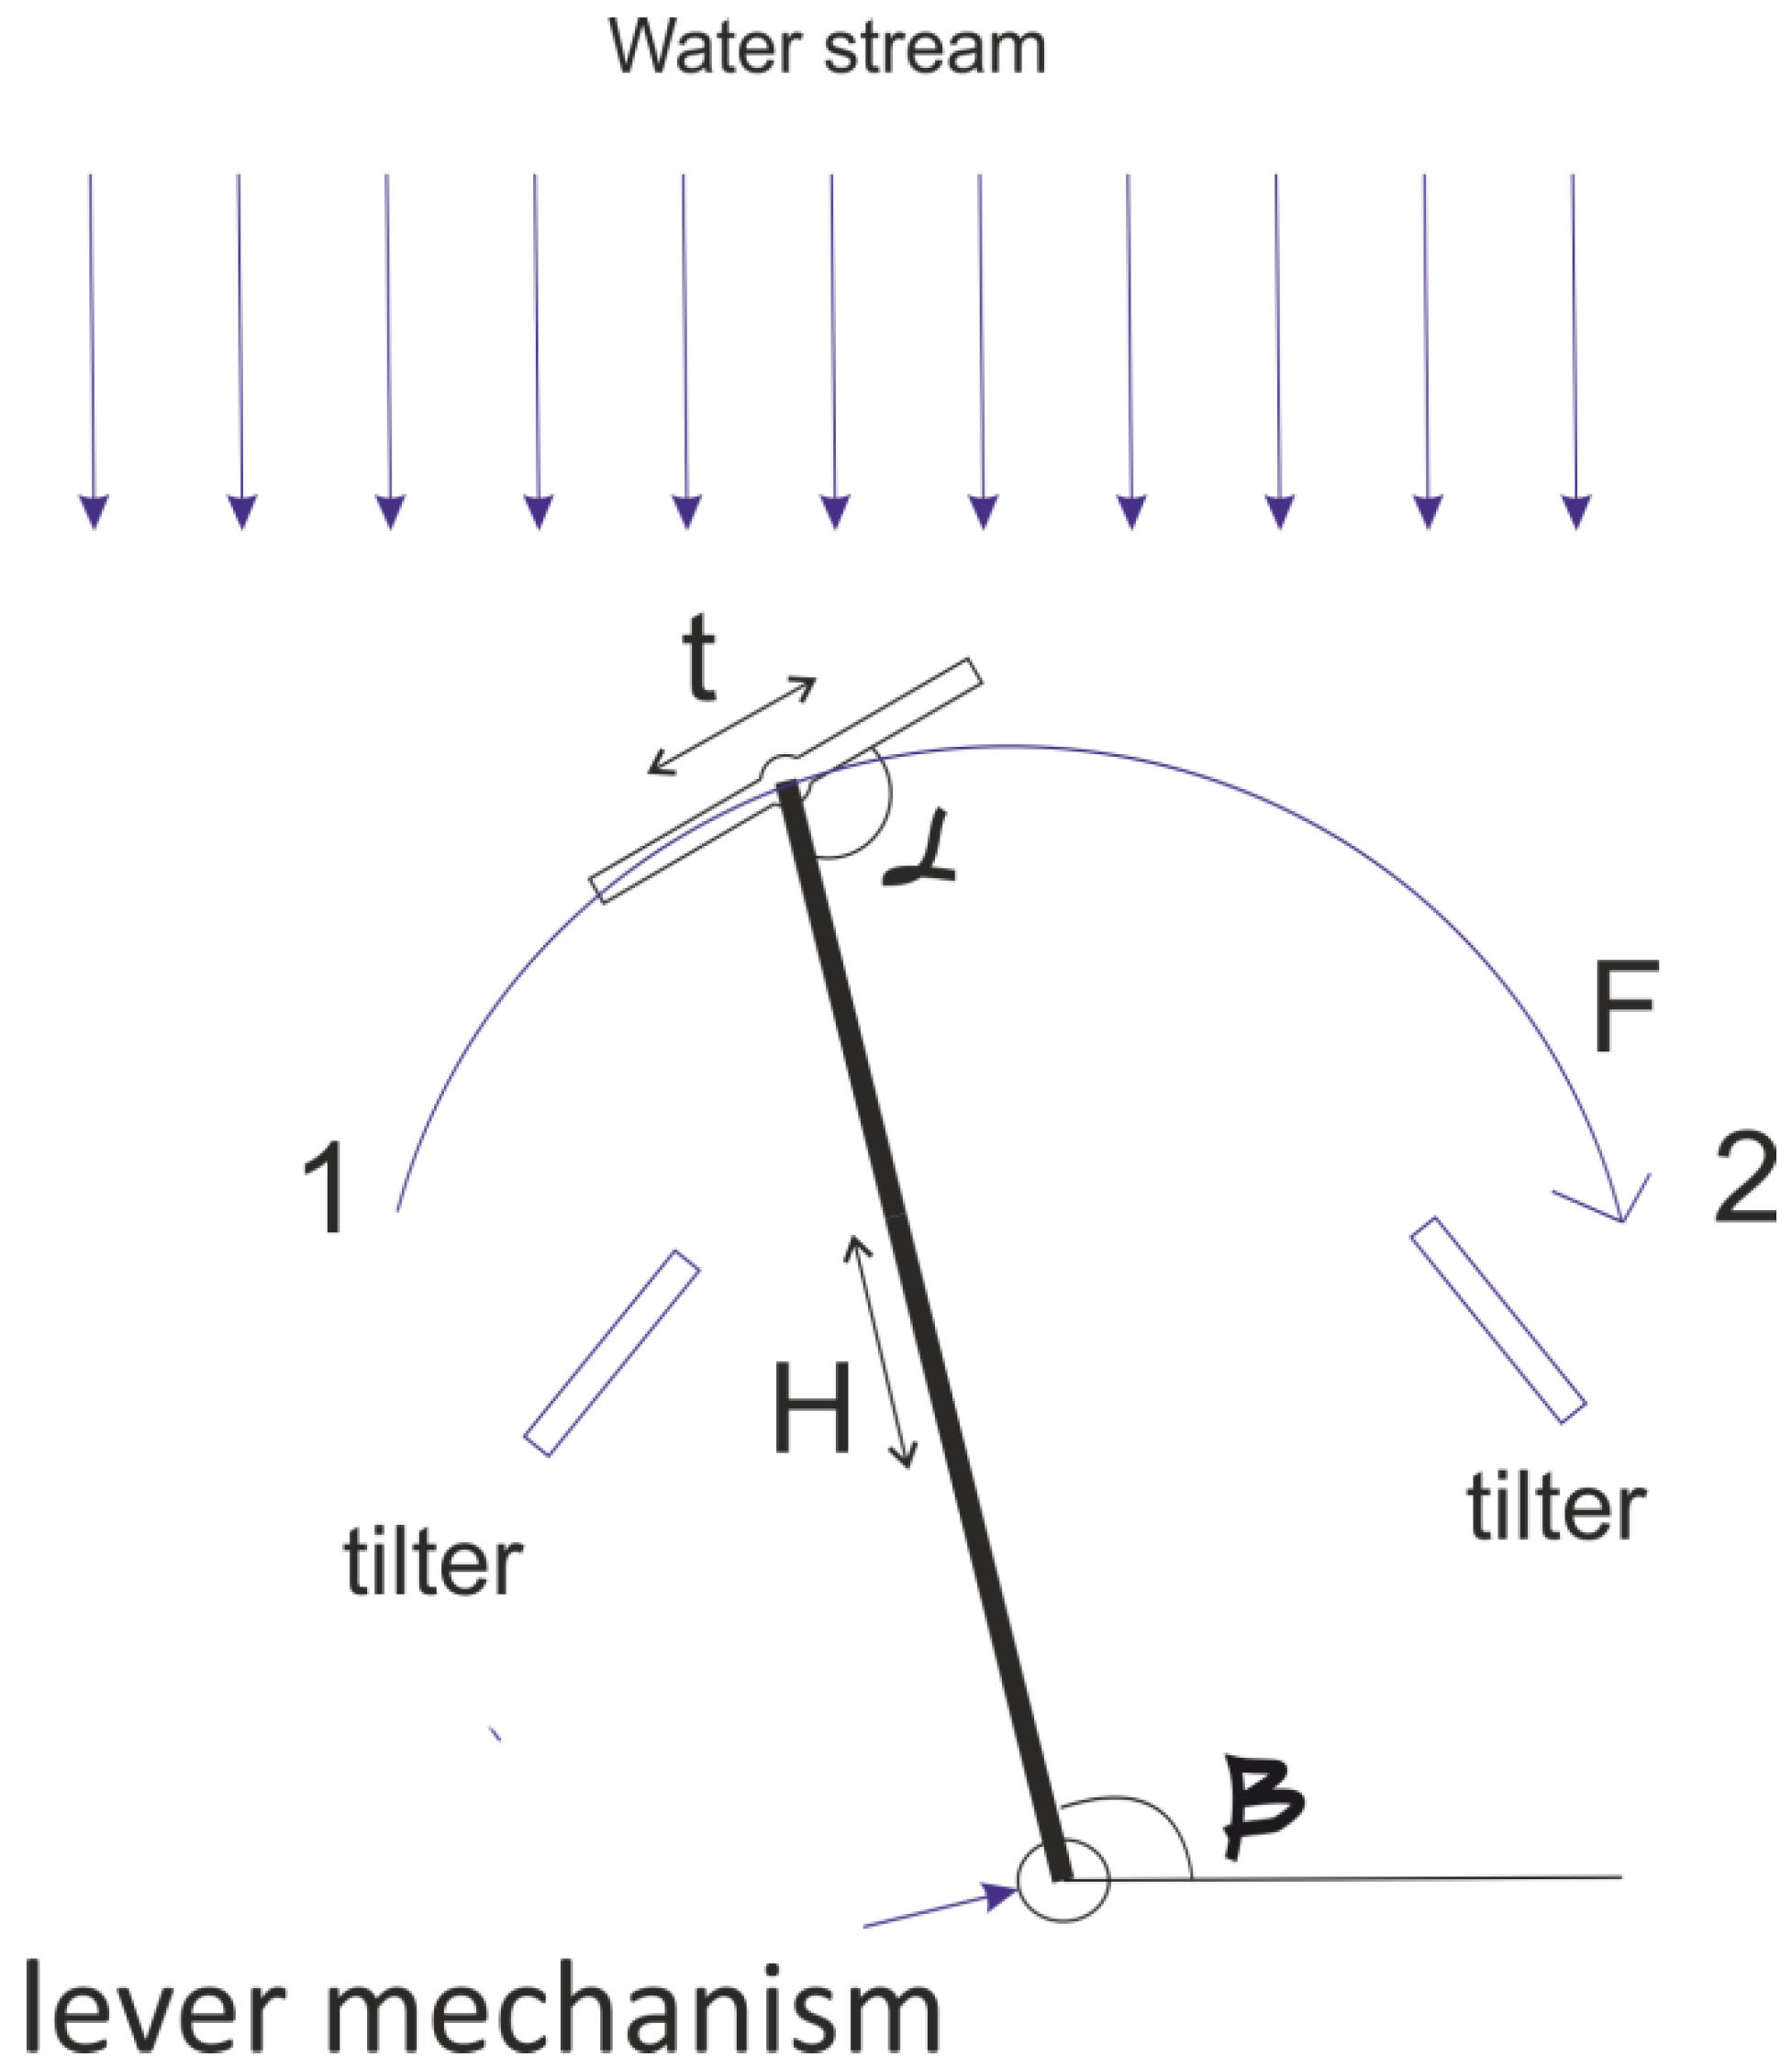
Figure 10 shows the dependence of torque and hydrodynamic force on the working angle for 1-m and 1.5-m blades. Both torque and force show a linear increase with the angle from negative to positive values. The torque values are higher than the force values for the same working angle, indicating that the lever length contributes to the increase in torque. At a lever length of 1 m, the graphs coincide. At a lever length of 1.5 m, the torque value exceeds the force value. The working angle ranges from −40° to +40°. At −40°, the torque is at its minimum (~20 N·m), and it increases steadily as the angle moves towards +40°, where the torque reaches its maximum (~140 N·m).
The graph shows a fairly linear relationship, especially as it moves from −20° to +40°. This linearity suggests that the system responds predictably to changes in the working angle within this range. There is a slight non-linearity and asymmetrical response around the negative angle region, suggesting possible variations in mechanical efficiency or resistance.
The variation in torque at negative angles should be considered when designing control systems to ensure smooth operation. Ensuring the lever operates predominantly within the positive angle range could enhance overall performance and reliability.
Figure 10a illustrates the dependence of torque on the working angle of the lever in a hydropower system. The near-linear increase in torque with the angle indicates an efficient and predictable system, particularly in the range from −20° to +40°. This insight is valuable for optimizing the design and operation of the hydropower plant, ensuring maximum efficiency and performance. The slight asymmetry at negative angles should be addressed to maintain smooth and reliable operation.
Next, we doubled the area of the blade, the length of the lever by one and a half times, and made calculations at a river speed of the same 1 m/s.
The graph in
Figure 10b illustrates the relationship between torque and the angle of inclination of a lever. The horizontal axis (x-axis) represents the working angle of the lever, denoted in degrees (°). The range of the angle is from −40° to 40°. The vertical axis (y-axis) represents the torque, measured in Newton meters (N·m). The torque values range from 0 to 450 N·m.
The graph shows a positive correlation between the working angle and the torque. As the working angle increases from −40° to 40°, the torque also increases. The relationship appears to be nonlinear, with the rate of increase in torque becoming more pronounced at higher angles. At a working angle of 40°, the torque reaches approximately 400 N·m.
Figure 10b suggests that the torque exerted by the lever increases as the angle of inclination increases. This could imply that the lever is more effective at generating torque at higher angles of inclination. This analysis could be useful in mechanical engineering and design of hydropower systems, where understanding the torque generated by levers at different angles is crucial for optimizing performance. Comparing
Figure 10a,b, it can be concluded that the torque is most sensitive to the blade’s surface area.
Increasing the length of the lever from 1 m to 1.5 m, while maintaining the blade area, resulted in an increase from 145 N·m to 177 N·m. At the same time, doubling the blade area to 0.6 m
2 led to an increase in torque to 430 N·m, with a lever length of 1.5 m (
Table 1).
Table 1 shows the dependence of torque on variable geometric parameters of lever length and blade area.
Table 1 shows that the maximum torque of 1000 N·m is achieved with a lever length of 2 m and a blade area of 1.2 m
2. The increase in torque in the peak state with an increase in the lever length from 1 m to 2 m, and an increase in the blade area from 0.3 m
2 to 1.2 m
2, was 145 N·m and 1005 N·m, respectively, and amounted to 860 N·m.
3.2. Calculation Results for a Radial Hydropower Plant
Table 2 shows the dependence of torque on turbine diameter for the radial HPP.
Table 2 shows a nonlinear relationship between the turbine diameter and the torque. Larger turbines yield significantly higher torque, implying greater mechanical advantage or power output. However, the diameter of the turbine is limited by the depth of the river, which is very important when installing in shallow rivers. This relationship is crucial for optimizing turbine design in applications requiring high torque, such as power generation or mechanical drives. Understanding the precise nature of this relationship can help in predicting performance and ensuring efficient and safe design.
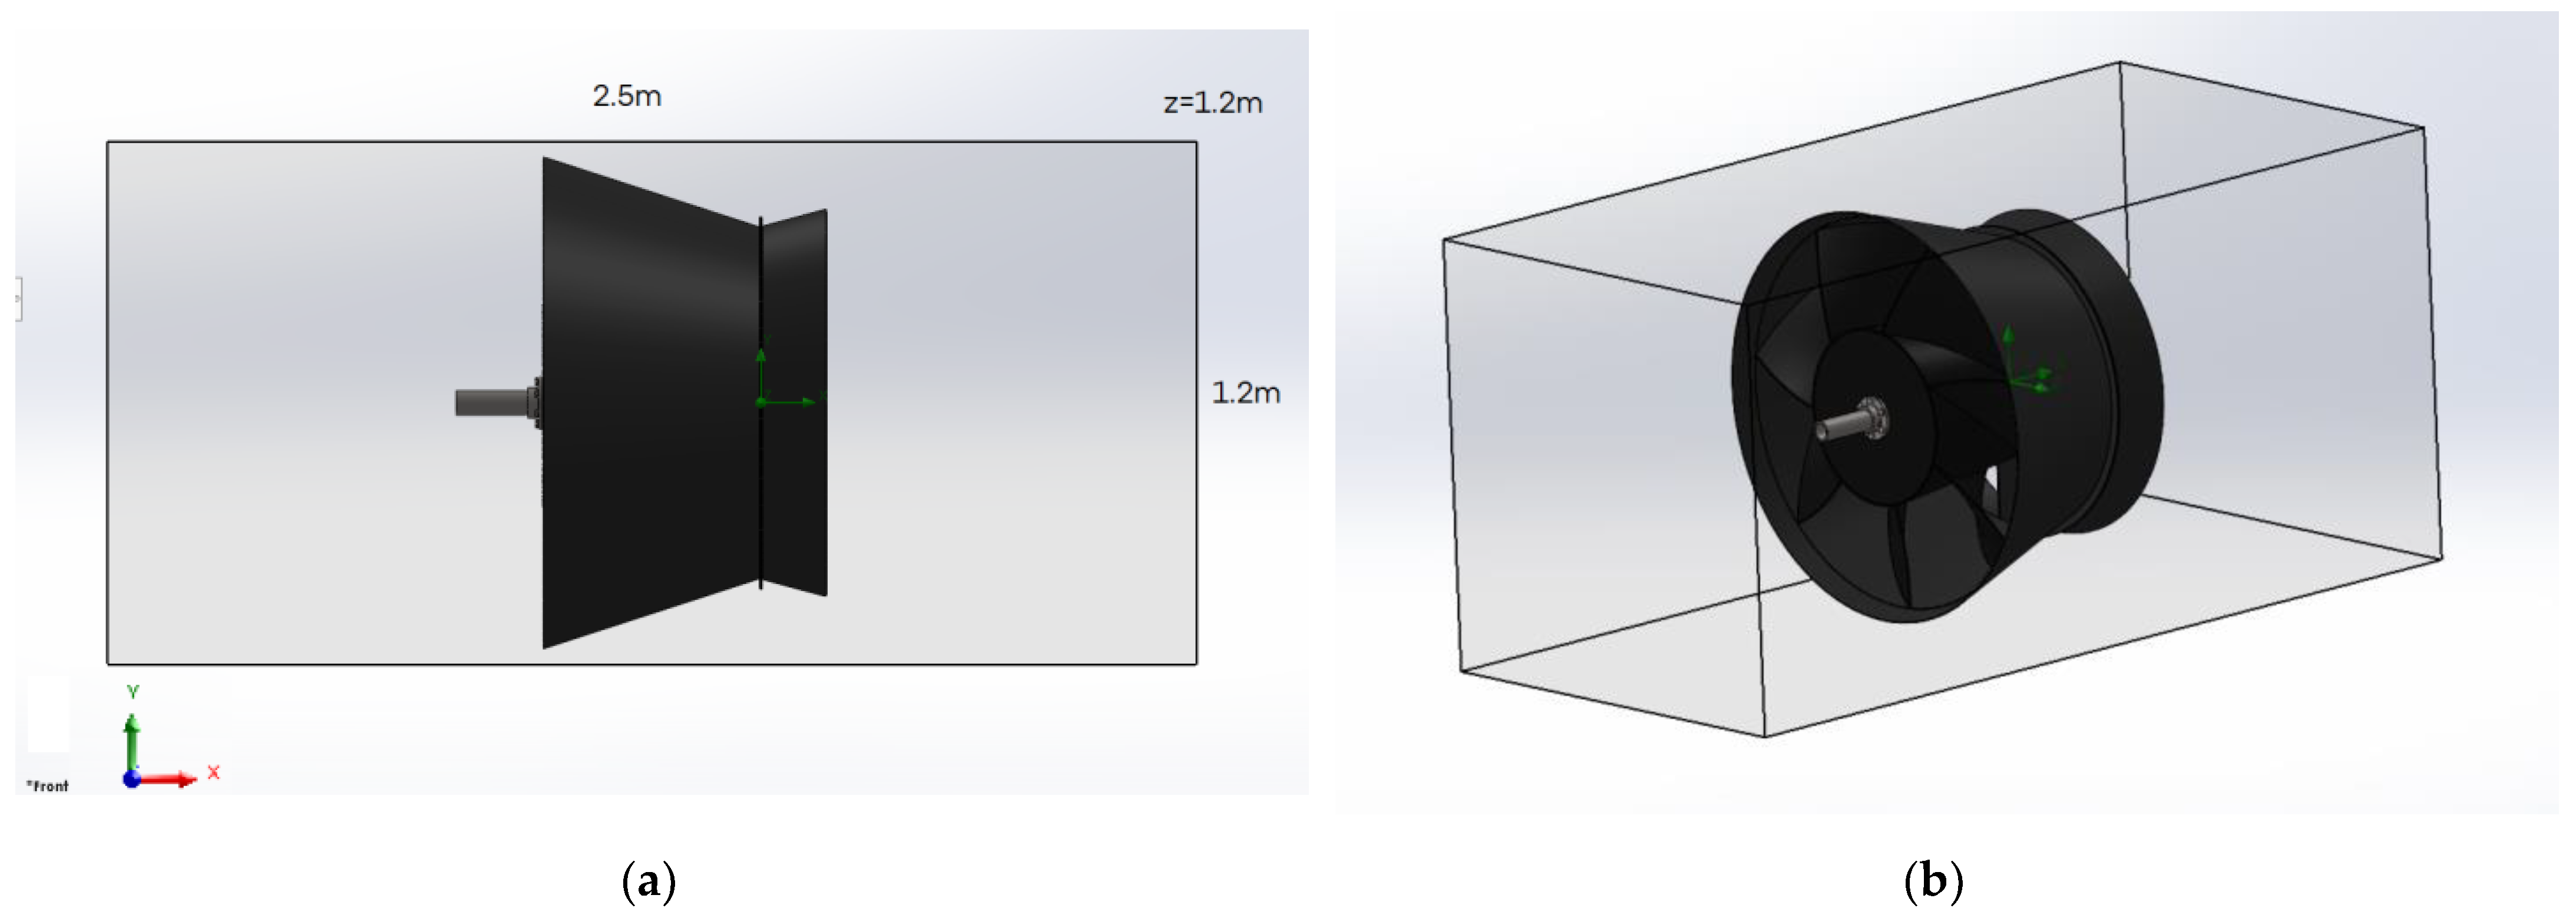
Figure 11 presents a contour plot depicting the velocity distribution within a radial turbine during operation. The plot uses a color gradient, with red representing the highest velocities and blue indicating the lowest. The velocity decreases uniformly towards the center of the hydro-turbine, then, in the expanding part, we can see an increase in the velocity of the liquid flow, as evidenced by the blue and light blue areas in
Figure 11.
A distinct region of high velocity, represented by red and orange contours, is observed at the turbine inlet. This indicates that the fluid entering the turbine possesses a significant amount of kinetic energy. As the fluid flows through the turbine, the velocity decreases gradually, as is evident by the progression of colors towards green and then blue. This velocity reduction is a consequence of the turbine blades converting the kinetic energy of the fluid into mechanical energy. The contour lines suggest a consistent flow pattern, with the velocity contours becoming more concentrated towards the center of the turbine. This indicates that the flow is being guided and directed effectively by the turbine blades.
A noticeable velocity gradient exists near the blades, where the contours are closer together. This indicates a rapid change in velocity in this area, which is likely due to the interaction of the fluid with the rotating blades. A region of very low velocity, represented by blue contours, is observed at the exit of the turbine. This indicates that the fluid has lost most of its kinetic energy and is close to a static state. These flow dynamics are crucial for optimizing the design and performance of the radial turbine.
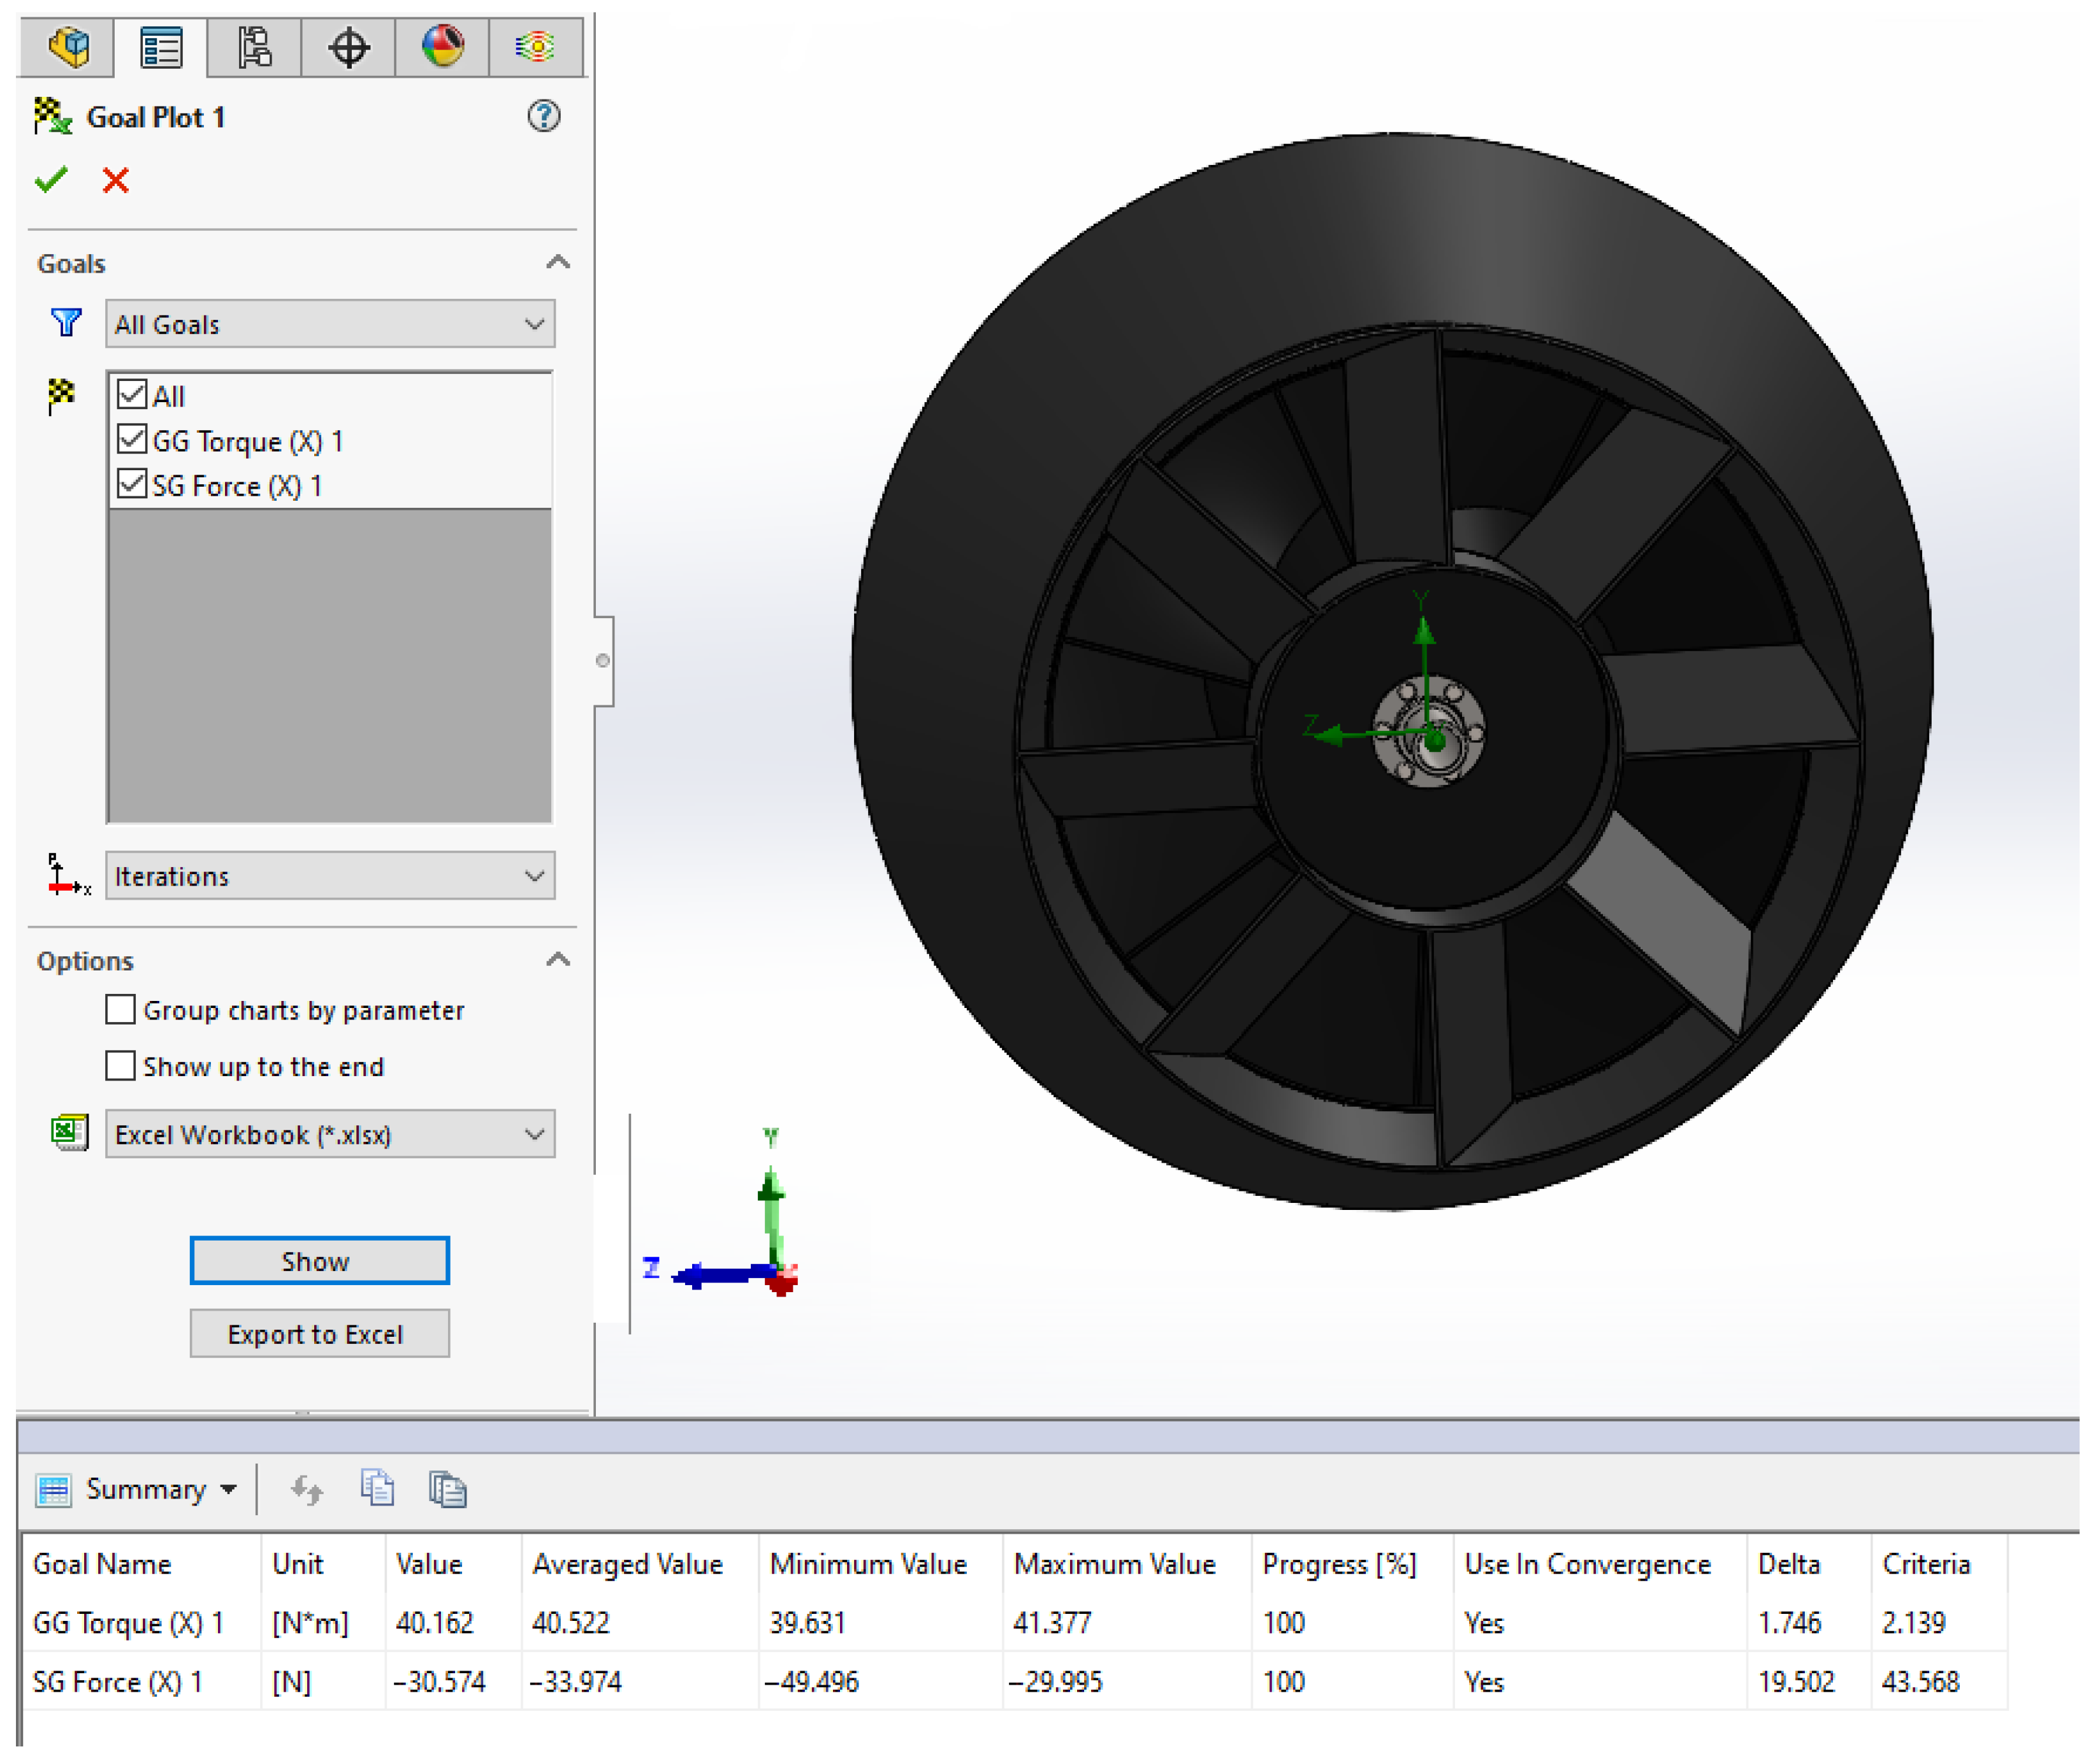
Figure 12 shows the calculated values of the moment of force and the force exerted by the water flow on the blades of the hydraulic turbine. The moment of the force was 40.162 N·m. The total force acting on the hydraulic turbine blades was 30.574 N.
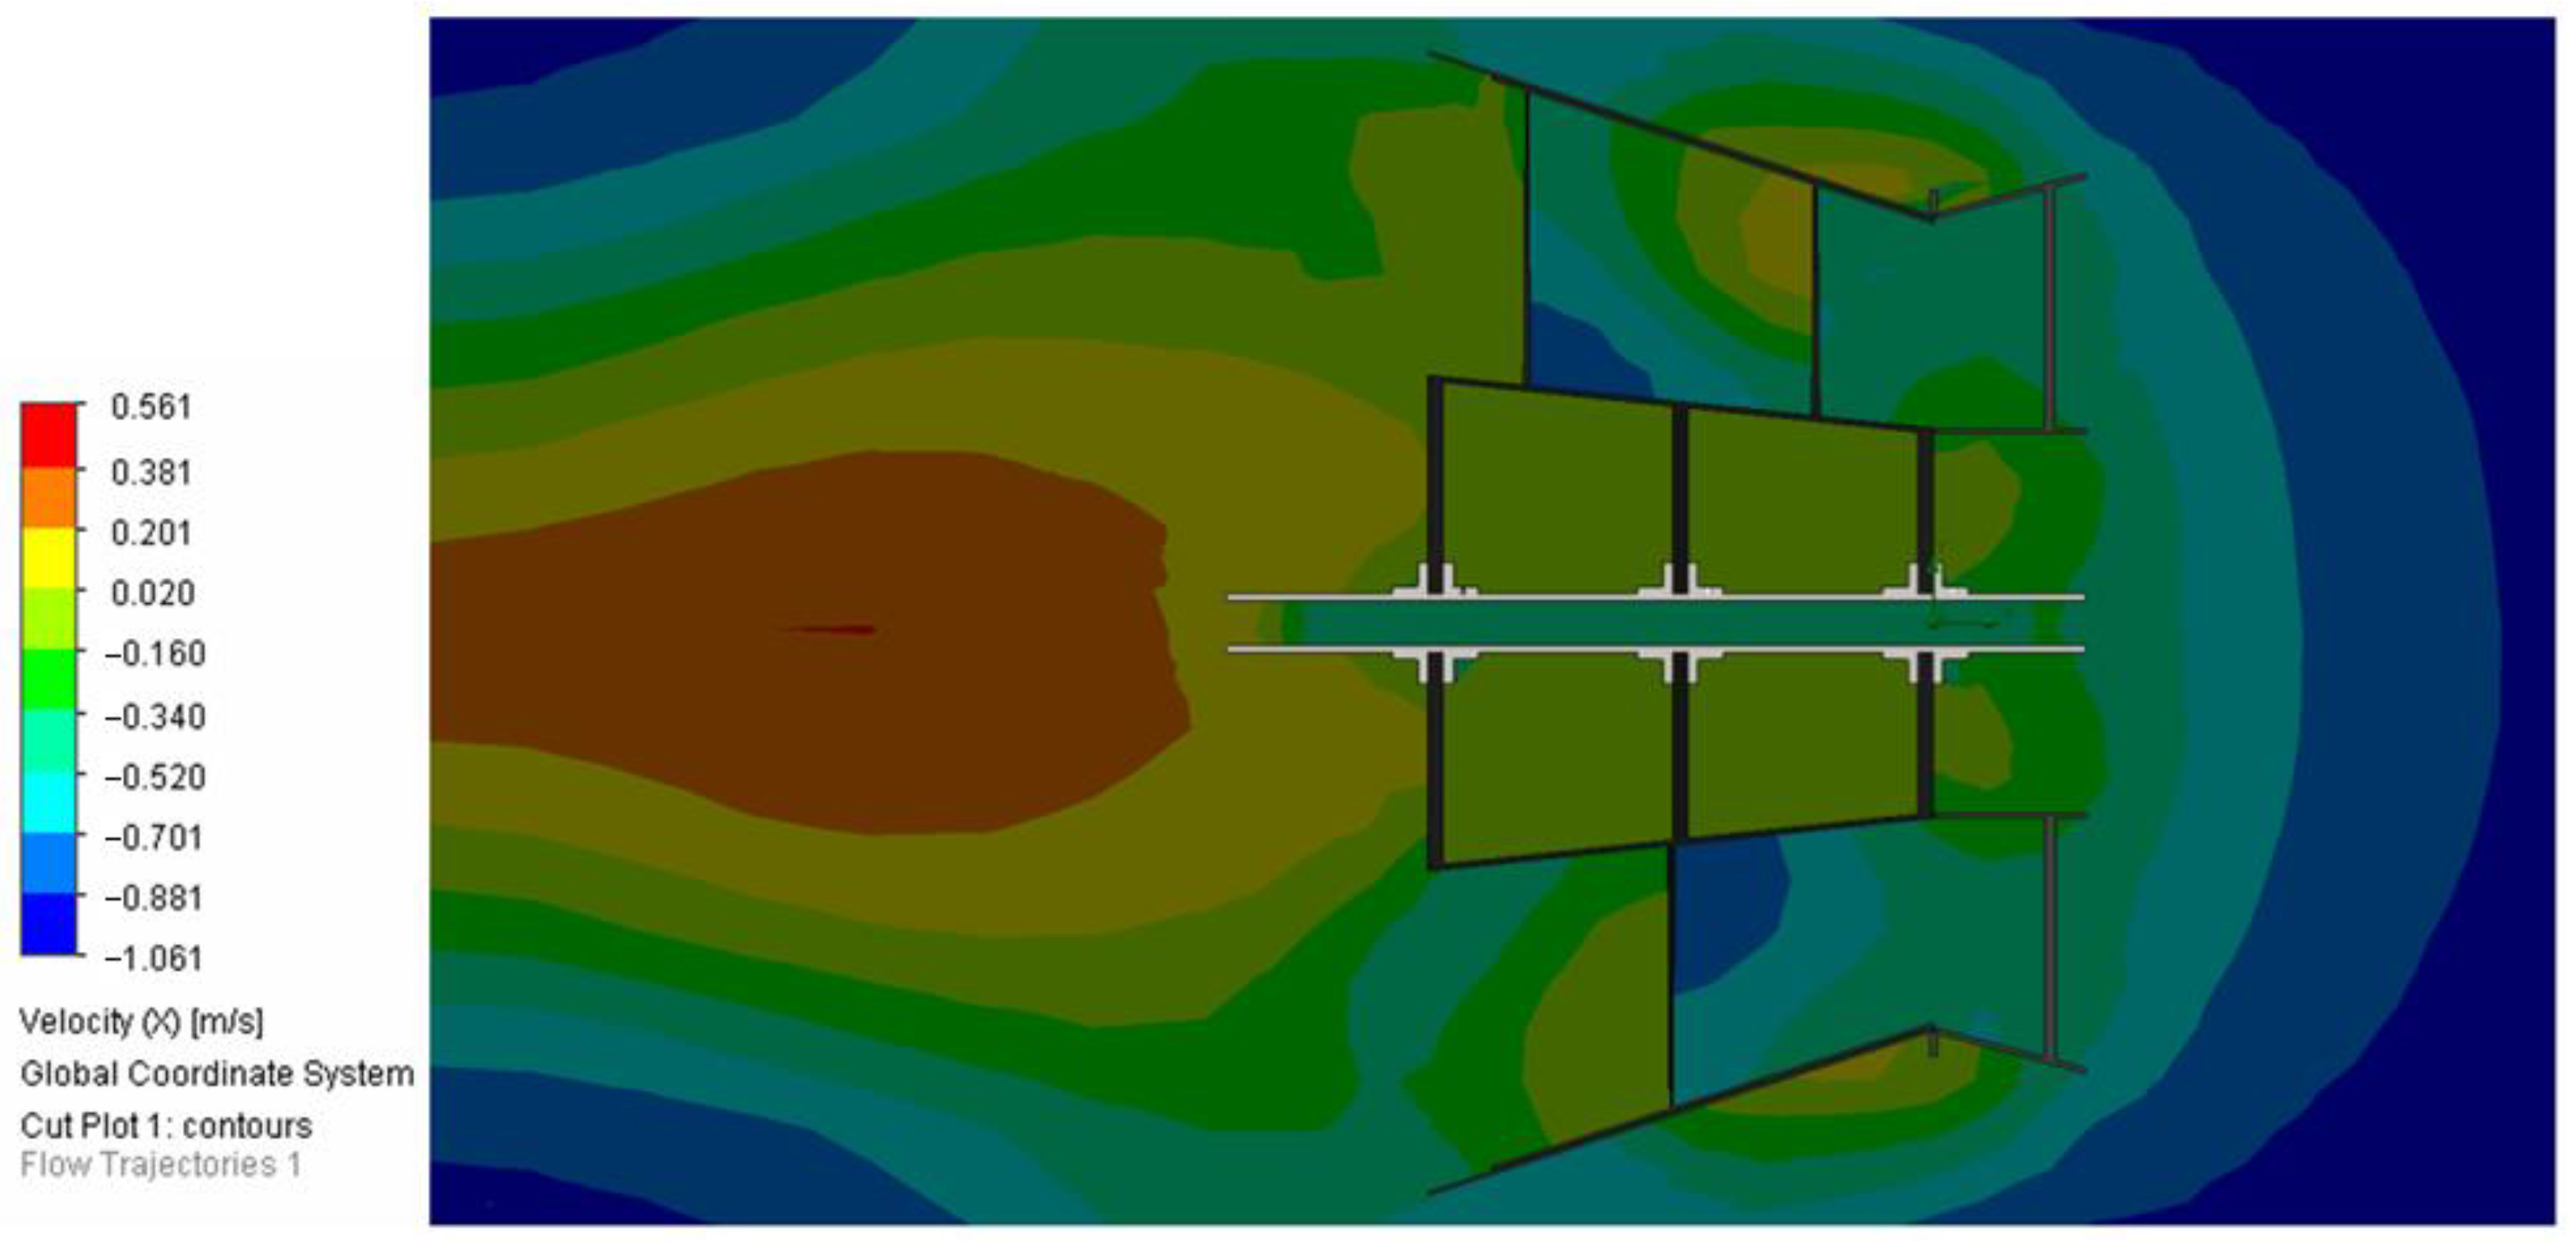
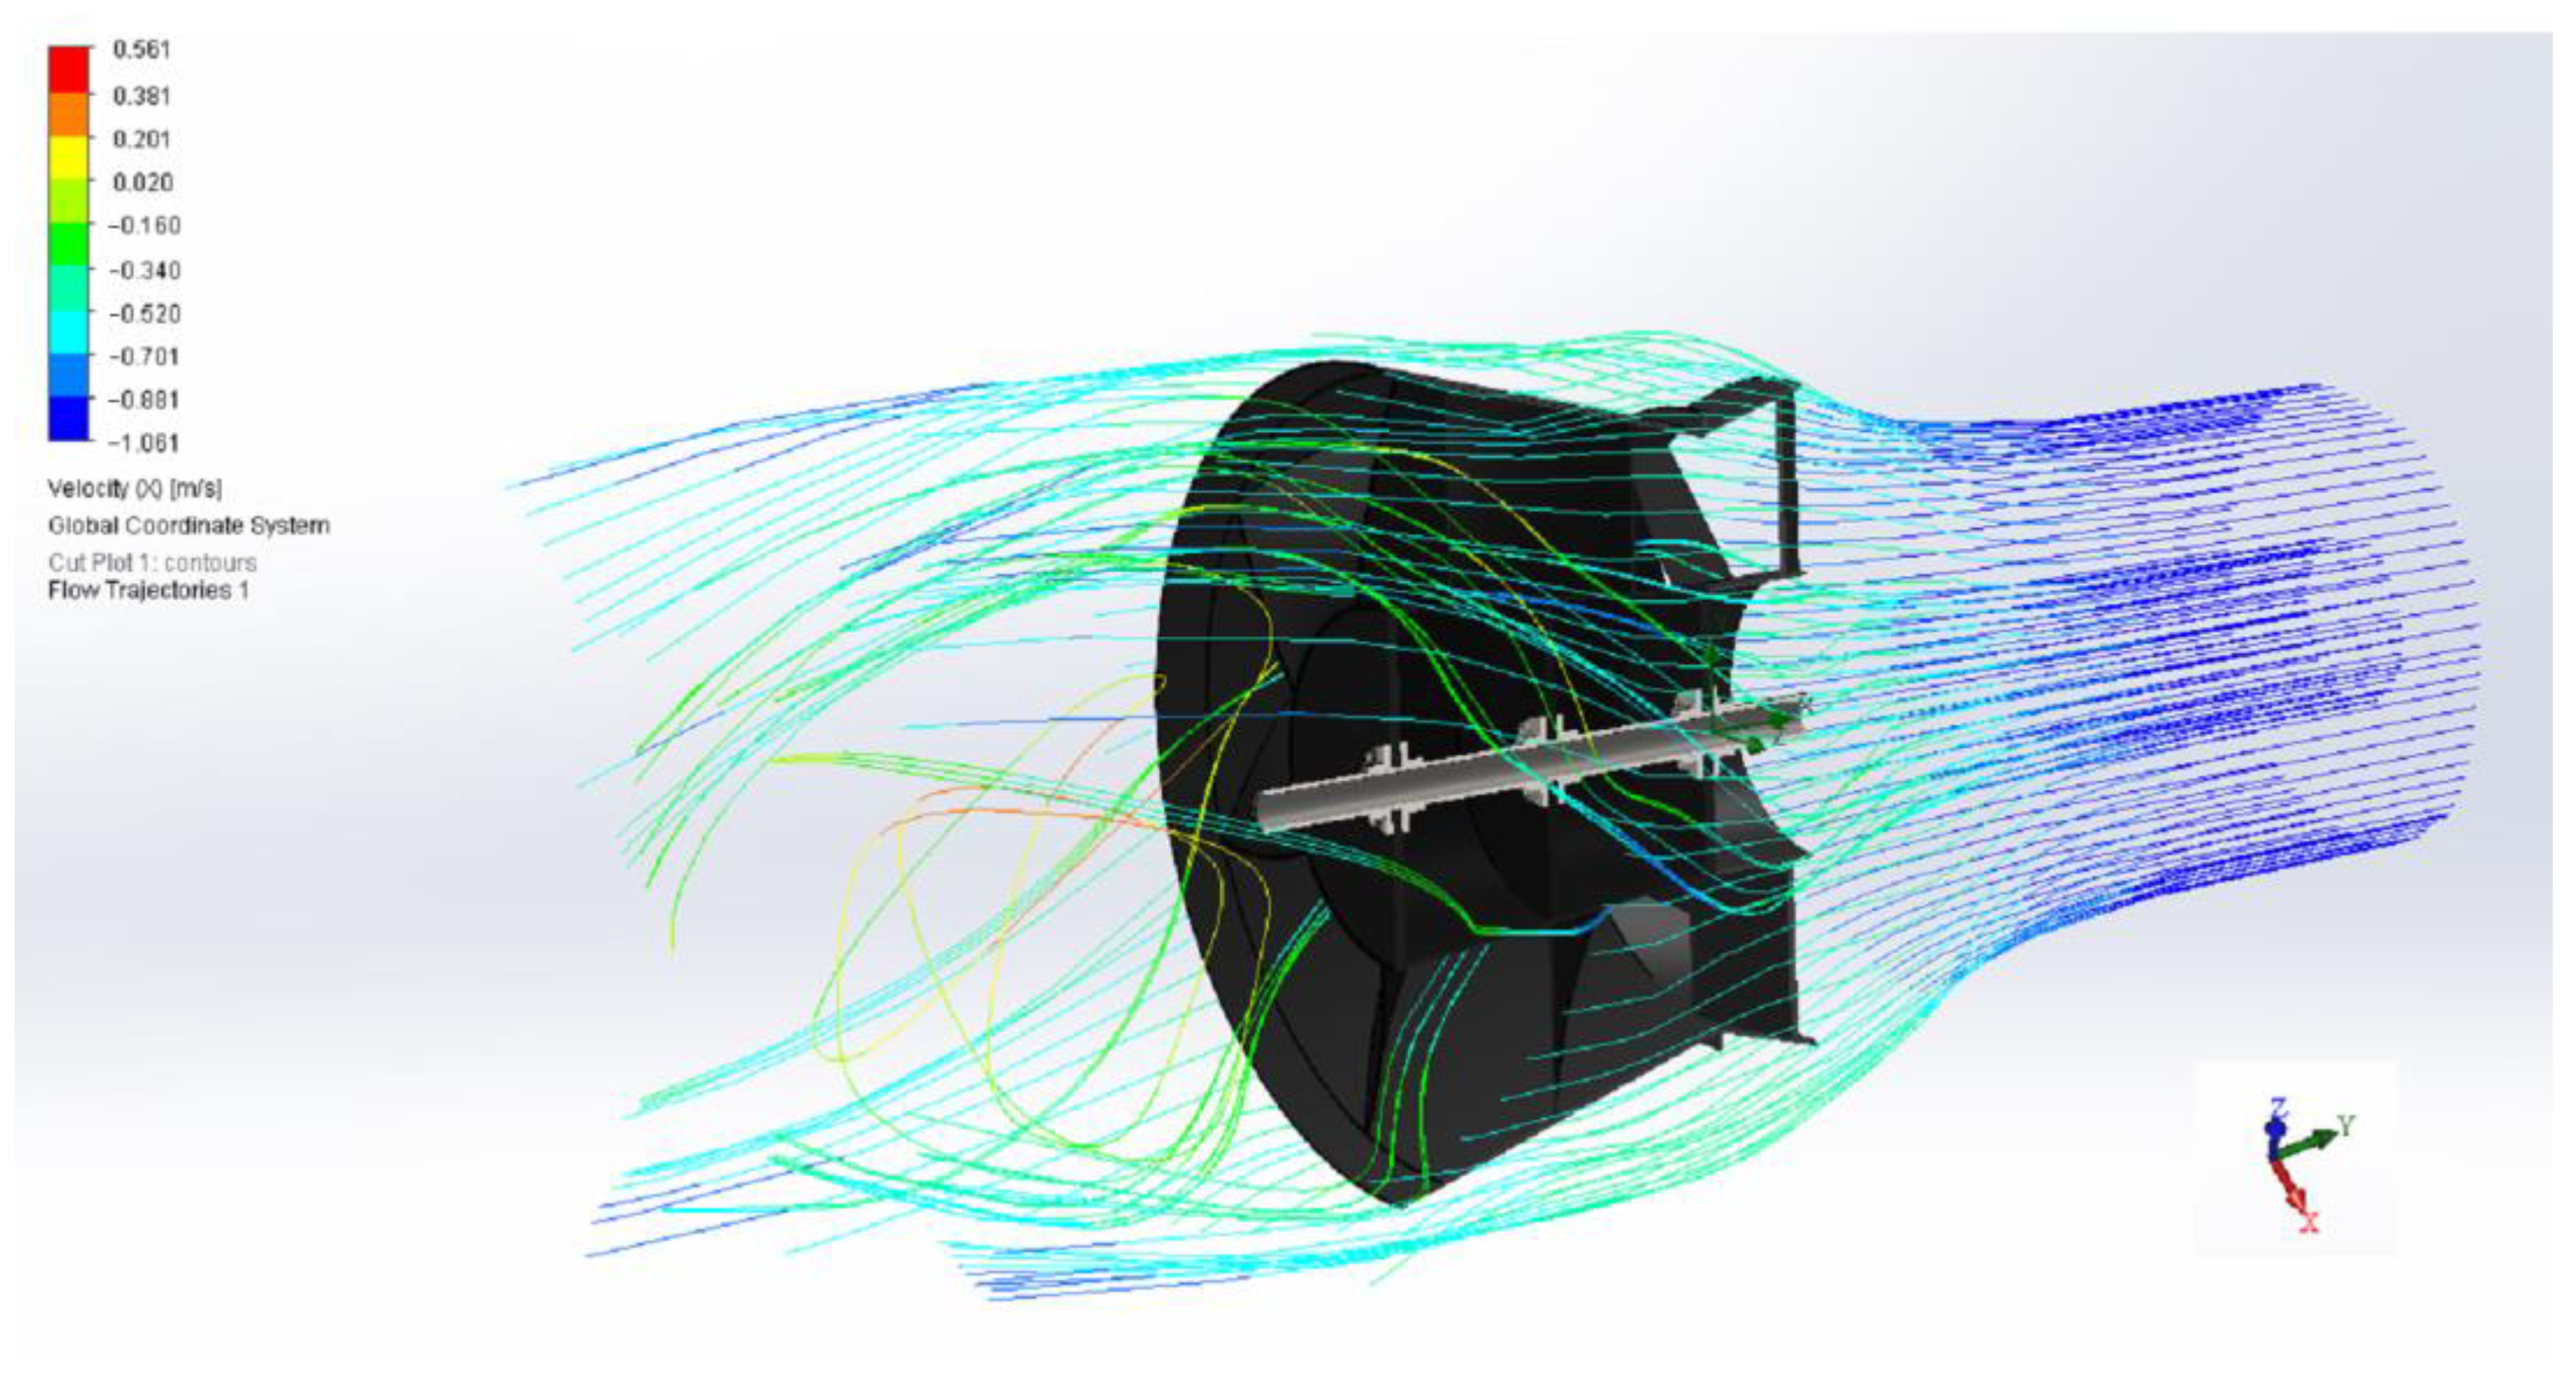
Figure 13 shows the distribution of water flow velocity through the hydraulic turbine channel throughout the entire volume of the structure. The velocity of the water decreases uniformly as it passes through the channel and, due to the decrease, pressure is exerted on the blades of the hydraulic turbine, which leads to rotation of the turbine.
At the inlet (left side of
Figure 13), the water flow is relatively uniform and primarily blue, indicating lower velocities. As the fluid approaches the turbine, the velocity starts to vary more significantly. Within the turbine, there are areas with higher velocities (yellow and green) and lower velocities (blue and cyan). The flow becomes more turbulent as it interacts with the turbine components, causing a mix of velocities. At the outlet (right side), the water flow becomes uniform again but with lower velocities compared to the inlet.
There are areas closer to the end of the turbine blades where the flow velocity increases, and the velocity in this area is 0.88 m/s. These velocities are shown in blue in
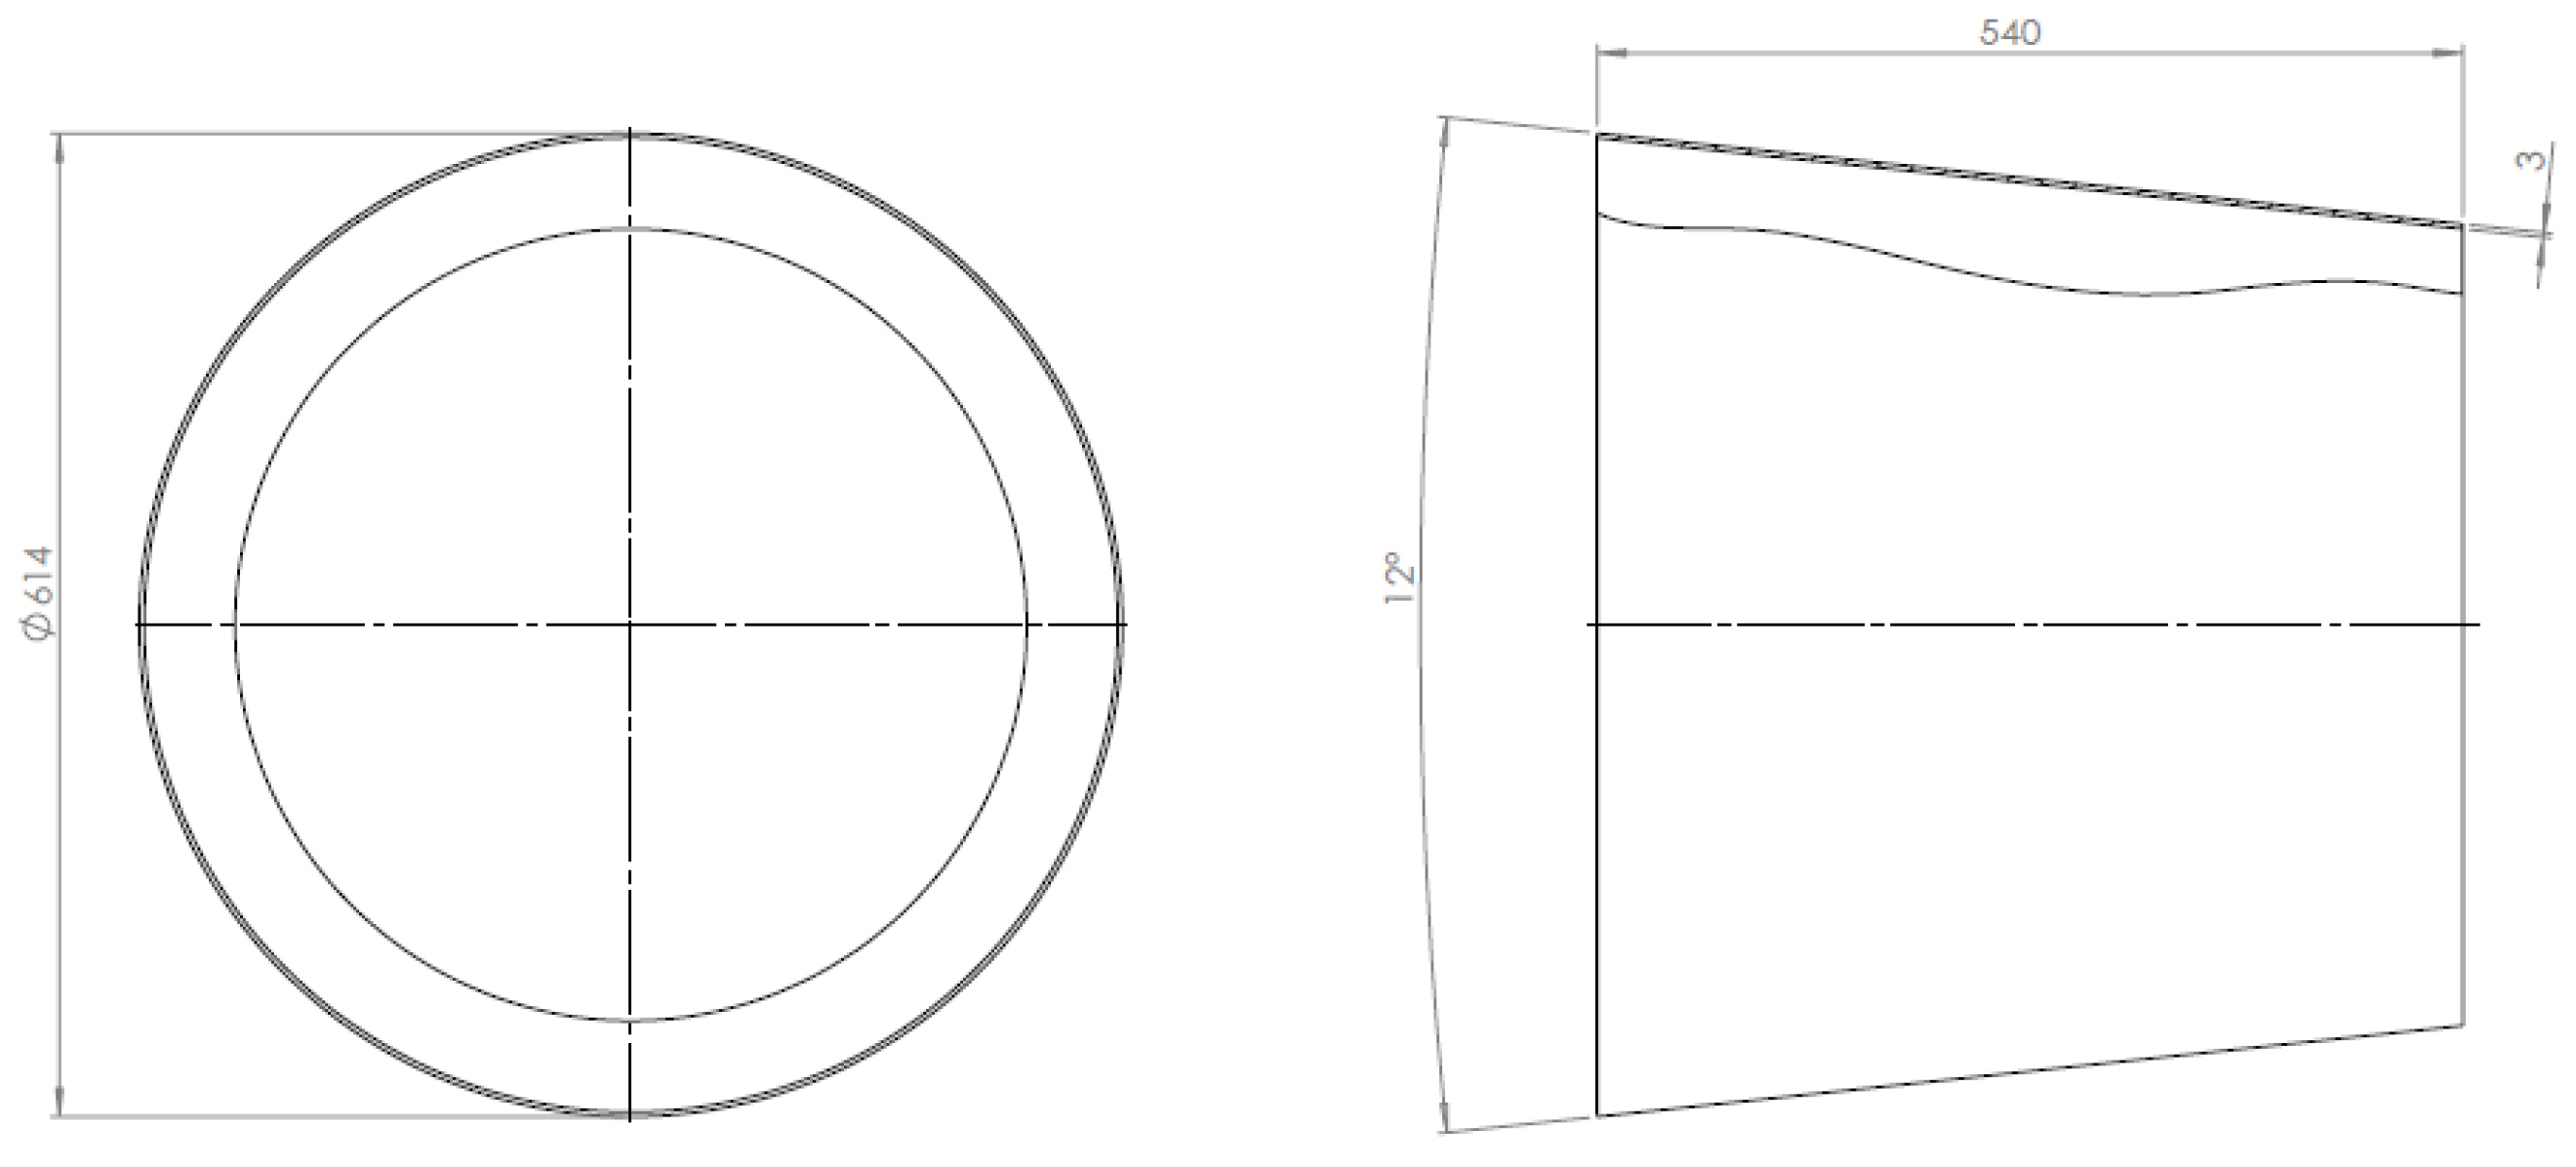
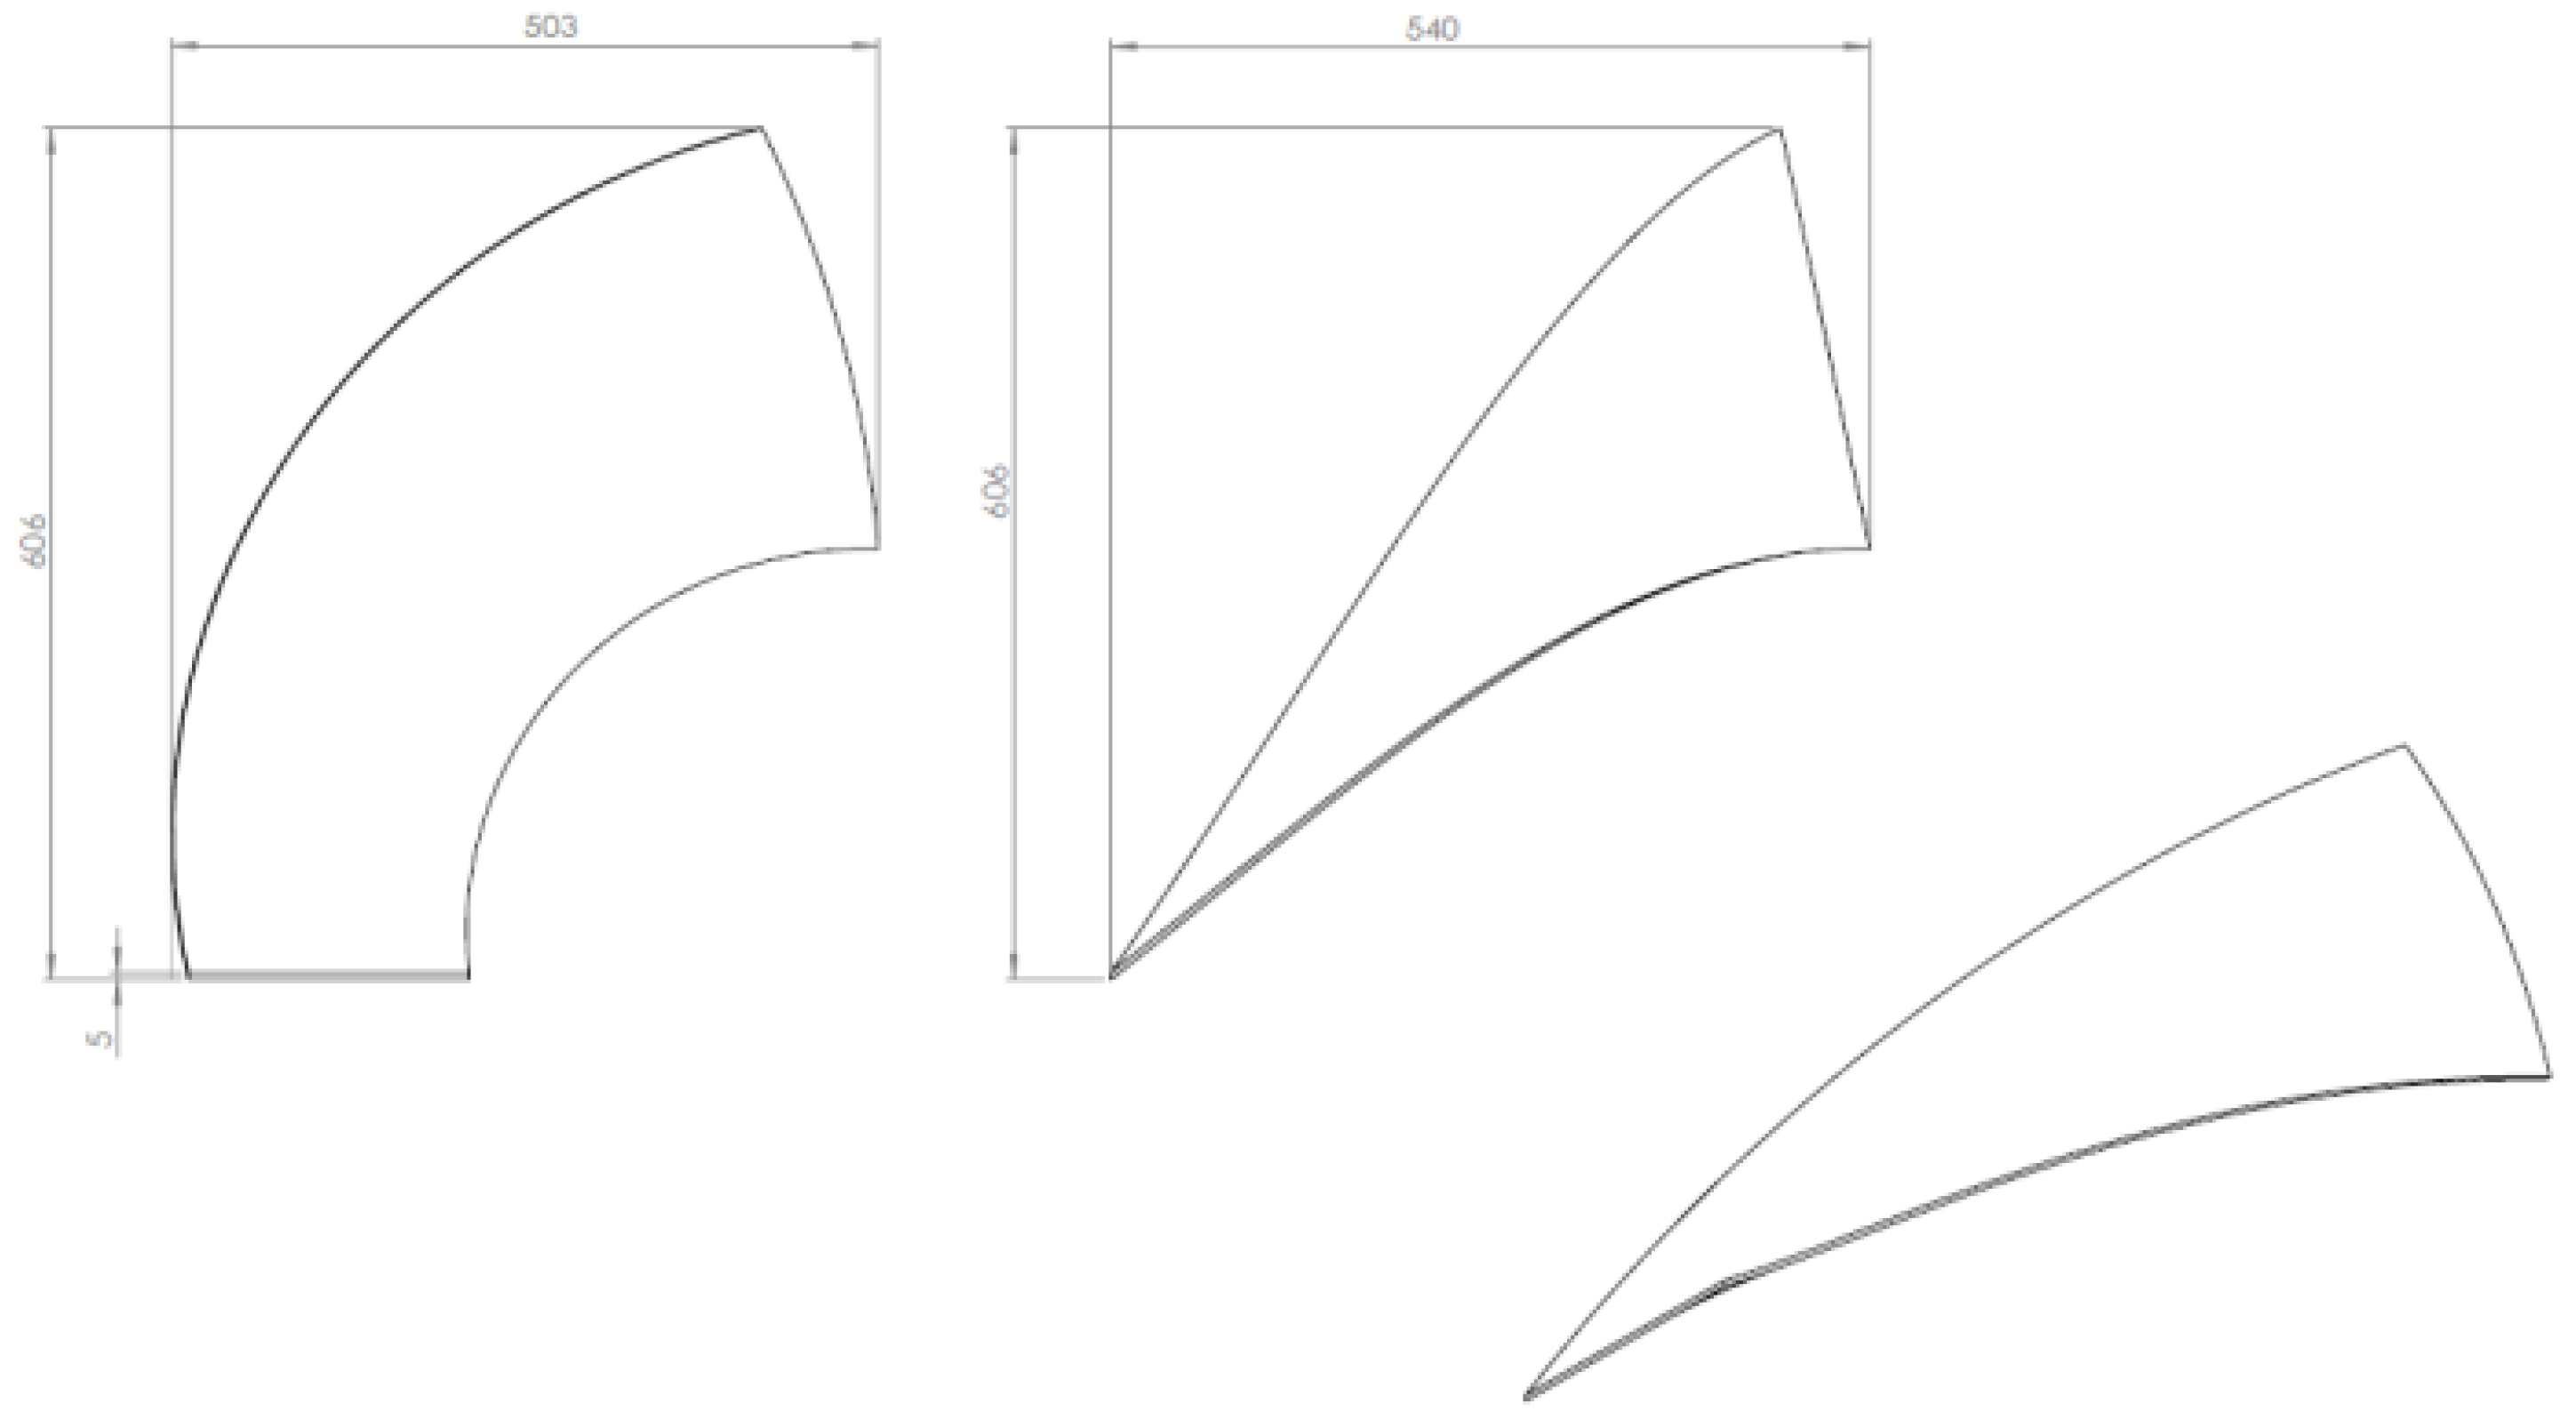
Figure 14. This effect is explained by the fact that when the fluid flow passes from the narrowing channel to the expanding channel, the Venturi effect occurs. If we consider the design of the turbine, we can see the guide channel, which is made in the form of a cone with partitions. Then, water enters the blades of the turbine, the shape of which expands towards the outlet. As a result, we have a typical Venturi pipe design. At the initial moment, the water flow at the inlet to the structure narrows, the pressure drops in this area, and the fluid flow velocity increases according to the Bernoulli equation. But, since the blades of the turbine have a twisted design, the fluid flow, encountering resistance on its way, creates a torque on the shaft of the turbine.
The interaction between the water and the turbine blades creates regions of high and low velocity, indicating the energy transfer between the fluid and the turbine. The variations in flow velocity within the turbine indicate the efficiency of the turbine in converting hydraulic energy into mechanical energy. Uniform flow at the outlet suggests efficient energy extraction, with minimal kinetic energy left in the fluid. The presence of both high and low velocity regions within the turbine indicates effective interaction between the fluid and the turbine blades, suggesting good design and performance of the turbine.
Figure 14 shows a view of the structure from the guide side, which shows the distribution of the force exerted by the water flow on the hydraulic turbine blades.
3.3. Comparison of Pendulum and Radial Hydropower Plants
Both pendulum and radial hydropower plants were compared using the relationship between various parameters and the resulting torque generated by each system.
Considering the pendulum HPP, the torque increases almost linearly with the working angle, indicating a direct proportional relationship. The system exhibits near-linearity in the torque response from −20° to +40°, suggesting predictable performance. There is a slight asymmetry and non-linearity at negative angles, indicating potential variations in mechanical efficiency or resistance. Doubling the blade area and increasing the lever length significantly increases the torque, suggesting a strong influence of these parameters.
Meanwhile, for the radial HPP, the turbine diameter has a nonlinear impact on the torque, with larger turbines producing significantly higher torque. The velocity field within the turbine shows a clear pattern of high velocity at the inlet, gradual velocity reduction as the fluid flows through the turbine, and a low velocity region at the exit. The velocity gradient near the blades suggests a rapid change in velocity due to the interaction with rotating blades.
Regarding the torque generation parameters, the pendulum system exhibits a near-linear relationship between the torque and the working angle, whereas the radial system shows a nonlinear relationship between the torque and the turbine diameter. The pendulum system’s torque is significantly influenced by the blade area and lever length. In contrast, the radial system’s torque is primarily dependent on the turbine diameter. The radial system analysis provides insights into the velocity distribution within the turbine, highlighting the energy conversion process and the flow dynamics.
The pendulum system emphasizes the impact of lever geometry, while the radial system focuses on the role of turbine diameter and the fluid dynamics within the turbine. Comparing the two systems provides a broader understanding of the principles governing hydropower plant design and optimization.
4. Conclusions
The characteristics of two types of small hydropower plants were studied based on their design parameters that affect efficiency. However, both types have both advantages and disadvantages. The advantage of radial hydropower plants is the constant rotation and torque. The advantage of the pendulum hydropower plant is high torque, but the disadvantage is cyclic operation. This disadvantage can be mitigated by installing hydropower plants with lever mechanisms, increasing the torque output in proportion to the magnitude of its increase. The efficiency of the pendulum hydropower plant is higher than that of the Lenyov HPP, if we consider specific characteristics [
33,
34]. At the same time, the pendulum hydropower plant still has high untapped potential, which can be revealed by increasing the lever and blade area.
It has been established that the increase in torque with increasing lever length, without increasing the blade area, is insignificant and amounted to 20 N·m of torque with a blade area of 0.3 m2. In terms of specific area with a diameter of 1 m, the pendulum hydropower plant has up to 12 times higher torque. It has been established that the pendulum hydropower plant best satisfies the requirements for converting a low river speed into high revolutions of a current generator.
However, the current generator needs higher revolutions; therefore, the system will include a gearbox converting the high torque created on the blade into high revolutions (speed), and transmitting them to the current generator. The current generator uses neodymium magnets, which manage well with the task of generating electric current at low revolutions and can be used in these instances. The optimal construction of such a system, taking into account all the losses on the gearbox, is interesting for further study.
The design of the radial hydropower plant was made in the form of a Venturi tube; there was a narrowing part, a middle part, and an expanding part. According to experiments performed using the SolidWorks CAD program, the Venturi effect can be observed. Initially, the flow rate at the inlet reached 1 m/s, then, the speed decreases to 0.3 m/s and at the outlet there is an increase in the flow rate of the liquid, again to 0.88 m/s. This increase in speed can be explained by the Venturi effect. As a result, an increase in the efficiency of the pendulum hydropower plant is possible: firstly, due to the installation of a larger number of blades, which leads to an increase in the contact area and, consequently, to an increase in torque; and secondly, due to a change in the design of the narrowing and expanding parts of the hydro-turbine. In the future, we will consider all possible basic schemes for turning the blade using the Venturi effect. These issues require separate research and optimization. In the future, we will also consider all possible symmetries and improve the basic design of the blade rotation. The results obtained will be taken into account in the manufacture of prototypes of micro-hydropower plants for further studies.
The development of the pendulum hydropower plant concept should give impetus to the development of design solutions in this area. It is necessary to develop designs that provide a limitation of the lever movement and blade rotation. The concept provides many options for blade combinations and their paired operation. In general, the introduction of damless hydropower plants with high torque can be a promising innovative step in small hydropower.
