Article

Optimal Domain-Partitioning Algorithm for Real-Life Transportation Networks and Finite Element Meshes

by
Jimesh Bhagatji
1,
Sharanabasaweshwara Asundi
1,
Eric Thompson
1 and
Duc T. Nguyen
2,*
1
Department of Mechanical and Aerospace Engineering, Old Dominion University, Norfolk, VA 23529, USA
2
Department of Civil and Environmental Engineering, Old Dominion University, Norfolk, VA 23529, USA
*
Author to whom correspondence should be addressed.
Designs 2023, 7(4), 82; https://doi.org/10.3390/designs7040082
Submission received: 16 February 2023 / Revised: 10 May 2023 / Accepted: 15 May 2023 / Published: 27 June 2023
(This article belongs to the Special Issue Design Sensitivity Analysis and Engineering Optimization)

Abstract

:
For large-scale engineering problems, it has been generally accepted that domain-partitioning algorithms are highly desirable for general-purpose finite element analysis (FEA). This paper presents a heuristic numerical algorithm that can efficiently partition any transportation network (or any finite element mesh) into a specified number of subdomains (usually depending on the number of parallel processors available on a computer), which will result in “minimising the total number of system BOUNDARY nodes” (as a primary criterion) and achieve “balancing work loads” amongst the subdomains (as a secondary criterion). The proposed seven-step heuristic algorithm (with enhancement features) is based on engineering common sense and observation. This current work has the following novelty features: (i) complicated graph theories that are NOT needed and (ii) unified treatments of transportation networks (using line elements) and finite element (FE) meshes (using triangular, tetrahedral, and brick elements) that can be performed through transforming the original network (or FE mesh) into a pseudo-transportation network which only uses line elements. Several examples, including real-life transportation networks and finite element meshes (using triangular/brick/tetrahedral elements) are used (under MATLAB computer environments) to explain, validate and compare the proposed algorithm’s performance with the popular METIS software.

1. Introduction

For large-scale engineering/science problems, it has been generally accepted that domain-partitioning algorithms [1,2,3,4,5,6,7,8,9,10] are highly desirable for general-purpose finite element analysis [11,12,13,14,15,16]. Domain-partitioning (DP) procedures can be considered as “divide and conquer” strategies, in which a large-scale (and complicated) problem is divided into several smaller (and simpler) subdomains [17,18,19,20]. This strategy is not only efficient but also blends very well with modern computer hardware with multiple parallel processors (each subdomain can be independently assigned to different processors for further analysis). This paper presents a simple/heuristic numerical algorithm that can efficiently partition any transportation networks and/or any finite element meshes into a specified number of subdomains (usually depending on the number of parallel processors available on a computer) which will result in “minimising the total number of system BOUNDARY nodes” and “balancing the work-loads” amongst the subdomains (as a secondary criteria). This current work represents several novelty features as compared to our previous work, such as unified treatments of transportation networks (using line elements) and finite element (FE) meshes (using triangular, tetrahedral, brick elements) that can be performed through transforming the original network (or FE mesh) into a pseudo-transportation network which only uses line elements. While different partitioning algorithms [21,22,23,24] and current advanced optimisation algorithms [25,26,27] have been reported in the literature, our work will focus on the comparisons with the METIS algorithm/software [21] (since METIS has been most widely used by researchers around the world).
In Section 2, a brief summary of the originally developed seven-step heuristic DD partitioning algorithm is highlighted [1,17]. In Section 3, additional algorithm details/refinements to enhance the performance of the proposed seven-step partitioning algorithm are discussed [18]. In Section 4, real-life transportation networks (under MATLAB computer environments) are used to validate the proposed algorithm and to compare its performance with the popular METIS software [1,21]. For DP finite element analysis (FEA), minimising the number of system boundary nodes will lead to minimising the communication time amongst different processors in parallel computing environments. This time saving usually occurs during the solution of simultaneous linear equations (SLE) for which the SLE can be effectively solved by the mixed direct-iterative sparse solver with appropriated preconditioners [11,18,19,20,28]. Domain-partitioning (DP) examples for finite element meshes are presented in Section 5. Finally, conclusion and suggested future works are discussed in Section 6.

2. A Review of the Basic Seven-Step Heuristic Algorithm for Domain Partitioning

This section reviews the basic seven-step heuristic algorithm for domain-partitioning [1], which provides a systematic approach for decomposing a domain into a predefined number of interconnected subdomains. It provides a step-by-step process for partitioning a domain into smaller subdomains while minimising the number of system boundary nodes.
As shown in Figure 1, we would like to divide the given transportation network with 15 nodes and 24 links into three subdomains in such a way (i) to minimise (or reduce) the total number of system boundary nodes (SBN) and (ii) to achieve a “work-load balancing” among different subdomains. By “eyes observation”, one can see that Figure 1 itself represents such optimum (or near optimum) partitions, with subdomain-1 having nodes N01–N05, subdomain-2 having nodes N11–N15, and subdomain-3 having nodes N06–N10. There are only three SBNs (nodes N05, N08, and N12). However, for a general (large-scale) network with thousands of nodes and links, we need to develop a heuristic DP algorithm to automatically partition (or divide) the original network into a user-specified number of subdomains, which is briefly summarised [1] in the following steps:
Step 1.
Initialise the problem: In this step, we simply provide the input data which describe the network’s connectivity information.
Step 2.
Determine nodal ranks: In this step, the rank for each i t h node can be computed (or defined) as the number of surrounding nodes connected to the i t h node.
Step 3.
Determine first-source (starting) node for each k t h subdomain: The first starting node for the k t h = 1th subdomain will be node N01 because node N01 has the lowest rank.
Step 4.
Determine other-source (starting) nodes for each remaining k t h subdomain: The starting node for each remaining k t h subdomain will also have the lowest rank. Furthermore, its starting node should be far away from the starting node of other subdomains. Based on these criteria (and the “tie-breaking” rules), the starting nodes for the second and third subdomains are nodes N11 and N06, respectively.
Step 5.
Populate more (two-node) LINE elements or (three-node) TRIANGULAR elements simultaneously to each k t h subdomain: In this step, additional nodes are populated into each subdomain based on the following criteria: (i) the newly added node to its k t h subdomain must be connected to at least one of the existing nodes and (ii) the newly added node to its k t h subdomain must be very close to its subdomain’s starting node.
Step 6.
Identify system boundary nodes (SBN): The SBN can be found by creating a loop that will process every (LINE) e t h element of the entire original network. For each e t h (line) element, we can identify its two end-nodes. These two end-nodes are considered as “SBN” if these two end-nodes belong to different subdomains. Otherwise, these two end-nodes will be declared as “interior nodes”.
Step 7.
Renumber the nodes: In this (last) step, the entire original node numbering system will be re-numbered in such a way that all “SBN” will be numbered last. For example, the original SBNs N05, N08 and N012 will be renumbered as SBNs N013, N014 and N015, respectively.

3. Extension of the Basic Seven-Step Domain Partitioning Algorithm for General Finite Element Mesh Partitioning

The seven-step domain-partitioning (DP) algorithm described in the previous sections has been specifically developed for finding the shortest path (SP) of a given transportation network [1]. The objectives of this section are two-fold:
i.
The proposed seven-step DP algorithm can be generalised to include a wider range of different elements in the “elements library,” including two-node LINE elements that can serve as links or arcs in transportation networks or as two-node truss/beam elements in finite element (FE) meshes, as well as three-node triangular elements, four-node quadrilateral elements, eight-node brick elements, and four-node tetrahedral elements used in 2D and 3D FE analysis.
ii.
An emphasis was placed on enhancing the effectiveness of 2D and 3D FE analysis.
We introduce a concept of the “original network” and the “transformed network” to facilitate the application of a general-purpose DP algorithm to problems such as finding the shortest path (SP) of a given transportation network or solving the system of simultaneous linear equations (SLE) of a given 1D, 2D, or 3D FE mesh. The former consists of a set of “original nodes” and “original links, or original elements”, and the latter consists of a set of “pseudo-nodes” and “pseudo-links”, or “pseudo-elements”.
It is rather obvious from Figure 2a–c that
  • The intersection of any (different) pair of (two-node) LINE elements will be a NODE (see Figure 2a).
  • For 2D applications, the intersection of any (different) pair of (three-node) TRIANGULAR elements will be a LINE (see Figure 2b).
  • For 3D applications, the intersection of any (different) pair of (eight-node) BRICK elements will be a four-node SURFACE (see Figure 2c).
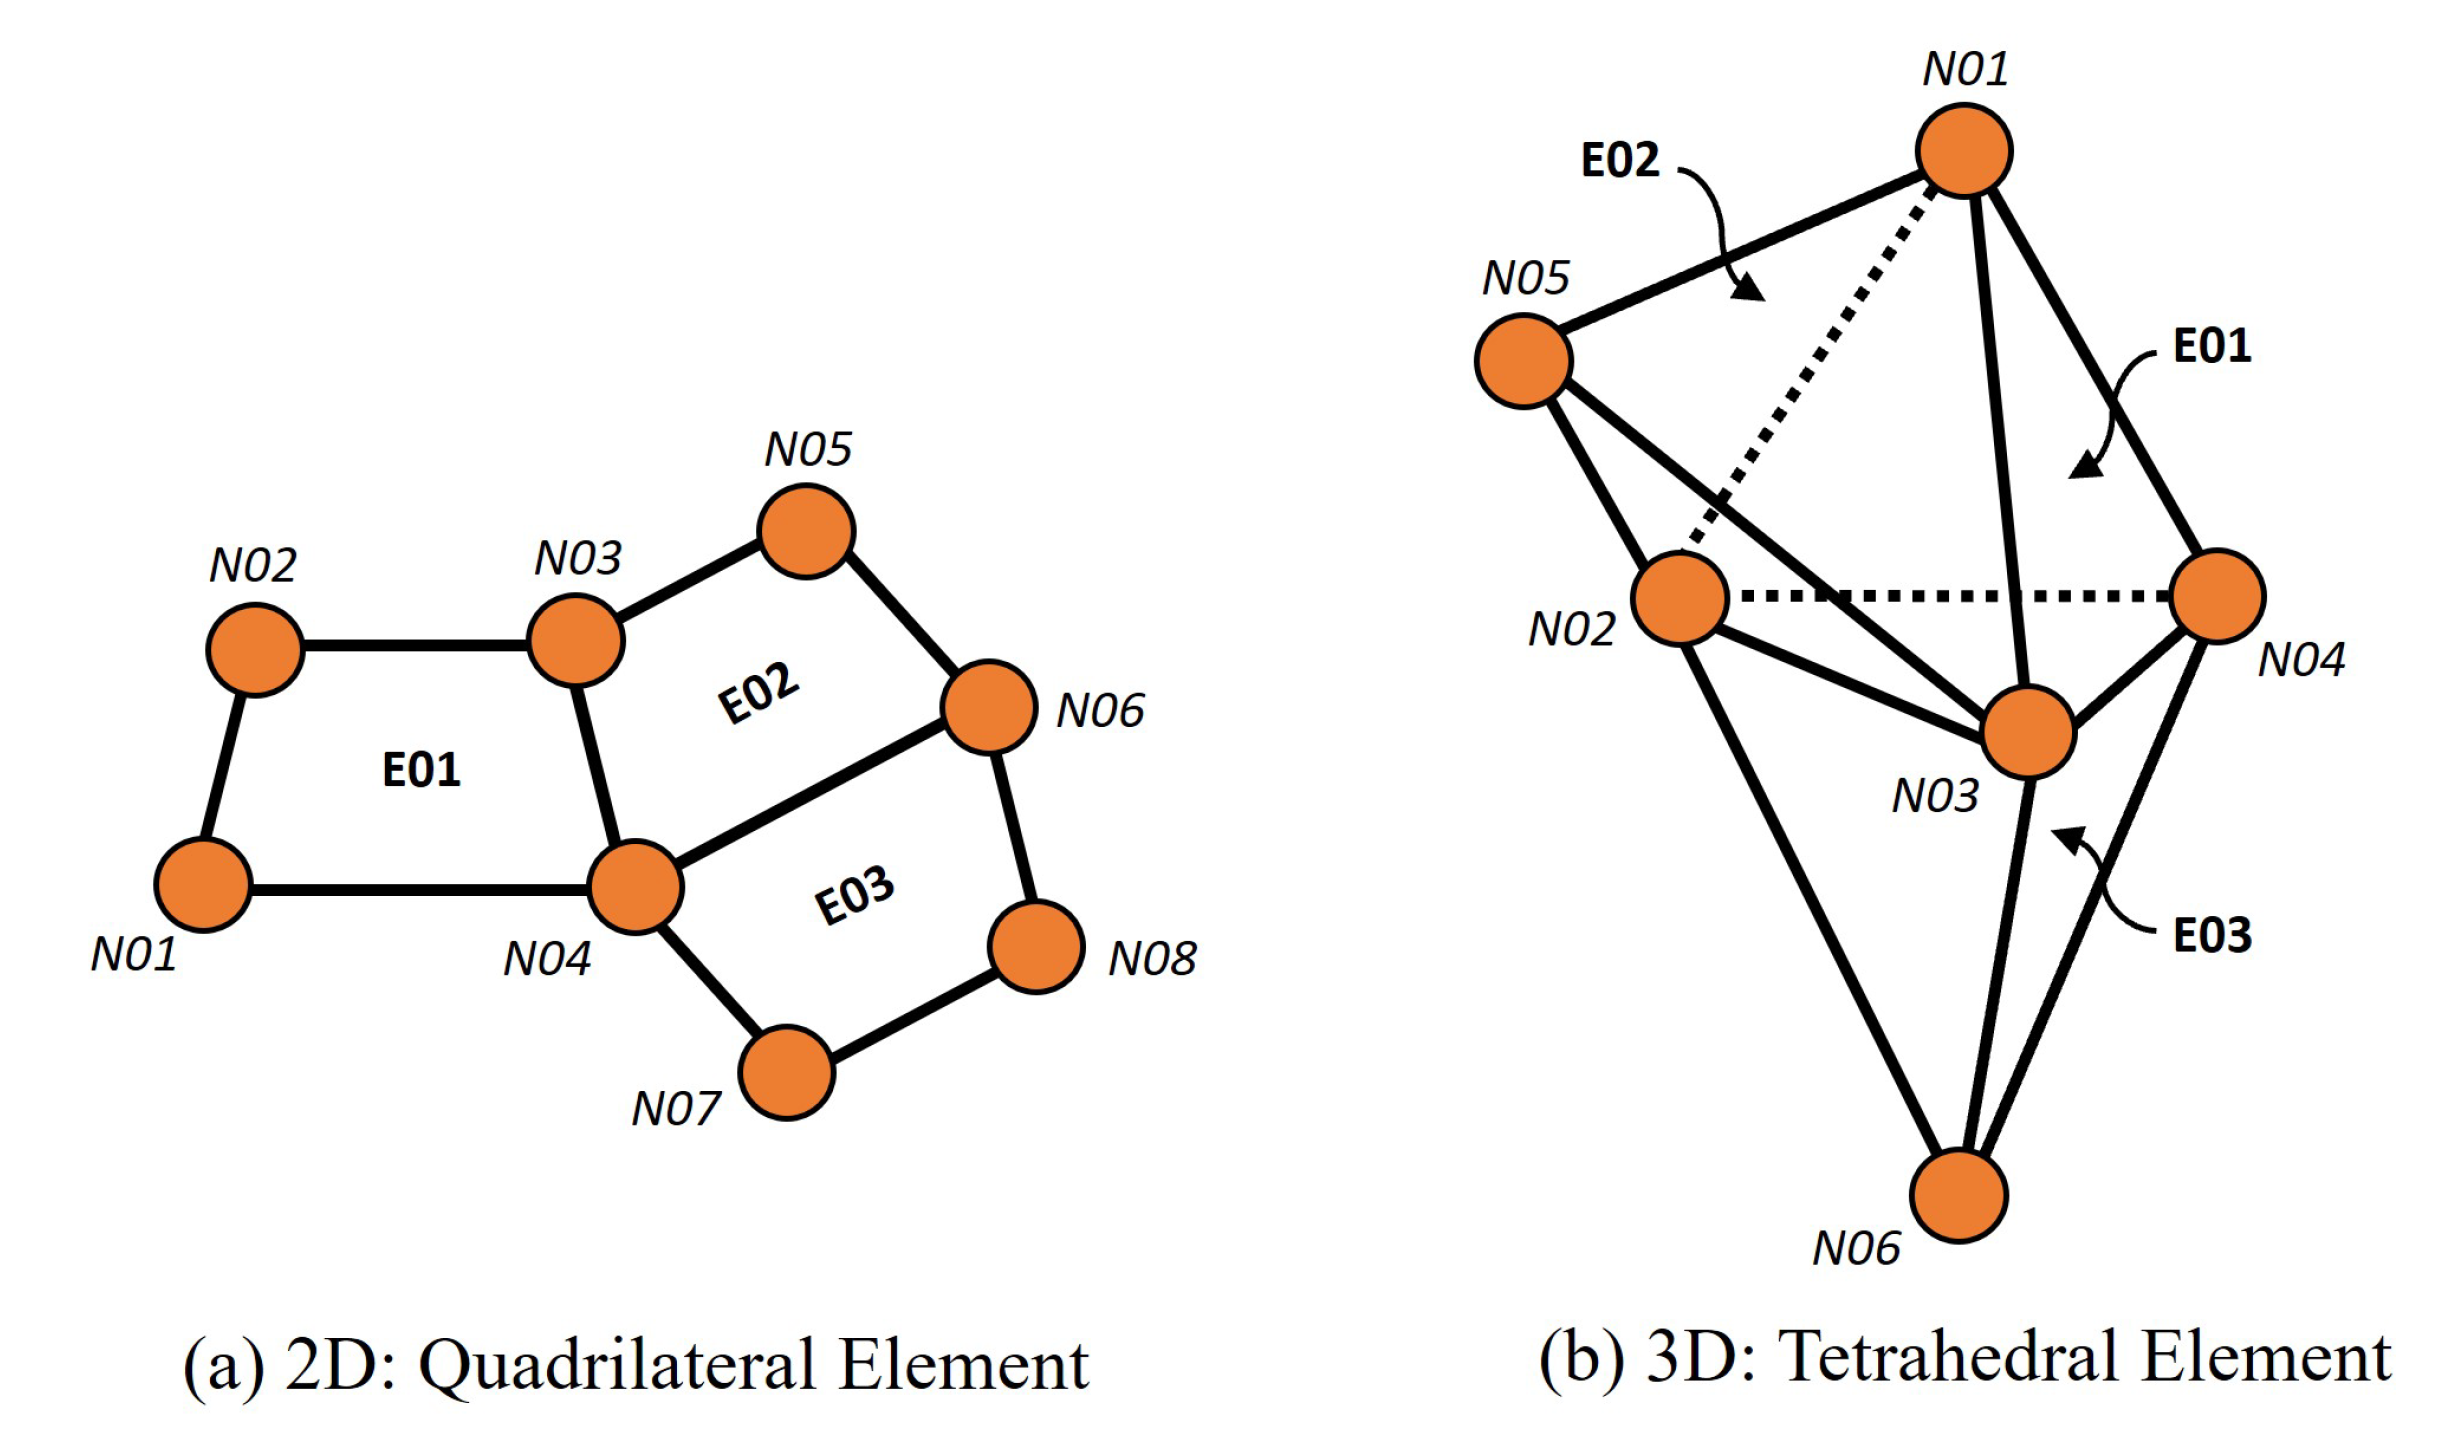
Similarly, for additional 2D applications, the intersection of any (different) pair of (four-node) RECTANGULAR (or QUADRILATERAL) elements will be a LINE (see Figure 3a). For additional 3D applications, the intersection of any (different) pair of (four-node) TETRAHEDRAL elements will be a three-node SURFACE (see Figure 3b).
The following examples will illustrate the “unified ideas” for constructing the “transformed network” from a given “original network” for the purpose of implementing the proposed seven-step domain-partitioning (DP) algorithm.

3.1. Example 1: Two-Node LINE Elements for Truss (or Beam) FEA

Figure 4a displays the “original network” of a 2D truss structure composed of five nodes and seven LINE elements, while Figure 4b shows the associated 7 × 3 “element connectivity” matrix data. The first column (under the label “E”) denotes the seven truss element numbers, while the second and third columns specify the two nodes associated with each LINE (or truss) element. For instance, element E01 is connected from node N01 to node N02. The numbers inside the small circles represent the “rank” associated with each node [1,17]. For example, node N02 has a rank of three, as it is surrounded by nodes N01, N03, and N04, as well as three LINE elements E01, E03, and E04. Likewise, node N03 (Figure 4a) has a rank of four, as it is bordered by LINE elements E02, E03, E05 and E06. To construct the corresponding “transformed network”, the following rules are applied:
i.
The “transformed network” is constructed by assigning a “pseudo-node" to each actual LINE element in the original network, resulting in a total of seven pseudo-nodes in this example, which are labelled from E01 to E07 (see Figure 5a).
ii.
The number of “pseudo-links” in the “transformed network” corresponds to the total number of INTERSECTIONS between different pairs of LINE elements in the original network. As shown in Figure 5a, node N01 is the INTERSECTION of two LINE elements E01 and E02; thus, only one INTERSECTION (between E01 and E02) will be allocated a pseudo-link.
Figure 4a shows node N02 as the INTERSECTIONS of three (LINE) elements E01, E03 and E04, resulting in three INTERSECTIONS (between E01 and E03, E01 and E04, and E03 and E04 pairs). The same figure shows node N03 as the INTERSECTIONS of four (LINE) elements E02, E03, E05 and E06, resulting in three INTERSECTIONS (between E02 and E03, E02 and E05, E02 and E06, E03 and E05, E03 and E06, and E05 and E06 pairs). In general, if a node is an INTERSECTION of “n” (LINE) elements, the number of INTERSECTIONS ( N i n t ) of that node can be calculated using Equation (1). As an example, if a node is the INTERSECTION of five (LINE) elements, it will have ten INTERSECTIONS [1 + 2 + 3 + 4].
N i n t = i = 1 n 1 i
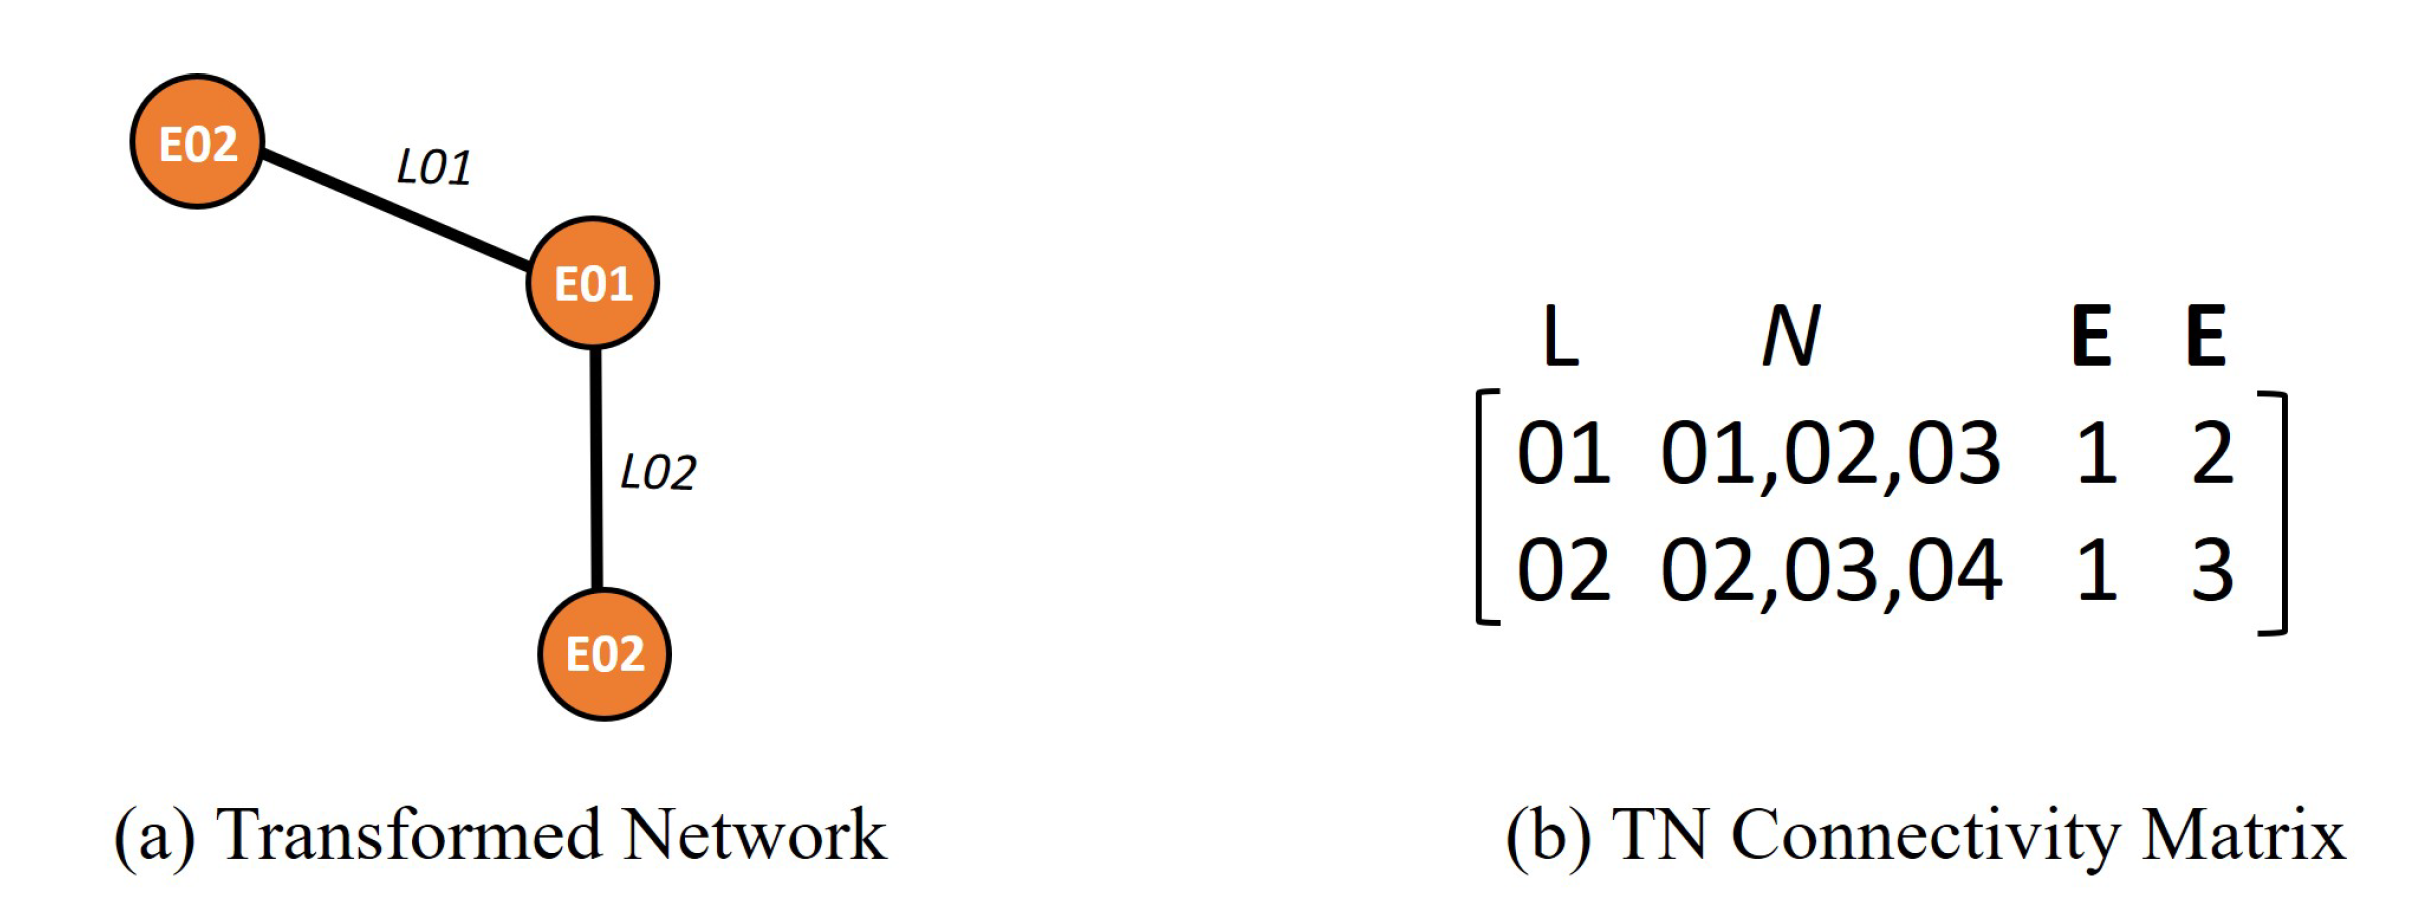
The number of INTERSECTIONS in the truss example of Figure 4a is equal to the total of the ranks at each node, which is 1 (at node N01) + 3 (at node N02) + 6 (at node N03) + 3 (at node N04) + 1 (at node N05) = 14. This number of intersections is also equal to the number of “pseudo-links” in the “transformed network”, labelled as L01, L02, L03, …, L13, L14, as shown in Figure 5a,b. The third and fourth columns of Figure 5b indicate the pair of elements that intersect at each node, as indicated in the second column of Figure 5b. For example, row 8 of the 14 × 4 matrix in Figure 5b shows that pseudo-link L08 consists of elements E03 and E05 and intersects at node N03, while row 4 of the same matrix shows that “pseudo-link” L04 consists of elements E02 and E03 and intersects at node N03.

3.2. Example 2: Three-Node TRIANGULAR Elements for Finite Element Analysis (FEA)

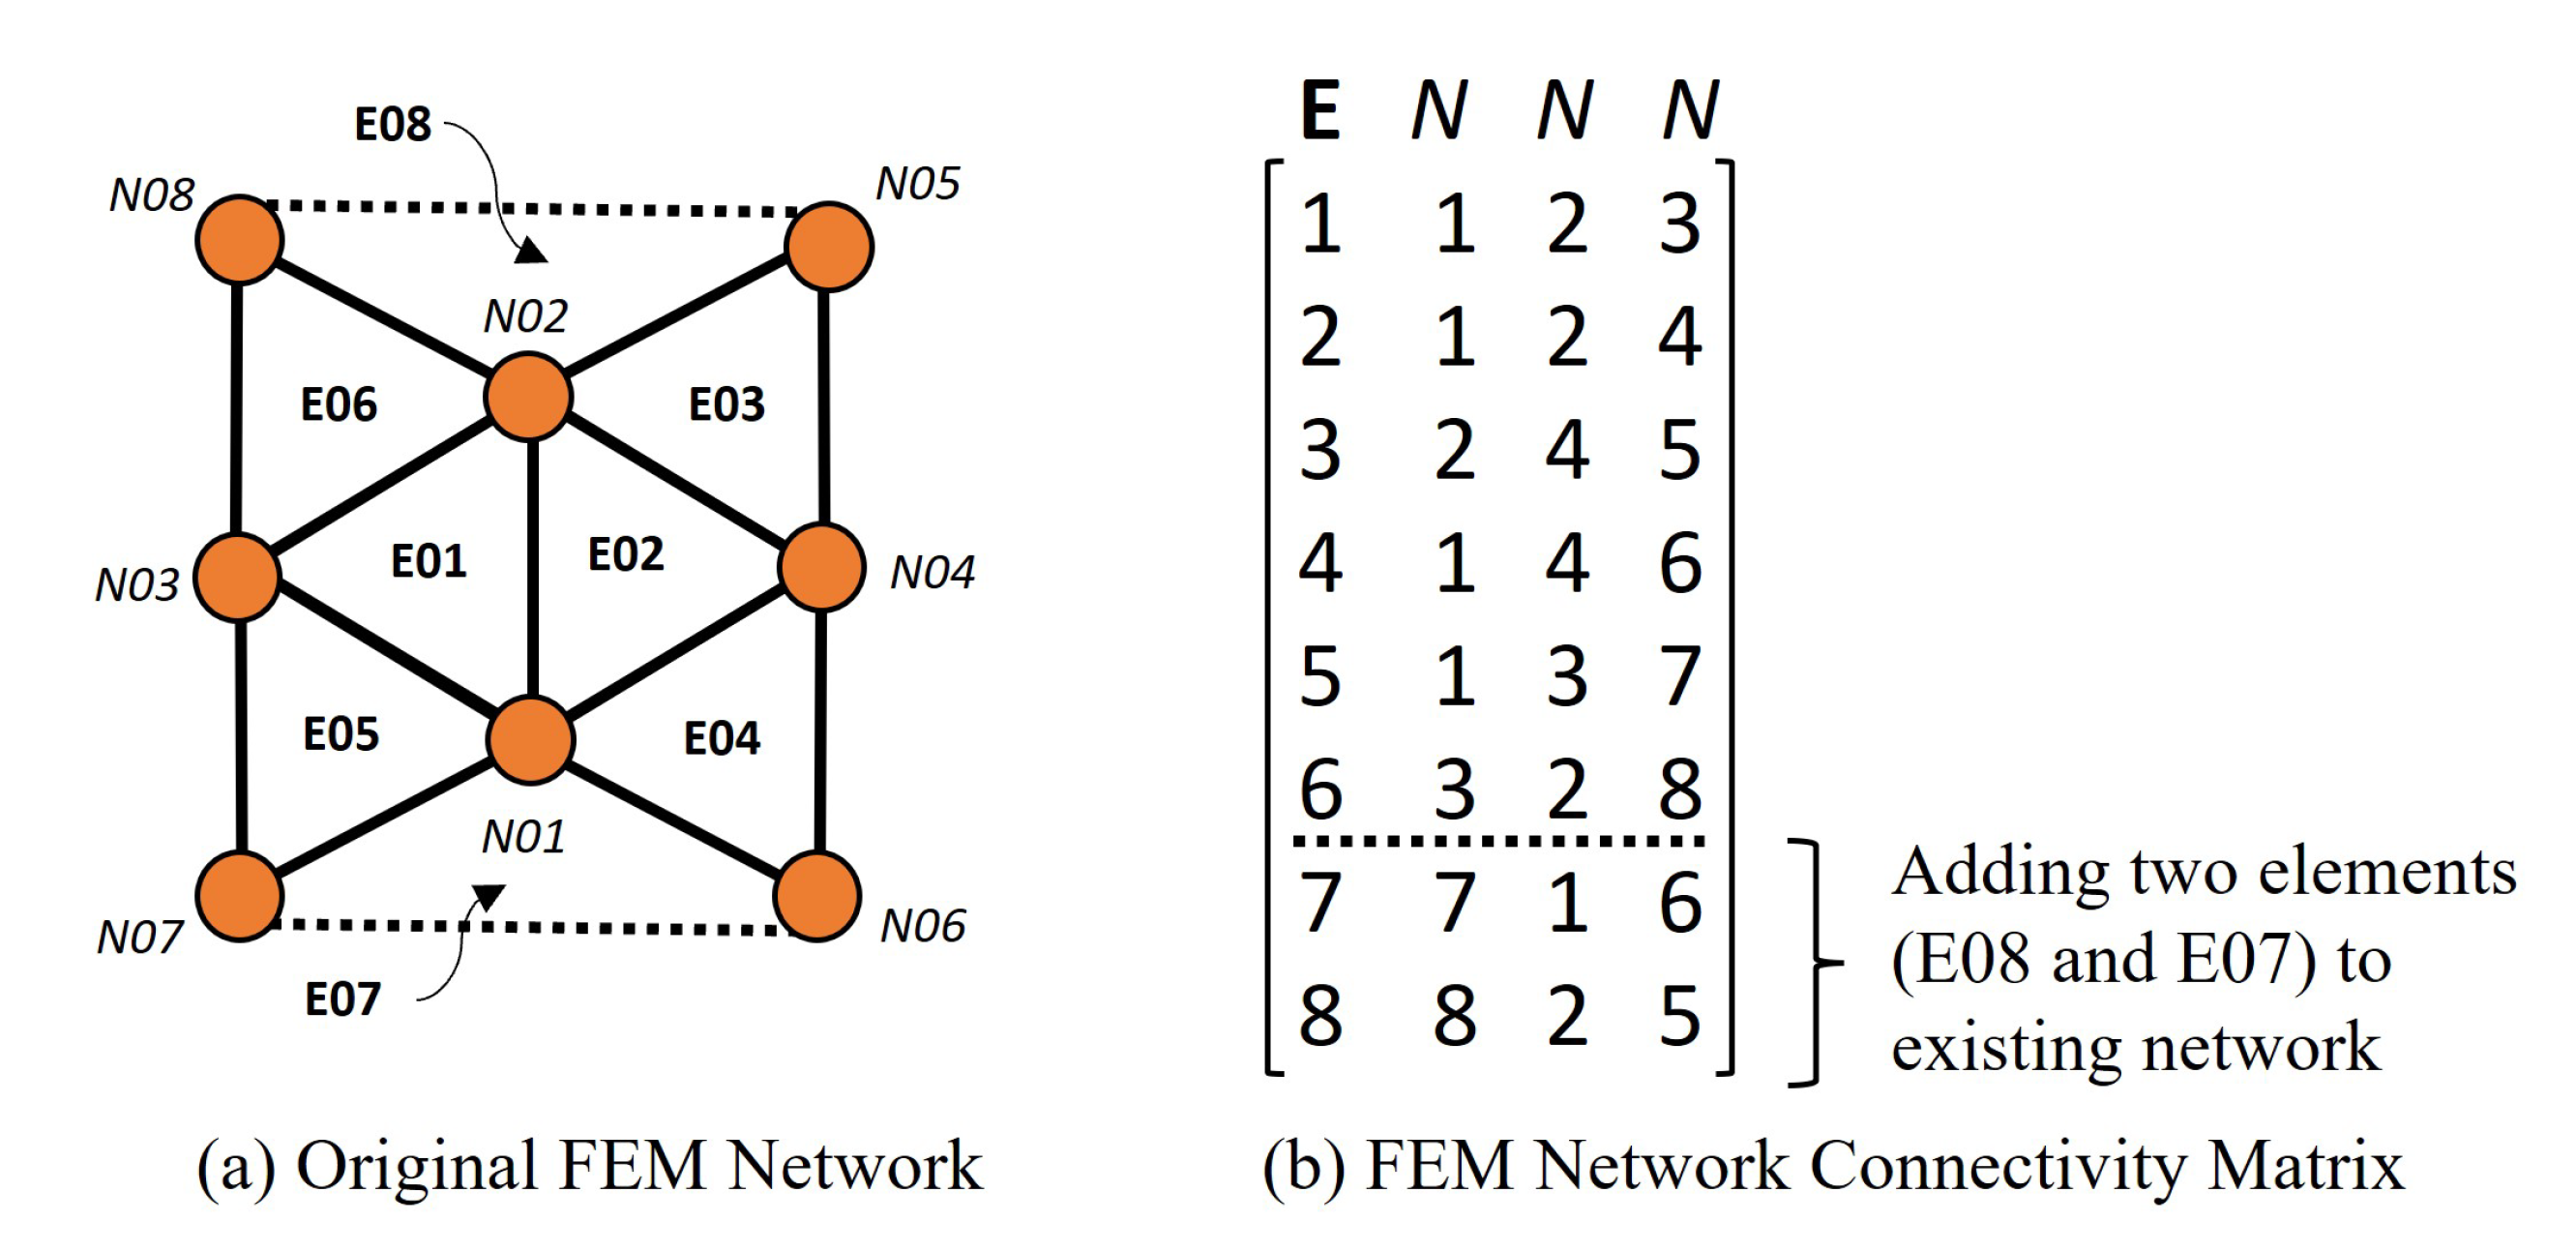
The “element connectivity” matrix data from Figure 6b show that the “original network”, displayed in Figure 6a, has eight nodes and six TRIANGULAR elements connected in a manner such that the first column (labelled “E”) contains the six TRIANGULAR element numbers and the second, third and fourth columns contain the nodes associated with each element; for example, element E01 is connected by nodes N01, N02, and N03. Similarly, element E06 is connected by nodes N03, N02, and N08.
Figure 6a displays two networks: Network-1 with eight nodes and six elements (solid line) and Network-2 with eight nodes and eight elements (six elements represented by a solid line and two elements represented by a dotted line). Figure 6b illustrates the corresponding connection matrix of the networks from Figure 6a, with Network-1’s connectivity matrix represented by the first six rows of the matrix (above the dotted line), and Network-2’s connectivity matrix represented by the entire matrix (including the rows below the dotted line).
To construct the corresponding “Transformed Network”, the same (previously discussed) rules are applied:
i.
The number of “pseudo-nodes” in the “transformed network” will be equal to the number of actual TRIANGULAR elements in the “original network”. Thus, in this example, the number of “pseudo-nodes” is equal to six, and these pseudo-nodes are labelled as node numbers E01, E02, …E06 (see Figure 6).
ii.
The number of “pseudo-links” in the “transformed network” will be equal to “the total number of INTERSECTIONS of all (different) pairs of TRIANGULAR elements” in the “original network”. In Figure 6, triangular element E01 will INTERSECT with its adjacent (triangular element) neighbours E02, E05, and E06 at three “boundary LINES” connected by nodes N01 and N02, nodes N01 and N03, and nodes N03 and N02, respectively.
iii.
Similarly, triangular element E02 will INTERSECT with its adjacent (triangular element) neighbours E01, E03, and E04 at two additional (new) “boundary LINES” connected by nodes N02 and N04 and by nodes N01 and N06, respectively.
Remarks:
  • In Figure 6, “Boundary LINE” connected by nodes N01 and N02 has already been accounted for in rule (ii); hence, this boundary line will not be counted twice.
  • In Figure 6, triangular E03 is adjacent to triangular E02 and shares the “boundary LINE” connected by nodes N02 and N04, which has already been accounted for in rule (iii); hence, this boundary line will not be counted twice.
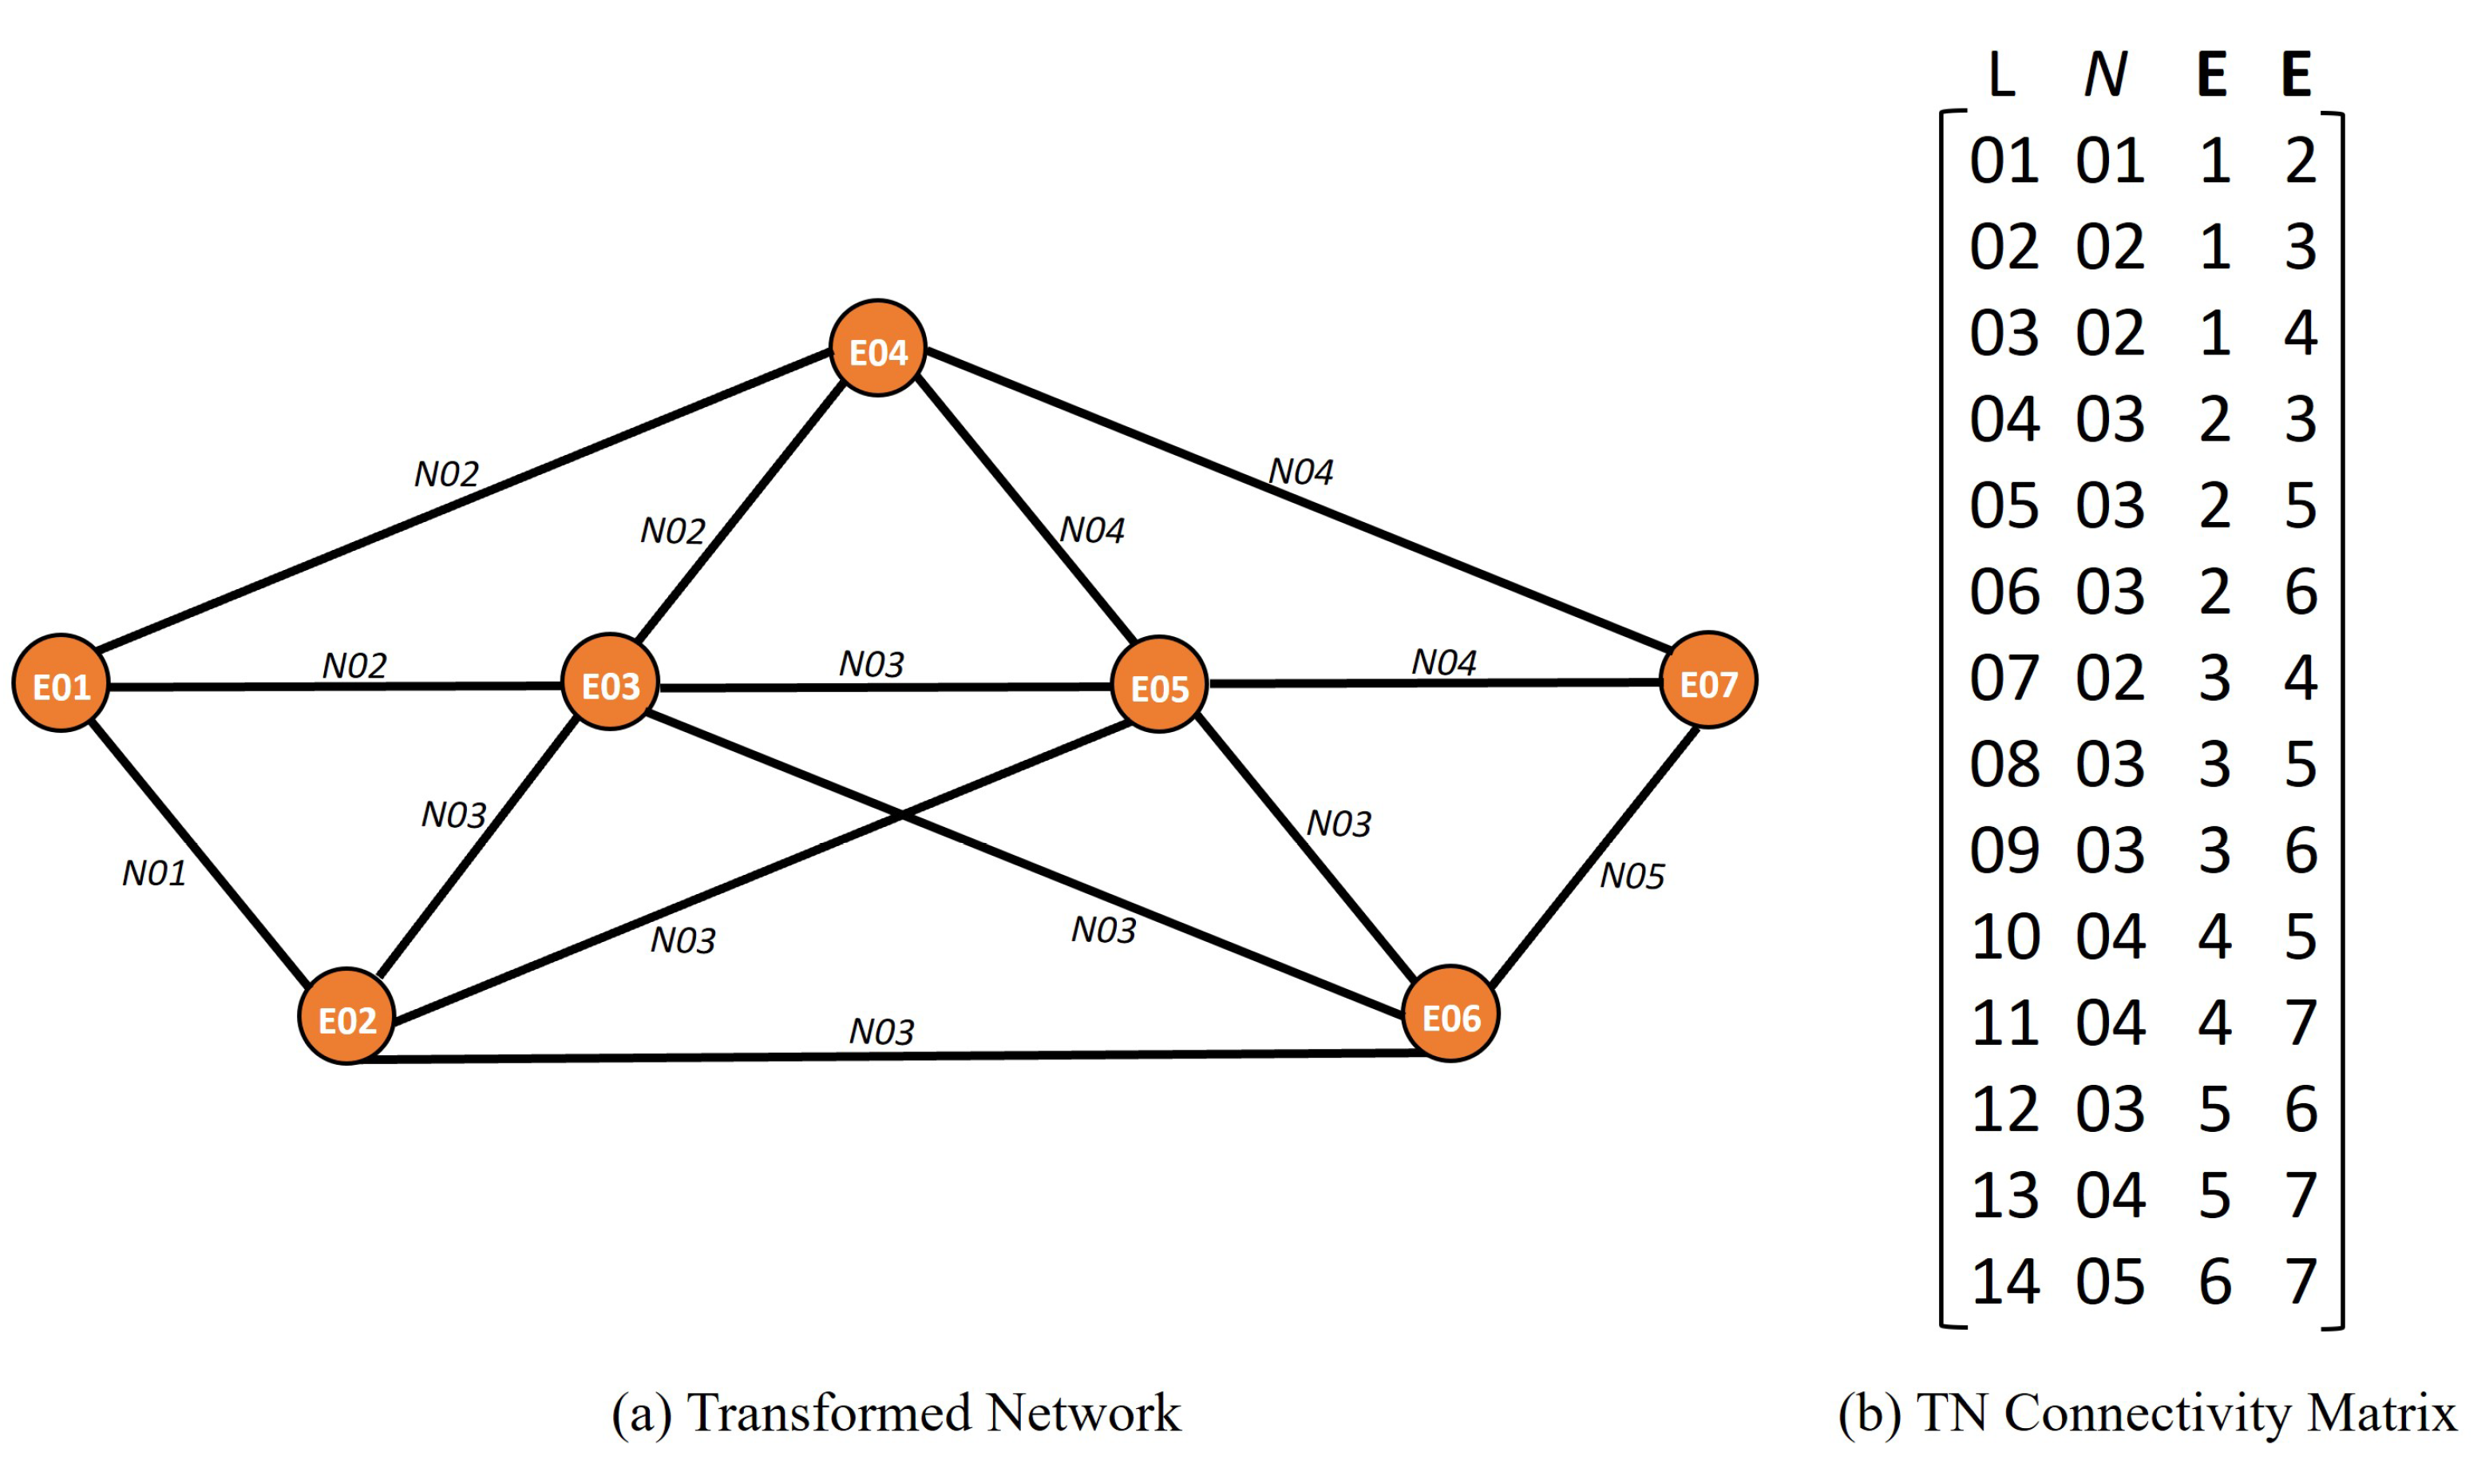
The “transformed network” in this example comprises six pseudo-nodes (E01, E02, E03, E04, E05, and E06) and five pseudo-links (L01, L02, L03, L04, and L05), as depicted in Figure 7a,b. If two additional triangular elements (E07 and E08) are included (see Figure 6a), the “transformed network” is composed of eight pseudo-nodes (E01, E02,…, E08) and nine pseudo-links (L01, L02, …, L09), as seen in Figure 7a,b.
Figure 7a shows two transformed networks (TN): TN-1 comprising six pseudo-nodes and five pseudo-links (represented by solid lines) and TN-2 comprising eight pseudo-nodes and nine pseudo-links (five pseudo-links represented by solid lines and four pseudo-links represented by dotted lines). Figure 7b provides the respective connection matrices of the two TN shown in Figure 7a, with TN-1’s connectivity matrix represented by the first five rows of the matrix (above the dotted line) and TN-2’s connectivity matrix represented by the entirety of the matrix (including the rows below the dotted line).

3.3. Example 3: Eight-Node BRICK Elements for Finite Element Analysis (FEA)

The “original FEM network” depicted in Figure 8a, composed of sixteen nodes and three eight-node BRICK elements, is represented by the associated 3 × 9 “element connectivity” matrix data shown in Figure 8b. The first column, labelled “E”, indicates the three BRICK element numbers, while the subsequent columns label the eight nodes associated with each element. For example, the BRICK element E01 is connected by nodes N01, N04, N05, N08, N09, N12, N13, and N16, while BRICK element E03 is connected by nodes N08, N05, N06, N07, N16, N13, N14, and N15. For example, the “transformed network” will have only “3 pseudo-nodes”, and “2 pseudo-links”, as can be seen in Figure 9.
To construct the corresponding “transformed network”, the same (previously discussed) rules are applied:
i.
The number of “pseudo-nodes” in the “transformed network” will be equal to the number of actual BRICK elements in the “original network”. Thus, in this example, the number of “pseudo-nodes” is equal to three, and these pseudo-nodes are labelled as node numbers E01, E02, and E03 (see Figure 9a).
ii.
The number of “pseudo-links” in the “transformed network” will be equal to “the total number of INTERSECTIONS of all (different) pairs of BRICK elements” in the “original network”. In Figure 8a, BRICK element E01 will INTERSECT with its adjacent (BRICK element) neighbours E02 and E03 at two “boundary (four-node) SURFACES” connected by nodes N01, N04, N12 and N09 and nodes N08, N05, N13 and N16, respectively.

3.4. Example 4: Four-Node TETRAHEDRAL Elements for Finite Element Analysis (FEA)

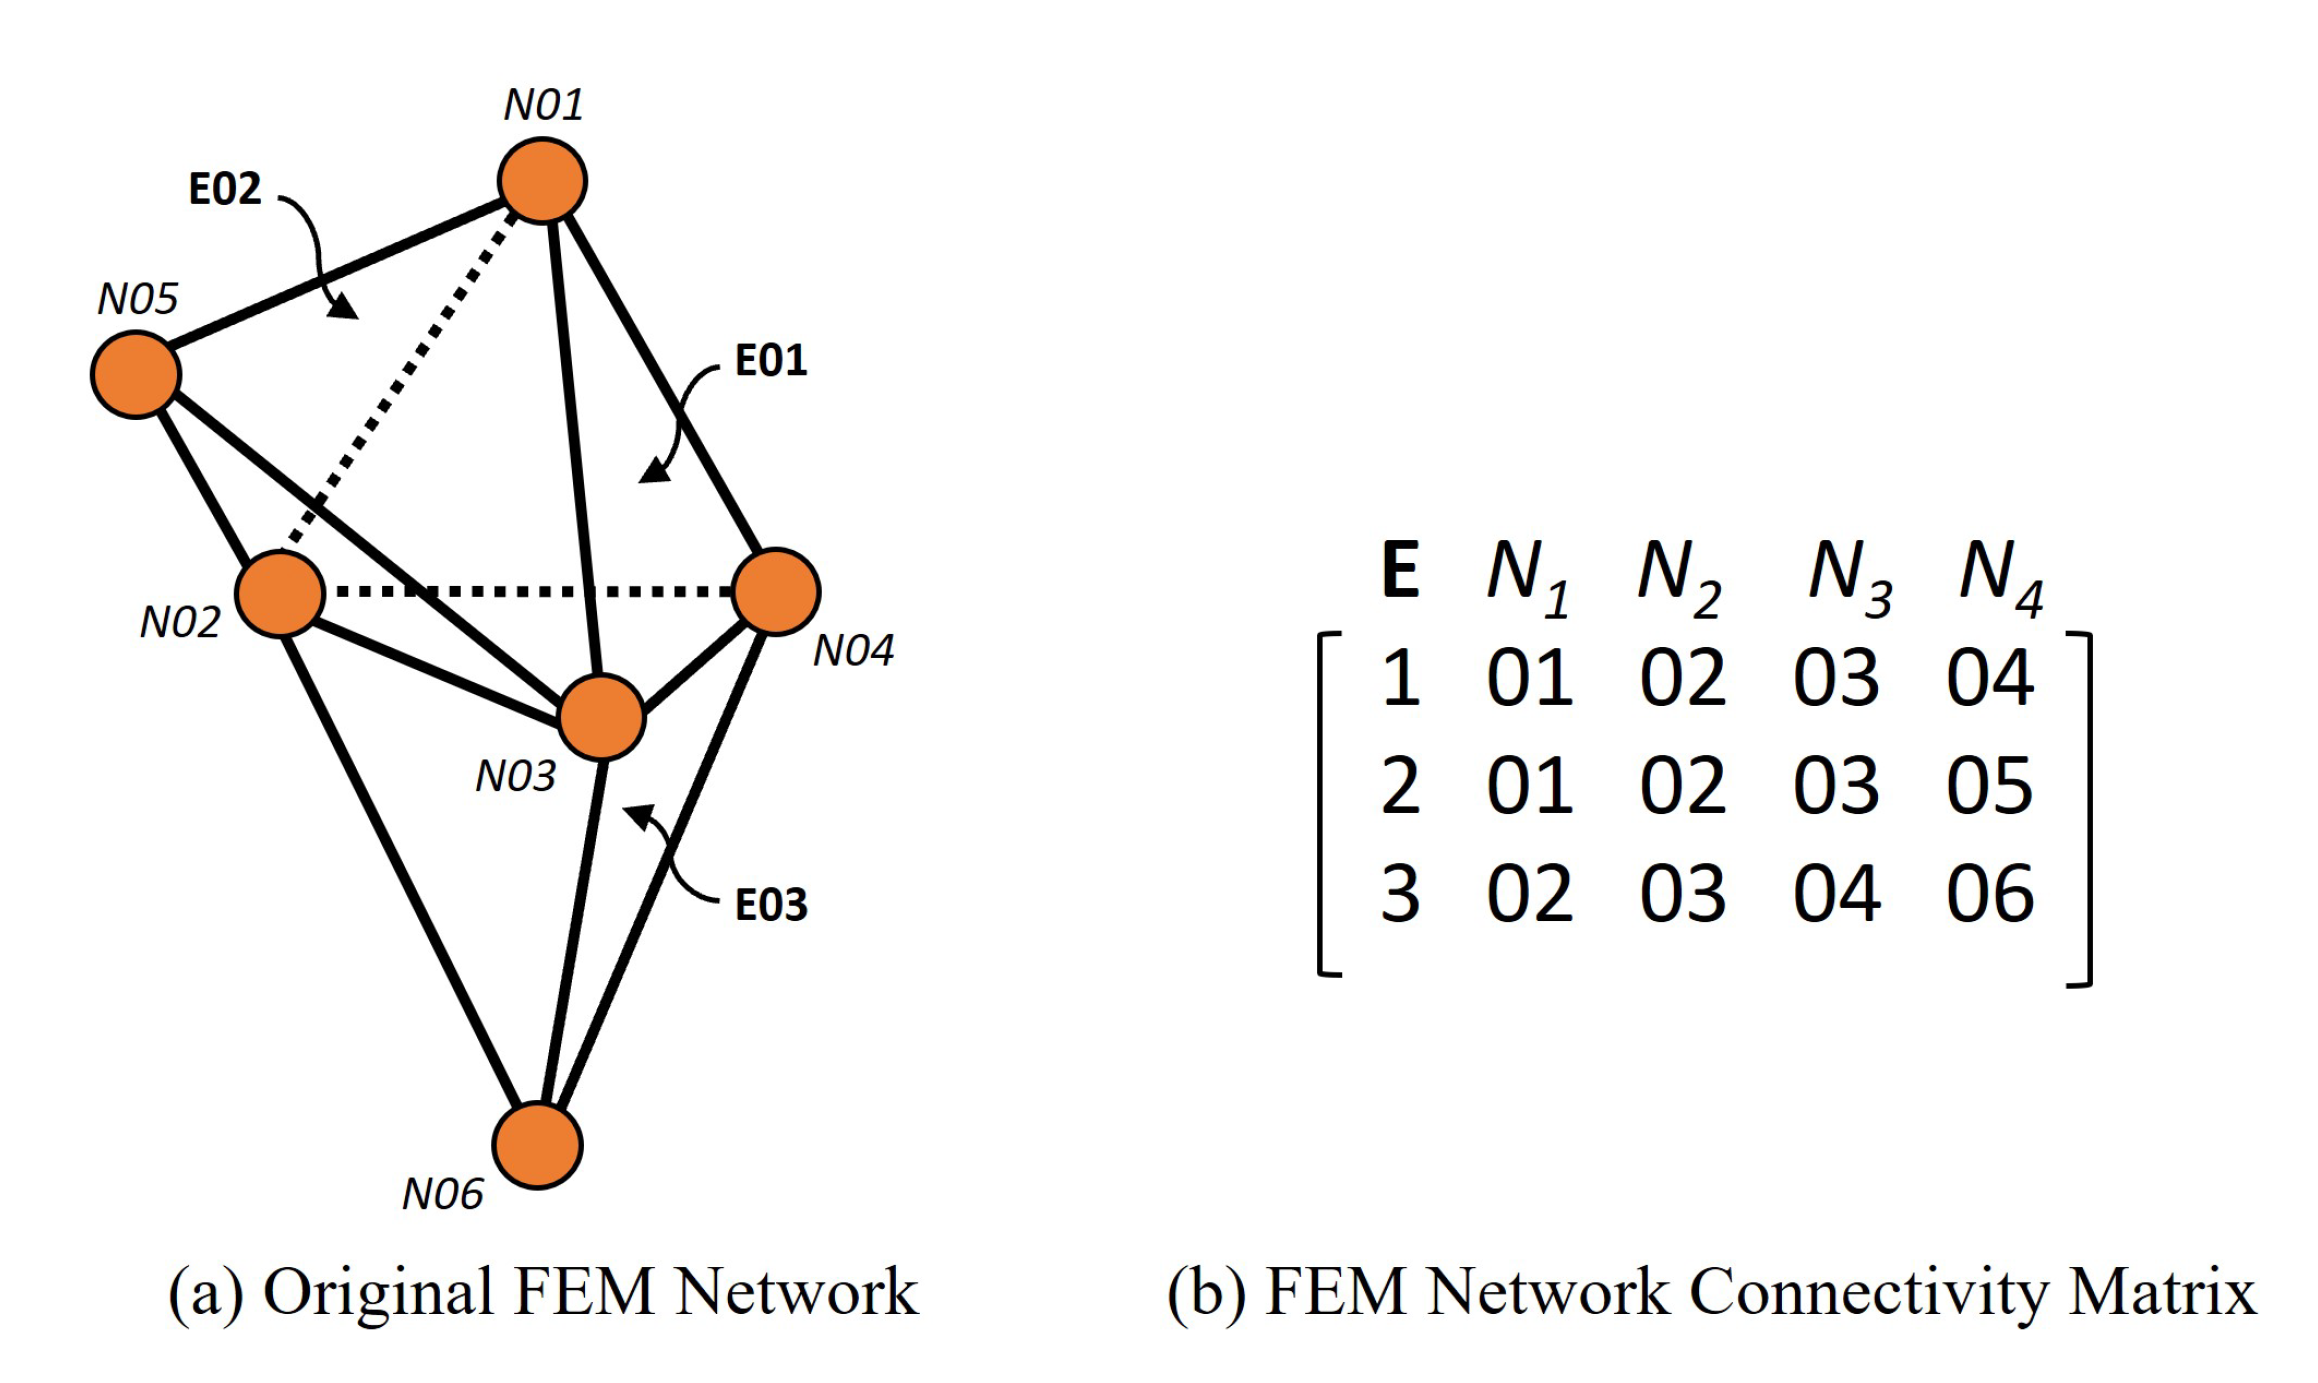
The “original FEM network”, depicted in Figure 10a, consists of six nodes and three (four-node tetrahedral) elements. The corresponding 3 × 5 element connectivity matrix is presented in Figure 10b. The first column of the matrix, labelled “E”, denotes the three tetrahedral elements. The remaining four columns denote the four nodes that make up each element, such as element E01, which is composed of nodes N01, N02, N03, and N04, and element E03, which is composed of nodes N02, N03, N04, and N06. In this example, the “transformed network” will have only “3 pseudo-nodes” which have been labelled as nodes E01, E02, E03, and “2 pseudo-links” which have been labelled as links L01 and L02, as can be seen in Figure 11.
To construct the corresponding “transformed network”, the same (previously discussed) rules are applied:
i.
The number of “pseudo-nodes” in the “transformed network” will be equal to the number of actual TETRAHEDRAL elements in the “original FEM network”. Thus, in this example, the number of “pseudo-nodes” is equal to three, and these pseudo-nodes are labelled as node numbers E01, E02, and E03 (see Figure 11).
ii.
The number of “pseudo-links” in the “transformed network” will be equal to “the total number of INTERSECTIONS of all (different) pairs of TETRAHEDRA elements” in the “original FEM network”. In Figure 10, TETRAHEDRAL element E01 will INTERSECT with its adjacent (TETRAHEDRAL element) neighbours E02, and E03 at two “boundary (three-node) SURFACES” connected by nodes N01, N02 and N03 and /by nodes N02, N03 and N04, respectively.

4. Domain-Partitioning Examples for Real-Life Transportation Network

This study investigates the performance of the proposed seven-step domain-partitioning (DP) algorithm with enhancement features on three real-life transportation networks, each of which is divided into two, three, and four subdomains. In domain decomposition (DD) FE partitioning analysis, it is important to minimise the total number of boundary nodes (in order to minimise the communication time amongst different processors, this is the primary criteria) and to maintain “work-load balancing” amongst different processors (in order to avoid idle time amongst different processors, this is the secondary criteria). To assess the results, a comparison between the proposed seven-step DP algorithm and the widely used METIS algorithm/software [21] is conducted, with particular emphasis on the total number of system boundary nodes generated and the computation time. A visualised sparsity pattern of the transportation network matrix is presented before and after the DP algorithm is implemented, with the aim of producing a “block diagonal pattern”. A summary table is provided for each transportation network, which includes the total number of system boundary nodes generated by the proposed seven-step DP algorithm and the METIS algorithm/software, as well as the computation time for the proposed seven-step.

4.1. Example 1: Anaheim (Real-Life) Transportation Network

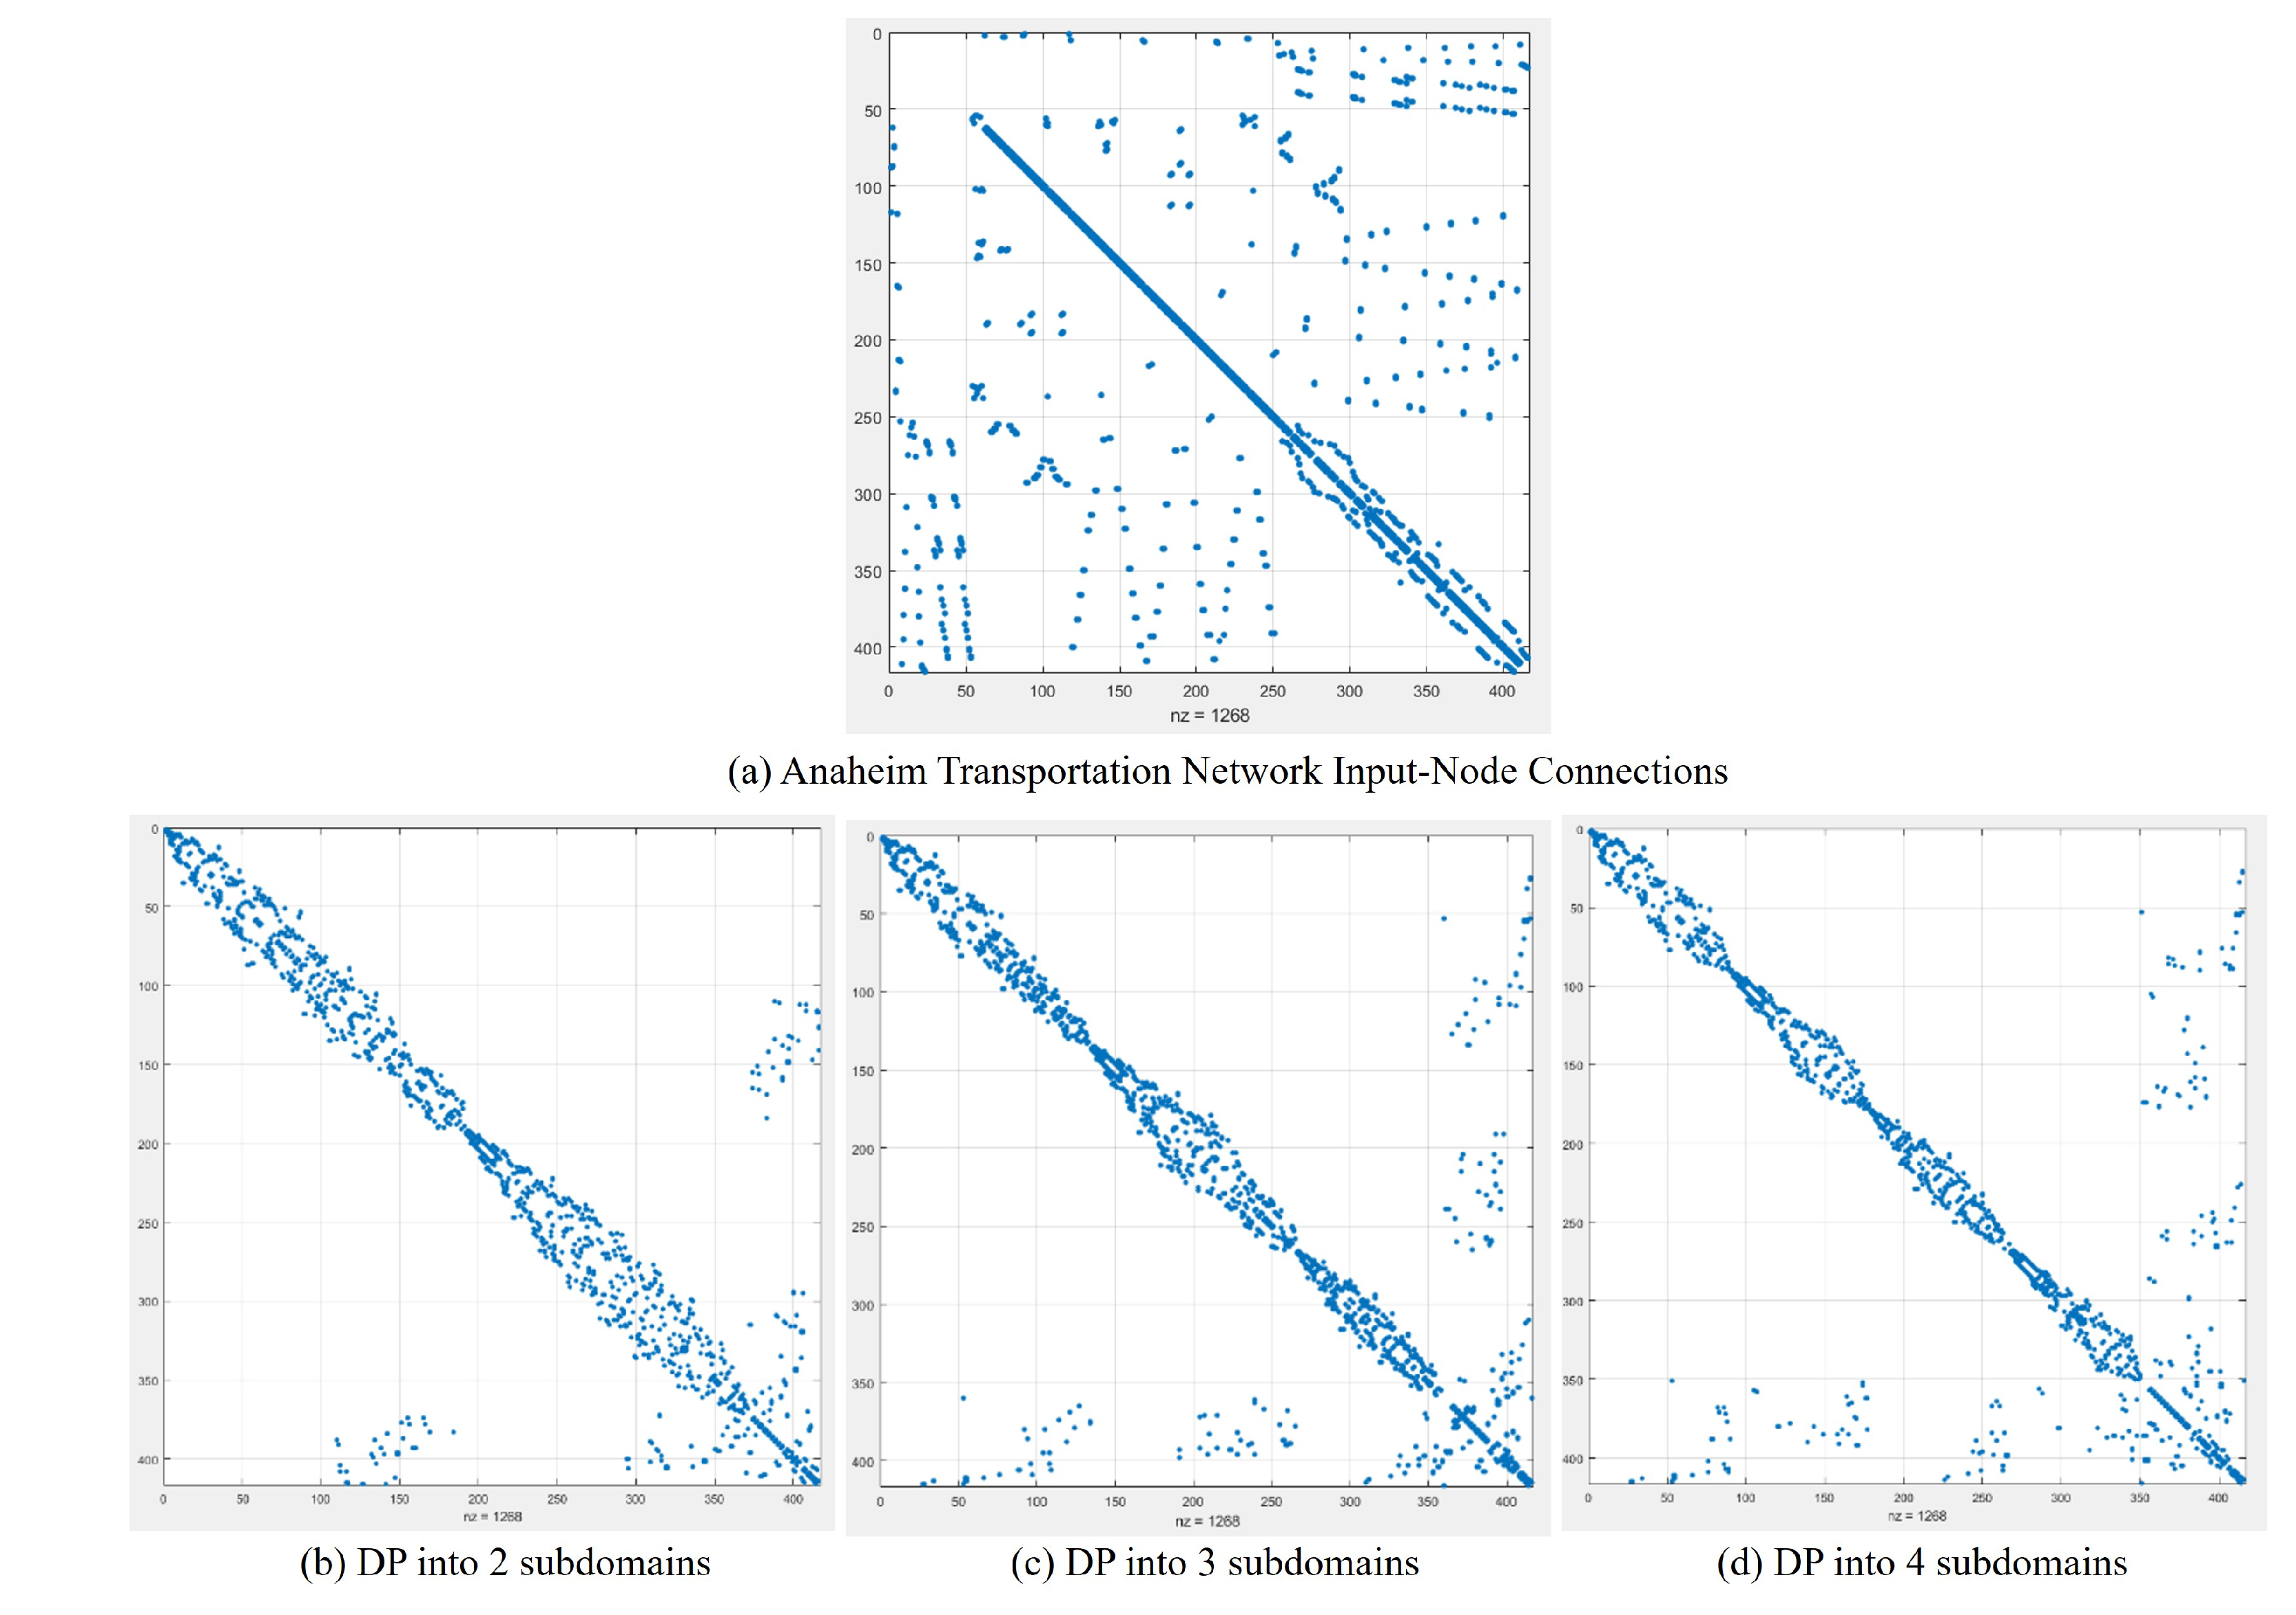
A real-life transportation network of Anaheim, consisting of 416 nodes and 914 links, was used to demonstrate the application of DP into subdomains of two, three and four. The input data for the network was sourced from the Git-Hub repository [29]. Figure 12a depicts the sparsity pattern of the matrix, representing the node connections of the given network prior to renumbering. The axes of the matrix correspond to the assigned node numbers, with the x-axis representing the source nodes and the y-axis representing the target nodes. The node connections after renumbering into two subdomains are presented in Figure 12b, while Figure 12c,d demonstrate the node connections after renumbering into three and four subdomains, respectively, using the seven-step shortest distance partitioning algorithm (SDPA).
SDPA was found to reduce the number of boundary nodes for two, three and four subdomains (as compared to METIS), as evident from Table 1. Although METIS [21] took less time when compared to SDPA’s solution time, this is not a fair comparison, due to the following reasons: (i) The computer configuration used by METIS is of higher configuration computation power (in terms of more RAM memory and higher number of parallel processing cores) in comparison to the “sequential” and lower RAM memory used in this present work. (ii) It has been shown in [1] that the domain-partitioning (pre-processing) time is “insignificant” as compared to the “total analysis time”, such as finding the shortest paths from all source nodes to all destination nodes in a transportation network or finding the joint displacements and element stresses of a finite element mesh.

4.2. Example 2: Austin (Real-Life) Transportation Network

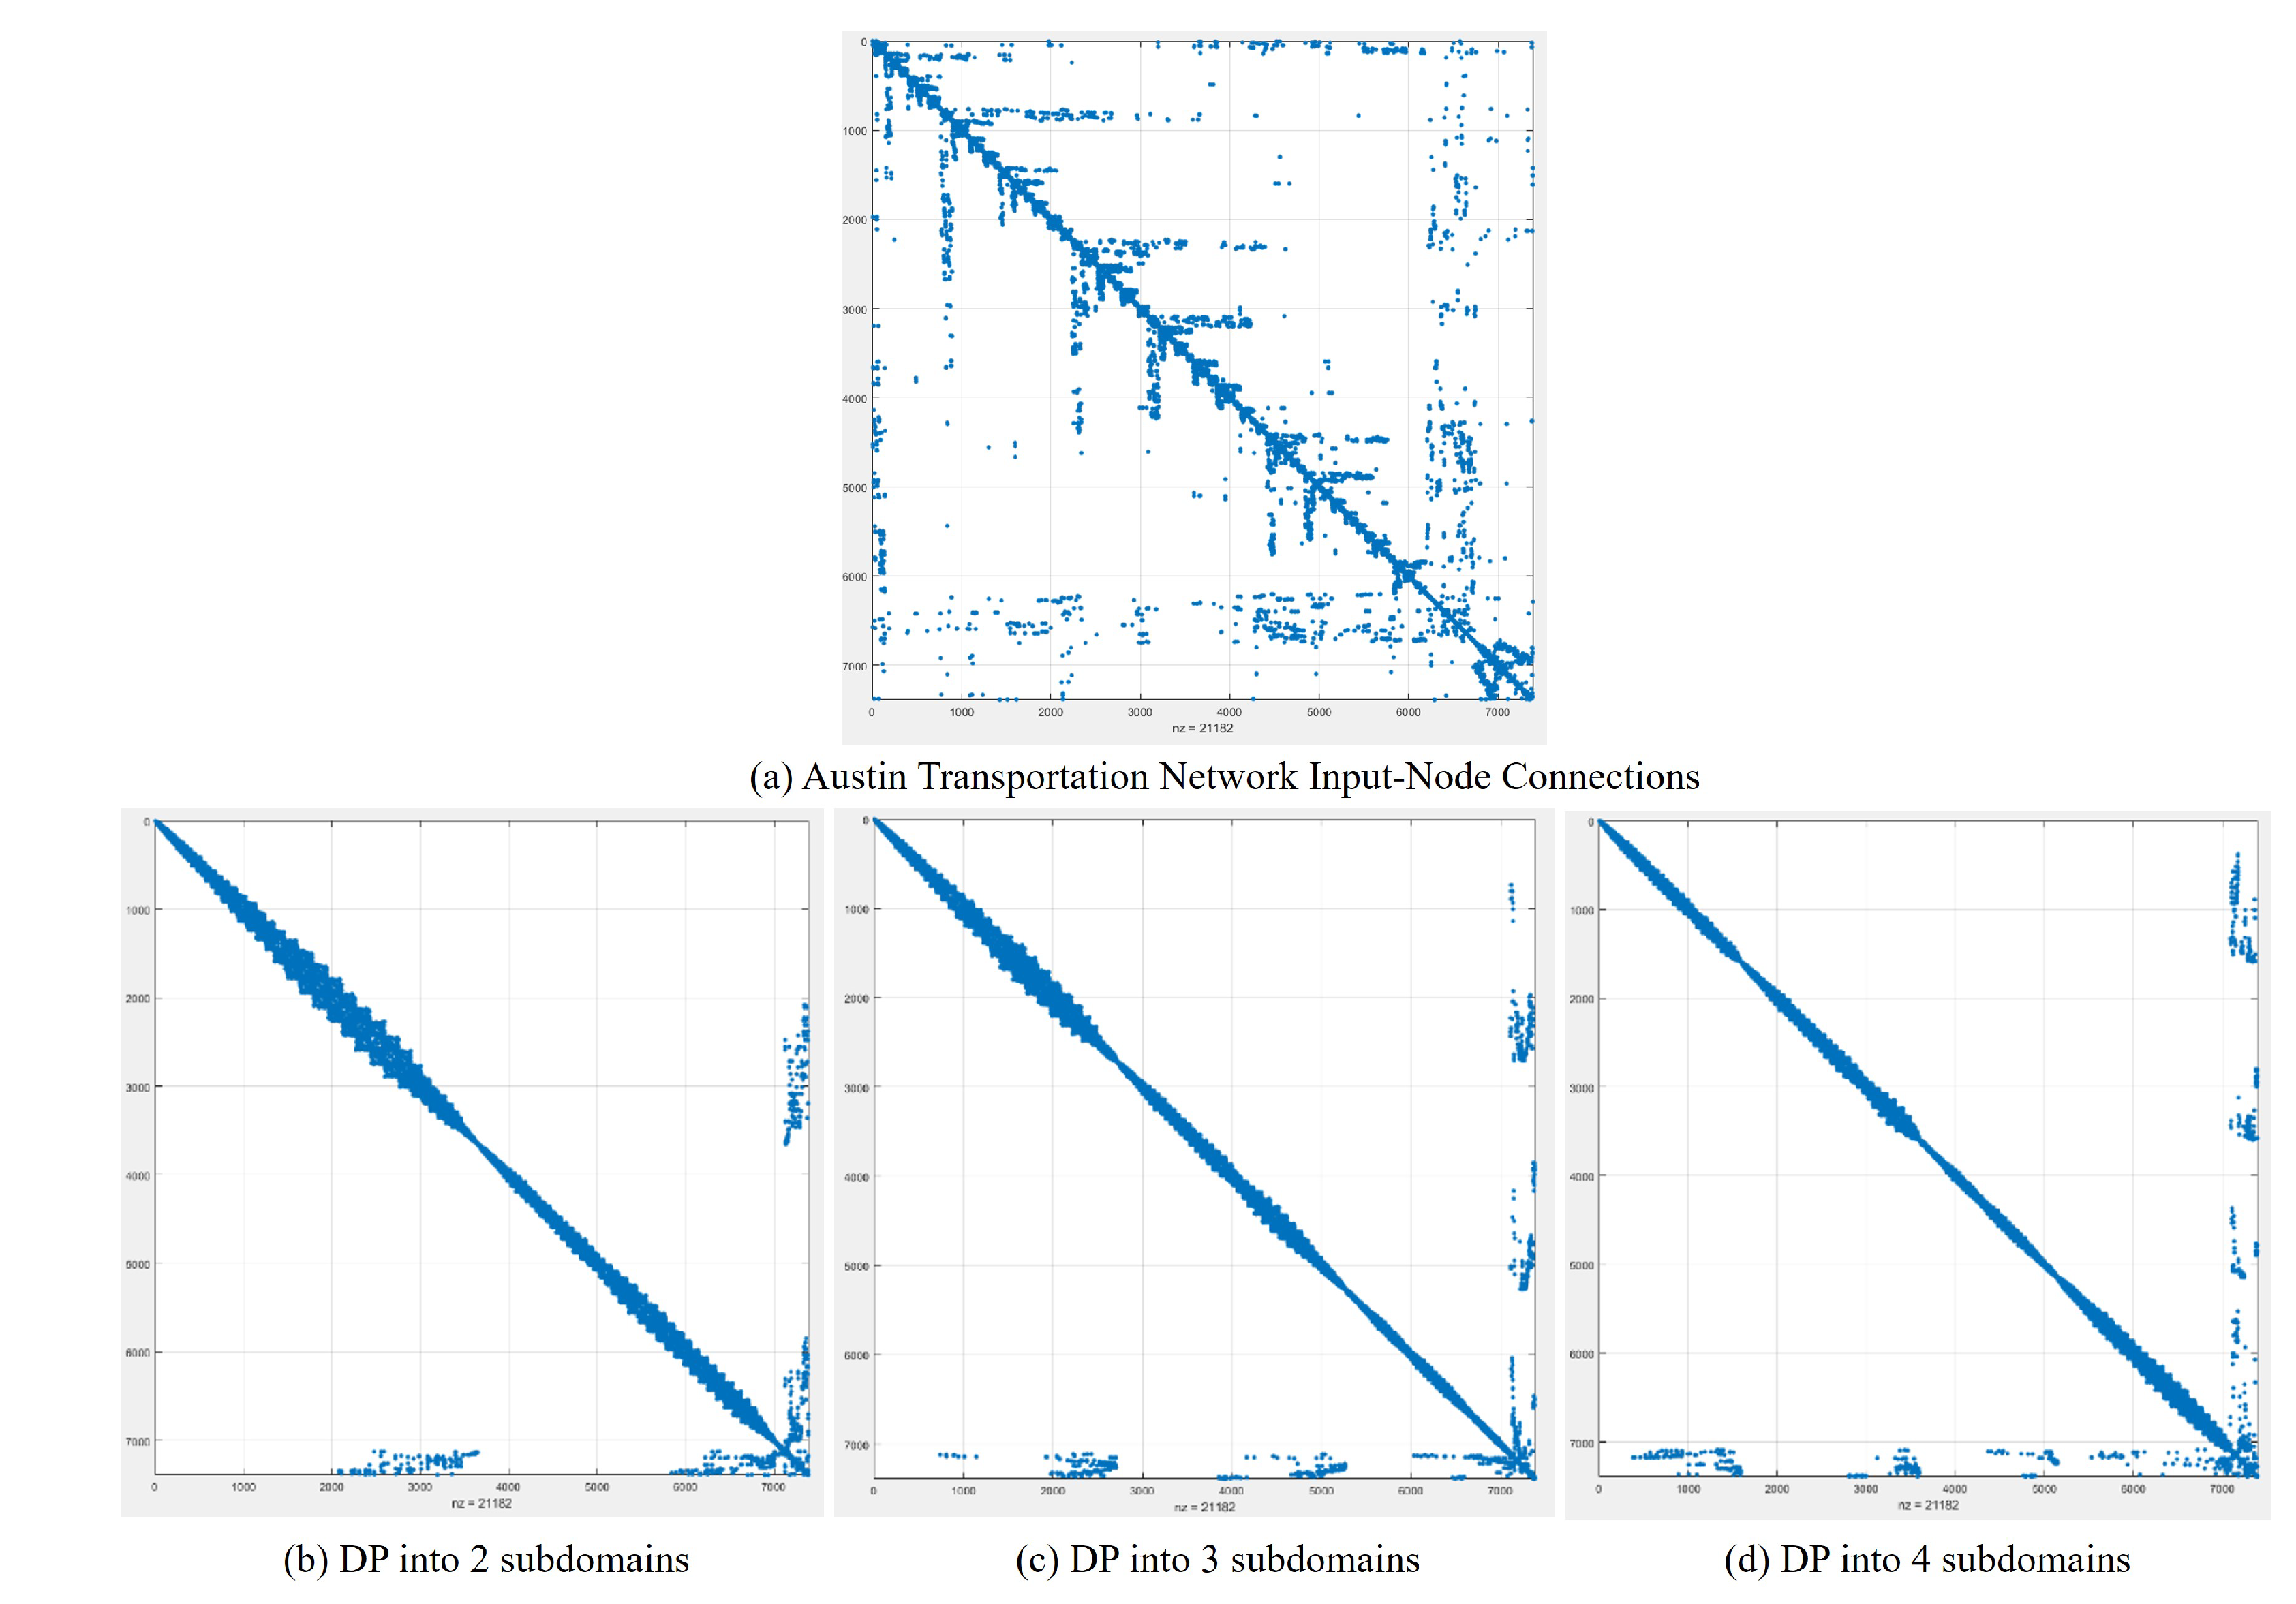
The transportation network of Austin with 7388 nodes and 18961 links was utilised to illustrate the application of the SDPA algorithm to decompose the network into two, three, and four subdomains, as visualised by the sparsity patterns of the matrices. Figure 13 presents the visualised sparsity pattern of the matrix and node connections for a given network prior to renumbering. Figure 13b shows the reordering of the nodes after decomposing the network into two subdomains, while Figure 13c,d demonstrate the reordering of the nodes after decomposition into three and four subdomains, respectively.
The results of Table 2 reveal that the SDPA algorithm outperforms the METIS algorithm in terms of decreasing the number of boundary nodes for two, three, and four subdomains. Furthermore, METIS [21] was found to require less time for the solution than SDPA, likely due to the fact that the computer configuration used for the METIS solution was more powerful than that used to solve the SDPA problem.

4.3. Example 3: Philadelphia (Real-Life) Transportation Network

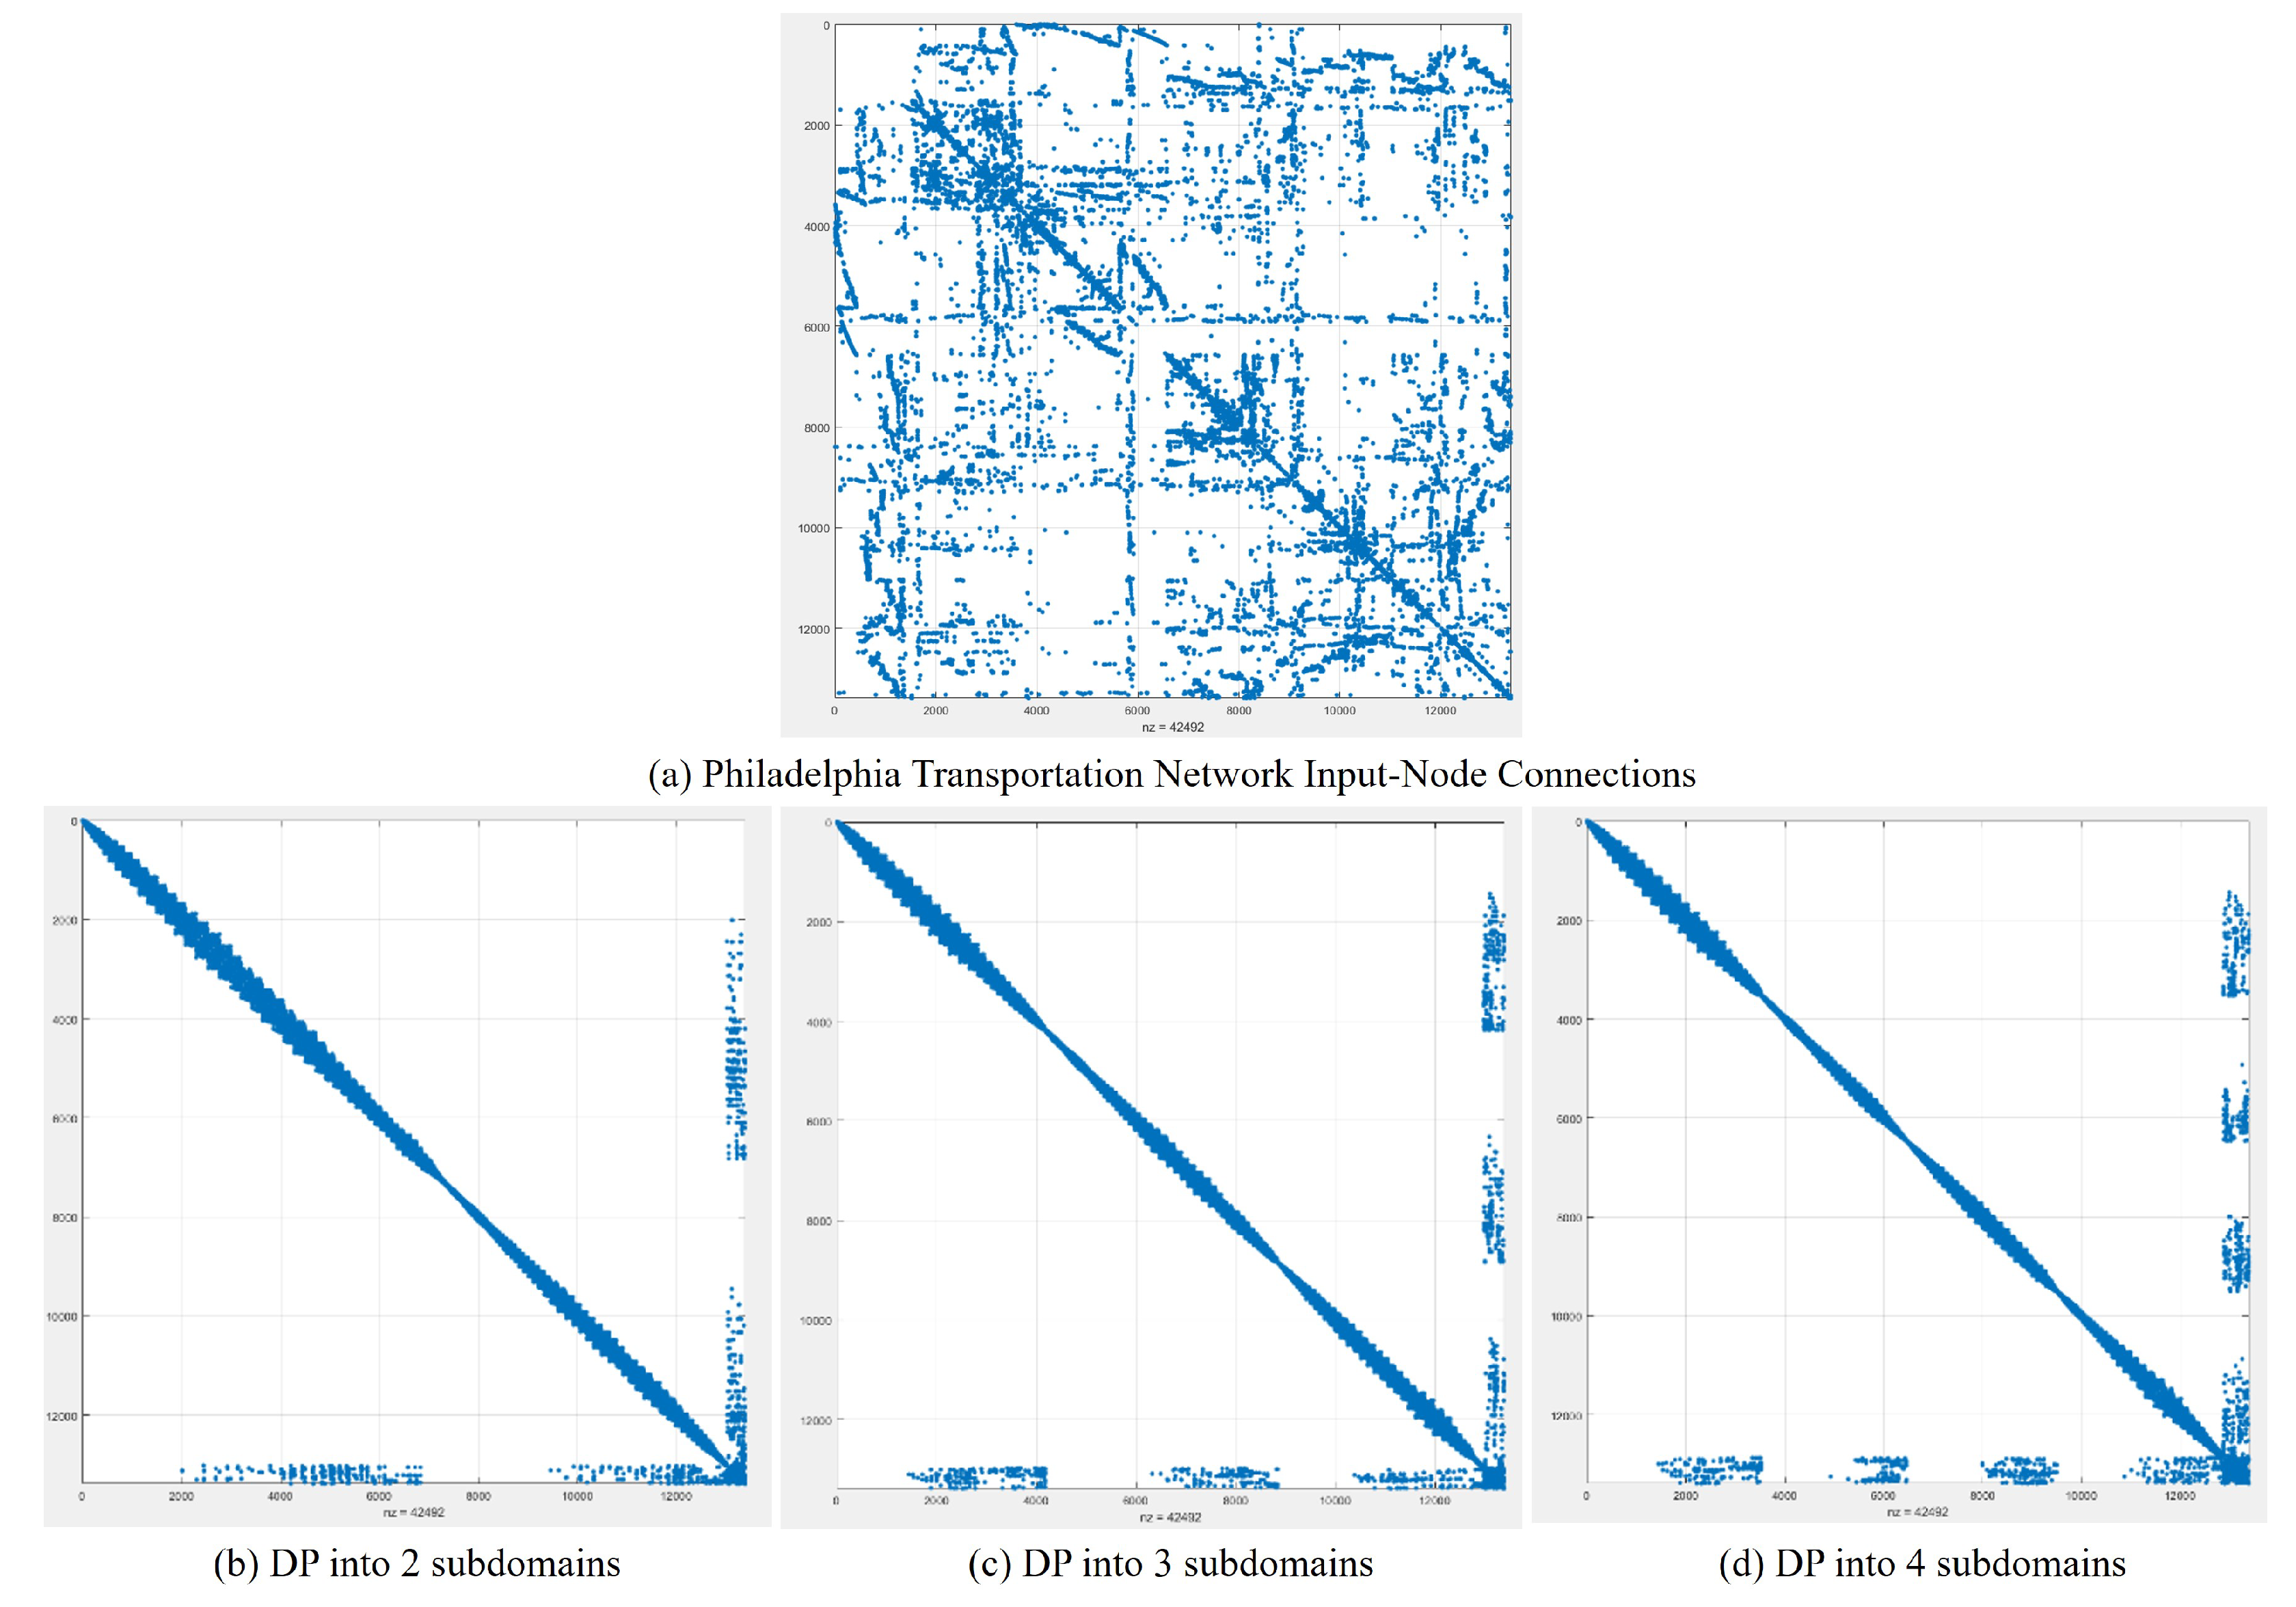
The Philadelphia transportation network, consisting of 13,389 nodes and 40,003 links (one of the largest real-life transportation networks), was used to demonstrate the application of the domain-partitioning (DP) algorithm. Figure 14a shows the sparsity pattern of the network prior to renumbering. Figure 14b–d then demonstrate the renumbered node connections into two, three and four subdomains, respectively, using the seven-step domain-partitioning algorithm (SDPA). It can be observed that the node connections become more distinct and clear after the renumbering process.
The results in Table 3 indicate that applying the SDPA approach was successful in decreasing the number of boundary nodes for scenarios with two and four subdomains. Conversely, the METIS method only yielded a decrease in boundary nodes for the three subdomain cases. Furthermore, METIS [21] was able to solve the problem faster than SDPA due to the higher configuration (computation power) in comparison to the configuration used to solve by SDPA.
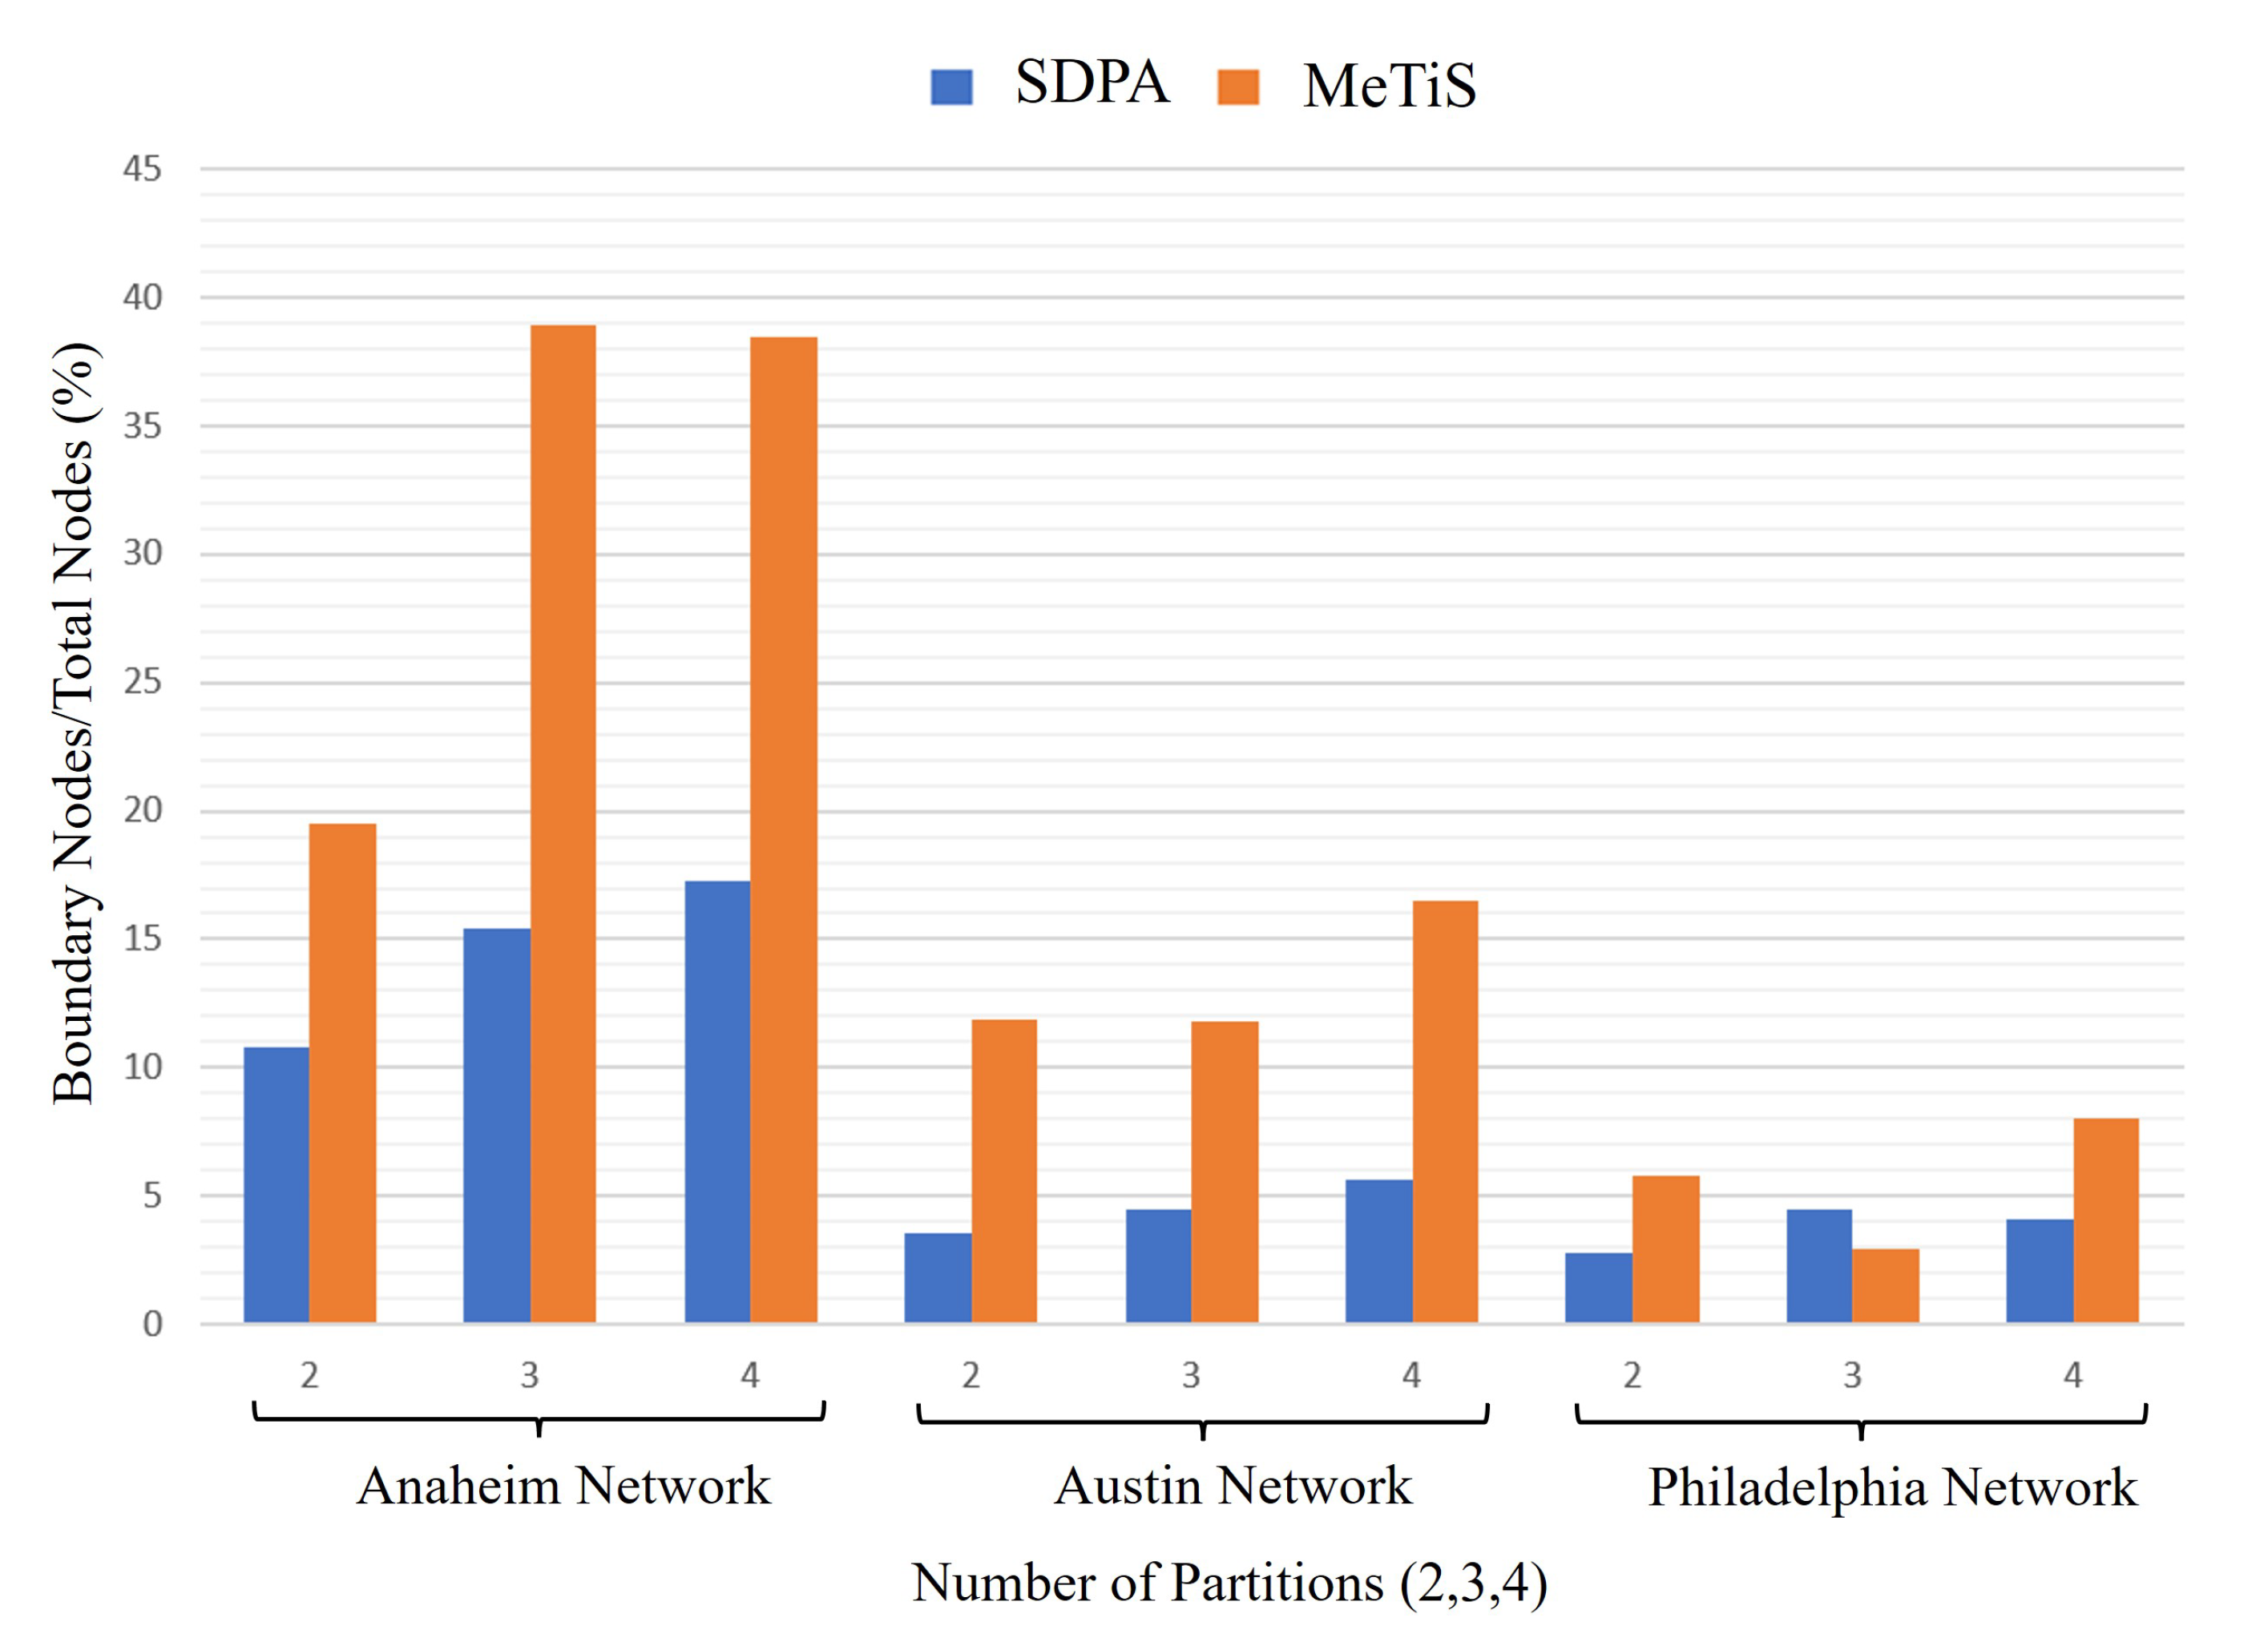
The proposed “general SDPA” algorithm was tested on three real-life transportation networks—Anaheim, Austin, and Philadelphia—with partitioning into two, three, and four subdomains in each network. As Figure 15 shows, the proposed algorithm yielded superior results to the popular METIS algorithm in eight out of nine cases, with the only exception being the Philadelphia network with three subdomains. In this case, METIS was able to minimise the number of boundary nodes more effectively than the proposed algorithm.

5. Domain-Partitioning Examples for Finite Element Meshes

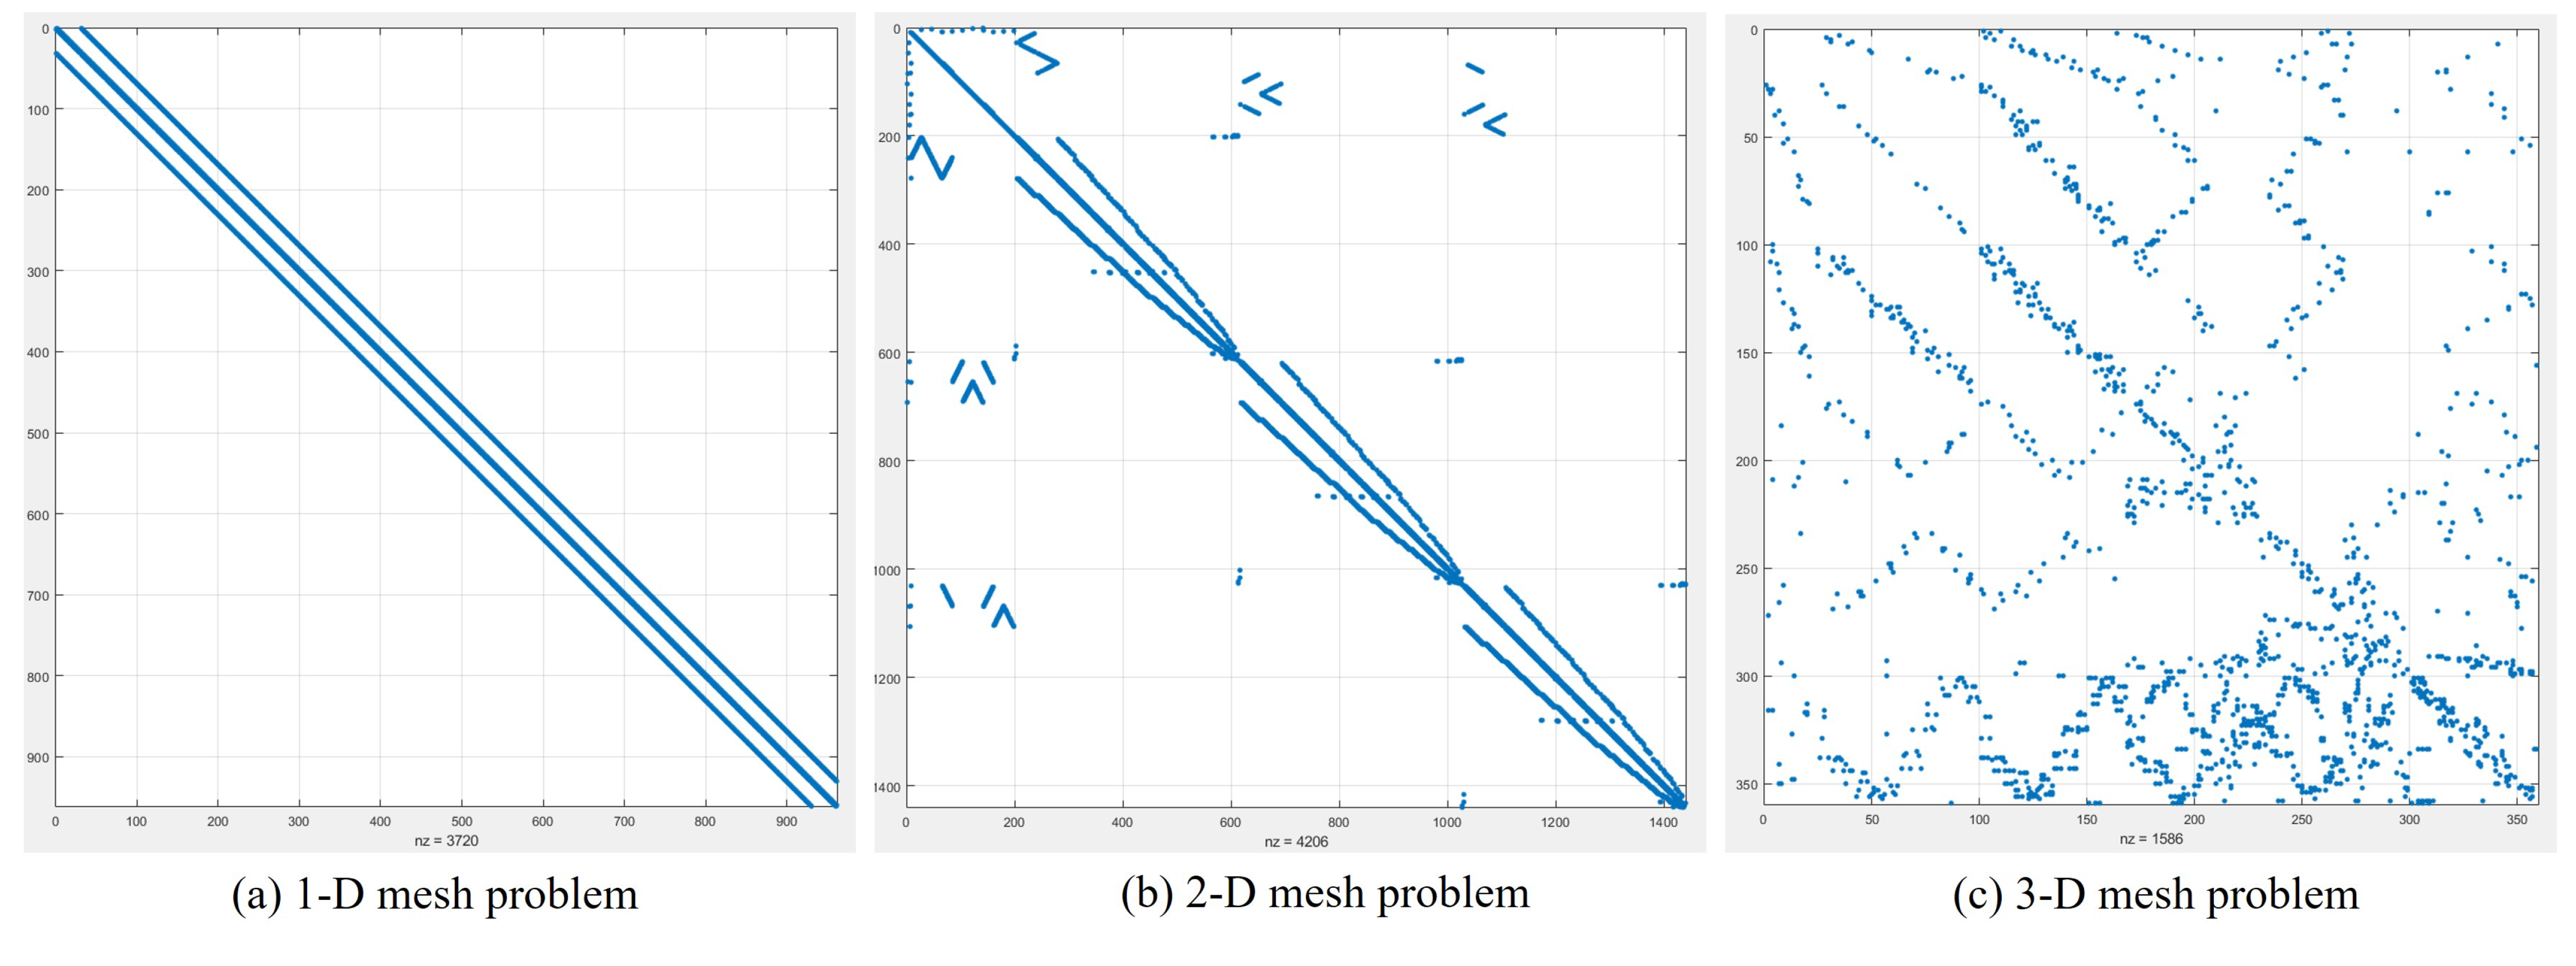
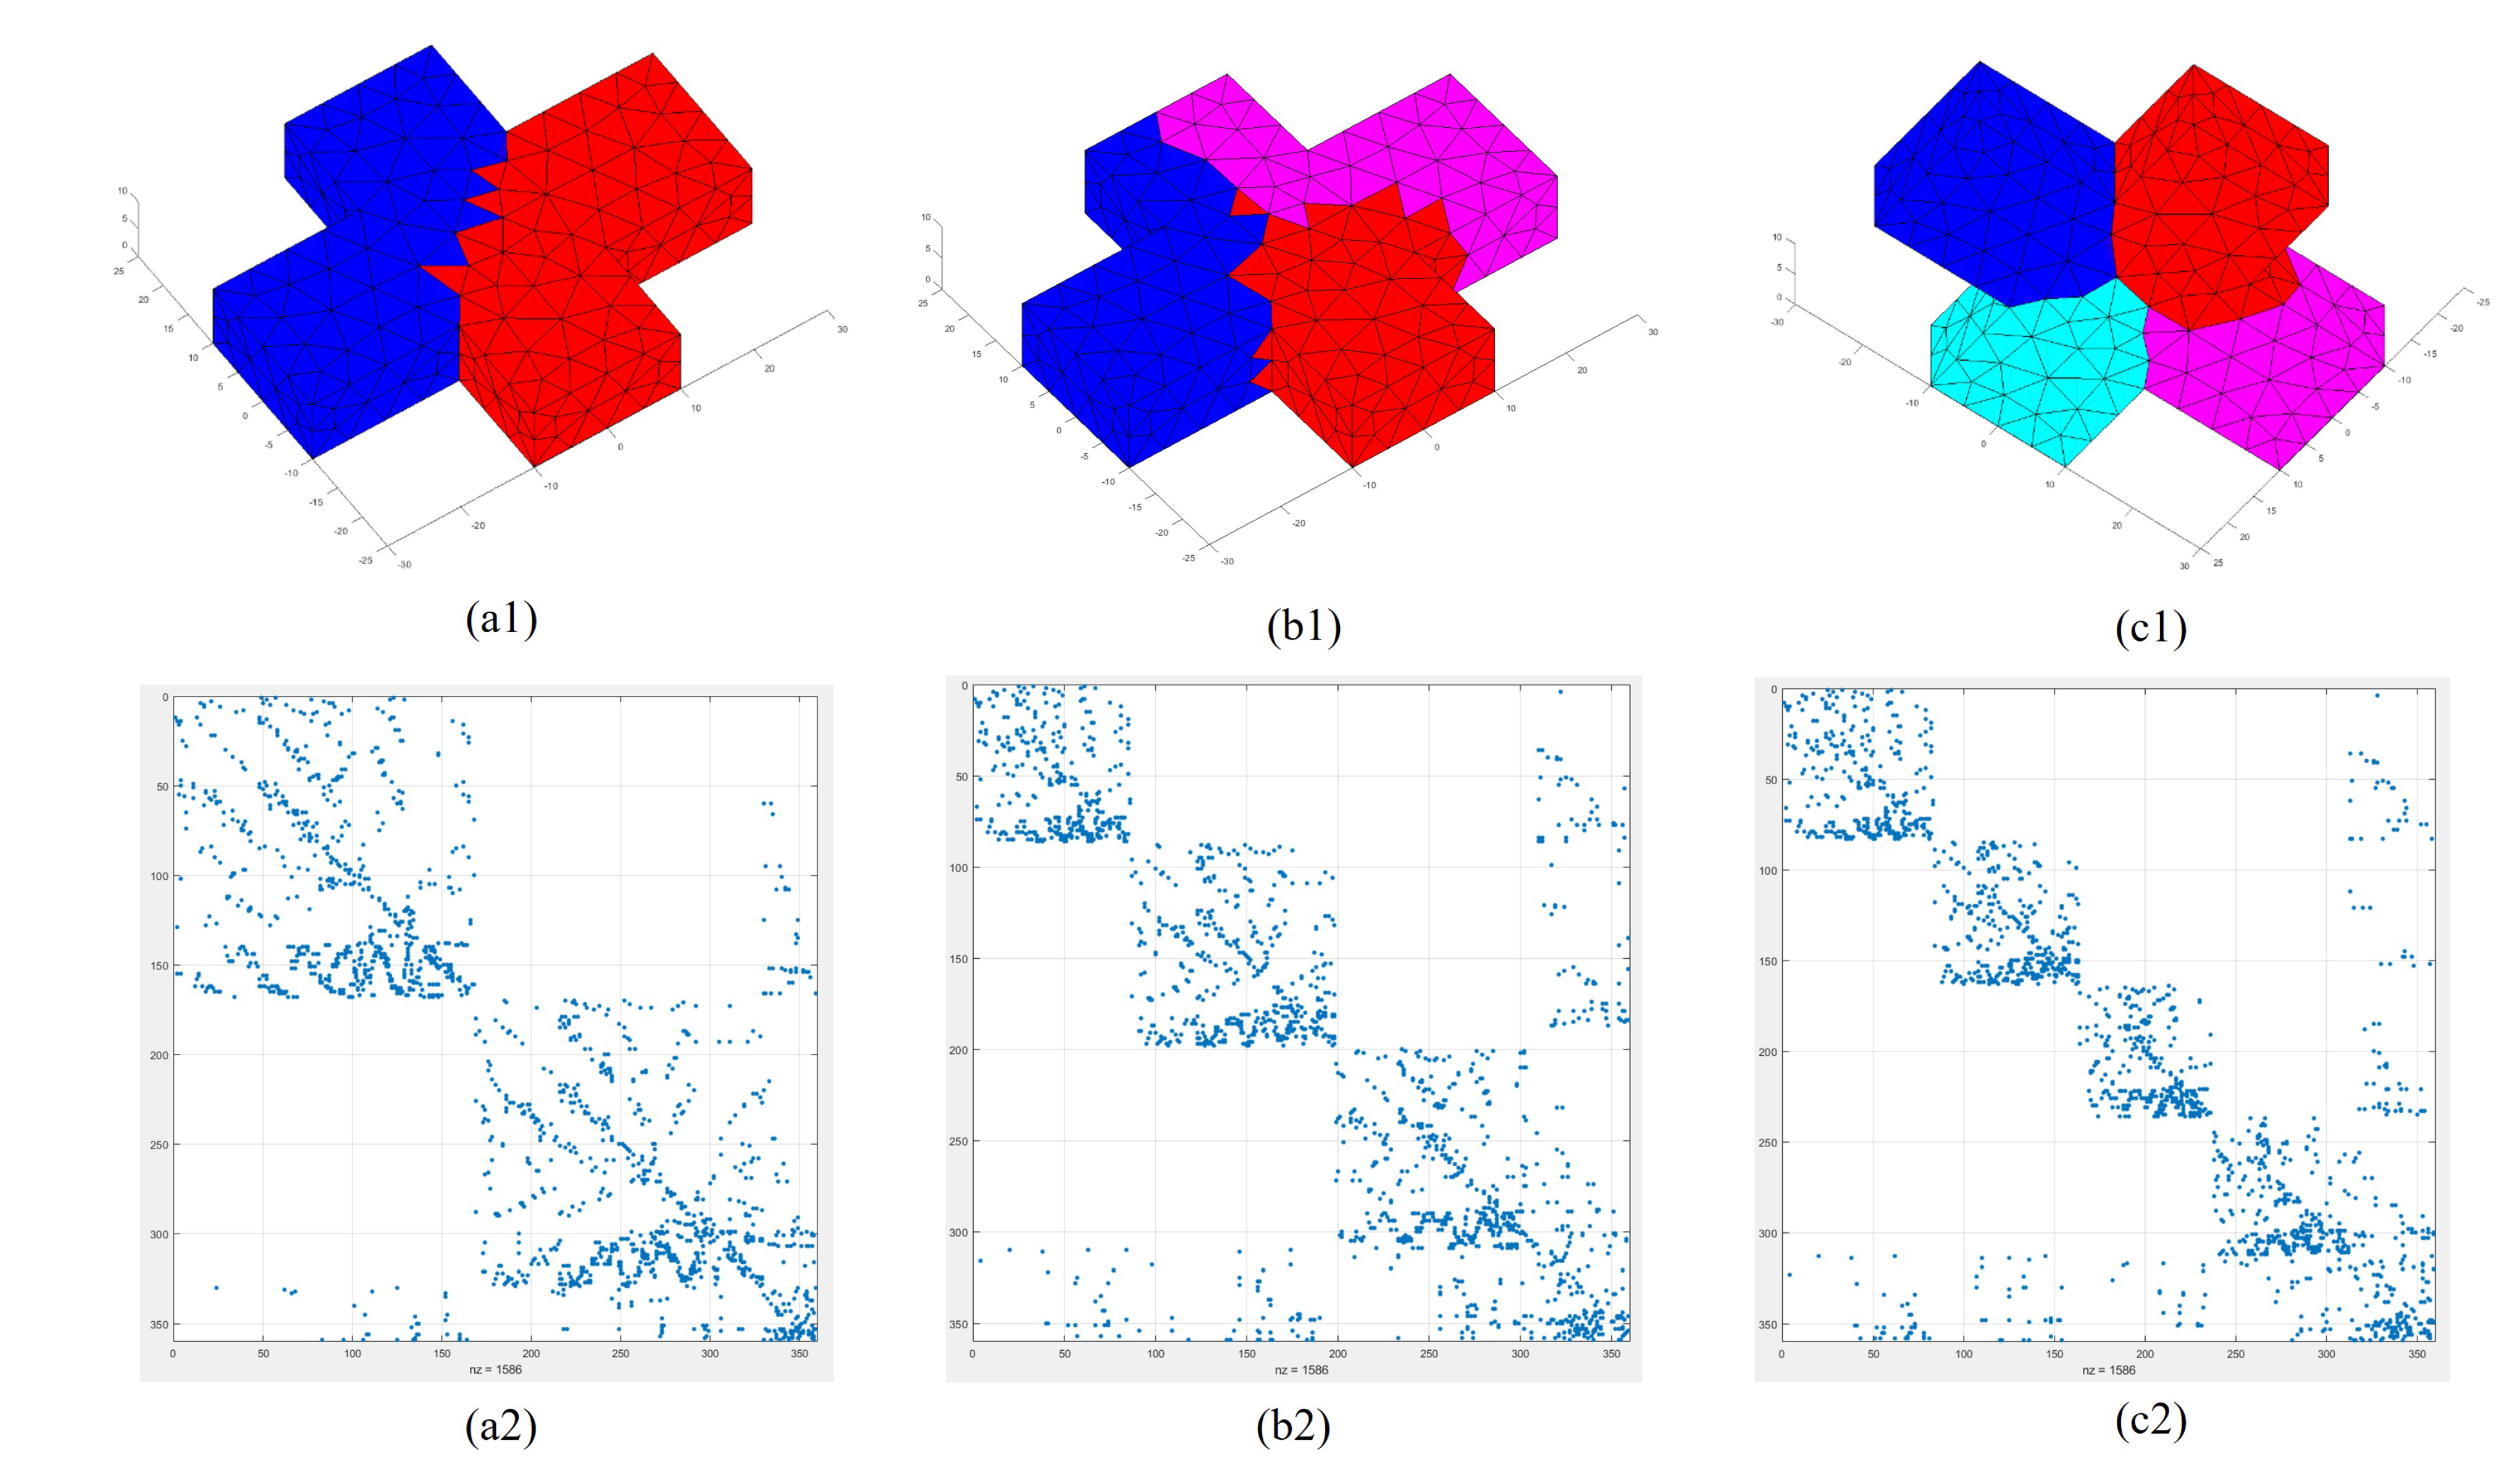
In this work, a nonuniformly meshed 31 × 31 grid with 1860 line elements and 961 nodes (1860 pseudo-nodes and 3720 pseudo-links) was demonstrated, and the associated node connection matrix was provided to the full DP algorithm (including pre- and post-processing algorithm) for its solution. The visualised sparsity pattern of a 1D mesh input node connection matrix is shown in Figure 16a. A two-dimensional right angle block with dimensions of 2 × 2 cm was studied, featuring a triangular mesh with sides of 0.5 mm. This mesh comprises 2718 triangular elements and 1440 nodes (2718 pseudo-nodes and 5436 pseudo-links). The visualised sparsity pattern of a 2D mesh input node connection matrix is shown in Figure 16b. Lastly, a 3D tetragonal mesh problem, consisting of 1138 tetrahedral elements and 359 nodes (1138 pseudo-nodes and 2276 pseudo-links), was generated on a 6 × 6 × 1 cm cross block with a mesh size of 5 mm. The sparsity pattern visualised in Figure 16c demonstrates the connections between the nodes of the domain. Each subdomain is represented by a different colour, with the domain being divided into two, three, and four distinct subdomains.

5.1. Example 1: One-Dimensional Grid Problem with 2–4 Subdomains

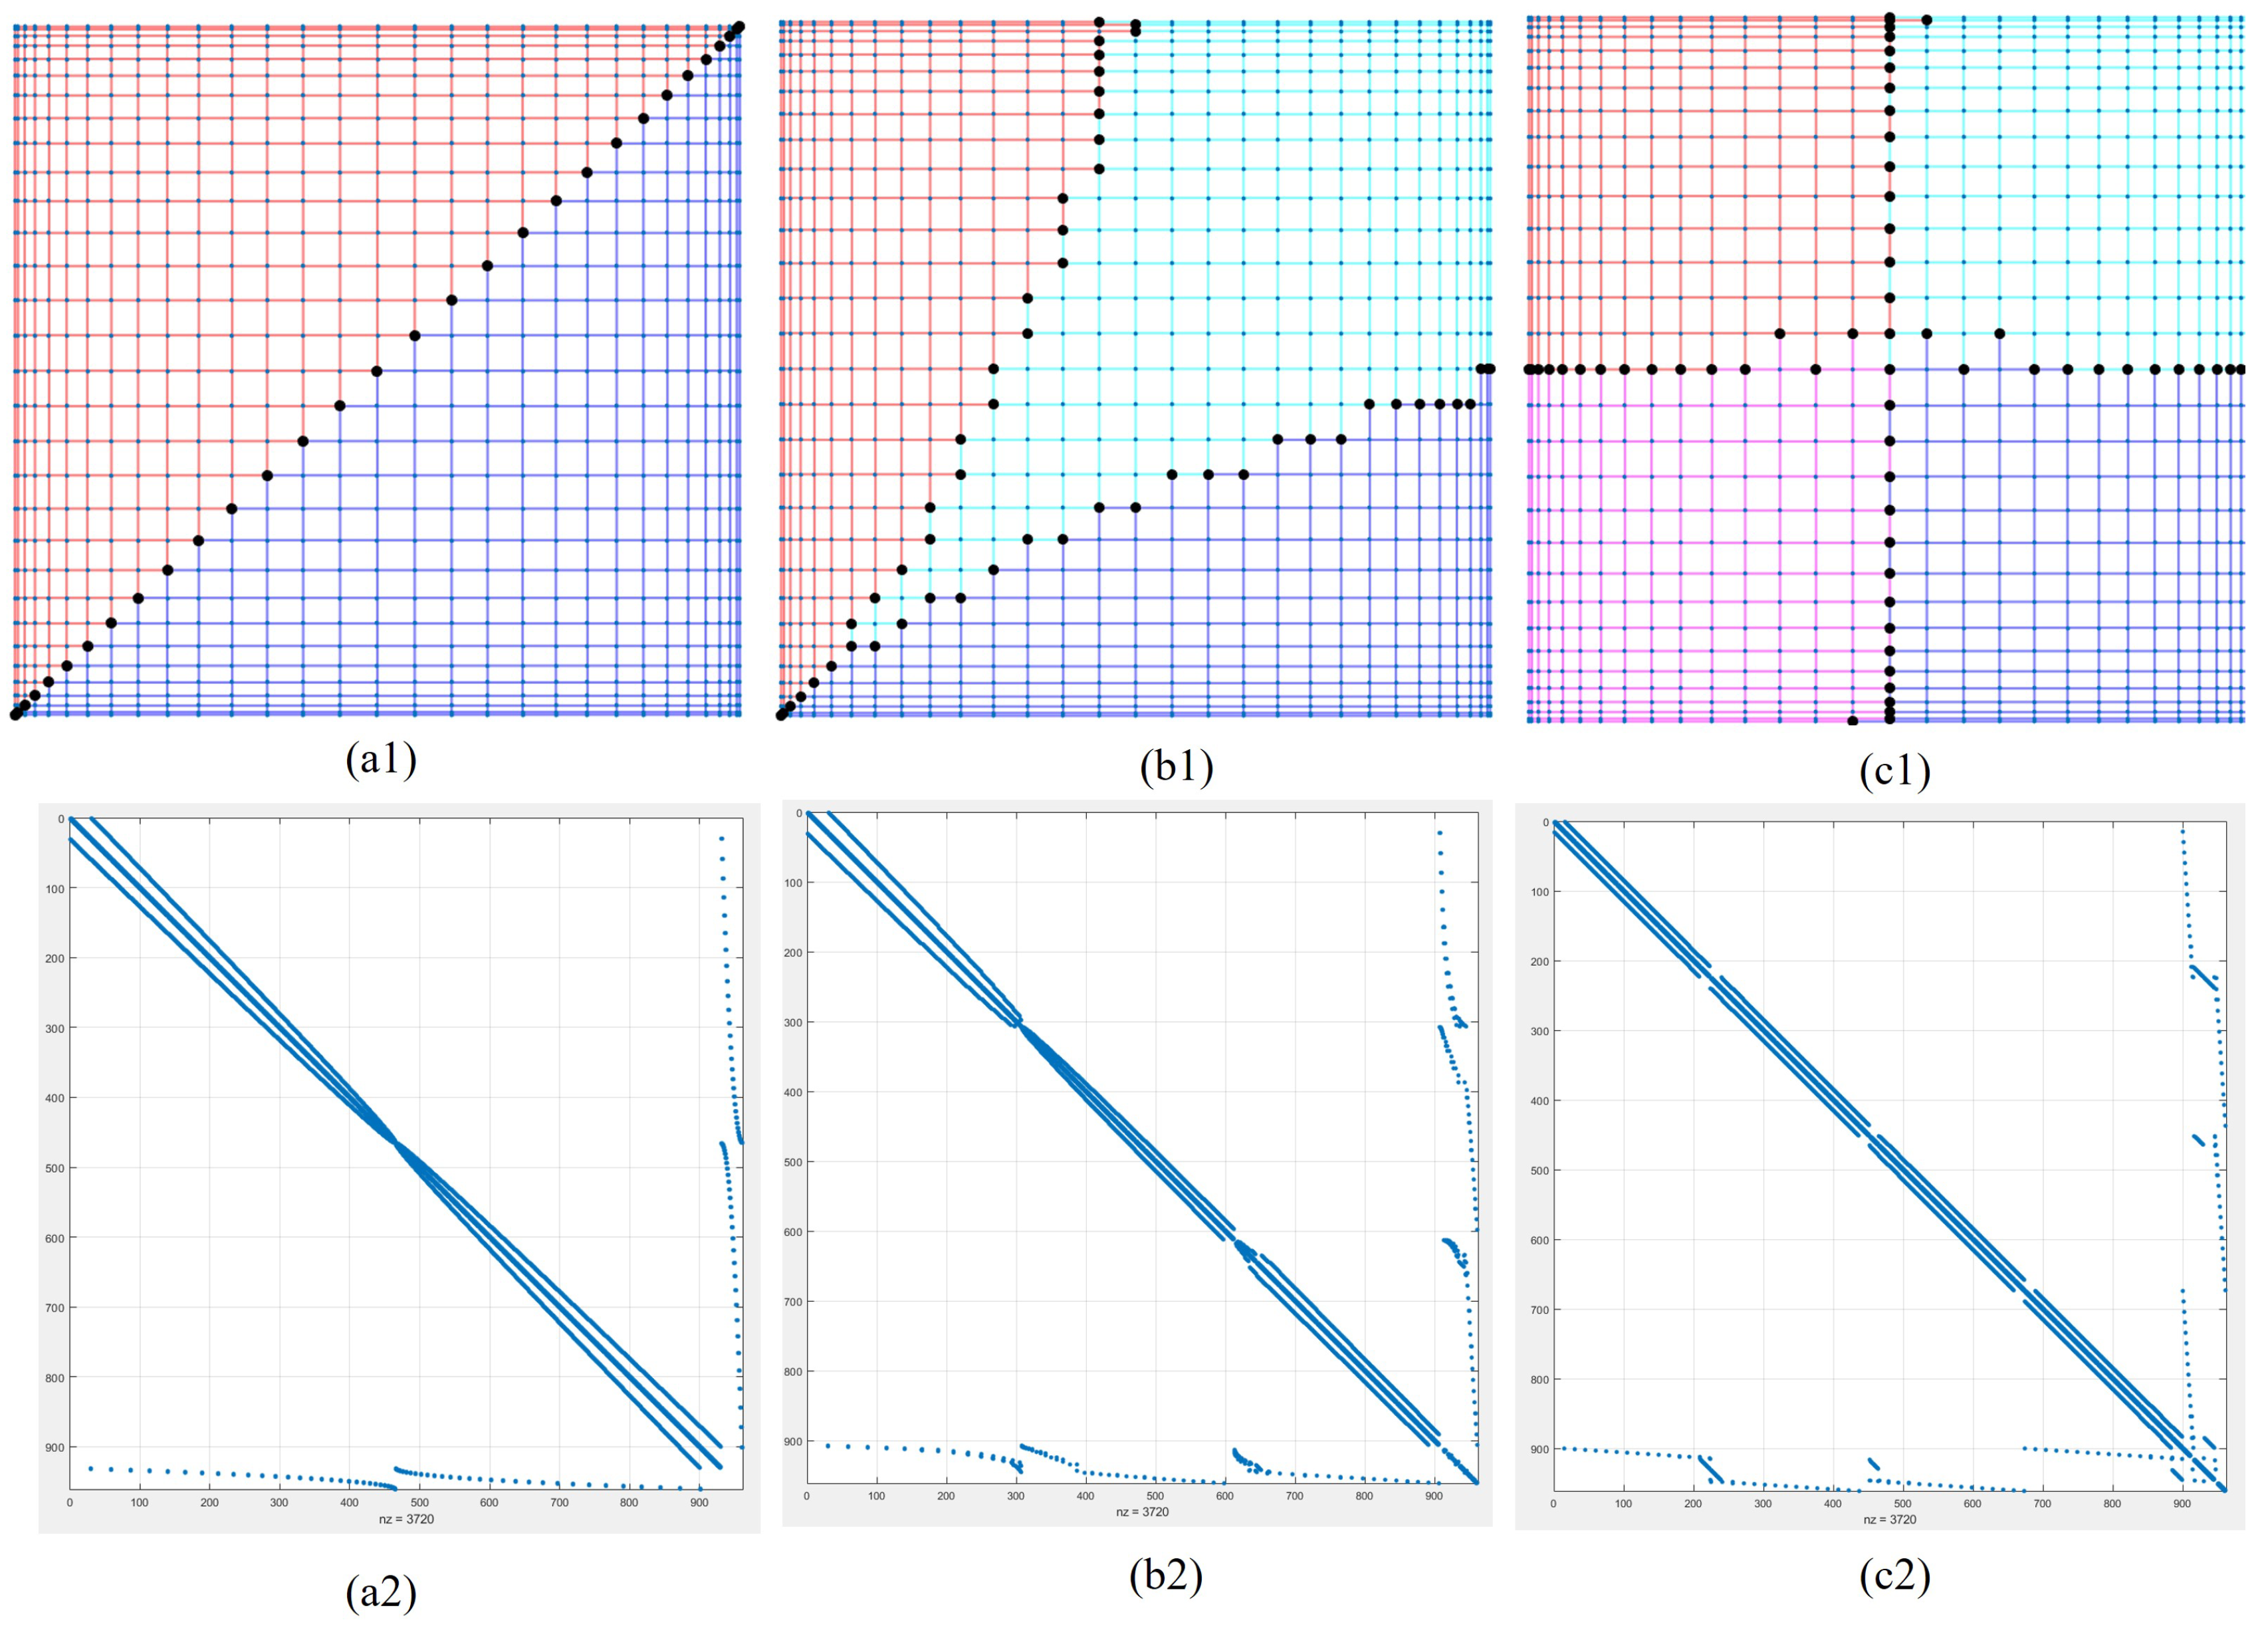
The solution of the full DP algorithm is clearly visible in Figure 17(a1, b1, c1), splitting the domain into two, three, and four subdomains, respectively. Figure 17(a1) shows the partitioning of the domain into two subdomains with 120 boundary elements and 31 boundary nodes, represented in red and blue, and the two subdomains were separated by the bolded node in black. Furthermore, Figure 17(a2) provides a visualised sparsity pattern of the node connection matrix after renumbering for two subdomains, which clearly shows the rearranging of the input matrix (Figure 16a) into two submatrices and boundary nodes at the extreme right/bottom of the rearranged matrix.
The grid domain is partitioned into three subdomains using 187 boundary elements and 55 boundary nodes, as shown in Figure 17(b1). This partitioning is illustrated in the figure by the red, blue, and cyan regions, which are separated by the black bolded node. To facilitate the rearrangement of the original input matrix, in Figure 16a, the node connection matrix is renumbered and visualised in Figure 17(b2). The sparsity pattern of the node connection matrix, as shown in Figure 17(b2), clearly reveals the three submatrices and boundary nodes at the extreme right/bottom after the rearrangement of the original matrix.
Lastly, the domain was partitioned into four distinct subdomains, as depicted in Figure 17(c1), each with 190 boundary elements and 62 boundary nodes. The boundary nodes are highlighted in black, while the subdomains are represented in red, blue, cyan, and magenta. Furthermore, Figure 17(c2) displays the sparsity pattern of the resulting node connection matrix, which was obtained by rearranging the original matrix, as shown in Figure 16a. This visualisation allows for easy identification of the four submatrices and boundary nodes located at the extreme right/bottom of the rearranged matrix.
Table 4 presents a comprehensive overview of the domain-partitioning (DP) result for a 31 × 31 grid with nonuniform meshing, partitioned into two, three, and four subdomains. The table includes the total number of elements per subdomain, the number of boundary nodes and elements for each subdomain, and the total computation time (including pre- and post-processing) on a desktop computer with an Intel i7 6th generation processor @3.4 GHz, 4 cores, and 12 GB RAM.

5.2. Example 2: Two-Dimensional Grid Problem with 2–4 Subdomains

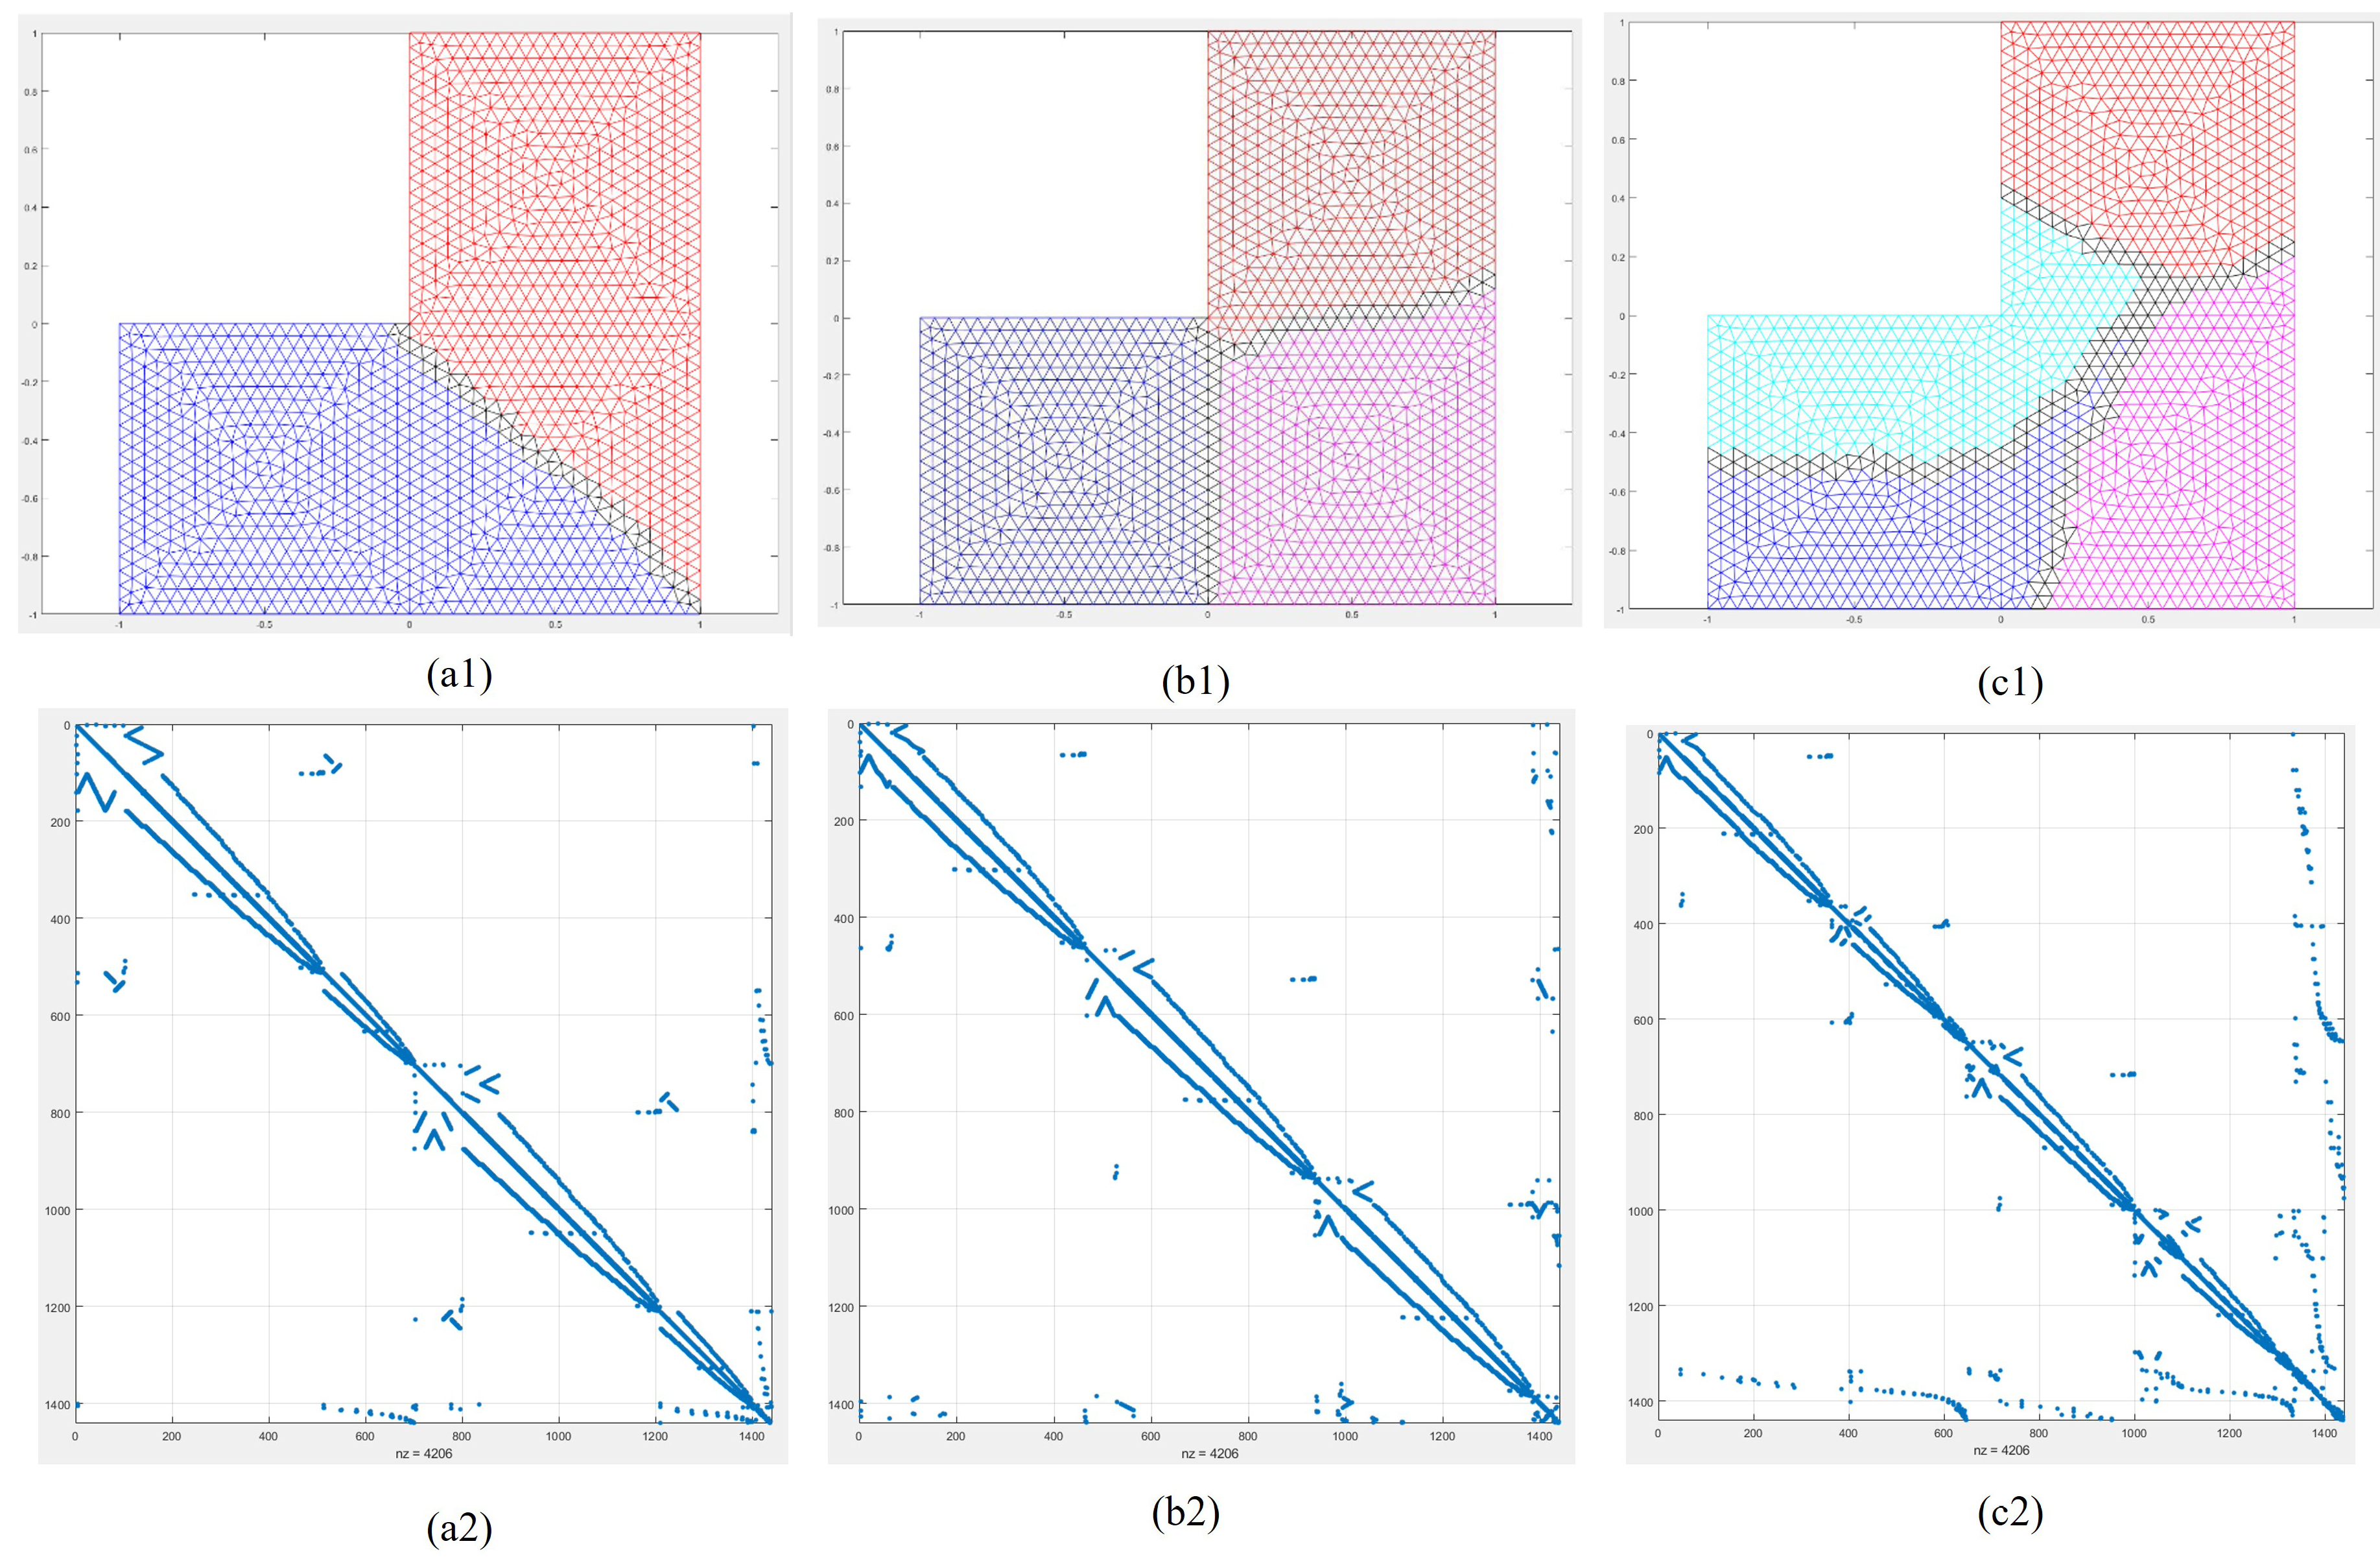
The right-angle block mesh domain is divided into two subdomains using 40 nodes and 65 boundary elements, with the first subdomain illustrated in red and the second in blue in Figure 18(a1). The visualisation in Figure 18(a1) enables easy identification of the two subdomains separated by boundary elements in black. Figure 18(a2) shows the sparsity pattern of the rearranged node connection matrix, which was obtained by rearranging the original matrix, as illustrated in Figure 16b. Simulations were carried out on the same mesh, with domain separation of three and four, respectively; 56 boundary nodes and 91 boundary elements were used for three domains, and 108 boundary nodes and 183 boundary elements for four domains (see Figure 18(b1) and (c1), respectively). The sparsity patterns of the corresponding node connection matrices, after renumbering, are visualised in Figure 18(b2) and (c2), respectively, which depict the rearrangement of the input matrix, shown in Figure 16b, into three, and four submatrices, with boundary nodes located at the extreme right/bottom.
Table 5 presents a summary of the results of the domain-partitioning (DP) algorithm, which was implemented on a desktop computer with an Intel i7 6th generation processor @3.4 GHz, 4 cores, and 12 GB RAM. The table includes the number of boundary nodes and boundary elements for each partition, the total number of elements per subdomain, and the complete computation time (including pre- and post-processing) for two, three and four subdomains.

5.3. Example 3: Three-Dimensional Grid Problem with 2–4 Subdomains

The 3D tetragonal mesh domain was divided into two subdomains, with 30 nodes and 53 boundary elements, as illustrated in Figure 19(a1). This visualisation makes it easy to identify the two subdomains, with the first subdomain illustrated in red and the second in blue. The sparsity pattern of the rearranged node connection matrix, obtained by rearranging the original matrix, is shown in Figure 19(a2). Additionally, simulations were carried out on the same mesh, but with domain separation of three and four, respectively. For the three domains, 50 boundary nodes and 109 boundary elements were used, and for the four domains, 47 boundary nodes and 99 boundary elements were used, as shown in Figure 19(b1,c1). The resulting sparsity patterns of the node connection matrices, after renumbering, are visualised in Figure 19(b2,c2). These figures illustrate the rearrangement of the input matrix, shown in Figure 16c, into three and four submatrices, with boundary nodes located at the extreme right/bottom.
Table 6 presents the results of a three-dimensional tetrahedral finite element mesh with partitioning into two, three, and four subdomains. The number of boundary nodes and boundary elements are listed for each partition, as well as the total number of elements per subdomain. Additionally, the computation time (including both pre- and post-processing) used the same desktop computer configuration as mentioned in the previous section These data provide a useful reference for researchers interested in exploring the performance of three-dimensional tetrahedral finite element meshes partitioned into different subdomains.

6. Conclusions and Suggested Future Works

In this work, a novel heuristic domain-partitioning (DP) algorithm was explained with great details. This current work has the following novel features: (i) Graph theories are not needed, since all (basic) seven steps involved in the proposed algorithm (including the enhancement features discussed in Section 3) are based on engineering common sense observations. (ii) Unified treatments of transportation networks (using line elements) and finite element (FE) meshes (using triangular, tetrahedral, brick elements) can be conducted through transforming the original network (or FE mesh) into a pseudo-transportation network which only uses line elements. Several examples (in transportation engineering networks and general-purpose finite element meshes) were tested to evaluate the performance of the proposed partitioning algorithm. Numerical comparisons with the popular METIS software indicated that the developed algorithm resulted in a significantly fewer number of system boundary nodes for eight out of the nine tested cases in large-scale (real-life) transportation networks. For DP finite element meshes, minimising the number of system boundary nodes will lead to minimising the communication time amongst different processors in parallel computing environments. Efforts are underway to incorporate the developed DP algorithm into general purpose FEA for solving statics and general Eigen-value problems, which will be reported on in the near future.

Author Contributions

J.B.: conceptualization, validation, formal analysis, visualization, writing—original draft preparation; S.A.: project administration, writing—review and editing; E.T.: resources, data curation; D.T.N.: supervision, project administration, writing—review and editing. All authors have read and agreed to the published version of the manuscript.

Funding

This research received no external funding.

Data Availability Statement

Not applicable.

Conflicts of Interest

The authors declare no conflict of interest.

References

  1. Johnson, P.; Nguyen, D.; Ng, M. Large-scale network partitioning for decentralised traffic management and other transportation applications. J. Intell. Transp. Syst. 2016, 20, 461–473. [Google Scholar] [CrossRef]
  2. Bank, R.E.; Holst, M. A New Paradigm for Parallel Adaptive Meshing Algorithms. SIAM J. Sci. Comput. 2000, 22, 1411–1443. [Google Scholar] [CrossRef] [Green Version]
  3. Achdou, Y.; Kuznetsov, Y.; Pironneau, O. Substructuring preconditioners for the mortar element method. Numer. Math. 1995, 71, 419–449. [Google Scholar] [CrossRef]
  4. deCougny, H.; Devine, K.; Flaherty, J.; Loy, R.; Özturan, C.; Shephard, M. Load balancing for the parallel adaptive solution of partial differential equations. Appl. Numer. Math. 1994, 16, 157–182. [Google Scholar] [CrossRef]
  5. Flaherty, J.; Loy, R.; Özturan, C.; Shephard, M.; Szymanski, B.; Teresco, J.; Ziantz, L. Parallel structures and dynamic load balancing for adaptive finite element computation. Appl. Numer. Math. 1998, 26, 241–263. [Google Scholar] [CrossRef]
  6. Fox, G.C.; Williams, R.D.; Messina, P.C. Parallel Computing Works! Parallel Processing Scientific Computing, Morgan Kaufmann: San Francisco, CA, USA, 1994. [Google Scholar]
  7. Kohn, S.; Weare, J.; Ong, M.E.; Baden, S. Software Abstractions and Computational Issues in Parallel Structured Adaptive Mesh Methods for Electronic Structure Calculations. Struct. Adapt. Mesh Refinement SAMR Grid Methods 2000, 117, 75–95. [Google Scholar]
  8. Selwood, P.M.; Berzins, M.; Dew, P.M. 3D Parallel Mesh Adaptivity: Data-Structures and Algorithms. In Proceedings of the SIAM Conference on Parallel Processing for Scientific Computing, Minneapolis, MN, USA, 14–17 March 1997. [Google Scholar]
  9. Walshaw, C.; Berzins, M. Dynamic load-balancing for PDE solvers on adaptive unstructured meshes. Concurr. Pract. Exp. 1995, 7, 17–28. [Google Scholar] [CrossRef]
  10. Williams, R.D. Performance of dynamic load balancing algorithms for unstructured mesh calculations. Concurr. Pract. Exp. 1991, 3, 457–481. [Google Scholar] [CrossRef]
  11. Nguyen, D.T. Finite Element Methods: Parallel-Sparse Statics and Eigen-Solutions; Springer: Berlin/Heidelberg, Germany, 2016. [Google Scholar]
  12. Bathe, K.J. Finite Element Procedures; Prentice Hall: Englewood Cliffs, NJ, USA, 1996. [Google Scholar]
  13. Hughes, T.J.R. The Finite Element Method: Linear Static and Dynamic Finite Element Analysis; Prentice-Hall: Englewood Cliffs, NJ, USA, 1987. [Google Scholar]
  14. Tallec, P.; Roeck, Y.; Vidrascu, M. Domain decomposition methods for large linearly elliptic three-dimensional problems. J. Comput. Appl. Math. 1991, 34, 93–117. [Google Scholar] [CrossRef] [Green Version]
  15. Reddy, J.N. An Introduction to the Finite Element Method, 3rd ed.; McGraw-Hill Series in Mechanical Engineering; McGraw-Hill: Boston, MA, USA, 2005. [Google Scholar]
  16. Dinh-Cong, D.; Nguyen-Thoi, T.; Nguyen, D.T. A FE model updating technique based on SAP2000-OAPI and enhanced SOS algorithm for damage assessment of full-scale structures. Appl. Soft Comput. 2020, 89, 106100. [Google Scholar] [CrossRef]
  17. CEE-718/815; Engineering Optimization, Spring 2022. Old Dominion University (ODU): Norfolk, VA, USA, 2022.
  18. Thompson, E.; Kontinis, M. Engineering-Based Heuristic Partitioning Algorithm For Finite Element Analysis of Field Problems; A Master Project Report; Mechanical & Aerospace Engineering (MAE) Department, Old Dominion University (ODU): Norfolk, VA, USA, 2022. [Google Scholar]
  19. Bramble, J.H.; Pasciak, J.E.; Schatz, A.H. The construction of preconditioners for elliptic problems by substructuring. I. Math. Comput. 1986, 47, 103–134. [Google Scholar] [CrossRef]
  20. Papadrakakis, M.; Stavroulakis, G.; Karatarakis, A. A new era in scientific computing: Domain decomposition methods in hybrid CPU–GPU architectures. Comput. Methods Appl. Mech. Eng. 2011, 200, 1490–1508. [Google Scholar] [CrossRef]
  21. Karypis, G.; Kumar, V. METIS: A Software Package for Partitioning Unstructured Graphs, Partitioning Meshes, and Computing Fill-Reducing Orderings of Sparse Matrices. Technical Report 97-061; University of Minnesota, Department of Computer Science and Engineering: Minneapolis, MN, USA, 1997. [Google Scholar]
  22. Berger, M.J.; Bokhari, S.H. A Partitioning Strategy for Nonuniform Problems on Multiprocessors. IEEE Trans. Comput. 1987, C-36, 570–580. [Google Scholar] [CrossRef] [Green Version]
  23. Karypis, G.; Kumar, V. Multilevel Algorithms for Multi-Constraint Graph Partitioning. In Proceedings of the IEEE/ACM SC98 Conference; IEEE: Orlando, FL, USA, 7–13 November 1998; p. 28. [Google Scholar]
  24. Spielman, D.A.; Teng, S.H. Spectral partitioning works: Planar graphs and finite element meshes. Linear Algebra Its Appl. 2007, 421, 284–305. [Google Scholar] [CrossRef] [Green Version]
  25. Tran-Ngoc, H.; Khatir, S.; Le-Xuan, T.; De Roeck, G.; Bui-Tien, T.; Abdel Wahab, M. Finite element model updating of a multispan bridge with a hybrid metaheuristic search algorithm using experimental data from wireless triaxial sensors. Eng. Comput. 2022, 38, 1865–1883. [Google Scholar] [CrossRef]
  26. Annicchiarico, W.; Cerrolaza, M. Structural shape optimization 3D finite-element models based on genetic algorithms and geometric modeling. Finite Elem. Anal. Des. 2001, 37, 403–415. [Google Scholar] [CrossRef]
  27. Tran-Ngoc, H.; Khatir, S.; Le-Xuan, T.; Tran-Viet, H.; De Roeck, G.; Bui-Tien, T.; Wahab, M.A. Damage assessment in structures using artificial neural network working and a hybrid stochastic optimization. Sci. Rep. 2022, 12, 4958. [Google Scholar] [CrossRef] [PubMed]
  28. Xu, J. Iterative Methods by Space Decomposition and Subspace Correction. SIAM Rev. 1992, 34, 581–613. [Google Scholar] [CrossRef] [Green Version]
  29. GIT-Hub Repository. Available online: https://github.com/bstabler/TransportationNetworks/find/master (accessed on 15 May 2022).
Figure 1. Seven-step domain-partitioning algorithm.
Designs 07 00082 g001
Figure 2. Element connectivity information (E: element; N: nodes): (a) two-node (LINE) elements; (b) three-node (TRIANGULAR) elements; (c) eight-node (BRICK) elements. The figure shows only portions of the “original network” with two-node LINE elements, three-node TRIANGULAR elements, and eight-node brick elements, for 1D, 2D, and 3D analysis, respectively.
Designs 07 00082 g002
Figure 3. Element connectivity information: (a) four-node (QUADRILATERAL) elements; (b) four-node (TETRAHEDRAL) elements. The figure shows only portions of the “original network” four-node TRIANGULAR elements and four-node brick elements, for 2D and 3D analysis, respectively.
Designs 07 00082 g003
Figure 4. (E: element; N: nodes): (a) “Original FEM Network” with five nodes and seven links; (b) connectivity matrix information.
Designs 07 00082 g004
Figure 5. (a) “Transformed Network” with seven pseudo-nodes and fourteen pseudo-links; (b) connectivity matrix information.
Designs 07 00082 g005
Figure 6. (a) The “original network” with eight nodes and 6/8 (TRIANGULAR) elements (E: element; N: nodes). Network-1 contains eight nodes and six elements represented by solid lines, while Network-2 contains eight nodes and eight elements, of which six elements are represented by solid lines and two elements are represented by dotted lines; (b) connectivity matrix information.
Designs 07 00082 g006
Figure 7. (a) The “Transformed Network” with “6 and 8 pseudo-nodes” and “5 and 9 pseudo-links”, (L: pseudo-link ; E: element; N: nodes); (b) connectivity matrix information.
Designs 07 00082 g007
Figure 8. (a) Original FEM network with sixteen nodes and three (eight-node BRICK) elements; (b) connectivity matrix information.
Designs 07 00082 g008
Figure 9. (a) “Transformed Network” with three pseudo-nodes and two pseudo-links, (L: pseudo-link; E: element; N: nodes); (b) connectivity matrix information.
Designs 07 00082 g009
Figure 10. (a) “Original FEM Network” with six nodes and three (four-node TETRAHEDRAL) elements (E: element; N: modes); (b) connectivity matrix information.
Designs 07 00082 g010
Figure 11. (a) “Transformed Network” with three pseudo-nodes and two pseudo-links (L: pseudo-link); (b) connectivity matrix information.
Designs 07 00082 g011
Figure 12. Visualised sparsity pattern of node connection matrix for Anaheim network.
Designs 07 00082 g012
Figure 13. Visualised sparsity pattern of node connection matrix for the Austin network.
Designs 07 00082 g013
Figure 14. Visualised sparsity pattern of the node connection matrix for the Philadelphia network.
Designs 07 00082 g014
Figure 15. Overall summary column plot for the “general SDPA” and METIS algorithms. The y-axis is the percentage ratio of boundary nodes to total nodes, and the x-axis is the number of partitions ranging from two to four subdomains for different real-life transportation networks.
Designs 07 00082 g015
Figure 16. Visualised sparsity pattern of node connection matrix for the finite element meshes problem; (a) nonuniform 1D grid problem; (b) right-angle block 2D mesh problem; (c) 3D tetragonal mesh problem.
Designs 07 00082 g016
Figure 17. Example 1: One-dimensional grid problem with 2–4 subdomains. (a1) Nonuniform 1D grid DP into two subdomains, as red and blue with black boundary nodes. (a2) Node connection matrix for DP into two subdomains. (b1) Nonuniform 1D grid DP into three subdomains, as red, cyan, and blue with black boundary nodes. (b2) Node connection matrix for DP into three subdomains. (c1) Nonuniform 1D grid DP into four subdomains, as red, cyan, magenta and blue with black boundary nodes. (c2) Node connection matrix for DP into four subdomains.
Designs 07 00082 g017
Figure 18. Example 2: Two-dimensional grid problem with 2–4 subdomains. (a1) Triangular 2D mesh DP into two subdomains, as red and blue with black boundary elements. (a2) Node connection matrix for DP into two subdomains. (b1) Triangular 2D mesh DP into three subdomains, as red, cyan, and blue with black boundary elements. (b2) Node connection matrix for DP into three subdomains. (c1) Triangular 2D mesh DP into four subdomains, as red, cyan, magenta and blue with black boundary elements. (c2) Node connection matrix for DP into four subdomains.
Designs 07 00082 g018
Figure 19. Example 3: Three-dimensional grid problem with 2–4 subdomains. (a1) Three-dimensional tetragonal mesh DP into two subdomains, with red and blue. (a2) Node connection matrix for DP into two subdomains. (b1) Three-dimensional tetragonal mesh DP into three subdomains, as red, cyan, and blue. (b2) Node connection matrix for DP into three subdomains. (c1) Three-dimensional tetragonal mesh DP in four subdomains, as red, cyan, magenta and blue. (c2) Node connection matrix for DP into four subdomains.
Designs 07 00082 g019
Table 1. Summary table of the Anaheim network. Comparison of SDPA’s number of boundary nodes and time with METIS. Computation time is in seconds for each step for SDPA. Total solution time is the summation of all seven steps of the SDPA solution timing using a desktop computer with an intel i7 processor, 6th generation, 3.4 GHz, 4 core, RAM 12 GB. ** METIS solution time based on using high-performance computer (Intel Xeon E5-2670 v2 2.50 GHz, 20 core, RAM 128 GB [1]) using FORTRAN shell program, which is called METIS, written in C.
NP = 2NP = 3NP = 4
NodesBoundary ElementsNodesBoundary ElementsNodesBoundary Elements
Subdomain 1212153102
Subdomain 2204 144 108
Subdomain 3451196410472
Subdomain 4 102
Total Nodes416 416 416
Metis Boundary Nodes41681416162416160
Step 1 Time0.02910.02810.035
Step 2 Time0.00240.00240.0022
Step 3 Time0.00180.0140.0016
Step 4 Time0.11270.17760.2489
Step 5 Time0.02380.02580.0297
Step 6 Time0.02450.02970.0246
Step 7 Time0.01360.01660.0138
Total Solution Time ⌃⌃0.20800.28160.3564
MeTiS Solution Time **0.0030.0030.004
Table 2. Summary table of the Austin network. Comparison of the proposed DP algorithm with METIS. Computation time in seconds for each of the proposed seven steps of the DP algorithm.
NP = 2NP = 3NP = 4
NodesBoundary ElementsNodesBoundary ElementsNodesBoundary Elements
Subdomain 1378826911976
Subdomain 23600 2159 1716
Subdomain 326525383292009414
Subdomain 4 1687
Total Nodes7388 7388 7388
METIS Boundary Nodes7388878738887273881221
Step 1 Time (s)0.13260.13850.1470
Step 2 Time (s)0.42650.36570.3881
Step 3 Time (s)0.00350.00230.0026
Step 4 Time (s)16.37026.07940.629
Step 5 Time (s)0.53820.50280.5074
Step 6 Time (s)1.25161.56581.3411
Step 7 Time (s)0.08820.08740.1122
Total Time (s) ⌃⌃18.80928.74243.128
MeTiS Time (s) **0.0060.0090.01
Table 3. Summary table of the Philadelphia network. Comparison of “general SDPA” with METIS algorithms. Computation time in seconds for each step in SDPA.
NP = 2NP = 3NP = 4
NodesBoundary ElementsNodesBoundary ElementsNodesBoundary Elements
Subdomain 1750253683525
Subdomain 25887 1797 731
Subdomain 337062246034994548
Subdomain 4 4139
Total Nodes13389 13389 13389
METIS Boundary Nodes1338977313389393133891080
Step 1 Time (s)0.32820.30450.2839
Step 2 Time (s)1.2281.32341.2617
Step 3 Time (s)0.00330.00310.0031
Step 4 Time (s)53.28589.893121.97
Step 5 Time (s)2.34352.60172.7539
Step 6 Time (s)5.21566.04766.3865
Step 7 Time (s)0.11720.14780.1363
Total Time (s) ⌃⌃62.521100.321132.796
MeTiS Time (s) **0.080.0260.013
Table 4. Summary table of nonuniform 1D grid problem. All computation times are in seconds.
NP = 2NP = 3NP = 4
ElementsBoundary ElementsElementsBoundary ElementsElementsBoundary Elements
Subdomain 1 (red)930620465
Subdomain 2 (blue)930 620 465
Subdomain 3 (cyan)120620187465190
Subdomain 4 (magenta) 465
Total FEM Elements1860 1860 1860
FEM Nodes961319615596162
Pre-processing Time100.6093.9990.81
Step 1 Time0.0250.0150.0129
Step 2 Time0.00510.00340.0029
Step 3 Time0.00320.00210.0022
Step 4 Time0.0470.0370.03
Step 5 Time0.0570.0390.06
Step 6 Time0.0310.0180.03
Step 7 Time0.0200.0140.02
Post-processing Time0.6050.920.98
Total Time ⌃⌃101.3995.04291.93
Table 5. Summary table of triangular 2D mesh problem. All computation times are in seconds.
NP = 2NP = 3NP = 4
ElementsBoundary ElementsElementsBoundary ElementsElementsBoundary Elements
Subdomain 1 (red)1359907707
Subdomain 2 (blue)1359 907 614
Subdomain 3 (magenta)6590491707183
Subdomain 4 (cyan) 690
Total FEM Elements2718 2718 2718
FEM Nodes1440401440561440108
Pre-processing Time205.8197.49205.67
Step 1 Time0.0120.010.01
Step 2 Time0.00310.00280.0029
Step 3 Time0.00220.00240.0022
Step 4 Time0.0350.0480.04
Step 5 Time0.0830.1020.094
Step 6 Time0.0140.0180.015
Step 7 Time0.0180.0030.0029
Post-processing Time0.1990.311.01
Total Time ⌃⌃206.15197.988206.84
Table 6. Summary table of 3D (tetrahedral) mesh problem. The computational times are in seconds.
NP = 2NP = 3NP = 4
ElementsBoundary ElementsElementsBoundary ElementsElementsBoundary Elements
Subdomain 1 (red)579327298
Subdomain 2 (blue)559 403 277
Subdomain 3 (magenta)5340810927999
Subdomain 4 (cyan) 284
Total FEM Elements1138 1138 1138
FEM Nodes359303595035947
Pre-processing Time34.6936.6534.32
Step 1 Time0.010.0110.01
Step 2 Time0.00320.00250.0025
Step 3 Time0.00210.00210.0023
Step 4 Time0.0260.0320.026
Step 5 Time0.030.0390.028
Step 6 Time0.0160.01370.013
Step 7 Time0.0020.0030.0023
Post-processing Time0.110.38970.29
Total Time ⌃⌃34.8937.146134.70
Disclaimer/Publisher’s Note: The statements, opinions and data contained in all publications are solely those of the individual author(s) and contributor(s) and not of MDPI and/or the editor(s). MDPI and/or the editor(s) disclaim responsibility for any injury to people or property resulting from any ideas, methods, instructions or products referred to in the content.