
Design of Electrical Characterization Method for Electroporation-Treated Biological Tissues


Abstract
1. Introduction
2. Materials and Methods
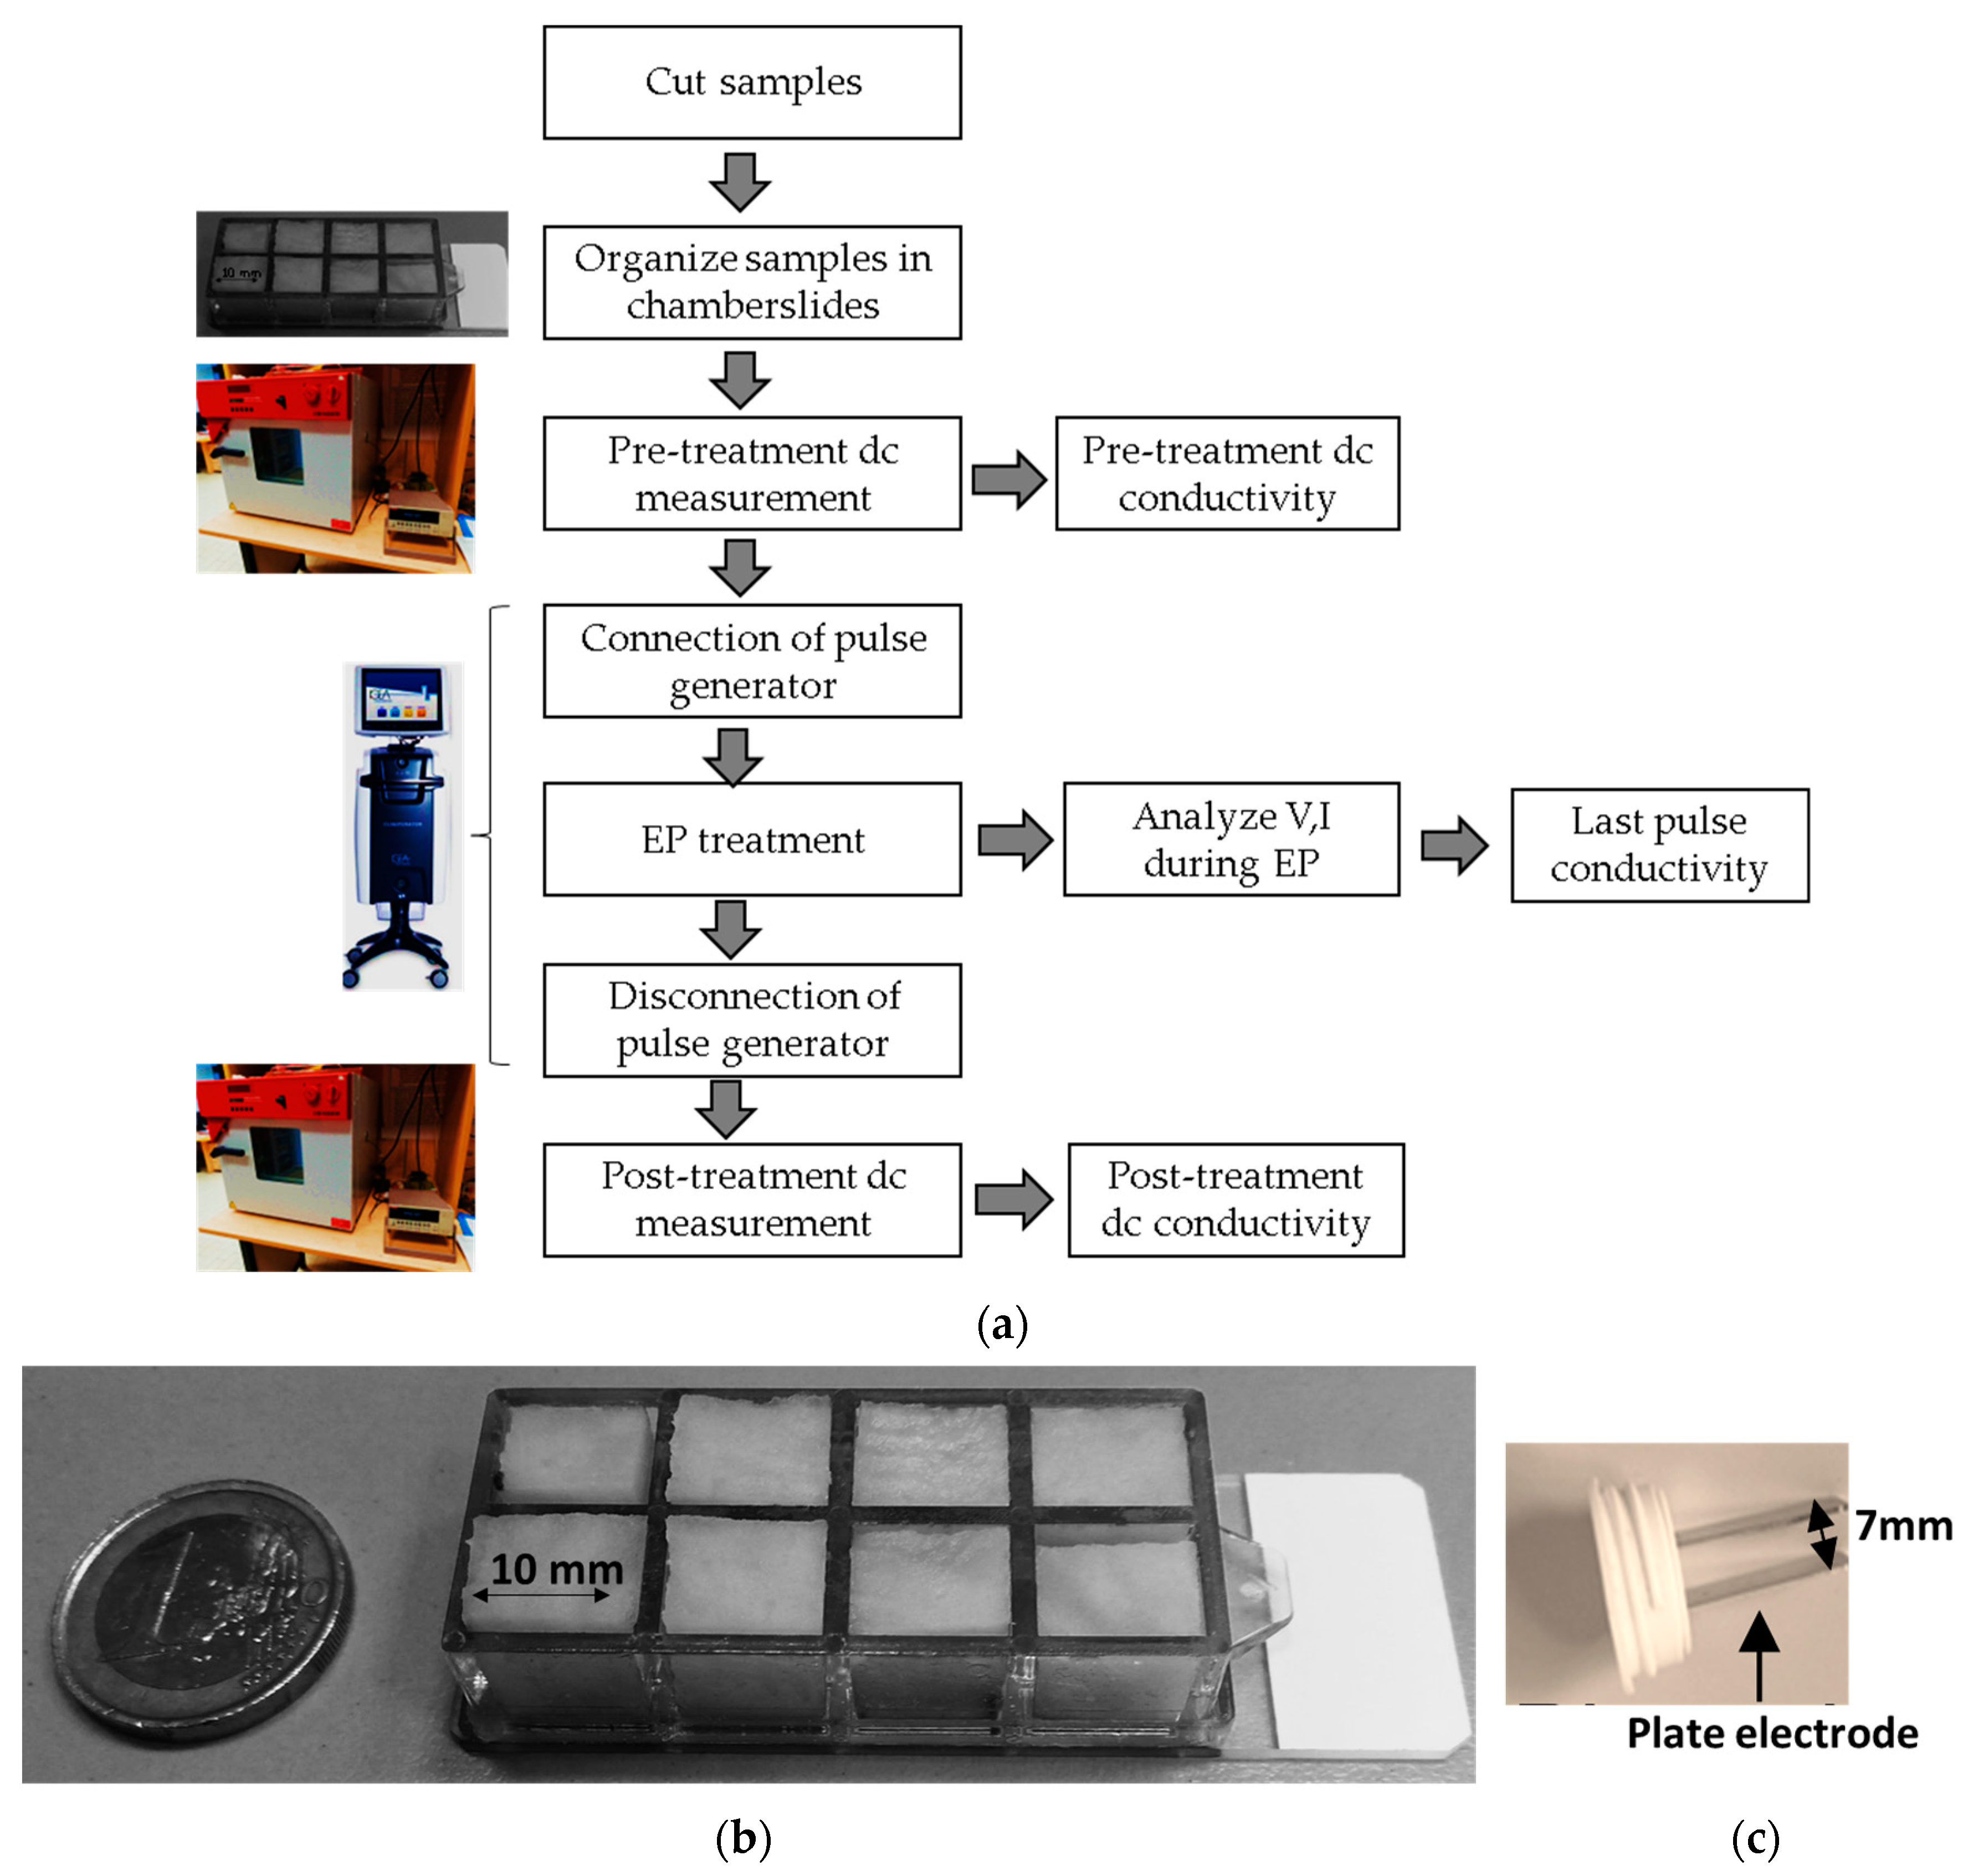
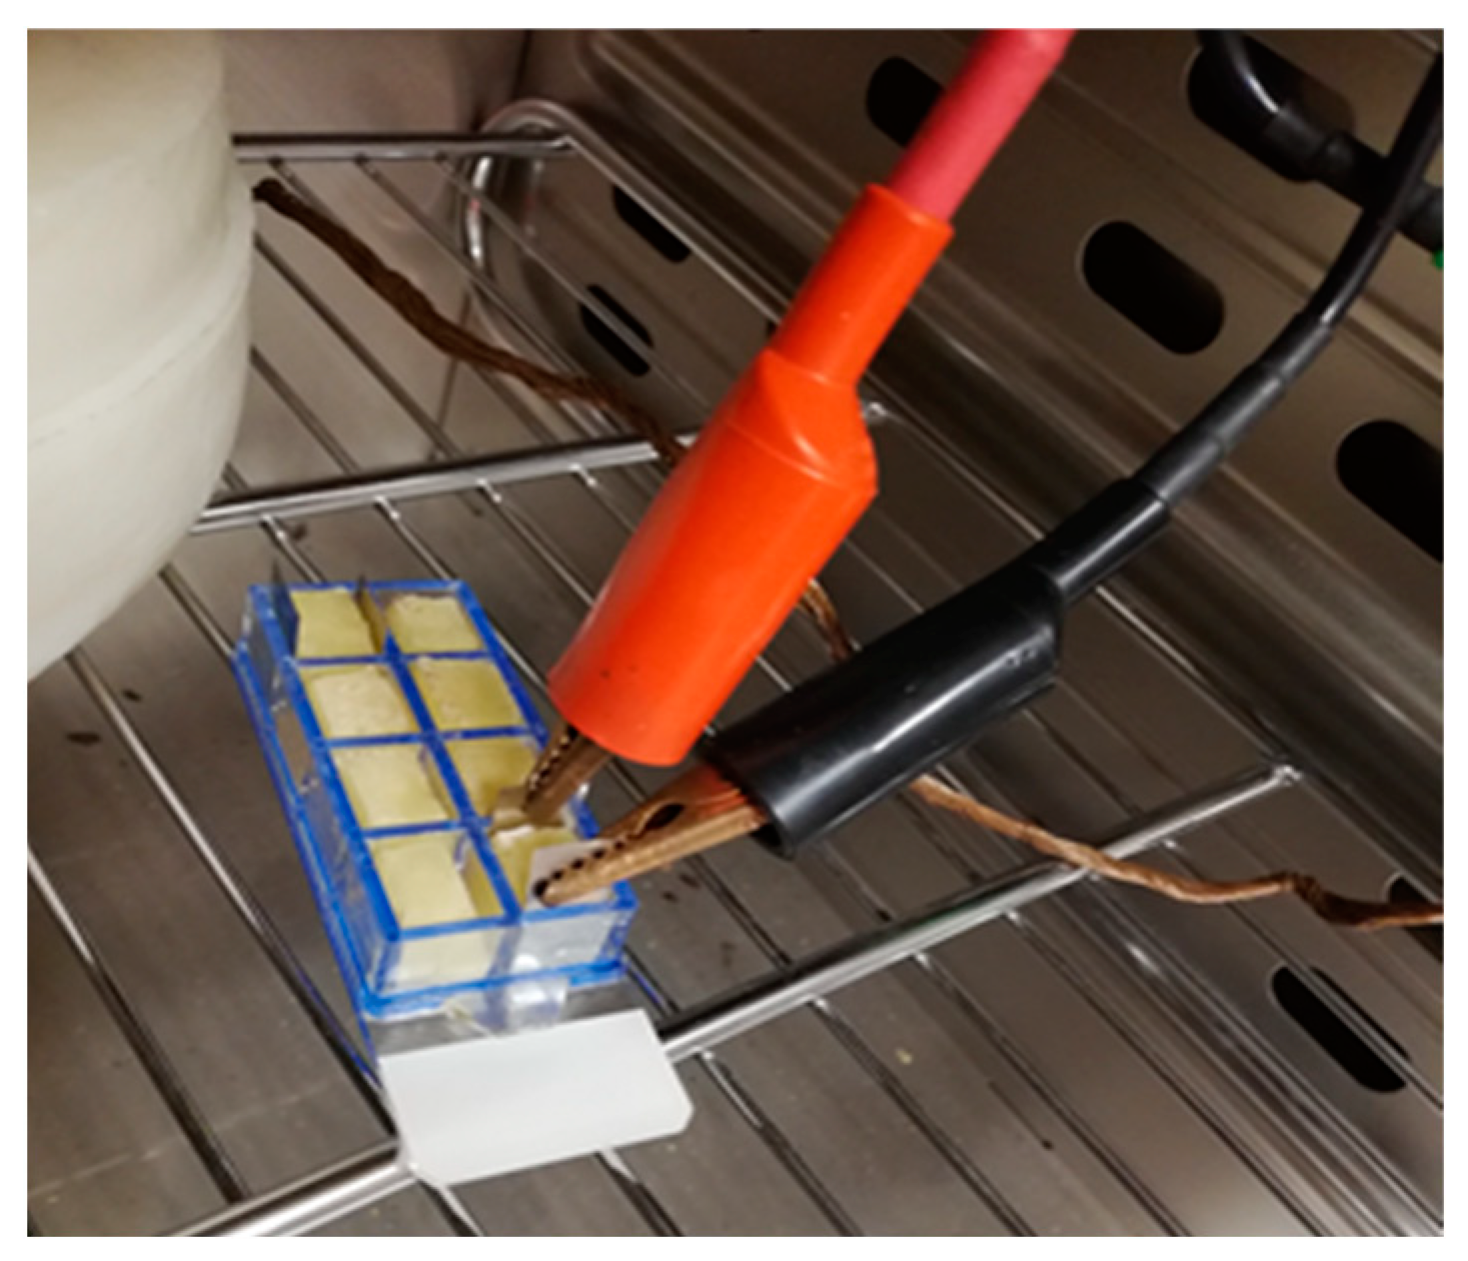
2.1. Procedure for NSC Testing
2.2. Sample Preparation
2.3. Experimental Measurement of the Conductivity
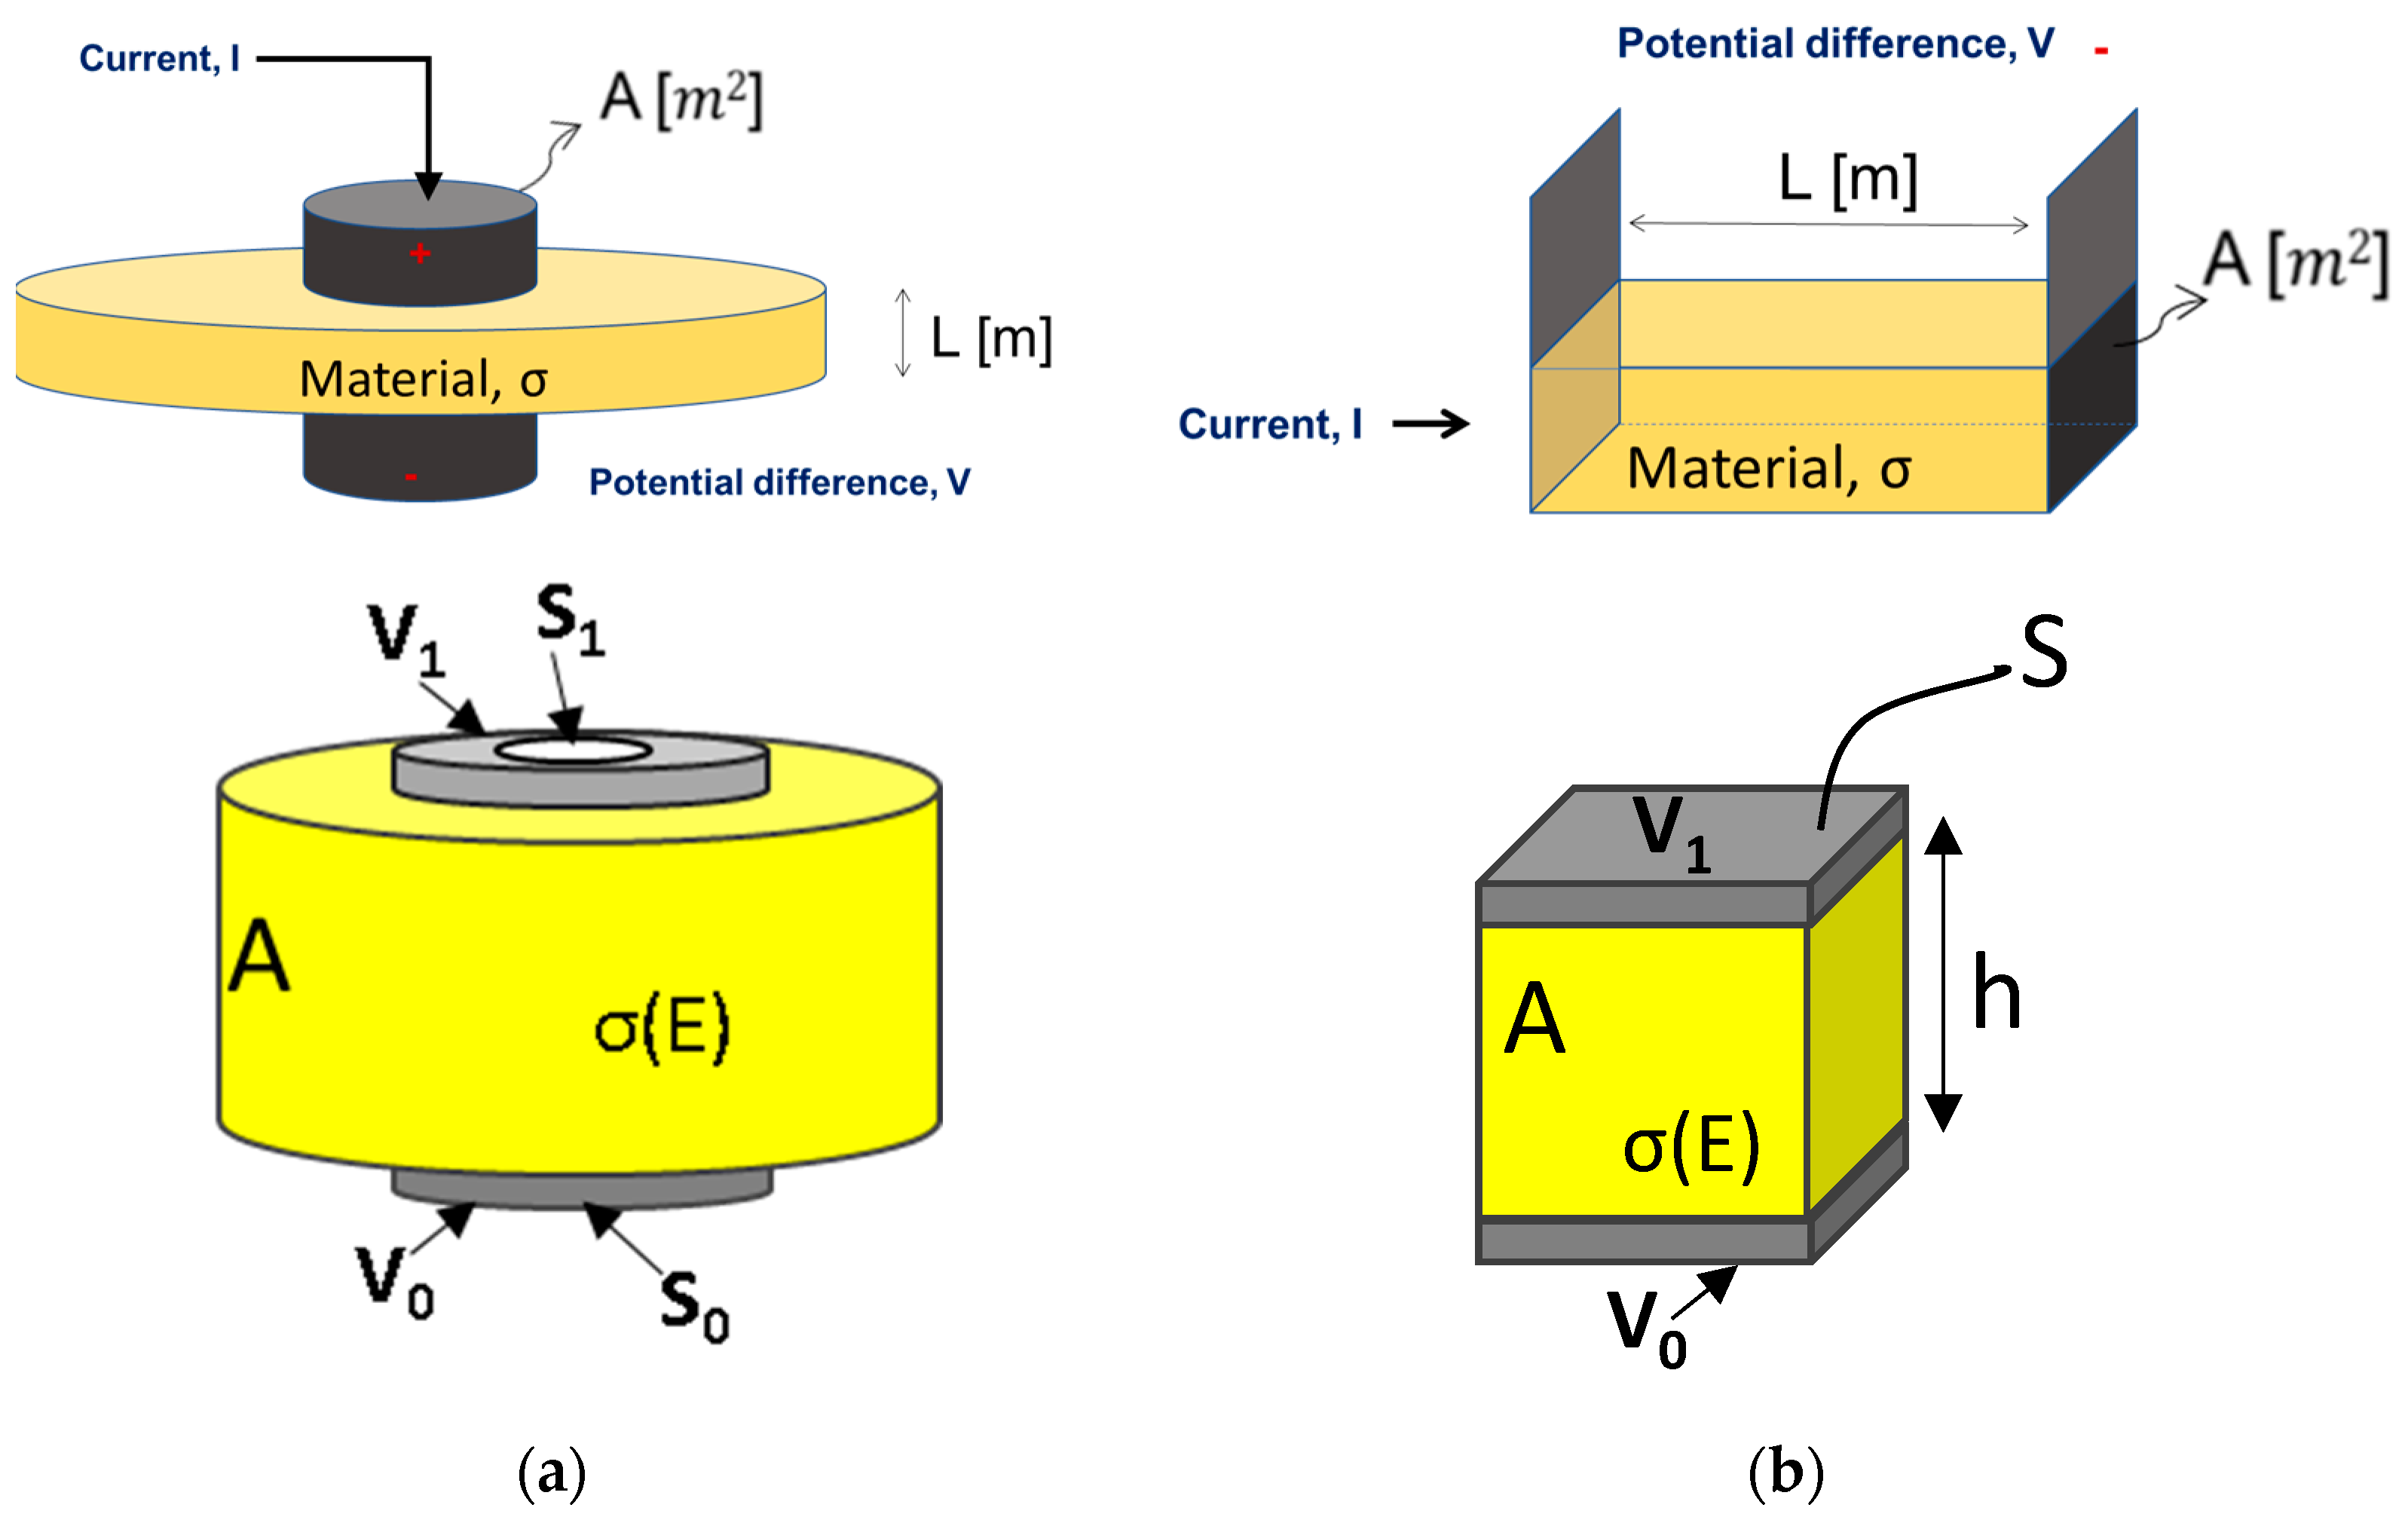
2.3.1. Under Standard Condition (SC)
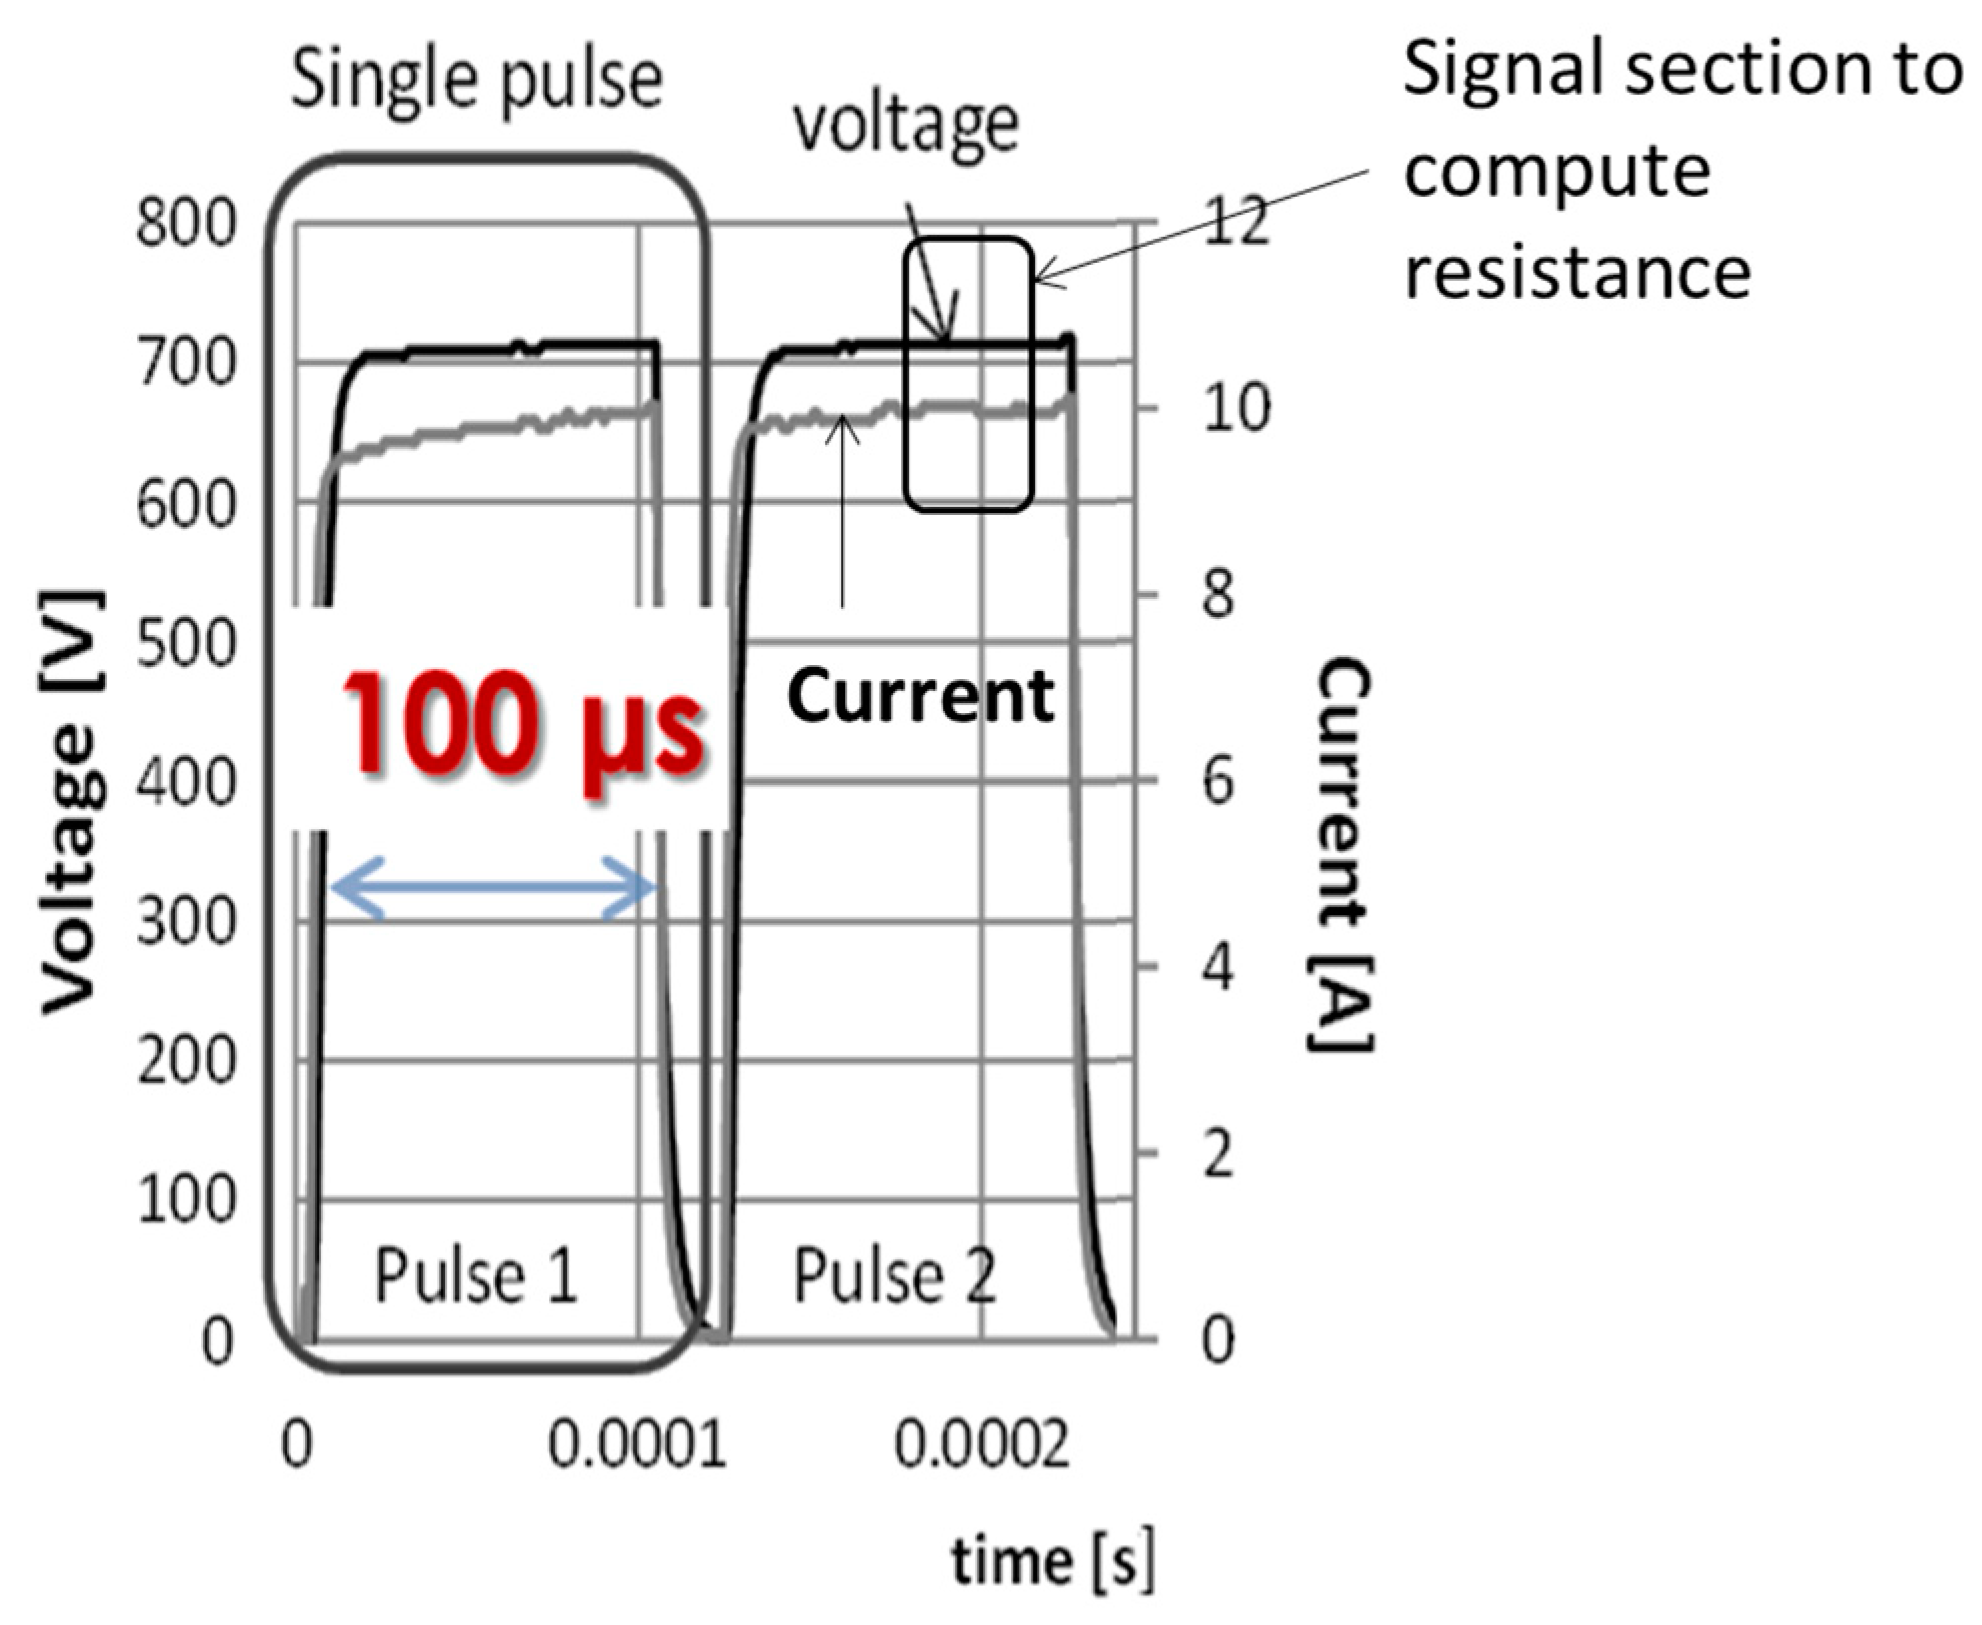
2.3.2. Under Non-Standard Condition (NSC)—Using the Last-Pulse Conductivity of Potato Tuber
2.3.3. Evaluation of Electrical Characteristics of Potato Tuber in NSC as a Function of Electric Field Strength
2.4. Finite Element Simulations—Model Setup
2.4.1. Geometry of the Testing Chamber
2.4.2. Finite Element Simulations
3. Results and Discussion
3.1. Measurements
3.2. Estimated Conductivity for Potato Tissue
3.3. FEM Validation of the Estimated Conductivity for Potato Tissue
4. Conclusions
Author Contributions
Funding
Data Availability Statement
Acknowledgments
Conflicts of Interest
References
- Angersbach, A.; Heinz, V.; Knorr, D. Effects of Pulsed Electric Fields on Cell Membranes in Real Food Systems. Innov. Food Sci. Emerg. Technol. 2000, 1, 135–149. [Google Scholar] [CrossRef]
- Saulis, G. Electroporation of Cell Membranes: The Fundamental Effects of Pulsed Electric Fields in Food Processing. Food Eng. Rev. 2010, 2, 52–73. [Google Scholar] [CrossRef]
- Castellví, Q.; Banús, J.; Ivorra, A. 3D Assessment of Irreversible Electroporation Treatments in Vegetal Models. In 1st World Congress on Electroporation and Pulsed Electric Fields in Biology, Medicine and Food & Environmental Technologies; Jarm, T., Kramar, P., Eds.; Springer Singapore: Singapore, 2016; Volume 53, pp. 294–297. ISBN 978-981-287-816-8. [Google Scholar]
- Frey, W.; Gusbeth, C.; Sakugawa, T.; Sack, M.; Mueller, G.; Sigler, J.; Vorobiev, E.; Lebovka, N.; Álvarez, I.; Raso, J.; et al. Environmental Applications, Food and Biomass Processing by Pulsed Electric Fields. In Bioelectrics; Akiyama, H., Heller, R., Eds.; Springer: Tokyo, Japan, 2017; pp. 389–476. ISBN 978-4-431-56095-1. [Google Scholar]
- Chen, C.; Smye, S.W.; Robinson, M.P.; Evans, J.A. Membrane Electroporation Theories: A Review. Med. Biol. Eng. Comput. 2006, 44, 5–14. [Google Scholar] [CrossRef]
- Kotnik, T.; Kramar, P.; Pucihar, G.; Miklavcic, D.; Tarek, M. Cell Membrane Electroporation—Part 1: The Phenomenon. IEEE Electr. Insul. Mag. 2012, 28, 14–23. [Google Scholar] [CrossRef]
- Davalos, R.V.; Mir, I.L.M.; Rubinsky, B. Tissue Ablation with Irreversible Electroporation. Ann. Biomed. Eng. 2005, 33, 223–231. [Google Scholar] [CrossRef]
- Donsì, G.; Ferrari, G.; Pataro, G. Inactivation Kinetics of Saccharomyces Cerevisiae by Pulsed Electric Fields in a Batch Treatment Chamber: The Effect of Electric Field Unevenness and Initial Cell Concentration. J. Food Eng. 2007, 78, 784–792. [Google Scholar] [CrossRef]
- Zhao, W.; Tang, Y.; Lu, L.; Chen, X.; Li, C. Review: Pulsed Electric Fields Processing of Protein-Based Foods. Food Bioprocess Technol. 2014, 7, 114–125. [Google Scholar] [CrossRef]
- Delbaere, S.M.; Bernaerts, T.; Vangrunderbeek, M.; Vancoillie, F.; Hendrickx, M.E.; Grauwet, T.; Van Loey, A.M. The Volatile Profile of Brussels Sprouts (Brassica Oleracea Var. Gemmifera) as Affected by Pulsed Electric Fields in Comparison to Other Pretreatments, Selected to Steer (Bio)Chemical Reactions. Foods 2022, 11, 2892. [Google Scholar] [CrossRef]
- Bolumar, T.; Rohlik, B.-A.; Stark, J.; Sikes, A.; Watkins, P.; Buckow, R. Investigation of Pulsed Electric Field Conditions at Low Field Strength for the Tenderisation of Beef Topside. Foods 2022, 11, 2803. [Google Scholar] [CrossRef]
- Timmermans, R.A.H.; Roland, W.S.U.; van Kekem, K.; Matser, A.M.; van Boekel, M.A.J.S. Effect of Pasteurization by Moderate Intensity Pulsed Electric Fields (PEF) Treatment Compared to Thermal Treatment on Quality Attributes of Fresh Orange Juice. Foods 2022, 11, 3360. [Google Scholar] [CrossRef]
- Stühmeier-Niehe, C.; Lass, L.; Brocksieper, M.; Chanos, P.; Hertel, C. Pre-Treatment of Starter Cultures with Mild Pulsed Electric Fields Influences the Characteristics of Set Yogurt. Foods 2023, 12, 442. [Google Scholar] [CrossRef]
- Kim, S.-Y.; Lee, B.-M.; Hong, S.-Y.; Yeo, H.-H.; Jeong, S.-H.; Lee, D.-U. A Pulsed Electric Field Accelerates the Mass Transfer during the Convective Drying of Carrots: Drying and Rehydration Kinetics, Texture, and Carotenoid Content. Foods 2023, 12, 589. [Google Scholar] [CrossRef] [PubMed]
- Kotnik, T.; Miklavcic, D. Theoretical Evaluation of Voltage Inducement on Internal Membranes of Biological Cells Exposed to Electric Fields. Biophys. J. 2006, 90, 480–491. [Google Scholar] [CrossRef] [PubMed]
- Probst, U.; Fuhrmann, I.; Beyer, L.; Wiggermann, P. Electrochemotherapy as a New Modality in Interventional Oncology: A Review. Technol. Cancer Res. Treat. 2018, 17, 153303381878532. [Google Scholar] [CrossRef] [PubMed]
- Mahnič-Kalamiza, S.; Kotnik, T.; Miklavčič, D. Educational Application for Visualization and Analysis of Electric Field Strength in Multiple Electrode Electroporation. BMC Med. Educ. 2012, 12, 102. [Google Scholar] [CrossRef] [PubMed]
- Mir, L.M. Therapeutic Perspectives of in Vivo Cell Electropermeabilization. Bioelectrochemistry 2001, 53, 1–10. [Google Scholar] [CrossRef] [PubMed]
- Mir, L.M.; Orlowski, S. Mechanisms of Electrochemotherapy. Adv. Drug Deliv. Rev. 1999, 35, 107–118. [Google Scholar] [CrossRef] [PubMed]
- Zhang, K.; Teoh, J.; Laguna, P.; Dominguez-Escrig, J.; Barret, E.; Ramon-Borja, J.C.; Muir, G.; Bohr, J.; Pelechano Gómez, P.; Ng, C.-F.; et al. Effect of Focal vs Extended Irreversible Electroporation for the Ablation of Localized Low- or Intermediate-Risk Prostate Cancer on Early Oncological Control: A Randomized Clinical Trial. JAMA Surg. 2023. [Google Scholar] [CrossRef]
- Masone, M.C. Irreversible Electroporation in Radio-Recurrent Prostate Cancer. Nat. Rev. Urol. 2023, 20, 65. [Google Scholar] [CrossRef]
- Batista Napotnik, T.; Polajžer, T.; Miklavčič, D. Cell Death Due to Electroporation—A Review. Bioelectrochemistry 2021, 141, 107871. [Google Scholar] [CrossRef]
- Miklavcic, D.; Davalos, R.V. Electrochemotherapy (ECT) and Irreversible Electroporation (IRE)-Advanced Techniques for Treating Deep-Seated Tumors Based on Electroporation. Biomed. Eng. Online 2015, 14, I1. [Google Scholar] [CrossRef] [PubMed]
- Garcia, P.A.; Rossmeisl, J.H.; Robertson, J.; Ellis, T.L.; Davalos, R.V. Pilot Study of Irreversible Electroporation for Intracranial Surgery. Conf. Proc. IEEE Eng. Med. Biol. Soc. 2009, 2009, 6513–6516. [Google Scholar] [CrossRef]
- Miklavčič, D. Handbook of Electroporation; Springer: New York, NY, USA, 2016; ISBN 978-3-319-26779-1. [Google Scholar]
- Ivorra, A.; Al-Sakere, B.; Rubinsky, B.; Mir, L.M. In Vivo Electrical Conductivity Measurements during and after Tumor Electroporation: Conductivity Changes Reflect the Treatment Outcome. Phys. Med. Biol. 2009, 54, 5949. [Google Scholar] [CrossRef] [PubMed]
- Corovic, S.; Lackovic, I.; Sustaric, P.; Sustar, T.; Rodic, T.; Miklavcic, D. Modeling of Electric Field Distribution in Tissues during Electroporation. BioMed. Eng. OnLine 2013, 12, 16. [Google Scholar] [CrossRef] [PubMed]
- Denzi, A.; Strigari, L.; Di Filippo, F.; Botti, C.; Di Filippo, S.; Perracchio, L.; Ronchetti, M.; Cadossi, R.; Liberti, M. Modeling the Positioning of Single Needle Electrodes for the Treatment of Breast Cancer in a Clinical Case. BioMed. Eng. OnLine 2015, 14, S1. [Google Scholar] [CrossRef] [PubMed]
- Sieni, E.; Sgarbossa, P.; Mognaschi, M.E.; Forzan, M.; Parupudi, T.; Mittal, L.; Camarillo, I.G.; Sundararajan, R. Electric Field Distribution Study in Inhomogeneous Biological Tissues. Int. J. Numer. Model. 2019, 33, e2699. [Google Scholar] [CrossRef]
- Kranjc, M.; Bajd, F.; Serša, I.; de Boevere, M.; Miklavčič, D. Electric Field Distribution in Relation to Cell Membrane Electroporation in Potato Tuber Tissue Studied by Magnetic Resonance Techniques. Innov. Food Sci. Emerg. Technol. 2016, 37, 384–390. [Google Scholar] [CrossRef]
- Silve, A.; Guimerà Brunet, A.; Al-Sakere, B.; Ivorra, A.; Mir, L.M. Comparison of the Effects of the Repetition Rate between Microsecond and Nanosecond Pulses: Electropermeabilization-Induced Electro-Desensitization? Biochim. Et Biophys. Acta (BBA)—Gen. Subj. 2014, 1840, 2139–2151. [Google Scholar] [CrossRef]
- Janositz, A.; Noack, A.-K.; Knorr, D. Pulsed Electric Fields and Their Impact on the Diffusion Characteristics of Potato Slices. LWT—Food Sci. Technol. 2011, 44, 1939–1945. [Google Scholar] [CrossRef]
- Jeong, S.; Kim, H.; Park, J.; Kim, K.W.; Sim, S.B.; Chung, J.H. Evaluation of Electroporated Area Using 2,3,5-Triphenyltetrazolium Chloride in a Potato Model. Sci. Rep. 2021, 11, 20431. [Google Scholar] [CrossRef]
- López-Alonso, B.; Sarnago, H.; Lucía, Ó.; Briz, P.; Burdío, J.M. Real-Time Impedance Monitoring During Electroporation Processes in Vegetal Tissue Using a High-Performance Generator. Sensors 2020, 20, 3158. [Google Scholar] [CrossRef] [PubMed]
- Pliquett, U. Electrical Characterization in Time Domain—Sample Rate and ADC Precision. In 6th European Conference of the International Federation for Medical and Biological Engineering; Lacković, I., Vasic, D., Eds.; IFMBE Proceedings; Springer International Publishing: New York, NY, USA, 2015; Volume 45, pp. 854–857. ISBN 978-3-319-11127-8. [Google Scholar]
- Pliquett, U.; Prausnitz, M.R. Electrical Impedance Spectroscopy for Rapid and Noninvasive Analysis of Skin Electroporation. In Electrochemotherapy, Electrogenetherapy, and Transdermal Drug Delivery; Jaroszeski, Mark, J., Heller, R., Gilbert, R., Eds.; Methods in Molecular Medicine; Humana Press: Totowa, NJ, USA, 2000; Volume 37, pp. 377–406. ISBN 978-0-89603-606-2. [Google Scholar]
- Pliquett, U.; Langer, R.; Weaver, J.C. Changes in the Passive Electrical Properties of Human Stratum Corneum Due to Electroporation. Biochim. Et Biophys. Acta (BBA)—Biomembr. 1995, 1239, 111–121. [Google Scholar] [CrossRef]
- Menegazzo, I.; Mammi, S.; Sgarbossa, P.; Bartolozzi, A.; Mozzon, M.; Bertani, R.; Forzan, M.; Sundararajan, R.; Sieni, E. Time Domain Nuclear Magnetic Resonance (TD-NMR) to Evaluate the Effect of Potato Cell Membrane Electroporation. Innov. Food Sci. Emerg. Technol. 2020, 65, 102456. [Google Scholar] [CrossRef]
- Neal, R.E.; Garcia, P.A.; Robertson, J.L.; Davalos, R.V. Experimental Characterization and Numerical Modeling of Tissue Electrical Conductivity during Pulsed Electric Fields for Irreversible Electroporation Treatment Planning. IEEE Trans. Biomed. Eng. 2012, 59, 1076–1085. [Google Scholar] [CrossRef]
- Breton, M.; Buret, F.; Krahenbuhl, L.; Leguebe, M.; Mir, L.M.; Perrussel, R.; Poignard, C.; Scorretti, R.; Voyer, D. Non-Linear Steady-State Electrical Current Modeling for the Electropermeabilization of Biological Tissue. IEEE Trans. Magn. 2015, 51, 1–4. [Google Scholar] [CrossRef]
- Bernardis, A.; Bullo, M.; Campana, L.G.; Di Barba, P.; Dughiero, F.; Forzan, M.; Mognaschi, M.E.; Sgarbossa, P.; Sieni, E. Electric Field Computation and Measurements in the Electroporation of Inhomogeneous Samples. Open Phys. 2017, 15, 790–796. [Google Scholar] [CrossRef]
- Elia, S.; Lamberti, P.; Tucci, V. Influence of Uncertain Electrical Properties on the Conditions for the Onset of Electroporation in an Eukaryotic Cell. IEEE Trans. Nanobiosci. 2010, 9, 204–212. [Google Scholar] [CrossRef]
- Marty, M.; Sersa, G.; Garbay, J.R.; Gehl, J.; Collins, C.G.; Snoj, M.; Billard, V.; Geertsen, P.F.; Larkin, J.O.; Miklavcic, D.; et al. Electrochemotherapy—An Easy, Highly Effective and Safe Treatment of Cutaneous and Subcutaneous Metastases: Results of ESOPE (European Standard Operating Procedures of Electrochemotherapy) Study. Eur. J. Cancer Suppl. 2006, 4, 3–13. [Google Scholar] [CrossRef]
- Mir, L.M.; Gehl, J.; Sersa, G.; Collins, C.G.; Garbay, J.-R.; Billard, V.; Geertsen, P.F.; Rudolf, Z.; O’Sullivan, G.C.; Marty, M. Standard Operating Procedures of the Electrochemotherapy: Instructions for the Use of Bleomycin or Cisplatin Administered Either Systemically or Locally and Electric Pulses Delivered by the CliniporatorTM by Means of Invasive or Non-Invasive Electrodes. EJC Suppl. 2006, 4, 14–25. [Google Scholar] [CrossRef]
- Sel, D.; Cukjati, D.; Batiuskaite, D.; Slivnik, T.; Mir, L.M.; Miklavcic, D. Sequential Finite Element Model of Tissue Electropermeabilization. Biomed. Eng. IEEE Trans. 2005, 52, 816–827. [Google Scholar] [CrossRef]
- ASTM 257-14; Standard Test Methods for DC Resistance or Conductance of Insulating Materials. ASTM International: West Conshohocken, PA, USA, 2021.
- FLUX (Altair). Available online: https://Altairhyperworks.Com/Product/Flux (accessed on 20 January 2023).
- Campana, L.G.; Di Barba, P.; Dughiero, F.; Rossi, C.R.; Sieni, E. Optimal Needle Positioning for Electrochemotherapy: A Constrained Multiobjective Strategy. IEEE Trans. Magn. 2013, 49, 2141–2144. [Google Scholar] [CrossRef]
- Meunier, G. (Ed.) The Finite Element Method for Electromagnetic Modeling; ISTE; Wiley: London, UK; Hoboken, NJ, USA, 2008; ISBN 978-1-84821-030-1. [Google Scholar]
- Di Barba, P.; Savini, A.; Wiak, S. Field Models in Electricity and Magnetism; Springer: Dordrecht, The Netherlands, 2008; ISBN 978-1-4020-6842-3. [Google Scholar]
- Ongaro, A.; Pellati, A.; Caruso, A.; Battista, M.; De Terlizzi, F.; De Mattei, M.; Fini, M. Identification of in Vitro Electropermeabilization Equivalent Pulse Protocols. Technol. Cancer Res. Treat. 2011, 10, 465–473. [Google Scholar] [CrossRef]
- Ongaro, A.; Campana, L.G.; De Mattei, M.; Di Barba, P.; Dughiero, F.; Forzan, M.; Mognaschi, M.E.; Pellati, A.; Rossi, C.R.; Bernardello, C.; et al. Effect of Electrode Distance in Grid Electrode: Numerical Models and In Vitro Tests. Technol. Cancer Res. Treat. 2018, 17, 153303381876449. [Google Scholar] [CrossRef] [PubMed]
- Corovic, S.; Zupanic, A.; Miklavcic, D. Numerical Modeling and Optimization of Electric Field Distribution in Subcutaneous Tumor Treated With Electrochemotherapy Using Needle Electrodes. Plasma Sci. IEEE Trans. 2008, 36, 1665–1672. [Google Scholar] [CrossRef]
- Pavselj, N.; Miklavcic, D. Numerical Models of Skin Electropermeabilization Taking Into Account Conductivity Changes and the Presence of Local Transport Regions. Plasma Sci. IEEE Trans. 2008, 36, 1650–1658. [Google Scholar] [CrossRef]
- Čorović, S.; Županič, A.; Kranjc, S.; Al Sakere, B.; Leroy-Willig, A.; Mir, L.M.; Miklavčič, D. The Influence of Skeletal Muscle Anisotropy on Electroporation: In Vivo Study and Numerical Modeling. Med. Biol. Eng. Comput. 2010, 48, 637–648. [Google Scholar] [CrossRef]
- Kos, B.; Zupanic, A.; Kotnik, T.; Snoj, M.; Sersa, G.; Miklavcic, D. Robustness of Treatment Planning for Electrochemotherapy of Deep-Seated Tumors. J. Membr. Biol. 2010, 236, 147–153. [Google Scholar] [CrossRef]
- Ivorra, A.; Mir, L.M.; Rubinsky, B. Electric Field Redistribution Due to Conductivity Changes during Tissue Electroporation: Experiments with a Simple Vegetal Model. In Proceedings of the World Congress on Medical Physics and Biomedical Engineering, Munich, Germany, 7–12 September 2009; Dössel, O., Schlegel, W.C., Eds.; IFMBE Proceedings. Springer: Berlin Heidelberg, Germany, 2010; Volume 25/13, pp. 59–62, ISBN 978-3-642-03894-5. [Google Scholar]
- Laufer, S.; Ivorra, A.; Reuter, V.E.; Rubinsky, B.; Solomon, S.B. Electrical Impedance Characterization of Normal and Cancerous Human Hepatic Tissue. Physiol. Meas. 2010, 31, 995. [Google Scholar] [CrossRef]
- Miklavčič, D.; Pavšelj, N.; Hart, F.X. Electric Properties of Tissues. In Wiley Encyclopedia of Biomedical Engineering; John Wiley & Sons, Inc.: Hoboken, NJ, USA, 2006; ISBN 978-0-471-74036-0. [Google Scholar]
- Teissié, J.; Eynard, N.; Gabriel, B.; Rols, M.P. Electropermeabilization of Cell Membranes. Adv. Drug Deliv. Rev. 1999, 35, 3–19. [Google Scholar] [CrossRef]


| Condition | Group A | Group B | ||||||
|---|---|---|---|---|---|---|---|---|
| 0 V | Std-Dev | 100 V | Std-Dev | 0 V | Std-Dev | 800 V | Std-Dev | |
| SC [mS/m] | 11 | 0.92 | 13 | 1.9 | 10 | 1.5 | 20 | 0.35 |
| NSC [mS/m] | - | - | 107 | 0.14 | - | - | 404 | 89 |
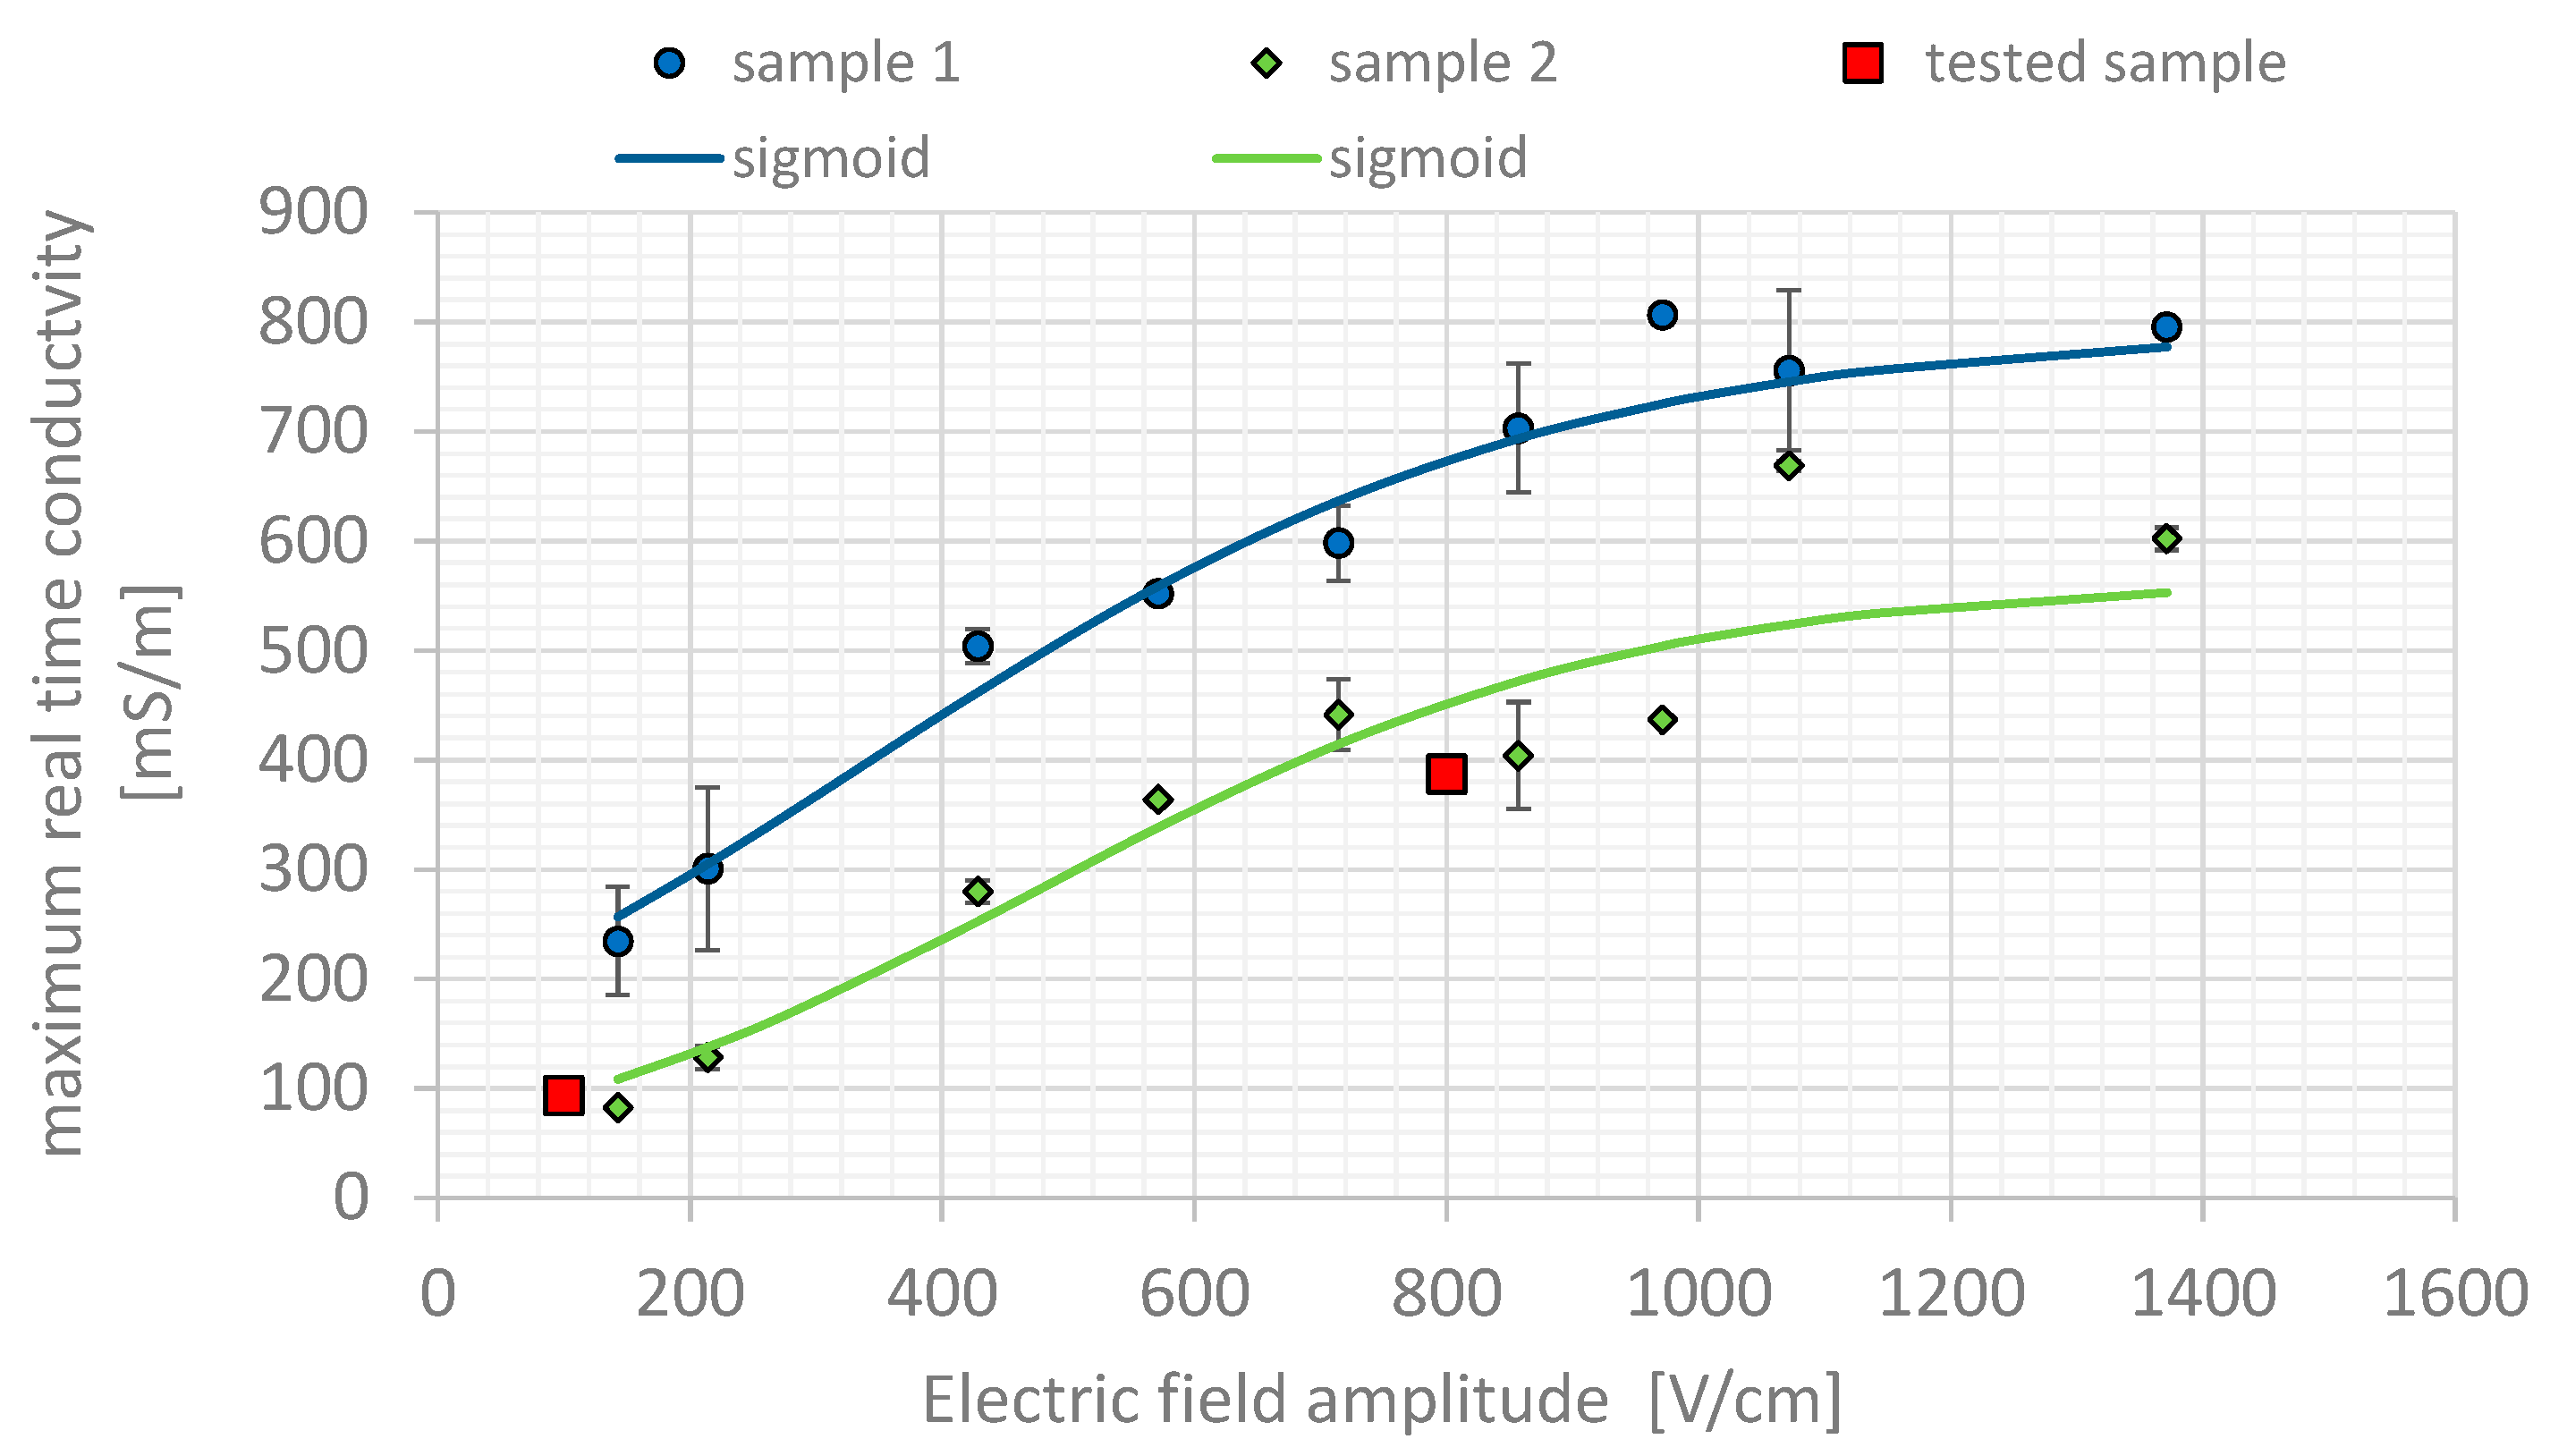
| E [Vcm−1] | σm1 [Sm−1] | Std (σm1) [Sm−1] | σm2 [Sm−1] | Std (σm2) [Sm−1] | |
|---|---|---|---|---|---|
| #1 | 143 | 234.5 | 0.05 | 82.8 | 0.000 |
| #2 | 214 | 396.7 | 0.04 | 128.6 | 0.010 |
| #3 | 429 | 487.9 | 0.00 | 280.2 | 0.011 |
| #4 | 571 | 621.2 | 0.10 | 364.1 | 0.000 |
| #5 | 714 | 700.8 | 0.07 | 441.3 | 0.033 |
| #6 | 857 | 669.4 | 0.10 | 404.1 | 0.049 |
| #7 | 971 | 938.1 | 0.10 | 436.5 | 0.028 |
| #8 | 1071 | 979.5 | 0.02 | 668.6 | 0.004 |
| #9 | 1371 | 867.1 | 0.00 | 602.1 | 0.010 |
| σ0[mSm−1] | 100 | - | - | 1 | - |
| σ1[mSm−1] | 960 | - | - | 570 | - |
| Eth[Vcm−1] | 480 | - | - | 489.6 | - |
| kv[cm/V] | 0.00190 | - | - | 0.00204 | - |
| Disk-Case A | Disk-Case B | Cube | ||||
|---|---|---|---|---|---|---|
| Voltage [V] | 100 | 700 | 100 | 700 | 100 | 700 |
| Current [A] | 1.86 | 50.23 | 0.58 | 16.83 | 0.33 | 9.81 |
| σ(E) [mS/m] | σ (143 V/cm) 230 | σ (1000 V/cm) 950 | σ (143 V/cm) 230 | σ (1000 V/cm) 950 | σ (143 V/cm) 230 | σ (1000 V/cm) 950 |
| R [Ω] | 53.9 | 13.9 | 172.3 | 41.6 | 304.3 | 73.5 |
| h [m] | 7 × 10⁻³ | 7 × 10⁻³ | 7 × 10⁻³ | 7 × 10⁻³ | 7 × 10⁻³ | 7 × 10⁻³ |
| S [m2] | 4.9 × 10⁻⁴ | 4.9 × 10⁻⁴ | 1.8 × 10⁻⁴ | 1.8 × 10⁻⁴ | 1 × 10⁻⁴ | 1 × 10⁻⁴ |
| ρm [Ωm] | 3.8 | 1.0 | 4.3 | 1.1 | 4.3 | 1.1 |
| σm [mS/m] | 265 | 1023 | 230 | 952 | 230 | 952 |
| error [%] | −15.1 | −7.7 | 0.0 | −0.2 | 0.0 | −0.2 |
| Disk-Case A | Disk-Case B | |||
|---|---|---|---|---|
| Voltage [V] | 100 | 700 | 100 | 700 |
| Current [A] | 1.96 | 56.66 | 0.58 | 16.82 |
| σ [mS/m] | 230 | 950 | 230 | 950 |
| R [Ω] | 51.0 | 12.4 | 171.9 | 41.6 |
| h [m] | 7 × 10⁻³ | 7 × 10⁻³ | 7 × 10⁻³ | 7 × 10⁻³ |
| S [m2] | 4.9 × 10⁻⁴ | 4.9 × 10⁻⁴ | 1.8 × 10⁻⁴ | 1.8 × 10⁻⁴ |
| ρm [Ωm] | 3.578 | 0.899 | 4.338 | 1.051 |
| σm [mS/m] | 280 | 1154 | 231 | 952 |
| error [%] | −21.5 | −21.5 | −0.2 | −0.2 |
| Cube–Case Model | ||
|---|---|---|
| Voltage [V] | 100 | 700 |
| Current [A] | 0.33 | 9.50 |
| σ(E) [mS/m] | 230 | 950 |
| R [Ω] | 304.3 | 73.7 |
| h [m] | 7 × 10⁻³ | 7 × 10⁻³ |
| S [m2] | 1 × 10⁻⁴ | 1 × 10⁻⁴ |
| ρm [Ωm] | 4.35 | 1.05 |
| σm [mS/m] | 230 | 950 |
| error [%] | 6.08 × 10⁻⁵ | −4 × 10⁻⁵ |
Disclaimer/Publisher’s Note: The statements, opinions and data contained in all publications are solely those of the individual author(s) and contributor(s) and not of MDPI and/or the editor(s). MDPI and/or the editor(s) disclaim responsibility for any injury to people or property resulting from any ideas, methods, instructions or products referred to in the content. |
© 2023 by the authors. Licensee MDPI, Basel, Switzerland. This article is an open access article distributed under the terms and conditions of the Creative Commons Attribution (CC BY) license (https://creativecommons.org/licenses/by/4.0/).
Share and Cite
Lamberti, P.; Sieni, E.; Sundararajan, R. Design of Electrical Characterization Method for Electroporation-Treated Biological Tissues. Designs 2023, 7, 35. https://doi.org/10.3390/designs7020035
Lamberti P, Sieni E, Sundararajan R. Design of Electrical Characterization Method for Electroporation-Treated Biological Tissues. Designs. 2023; 7(2):35. https://doi.org/10.3390/designs7020035
Chicago/Turabian StyleLamberti, Patrizia, Elisabetta Sieni, and Raji Sundararajan. 2023. "Design of Electrical Characterization Method for Electroporation-Treated Biological Tissues" Designs 7, no. 2: 35. https://doi.org/10.3390/designs7020035
APA StyleLamberti, P., Sieni, E., & Sundararajan, R. (2023). Design of Electrical Characterization Method for Electroporation-Treated Biological Tissues. Designs, 7(2), 35. https://doi.org/10.3390/designs7020035