1. Introduction
The Lean Design-for-eXcellence framework (LeanDfX) has been developed at INEGI (the Institute of Science and Innovation in Mechanical and Industrial Engineering) as a tool for the design of products. LeanDfX assesses domains such as design for manufacturing, assembly, maintenance, modularity, adaptability, sustainability and structural optimization, amongst other relevant “X” domains for a given product. LeanDfX leads to a systematic methodology and tool (“framework”) for design engineers, assessing effectiveness (product goals) and efficiency (mapping possible over-engineering hot spots) of a product design.
LeanDfX is the object of several publications, such as [
1] where it is applied to the development process of an adaptive robot gripper or [
2] dealing with an application to a machine tool. Efficiency and waste are aspects of the approach discussed in [
3], and adding eco-efficiency targets is discussed in the context of aeronautical panels production in [
4] or of the design of aeronautical assembly processing [
5].
The present work combines existing tools and techniques into a design process methodology accounting for the opinions of other people besides the designer’s own. To complement the LeanDfX framework and assist its deployment in new product development, two existing methodologies—quality function deployment (QFD) and failure mode and effect analysis (FMEA)—were adapted and incorporated into that framework. Moreover, a fuzzy approach is combined with QFD and LeanDfX to deal with design parameter uncertainty.
Fuzzy logic was adopted to deal with situations where a simple true or false, black or white dichotomy would be an unwarranted simplification.
New product creation is progressively becoming more complex and multidisciplinary. Since 2015, INEGI has been developing the LeanDfX framework, focused on the evaluation and management of product development (PD). This is based upon lean product development axioms and modular design, aiming at a great degree of multi-dimensional and multi-disciplinary product systematization and organization, while providing a novel form for product performance assessment.
The evolving growth of the LeanDfX framework has indicated the importance of linking its holistic capacity to manage requirements and life-cycle information, with the application of specific product development tools such as failure mode and effects analysis (FMEA) and quality function deployment (QFD). In this context, and while emphasizing the design methodologies, the objectives of the present work are:
to establish guidelines for the combined application of tools (LeanDfX, QFD, FMEA, fuzzy logic) to increase the effectiveness and efficiency of the product development process, and facilitate, as far as possible, the more precise initial characterization of product requirements, specification and goals.
to apply the enhanced framework and tools in a complex mechatronic project of an industrial company.
This paper is organized as follows:
Section 2 presents a concise literature review.
Section 3 presents the tools of the LeanDfX framework, LeanDfX Fuzzy QFD and FMEA. The designing process of the AGV and the results are discussed in
Section 4, and concluding remarks are presented in
Section 5.
2. Concise Literature Review
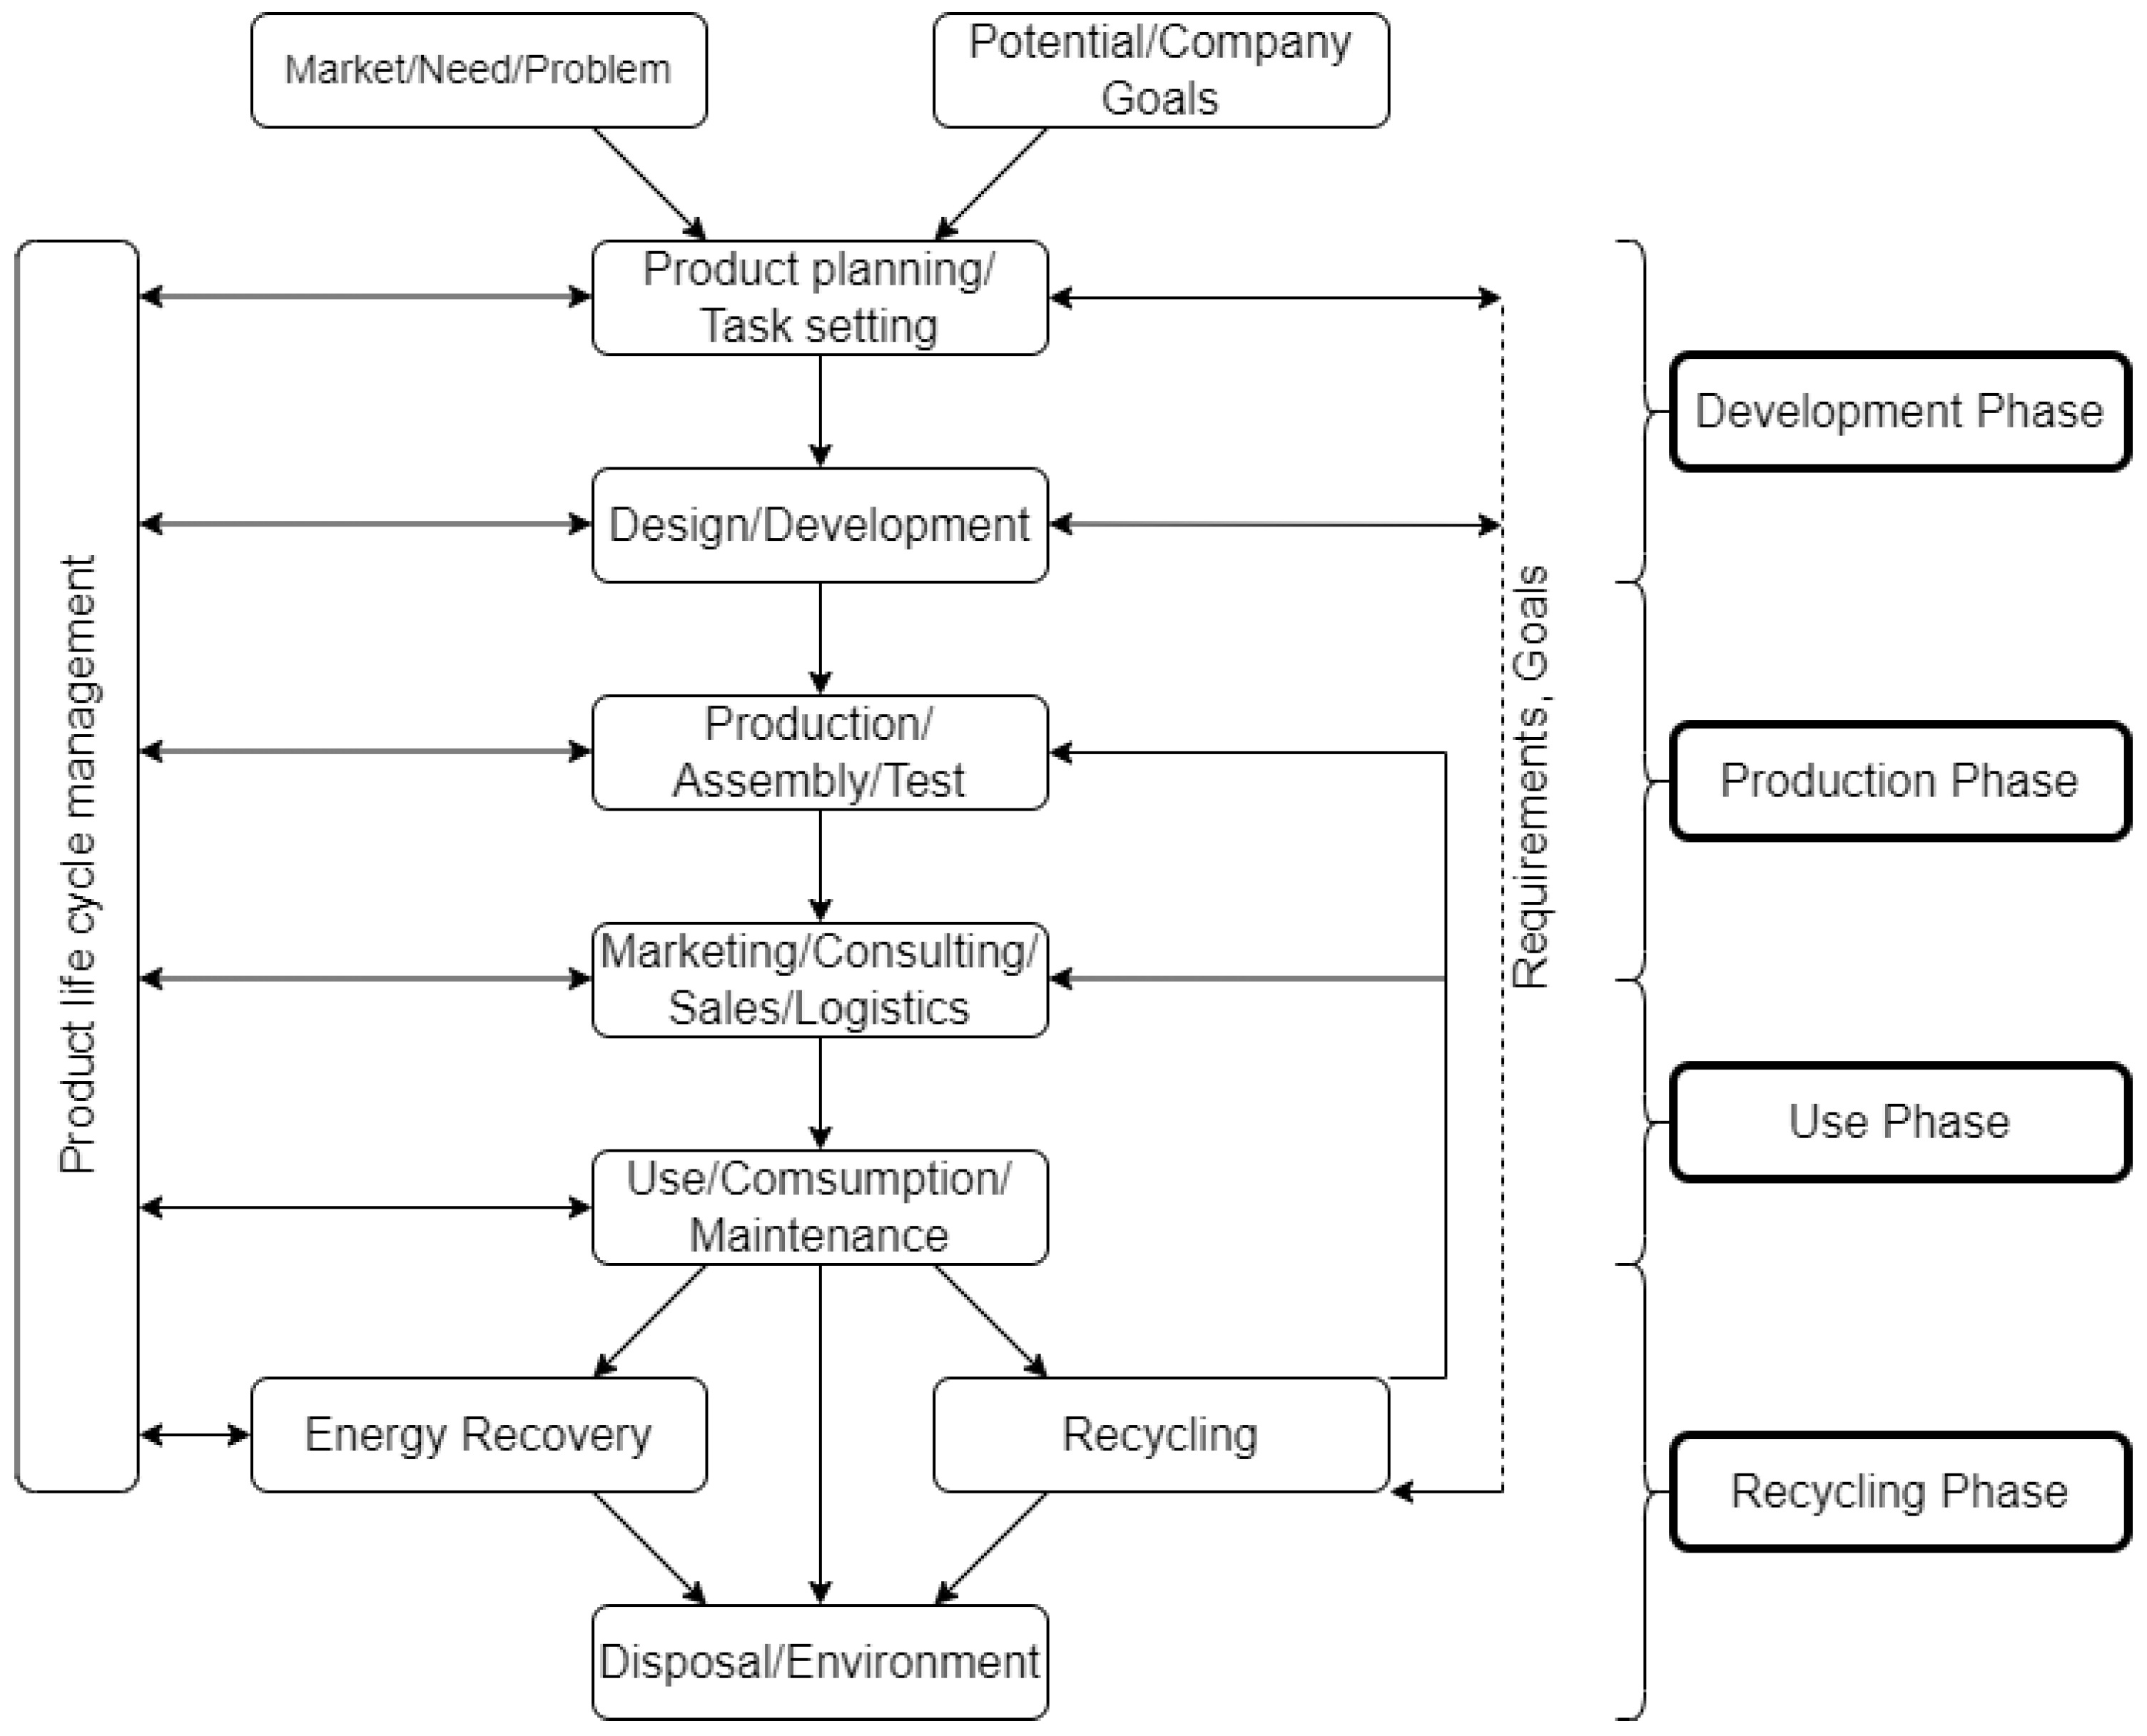
Figure 1 schematically shows a product life cycle and the many steps that should be considered in the design process. A new cycle is triggered by a market demand or a new idea and only ends with recycling or environmental disposal of the product. The life cycle of a product is not a linear process; it represents the ability to convert raw materials into economic products of hopefully high-added value [
6]. The high value is given by producibility [
7].
Several tools and techniques can help the design process and ensure the quality of the product. They can be applied at different stages of the process, and include quality function deployment (QFD), design for X (DfX) and failure modes and effects analysis (FMEA), among others. Stewart et al. present in [
8] a comprehensive discussion of design methods, processes and environments.
Figure 1.
Life cycle of a product [
6,
9].
Figure 1.
Life cycle of a product [
6,
9].
Quality function deployment (QFD), conceived and developed by Akao and Mizuno, intends to solve or at least contribute to the conversion of customer requirements into specifications or technical requirements [
10]. The 1990 translation in English of a book by Akao [
11] surveys the subject with a variety of contributions from industry practitioners. As in the
Journal of Quality Technology recension of the book [
12], it is interesting to retain Akao’s advice: “
best method is not to ‘play it by the book’. Since each company’s conditions are unique, it is important to be imaginative in applying the rules and to find a method suitable to your company”.
The main design tool used in QFD is the house of quality (HoQ), schematically shown in
Figure 2.
The correlation or roof matrix, with a triangular shape, is located at the roof of the house. This matrix shows how the engineering characteristics interrelate with each other and the strength of their relationship. The roof matrix is filled with values/symbols representing the relationship between engineering characteristics: if it exists or if it is positive or negative. Underneath the relationship matrix, for each technical requirement a target value is presented, together with a technical assessment of competing products as the benchmark. For each customer requirement, there may be a weighting factor, determining its relative importance, and likewise for the technical requirements [
6,
7,
13,
14].
A popular methodology to fight the uncertainty and the fuzziness of the process is the fuzzy set theory [
15]. Developed and popularized by Zadeh [
16], the fuzzy set theory was combined with QFD, e.g., in [
17,
18,
19]. Recent applications include complex products [
20], manufacturing [
21], design of websites [
22] and even human resources management [
23]. However, to overcome most of the problems with the process, the QFD and fuzzy QFD are combined with one or more complementary methodologies, such as multicriteria decision-making (MCDM) methods. Some authors join the analytic network process (ANP) with the fuzzy QFD [
15,
18,
24], whereas Asadabadi et al. [
24] also combine the Markov chain.
Fuzzy set theory provides a natural way of dealing with problems where imprecision has its origin in the uncertainty or lack of clarity regarding defined criteria of class membership [
16]. In other words, it is a theory that attempts to deal with imprecision and vagueness in data, which suggests its importance for the methodology developed in this paper.
Fuzzy set theory allows mathematical operators and programming to apply to the fuzzy domain [
18]. To define the sets, the membership function
µ is used. The most typical application of the fuzzy set theory in QFD relies on triangular fuzzy numbers. In the present approach, trapezoidal fuzzy numbers were used. The membership function has any value between 0 and 1, and with this, unclear data are represented accurately. With
S being a set of objects which is represented by
y, the fuzzy set
A in
Sf is defined by [
16]:
A trapezoidal fuzzy number,
A, is represented by four parameters
where
, and these are in the membership group under fuzzy set
, instead of a more typical triangular approach. With a trapezoidal number, the theory can provide solutions with greater detail [
19].
Figure 3 facilitates the understanding of Equation (2):
Mathematical operations with fuzzy numbers also have particular characteristics. If
and
are fuzzy trapezoidal numbers, then their operations are given by [
25]:
Strategies and guidelines for design and development, aiming at achieving the desirable objectives for a product, have evolved throughout the years. AT&T Bell Laboratories [
26] coined the designation design for X (DfX), where X represents the many fields of work in which such methodologies are applicable, such as manufacturability, assembly, quality, recyclability or logistics, [
27]. Even though it began as a design for manufacturing DfM, [
28] the concept of design for X became progressively broader and applicable in many fields, providing designers with tools that help to achieve a product’s desirable features. Juniani et al. present in [
29] a comprehensive discussion of design for manufacturing, assembly and reliability, whereas an application to a conveyor system is discussed by Butt and Jedi in [
30].
Table 1 illustrates guidelines for some common DfX methodologies. Many other Xs can be referenced in the literature, and the number of publications and guidelines for each one can be overwhelming. As a result of its various dimensions, DfX brought a holistic view and became a powerful tool in the product development process.
FMEA is a method for the identification of possible failures and prediction of risks through a systematic analysis [
6]. It is applied throughout the development of new products and is connected to the total quality management (TQM) approach [
35]. As a first step, it is necessary to identify possible hazards and failures of the product being designed [
36].
The first stage to build an FMEA chart is to identify each failure mode. Then, for each possible failure mode, its consequences and causes are stated. Subsequently test measures are proposed, and afterwards, a risk number (
RN) is assigned to each failure mode. This RN is calculated through three other estimated parameters [
6]:
probability of occurrence (O);
significance or severity of the effects of the failure (S);
probability of detection of the failure before it fails (D).
For each of these parameters, usually a rating between 1 and 10 is assigned, 1 being the best-case scenario and 10 the worst. After this, it is possible to obtain
RN through Equation (9) [
6]:
If
RN is bigger than 125, then the failure is considered critical [
6]. Finally, for each of the possible failures to the component, a solution or improvement should be given; for this new solution, estimate the parameters and compare both
RN results [
37]. For examples of FMEA charts, see, e.g., Pahl et al. [
6].
Due to its qualitative nature, FMEA may present some drawbacks [
37,
38], including:
measurement scale for parameters;
lack of interconnection between parameters;
loss of information as lack of precision due to the dilution of expert knowledge in the overall responsible team;
lack of connection to cost.
Many authors have proposed several enhancements to overcome these and other negatives aspects of FMEA method. Wang et al. use the fuzzy linguistic terms to turn a risk priority number (RPN) into a fuzzy risk priority number (FRPN) in order to diminish the inaccuracy related to the evaluation process [
39]. Pillay and Wang attempt to eliminate much of the aforementioned problems by combining FMEA with fuzzy linguistic terms, adding a grey relation analysis [
40]. QFD is also combined with FMEA in some papers, such as by Liu et al., where the method is tested in the quality improvement of packaging designs in the TFT-LCD industry [
41]. Aiming at the improvement of RPN evaluation, Chang and Wen combine 2-tuple and the ordered weighted averaging (OWA) operator to improve the failure prioritization process [
37]. A novel process failure mode and effect analysis (PFMEA) approach for reliable design of assembly activities is presented by Braglia et al. [
42].
Lean design is focused on customer value via optimized product design [
43]. What the customer values in the product—the customer requirements—and how these translate in product properties is of paramount importance [
44]. From one side, the properties that are relevant for the customer are dependent on the defined product design; on the other side, the necessary processes and activities covering the complete life cycle are implied by the product design [
45]. As a recap, lean design focuses at maximizing customer value and seeks to avoid waste that may happen in the downstream life-cycle processes through the optimization of product design [
45]. Once again, a holistic approach is necessary with lean design. This means that when thinking and designing a product, waste minimization and product value addition should be ensured from the concept to the recycling and disposal [
45].
Combining lean design with some of the methodologies mentioned, Hoppmann et al. list eleven components for the coherent definition of a Lean PD system [
46].
The interdependency between the Industrie 4.0 paradigm and lean production systems is studied by Dombrowski et al. [
47]. The same authors also developed possible connections between the design for X approaches and lean design thinking [
45]. Moreover, in the work of Baptista et al. [
1], a framework called lean design for X is used, to be presented in
Section 3.
3. Tools: LeanDfX Framework, Fuzzy QFD and FMEA
An increasing focus on reducing the time spent in design processes without sacrificing product quality and increasing costs is found throughout the years [
48]. This increases the importance of approaches such as DfX, since they make it possible to systematize the design process and support the design management of complex products, contributing to sustainable development [
1]. With the same purpose, lean practices are adopted to keep up with the market, thus narrowing budgets [
41].
Inspired by both concepts, since 2015 INEGI has been developing an approach called LeanDfX methodology, combining lean thinking and design for X project support, where multiple domains such as optimization, manufacturing, assembly, maintenance, eco-design or modularity are assessed [
1]. It provides a systematic assessment of the effectiveness and efficiency of a given product design, evaluated through multiple “X” domains. LeanDfX gives a multidimensional performance evaluation to products or system designs, incorporating lean thinking principles and focusing on minimizing waste in all product life cycles through a visual management concept [
1].
The LeanDfX framework aids design teams by providing the necessary tools to reach a new performance level, managing in a very structured form products or system designs with high levels of complexity and accounting for the whole product life cycle [
1]. It was developed taking also into account the multi-layer stream mapping (MSM) [
49] concept framework [
2].
Industry is pushing the boundaries in the complexity of mass products, implying that, usually, a product has several requirements and technical specifications. The need for a structured approach and framework increases, so that it is possible to manage a high number of different requirements and specifications, related with the associated stage of its life cycle, such as manufacturing, maintenance, retrofitting and disposal, etc. [
1].
Figure 4 shows some design domains and their relation within the LeanDfX approach.
To assure that timelines are respected and time is reduced as much as possible, the number of iterations in the design process must be the lowest possible. The LeanDfX framework also works towards this goal. Inspired by lean thinking, it is critical to use just the necessary resources to obtain design targets and product goals [
45], implying that effectiveness and efficiency must be measured. Effectiveness works towards the verification of product design goals, verifying if all requirements and specifications targets are fulfilled. Efficiency comprehends the resources quantification and consequently the cost assessment of the designed product [
1]. This is inherently present in lean thinking, in which the inefficiency is measured by the evaluation of ”over-engineering” (waste generation) in the product (inefficiency either of excess of material, energy, capacity, etc.) [
1].
3.1. LeanDfX Pillars
The structure of LeanDfX is supported in four main pillars that are the basis of this holistic approach [
2]:
Pillar 1—product breakdown;
Pillar 2—selection of “X” domains and their specific design indicators;
Pillar 3—simple visual management attributes;
Pillar 4—aggregation of efficiency and effectiveness through product modular hierarchy and “X” design domains.
Given their relevance, specific mention is made of concepts of effectiveness and efficiency.
Effectiveness—Doing the right things to create the most value [
50]. Applying this to the LeanDfX perspective means if a particular requirement is met by the variable. Therefore, in this case, the color scheme is binary, in which the green corresponds to ratios of 100% and red is applied for ratios below 100%. The use of colors is justified by an approval system, where green means the analyzed value is approved and red means the contrary.
Efficiency—Where all requirements are met, meaning that every effectiveness reaches 100% and efficiency is calculated; otherwise, the corresponding efficiency cell displays a hyphen, representing “efficiency not calculated”. The core meaning of efficiency is a ratio of the actual output of a process relative to some standard and doing something at the lowest possible cost [
50]. In its essence, the meaning of efficiency in LeanDfX is the same, where it is a quantification of the effort to achieve a certain goal/target [
1].
3.2. Deployment
Resistance to change is a common difficulty in the industrial world [
1]. Therefore, a deployment roadmap approach to help the implementation of the LeanDfX tool is almost sine qua non for it to be successful. The implementation of the following six steps is necessary for the deployment of LeanDfX. These are not only linked to the pillars definition but also to a mindset of continuous improvement [
1].
Step 1—workshop;
Step 2—modularization;
Step 3—selection of design domains;
Step 4—selection indicators and parameter values;
Step 5—analysis of results;
Step 6—improvement of the design (iteration loop).
3.2.1. Step 1—Workshop
To avoid an erroneous use from the beginning, firstly an introductory workshop should be performed to ensure the alignment of all team members with the methodology. When the design team has a high number of members, a pilot group must be chosen to test and validate the methodology and afterwards extended to the entire design team [
1].
3.2.2. Step 2—Modularization
As mentioned above, modularization is directly connected to product breakdown. The starting point for the implementation of the design analysis of a particular product, equipment or system should be its decomposition into functional parts, or modules. It is a fundamental step to reduce overall complexity and, moreover, to allow the evaluation of effectiveness and efficiency for the smaller component up to the overall product. Thus, the second step consists of decomposing the product along its hierarchy of relations in the product breakdown, as shown in
Figure 5.
3.2.3. Step 3—Selection of Design Domains
The third step of the process seeks the correct definition of the various ”X” domains such as design for structural integrity, design for manufacturing, eco-design and design for modularity, etc. [
2]. A life-cycle analysis oriented to the selection of the domains and a very clear alignment with product requirements, specifications and standards must be considered [
1].
3.2.4. Step 4—Selection Indicators and Parameter Values
Afterwards, for each domain, the indicators and design variables associated must be identified. Then, for each design variable, the parameter value must be decided by the design team, i.e., this step consists in listing the design variables of the concerned domain based on the complete product specifications [
2].
The results are calculated, and, as aforementioned, a visually intuitive system (scorecards) to facilitate the analysis is used. The color scheme helps to attain a quick determination of which values must be developed and worked on.
Figure 6 shows an illustrative example of a LeanDfX scorecard.
3.2.5. Step 5—Analysis of Results
With the help of the scorecards, the obtained results are analyzed by the team. The aggregation tree must be used, and every previously chosen domain must be taken into account. In a bottom-up analysis, one should start the examination of the lower level (module, sub-system, system, etc.) and gradually progress upwards. In the upper levels, the aggregation results in two ratios of the product design. To help understand this step,
Figure 7 has a visual representation of the process: simple average was applied/average effectiveness (efc) and efficiency (eff). This aggregation method can be adapted as the user desires, depending on the company or product, using different mathematical operators.
At this step, the team can see if it is possible to lessen the design effort on some module and increase the effort elsewhere without compromising the budgetary constraints and overall design [
1].
3.2.6. Step 6—Improvement of the Design (Iteration Loop)
Finally, driven by a mindset of continuous improvement and iterative process, at this step correction of non-effective results of the current design variable, and improvement of poor efficiency results, must be performed. In a given concept to be improved, the iterative step is performed to improve modules with the variables in the most critical state. It allows the evaluation and selection of the best design concepts through the analysis of the LeanDfX scorecards [
1].
3.3. LeanDfX Fuzzy QFD
The LeanDfX Fuzzy QFD novel approach, presented in this work, is inspired by fuzzy QFD. As mentioned before, it is a very common approach to incorporate the fuzzy set theory in QFD to reduce as much as possible any uncertainty in the decision process. Its six main goals are the following:
Clarification of customer and client requirements and its functional requirements;
Ranking of the most important technical requirements to implement in the design of the product under analysis;
Identification of trade-offs between technical requirements;
Choice and identification of LeanDfX domains;
Choice and identification of LeanDfX indicators and parameter values;
To start the LeanDfX deployment process.
The existence of three documents to be filled is the origin of the three-stage procedure. However, as it will be seen later, there may be an additional (optional) document, originating a four-stage procedure. The following paragraphs present a space-by-space explanation and a step-by-step instruction to help the implementation of the methodology. The three documents and the optional document to fill are:
Client/customer requirements HoQ;
Additional requirements HoQ;
CRAR (customer requirements and additional requirements) QFD-LeanDfX;
(optional) LeanDfX domains weighting.
There are also three additional sheets to recap the results—one for each of the first two sheets and one aggregating both results. Those tables are:
Customer requirements order;
Additional requirements order;
Total requirements order.
An auxiliary document should address the logic behind this methodology, explaining step by step what should be done in order to fill the HoQs and explaining each column and line so that anyone without a background in project management can easily understand what must be done and why.
3.4. Client/Customer Requirements HoQ and Additional Requirements HoQ
These two HoQs are classic examples of house of quality with fuzzy set theory; however, to help the deployment phase of the LeanDfX framework, some changes are made to this sheet.
Figure 8 is a conceptual illustration showing that each space, i.e., column, row or matrix, is numbered. The main difference between both HoQs consists of the fact that the first is only for the client direct requirements and the second is dedicated to others, sometimes implicit or dedicated to good design standards.
In
Figure 8 the number codification is the following:
1—Customer requirements—list of customer requirements;
2—Maximum relationship—maximum relationship value for each requirement;
3—Importance—requirement importance from 1 to 9;
4—Fuzzy importance—importance in fuzzy trapezoidal value;
5—Type of requirement—if it is client, additional or project requirement, as an example;
6—X-domain—domain connected to the requirement;
7 and 8—Sub-part and part—part and sub-part that the requirement is about;
9 and 10—Weight chart and relative weight—relative weight in percentage and corresponding chart;
11—Row—row number;
12—Functional requirements—list of functional requirements;
13—Direction of improvement—if a functional requirement should be maximized, minimized or reach a specific value;
14—Roof matrix—where the relationship between functional requirements is translated, and how they affect each other;
15—Relationship matrix—where the relationship between customer requirements and functional requirements is defined from a 3, 5 or 9 value scale (explained further in the article);
16—Target—target value for the functional requirement;
17—Unit—target unit;
18—Maximum relationship—maximum relationship value for each functional requirement;
19—Fuzzy technical importance—importance value translated in fuzzy numbers;
20—Technical Importance—Defuzzified value of the technical importance;
21 and 22—Relative weight and weight—relative weight in percentage and corresponding chart;
23—Job experience—from three possible values, the user chooses a level depending on his/her experience.
Details concerning some spaces are now given. Spaces 9 and 10—if
ICr is the importance of the customer requirement on the row
r and
R1 the total number of rows, then the relative weight of customer requirement on the row
r,
RWCr, is given by:
Space 15—the goal of this space is to identify how the customer requirement on row
r,
CRr relates to the functional requirement on column
c,
FRc. In the most developed version of the methodology, a 9-values scale is available to fill the space under analysis, as shown in
Figure 9. The chosen value should measure the strength of the relationships between requirements.
It is also possible to have a 5-values scale or a 3-values scale and that it is a choice made by the team.
In
Figure 10, the weights represented are the crisp weights; however, the weights considered are in a fuzzy logic. In
Figure 10, each decision-maker assigns values based on the linguistic scale, and their relationship strength in fuzzy language is translated by
RS rc, where once again,
r and
c are row and column number, respectively.
This set of linguistic variables is denoted by F = WT, VW, W, WM, M, S M, S, VS, S T and are quantified in trapezoidal fuzzy numbers.
Space 20—if for each functional requirement on column
c,
FRc, 4 fuzzy technical importance values are used,
FTIci, where
i is a number between 1 and 4, the technical importance for column
c,
TIc, can be obtained by:
3.5. CRAR (Customer Requirements and Additional Requirements) QFD-LeanDfX
This diagram is the most direct bridge between QfD and the LeanDfX framework. Here, step 3—“Selection of design domains” of LeanDfX framework occurs systematically and once again facilitates the deployment of the framework. The graphic representation is shown in
Figure 11, and it is simpler than the previous two.
The number codification is as follows:
1—X-domains—domains assessed in LeanDfX;
2—Total functional requirements—the functional requirements from both previous HoQ;
3—Roof matrix—roof matrix for all functional requirements;
4—Relationship matrix—relationship between the X-domain and the requirement. If they are connected, an X is filled in the blank space.
3.6. (Optional) LeanDfX Domains Weighting
In this optional step, the users should give a weight to each domain, where the job experience of the user is also considered. The conceptual diagram is shown in
Figure 12.
The number codification is as follows:
1—X-domains—domains assessed in LeanDfX;
2—Users and fuzzy importance—users of the methodology;
3—Total—final importance of each X-Domain;
4—Relative weight—relative weight in percentage of each X-domain;
5—Job experience—job experience for each user;
6—Importance matrix—from a scale of 1 to 9, the user decides the importance of each X-domain.
3.7. Combining Results
One of the strengths of the complete methodology is the possibility of combining individual results of all people filling the charts and reaching a combined result with useful information for the team.
To combine results, if
U is the number of users that followed the steps and filled the file,
u being a natural number that represents a user and
FTIcu, the fuzzy technical importance of a user
u of a functional requirement on a column
c, to obtain the aggregated fuzzy technical importance value,
AFTIc:
3.8. FMEA
Another additional tool used to complement and integrate the LeanDfX framework is FMEA. A direct connection with design for safety and design for reliability domains can be concluded from a first analysis.
In the case study to be discussed in the next section, a classical approach was adopted with small changes. The opinions of several people (inside and outside the project) were considered. In the same way as in QFD, the experience of the person that contributed was taken in consideration. This demanded that the results of every FMEA were converted to fuzzy set language so that they could be combined in one single file and conclusion.
To have a coherent approach in the explaining process, a conceptual representation of the spaces and FMEA is shown in
Figure 13.
Spaces 1 and 2 are just dedicated fields to mention what the component is in the main analysis. Space 3 is a field where an additional component may be associated to the considered failure, or extra information or details on the place where the failure may happen in the component.
As in the example given in the work of Pahl et al. [
6], there are spaces then dedicated to explain failures, from the type of failure to the consequence associated and what the failure cause is. These are, respectively, spaces 4, 5 and 6.
Space 7 is dedicated to a possible test that can be performed to prevent or detect possible failures so that accurate values can be reached when filling FMEA.
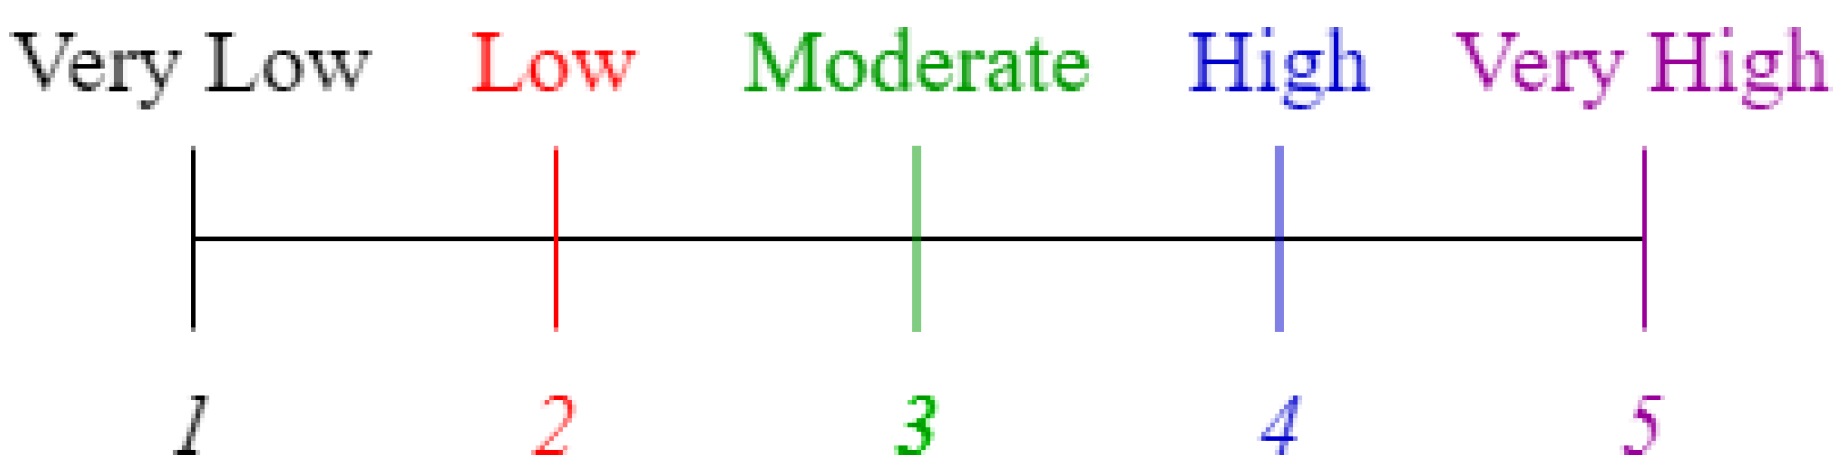
People that only need to fill the file must look for spaces 8, 9 and 10, classical fields where the probability of occurrence (
O), severity of failure (
S) and detectability (
D) are evaluated in a linguistic scale of five terms. This scale is inspired by the work of Pillay and Wang [
40] and was chosen to facilitate the filling the process and to be able to use it without having to conceptualize values in a case. Finally, they were transformed to values, and the linguistic scale and its values for use in FMEA are given in
Figure 14.
Afterwards, in another sheet to avoid user confusion, these three terms are translated to a 0 to 10 value fuzzy linguistic scale, allowing for the possibility to use the 125 RPN threshold number again. The fuzzy scale used for the linguistic scale is also represented in a graphic, and a trapezoidal fuzzy number was also the method used, only to keep a similar approach in both additional tools. The linguistic scale in fuzzy language is represented in
Figure 15.
Values used for the experience of the user were the same as in the QFD methodology, where the three classes were:
little experience—(0, 0, 2, 4);
medium experience—(0, 2, 6, 8);
good experience—(4, 6, 8, 8).
The fuzzification process is obtained by the following expression:
where
JE is a fuzzy number regarding the user experience,
FVr translates the value given in the five-terms linguistic scale in the fuzzy scale for one of the three evaluation variables (meaning that the
V can be one of these three:
O,
S,
D) for a failure in row
r, and
FFVr is the final fuzzy value for the variable calculated (
O,
S,
D) for the same row
r.
After, space 11 has different meanings depending on the sheet that is being analyzed. It can be the one that only has the values from 1 to 5 where the scale is the in
Figure 14 or one where those values are also translated to fuzzy numbers.
Spaces 7, 8 and 9 also can be one of the options aforementioned, depending only on the Excel sheet. In this space, the case study adopted a classical approach to
RPN, i.e., its value is calculated as:
If the visual representation of RPN is in crisp numbers, it allows a quick analysis of its result, something that it is not possible with the fuzzy numbers.
4. Case Study
Autonomous guided vehicles are thoroughly discussed e.g., in [
51]. In the present work, the design of an AGV chassis was used as a case study to test the enlarged and enhanced LeanDfX framework. This AGV was an active project of JPM Industry. Once JPM specified a set of requirements for the chassis, the project could start. The first step was transforming the customer and additional requirements into technical requirements, as demonstrated in
Table 2 and
Table 3:
Then, a modular breakdown of the AGV was made to characterize the chassis and its relationships with the other components of the vehicle. Recalling
Figure 5, the modular breakdown of the AGV is shown in
Figure 16. Afterwards, as step 3 of the framework, the domains needed for the development of the chassis were selected. With all this information, both FMEA and QFD templates could be filled and their results obtained.
4.1. LeanDfX Fuzzy QFD Analysis
The connection of QFD with the LeanDfX framework is not limited to design for X methods; it also includes lean thinking, the other part that individualizes and makes LeanDfX shine. Lean thinking guidelines focus on meeting technical requirements that allow to fulfill the highest number of client requirements, reducing wasted time.
This systematic and simple approach allows a smoother transition to the LeanDfX framework. Some vagueness associated with some requirements or steps needed to deploy LeanDfX is eliminated by QFD.
As mentioned, it is hoped that small- and medium-sized enterprises can understand and adapt LeanDfX Fuzzy QFD. Even if the sample is small and JPM is a company with a mature approach to systematic design processes, the feedback from the deployment of this QFD methodology was positive. There were no major drawbacks or difficulties in understanding the importance of this methodology and its deployment. The case study was performed under the COVID-19 pandemic constraints, i.e., everything was done at a distance without workshops or physical meetings to explain the process. Even in these circumstances, the people responsible for filling the documents did not report difficulties concerning the purpose or the instruction guides. This indicates, at least in a small sample, the usability of the developed methodology, a characteristic that was seen as important since the start of its development.
If the complexity of the methodology is a major drawback to some companies, there is also a possibility to use LeanDfX Fuzzy QFD as a modular tool where only one or two of the stages are accomplished. For instance, if the HoQ is perceived as a hard and difficult process, the LeanDfX domains weighting can be performed alone and, even so, value is added to the design process. This is originated from the implementation of modularization forward thinking into the full designing process outside of the main LeanDfX framework.
The full HoQ diagrams are too large for inclusion here, but results concerning relative weights for client/customer requirements are recorded in
Table 4 and concerning relative weights for additional requirements in
Table 5. LeanDfX domains weighting results are presented in
Table 6, illustrating the major importance assumed by design for safety, design for standardization, design for structural integrity and design for reliability.
4.2. FMEA Analysis
Within LeanDfX Fuzzy QFD, the need for FMEA to cover several guidelines and safety requirements was highlighted. The use of FMEA allowed the prevention of possible failures; the following were considered as critical:
Battery performance degeneration may be used as an example of the measures taken to reduce failure. Usually, performance degeneration results from bad maintenance or confinement in a very limited space. To prevent this, the battery was placed in an accessible location to allow maintenance and in a space a little bigger than its own dimensions.
4.3. AGV Chassis Design
At this stage, it was possible to start the design process of the AGV. From the QFD results, it was possible to conclude that the most important characteristic to consider is the location of the several components in the limited space. To deal with this problem, the first step in the design process was the schematic design choosing the location of each component in the chassis.
4.4. X-Domains Influence
Design for safety is met in the design process through several additional functional requirements. Simple parts, identical components, modules and symmetry when possible, allow the spreading of loads through the entire structure, reducing its impact at the loading point. FMEA is a tool that allows meeting guidelines for this domain. Structural calculations, consideration of mechanical and physical properties and safety standards are connected to safety requirements and guidelines. Structural integrity and reliability also derive from the same reasons and measures, showing that safety, structural integrity and reliability are deeply connected, and there is a single tool that helps meeting several guidelines for the three domains: FMEA. Another safety measure that may not be seen as such is the easy accessibility to components, allowing their safe replacement and maintenance.
Forward-thinking design is where a number of standard pieces, simple parts, identical components, modules and symmetry, when possible, all aid in meeting standardization guidelines. Design for maintenance is accomplished by allowing easy maintenance for parts and accessibility. Moreover, the number of standard pieces, the use of simple parts, identical components, modularity and possibility of symmetry also aid this goal, due to the fact that using identical and standardized parts makes their replacement and behavior prediction a lot easier.
DfQ has several dimensions. Using FMEA, also a quality tool [
7], and meeting customer requirements are the most basic ways to consider this domain. The iteration loop of LeanDfX is also a design process that makes designing for quality possible.
DfMA can be met by obeying several standards, which also facilitates manufacturability and assembly processes.
Ergonomics may seem not important since an AGV has no transported operator. Nevertheless, accessibility to components that may be maintained, operated or cleaned must be considered. As an example, ergonomic principles would not be respected if the electrical cabinets were placed in a low position in the AGV, since this would oblige the operator to get in a non-ergonomic position to operate the machine.
One important overall knowledge domain is the environment, and the related X-domains include design for environment and recycling. Naturally, the use of recyclable material is a direct measure of these domains, but not the only one. Recycling is easier when parts are standardized with recycling guidelines. When they are simple or at least identical parts, they can have the same treatment holistically. Modularity makes replacement easier and retrofitting.
4.5. Structural Tests and Design
With the previous considerations, the first schematic design of the chassis was born. Afterwards, beams were considered to create the metallic structure of the chassis. Then, fatigue, dynamic and structural analyses were carried out using Solidworks (Solidworks Educational 2019 Porto Portugal).
As mentioned, with the help of analyses and the simulation feature in Solidworks, multiple tests regarding the effect of the loads, the stiffness of the structure and its stability were conducted for each iteration in order to verify if the structure could resist the worst-case scenario. Even if the worst-load-case scenario is not probable, there is a chance that it may happen. Consider, for instance, lifting the load to maximum height and leaving it in the right place; during the separation phase (i.e., AGV is departing from the load), the load may connect once again with the forks and will be supported by the tip of the forklifts, creating an extreme bending situation. Schematical
Figure 17 illustrates the applied loads and their distances, and corresponding data are given in
Table 7.
An intermediate step of the structural analysis using Solidworks is shown in
Figure 18. The final obtained design is illustrated in
Figure 19.
4.6. Iterations
Several iterations were necessary to reach this final design, and the LeanDfX framework allowed to understand what was overdone or what was still necessary to fulfill. This is the strength of the framework and its purpose—a systematic and organized approach to designing and improvement. Four iterations were considered to the scorecards, but for this analysis, only the first (1) and the last (4) are compared.
To test the structure and appreciate the value of the LeanDfX framework enhanced with QFD and FMEA, some X-domains were selected. Furthermore, to reduce the number of scorecards with redundant information, some domains were combined due to their connection and similarity in some fields. The used domains were the following:
To prove the utility of such a framework, an analysis was performed only to the structural/safety/reliability domain to demonstrate the value added by having a systematic approach to design, provided by LeanDfX Fuzzy QFD, FMEA and the LeanDfX framework.
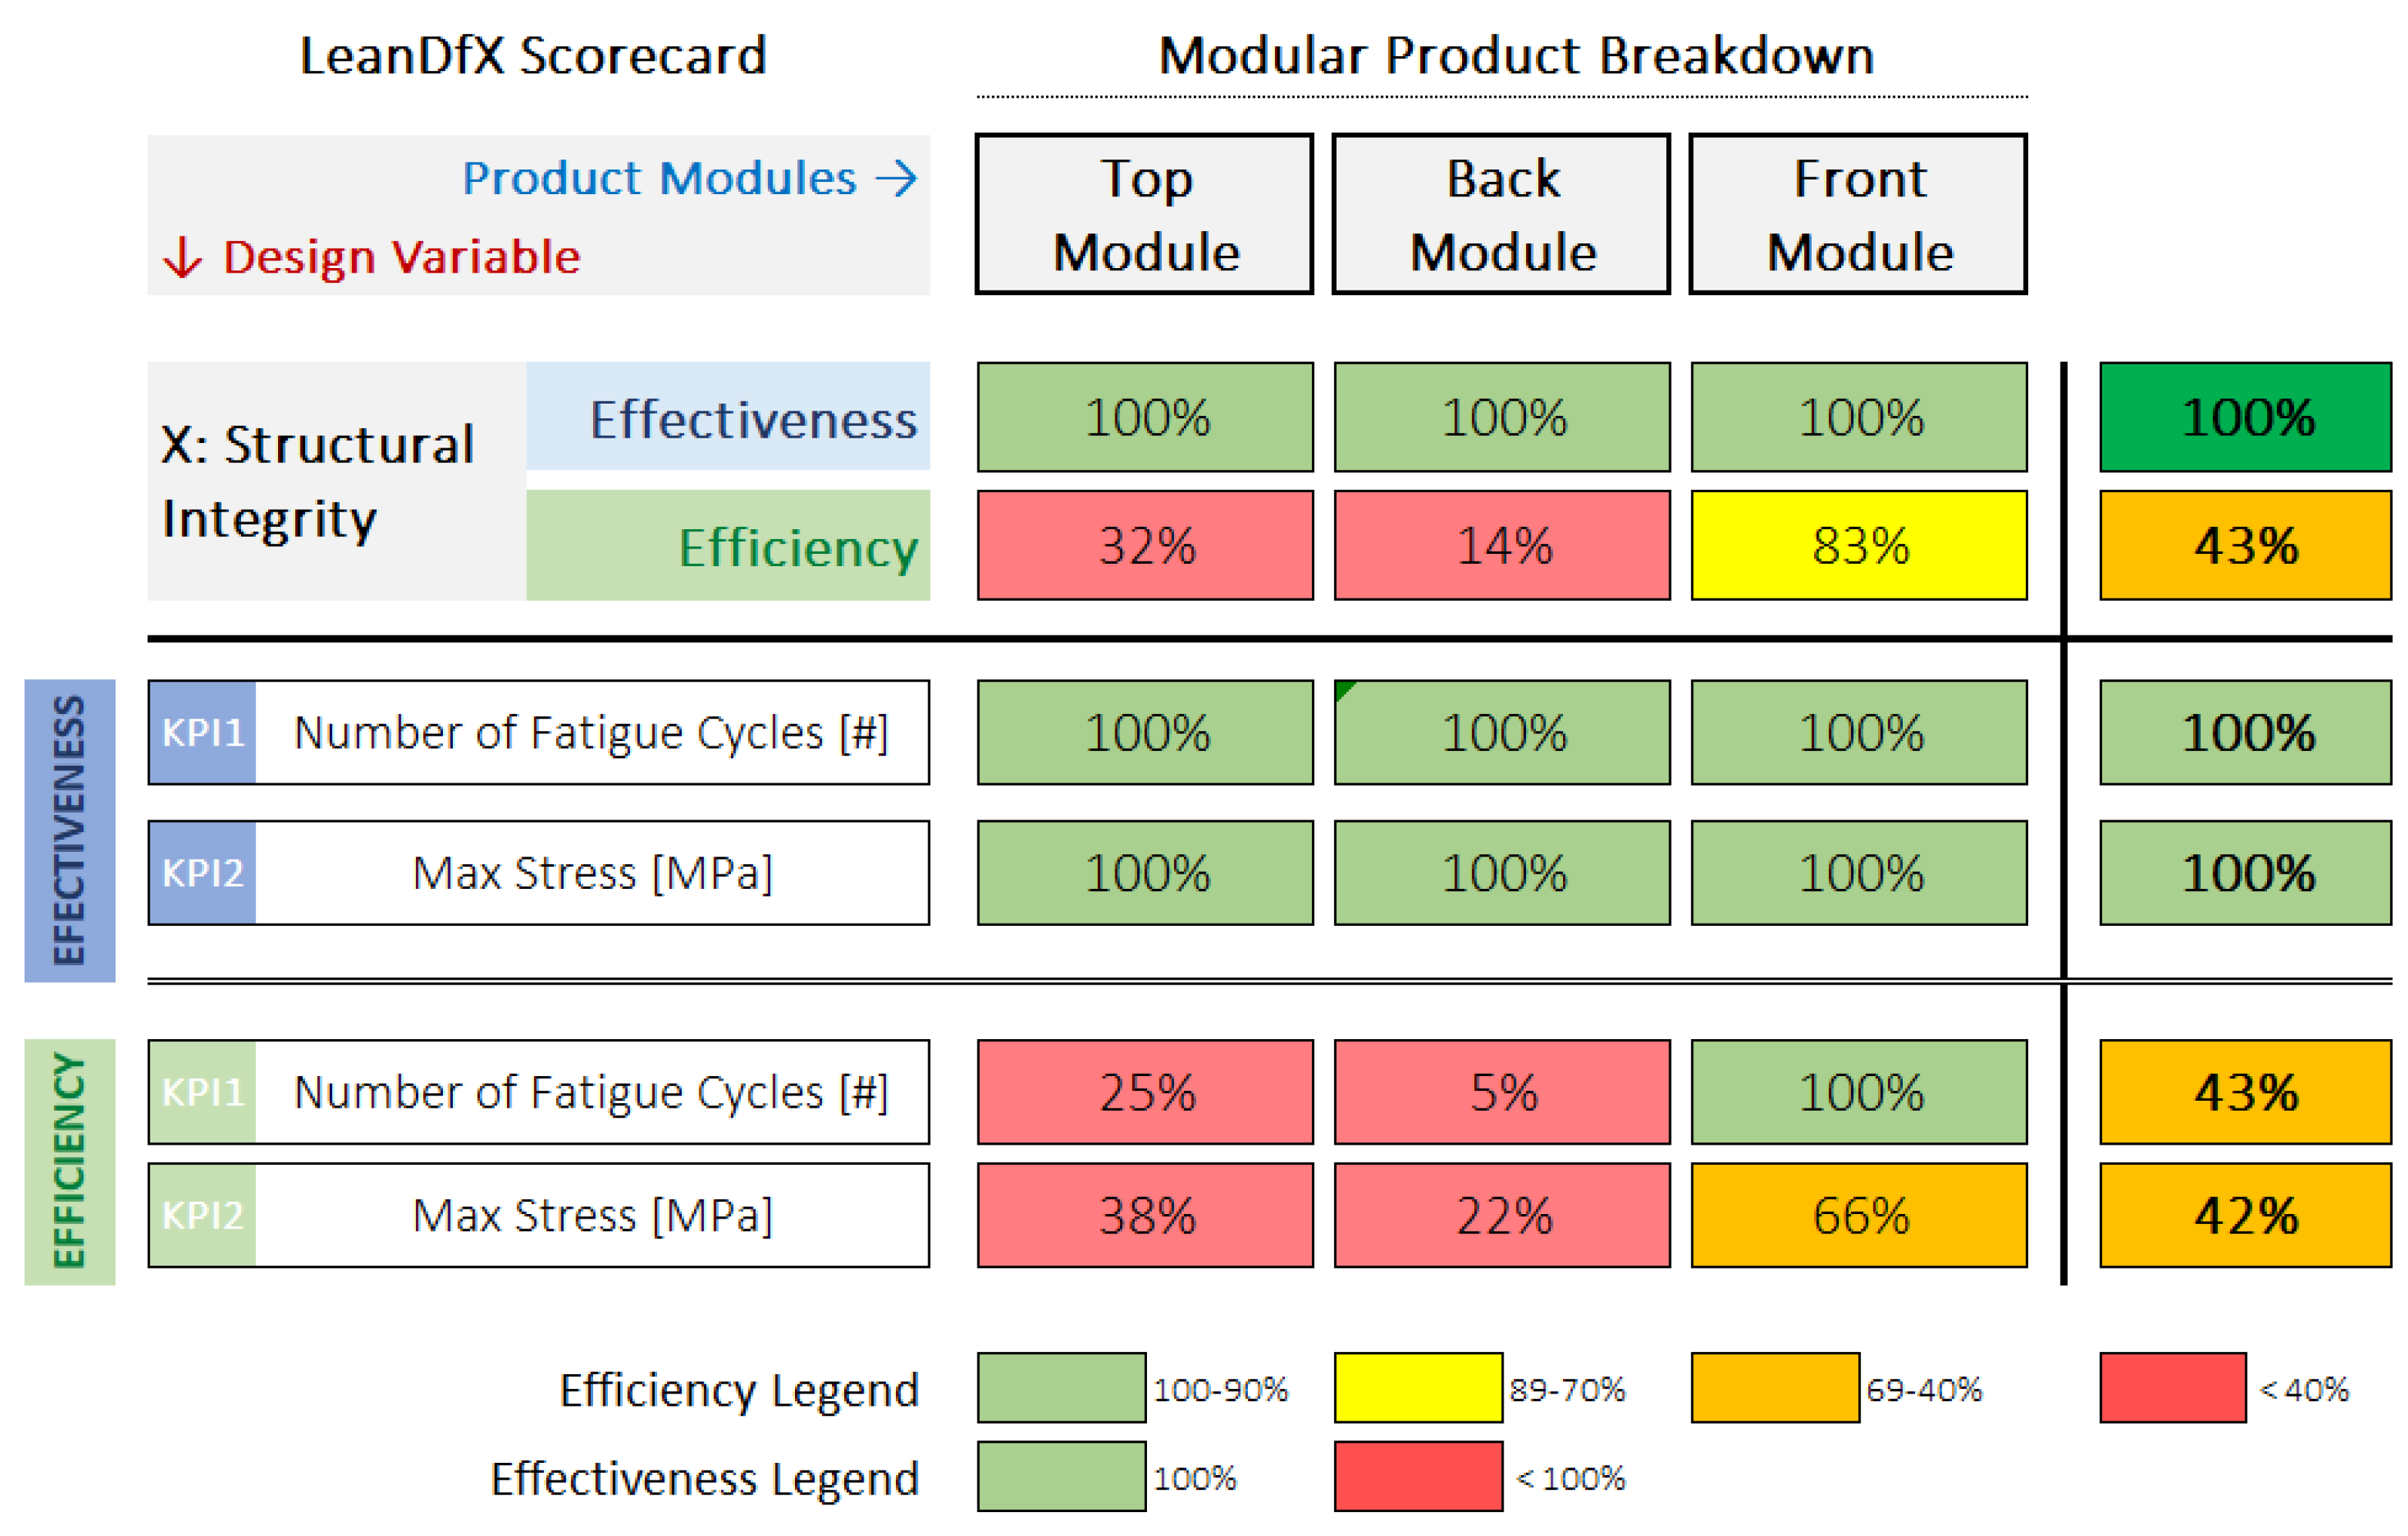
4.6.1. Structural, Safety, Reliability
QFD indicated that structural/safety/reliability is overall the most critical domain and was assessed for the overall structure and for each module. For simplification reference, it is named in the study as the “Structural Integrity” domain. Measures were taken such as applying fuzzy FMEA and some requirements in the technical requirements list. To evaluate if the structure fulfills structural integrity variables and to know how far the design is in relation to the best-case scenario, the design variables chosen were the number of cycles (fatigue) and maximum stress, with specific threshold values. Even if the threshold value for factor of safety assumed was 1.5, it was assumed that a factor of safety about 2 would be the ideal value. In the same way, 5 × 10⁵ was the number of cycles assumed to be ideal because it would imply that fatigue failure was precluded.
The generated scorecards for the first and last iteration are shown in
Figure 20 and
Figure 21.
4.6.2. Results Analysis
The first version is much more complex than the last version. As a result, over-engineering and overdo are shown in the scorecards. Even if it presents an effectiveness of 100%, it has a low efficiency due to the over-engineering in several variables. As it can be seen, only the front module, connected to the elevation tower, has a good efficiency because it presents the higher stress values. The other two modules show a high level of over-safety, which goes against lean thinking. The total efficiency presented for the whole structure is 43%.
For the last version, efficiency rose to much more acceptable values, evolving from 43% to 65% and showing that only the back module is much more robust than necessary. However, this is not a problem because of how this structure was designed: allowing the possibility to connect the elevation tower to both sides. Taking this into consideration, real efficiency value is higher than what is presented in the scorecard in
Figure 21. The only module that suffers real over-engineering is the “back module”, with an efficiency of just 33%.


