Article

One Factor at a Time Analysis to Modify Potting Technique for Manufacturing of Bubble-Free High-Voltage Polyester Insulated Automotive Coils

1
Department of Mechanical Engineering, University of Engineering & Technology, Peshawar 25120, Pakistan
2
National Center for Physics, Quaid-i-Azam University, Islamabad 45320, Pakistan
3
Department of Mechanical Engineering, International Islamic University, Islamabad 44000, Pakistan
4
Department of Automated Mechanical Engineering, South Ural State University, Lenin Prosp. 76, 454080 Chelyabinsk, Russia
5
School of Mechanical and Design Engineering, University of Portsmouth, Portsmouth PO1 3DJ, UK
6
School of Engineering, Edith Cowan University, Joondalup 6027, Australia
*
Authors to whom correspondence should be addressed.
Designs 2022, 6(3), 44; https://doi.org/10.3390/designs6030044
Submission received: 16 March 2022 / Revised: 20 April 2022 / Accepted: 29 April 2022 / Published: 13 May 2022
(This article belongs to the Section Vehicle Engineering Design)

Abstract

:
The current study focuses on minimising the bubbles in polyester-insulated ignition coils, which were produced with a defect level of ~21–25% or 210–250 coils per 1000 batch size by using the potting method. This high-level rejection makes a substantial financial impact by increasing waste material, manufacturing, and after-sales costs. Hence, to control the bubbled problem without using expensive and maintenance-heavy techniques, the process parameters in the potting method were alternated and investigated using one factor at a time, which played a vital role in the formation/reduction of bubbles in the ignition coil insulation. Process parameters, including pre/process heating, the appropriate MEKP/cobalt naphthenate ratio, the pouring amount/increments, and the stirring speeds, reduced the bubble formation per lot from 205 ± 30 to 146 ± 25, 108 ± 21, 61 ± 17, and 10 ± 2 per 1000 lot accordingly. In addition, a comparative study was conducted in terms of performance and life cycle endurance, using Japanese and Indian standards. Furthermore, an after-sale warranty claim also supports the proposed changes in the potting technique. This modification may reduce the after-sales rejection within two years to approximately ~85%. This modification in the potting technique is extremely cost-effective in comparison to expensive processes, i.e., vacuum-pressure impregnation and vacuum impregnation, which require extensive labour and maintenance.

1. Introduction

Ignition coils are a major component in automobiles, boilers, and generators that provide ignition with a proper sequence [1,2]. Ignition coil step-ups need low to relatively high voltages, i.e., 20–35 kV (depending upon design), to generate a reasonable spark [3,4]. Exposure to harsh conditions, including engine heat, oils, lubricants, loose mountings, and greases, makes this task substantially challenging [5]. Additionally, bearing higher environmental and engine-generated temperatures (~−40 to 150 °C depending on application) makes these coils vulnerable [6,7]. Materials with an appreciably higher breakdown voltage and dielectric strength are required. Epoxies are mainly used to insulate high-voltage coils and applications [8]. However, prominent defects such as cracks significantly affect the insulation quality [9,10]. However, polyester-based insulations usually contain a noticeable quantity of bubbles (see Figure 1). These bubbles affect the performance of the coil by enhancing the possibility of unnecessary discharges. Furthermore, the difference in coefficient of thermal expansion between three different materials, i.e., copper winding, cured epoxy insulation, and polypropylene capsule, causes cracking [11]. Therefore, polyester may be preferred over epoxy-based insulations in this application. Moreover, bubbles mostly entrap air, which is a good insulator of heat and electricity. Therefore, these bubbles do not conduct heat properly, which causes the coil to heat up. Heating high-voltage insulation for a longer period may cause a significant decrease in dielectric strength, ultimately leading to failure [12]. Additionally, captured air may entrap tiny dust or other charged particles, which can also contribute to the failure of the device by ionization. Besides, an increase in bubble dimensions boosts the possibilities of failure in coils. Previous literature also suggests that size, shape, position, and quantity inside insulation may noticeably enhance the possibilities of partial discharges (PD) and ionization [13].
An improvement in dielectric strength with the addition of nano-fillers is usually unlikely [14,15]. Likewise, the addition of ceramics, i.e., BaTiO3, SiO2, TiO2, and Al2O3, were also ineffective in these applications [16]. Moreover, micro and nanocomposites with thermosetting polymers are not an economical route. Therefore, effective methods to remove the bubbles/voids from insulation need to be investigated stepwise. Hence, an existing potting method was modified by changing several parameters during the insulation process to minimise the percentage of bubbles in the ignition coils. However, its non-economical maintenance entailed procedures and processes, i.e., vacuum impregnation (VI) and vacuum pressure impregnation (VPI), which were used to mitigate bubbles-related problems [17]. However, bubbles are formed in coils manufactured from these two processes due to the development of partial pressure in the vacuum chamber. Partial pressure, as a consequence, evaporates polyester itself, which also results in bubbles [18]. To the best of our knowledge, a reduction in the bubble percentage of ignition coils by modifying the cost-effective potting method using the one-factor-at-a-time approach (OFAT) additionally supported with process-related parametric analysis was not comprehensively performed previously. Therefore, a thorough study needs to be performed on this specific manufacturing problem.
In the present paper, a combination of values of factors is determined using a one factor at a time approach (OFAT) to eradicate bubbles in polyester-based insulations of ignition coils using the potting technique. These factors include pre and process heating of coils by LEDs, accelerator/hardener quantity, pouring amount, and the application of centrifugal force. Additionally, the relationship of influencing factors is also presented to elaborate the outcome statistically. Afterward, 10 coils from the improved lot are subjected to quality tests (performance and endurance tests) based on IS-14380 and JIS D- 5121 and receive after-sale claim analysis. The outcome of improved and previously manufactured coils is compared. However, based on positive results, an amendment in the conventional potting procedure is suggested.
The production of 21–25% of bubbled coils is major concern using the polyester and potting method. This higher quantity of bubbles reduces the quality by enhancing the chances of failure by increasing the probability of PD and corona. Therefore, the potting method needs substantial improvement by manipulating the factors. Therefore, the prime objective of this study is to improve the potting process to reduce the bubbled coils percentage to at least less than 2%.

2. Materials and Methods

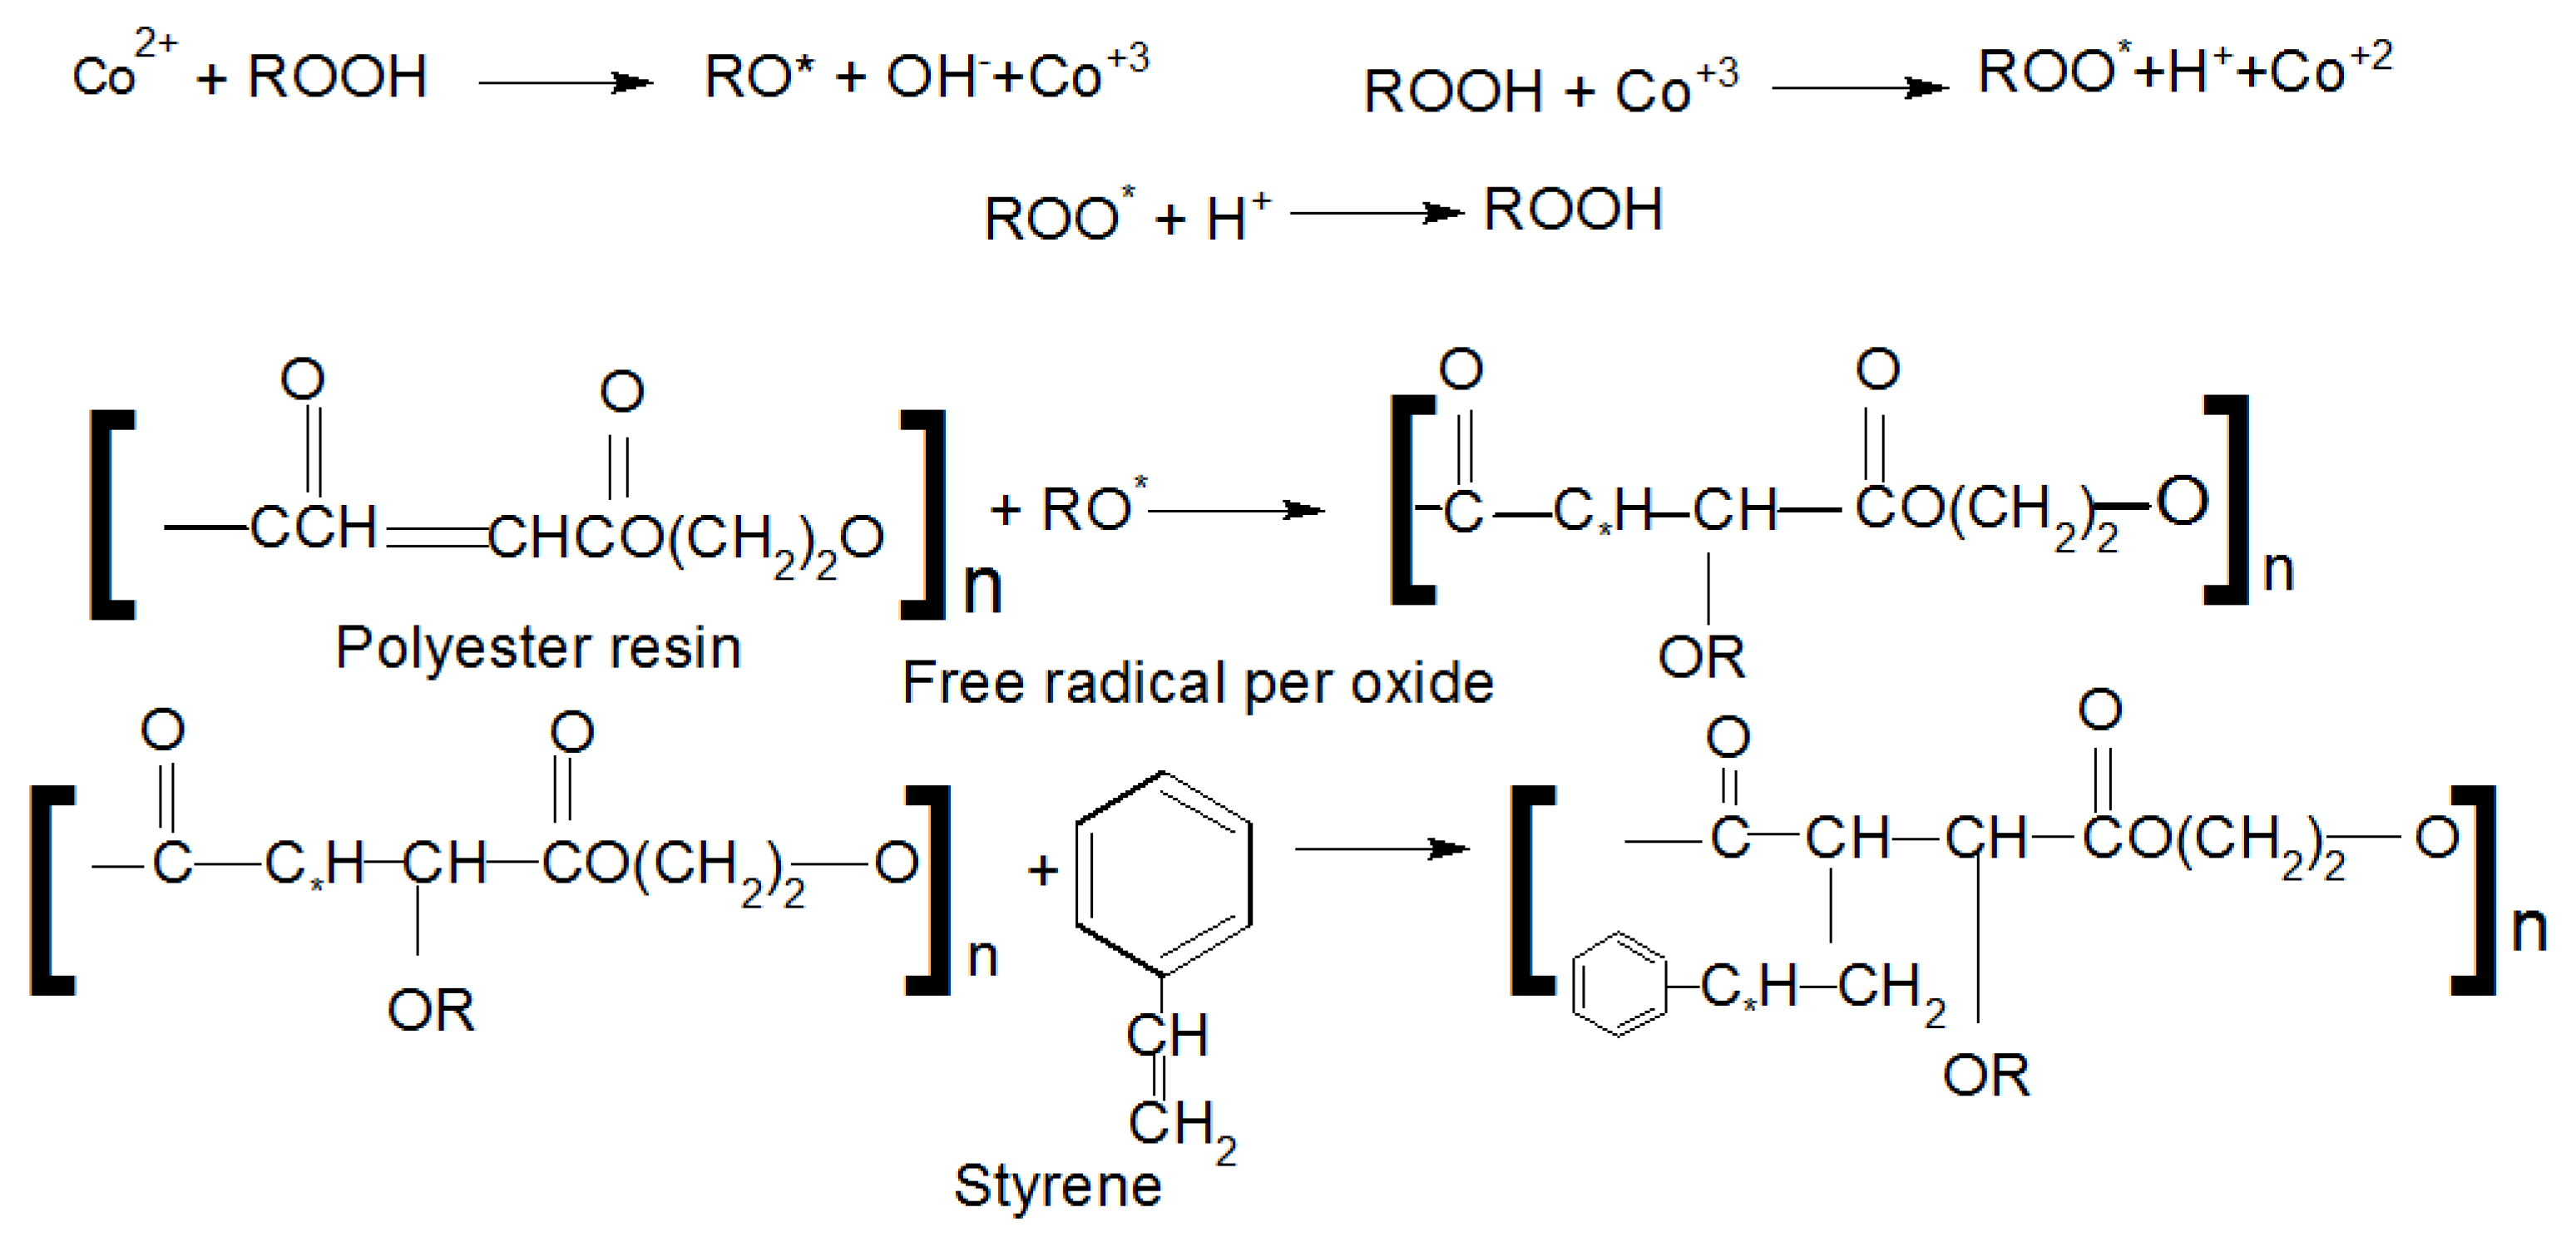
2.1. Materials and Curing Procedure

The general-purpose unsaturated polyester (UPR) resin was purchased from Al-Khair chemicals (Pvt) Ltd. and used in the current study. The UPR was synthesised mainly by the reaction of polypropylene glycol and maleic anhydride. The initiator comprises 50% methyl ethyl ketone peroxide (MEKP) solution in dimethyl phthalate. Moreover, cobalt naphthenate (accelerator) accelerates the reaction [19,20]. For making a coil insulation, the initiator and accelerator are incorporated in UPR to initiate curing. The accelerator (cobalt naphthenate) decomposes the initiator (50% MEKP solution in dimethyl phthalate) into a free radical (as shown in Figure 2) [20]. Afterward, free radical attacks UPR and gets itself attached to the UPR chain. UPR is also radicalised and further attacks styrene molecules. Furthermore, styrene gets attached to the UPR chain and becomes radical to connect with another chain (see Figure 2) [20].

2.2. Manufacturing of Ignition Coil

The coils are manufactured using the potting method because it is economical compared to the other six high-voltage impregnation techniques. 25.6 ± 0.20 g of the UPR polyester resin was incorporated into the capsule. Additionally, the UPR polyester resin was heated at 50 °C for 5–10 min before being poured into the capsules. All the coils were manufactured using the Fontalba technique by over-molding the polyester insulation with another polymer [21]. In our case, the polyester insulation was further over-molded by polypropylene. The relative humidity was maintained at 35 ± 5% in all the experiments, as per the American Society of Heating, Refrigerating and Air-conditioning Engineers (ASHRAE) guidelines.

2.3. One Factor at a Time Experiments

To find an adequate solution for bubble eradication, the OFAT approach is used in which one factor is changed at a time while other factors are kept constant. The appropriate input value of each factor is determined and kept consistent in the succeeding experiment. Besides heating UPR before pouring it in capsules, 4-watt light-emitting diodes (LEDs) are installed on all the coils’ partial assembly and placed inside the potting fixture. A lot of coils are pre-heated for different amounts of time before polyester is poured inside the coils and process-heated consistently after polyester addition by installed LEDs. The outcome of the experiments on bubble percentage are recorded and analyzed. Furthermore, the quantity of the initiator and hardener vary from the existing quantity, and its consequence on average bubble formation percentage per lot (%BFPL) are also analyzed. In addition, the alteration in pouring sequence (pouring UPR in single or multiple incremental amounts in coils) of UPR is also performed, and its influence on bubble formation per lot is also analyzed. After determining the appropriate value of other factors, the effect of angular velocity on bubble formation percentage is investigated. Appropriate optimal values for each of the factors are determined using experimental outcomes and combined to improve the conventional potting technique. Finally, statistical relations are manipulated, which shows the interaction between these factors and is also used to validate an improvement in modified insulation manufacturing procedures. These statistical relations are also used to explain the possible scientific reasons behind the increase or decrease in bubble formation percentage.

2.4. F and T Statistics

Statistical studies are assisted by analysis of variance (ANOVA). We conclude about the significance of these outcomes by evaluating the sum of squares (SS), mean squares (MS), and F-values. Moreover, SS is comprised of two prime factors, i.e., SStreatment and SSError. The summation of these aforementioned factors (SSError and SStreatment) is equal to SSTotal. Mathematically, SSTotal can be written as:
S S T o t a l = S S T r e a t m e n t + S S E r r o r
Likewise, SSError is estimated using Equation (2):
S S E r r o r = i = 1 n j = 1 n ( y i j y i . ¯ ) 2  
Equation (3) is further used to estimate SStreatment as:
S S T r e a t m e n t = n i = 1 a ( y i . ¯ y .. ¯ ) 2  
MS is determined by the ratio between SStreatment and the corresponding degree of freedom/s (DOFs). In case of error and treatment, DOFs are Na and a − 1.
M S T r e a t m e n t = S S T r e a t m e n t D O F = S S T r e a t m e n t a 1
M S E r r o r = S S E r r o r D O F = S S E r r o r N a
The F-value can be estimated by an under-mentioned relation:
F = M S t r e a t m e n t M S E r r o r
t-statistics were used for two or more input parameters related to a single output. Mathematically, the t-statistics relation can be written as:
t = β ^ S E ( β ^ )
In the above-mentioned relation, β ^ and S E ( β ^ ) are the predictor and its error of respective input parameter. Furthermore, t-statistics values are converted to their respective p-values.

2.5. Testing Sample Coils

Afterward, coils are subjected to three different analyses, such as a performance test, an endurance test and an after-sale warranty claim percentage. Performance and endurance tests are conducted by creating a situation similar to the motion of a vehicle. Test equipment for performance and endurance includes a motor connected to capacitor discharge ignition (CDI), alternating to a direct current (AC/DC) converter, magneto and three-point specified gaps between electrodes. Performance is analyzed using Indian standard (IS-14380) at three different speeds, i.e., 1500, 2500, and 6000 rpm, for 5 minutes, having a three-point spark gap of 5 and 8.5 mm, respectively, on the abovementioned testing equipment [22]. The reason for being subject to Indian standards is that most bikes are sold in south Asian countries, i.e., India, Pakistan, and Bangladesh. Therefore, coils are tested in accordance with Indian standard IS-14380. All the manufactured lots are subjected to a performance test for 5 min. The coil is considered for rejection if it produces a distorted spark or no spark during the specified testing time. Moreover, from the performance, the test percentage of failed coils is calculated. The percentage reduction in conventional and proposed insulation manufacturing is used for analysis. Afterward, an endurance test (JIS D-5121) is performed on a hundred coils randomly selected from both the lots (the existing and the proposed method) on the aforementioned machine. Coils are subjected to the motor running at 3000 rpm and 20 kV voltage is applied between two electrodes at a three-point spark gap of 12.5 mm, continuously for 300 h as per the JIS standard [23,24]. Finally, after-sale warranty claims analyses of coils within two-year periods of usage are also considered for existing and modified lots of coils. The final comparison between conventional and modified potting techniques is made based on the percentage of coils received within two years’ time.

3. Results

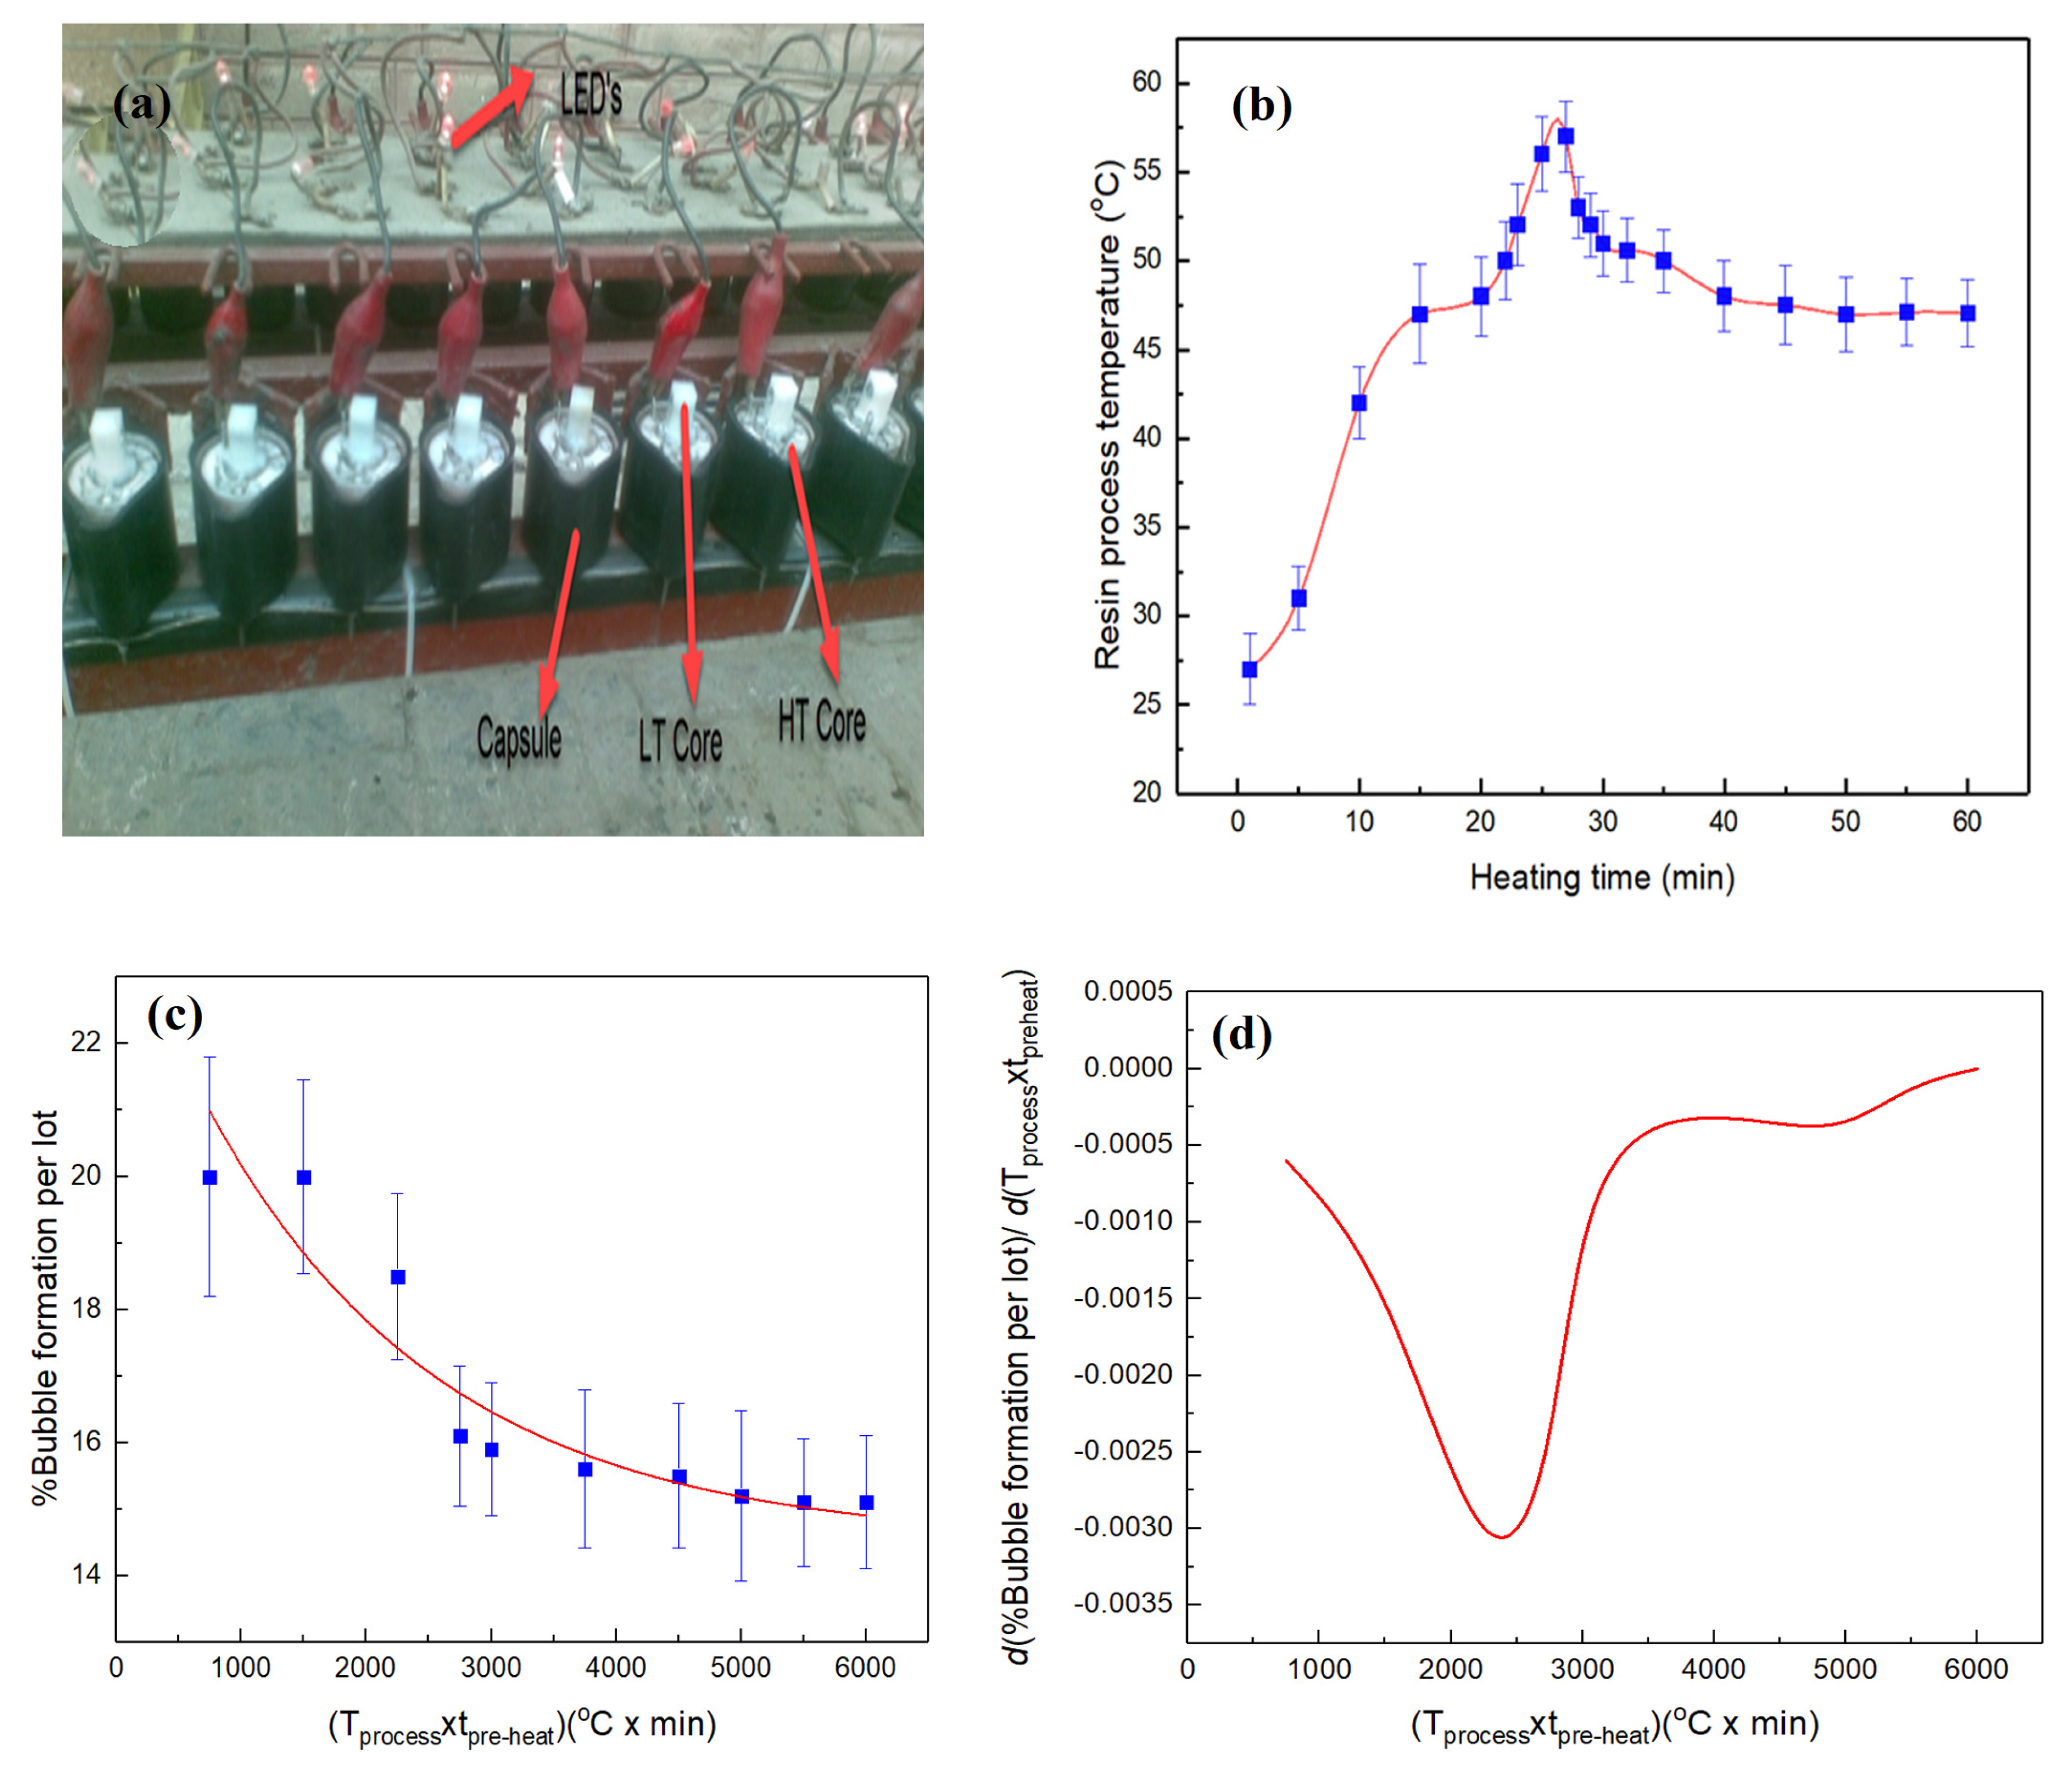
3.1. Pre and Process Heating of Coils

Coils are preheated before UPR is poured inside capsules. Four-watt LEDs are used to preheat the coils for 15, 30, 45, 60, 75, 90, and 120 min, respectively, for the installed LEDs in the potting fixture. Furthermore, the consistent heating of UPR is performed by the LEDs inside the capsule at TProcess = 50 ± 5 °C until it is cured. Moreover, Figure 3b depicts that preheating the coil exponentially affects the bubble formation percentage up to ~55 to 60 min. The results show the effect of pre-heating on %BPFL by decreasing bubbled coils from ~22 to 14.7% (as shown in Figure 3a). The exponential relation (see Equation (17)) perfectly fits the data set with the fitting parameter as yo = 14.50 ± 0.70, A = 9.64 ± 1.90, and Ro = −5.31 × 10⁻⁴, with the statistical relation error α = 0.1 (as exhibited in Table 1). Equation (17) almost confirms the exponential decrease in percent bubbled coils up to 55 ± 5 min. Intercept yo represents the minimum bubble proportion in the manufactured coils with preheating above 60 °C, i.e., 13.07 ± 1.70%. Similarly, the slope or pre-exponential constant (A) of the relationship represents the difference between two failure percentages, i.e., without and with treatment. Beyond 55 min, no considerable effect of preheating is observed on bubble formation, which is also confirmed by the first derivative (as depicted in Figure 3c,d). Similarly, the size of spherical bubbles is also reduced significantly in comparison to conventional procedures (1.13 to 0.33 mm2) (see Figure 4). However, the effects of pre-heating time and process heating on elliptical bubbles are smaller (3.5 to 3.2 mm2) (as evidenced in Figure 4).
We assume the rate of change %BPFL w.r.t. preheating time. The derivative equals the exponential of constant Ro the process temperature and preheating time.
d   ( % B P F L ) d t P r e h e a t i n g = e R o T · t P r e h e a t i n g
where T is also the constant process temperature.
d ( % B P F L ) = e R o T · % B P F L · t P r e h e a t i n g d t p r e h e a t i n g
Taking the integral on both sides of the relation
  d ( % B P F L ) =   e R o T · t P r e h e a t i n g d t p r e h e a t i n g
( % B P F L ) + C 1 = 1 R o T ( e R o T · t P r e h e a t i n g ) + C 2
( % B P F L ) = 1 R o T ( e R o T · t P r e h e a t i n g ) + C 2 C 1
( % B P F L ) = 1 R o T ( e R o T · t P r e h e a t i n g ) + C 3
( % B P F L ) = 1 T · R o   ( e R o T · t P r e h e a t i n g ) + C 3
( % B P F L ) = 1 C 4   ( e R o T · t P r e h e a t i n g ) + C 3
where (C3) and can be written/replaced by another constant yo or intercept of this relation and slope 1/C4 = C5 = A.
( % B P F L ) = C 5   ( e R o T · t P r e h e a t i n g ) + C 3
% B F P L = y o + A × e [ R o   T p r o c e s s × t p r e h e a t i n g ]

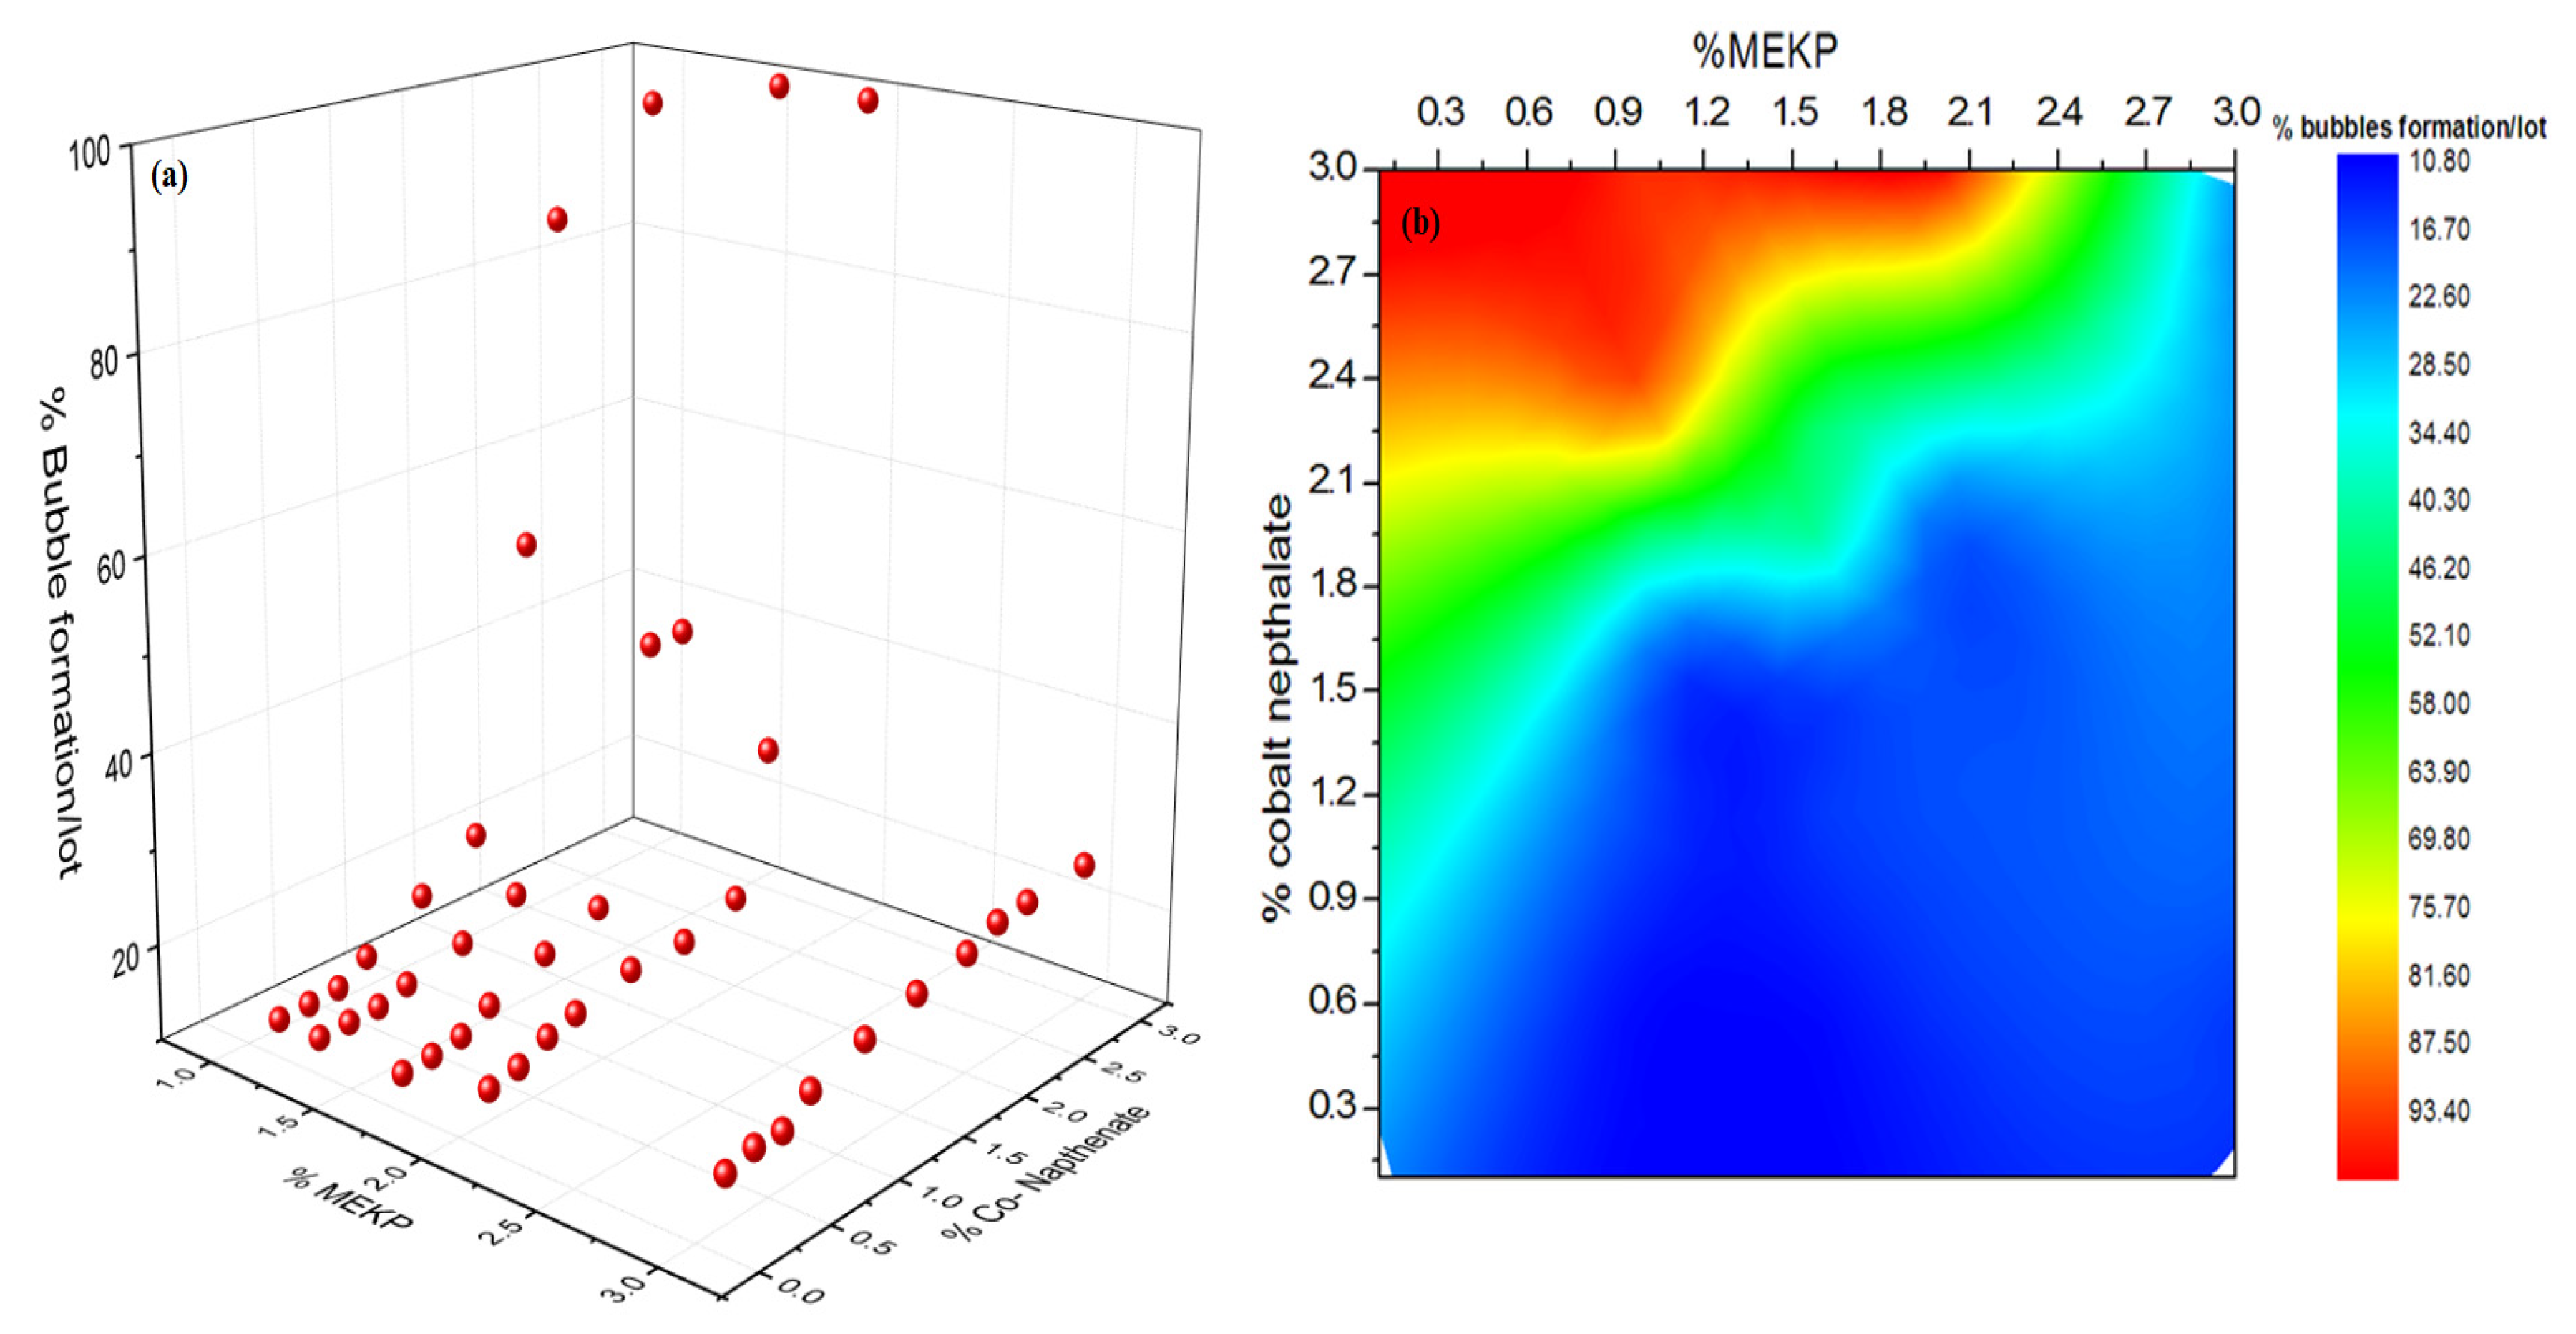
3.2. Effect of Initiator and Accelerator

In these trials, the best outcome obtained (based on particular input parameter/s and conditions) were unchamged (it was determined in the aforementioned experiments). Several quantities of hardener and accelerator are mixed with polyester for curing. The outcomes of these experiments reveal that with an increase in hardener and catalyst bubble formation, the percentage also increases per lot. The bubble percentage increases because the gel formation time duration reduces, which hinders more entrapped air form escaping from the environment [25]. The available literature also suggests that increasing the applied temperature, hardener and catalyst enhances the reaction rate due to an increase in the degree of cure. Hence, air lacks sufficient time to escape in the environment. Similarly, a reduction in the amount of hardener and accelerator reduces bubble formation. The experimental results exhibit that MEKP and the accelerator (cobalt naphthenate) are 1.2 and 0.3%, as seen in Figure 5a. Similarly, the contour analysis supported with ~90% significance level using Equation (22) suggests that the suitable amount of the initiator (50% MEKP) and accelerator (cobalt naphtenate) are ~1.2 and 0.3%, respectively, as shown in Figure 5b and Table 2.
Equation (22) can be derived by assuming the ratio between change in the %BPFL w.r.t. quantity of the MEKP and the cobalt naphtenate, which is assumed to be equal to K.
d   ( % B P F L ) d ( k 1 M E K P + k 2 C o ) = K
  d ( % B P F L ) = K · k 1     d ( M E K P + K · k 2     d ( C o ) )
where K.k1 and K.k2 are replaced by C1 and C2, respectively.
% B P F L = C 1 ( M E K P ) + C 2 ( C o ) + C o
Which can further be written as:
% B P F L = β 1 ( M E K P ) + β 2 ( C o N a p t h e n a t e ) + β o
% B F P L = β o + β 1 × ( % M E K P ) + β 2 × ( % C o N a p t h e n a t e )
Relatively reduced percentages and sizes of bubbles are observed on the abovementioned quantities of the MEKP and the cobalt naphthenate by experimental results and the statistical model.

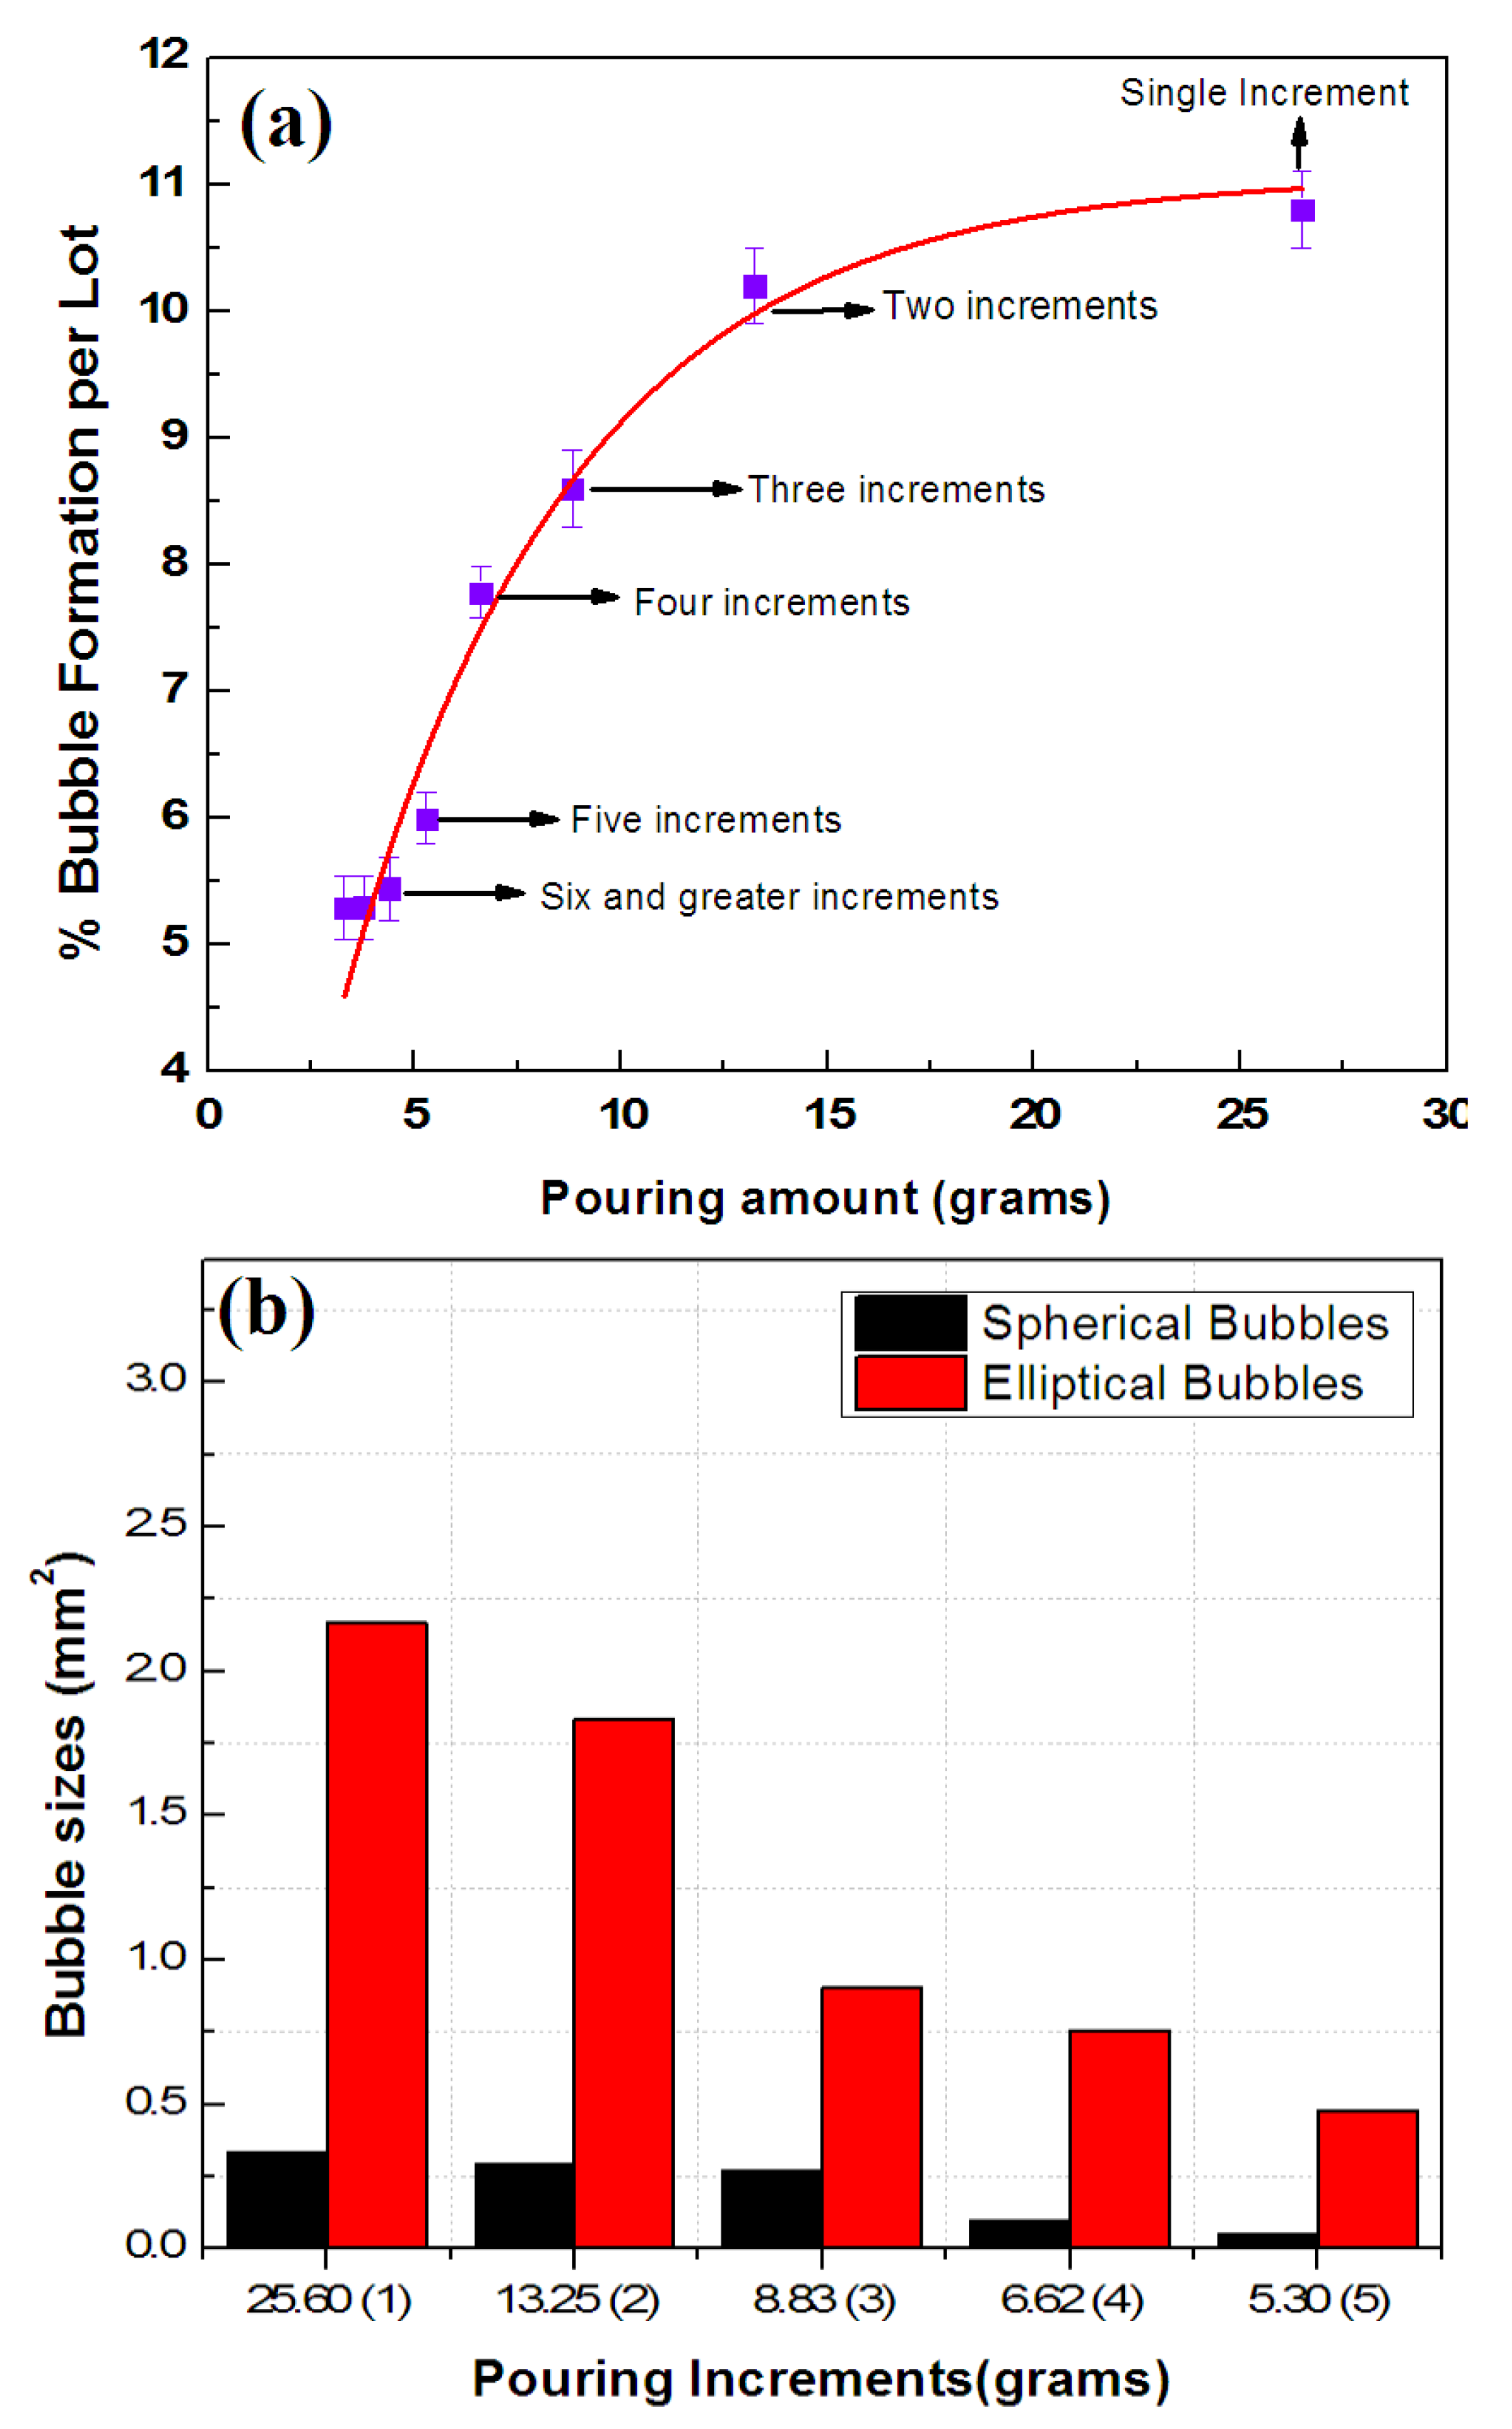
3.3. Incremental Pouring

Assuming a decrease in %BPFL w.r.t. to a pouring weight of resin can be related to the undermentioned relation:
d   ( % B P F L ) d W = ( % B P F L ) × C 1 C o
d   ( % B P F L ) % B P F L = d W × C 1 C o
  d ( % B P F L ) % B P F L = C 1 C o   d W
ln ( % B P F L ) + C 2 = [ C 1 C o W + C 3 C o ]
ln ( % B P F L ) + C 2 = [ C 1 W + C 3 C o ]
ln ( % B P F L ) + C 2 = C 1 C 3 [ C 3 W C 1 C o ]
Taking an exponential on both sides of the relation, we get:
% B P F L × ( e C 2 ) = e C 1 C 3 · e [ C 3 W C 1 C o ]
% B P F L + ( C 4 ) = e C 1 C 3 e C 2 · e [ C 3 W C 1 C o ] + C 4
% B P F L + C 4 = A · e [ C 3 W C 1 C o ] C 4
On left side of relation consider change in %BPFL negligible by putting C4 = 0 on left hand side. Additionally, considering C3 = 1, C4 = C5 + C6 (on righthand side).
% B P F L = A · e [ W C 1 C o ] + C 5 + C 6  
where C5 + C6 = yo or y-intercept, C1 = Wo, Co = Wcrit, accordingly.
% B P F L = A · e [ W W o W c r i t ] + y o
The polyester resin is mixed with the aforementioned percentages of the cobalt naphthenate and the MEKP. The approximate weight of the polyester solution, including the MEKP and cobalt naphthenate, is 26.05 ± 0.03 g. This quantity of polyester is added in a single step and incremental steps in each coil. Results depict that the coils formed in higher increments had a lower percentage of bubbles. The exponential decreasing behaviour of %BFPL can be ascribed to Equation (33), where y-intercept yo = 11.0 ± 0.6 and slope A = −5.76 ± 0.5 having the p-value ˂ 0.1 (refer to Table 3). The slope and intercept of Equation (33) represent %BFPL at one and five increments. Moreover, the fitting parameter (Wo) depicts the minimum pouring quantity of the polyester resin (4.79 ± 0.3 g), which substantially reduces the bubbles percentages. Similarly, Wcrit depicts the minimum quantity below which there is no considerable decrease in percentage bubble formation per lot. Phenomenologically, the percentage of bubbled coils declines exponentially with an increase in incremental amount. However, beyond five increments, no substantial improvement in bubble reduction is observed (see Figure 6a). Especially, spherical bubbles are mostly eliminated; however, some elliptical bubbles remain, which need to be further investigated (as depicted in Figure 6b).

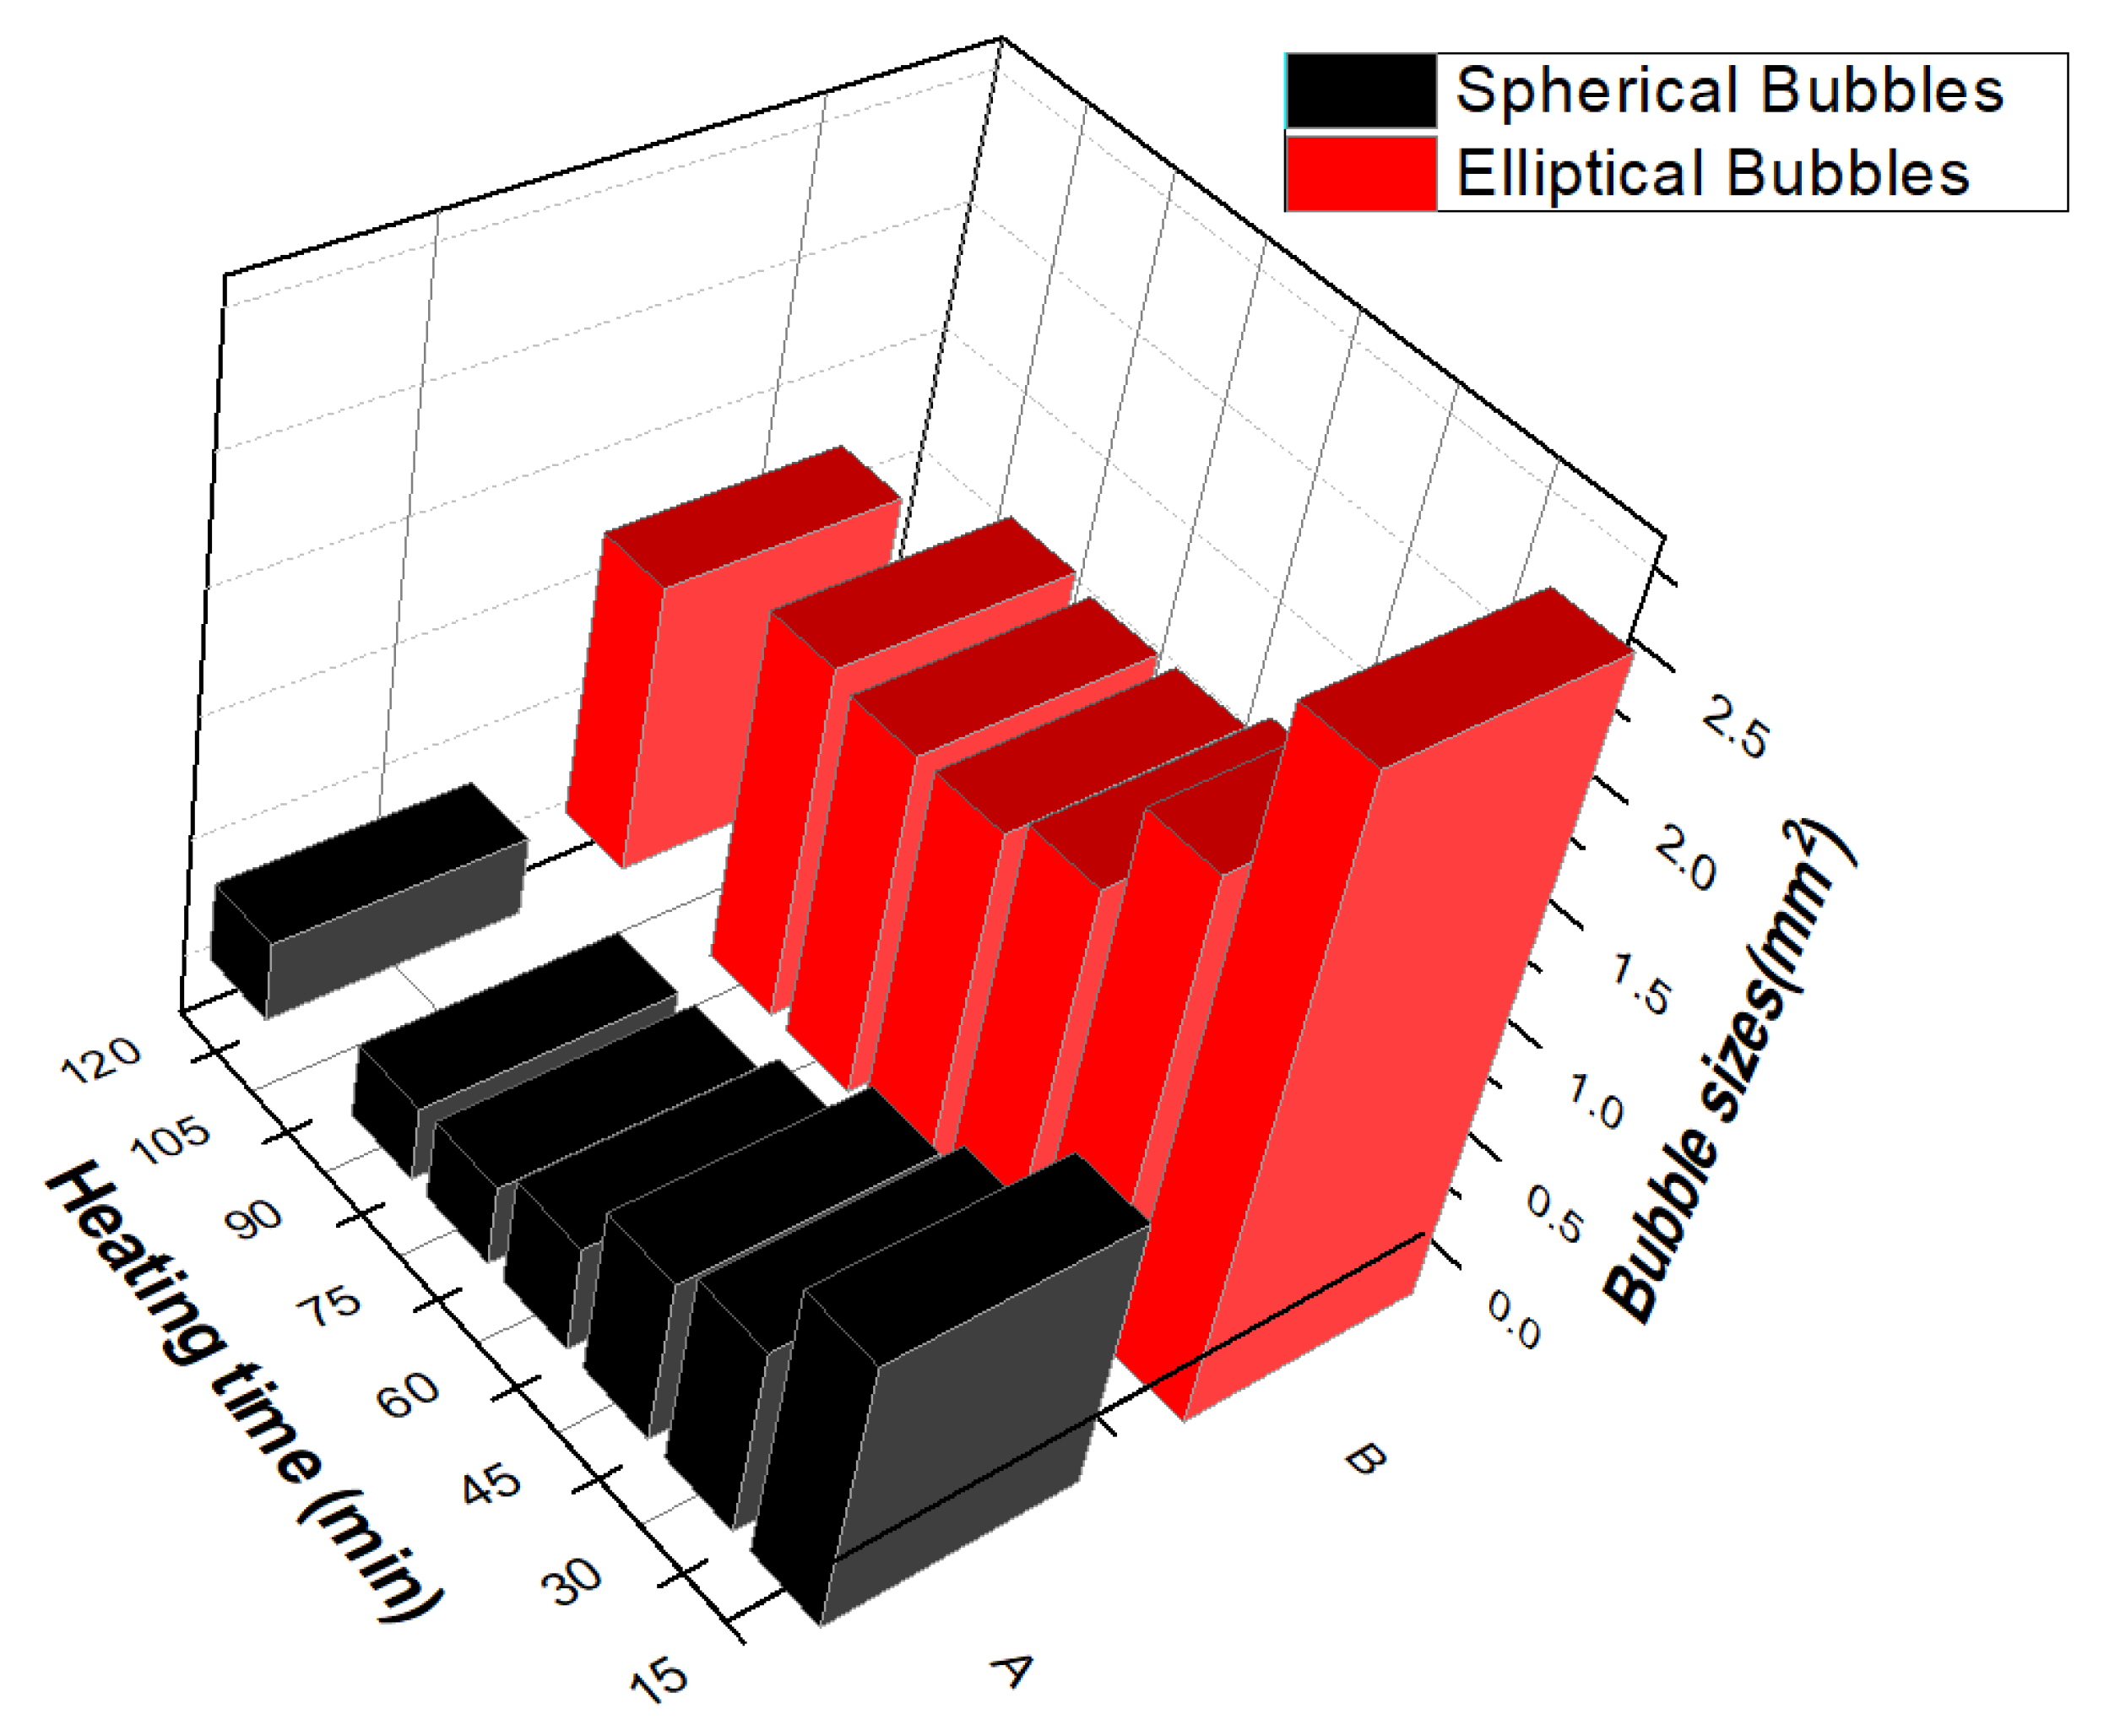
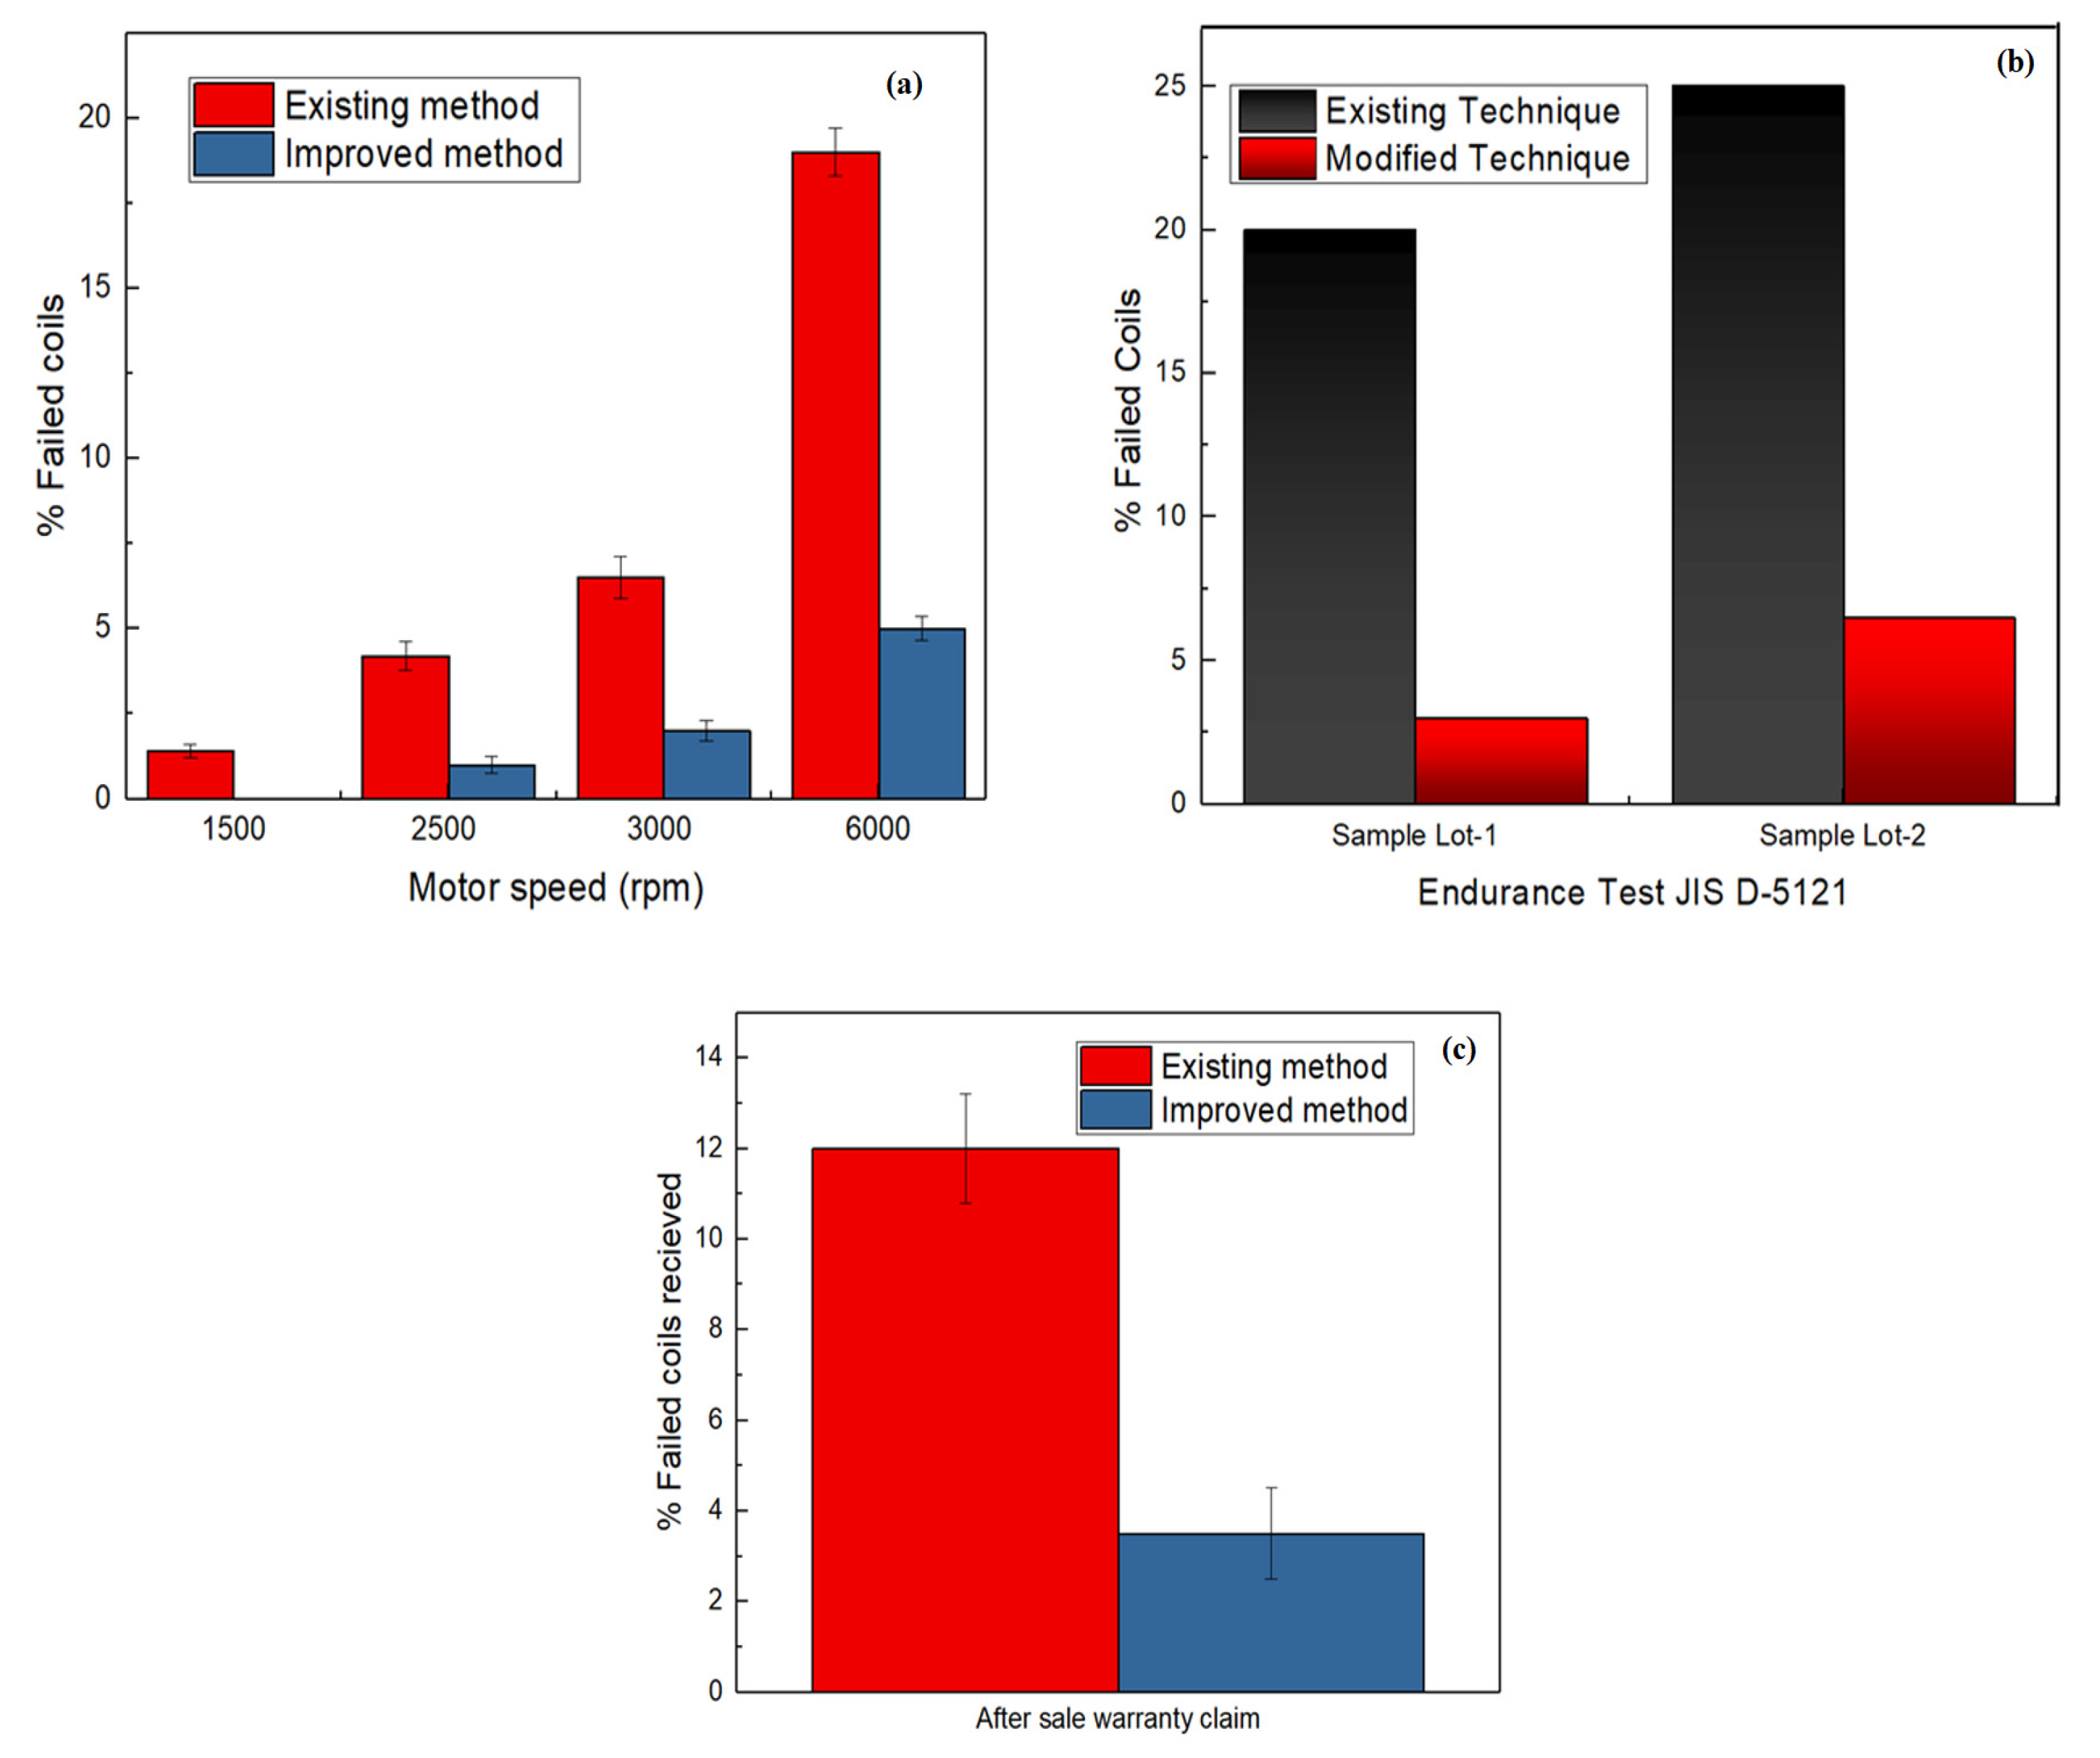
3.4. Dipping Electric Stirrer at Various Speeds

Keeping all the values of the abovementioned factors constant, an additional factor is added to the analysis. An electric stirrer is dipped inside the polyester-impregnated capsules and rotated at various angular speeds. The fallouts depict that initially with an increase in angular speed (from 20 to 30 rpm) of the stirrer, the bubble formation is reduced to ≤2% (shown in Figure 7). Figure 7 further depicts that after 30 rpm bubble formation, the percentage per lot increases again. The behaviour is depicted by a typical second-order polynomial relation (as evidenced by Equation (39) and Figure 7). Hence, the second-degree polynomial relation perfectly fits the obtained data results with 90% confidence interval (as shown in Table 4).
% B P F L = C o + C 1 ( w s p e e d ) + C 2 ( w s p e e d 2 )
% B P F L d ω = ( ω + C )
% B P F L = ( ω + C ) ·   d ω
  % B P F L =   ( ω · d ω +   C · d ω )
% B P F L = k 1 ω 2 2 + k 2 ω + k o
% B P F L = C o + C 1 ( w s p e e d ) + C 2 ( w s p e e d 2 )

3.5. Testing of Coils and Analysis of Results

Entire sample lots are subjected to performance tests. The outcome of the performance test depicts that at 1500 rpm, 2% of the manufactured coil from the existing procedure was rejected. However, no single coils were rejected at 1500 rpm that were manufactured from proposed technique. Similarly, coils produced from the conventional procedure were also run at 2500 and 6000 rpm, respectively, and it was observed that 6 and 19% of coils were rejected, respectively, due to improper or no discharge. Conversely, from the proposed manufacturing procedure at 2500 and 6000 rpm, less than 1 and 2.5% of the coils were rejected, respectively, as shown in Figure 8a. This result shows the significance of the proposed method.
A hundred coils were randomly selected from the consecutive two lots manufactured using both the methods (conventional and modified). In addition, all the sample coils were subjected to an endurance test, which was performed for 300 h continuously. The failure rates of coils manufactured from the conventional potting procedure were from 20% to 25%. However, after running for 300 h, only 2 and 4% of the coils of the modified method were not qualified during the analysis (as shown in Figure 8b). Upon a close investigation of the failed coil (from the modified method), it was found that they had small bubbles that may remain, possibly due to the improper dipping of the electric stirrer.
An after-sale claim analysis further validates and supports the improved procedure. Five consecutive lots prepared from both the method (conventional as well as modified) were mounted on motorbikes. Subsequently, all the motorbikes were sent to dealers to be sold. After selling most of the bikes, their warranty claim records were monitored. After the passage of two years of the sale of these bikes, it was found that less than 2% of the coils were received, which were manufactured from a modified procedure compared to 12% from a conventional procedure (clearly shown in Figure 8c). This further supports the idea that the modification in the potting method was necessary for the production of high-quality products.

4. Discussion

Three prominent reasons for bubble formation are the entrapment of gases/air during the filling of these resins in respective packing bottles. Moreover, during the mixing of polyester resin with accelerator and hardener, air present inside the mixing container may also become trapped. Similarly, air and moisture content present inside the molding cup may also become entrapped in the polyester solution [25]. The dominant heterogeneous nature of air and polymers results in higher proportions of undissolved gas to nucleate bubbles [26]. Preheating coils at 55 ± 5 °C possibly reduced bubble formation per lot due to the evaporation of moisture content. As aforesaid, the reason is also validated from the available literature, which supports the contribution of absorbed moisture in bubble formation [27,28]. Additionally, after pre-heating coils for 55–60 min, a significant amount of moisture evaporates; therefore, further, pre-heating does not noticeably contribute towards bubble percentage reduction.
Increasing the bubble dimensions enhances the possibilities of failure in coils. Therefore, the chances of unnecessary discharges (including partial discharges and corona) increase. The findings of Adhikari et al. [29] also validate the abovementioned fact and lead one to further conclude that the probability of partial discharges occurrence increases in polymer-based insulations with the rise in bubble sizes. However, partial discharges occur more severely in cylindrical-shaped bubbles than in circular bubbles. Similarly, bigger bubbles and higher relative humidity provide suitable conditions for partial discharges and corona [24,30].
The bubble percentage increases because the gel formation duration decreases, which hinders more entrapped air from escaping into the environment [31]. The available literature also suggests that increasing the applied temperature, hardener, and catalyst enhances the reaction rate due to an increase in the degree of cure [32,33]. Hence, air lacks sufficient time to escape into the environment. Similarly, a reduction in the amount of hardener and accelerator reduces bubble formation. The previous literature suggests that the quantity of MEKP is ~2% by weight [34,35]. However, the previously determined amounts of the aforesaid chemicals (MEKP and cobalt naphthenate) result in a relatively higher percentage of bubbles (see Figure 5a,b). Furthermore, the quantities of MEKP and cobalt naphthenate stated in the earlier literature are not suitable for 25.6 ± 0.02 g of general-purpose UPR used in the manufacturing of ignition coil insulation. Additionally, relatively higher pouring increments also facilitated the air evacuation and provided appropriate opportunities to easily escape from the environment. The addition of the higher proportions of MEKP and cobalt naphthenate in the polyester resin enhances the radical formation, which ultimately combines other radicalised species or polyester resin chains to complete unpaired electrons and terminates the reaction. As a consequence, some monomers of the polyester resin remain unattached to the polymer chain, resulting in premature curing (see Figure 5a,b). The role of radicals in terminating the reaction is also mentioned in the literature for radical polymerization [36]; this may contribute to a higher proportion of bubbles and voids. Pouring in five increments seems to be the most suitable option for this process. An additional increase in pouring increments had no substantial effect on %BFPL.
An increase in the percentage of bubbled coils can be ascribed towards the release of dissolved air inside the resin at relatively higher angular speeds. In addition, the removal of elliptical bubbles is difficult because they are concealed inside bobbin-designed spaces. Therefore, the confiscation of elliptical bubbles occurred due to the application of centrifugal forces, which are produced due to the electric stirrer angular motion. Consequently, the centrifugal force pushes the bubbles away from designed spaces in the bobbin. Bubbles move away from the bobbin and towards the capsule’s internal surface. Finally, heat gained via the polyester resin by LEDs forces entrapped air to evacuate the liquid polyester resin. The IS-14380 results were also in agreement with the results of Islam et al., at 1500, 2500, and 3000 rpm, accordingly [37]. Islam et al. used 0.05% or 1.28 kg per lot of chopped fiber glass in polyester, which is an uneconomical method [37]. However, our study reported a significant improvement without the addition of any costly procedure or material addition.

5. Conclusions

The potting process was studied and modified based on obtained results. The following conclusions can be systematically drawn, which are under-mentioned:
  • In the existing potting technique, 210–250 bubbled coils per lot are produced. These manufactured coils are wasted or usually received in market claims bearing considerable financial losses. Therefore, the aforesaid technique is improved by pre- and process heating of the coil for ~55–60 min for 50 ± 5 °C before and after pouring UPR, which reduces bubbled coils 1.31 times. Moreover, the UPR heated at 50 ± 5 °C is mixed with the accelerator/initiator (at 0.3 and 1.2%); poured in five increments; and further reduced to 1.89 and 3.36 folds, respectively.
  • Dipping the electric stirrer inside the capsule forces elliptical bubbles towards the capsule’s inner-surface. Hence, most of the air escapes from the environment. Furthermore, lots manufactured using this modified technique were almost minimised 25.6 folds.
  • IS-13480 and JIS-D5121 quality tests validate that non-qualified or failed specimens decreased by applying the OFAT approach stepwise. Additionally, after-sales claim tests also validate the effectiveness of the improved technique in producing high-quality coils.
  • Based on the abovementioned results, suitable combinations of pre-treatment temperature, initiator/catalyst amount, pouring amount, and stirring speeds are extracted to alter the process and achieve minimum bubbled coils. This modification may reduce the waste material to approximately ~85%, which is received as a market claim within two years.
  • The surface treatment of polymeric materials, i.e., laser and plasma, can be performed in future studies to tailor the dielectric strength and constant for high-voltage and other applications. Similarly, functionalised and non-functionalised micro fillers can also be investigated in making ignition coils and in the measurement of their properties.

Author Contributions

Conceptualization, A.N. and B.I.; Investigation, A.N. and B.I.; Methodology, A.N., I.A., W.A. and B.I.; Validation, I.A., W.A. and B.I. Writing—original draft, A.N., I.A., W.A., B.I., D.Y.P., K.G. and M.A.; Writing—review and editing, D.Y.P., K.G. and M.A. All authors have read and agreed to the published version of the manuscript.

Funding

This research received no external funding.

Institutional Review Board Statement

Not applicable.

Informed Consent Statement

Not applicable.

Data Availability Statement

Data can be provided on reasonable request.

Acknowledgments

Authors acknowledge the support of the Pecs industry (pvt) Ltd., which is a Vendor Company of major cars, bikes, tractors, trucks, and rickshaws. All the lots were manufactured in the Pecs coil manufacturing facility. Therefore, we are grateful to Abid Iqbal and Tehman Shaukat.

Conflicts of Interest

The authors declare no conflict of interest.

References

  1. Rohwein, G.; Camilli, L.S. Automotive Ignition Transfer Efficiency; Technical Paper for SAE: Warrendale, PA, USA, 2002. [Google Scholar]
  2. Yu, X.; Yu, S.; Yang, Z.; Tan, Q.; Ives, M.; Li, L.; Liu, M.; Zheng, M. Improvement on energy efficiency of the spark ignition system. In Proceedings of the ECX 17: SAE World Congress Experience, Detroit, MI, USA, 4 April 2017. [Google Scholar]
  3. Schwaner, J. The Magneto Ignition System, 1st ed.; Sacramento Sky Ranch Publisher: Sacramento, CA, USA, 1992. [Google Scholar]
  4. Ogata, K.; Kataoka, T. A high energy ignition system for EGR combustion engine. Trans. Automot. Soc. Jpn. 2016, 47, 357–362. [Google Scholar]
  5. Ruan, G.; Kienzle, D.; Roth, D.; Becker, M. Dual coil ignition for gasoline EGR engines. MTZ Worldwide 2014, 74, 18–21. [Google Scholar] [CrossRef]
  6. GmbH, R.B. Bosch Automotive Electrics and Automotive Electronics Systems and Components, Networking and Hybrid Drive, 1st ed.; Springer: Wiesbaden, Germany, 2014. [Google Scholar]
  7. Reif, K. System and components. In Gasoline Engine Management, 1st ed.; Springer: Berlin/Heidelberg, Germany, 2015. [Google Scholar]
  8. Chen, C.M.; Sun, C.H.; Chang, H.L. Environmental impact analysis of an automotive ignition coil in a supply chain. Carbon Manag. 2020, 11, 69–80. [Google Scholar] [CrossRef]
  9. Sanchez, R.O. A method for encapsulating high voltage power transformers. In Proceedings of the 11th Capacitor and Resistor Technology Symposium (CARTS), Las Vegas, NV, USA, 4–7 March 1991; pp. 42–47. [Google Scholar]
  10. Berk, C.L.; Phillip, J.D.; Hageman, D.E. System and Method for Minimizing Cure Induced Residual Stresses in an Epoxy Impregnated Coil. U.S. Patent 0197297A1, 23 October 2003. [Google Scholar]
  11. Nawaz, A. Study of the Problem of Void Formation in Electrical Lamination Parts and Its Removal. Master’s Thesis, University of Engineering & Technology, Peshawar, Pakistan, 2013. [Google Scholar]
  12. Kim, H.K.; Shi, F.G. Thickness dependent dielectric strength of a low-permittivity dielectric film. IEEE Trans. Dielectr. Electr. Insul. 2001, 8, 248–252. [Google Scholar] [CrossRef]
  13. Li, W.; Ren, X.; Ruan, L.; Zhu, S. Simulation of the effect of bubble defect on the distribution of electric field in epoxy resin pouring type insulated tubular bus-bar. In Proceedings of the 20th International Conference on Electrical Machines and Systems (ICEMS), Sydney, Australia, 11–14 August 2017; pp. 1–5. [Google Scholar]
  14. Cao, Y.; Irwin, P.C.; Younsi, K. The future of nanodielectrics in the electrical power industry. IEEE Trans. Dielectr. Electr. Insul. 2004, 11, 797–807. [Google Scholar]
  15. Cao, Y.; Irwin, P.C. The electrical conduction in polyimide nanocomposites. In Proceedings of the Conference on Electrical Insulation and Dielectric Phenomena (CEIDP), Albuquerque, NW, USA, 19–22 October 2003; pp. 116–119. [Google Scholar]
  16. Tan, D.Q. The search for enhanced dielectric strength of polymer-based dielectrics: A focused review on polymer nanocomposites. J. Appl. Polym. Sci. 2020, 137, 49379. [Google Scholar] [CrossRef]
  17. Sharma, C.P.; Vadera, K.L.; Agarwal, R.P. Impregnation of electrical machines with solvent less resins. Pigment Resin Technol. 1993, 22, 10–11. [Google Scholar] [CrossRef]
  18. Nawaz, A.; Islam, B.; Khattak, M.S.; Ali, L.; Saleem, U.; Ullah, A.; Ijaz, M.Z.; Mao, W.G. Polyester Usage in Manufacturing of Electrical and Mechanical Products and Assemblies. In Polyester-Production, Characterization and Innovative Applications; Camlibel, N.O., Ed.; Intech Publishers: London, UK, 2018; Volume 1, pp. 41–54. [Google Scholar]
  19. Dodiuk, H.; Goodman, S. Handbook of Thermoset Plastics, 3rd ed.; Elsevier: San Diego, CA, USA, 2014. [Google Scholar]
  20. Kosar, V.; Gomzi, Z. In-depth analysis of the mathematical model of polyester thermosets curing. Eur. Polym. J. 2004, 40, 2793–2802. [Google Scholar] [CrossRef]
  21. Fontalba, F. Method for Producing Individual Coil Thus Obtained. Patent No. US2007/0006858A1, 11 January 2007. [Google Scholar]
  22. IS 14380; Automotive Vehicles—Ignition Coils for Magneto Ignition Systems. Bureau of Indian Standards: New Delhi, India, 1996. Available online: https://archive.org/details/gov.in.is.14380.1996 (accessed on 1 December 2021).
  23. Judge, A.W. Modern Electrical Equipment for Automobile, 2nd ed.; Hall and Chapman: London, UK, 1970. [Google Scholar]
  24. Nawaz, A.; Islam, B.; Akhtar, R.; Alamgir, K.; Noor, S. Failure of polyester laminated automotive ignition coils influenced by environmental factors. Arab. J. Sci. Eng. 2015, 40, 3337–3344. [Google Scholar] [CrossRef]
  25. Islam, B. Study of Parameters Reducing Curing Time for Hot Plate Glass Capsule Impregnation Technique. Master’s Thesis, University of Engineering & Technology, Peshawar, Pakistan, 2016. [Google Scholar]
  26. Kurematsu, K.; Koshi, M. Kinetic Studies on void formation during liquid epoxy resin impregnation through polyester non-woven fabric. Colloid Polym. Sci. 1995, 263, 454–461. [Google Scholar] [CrossRef]
  27. Mujumdar, A.S.; Mashelkar, R.A. Advances in Transport Processes, 1st ed.; Elsevier: Amsterdam, The Netherlands, 1993. [Google Scholar]
  28. Tong, H.M.; Ouano, A.C. Bubble formation mechanism during heat treatment of polymer films cast from solutions. Polym. Eng. Sci. 1985, 25, 75–82. [Google Scholar] [CrossRef]
  29. Adhhikari, D.; Hepburn, D.M.; Stewart, B.G. Characterization of PD occurring in injected air bubbles in block polymeric insulation. In Proceedings of the Electrical Insulation and Dielectric Phenomena (CEIDP) Conference, Montreal, QC, Canada, 14–17 October 2012; pp. 48–51. [Google Scholar]
  30. Yahaya, E.A.; Jacob, T.; Nwohu, M.; Abubakar, A. Power loss due to Corona on high voltage transmission lines. IOSR J. Electr. Electron. Eng. 2013, 8, 14–19. [Google Scholar] [CrossRef]
  31. Waigaonkar, S.; Babu, B.C.; Rajput, A. Curing studies of un-saturated polyester resin used in FRP products. Indian J. Eng. Mater. Sci. 2011, 18, 31–39. [Google Scholar]
  32. Jankovic, B. The Kinetic analysis of isothermal curing reaction of an unsaturated polyester resin: Estimation of density distribution function of the apparent activation energy. Chem. Eng. J. 2010, 162, 331–340. [Google Scholar] [CrossRef]
  33. Groβ, H.; Kollek, H.; Brockmann, H. The nucleophilicity as the determining parameter in the curing of epoxy resins. Int. J. Adhes. Adhes. 1988, 8, 225–235. [Google Scholar]
  34. Satapathi, A.; Patnaik, A. Analysis of dry sliding wear behavior of red mud filled polyester composites using the Taguchi method. J. Reinf. Plast. Compos. 2010, 29, 2883–2897. [Google Scholar] [CrossRef]
  35. Prabu, V.A.; Manikandan, V.; Uthayakumar, M.; Kalirasu, S. Investigations on the mechanical properties of red mud filled sisal and banana fiber reinforced polyester composites. Mater. Phys. Mech. 2012, 15, 173–179. [Google Scholar]
  36. Matyjaszewski, K.; Moller, M. Polymer Science: A Comprehensive Reference, 1st ed.; Elsevier: Amsterdam, The Netherlands, 2012; Volume 4, pp. 779–831. [Google Scholar]
  37. Islam, S.; Arbab, M.N.; Nawaz, A.; Islam, B.; Bibi, S.; Hussain, I. Appropriate polymer selection for insulation of high voltage ignition coils by combination of material index determination and novel heuristical approach. Trans. Indian Inst. Met. 2021, 74, 1387–1396. [Google Scholar] [CrossRef]
Figure 1. The bubble and cracks inside the insulation of the ignition coil.
Designs 06 00044 g001
Figure 2. The curing scheme of the polyester resin with the help of the initiator and accelerator [18,20].
Designs 06 00044 g002
Figure 3. (a) The LEDs installed on the potting fixture for pre and process heating. (b) The increase in temperature of polyester resin after pouring in the capsule. (c) The effect of the combination factor of pre-heating time and process temperature on the percentage of bubble formation in ignition coil per lot. (d) The first derivative to extract the optimum value of the pre-heating time and process temperature at %BFPL.
Designs 06 00044 g003
Figure 4. The average size of spherical and elliptical bubbles at numerous preheating temperatures by keeping the process temperature constant.
Designs 06 00044 g004
Figure 5. (a) The experimental data on various concentrations of accelerator and initiator (by weight %) on %BFPL. (b) The theoretical estimated values of the accelerator and initiator on the %BFPL ignition coil exhibited by the contour plot using Equation (22).
Designs 06 00044 g005
Figure 6. (a) The effect of incremental pouring on the percentage of bubble formation in the ignition coil lot. (b) The effect of incremental pouring on the bubble sizes of elliptical and spherical bubbles.
Designs 06 00044 g006
Figure 7. The effect of angular speed of the electric stirrer, dipped inside the capsule, on the percentage of bubble formation per lot.
Designs 06 00044 g007
Figure 8. (a) The failed coils’ average percentage during the performance test of the existing and modified manufacturing technique at 1500, 2500, and 6000 rpm. (The spark gap at 1500 rpm is 5 mm, while at 2500 and 6000 it is 8.5 mm as per IS-14380). (b) The failed coils mean the percentage during the endurance test of the existing and modified manufacturing technique at 3000 rpm. (The spark gap at 3000 rpm is 12.5 mm, as per JIS D-5121 standard). (c) A depiction of the average percentage of an after-sale warranty claim received for the existing and modified technique.
Designs 06 00044 g008
Table 1. An ANOVA analysis of the multiplication factor of the process temperature and the preheating temperature against the % bubble formation per lot—Part 1.
VariablesDOFSum of SquaresMean SquareFValue ˃ F0.1,v1,v2p-Value
Regression32008.71669.571914.61 ˃ 3.07˂0.1
Residual72.4480.34972
Uncorrected Total102011.16
Corrected Total918.6066
Table 2. An ANOVA analysis of the multiplication factor of the process temperature and the preheating temperature against the % bubble formation per lot—Part 2.
PredictorCoefficient
(β)
Standard Error
(SE)
t = β/SEp-Value
Correction factor (βo)11.5767.001.650.098
MEKP wt%−6.963.299−2.110.041
Cobalt naphthenate wt%20.252.7417.460.001
Table 3. An ANOVA analysis of pouring quantity against % bubble formation per lot.
VariablesDOFSum of SquaresMean SquareFValue ˃ F0.1,v1,v2p-Value
Regression47041.1481760.287385.484 ˃ 4.11˂0.1
Residual418.265734.56643
Uncorrected Total87059.413
Corrected Total7473.4712
Table 4. An ANOVA analysis of the second-degree polynomial relation with the stirring speed.
VariablesDOFSum of SquaresMean SquareFValue ˃ F0.1,v1,v2p-Value
Regression31170.99016390.33005186.24 ˃ 4.19˂0.1
Residual48.383182.09579
Uncorrected Total71179.37333
Corrected Total6635.32739
Publisher’s Note: MDPI stays neutral with regard to jurisdictional claims in published maps and institutional affiliations.

