Article

Load Frequency Control Based on the Bees Algorithm for the Great Britain Power System

1
Wolfson Centre for Magnetics, School of Engineering, Cardiff University, Cardiff CF24 3AA, UK
2
High Value Manufacturing Group, School of Engineering, Cardiff University, Cardiff CF24 3AA, UK
*
Author to whom correspondence should be addressed.
Designs 2021, 5(3), 50; https://doi.org/10.3390/designs5030050
Submission received: 14 June 2021 / Revised: 21 July 2021 / Accepted: 26 July 2021 / Published: 2 August 2021
(This article belongs to the Section Electrical Engineering Design)

Abstract

:
This paper focuses on using the Bees Algorithm (BA) to tune the parameters of the proposed Fuzzy Proportional–Integral–Derivative with Filtered derivative (Fuzzy PIDF), Fractional Order PID (FOPID) controller and classical PID controller developed to stabilize and balance the frequency in the Great Britain (GB) power system at rated value. These controllers are proposed to meet the requirements of the GB Security and Quality of Supply Standard (GB-SQSS), which requires frequency to be brought back to its nominal value after a disturbance within a specified time. This work is extended to employ the proposed fuzzy structure controller in a dual-area interconnected power system. In comparison with controllers tuned by Particle Swarm Optimization (PSO) and Teaching Learning-Based Optimization (TLBO) used for the same systems, simulation results show that the Fuzzy PIDF tuned by BA is able to significantly reduce the deviation in the frequency and tie-line power when a sudden disturbance is applied. Furthermore, the applied controllers tuned by BA including the Fuzzy PIDF prove their high robustness against a wide range of system parametric uncertainties and different load disturbances.

1. Introduction

A secure supply of power energy is the main concern in power system operation, i.e., reliable electricity with appropriate quality is supplied to the customers at all times. Thus, it is essential that energy production is continuously balanced with demand: this guarantees that the system’s frequency is maintained within strict limits and centered at nominal value, through load frequency control (LFC) [1]. In the Great Britain power system, over 30% of the energy produced is based on a renewable energy source (RES), such as wind turbine generators (WTG) [2]. Over the last half-decade, capacity from the RES has increased by a factor of three, with a corresponding 33% drop in the contribution of fossil fuel, with power stations being closed due to a loss of economic viability or completion of their lifespan. RES is set to remain strategically significant to GB’s power system, with predictions that it will contribute around 50% of energy production by 2025. The rationale for this growth is to achieve reductions in carbon emitted [3]. The increased use of energy from RESs decreases the system inertia in power systems, and this reduced inertia presents challenges for keeping frequency within a permissible limit. The reduced inertia can also cause major increases in the absolute value of the rate of change of frequency (RoCoF), with the risk that the system may be destabilized when subjected to suddenly occurring disturbances—for example, rising or dropping production or demand. This leads to the need for fast frequency response technologies that can address the challenges that lower inertia presents [4]. While providing a fast and stable response is required by the control system to the high RoCoF, it should be considered that system oscillation can result from very fast responses. In order to control the frequency in power systems, various control loops are involved: primary, secondary, tertiary and emergency in specified conditions. In the GB power system, the primary loop, which is also recognized as dynamic power generation, reaches the maximum in ten seconds, where the secondary control takes thirty seconds to reach its maximum operative capacity. Frequency response services are classified into dynamic services, which respond automatically to any frequency alternation, and non-dynamic, which are triggered via load frequency relays. When the generation power and the demand is significantly imbalanced, the system will experience major frequency deviations; frequency fluctuation is required by GB-SQSS to remain within an acceptable range, as demonstrated in Table 1 [5]. Figure 1 shows the actable frequency deviations in the normal operating conditions and when a generation loss of up to 1800MW (representing a substantial nuclear generator) or less suddenly occurs [1,6].
Recently, a number of strategic approaches have been suggested for LFC in power systems: this is to keep the frequency and tie-line power flow of the system within a permissible range even when the system experiences sudden perturbation. The GB power system in particular has received considerable attention in tackling the problem of frequency deviation, particularly with the increase in RES penetration and its impact on the total system inertia [7,8,9,10].
For LFC, recent studies have applied decentralized PID controllers based on different optimization techniques. Genetic algorithm (GA) is used to tune the PID controller as applied in interconnected power networks [11]. Meanwhile, [12] assesses Particle Swart Optimization (PSO) for PID applied for LFC. Work in [13] shows that the Teaching Learning-Based Optimization (TLBO) algorithm could be used to tune I and PID controllers applied to a single- and multi-area multi-source with or without an HVDC link. This algorithm performed more optimally than the Differential Evolution algorithm (DE)-based PID controller. A Fractional Order Proportional Integral (FOPID or PIλDμ) controller provides an extra two supplementary degrees of flexibility in comparison to the traditional PID controller, in addition to the main three parameters [14]. Researchers in [15] examined the potential capabilities of this controller for LFC in a two-area hydro-thermal power system. Additionally, the Big Bang Big Crunch algorithm was applied in [16] to optimally find the gains of an FOPID controller’s parameters applied for a deregulated multi-area automatic generation control (AGC) scheme.
Researchers have also widely investigated fuzzy logic controllers to control the frequency in power systems. Researchers in [17] designed and implemented a fuzzy controller as a part of an AGC system for the National Control Centre of Eskom. In [18], the Imperialist Competitive Algorithm was applied in optimizing a fuzzy proportional–integral controller’s output scaling factor, using the criterion of the Integral of Squared Error (ISE) to enhance the performance of LFC in a dual-area power system. Fuzzy fractional PIλD with filtered derivative mode is investigated in [19], and the Cuckoo optimization algorithm is used to find the optimal values of the gains of the suggested controller. The authors of [20] proposed a novel approach to enhance the frequency performance of a hybrid dual-area power system via coordination between an optimized fuzzy fine-tuning scheme and Gate-Controlled Series Capacitors (GCSC). In [21], a design involving a robust fuzzy logic-based fine-tuning approach used to tune the parameters of the classical proportional–integral controller is proposed for LFC in a multi-area power system. Further, a two-stage robust-intelligent controller design is proposed for LFC in a single-area power system: this design is based on the Kharitonov theorem and fuzzy logic to enhance the performance of a PI controller [22].
The research works discussed above aimed to determine optimized controllers’ parameter values for speeding up power provision as well as reducing frequency deviations to enhance the stability of power systems. A state-of-the-art review of the recent techniques based on different theories proposed for LFC in power systems is provided in [23].
Accordingly, as demonstrated in the literature, in recent years, there has been considerable progress in intelligent algorithm-based controllers attempting to better control LFC systems, which have solved the problem to a great extent. However, to the best of the authors’ knowledge, no attempt has been made to utilize the BA in designing the secondary frequency control of a power system. Since this algorithm has demonstrated a high level of superiority and effectiveness as an optimization tool in many different fields [24,25,26,27], this promising achievement motivated the authors to make use of this very powerful optimization technique to determine the optimum parameters’ gains of the PID, FOPID and Fuzzy PIDF for LFC in power systems. The main investigations of the present work are:
  • To propose a metaheuristic algorithm, the Bees Algorithm (BA), inspired by the natural behavior of honeybees, for the LFC of the GB power system.
  • To optimize PID and FPID controllers’ gains and study their dynamic performance for the GB power system.
  • To design and optimize the fuzzy logic controller (FLC) scale factor gains and study its dynamic performance for GB power system.
  • To compare the dynamic performance of BA-based PID, FPID and FLC controllers with those of PSO and TLBO-tuned different controllers for the same system.
  • To investigate the effects of parametric uncertainties of the system with different load disturbances when the proposed controllers are implemented for LFC.
  • This study is then extended to examine the validation of the proposed Fuzzy PIDF in a two-area interconnected power system; the robustness analysis of Fuzzy PIDF against parametric uncertainties in this system is also validated.
It may be worth mentioning that the reason behind choosing PSO and TLBO for comparison with BA is due to their wide use in the area of LFC and their superior performance as a tool of optimization. Therefore, if the proposed algorithm provides a frequency response similar to or better than these two algorithms, this will be another successful use of BA in engineering applications.
The Artificial Bee Colony (ABC) optimization algorithm has also different applications for LFC [28,29]. Despite some similarities in the mechanism of the proposed Bees Algorithm (BA) and the ABC algorithm, the proposed BA has outperformed the ABC algorithm as an optimization tool [30]. However, a new study to further investigate the differences and the superiority between these algorithms for LFC applications may be considered for future work in the authors’ research.

2. The Simplified GB Power System Model

A simplified model of the GB power system shown in Figure 2 was developed using MATLAB Simulink; this model is utilized to analyze the power system frequency and then design an appropriate controller. The characteristics of the generators employed in the system are considered in this simplified model, as well as damping from the loads depending on frequency. Within this, synchronous coal-powered, gas-powered, hydro-power and nuclear plants are responsive to any decline in frequency and increase their generated output power correspondingly. In the model, such synchronous generators are represented by first-order transfer function blocks used to model the governor and the turbine. The governor droop gain R represents the turbine velocity control; this gain is the combined value of all droops of generator speed governors in the system. Tg is the typical time constant of the governor. Stable performance of the speed control is guaranteed by introducing transient droop compensation represented as lead-lag between the governor and turbine. The output mechanical power following the response of the governor which defines the turbine model is characterized in this simulation by the time constant Tt. The system inertia in this simplified model is represented by the time constant Heq, which was considered to represent the current scenario of the GB power system with the high penetration of RERs. The damping obtained from frequency-dependent loads is represented by an equivalent gain value D. The effect of an electrical vehicle (EV) was also considered in this design, which was modeled as an aggregated value represented by a feedback gain in the primary loop, with an estimated aggregated load equal to 2.16 GW. The value of this load was considered to be =1.35 pu (EV load × f/(Network base)), where the network base value is equal to 79.2 GW [2]; the effect of EV gain on the primary loop response is provided in Appendix A. The secondary control applied in this model is the main study of this paper, which will be examined via different controllers tuned by proposed algorithms including the Bees Algorithm, which represents the main contribution of this work. The parameters applied in this simplified model are tabulated in Table 2 [2,6,31]. It should be noted that the model used in this study to examine the frequency response of the GB power system is simplified; accordingly, the small effect of nonlinearities such as governor dead band (GDB) and generation rate constrain (GRC) is neglected.

3. Control Strategies and Objective Functions

3.1. Classical Controllers

PID controllers are the most widely applied feedback controller for the process sector. Easy to understand and offering robustness, strong performance in spite of the differing and dynamic properties of the process plant and the low cost are the main merits of this controller. The PID controller essentially includes proportional, integral and derivative modes. While a proportional controller decreases the rise time, it cannot completely remove the steady-state error. Integral controls, on the other hand, eliminate steady-state error, yet they can worsen transient responses. Derivative controls improve the system stability, decrease the overshoot/undershoot and enhance transient responses. Current industrial applications most frequently rely upon the proportional–integral (PI) controller. Controls without derivative action are applied in the following circumstances: when it is not important for the system to respond rapidly; when significant noise and disturbance are experienced during the system operation. The overall stability of the system can be improved by adding the derivative mode as it enables an increase in the proportional gain and decrease in the integral, thus increasing the speed response of the controller. Accordingly, PID controllers are frequently applied in systems that require stability with a fast response. Considering these points, this study investigates the effectiveness of a PID controller for the LFC of the GB power system. Equation (1) illustrates the transfer function of this controller, where Kp is the proportional gain, KI the integral gain, and KD is the derivative gain.
TF PID   = K P + K I S + K D S
Generally, for LFC, conventional methods of control remain the main approach, but in more complex systems, such approaches can become inadequate. A recently introduced control approach used for LFC tasks is known as non-integer control, developed on the basis of fractional calculus, which is generalized from integer order calculus. Fractional calculus is a generalization of differentiation/integration to a non-integer order, and thus provides n degrees of additional freedom when designing controllers, which can make them more efficient, flexible and robust [14]. The FOPID controller’s transfer function is shown in Equation (2), where λ is the order of integration, and μ is the order of the differentiator.
TF FOPID = K P + K I S λ + K D S μ
As highlighted in the literature, fractional-order control (FOC) has emerged to address the problem of LFC. However, this is the first attempt to tune the parameters of this controller using the Bees Algorithm.

3.2. Fuzzy PID Logic Control

There has been a broad implementation of fuzzy PID controllers in different structures to solve the LFC problem and a significant enhancement in performance has been achieved, as reported in the literature. It is also proven that in order to gain further enhancement in the overall system performance and improve the stability, a simple filter for the derivative mode of the fuzzy PID controller can be applied [32,33]. Moreover, the performance of these controllers mainly relies on the selection of the scaling factor gains of the input and output of the controller, but it is difficult to find the optimum values of these gains using the trial-and-error technique. In view of the above, a fuzzy PID controller with derivative filter (Fuzzy PIDF), in which the scaling factor gains are tuned by the Bees Algorithm, is proposed in this section for LFC. The structural design of this controller is illustrated in Figure 3. As is clear from the figure, the controller has two inputs, ∆F and the derivative of ∆F and one output; in the case of employing this controller in a multi-area power system, the two inputs are the Area Control Error (ACE) and the derivative of (ACE).
The scaling factor gains of the input are (K1 and K2) and four scaling factors in the output, namely Kp, KI, KD and KF is the filter gain. Due to its simplicity and the lower computation time needed for this type of membership, five triangular membership functions are used for the inputs and the output variables shown in Figure 4, namely Negative Big, Negative Small, Zero, Positive Small and Positive Big. Thus, 25 rules are required to generate the fuzzy output of the controller. Table 3 depicts the rule base of the proposed controller. Since the performance of the controller depends on these rules, the tabulated rules are generated by a comprehensive study of the dynamic behaviors of the testbed power system. The “Mamdani” interface tool is used in this controller for the fuzzification stage, while the “Centroid” method is used in the defuzzification stage to convert the fuzzy output value of the controller to a real value.

3.3. Objective Functions

In the design of modern controllers and for any controlled system, stable performance and fast response are required. However, in practice, both requirements are never achievable simultaneously. Therefore, a compromise between quick response and excellent stability is considered when designing a controller, which is achievable by adequately selecting an appropriate controller and designing it by minimizing a properly selected cost/objective function with the aid of an optimization algorithm. The objective function used to tune the controller mainly relies on a performance criterion that considers the overall closed-loop response of the system. Many objective functions have been proposed in the control design, in which four kinds are most often used for LFC. Because of their better performance compared to the other criteria [13], the Integral of Square Error (ISE) illustrated in Equation (3) and Integral Time Absolute Error (ITAE) expressed in Equation (4) are used in this paper. Therefore, PID, FOPID and Fuzzy PIDF controllers are designed for the LFC of the GB power system by minimizing the defined objective functions with the help of the Bees Algorithm and other two techniques.
ISE   = J   =   0 T sim ( F ) 2 ×   dt
ITAE   =   J   =   0 T sim | F | ×   t   ×   dt
It is proven that with ISE, large errors are more penalized than smaller ones. Thus, control systems designed to minimize ISE are more most likely to eliminate large errors quickly. However, they have to tolerate small ones that are continuous for a long period of time. ITAE calculates the integration of the absolute error multiplied by the time over the simulation period. This criterion is based on weighing errors that occur after a long time more largely than those that exist during the beginning of the response [34]. Control systems specified based on ITAE tuning tend to settle much more quickly than the ISE tuning methods.

4. The Proposed Algorithm

Over the last two decades, considerable interest has been shown by many researchers to propose algorithms inspired by the lifestyle of different animals and insects as well as the behavior of natural phenomena. Most of these algorithms have successfully demonstrated their potential in many applications to solve different optimization problems. This section precisely summarizes the main concept in steps that explain the Bees Algorithm (BA). Since its invention by Pham et al. in 2005 [24], several studies have been introduced based on this algorithm and different problems in many fields have been successfully solved using the BA [24,25,26,27]. The simplest pseudo-code for this algorithm is shown in Figure 5.
As with any optimization algorithm, a number of parameters are required to be set—specifically, the number of scout bees (n), number of selected sites for search out of n visited patches (m), number of best (elite) sites among them selected sites (e), number of recruited bees in the best-selected e sites (nep), number of bees sent to the other (m-e) selected sites (nsp), the initial size of each patch (ngh), which includes the site and the neighborhood, area as well as the stopping criteria. The mechanism of this algorithm begins with placing the n scout bees randomly in the search space. In step 2, the evaluation of the fitness of sites visited by the n scout bees is done. The m sites with the highest fitness in specified “chosen sites” in step 3 are selected for neighborhood or local search. The algorithm in steps 4 and 5 conducts searches in the neighborhood of the selected sites, with more bees assigned to the best e sites. Selection of the best sites could be conducted directly based on the fitness associated with them. Alternatively, using the fitness values, the probability of sites being selected is determined. Searches in the neighborhood of the best e sites which represent the most promising solutions are made more prominent by recruiting more bees for them than for the other selected sites. Together with scouting, this differential recruitment is a key operation of the Bees Algorithm. For each patch, only the one bee that has found the site with the highest fitness (the “fittest” bee) is selected in step 5 to form part of the next bee population. In steps 6–8, the remaining bees in the population n are assigned randomly around the search space to scout for potential new solutions or to conduct the global search. These eight steps are repeated until a stopping criterion is met. The colony will have two parts to its new population at the end of each iteration: representatives from each selected patch and other scout bees assigned to conduct random searches [35].

5. Results and Discussion

This work was implemented in MATLAB (2019a), the BA, TLBO and PSO codes were programmed in (.m files), and the model of the GB power system was developed in the MATLAB Simulink environment. The parameters of BA and PSO were set as depicted in Table 4 and Table 5, respectively. With TLBO, the population size was set to 50, and the maximum number of iterations was taken as 40 for all algorithms.
To study the dynamic performance of the GB power system, a step load perturbation of 0.03955 pu (at t = 5 s) represents a loss of generation unit equal to 1.32 GW (two of large generators, 660 MW) of the total generation power of the GB system used, which occurred in the GB system on 27th May 2008 [2].
ITAE and ISE are taken separately as objective functions to tune the parameters of the proposed controllers using the above-mentioned algorithms for LFC in the generalized GB power system model. Initially, the parameters of the PID controller are optimized; it is found that the PID tuned by the proposed algorithms performs satisfactorily to damp out the drop in the frequency. However, a reduced drop in frequency with a slow response is achieved when ISE is considered as an objective function, while with ITAE, the drop in frequency worsened with the fast response obtained, bringing the frequency back to the nominal value in a shorter period of time. Then, the gains of FOPID are tuned; in this regard, it is worth highlighting that, in general, the tuned FOPID tuned by BA designed via minimizing ITAE provides better results compared to the tuned PID. However, FOPID designed with ISE fails to bring the frequency back to its nominal value. Thereafter, Fuzzy PIDF parameters are tuned, where a significant improvement is achieved in comparison with PID and FOPID.

5.1. Classical Controllers

The gains of the conventional PID and FOPID controllers obtained using BA, TLBO and PSO optimization algorithms using the suggested objective functions are depicted in Table 6.
Results obtained based on the proposed algorithms “BA” tuning PID and FOPID are compared with those of TLBO and PSO; it is found to be a successful solution and provides excellent performance in many aspects, i.e., undershoot, overshoot and settling time, which are shown in Table 7, Table 8, Table 9 and Table 10. The changes in the frequency of the GB power system when different conventional controllers tuned by different optimization algorithms are used to control the frequency deviation are shown in Figure 6, Figure 7, Figure 8 and Figure 9.
From Figure 6 and Table 7, it is clear that when the PID is tuned using the proposed algorithms based on ISE, almost identical responses are obtained. On the other hand, when ITAE is used as an objective function to design the PID controller, as demonstrated in Figure 7 and Table 8, BA shows better performance in terms of undershoot and overshoot, with only a 0.1840 Hz drop in frequency.
As shown in Figure 8 and Table 9, FOPID designed by minimizing ISE is found to be less effective in eliminating the steady-state error, which made this technique a less preferable option for this system. In terms of undershoot and settling time Ts, Figure 9 and Table 10 prove that FOPID tuned by the proposed BA using ITAE as an objective function provides the best performance in comparison with the other classical controllers tuned by TLBO and PSO.

5.2. Fuzzy PIDF Controller

The optimal gains of the proposed Fuzzy PID with derivative filter obtained by the proposed BA, TLBO and PSO algorithms using the suggested objective functions are depicted in Table 11. Simulation results obtained with the BA are compared with those of TLBO and PSO and it is found to be an excellent tool and provides improved performance in many aspects.
Table 12 and Table 13 and Figure 10 and Figure 11 demonstrate the frequency response of the GB power system when the Fuzzy PIDF is optimized by different optimization algorithms implemented for LFC. It is observed that a significant improvement is achieved in comparison with classical controllers.
Moreover, BA has proved to be a powerful technique to tune the Fuzzy PIDF as the results obtained from the proposed controller tuned by BA prove that the performance of the system experiences a clear improvement in terms of undershoot and settling time. Regarding the error and overshoot, almost similar results are obtained based on all algorithms.

5.3. Robustness Analysis

5.3.1. Robustness Analysis against System Uncertainty

Parameters within the system, including the damping coefficient D, speed regulator R, system inertia coefficient Heq and turbine governor time constant Tg, are subject to constant fluctuation, which can lead to a significant degradation in the performance of close-loop systems. There has been comparatively less focus in research on this issue within load frequency control; for example, the increase in the total system inertia will slow down the system response, while the frequency deviation decreases if the damping ratio increases, and if the governor time constant increases, the frequency deviation will increase. The impact of the variation in each parameter on the frequency response of the GB power system is provided in Appendix B. Therefore, investigations are carried out in order to study the consequences of parametric uncertainties in the system. For this, each parameter in the system is altered by ±50% from its nominal value. Two different scenarios of parameters’ uncertainty, Tg, D, R and Heq (listed in Table 14 and shown in Figure 12), are considered for the simplified GB power system model examination. In this sub-section, only controllers tuned by the proposed BA are examined. The optimal gains obtained during the normal condition will not be re-tuned when the model is subjected to variation in system parameters.
Furthermore, as shown in Figure 12, and since, in the second scenario, the frequency response of the system is worse than the nominal case, the second scenario only is investigated, which also represents a possible decline in the total system inertia of the GB power system due to the increasing use of renewable energy resources.
Figure 13 and Figure 14 show the frequency response of the GB power system under parametric uncertainties when different controllers tuned by BA are employed as the LFC system. From Figure 13 and Figure 14, it is noted that Fuzzy PIDF controllers provide high stability while classical controllers show less robustness against system uncertainty, with the worst drop in frequency recorded at −0.178 Hz when PID is applied for scenario 2. The frequency responses of the system with different BA-tuned controllers based on ISE and ITAE, respectively, are listed in Table 15 and Table 16.

5.3.2. Different Load Disturbances

To further investigate the robustness of Fuzzy PIDF, FOPID and PID tuned by BA, a loss of 1.8 GW (very large nuclear generator) in the generation unit representing around 0.053 pu is considered in this sub-section. The frequency response of the GB power system with the new load disturbance is shown in Figure 15 and the frequency response performances are tabulated in Table 17. Furthermore, in order to further examine the robustness of the proposed techniques, parameter uncertainties from scenario 2 are considered when a power generation of 0.053pu is lost and the frequency response of the system in this case is given in Figure 16; the frequency response performances are depicted in Table 18, from which it is obvious that the proposed controller “Fuzzy PIDF” tuned by BA is robust and performs satisfactorily even when a larger generator is lost with parameter uncertainties. Note that only controllers tuned by BA based on minimizing the ITAE objective function are considered in this part.

6. Load Frequency Control for Dual-Area Power System

This study is extended to a multi-area interconnected power system as demonstrated in Figure 17. This model is extensively investigated in the literature to study the dynamic behavior of different control concepts for LFC in power systems [36,37]. It consists of two unequal thermal interconnected areas; the parameters of this model are tabulated in Appendix C. Based on the function of the LFC loop in multi-area power systems, the main tasks of LFC are providing the required power from the generation units to meet the load variation and maintaining the interchanged power among interconnected control areas via tie-lines at pre-rated values. The specified objectives of LFC that contribute to improving the overall power system stability are to guarantee zero steady-state errors in frequency fluctuations of different control areas along with the tie-line power fluctuations. It is also responsible for reducing the overshoot and undershoot of the oscillation within a specified time; this depends on the size of the disturbance and the capacity of the power system.
The term defined as Area Control Error (ACE) in each area is the input of the controller located in that area. In this model, the ACEs are represented in Equations (5) and (6).
ACE area   1   =   P 12   +   B 1   F 1
ACE area   2   =   P 12   +   B 1   F 1
where ∆F1 and ∆F2 are the frequency deviation in areas 1 and 2, respectively, ∆P12 and ∆P21 are the power flow deviation in areas 1 and 2, and B1, B2 are frequency biases.
The proposed Fuzzy PID with the filtered derivative mode is applied in this section as LFC in the dual-area interconnected power system. A step load disturbance of 0.2 pu is applied in area 1 to investigate the dynamic performance of the system with the proposed controller. The optimum values of the scaling factors of Fuzzy PID with Filtered derivative (Fuzzy PIDF) optimized by BA, PSO and TLBO by minimizing the ITAE objective function expressed in Equation (7) are depicted in Table 19.
Objective   Function   =   ITAE   =   0 t ( | F 1 | + | F 2 | + | P tie | )   ×   t   ×   dt
Due to the sudden subjection of the system to 0.2 pu disturbance in area 1, the frequency and tie-line power flow within the system experience a range of deviation from their nominal values. Frequency deviation in area 1 (∆F1), frequency deviation in area 2 (∆F2) and tie-line power flow deviation (∆Ptie) are illustrated in Figure 18, Figure 19 and Figure 20, respectively. Table 20 provides the characteristics of the dynamic performance of the testbed system-based Fuzzy PIDF tuned by different algorithms, where undershoot (Ush), overshoot (Osh) and settling time (Ts) of frequency in both areas and tie-line power along with the values of the objective function are given.
From Figure 18, Figure 19 and Figure 20 and Table 20, it is observed that the proposed Fuzzy PIDF controller provides an excellent dynamic response in different aspects. Moreover, despite the small difference in results obtained by applying the proposed controller based on the suggested optimization techniques, it is obvious that the Fuzzy PIDF tuned by BA offers the best response among the investigated techniques in terms of peak undershoot experienced in the area 1, with only −0.04 Hz recorded after applying the sudden disturbance, while the smallest drop in the frequency of area 2 was −0.0036 Hz based on the TLBO- and PSO-tuned Fuzzy PIDF.
To examine the robustness of the Fuzzy PIDF controller employed for LFC in the testbed dual-area power system, the parameters of the investigated system are simultaneously varied from their nominal values as shown in Table 21. The same disturbance of 0.2 pu is applied in area 1 and the optimum values of the Fuzzy PIDF parameters obtained in the normal condition are used to verify the robustness of the proposed controller.
Figure 21, Figure 22 and Figure 23 illustrate the deviation in frequency in areas 1 and 2 and the tie-line power fluctuation under parametric uncertainties of the dual-area power system with the proposed Fuzzy PIDF tuned by BA, TLBO and PSO equipped in the system for LFC. Undershoot (Ush), overshoot (Osh) and settling time (Ts) for ∆F1, ∆F2 and ∆Ptie of the system under parametric uncertainties are expressed in Table 22.
The simulation results obtained from robustness analysis given in Figure 21, Figure 22 and Figure 23 and Table 22 validate the robustness of the proposed Fuzzy PIDF-controlled LFC in the dual-area power system towards a wide range of parametric uncertainties. Furthermore, it is noticed that the TLBO-optimized Fuzzy PIDF is less robust against parametric uncertainties as compared to BA and PSO tuned with the same controller.

7. Conclusions

In this paper, the Bees Algorithm is proposed for the first time in load frequency control (LFC). This algorithm was successfully used to find the optimal parameters of PID, FOPID and the proposed Fuzzy PID with filter for the derivative action (Fuzzy PIDF) in order to solve the problem of LFC for the GB power system. A step load disturbance was applied to study the frequency performance of the system, taking ISE and ITAE as objective functions to design the above-mentioned controllers tuned by BA. The parameters of PID and FOPID were first optimized, and the obtained results were compared with those from TLBO and PSO; it was evident from the results that the BA-tuned FOPID designed by minimizing ITAE offered the best performance among the investigated classical controllers. In terms of applying the proposed Fuzzy PIDF, an obvious improvement in the performance of the system was achieved, and the obtained results from this controller based on BA, TLBO and PSO were somewhat similar, with the lowest drop in frequency equal to −0.0028 Hz when BA was used. Furthermore, it was demonstrated that the Fuzzy PIDF tuned by BA is robust against system uncertainties and different load disturbances. Finally, the research was extended to examine the validation of the proposed Fuzzy PIDF as LFC system in a dual-area interconnected power system; the obtained results emphasize that the Fuzzy PIDF-based BA is an excellent and robust controller and can be successfully implemented for LFC in different power systems.

Author Contributions

Conceptualization, M.S. and F.A.; methodology, M.S.; software, M.S., M.P. and M.H.; validation, M.S., F.A. and M.P.; formal analysis, M.S. and F.A; investigation, M.S., F.A. and M.P.; resources M.S., F.A., M.P. and M.H.; data curation, M.S., F.A., M.P. and M.H; writing—original draft preparation, M.S.; writing—review and editing, M.S., F.A., M.P. and M.H.; visualization, M.S.; supervision, F.A. and M.P.; project administration, M.S. and F.A.; funding acquisition, M.S. All authors have read and agreed to the published version of the manuscript.
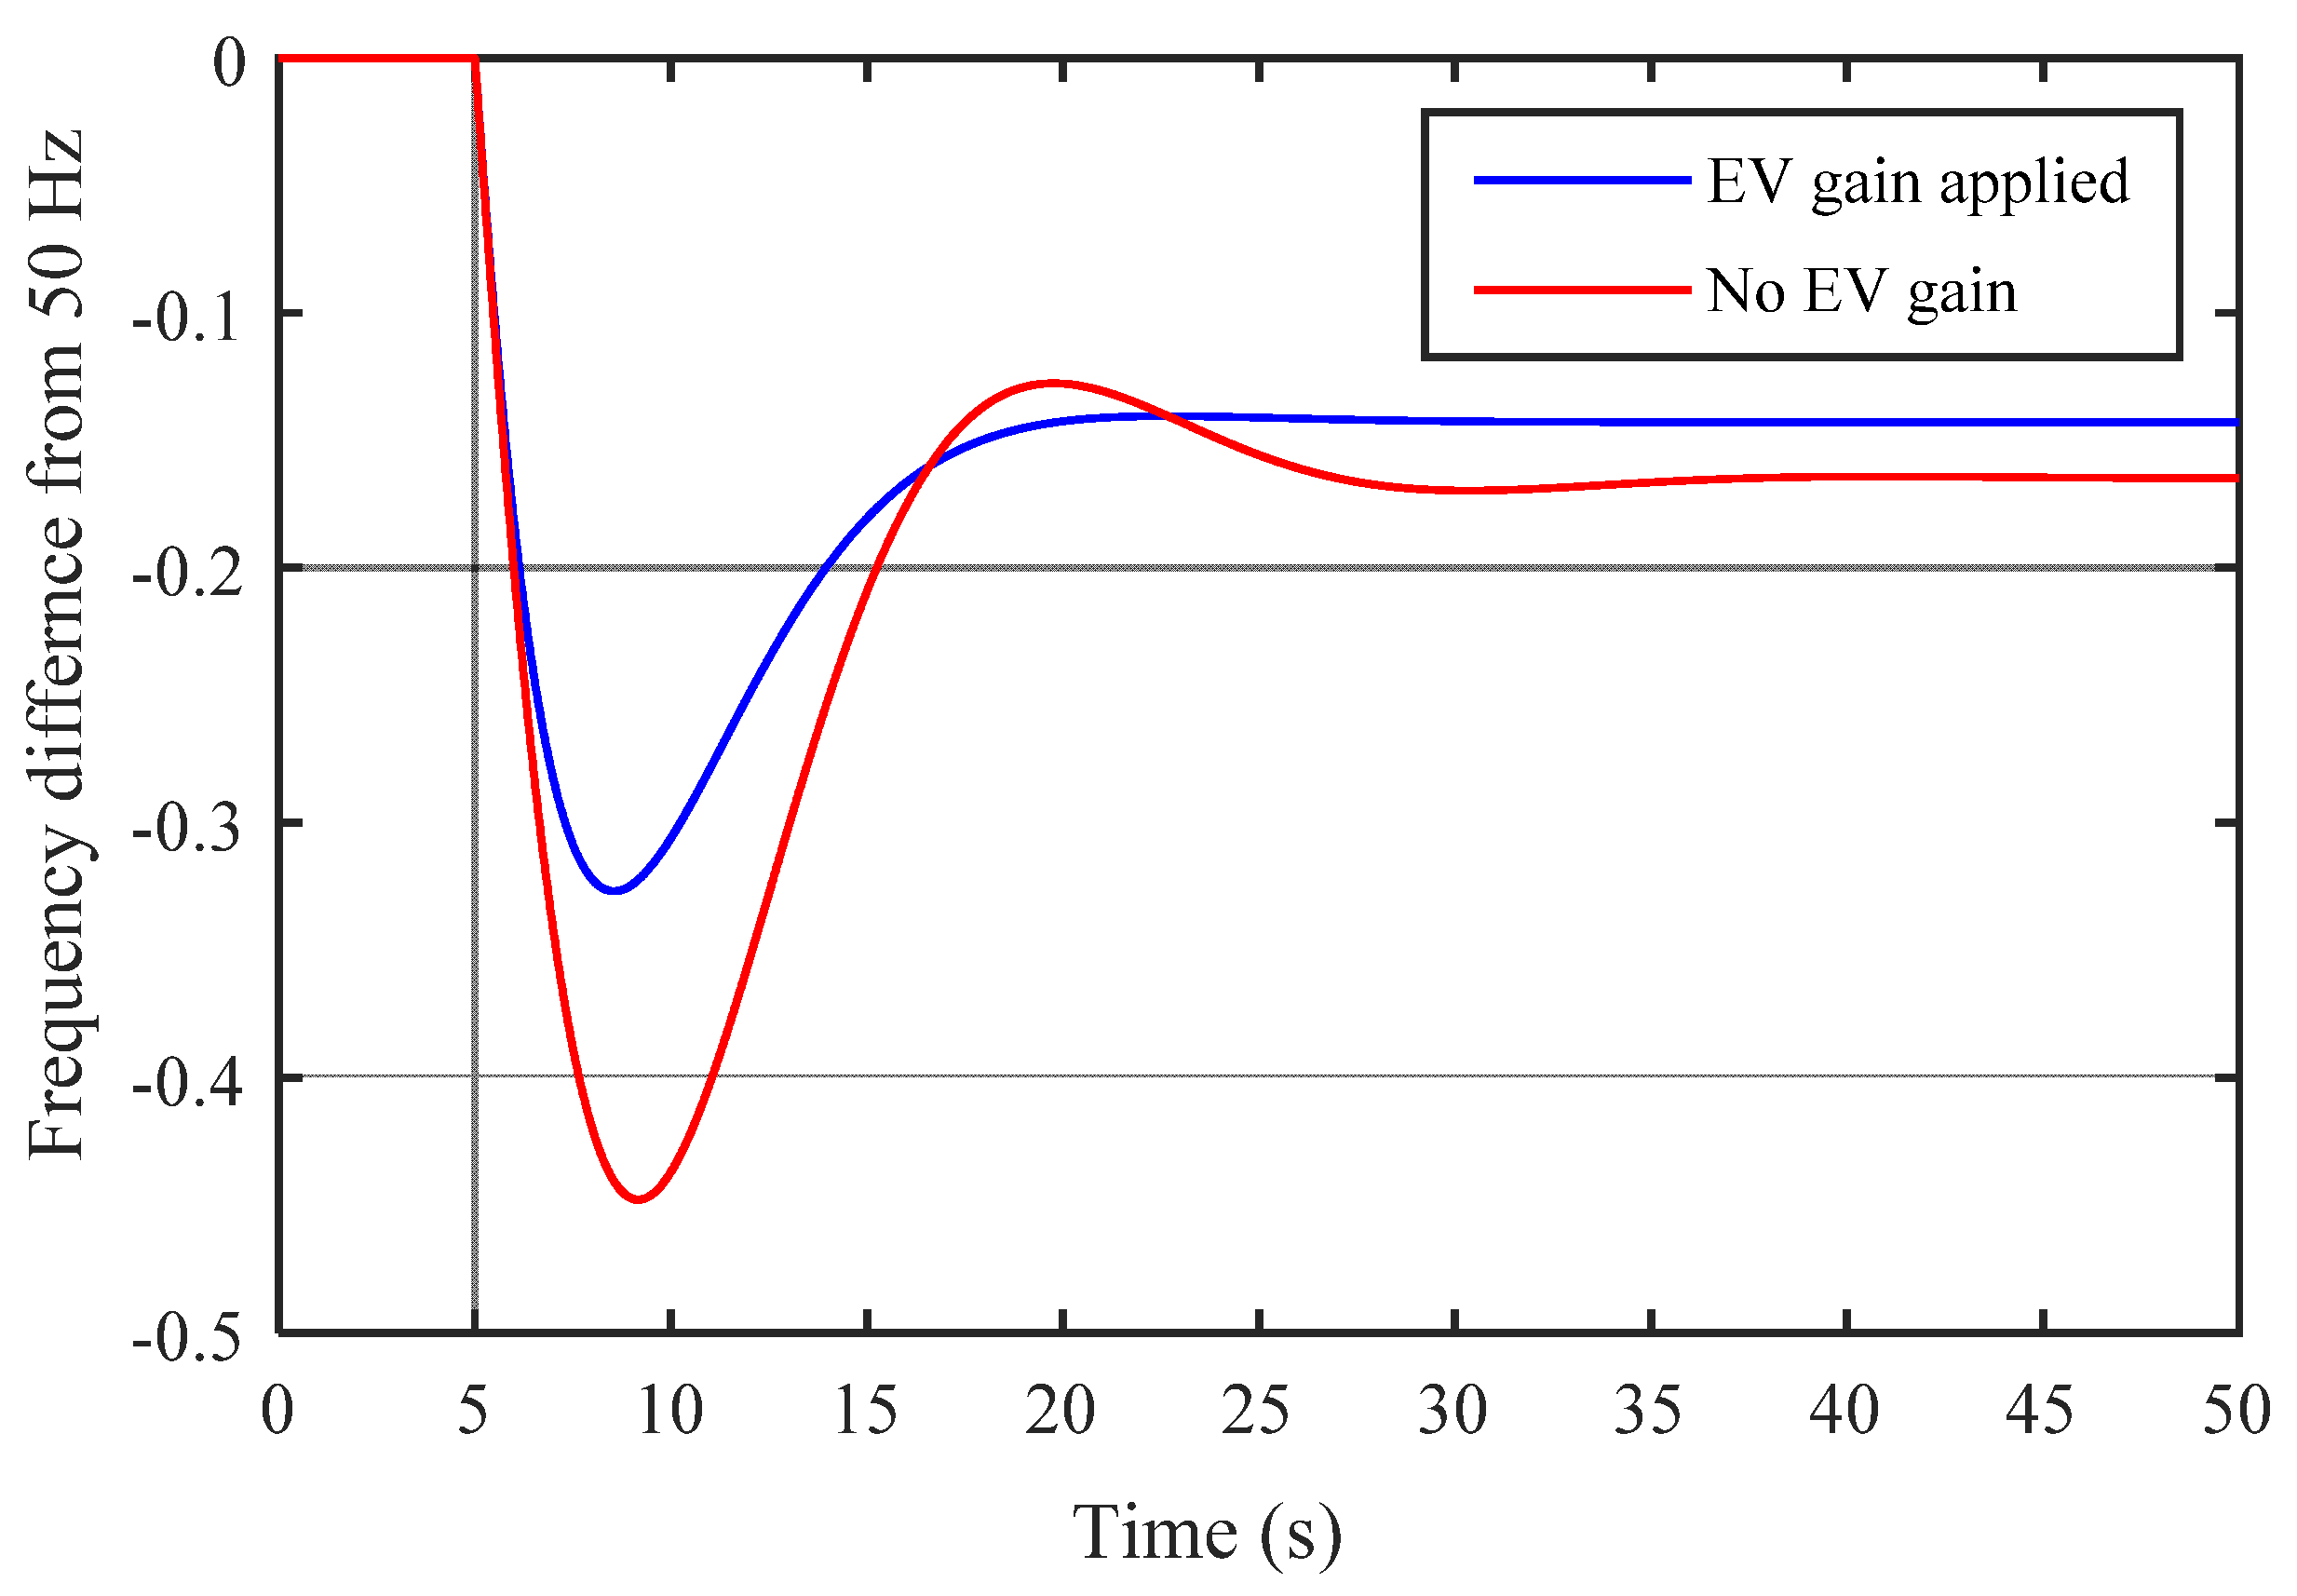
Funding

This paper is part of the PhD research of the corresponding author, M. Shouran, who is sponsored by the Ministry of Higher Education and Scientific Research in Libya.

Acknowledgments

The authors would like to thank Cardiff University/School of Engineering for accepting to pay the APC towards publishing this paper.

Conflicts of Interest

The authors declare no conflict of interest.

Appendix A

Electrical vehicle’s gain effect.
Figure A1. The primary frequency response of GB power system with and without the feedback gain of electrical vehicles.
Designs 05 00050 g0a1

Appendix B

The effect of parametric uncertainties on the frequency response of the GB power system.
Figure A2. The primary frequency response of GB power system with various values of Tg.
Designs 05 00050 g0a2
Figure A3. The primary frequency response of GB power system with various values of H.
Designs 05 00050 g0a3
Figure A4. The primary frequency response of GB power system with various values of D.
Designs 05 00050 g0a4
Figure A5. The primary frequency response of GB power system with various values of R.
Designs 05 00050 g0a5

Appendix C

The parameters of the system as used in [6,12] are as follows (T = 2, F = 60 Hz, SLP = 0.2 pu):
Area   1 :   T g   =   0.2 ,   T t   =   0.5 ,   R   =   0.050 ,   B   =   20.6 ,   D   =   0.6 ,   H   =   5 .
Area   2 :   T g =   0.3 ,   T t   =   0.6 ,   R   =   0.062 ,   B   =   16.9 ,   D   =   0.9 ,   H   =   4 .
where T is the synchronization constant, F is the system frequency, SLP is the step load perturbation, Tg is the time constant of the governor (second), Tt is the time constant of the turbine (second), R is the regulation constant (MW/Hz), B is the frequency bias constant (Hz/MW), H is the inertia time constant (second), and D is the ratio of variation in load to variation in frequency.

References

  1. Teng, F.; Mu, Y.; Jia, H.; Wu, J.; Zeng, P.; Strbac, G. Challenges on primary frequency control and potential solution from EVs in the future GB electricity system. Appl. Energy 2017, 194, 353–362. [Google Scholar] [CrossRef]
  2. Assi, Z.; Cipcigan, L.M.; Muhssin, M.T. Fuzzy hierarchal approach-based optimal frequency control in the Great Britain power system. Electr. Power Syst. Res. 2016, 141, 529–537. [Google Scholar]
  3. Analysis: Half of UK’s Electricity to Be Renewable by 2025. Available online: https://www.carbonbrief.org/analysis-half-uks-electricity-to-be-renewable-by-2025 (accessed on 2 May 2021).
  4. Muhssin, M.T.; Cipcigan, L.M.; Obaid, Z.A.; L-Ansari, W.F.A. A novel adaptive deadbeat- based control for load frequency control of low inertia system in interconnected zones north and south of Scotland. Int. J. Electr. Power Energy Syst. 2017, 89, 52–61. [Google Scholar] [CrossRef]
  5. Obaid, Z.A.; Cipcigan, L.M.; Abrahim, L.; Muhssin, M.T. Frequency control of future power systems: Reviewing and evaluating challenges and new control methods. J. Mod. Power Syst. Clean Energy 2019, 7, 9–25. [Google Scholar] [CrossRef]
  6. Mu, Y.; Wu, J.; Ekanayake, J.; Jenkins, N.; Jia, H. Primary frequency response from electric vehicles in the Great Britain power system. IEEE Trans. Smart Grid 2013, 4, 1142–1150. [Google Scholar] [CrossRef]
  7. Obaid, Z.A.; Cipcigan, L.; Muhsin, M.T. Analysis of the Great Britain’s power system with Electric Vehicles and Storage Systems. In Proceedings of the 18th International Conference on Intelligent System Application to Power Systems (ISAP), Porto, Portugal, 11–16 September 2015; pp. 1–6. [Google Scholar] [CrossRef]
  8. Short, J.A.; Infield, D.G.; Freris, L.L. Stabilization of Grid Frequency Through Dynamic Demand Control. IEEE Trans. Power Syst. 2007, 22, 1284–1293. [Google Scholar] [CrossRef] [Green Version]
  9. Nedd, M.; Booth, C.; Bell, K. Potential solutions to the challenges of low inertia power systems with a case study concerning synchronous condensers. In Proceedings of the 52nd International Universities Power Engineering Conference (UPEC), Heraklion, Greece, 28–31 August 2017; pp. 1–6. [Google Scholar] [CrossRef] [Green Version]
  10. Strbac, G.; Shakoor, A.; Black, M.; Pudjianto, D.; Bopp, T. Impact of wind generation on the operation and development of the UK electricity systems. Elect. Power Syst. Res. 2007, 77, 1214–1227. [Google Scholar] [CrossRef]
  11. Ravindra, S.; Indraneel, S. Tuning of PID controller based AGC system using genetic algorithms. In Proceedings of the 2004 IEEE Region 10 Conference TENCON 2004, Chiang Mai, Thailand, 24–24 November 2004; Volume 3, pp. 531–534. [Google Scholar]
  12. Sharma, D.; Kumar, B. PSO Optimized PID Controller for Load Frequency Control. Eur. J. Adv. Eng. Technol. 2015, 2, 43–48. [Google Scholar]
  13. Barisal, A.K. Comparative performance analysis of teaching learning-based optimization for automatic load frequency control of multi-source power systems. Int. J. Electr. Power Energy Syst. 2015, 66, 67–77. [Google Scholar] [CrossRef]
  14. Shah, P.; Agashe, S. Review of fractional PID controller. Mechatronics 2016, 38, 29–41. [Google Scholar] [CrossRef]
  15. Topno, P.N.; Chanana, S. Fractional order PID control for LFC problem of a hydro-thermal power system. In Proceedings of the 11th International Conference on Industrial and Information Systems (ICIIS), Roorkee, India, 3–4 December 2016; pp. 867–872. [Google Scholar]
  16. Kumar, N.; Tyagi, B.; Kumar, V. Application of Fractional Order PID Controller for AGC Under Deregulated Environment. Int. J. Autom. Comput. 2018, 15, 84–93. [Google Scholar] [CrossRef]
  17. Chown, G.A.; Hartman, R.C. Design and Experience with a Fuzzy Logic Controller for Automatic Generation Control (AGC). In Proceedings of the 20th International Conference on Power Industry Computer, Columbus, OH, USA, 11 May–16 June 1997; Volume 13, pp. 965–970. [Google Scholar]
  18. Arya, Y. Automatic generation control of two-area electrical power systems via optimal fuzzy classical controller. J. Franklin Inst. 2018, 355, 2662–2688. [Google Scholar] [CrossRef]
  19. Gheisarnejad, M.; Khooban, M.H. Design an optimal fuzzy fractional proportional integral derivative controller with derivative filter for load frequency control in power systems. Trans. Inst. Meas. Control 2019, 41, 2563–2581. [Google Scholar] [CrossRef]
  20. Khezri, R.; Oshnoei, A.; Oshnoei, S.; Bevrani, H.; Muyeen, S.M. An intelligent coordinator design for GCSC and AGC in a two-area hybrid power system. Appl. Soft Comput. 2019, 76, 491–504. [Google Scholar] [CrossRef]
  21. Khezri, R.; Golshannavaz, S.; Shokoohi, S.; Bevrani, H. Fuzzy Logic Based Fine-tuning Approach for Robust Load Frequency Control in a Multi-area Power System. Electr. Power Compon. Syst. 2016, 44, 2073–2083. [Google Scholar] [CrossRef]
  22. Golshannavaz, S.; Khezri, R.; Esmaeeli, M.; Siano, P. A two-stage robust-intelligent controller design for efficient LFC based on Kharitonov theorem and fuzzy logic. J. Ambient. Intell. Humaniz. Comput. 2018, 9, 1445–1454. [Google Scholar] [CrossRef]
  23. Shouran, M.; Anayi, F.; Packianather, M. A State-of-the-Art Review on LFC Strategies in Conventional and Modern Power Systems. In Proceedings of the 2021 International Conference on Advance Computing and Innovative Technologies in Engineering (ICACITE), Greater Noida, India, 4–5 March 2021; pp. 268–277. [Google Scholar]
  24. Pham, D.T.; Ghanbarzadeh, A.; Koç, E.; Otri, S.; Rahim, S.; Zaidi, M. The Bees Algorithm—A Novel Tool for Complex Optimisation Problems. In Intelligent Production Machines and Systems; Elsevier: Amsterdam, The Netherlands, 2006; pp. 454–459. [Google Scholar]
  25. Pham, D.T.; Castellani, M. The bees algorithm: Modelling foraging behaviour to solve continuous optimization problems. Proc. Inst. Mech. Eng. Part C J. Mech. Eng. Sci. 2009, 223, 2919–2938. [Google Scholar] [CrossRef]
  26. Packianather, M.S.; Al-Musawi, A.K.; Anayi, F. Bee for mining (B4M)—A novel rule discovery method using the Bees algorithm with quality-weight and coverage-weight. Proc. Inst. Mech. Eng. Part C J. Mech. Eng. Sci. 2019, 233, 5101–5112. [Google Scholar] [CrossRef]
  27. Pham, D.T.; Koç, E. Design of a Two-dimensional Recursive Filter Using the Bees Algorithm. Int. J. Autom. Comput. 2010, 7, 399–402. [Google Scholar] [CrossRef]
  28. Gozde, H.; Taplamacioglu, M.C.; Kocaarslan, İ. Comparative performance analysis of Artificial Bee Colony algorithm in automatic generation control for interconnected reheat thermal power system. Int. J. Electr. Power Energy Syst. 2012, 42, 167–178. [Google Scholar] [CrossRef]
  29. Kouba, N.e.; Menaa, M.; Hasni, M.; Boudour, M. Optimal load frequency control based on artificial bee colony optimization applied to single, two and multi-area interconnected power systems. In Proceedings of the 3rd International Conference on Control, Engineering & Information Technology (CEIT), Tlemcen, Algeria, 25–27 May 2015; pp. 1–6. [Google Scholar] [CrossRef]
  30. Li, H.; Liu, K.; Li, X. A Comparative Study of Artificial Bee Colony, Bees Algorithms and Differential Evolution on Numerical Benchmark Problems. In Computational Intelligence and Intelligent Systems; ISICA 2010. Communications in Computer and Information Science; Cai, Z., Tong, H., Kang, Z., Liu, Y., Eds.; Springer: Berlin/Heidelberg, Germany, 2010; Volume 107. [Google Scholar] [CrossRef]
  31. Moore, I.; Ekanayake, J. Frequency response from wind turbines. In Proceedings of the 44th International Universities Power Engineering Conference (UPEC), Glasgow, UK, 1–4 September 2009; pp. 573–586. [Google Scholar]
  32. Mohanty, P.K.; Sahu, B.K.; Pati, T.K.; Panda, S.; Kar, S.K. Design and analysis of fuzzy PID controller with derivative filter for AGC in multi-area interconnected power system. IET Gener. Transm. Distrib. 2016, 10, 3764–3776. [Google Scholar] [CrossRef]
  33. Sekhar, G.T.C.; Sahu, R.K.; Baliarsingh, A.K.; Panda, S. Load frequency control of power system under deregulated environment using optimal firefly algorithm. Int. J. Electr. Power Energy Syst. 2016, 74, 195–211. [Google Scholar] [CrossRef]
  34. Mohanty, B.; Panda, S.; Hota, P.K. Controller parameters tuning of differential evolution algorithm and its application to load frequency control of multi-source power system. Int. J. Electr. Power Energy Syst. 2014, 54, 77–85. [Google Scholar] [CrossRef]
  35. Pham, D.T.; Kalyoncu, M. Optimisation of a fuzzy logic controller for a flexible single-link robot arm using the bees algorithm. In Proceedings of the IEEE International Conference on Industrial Informatics (INDIN), Cardiff, UK, 23–26 June 2009; pp. 475–480. [Google Scholar]
  36. Hussein, T.; Shamekh, A. Design of PI Fuzzy Logic Gain Scheduling Load Frequency Control in Two-Area Power Systems. Designs 2019, 3, 26. [Google Scholar] [CrossRef] [Green Version]
  37. Sahu, B.K.; Pati, S.; Mohanty, P.K.; Panda, S. Teaching-learning based optimization algorithm based fuzzy-PID controller for automatic generation control of multi-area power system. Appl. Soft Comput. J. 2015, 27, 240–249. [Google Scholar] [CrossRef]
Figure 1. 
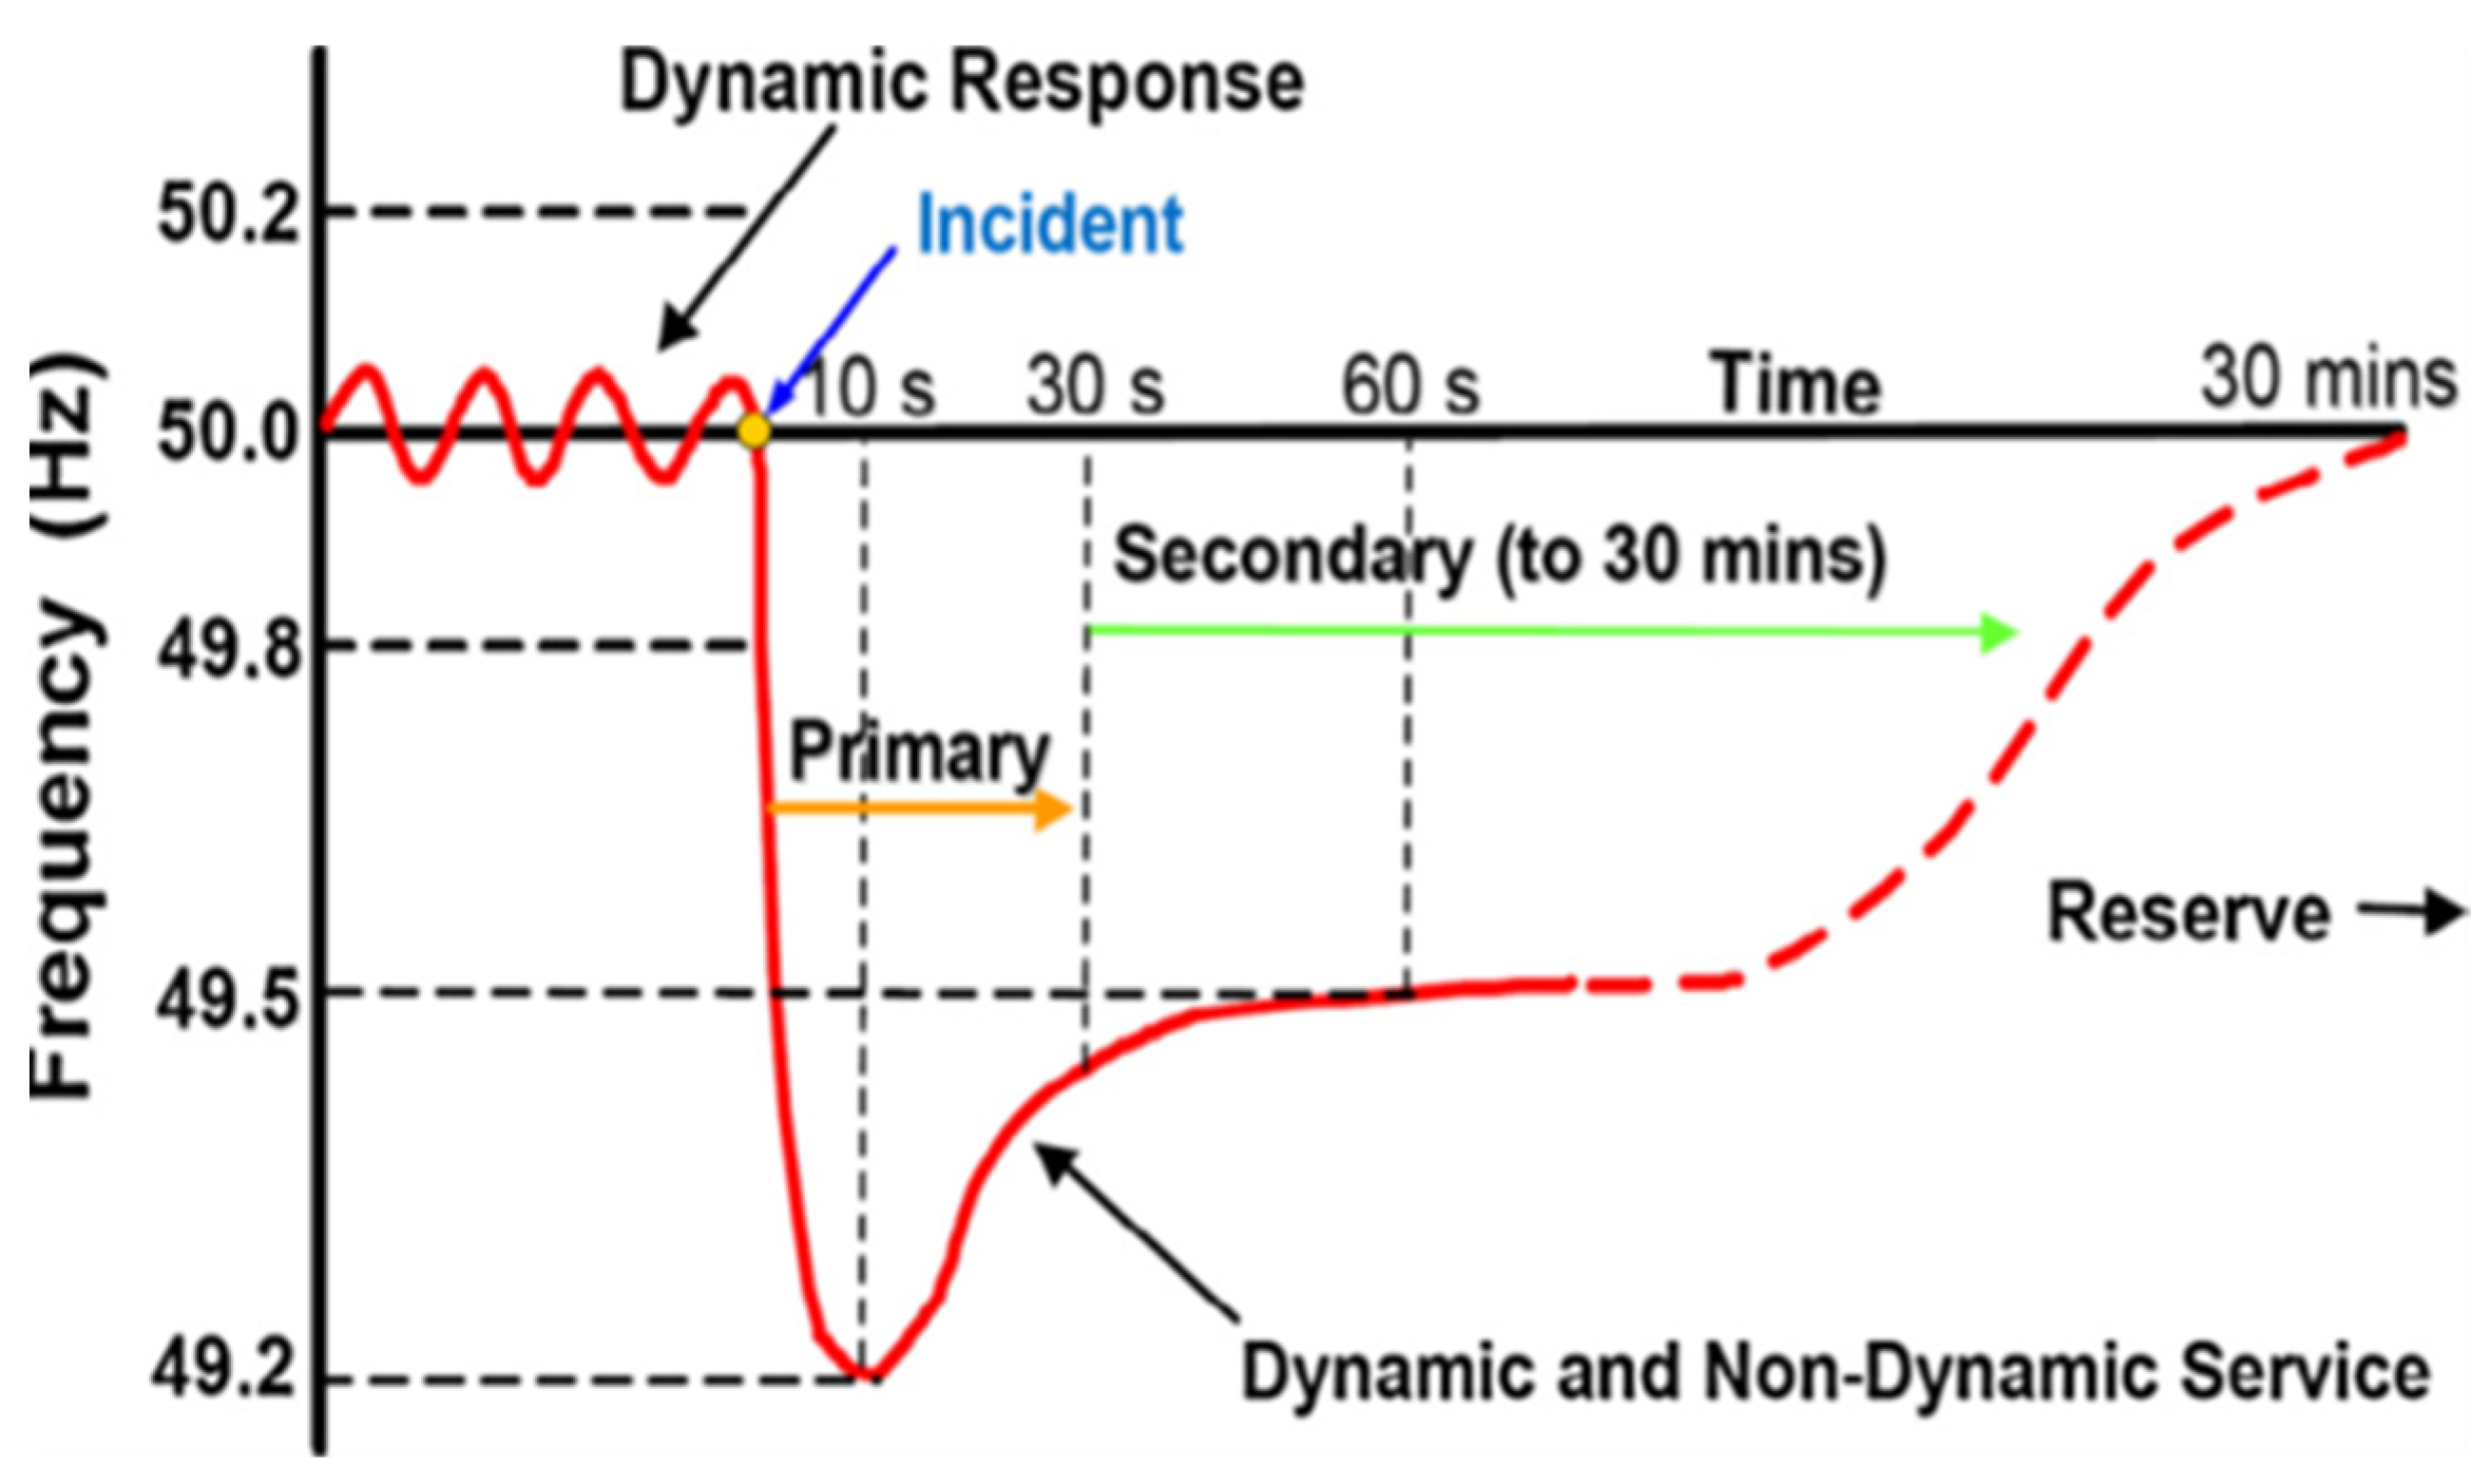
Frequency fluctuations following the loss of generation up to 1800 MW [1].
Designs 05 00050 g001
Figure 2. 
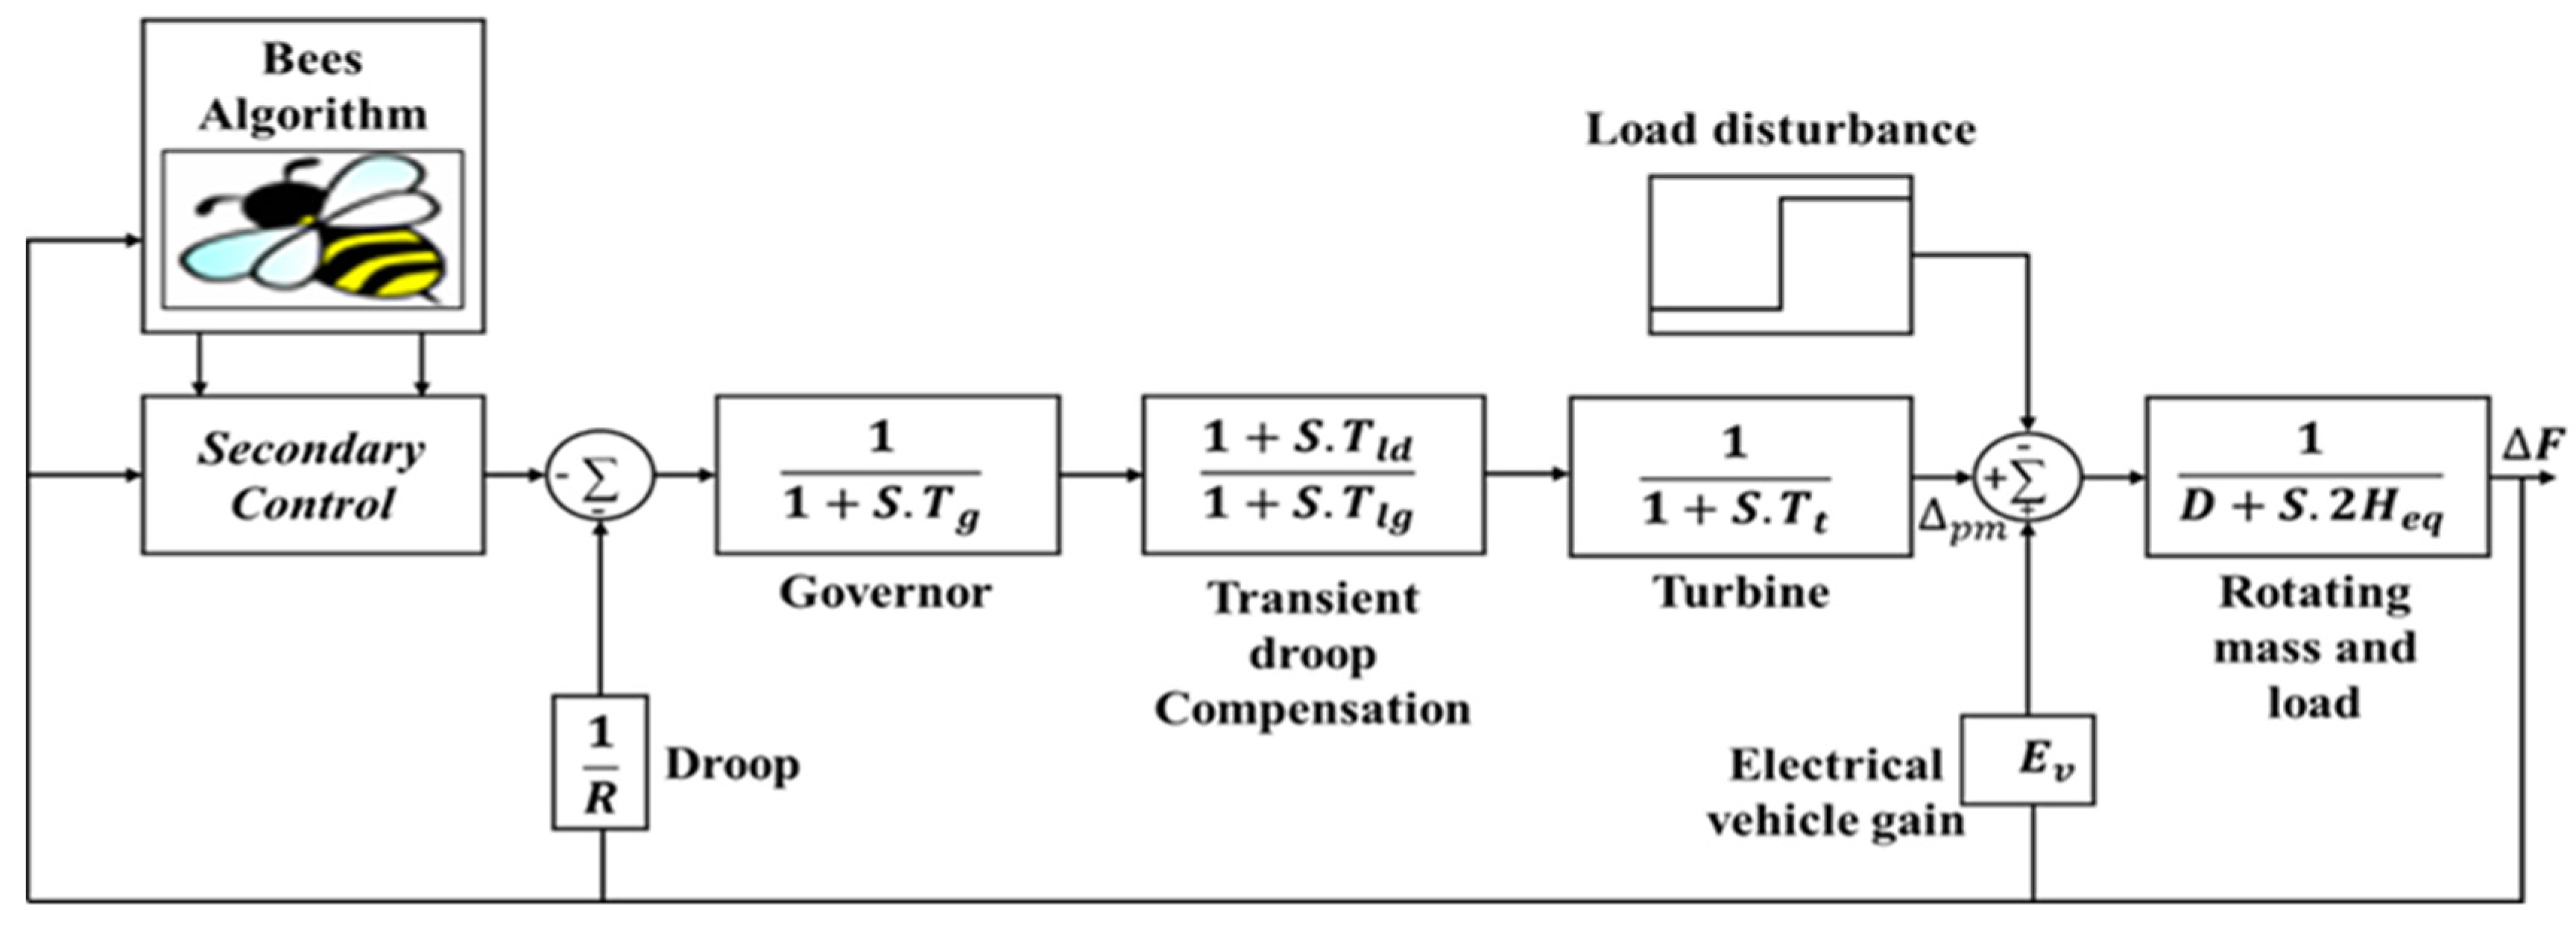
GB simplified power system.
Designs 05 00050 g002
Figure 3. 
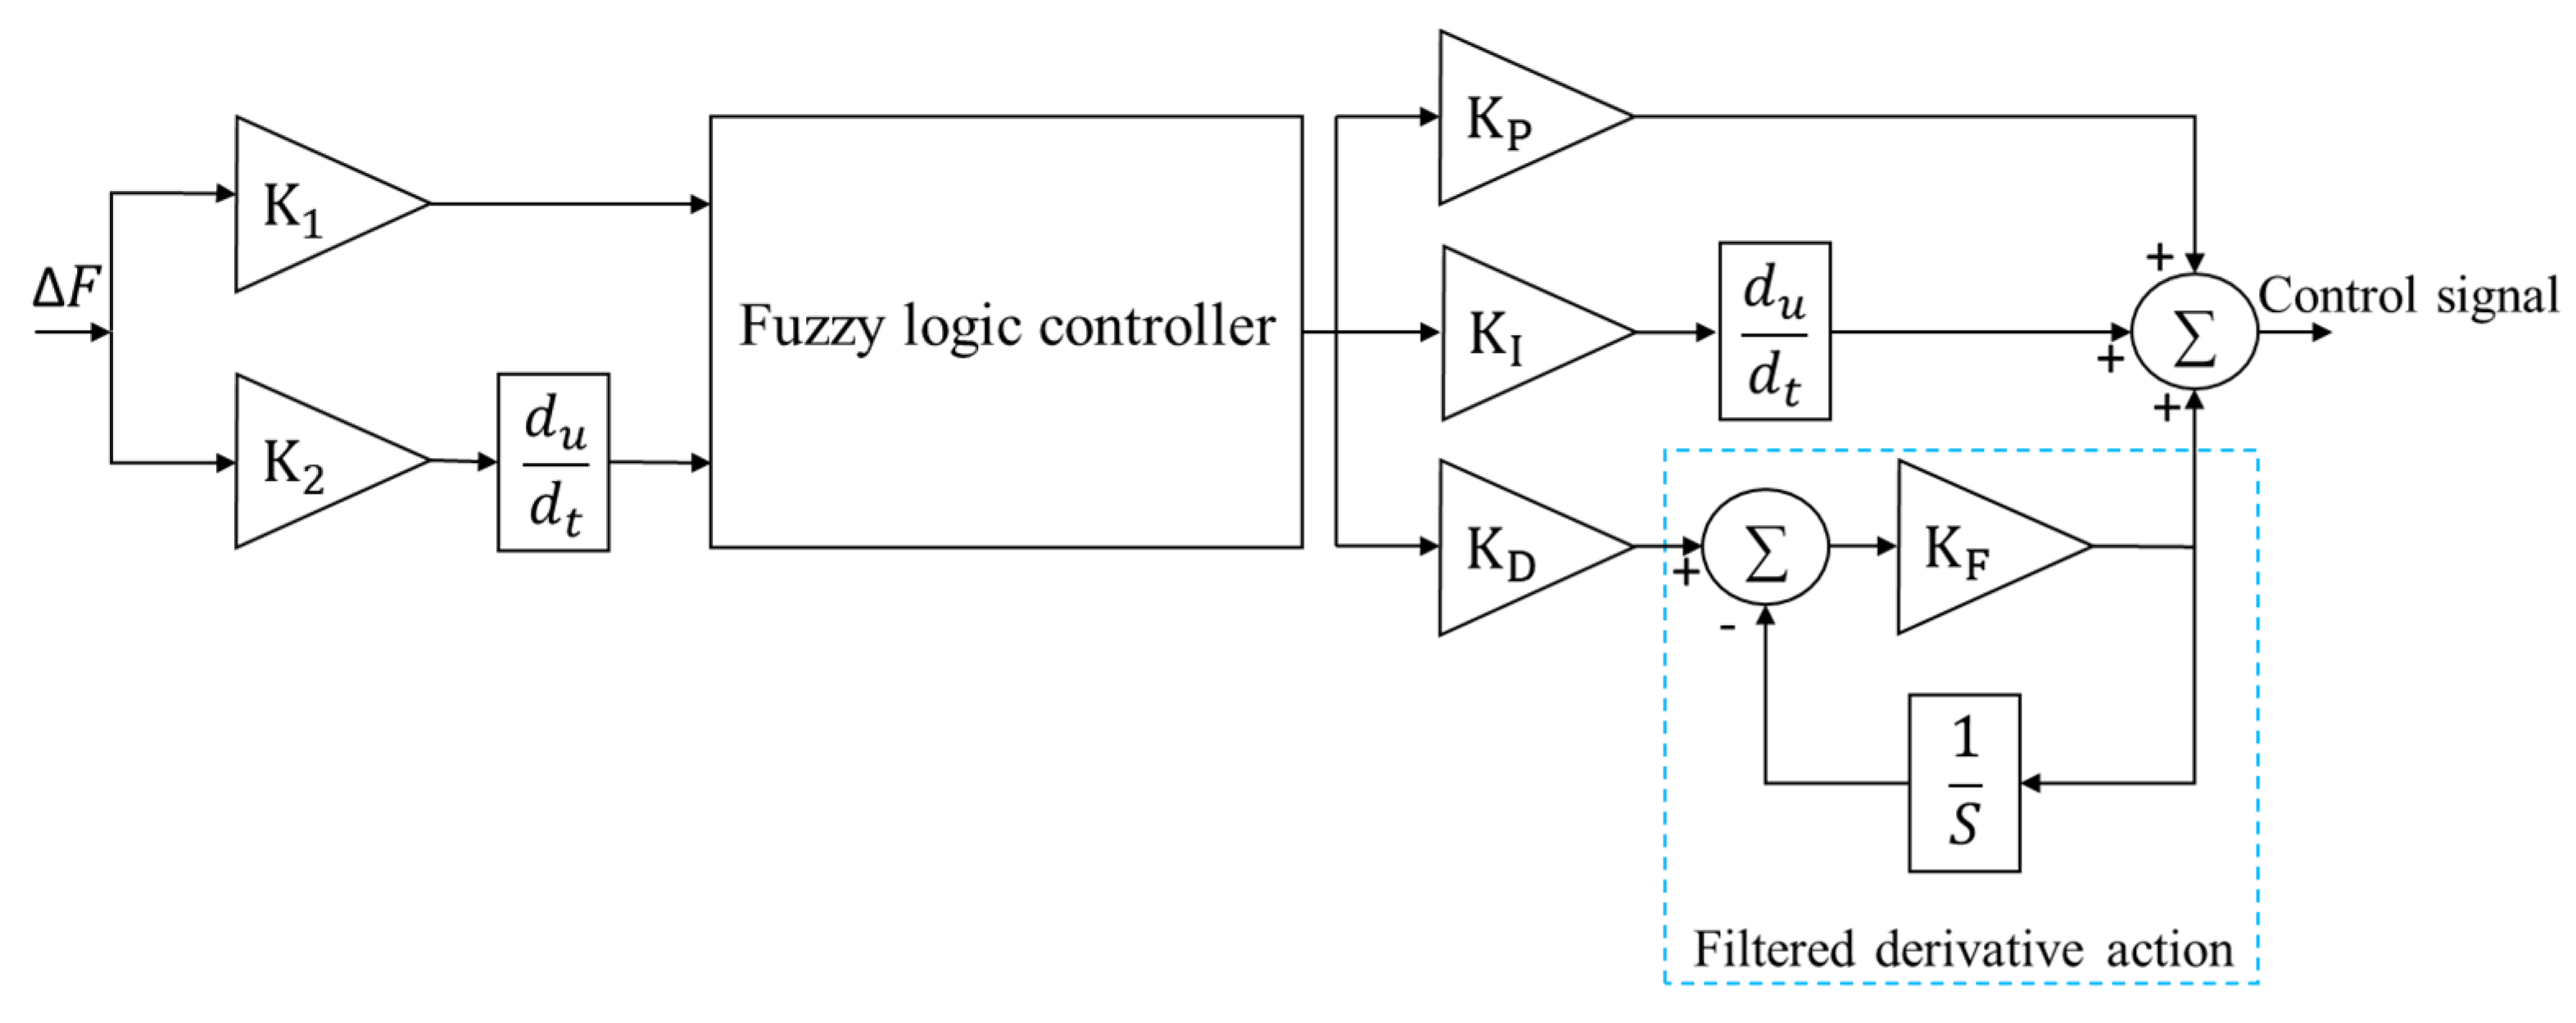
Structural diagram of fuzzy PIDF controller.
Designs 05 00050 g003
Figure 4. 
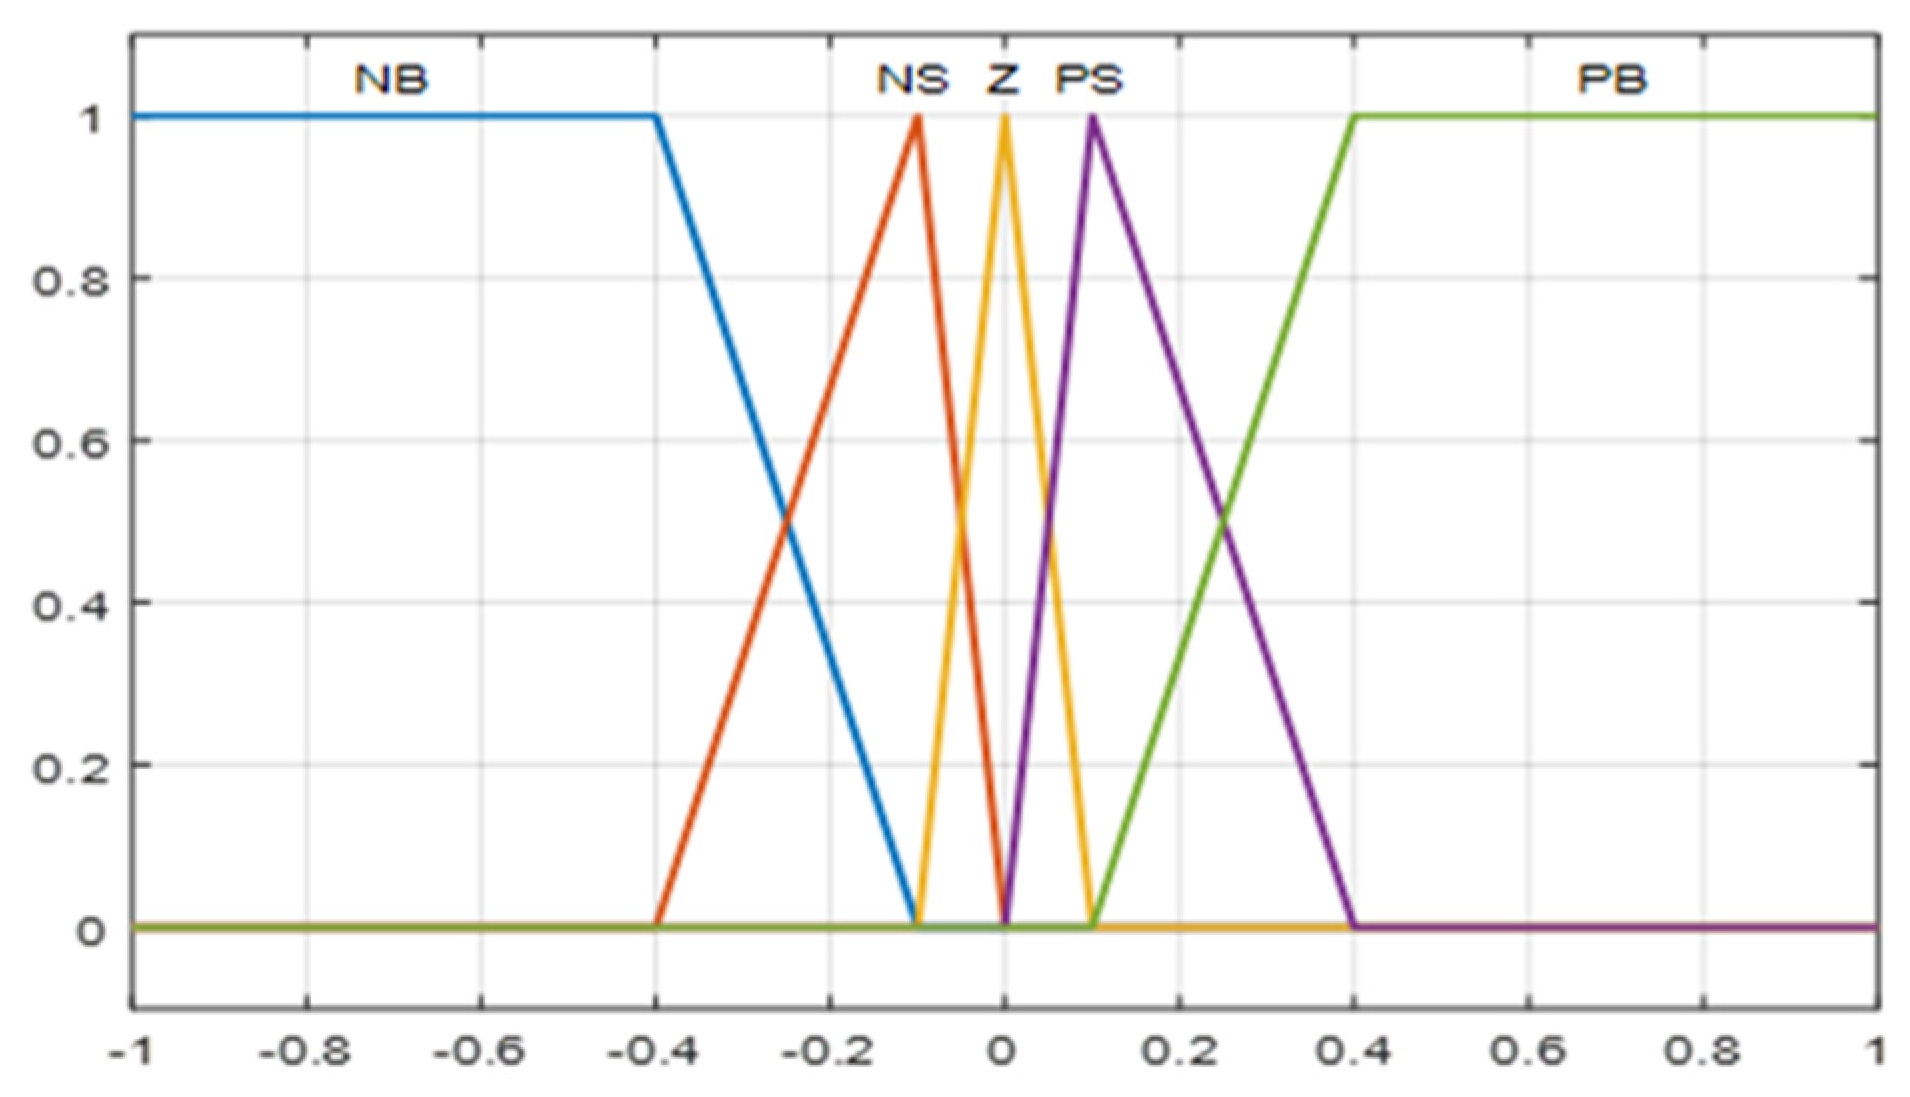
Membership functions of the two inputs and output.
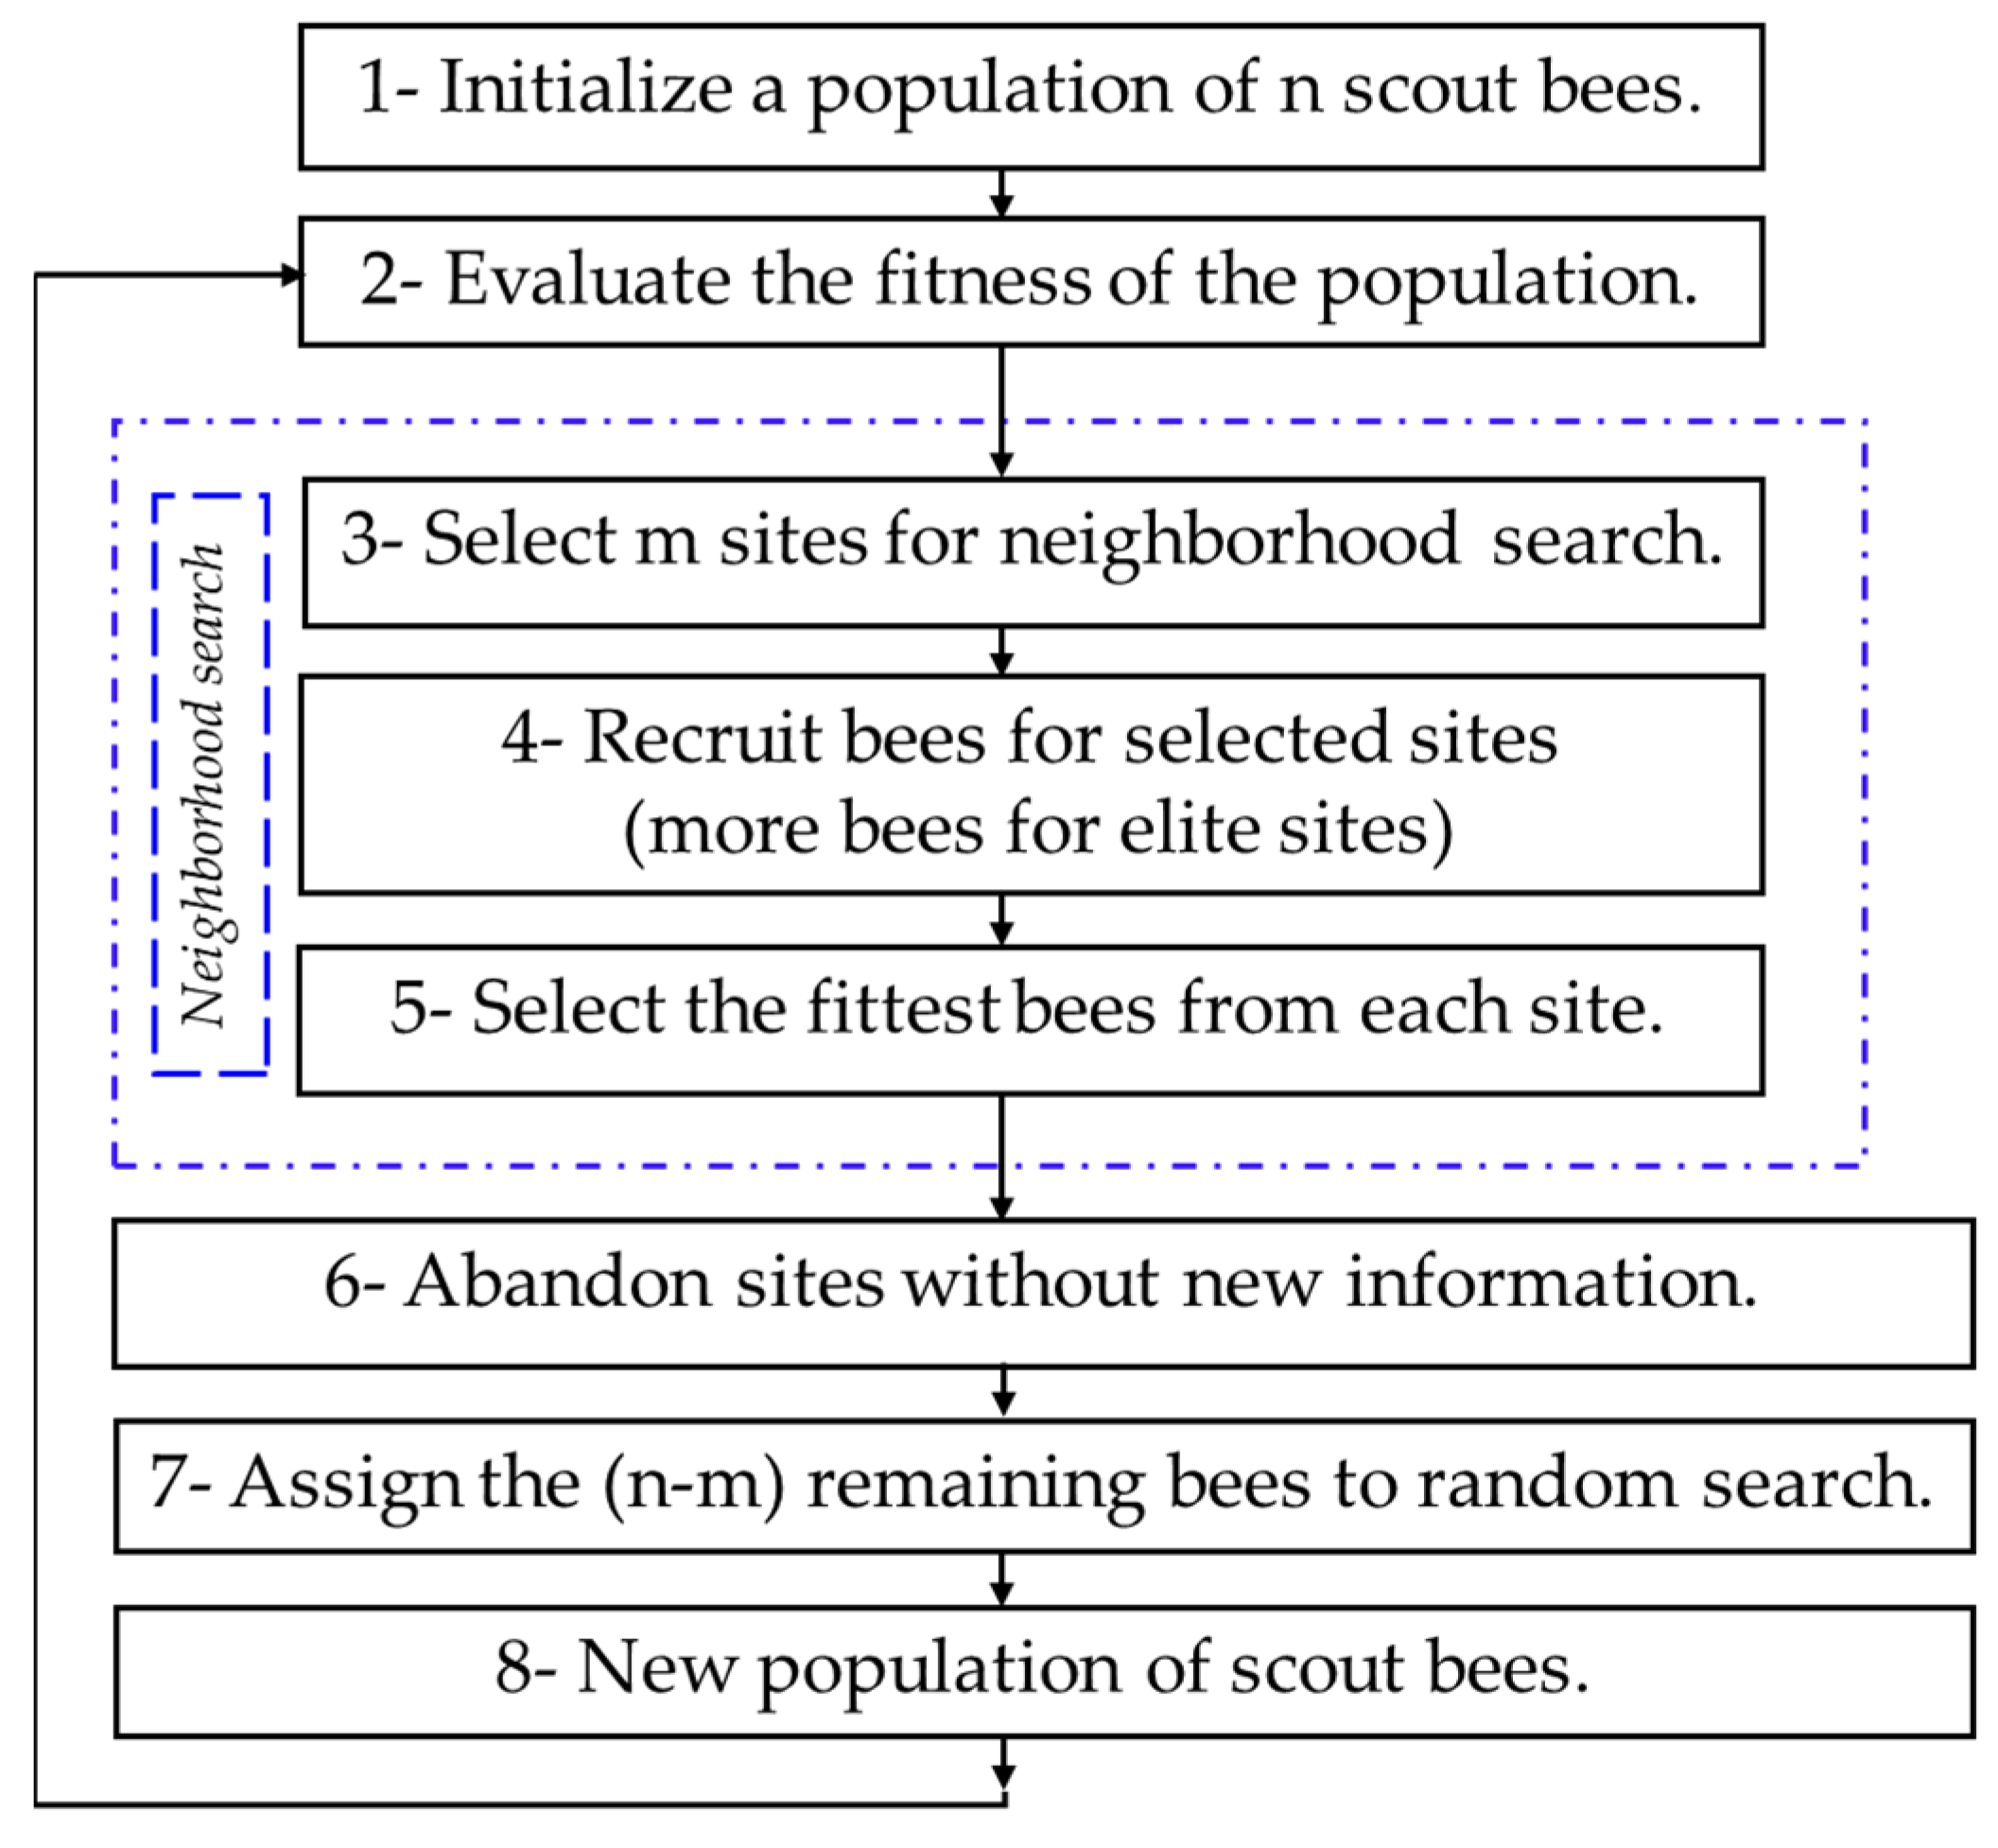
Designs 05 00050 g004
Figure 5. The Bees Algorithm flowchart.
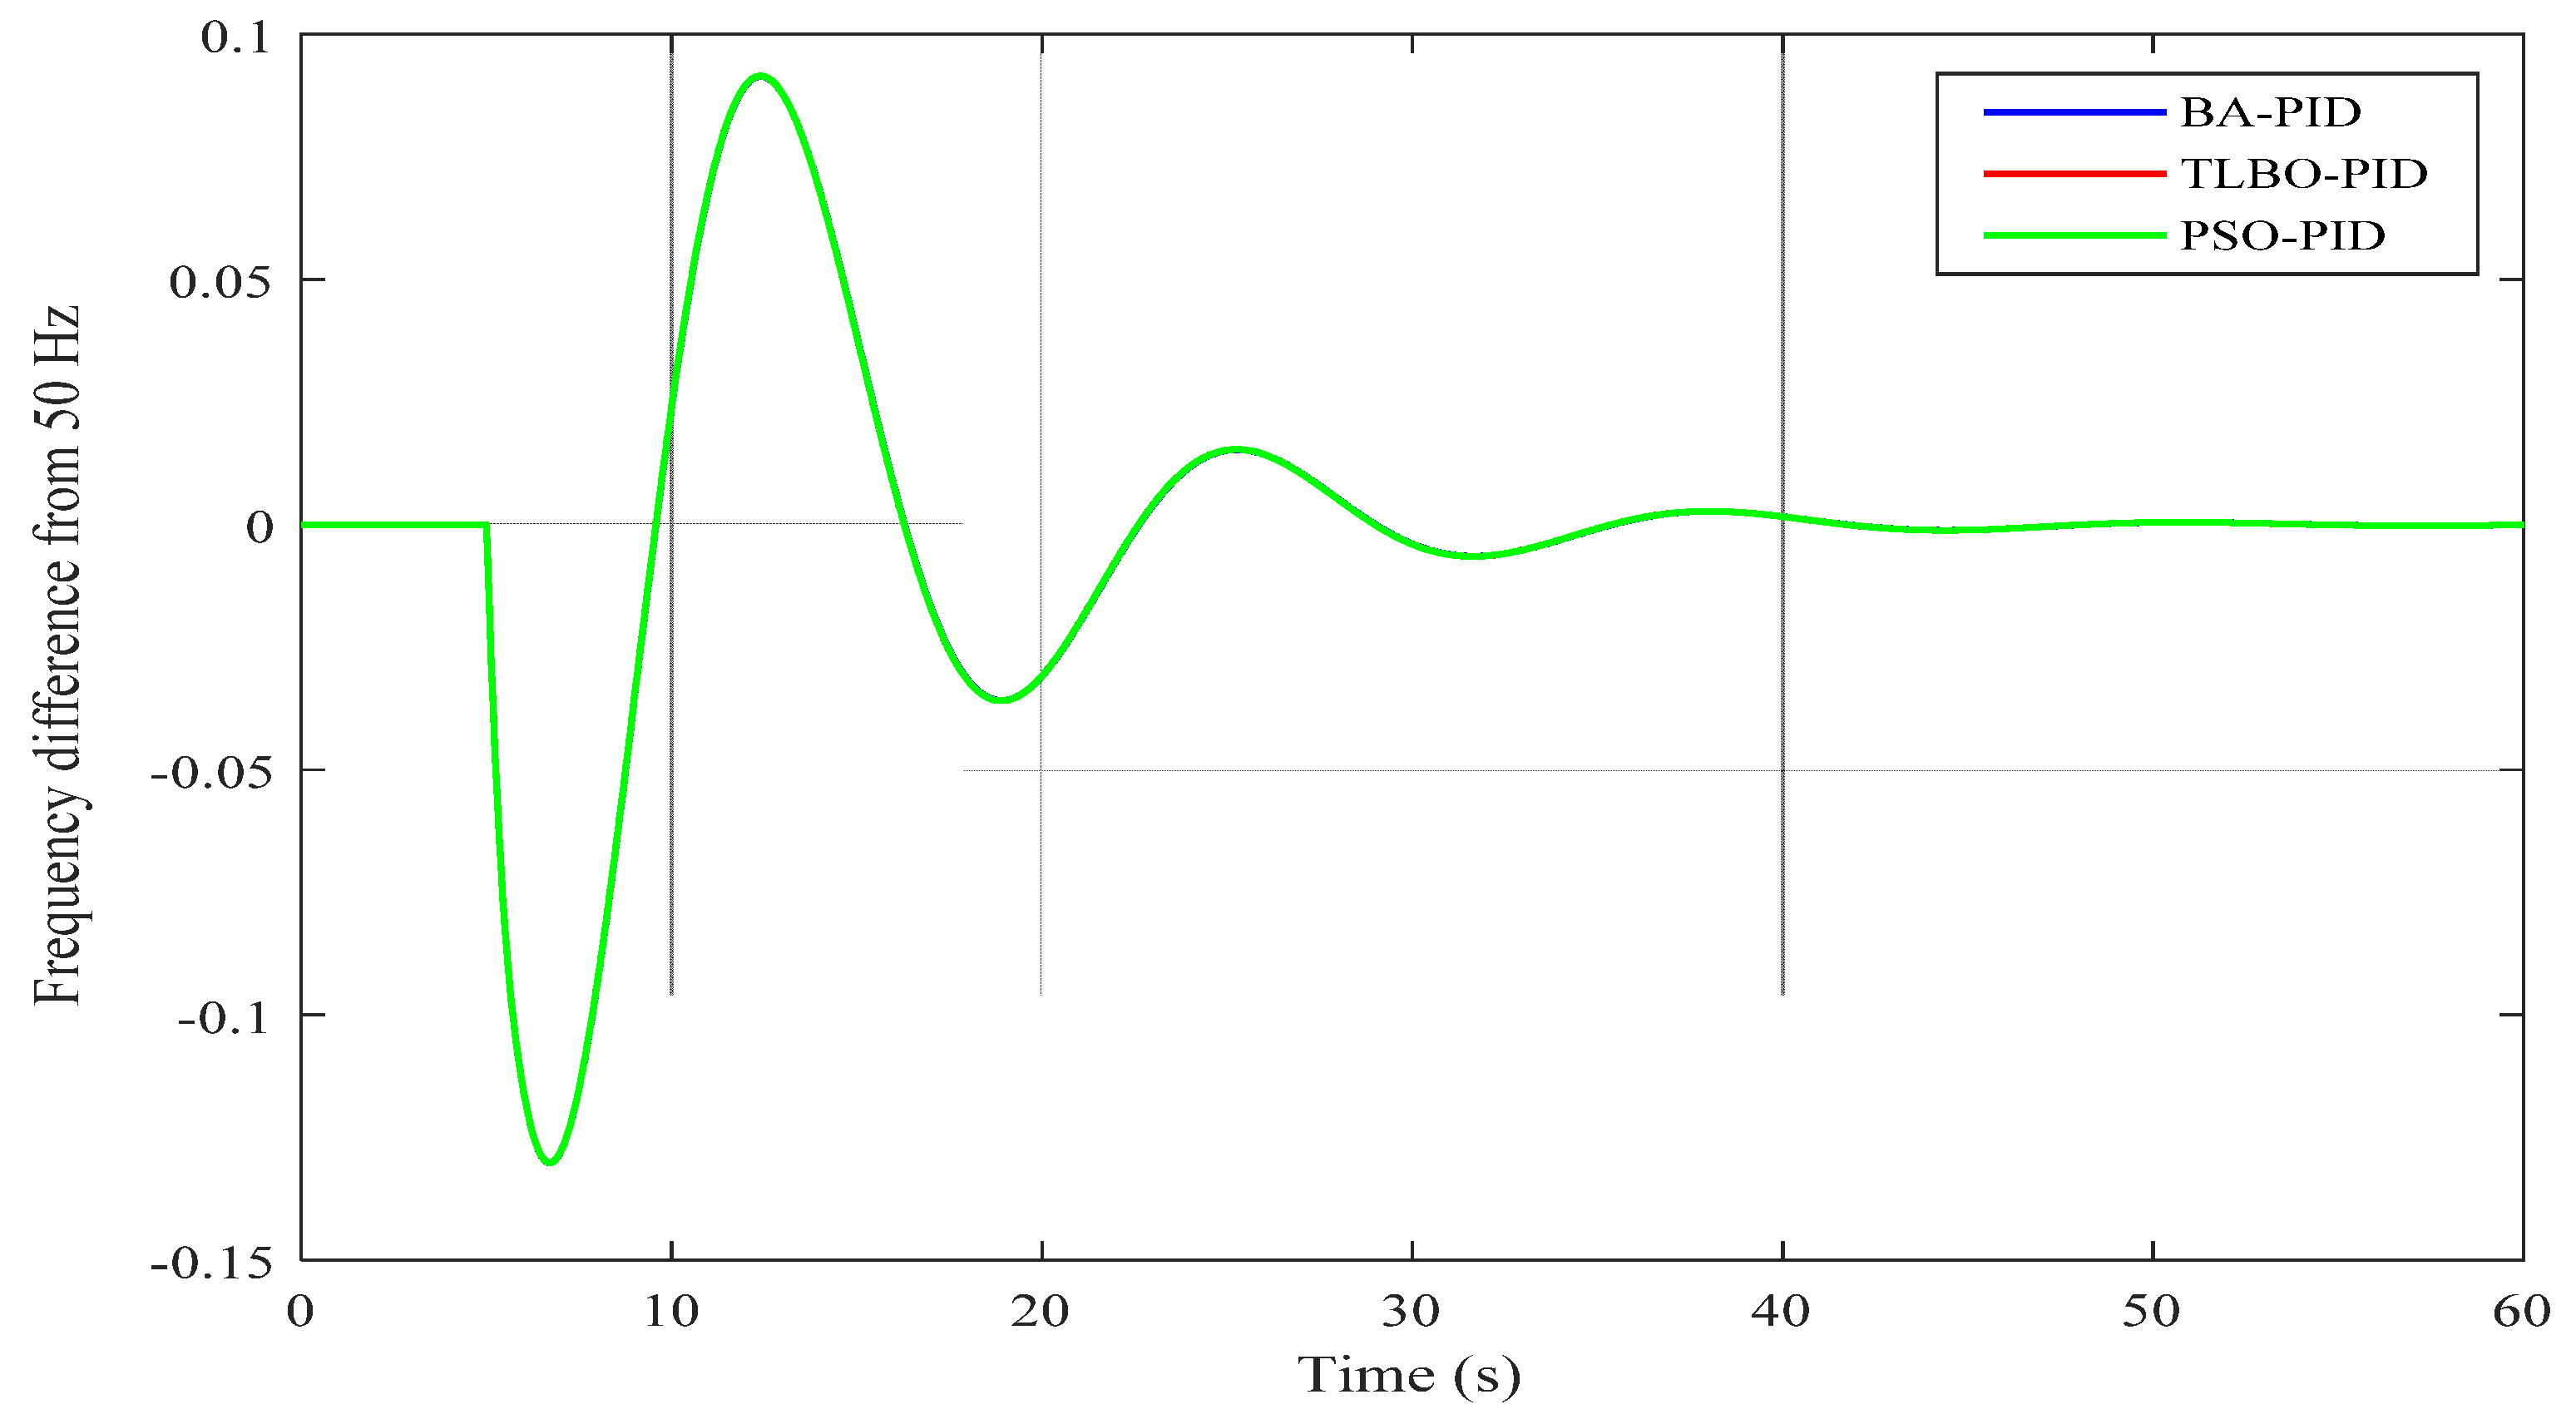
Designs 05 00050 g005
Figure 6. Change in frequency in the GB power system for 0.035 pu load disturbance with tuned PID-based ISE.
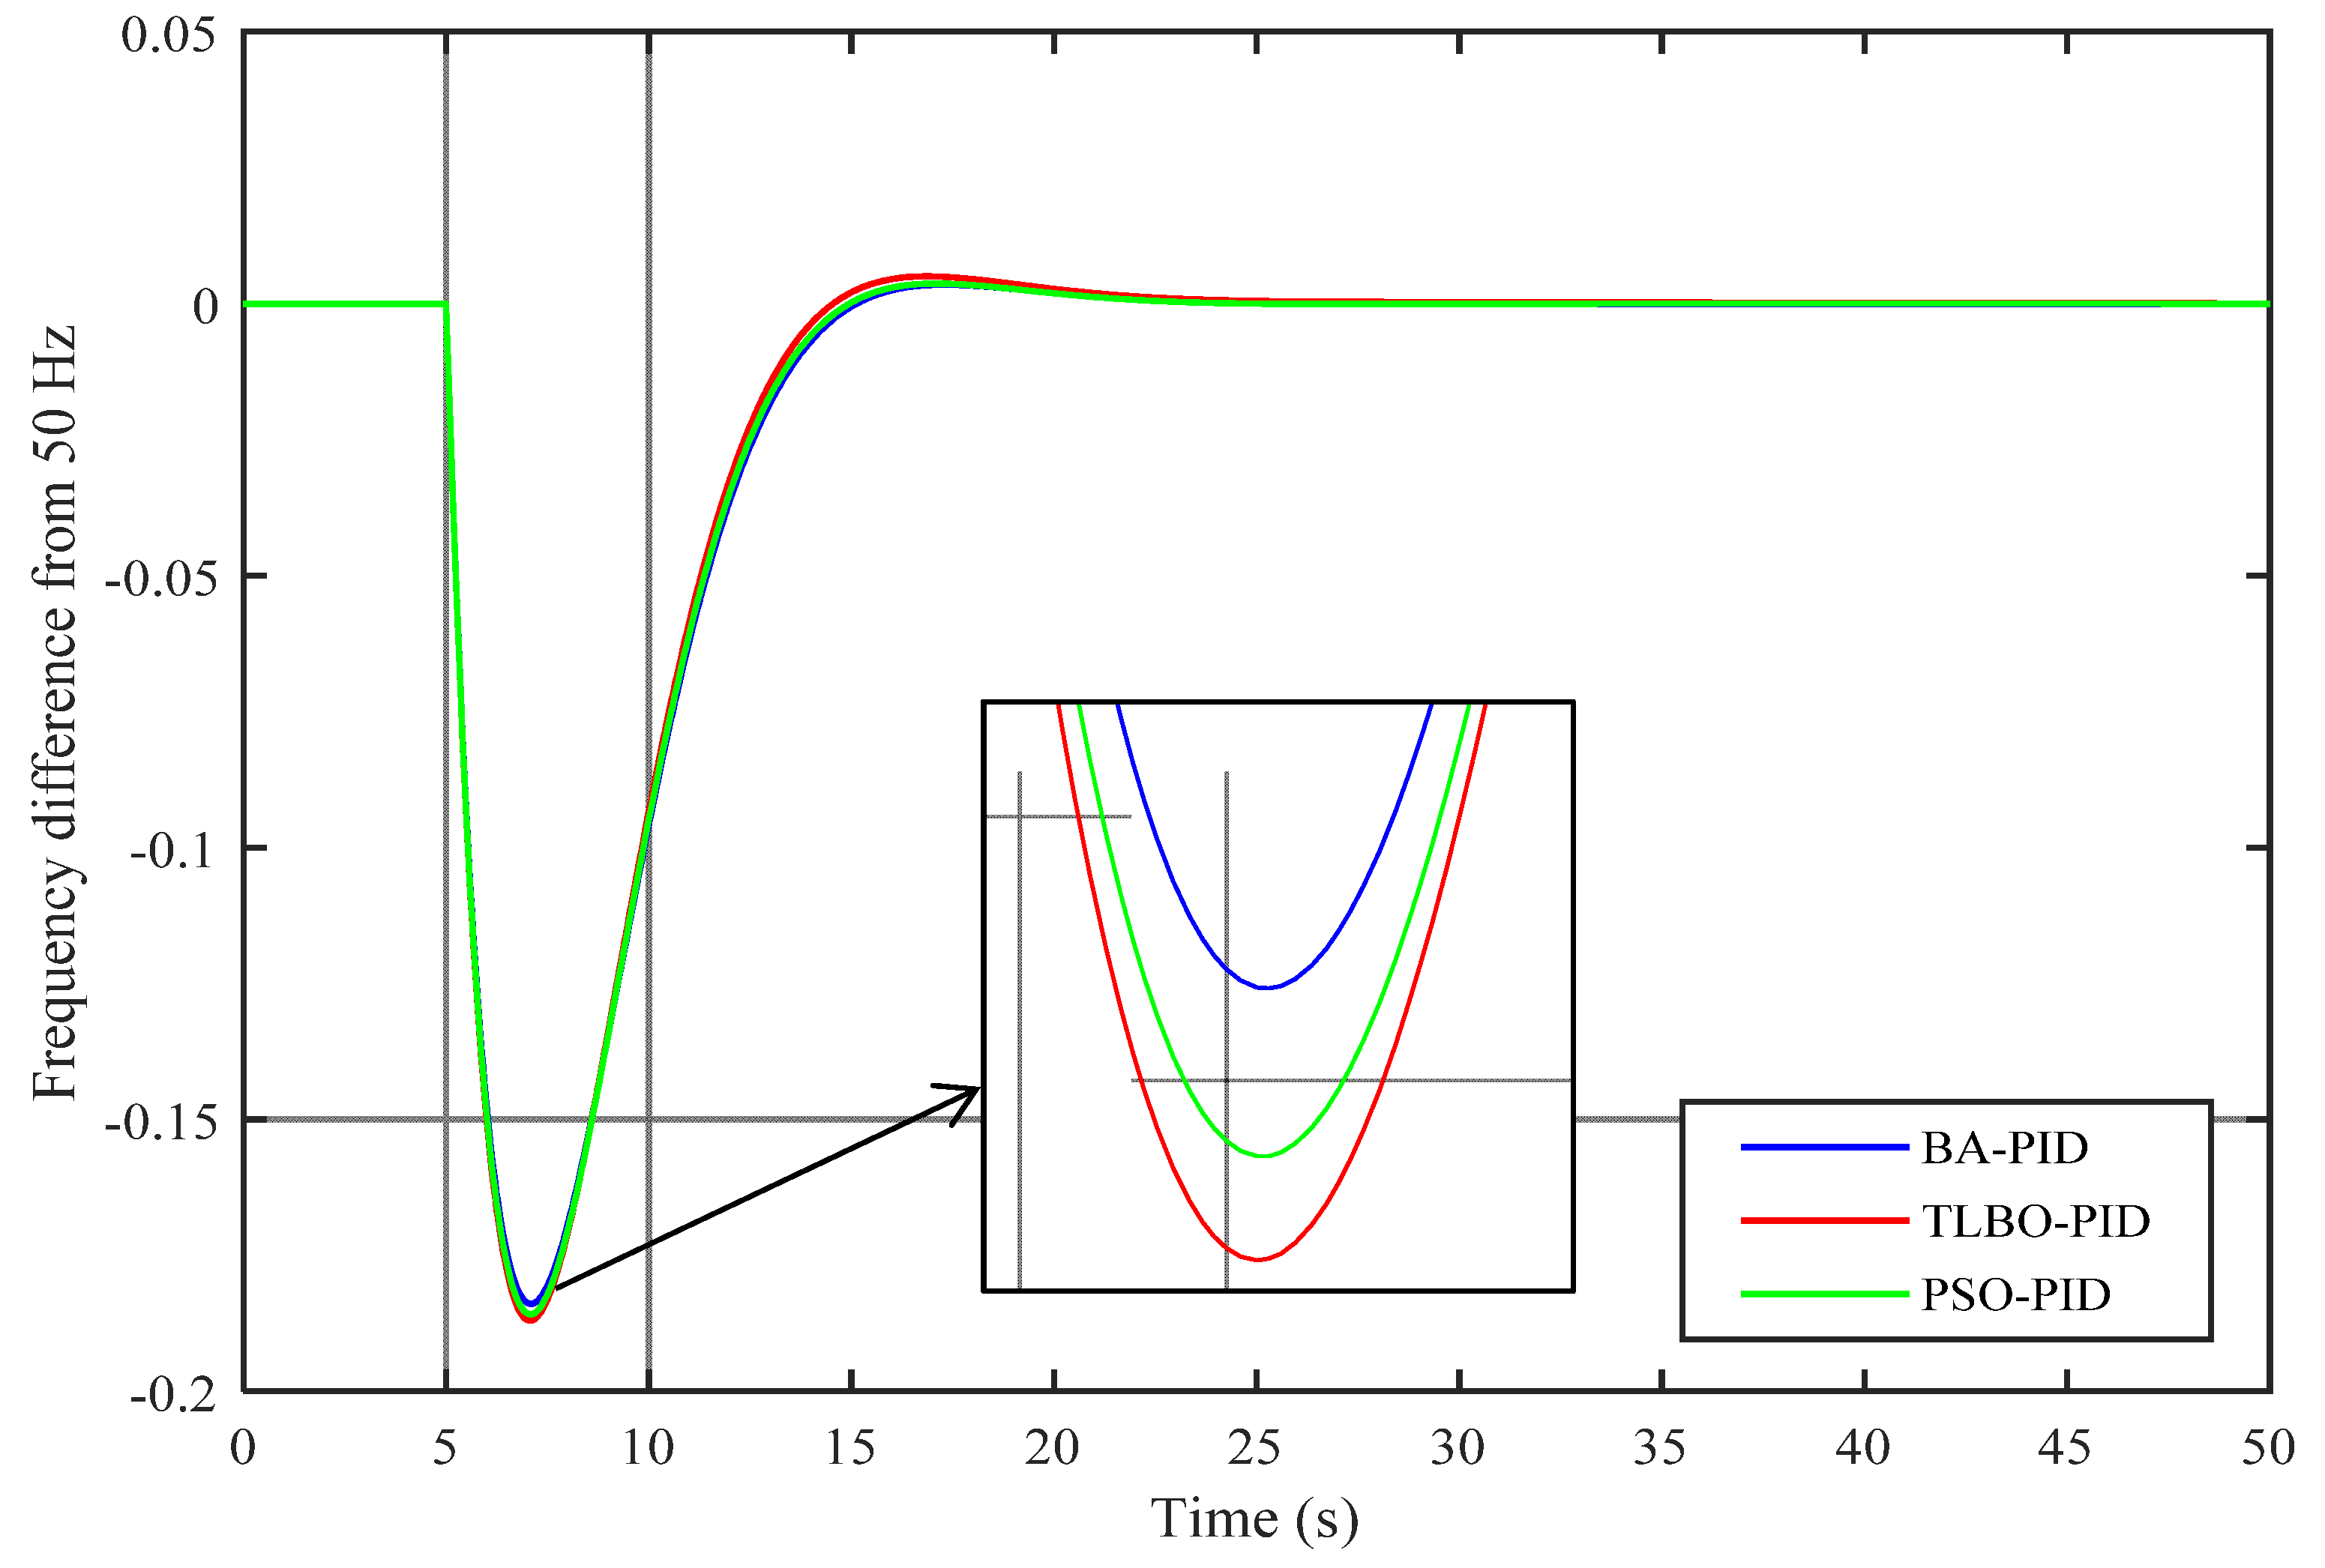
Designs 05 00050 g006
Figure 7. Change in frequency in the GB power system for 0.035 pu load disturbance with tuned PID-based ITAE.
Designs 05 00050 g007
Figure 8. Change in frequency in the GB power system for 0.035 pu load disturbance with tuned FOPID-based ISE.
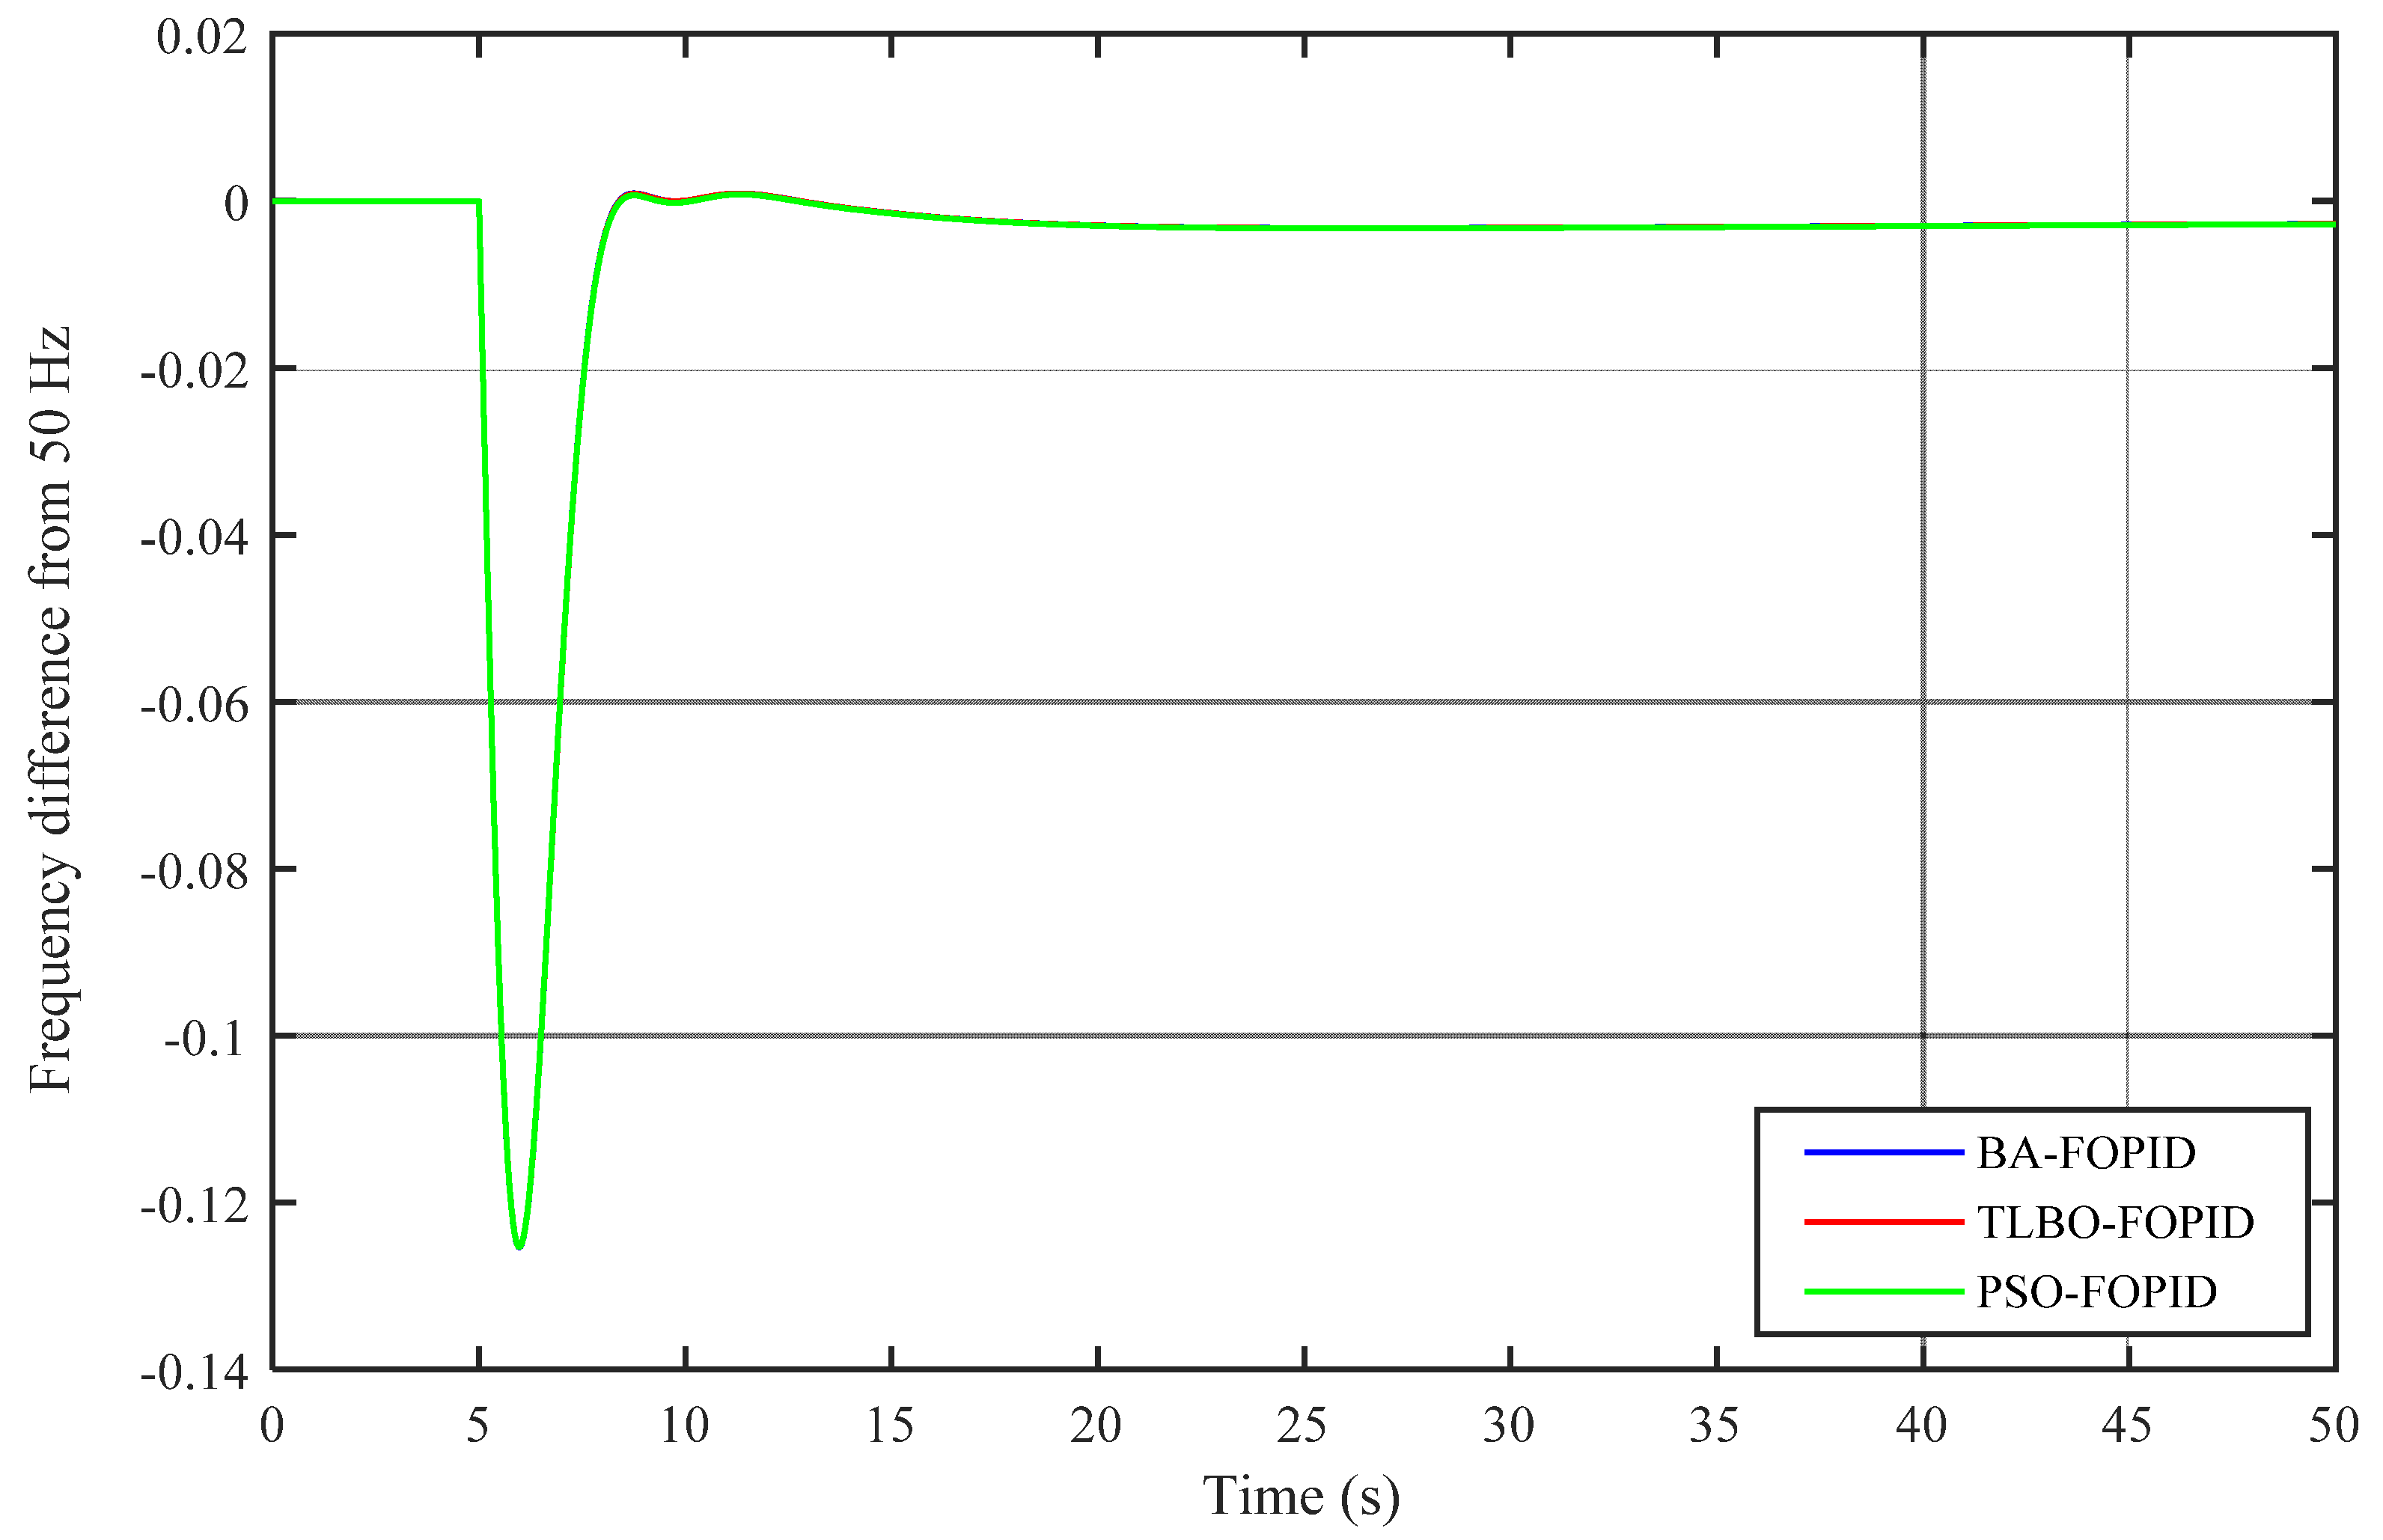
Designs 05 00050 g008
Figure 9. Change in frequency in the GB power system for 0.035 pu load disturbance with tuned FOPID-based ITAE.
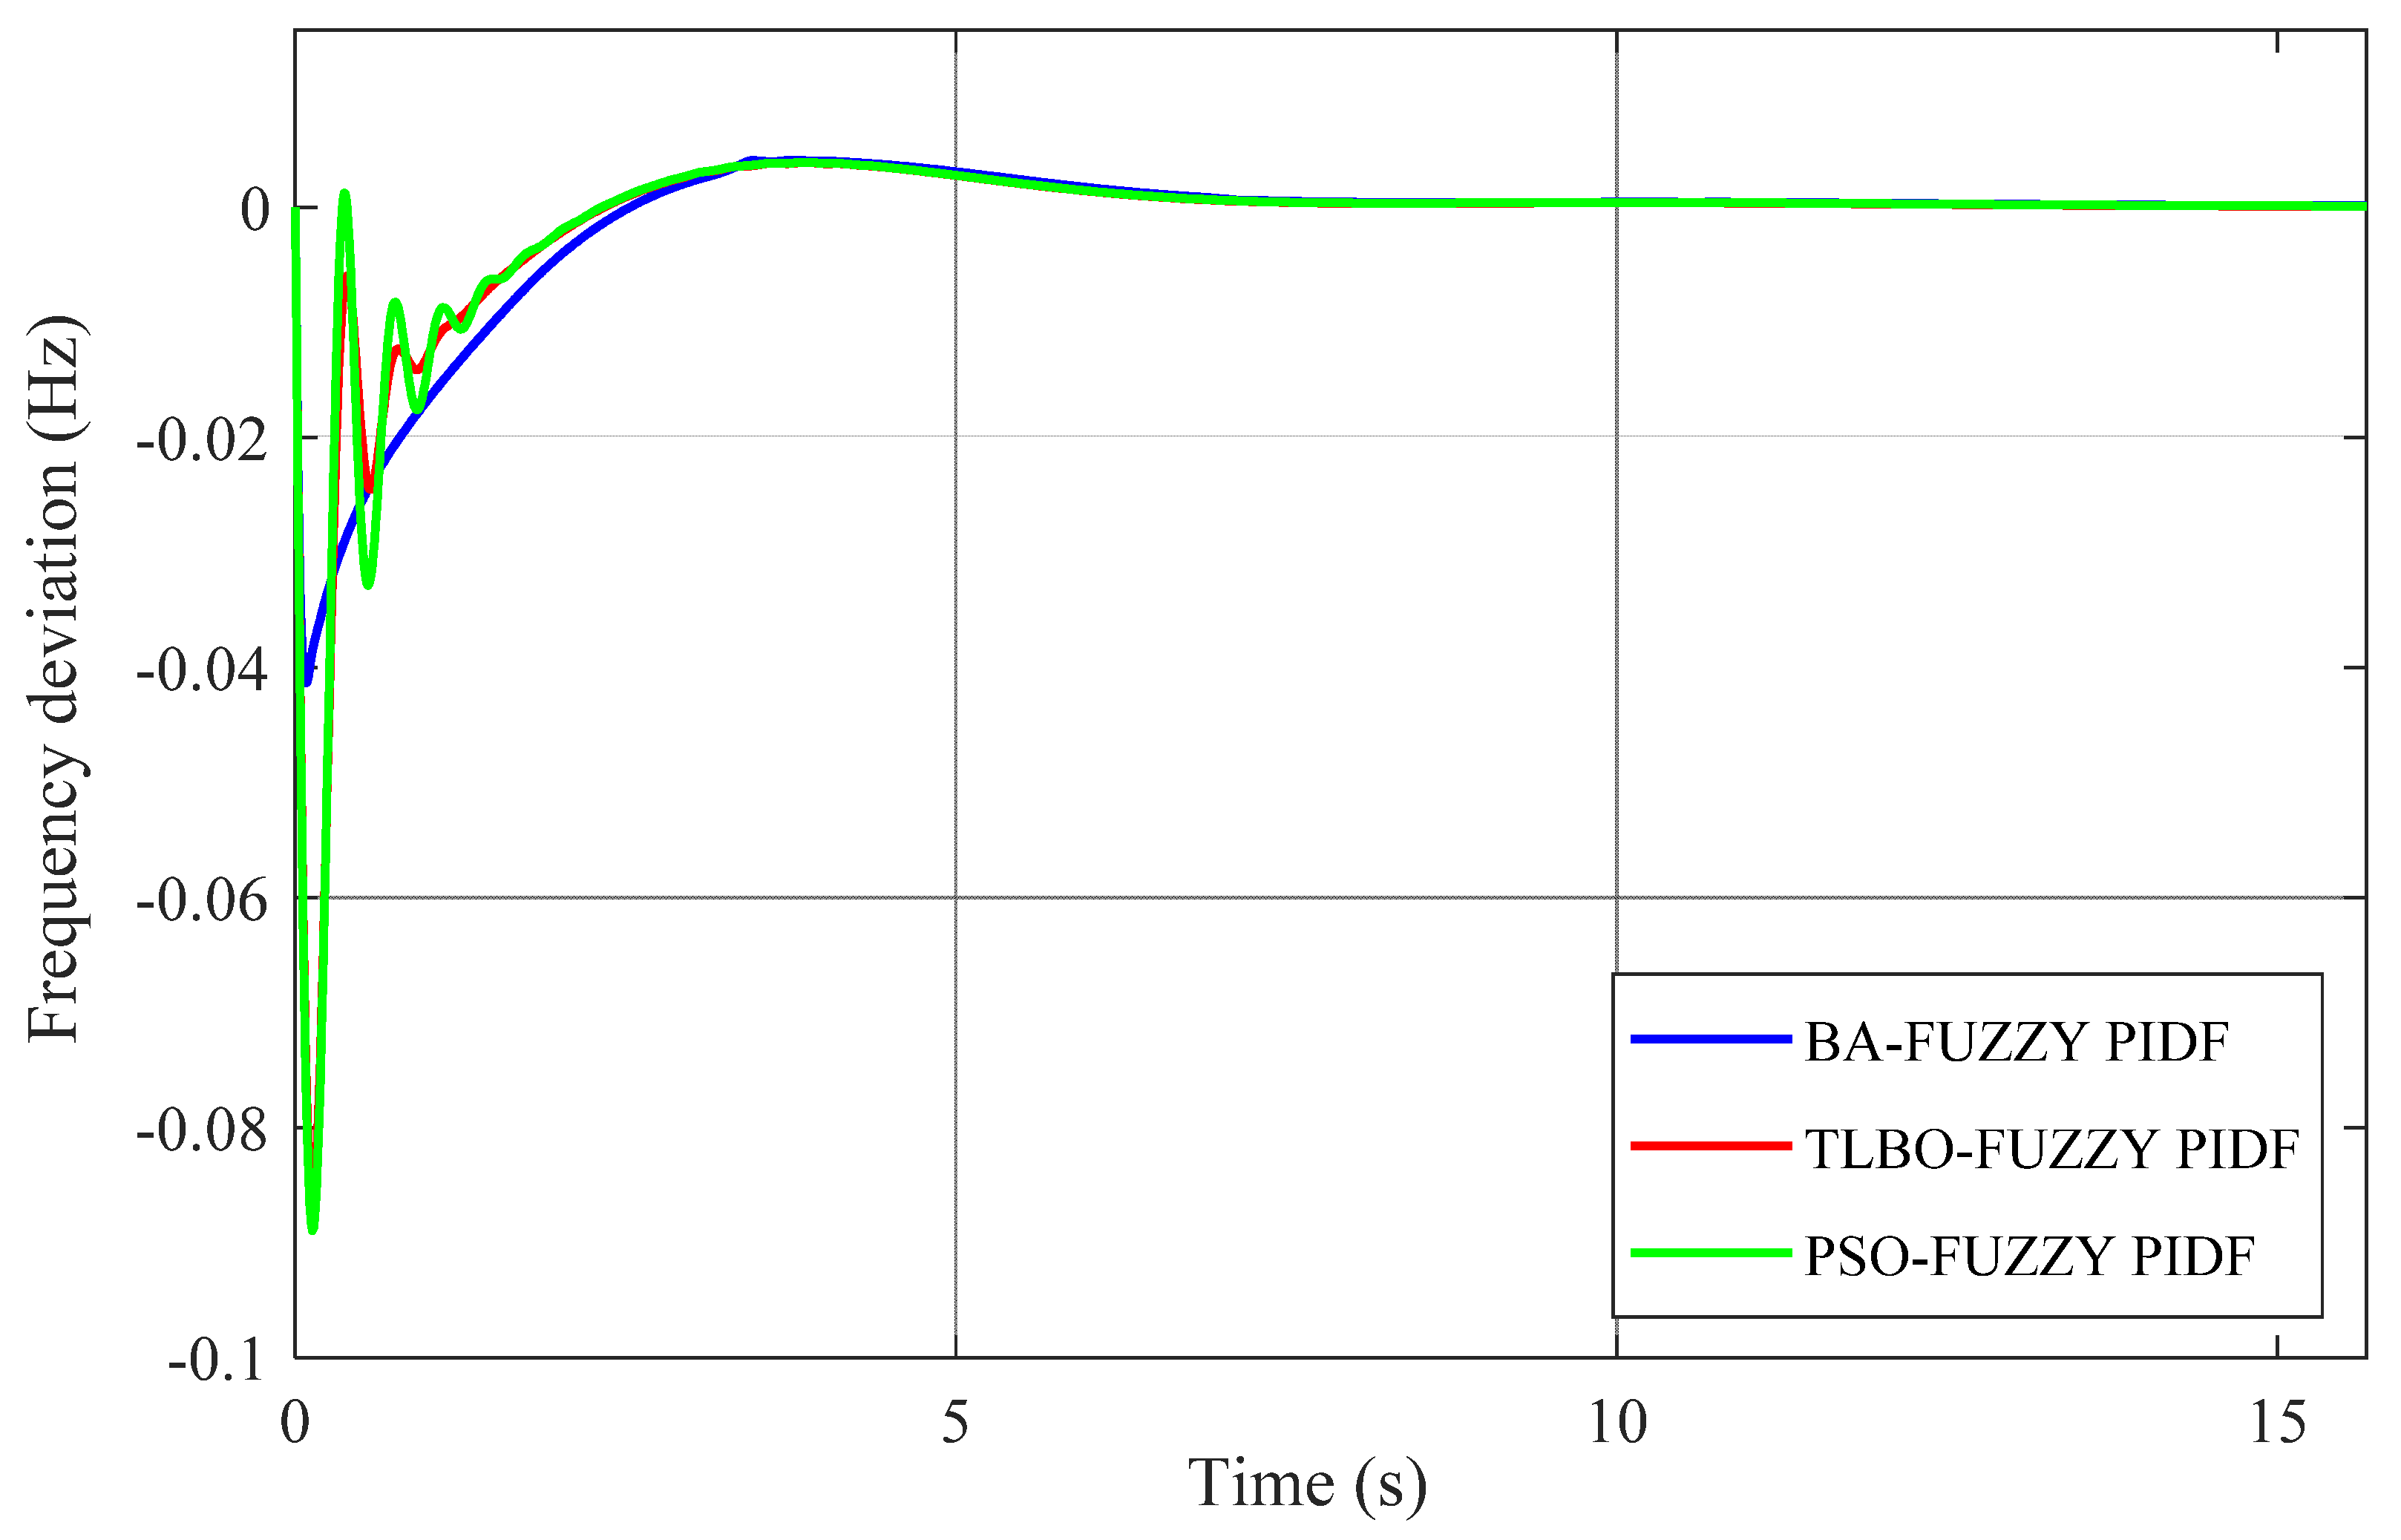
Designs 05 00050 g009
Figure 10. Change in frequency in the GB power system for 0.035 pu load disturbance with tuned Fuzzy PIDF-based ISE.
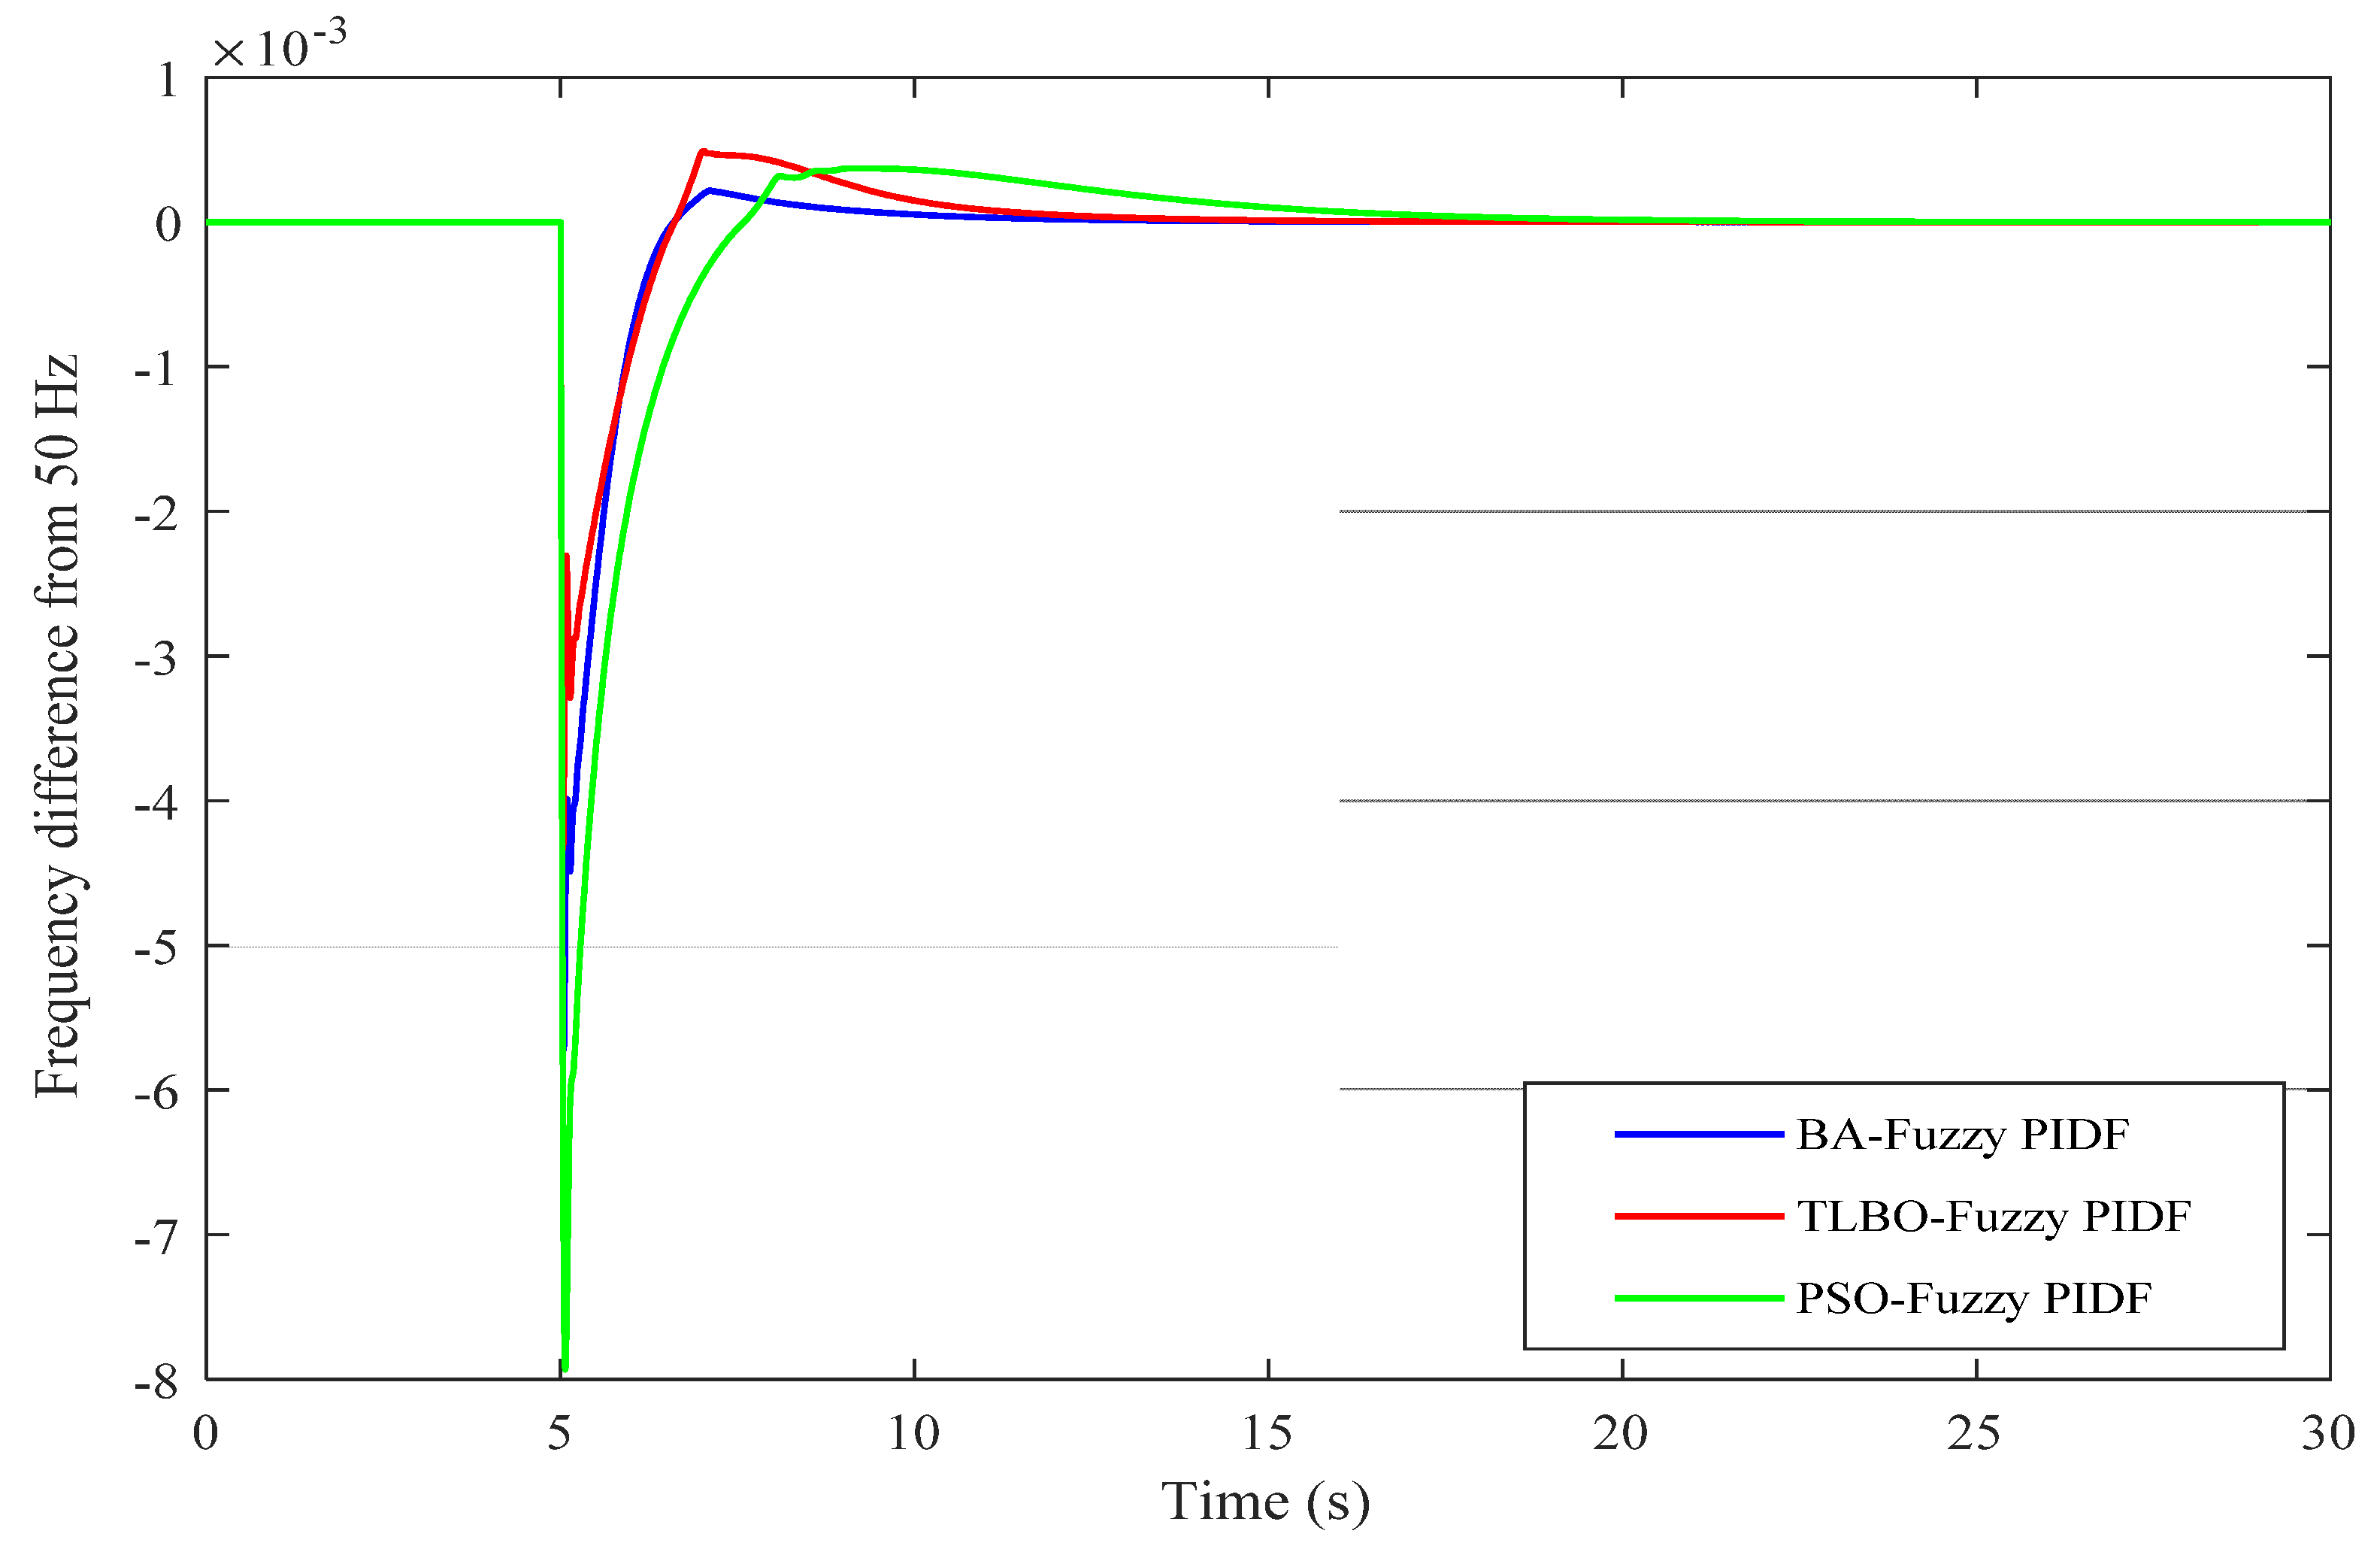
Designs 05 00050 g010
Figure 11. Change in frequency in the GB power system for 0.035 pu load disturbance with tuned Fuzzy PIDF-based ITAE.
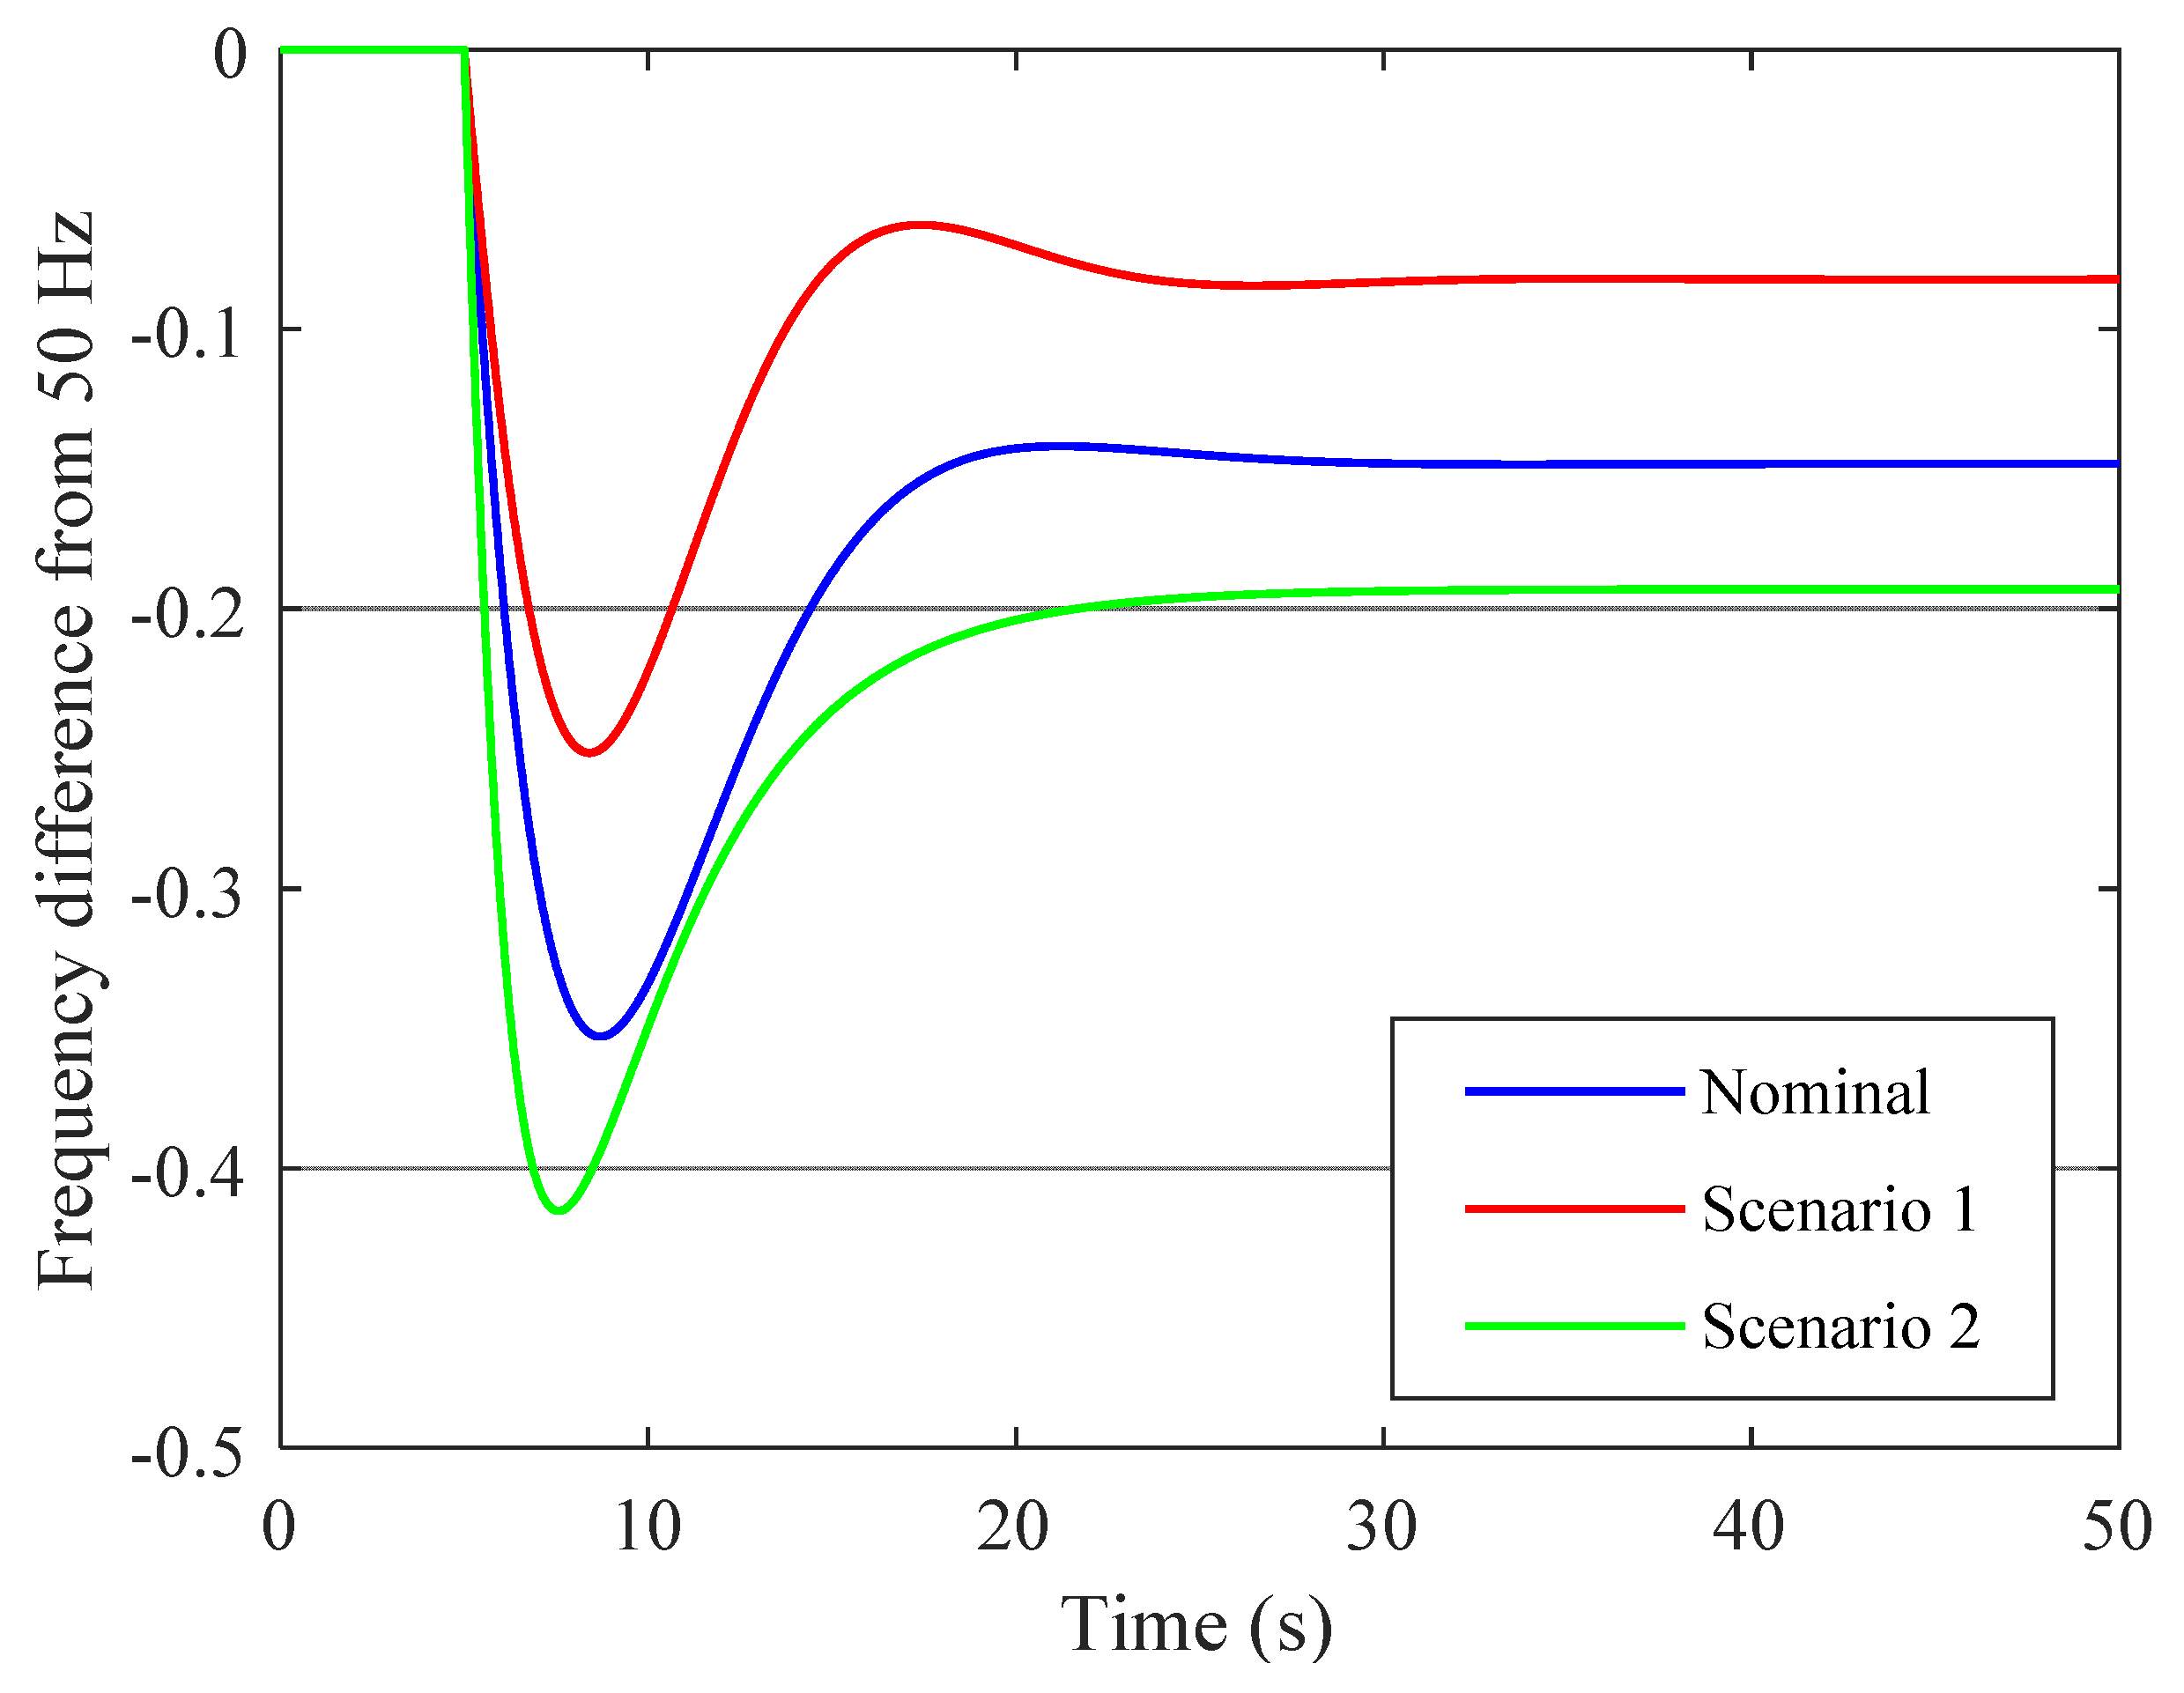
Designs 05 00050 g011
Figure 12. Comparison of the dynamic response of GB power model with parameter uncertainties of scenarios 1 and 2 with no secondary control loop.
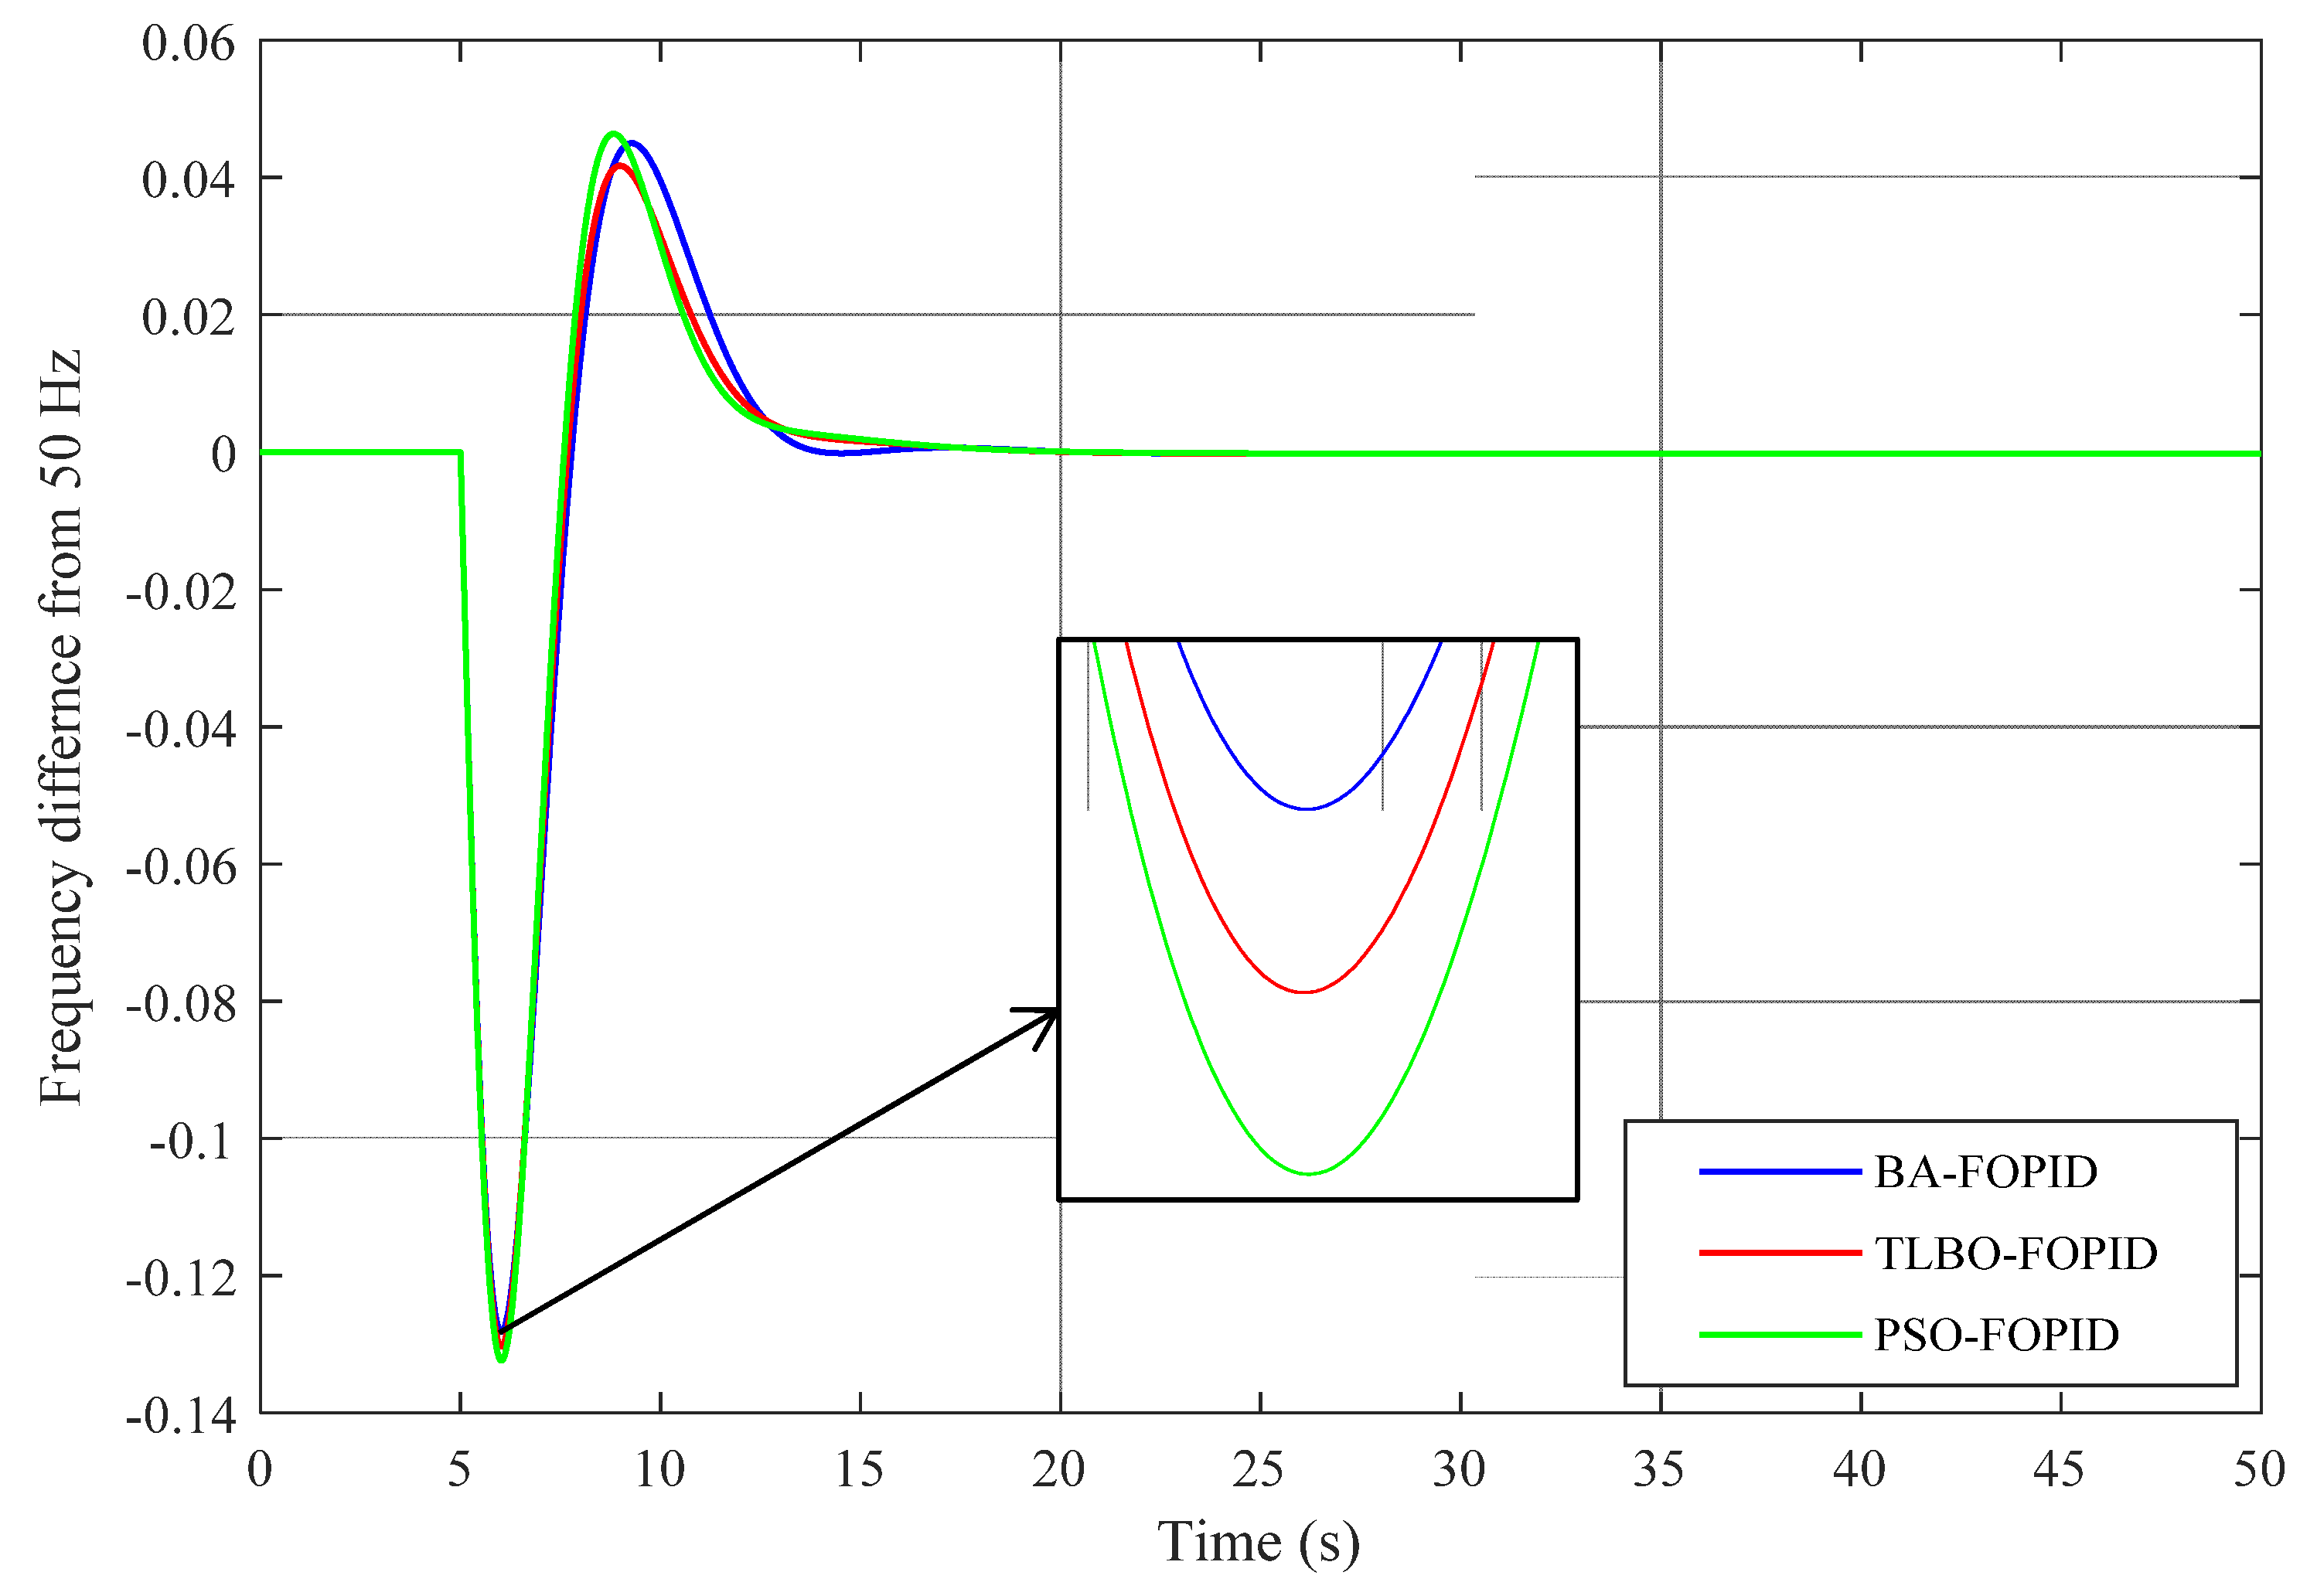
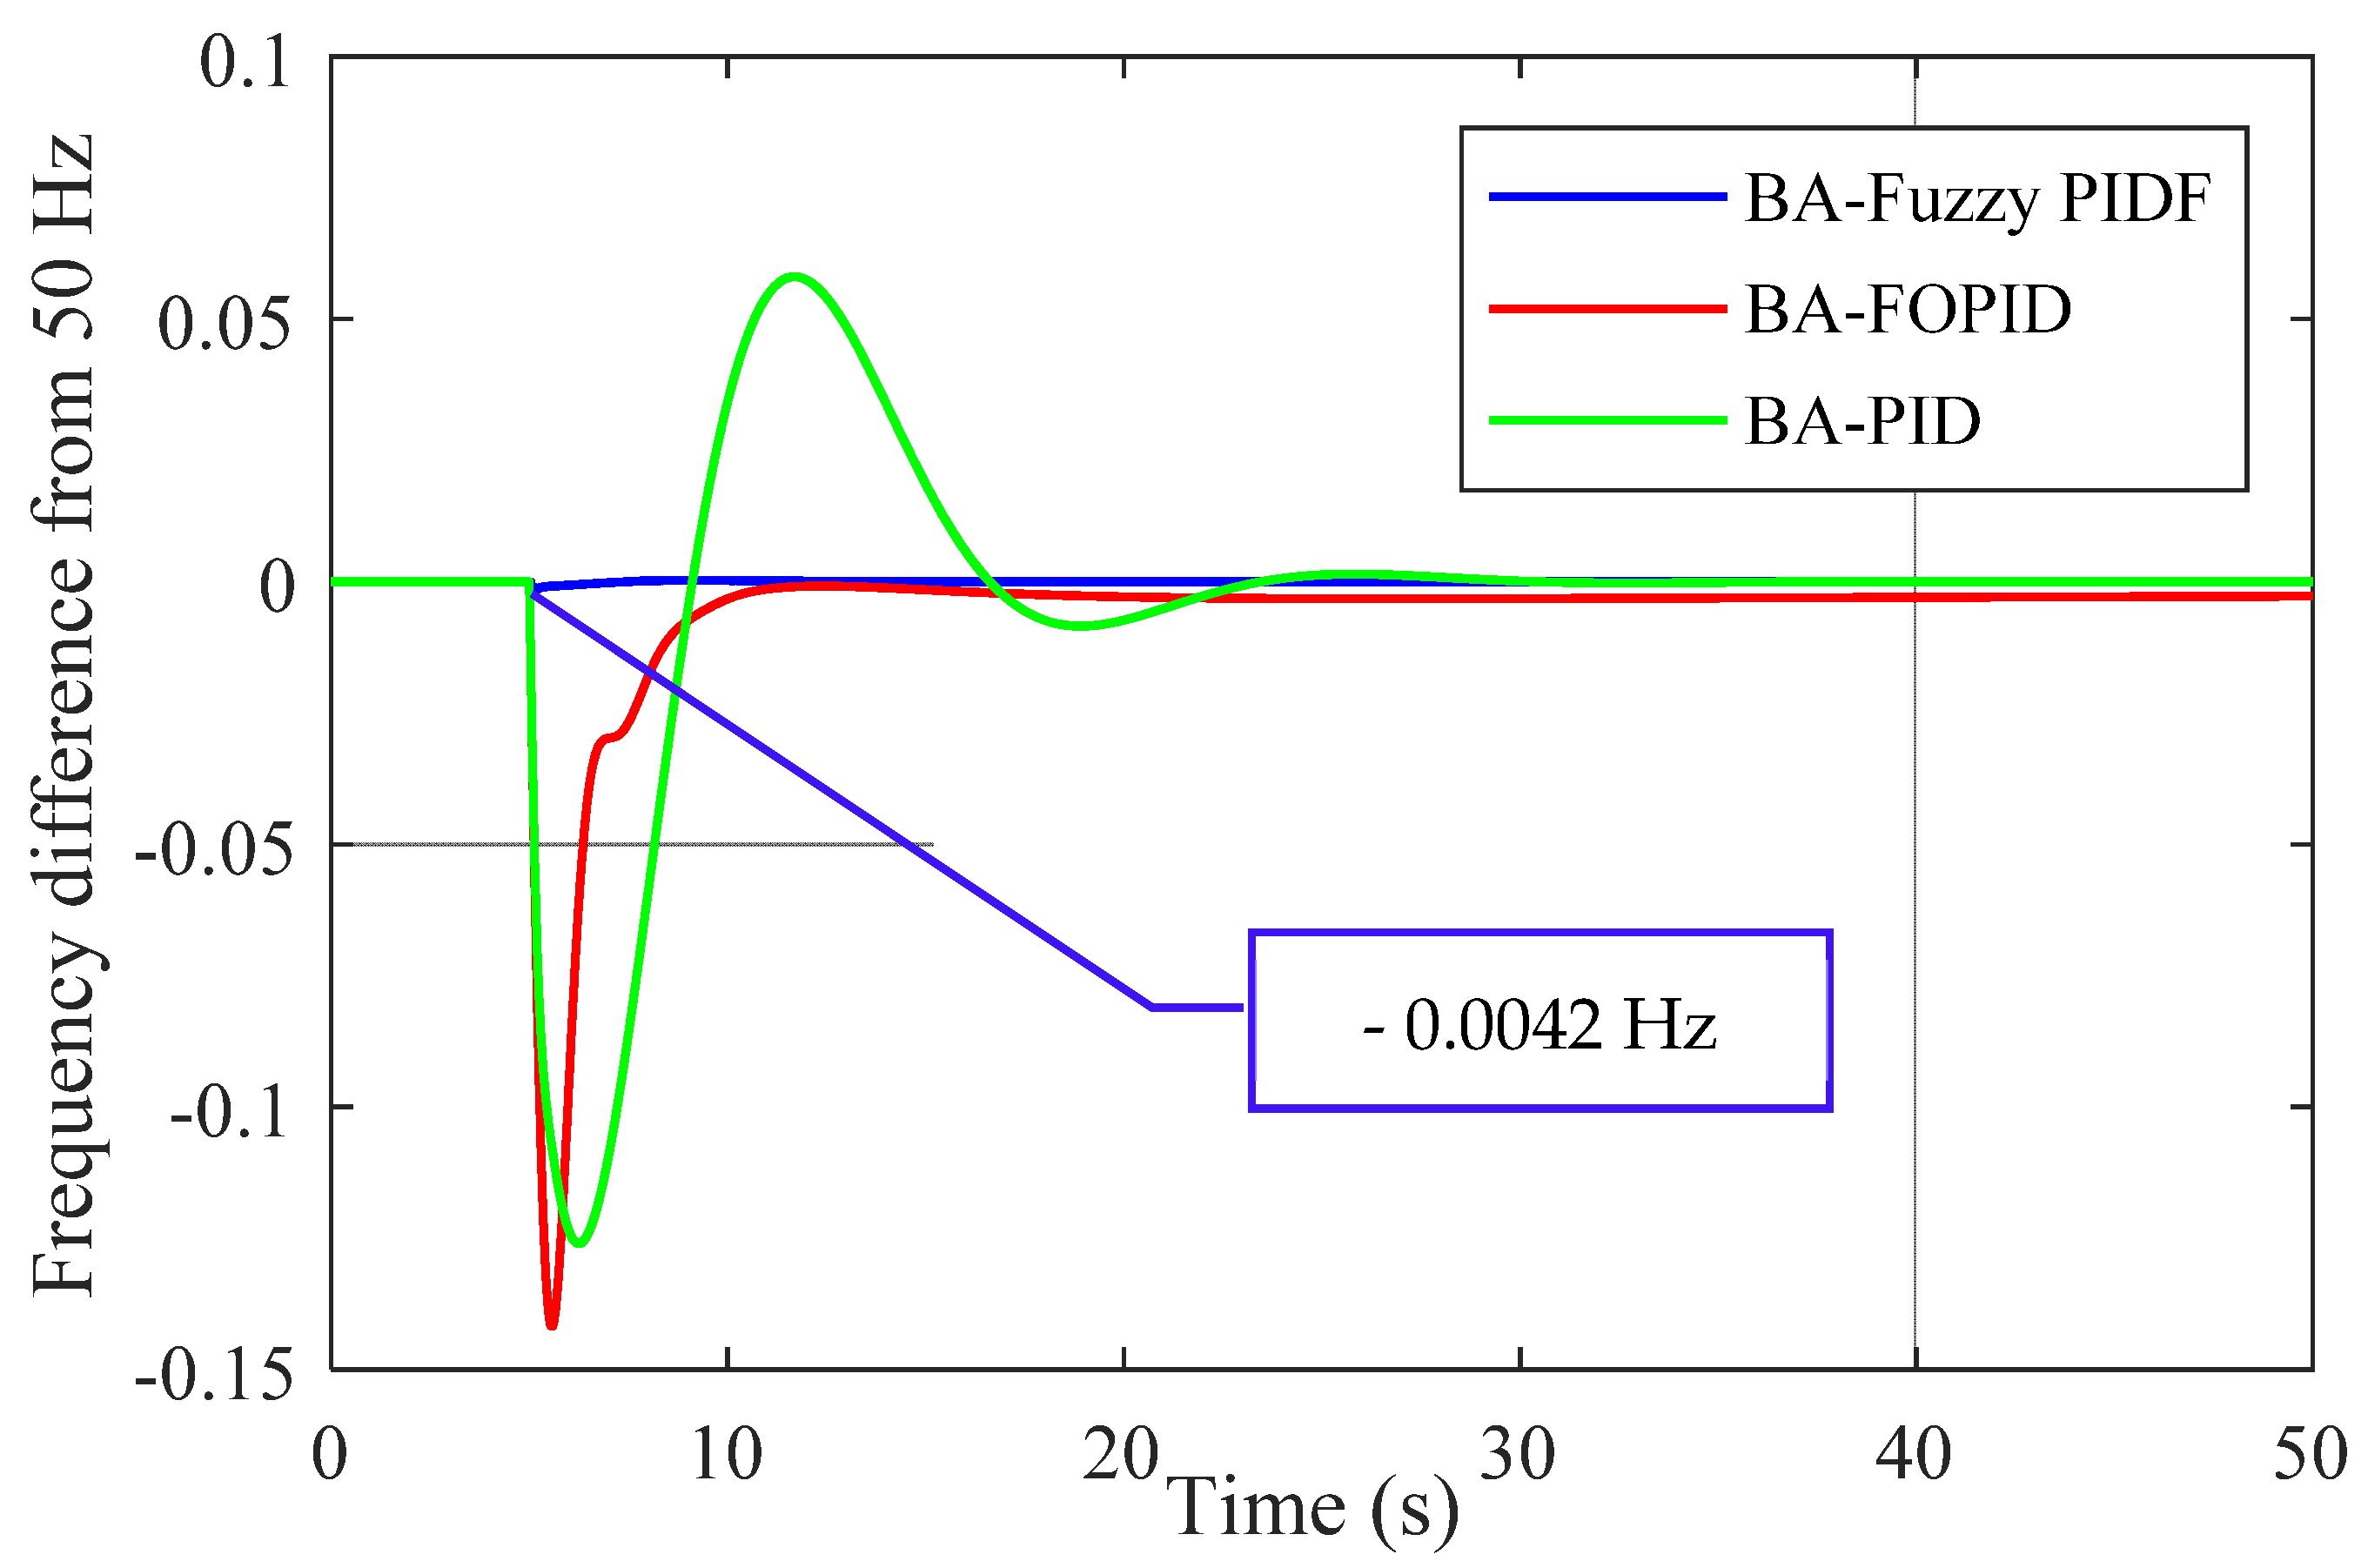
Designs 05 00050 g012
Figure 13. Comparison of three controllers tuned by BA based on ISE for scenario 2.
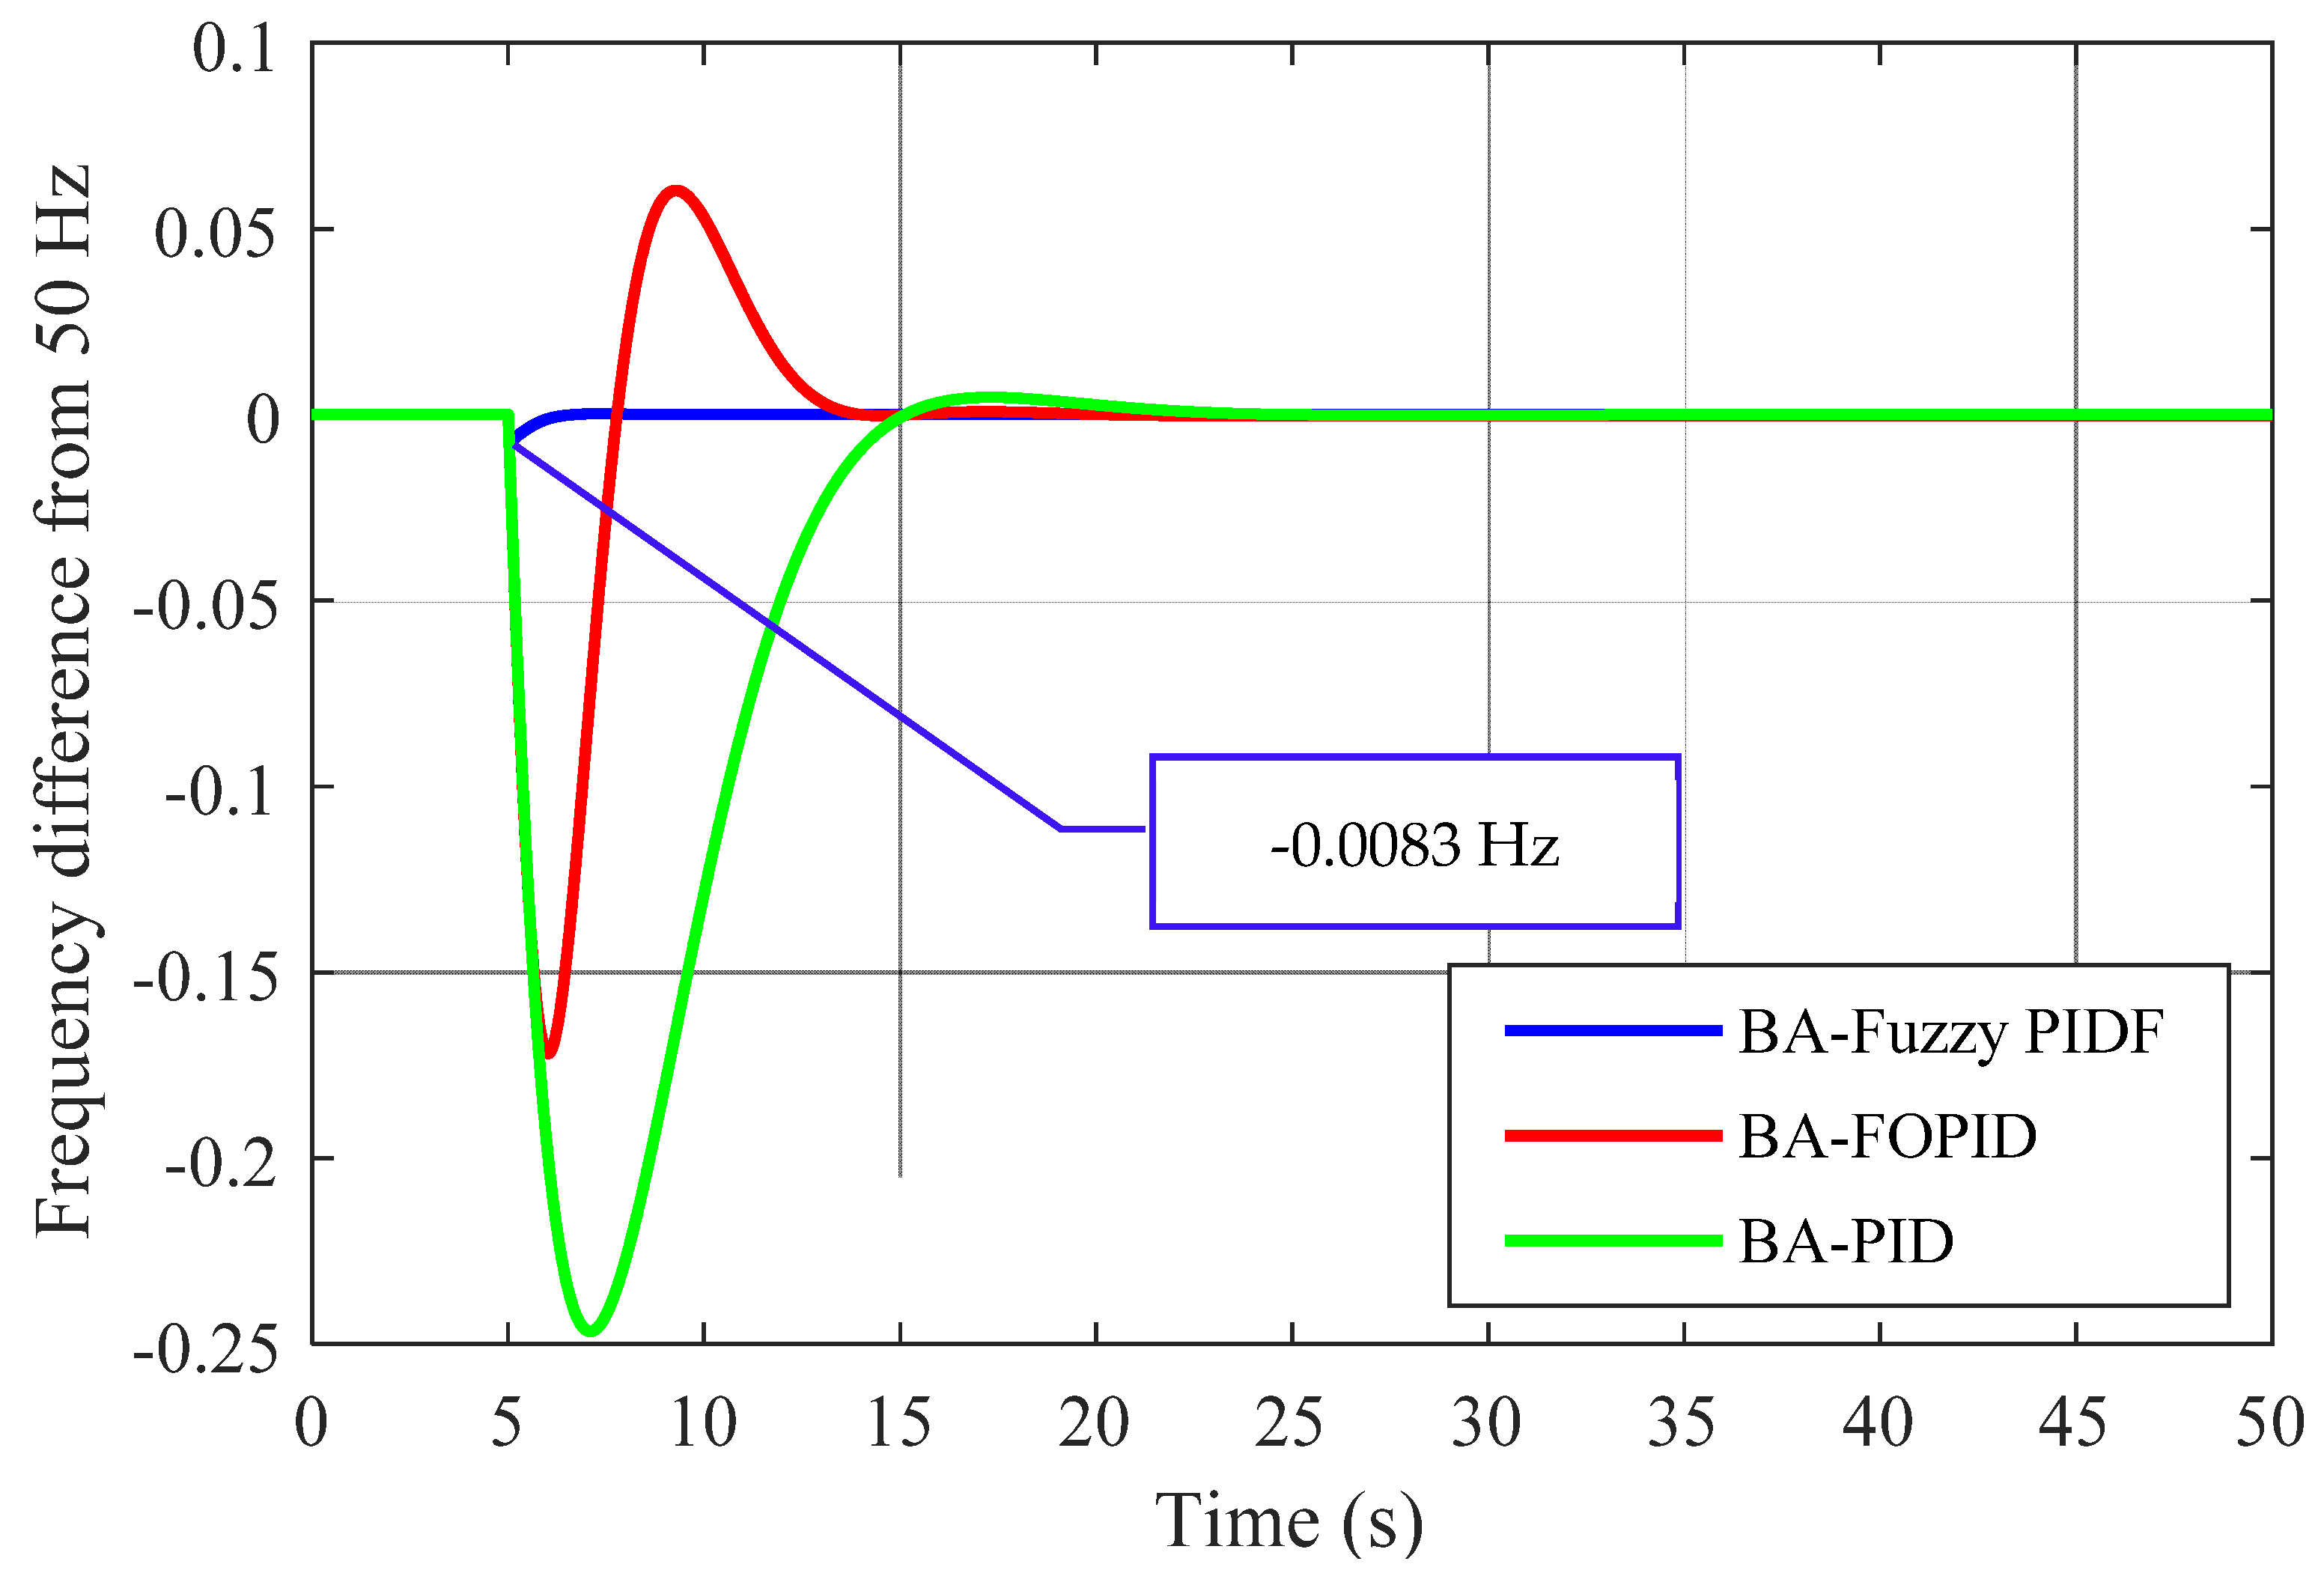
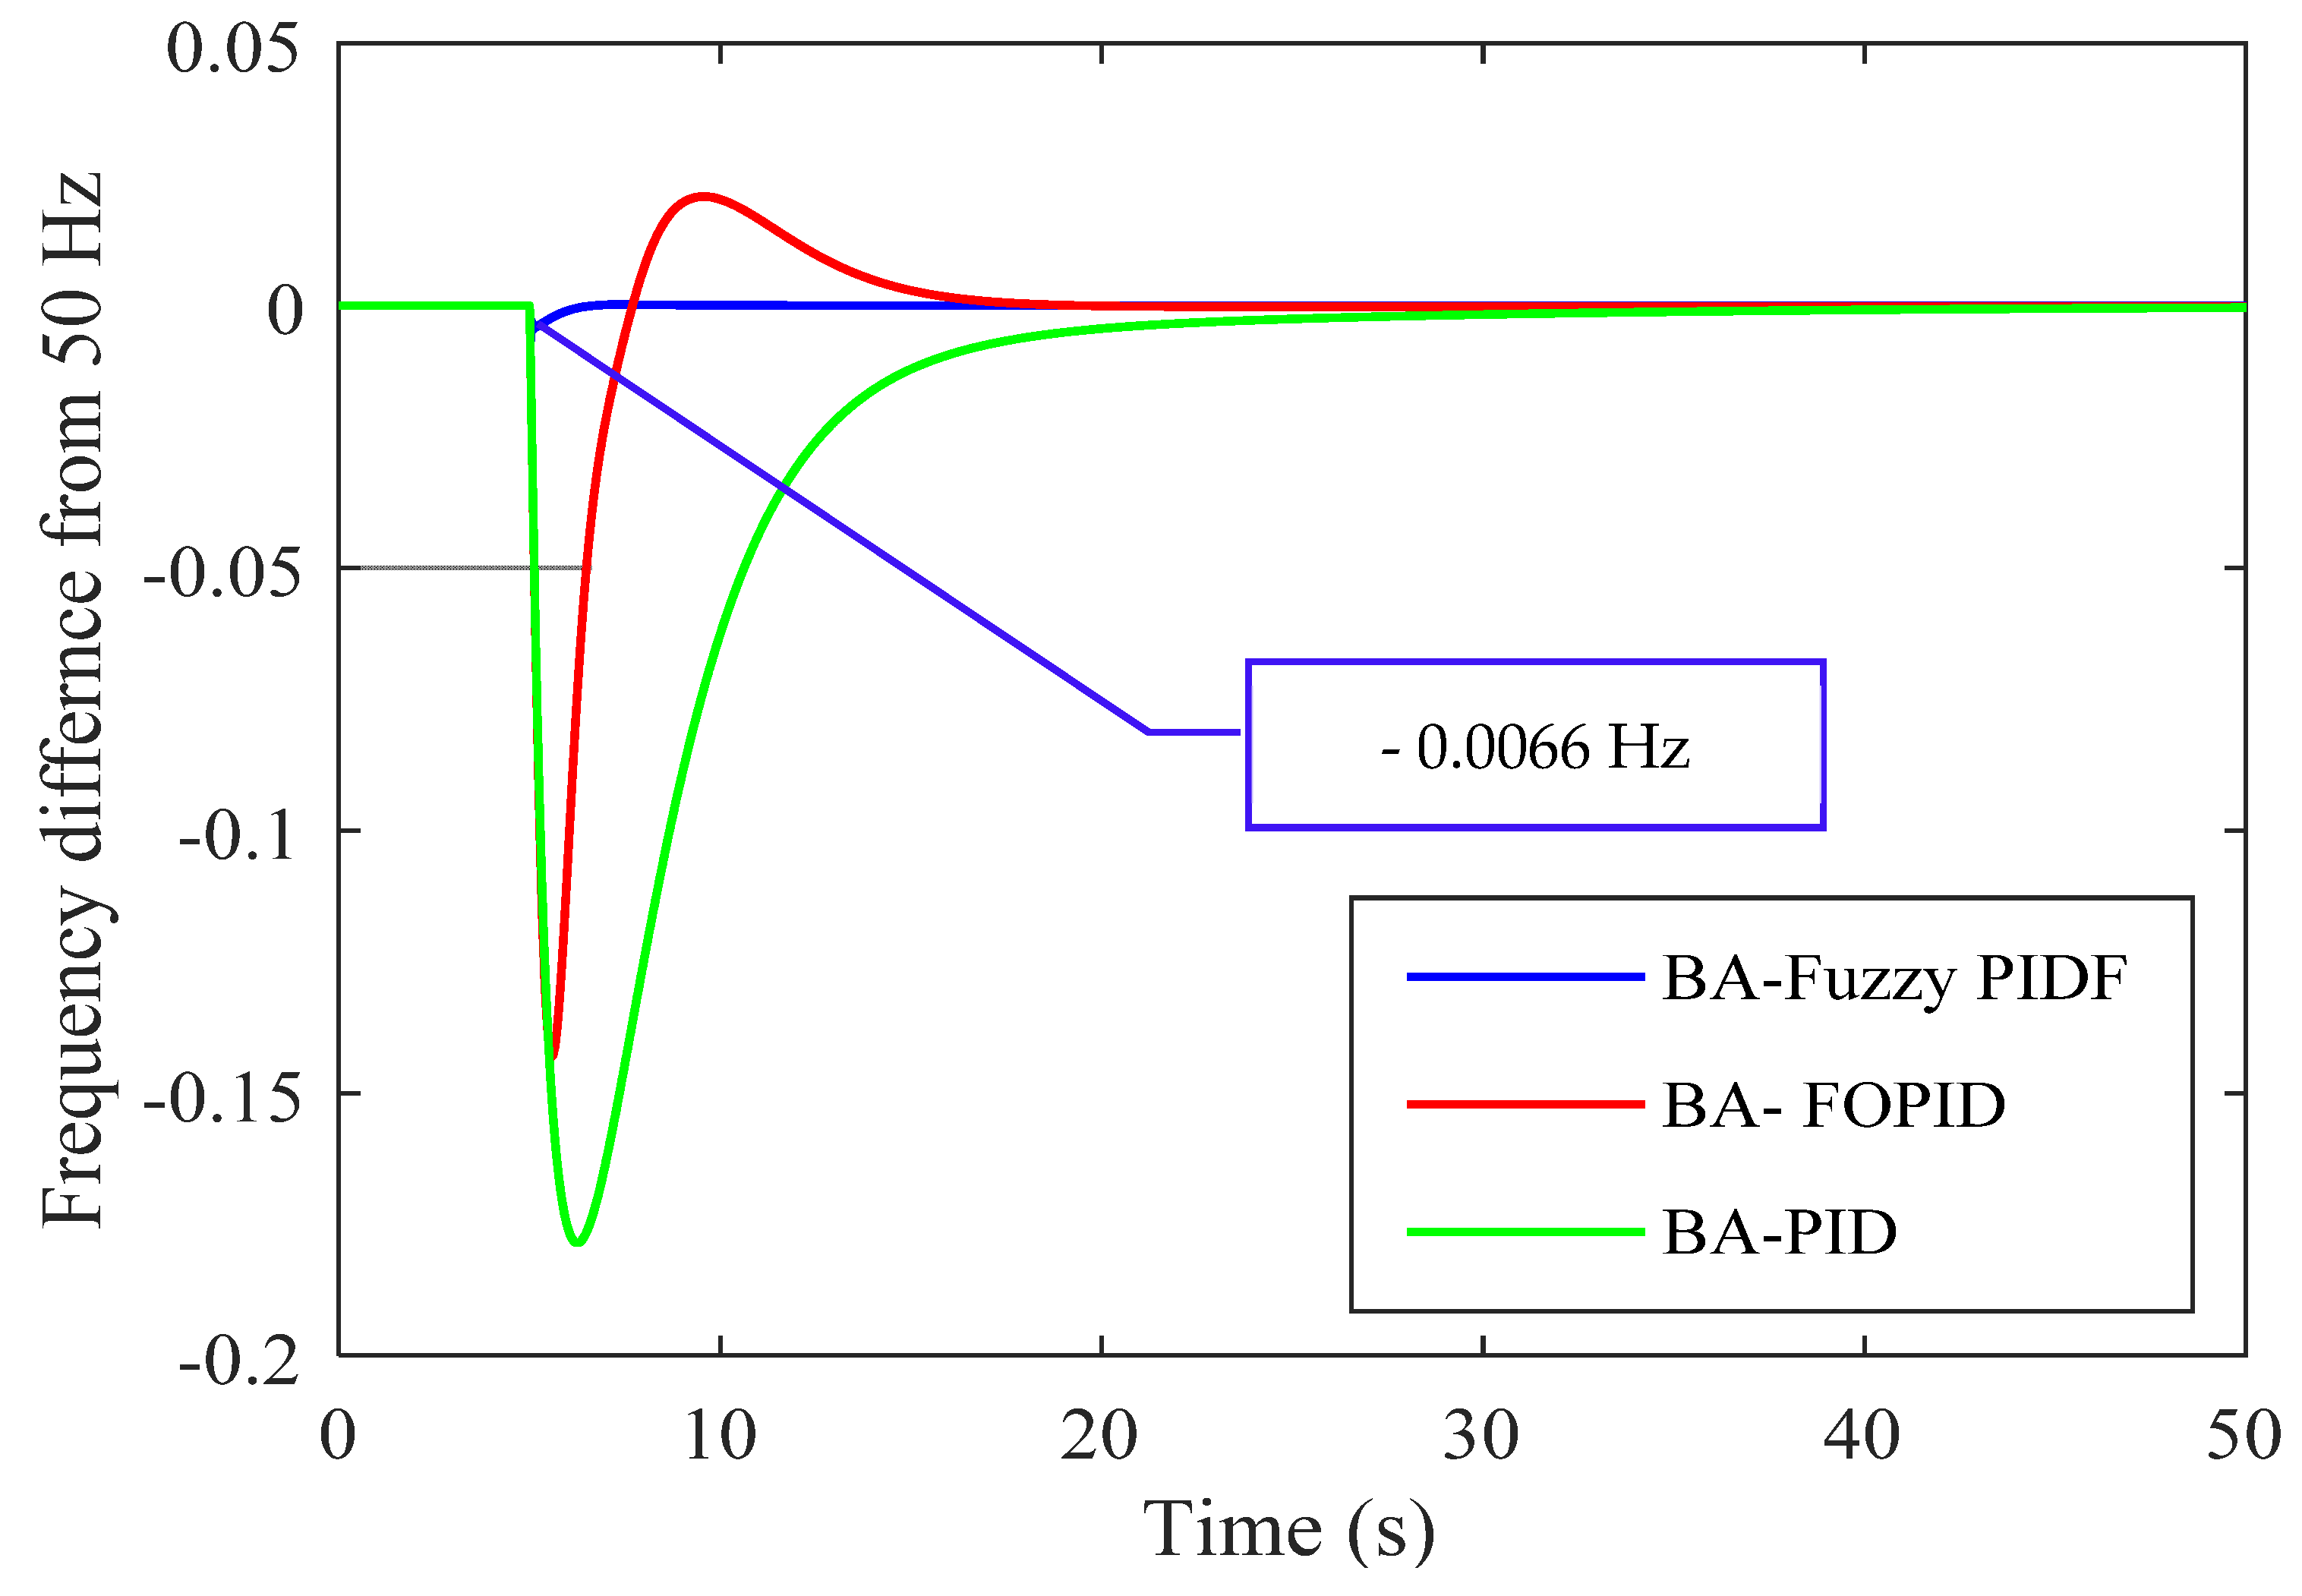
Designs 05 00050 g013
Figure 14. Comparison of three controllers tuned by BA based on ITAE for scenario 2.
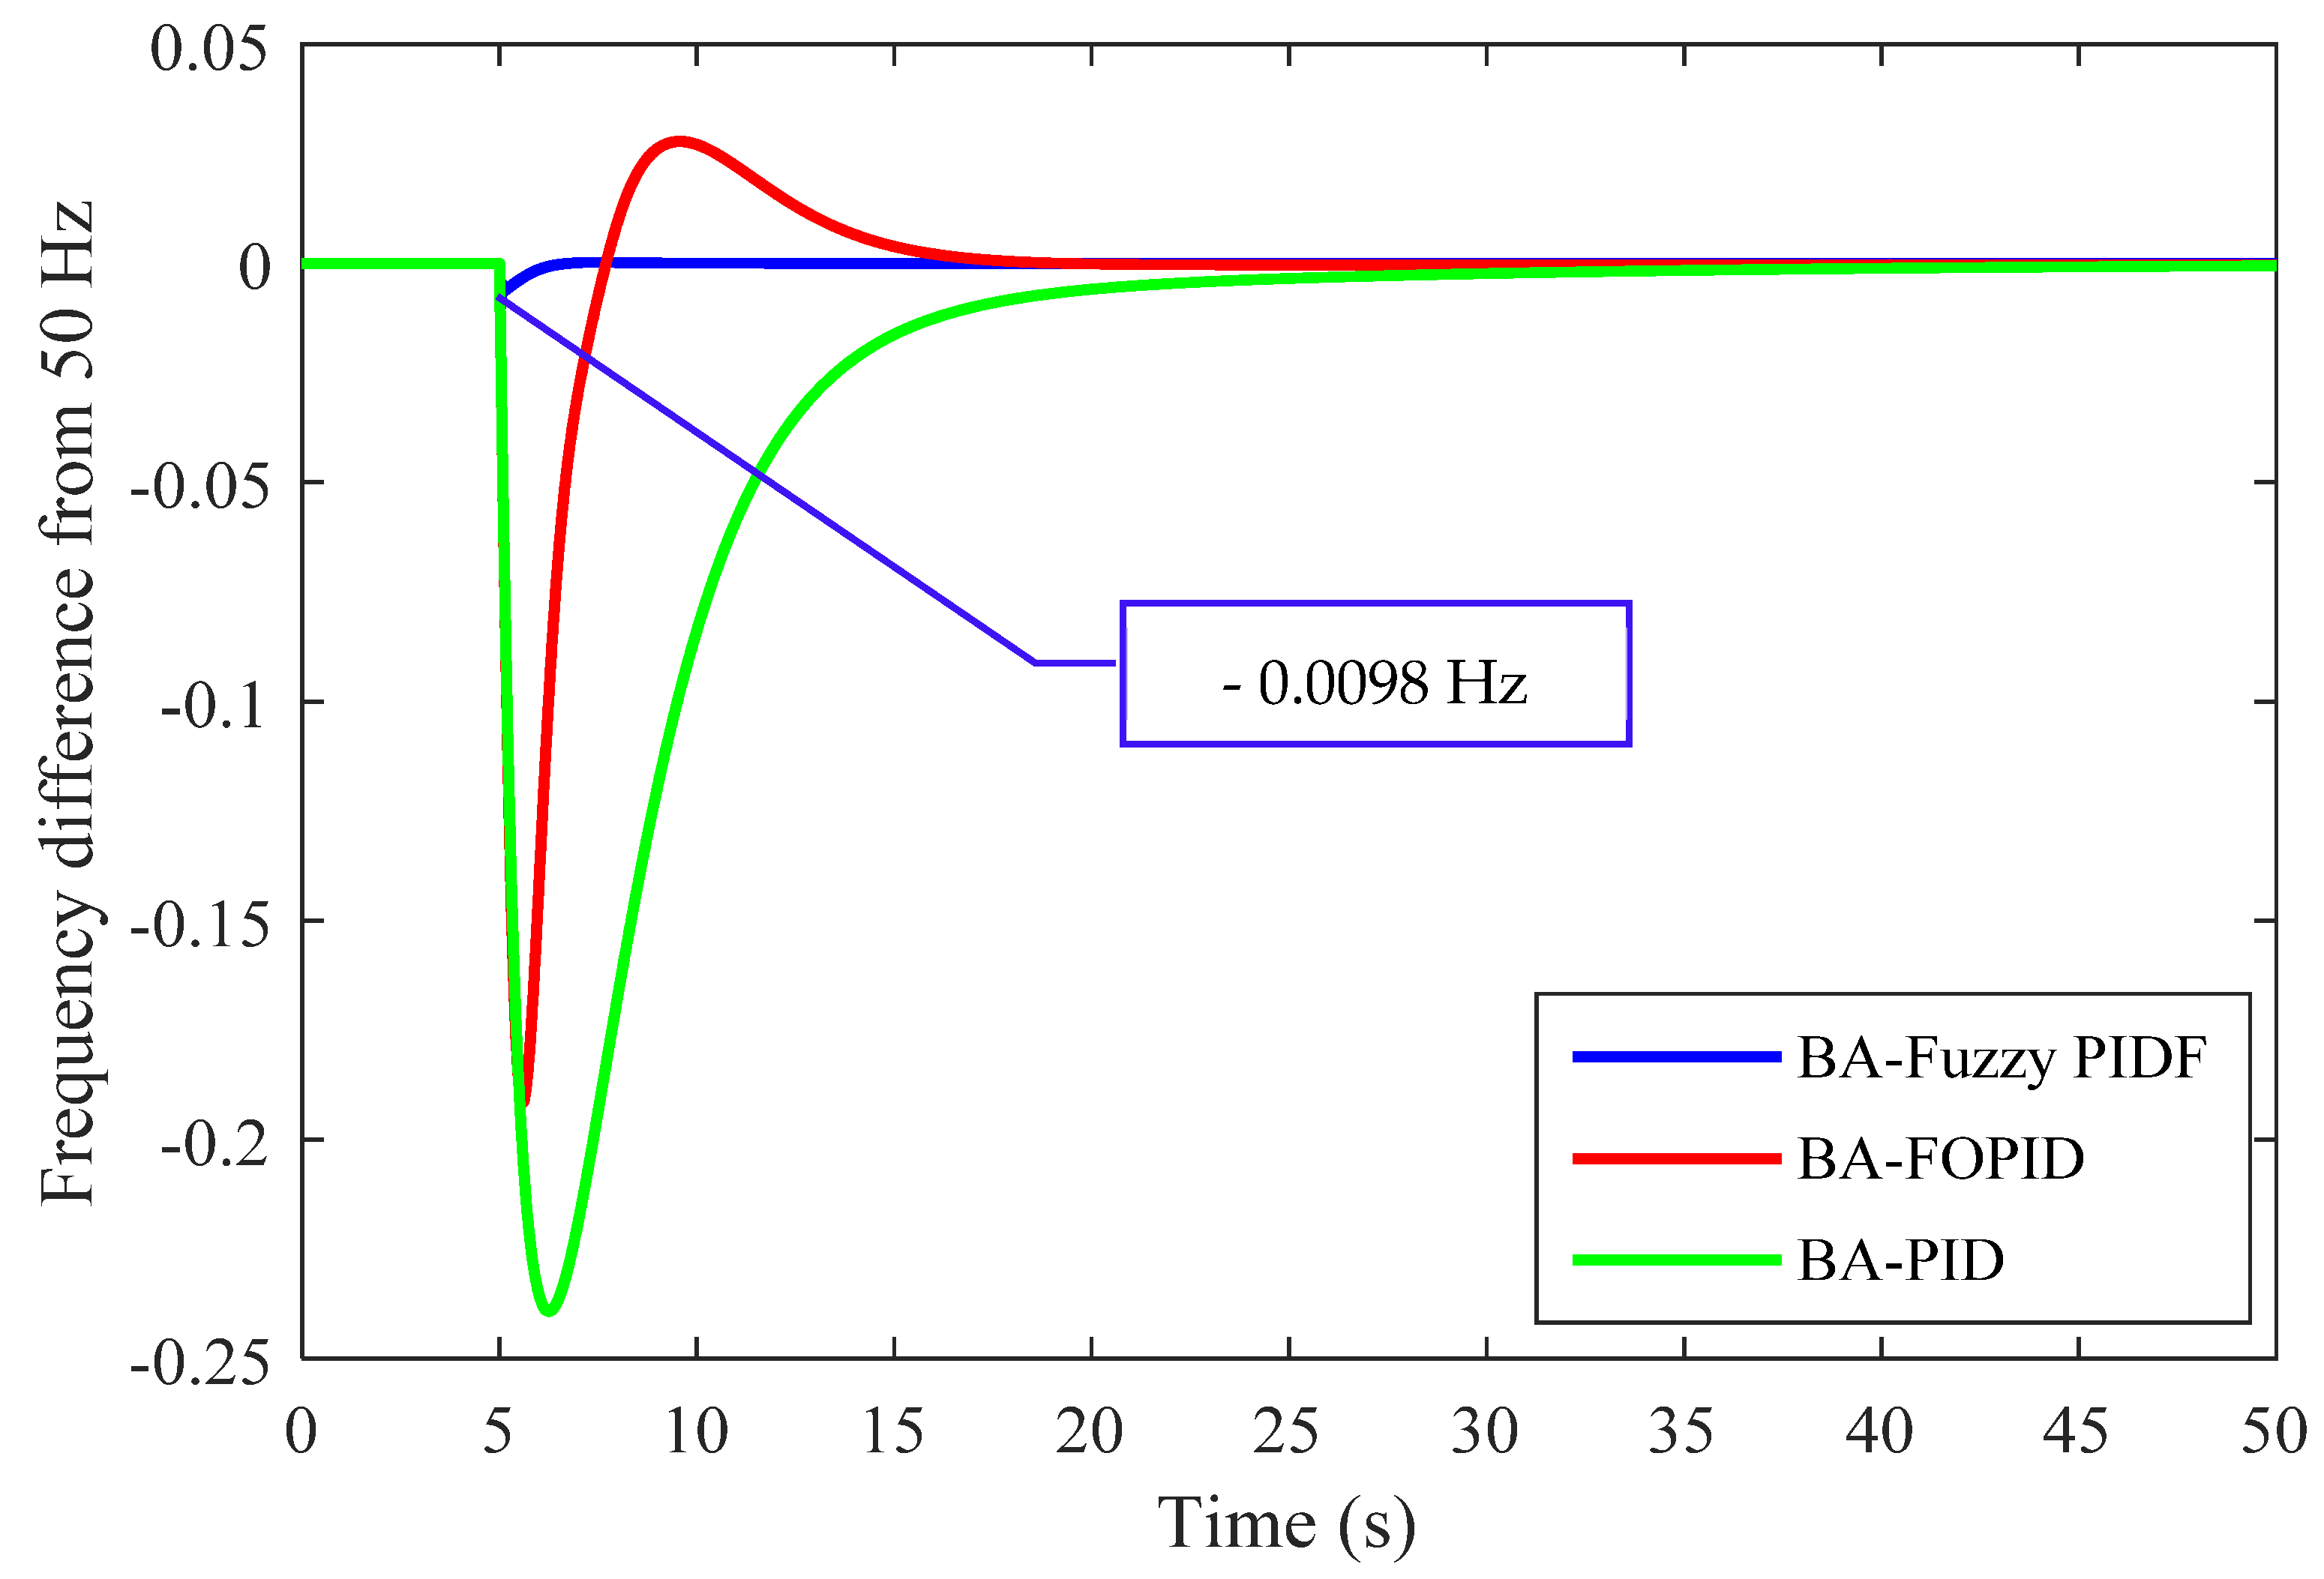
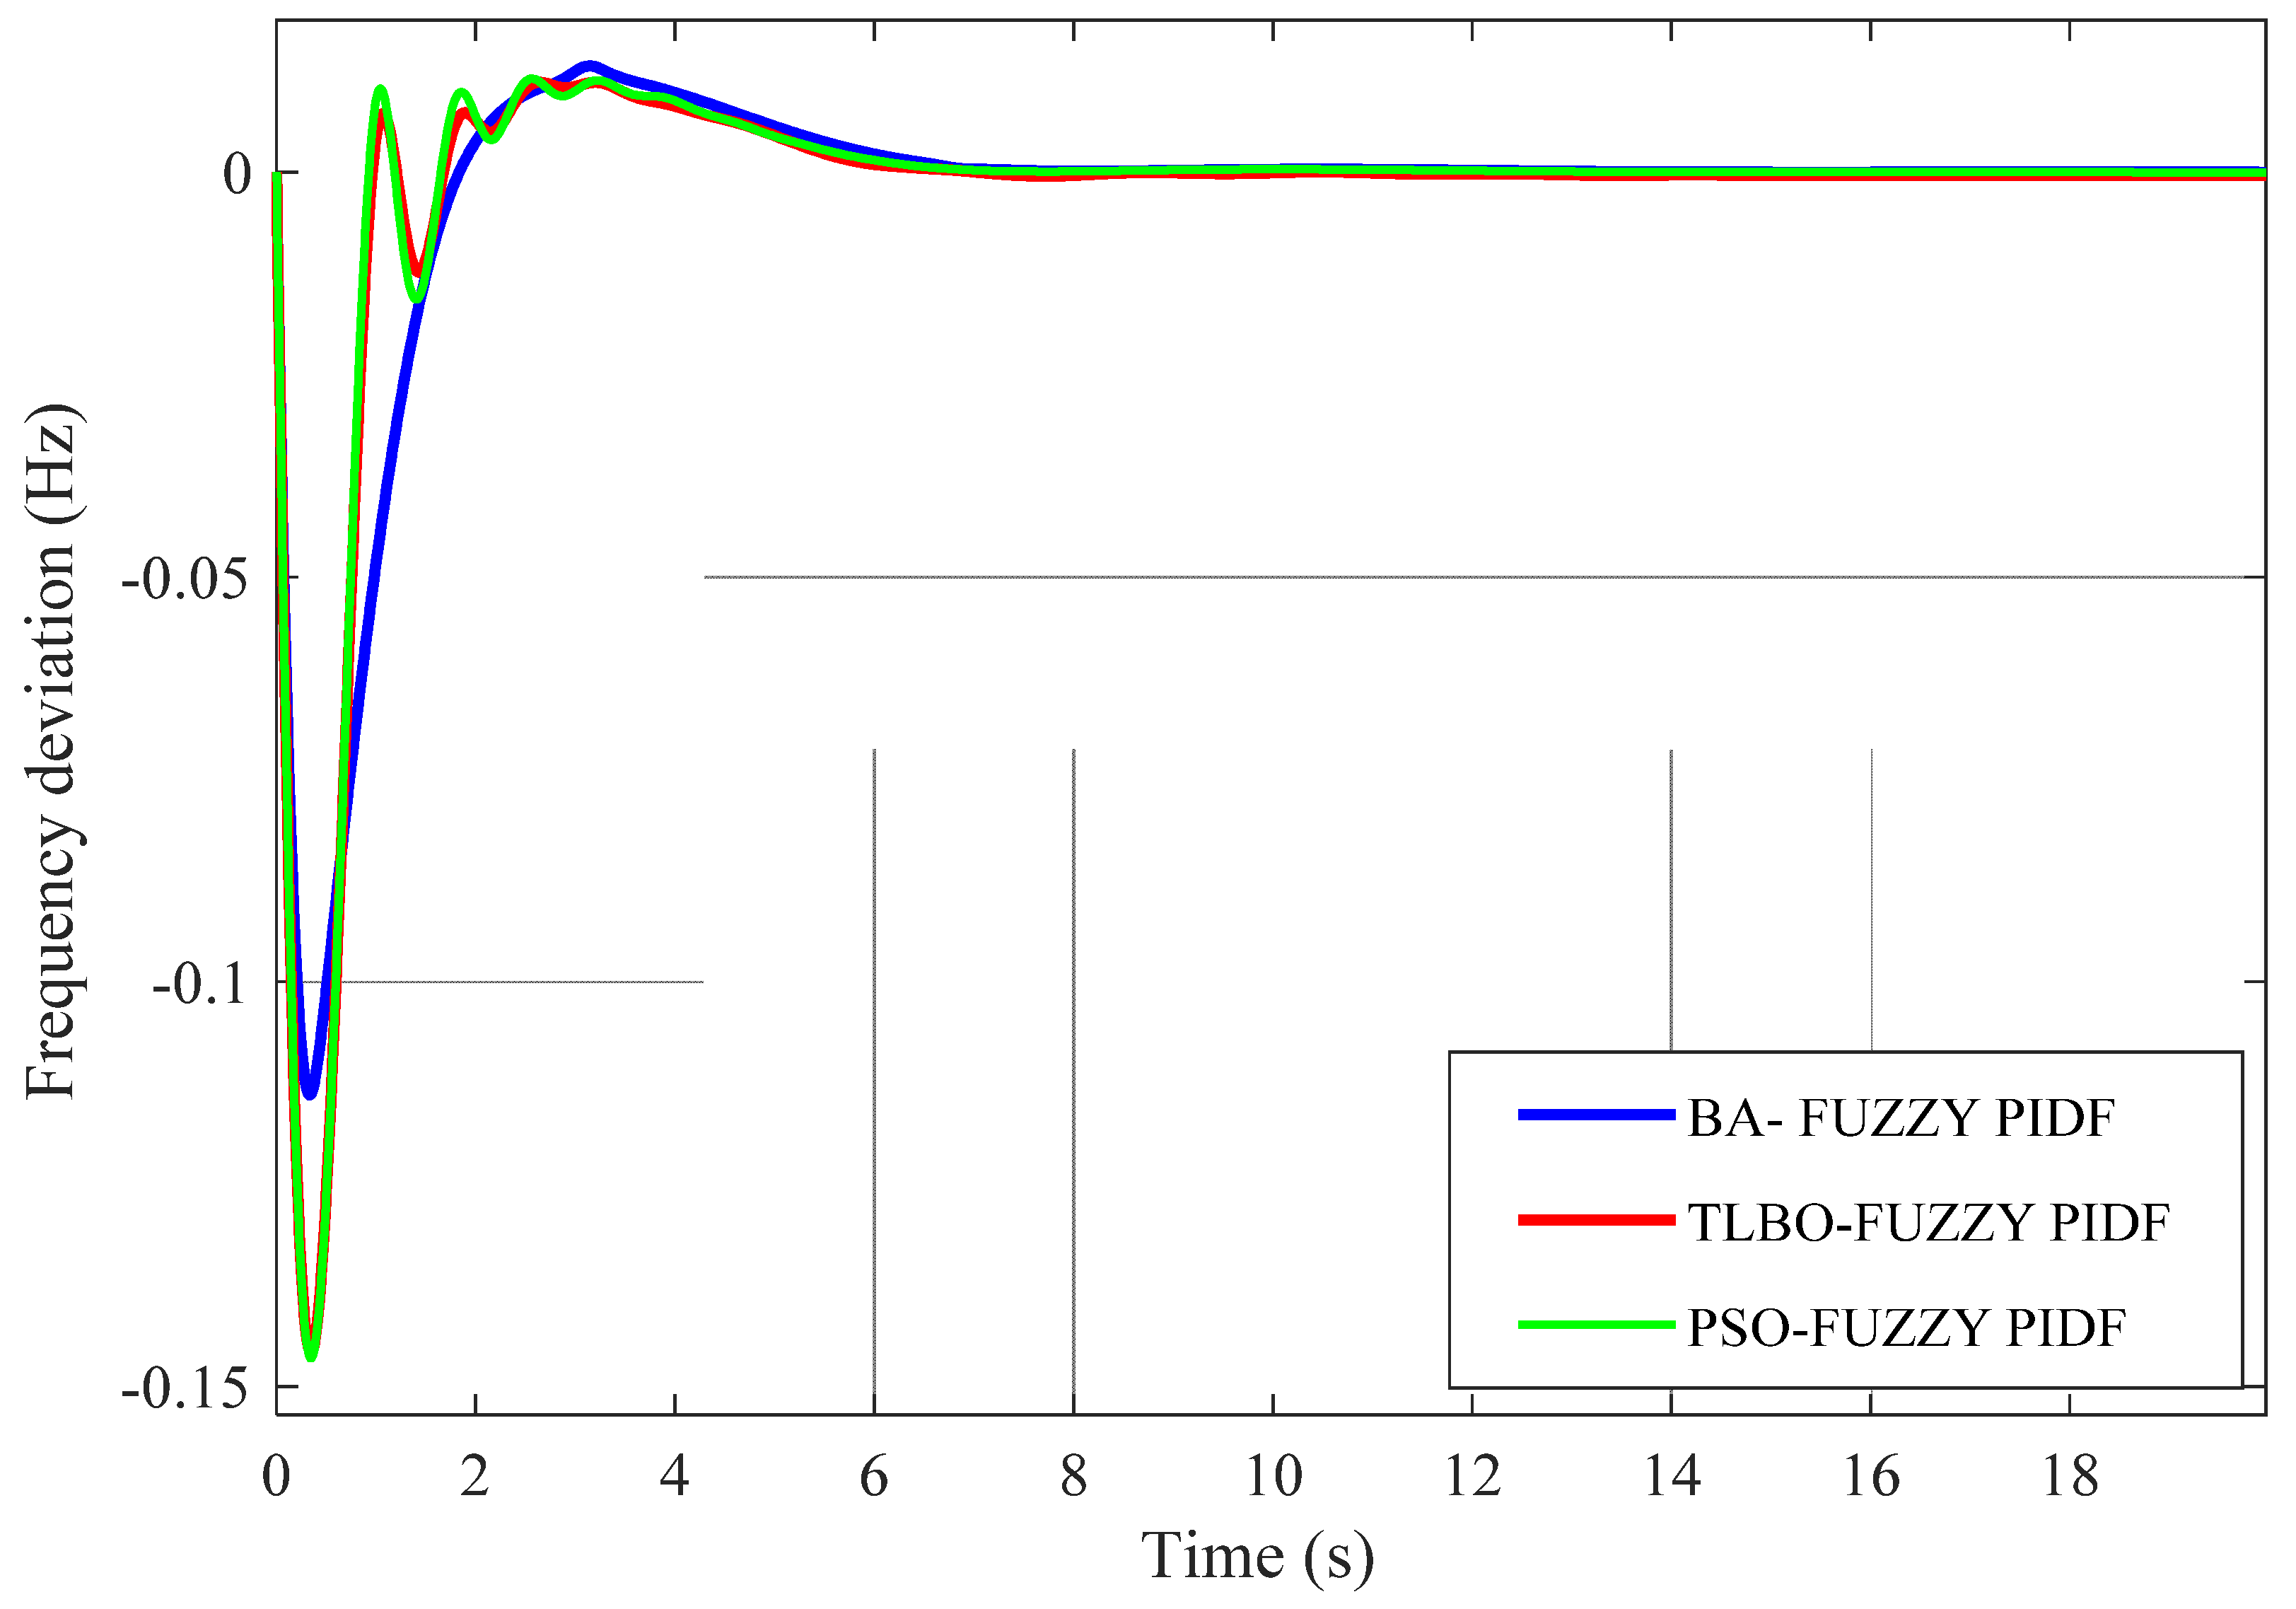
Designs 05 00050 g014
Figure 15. Comparison of three controllers tuned by BA based on ITAE for LFC of the GB system in the nominal scenario with 0.053 pu load disturbance.
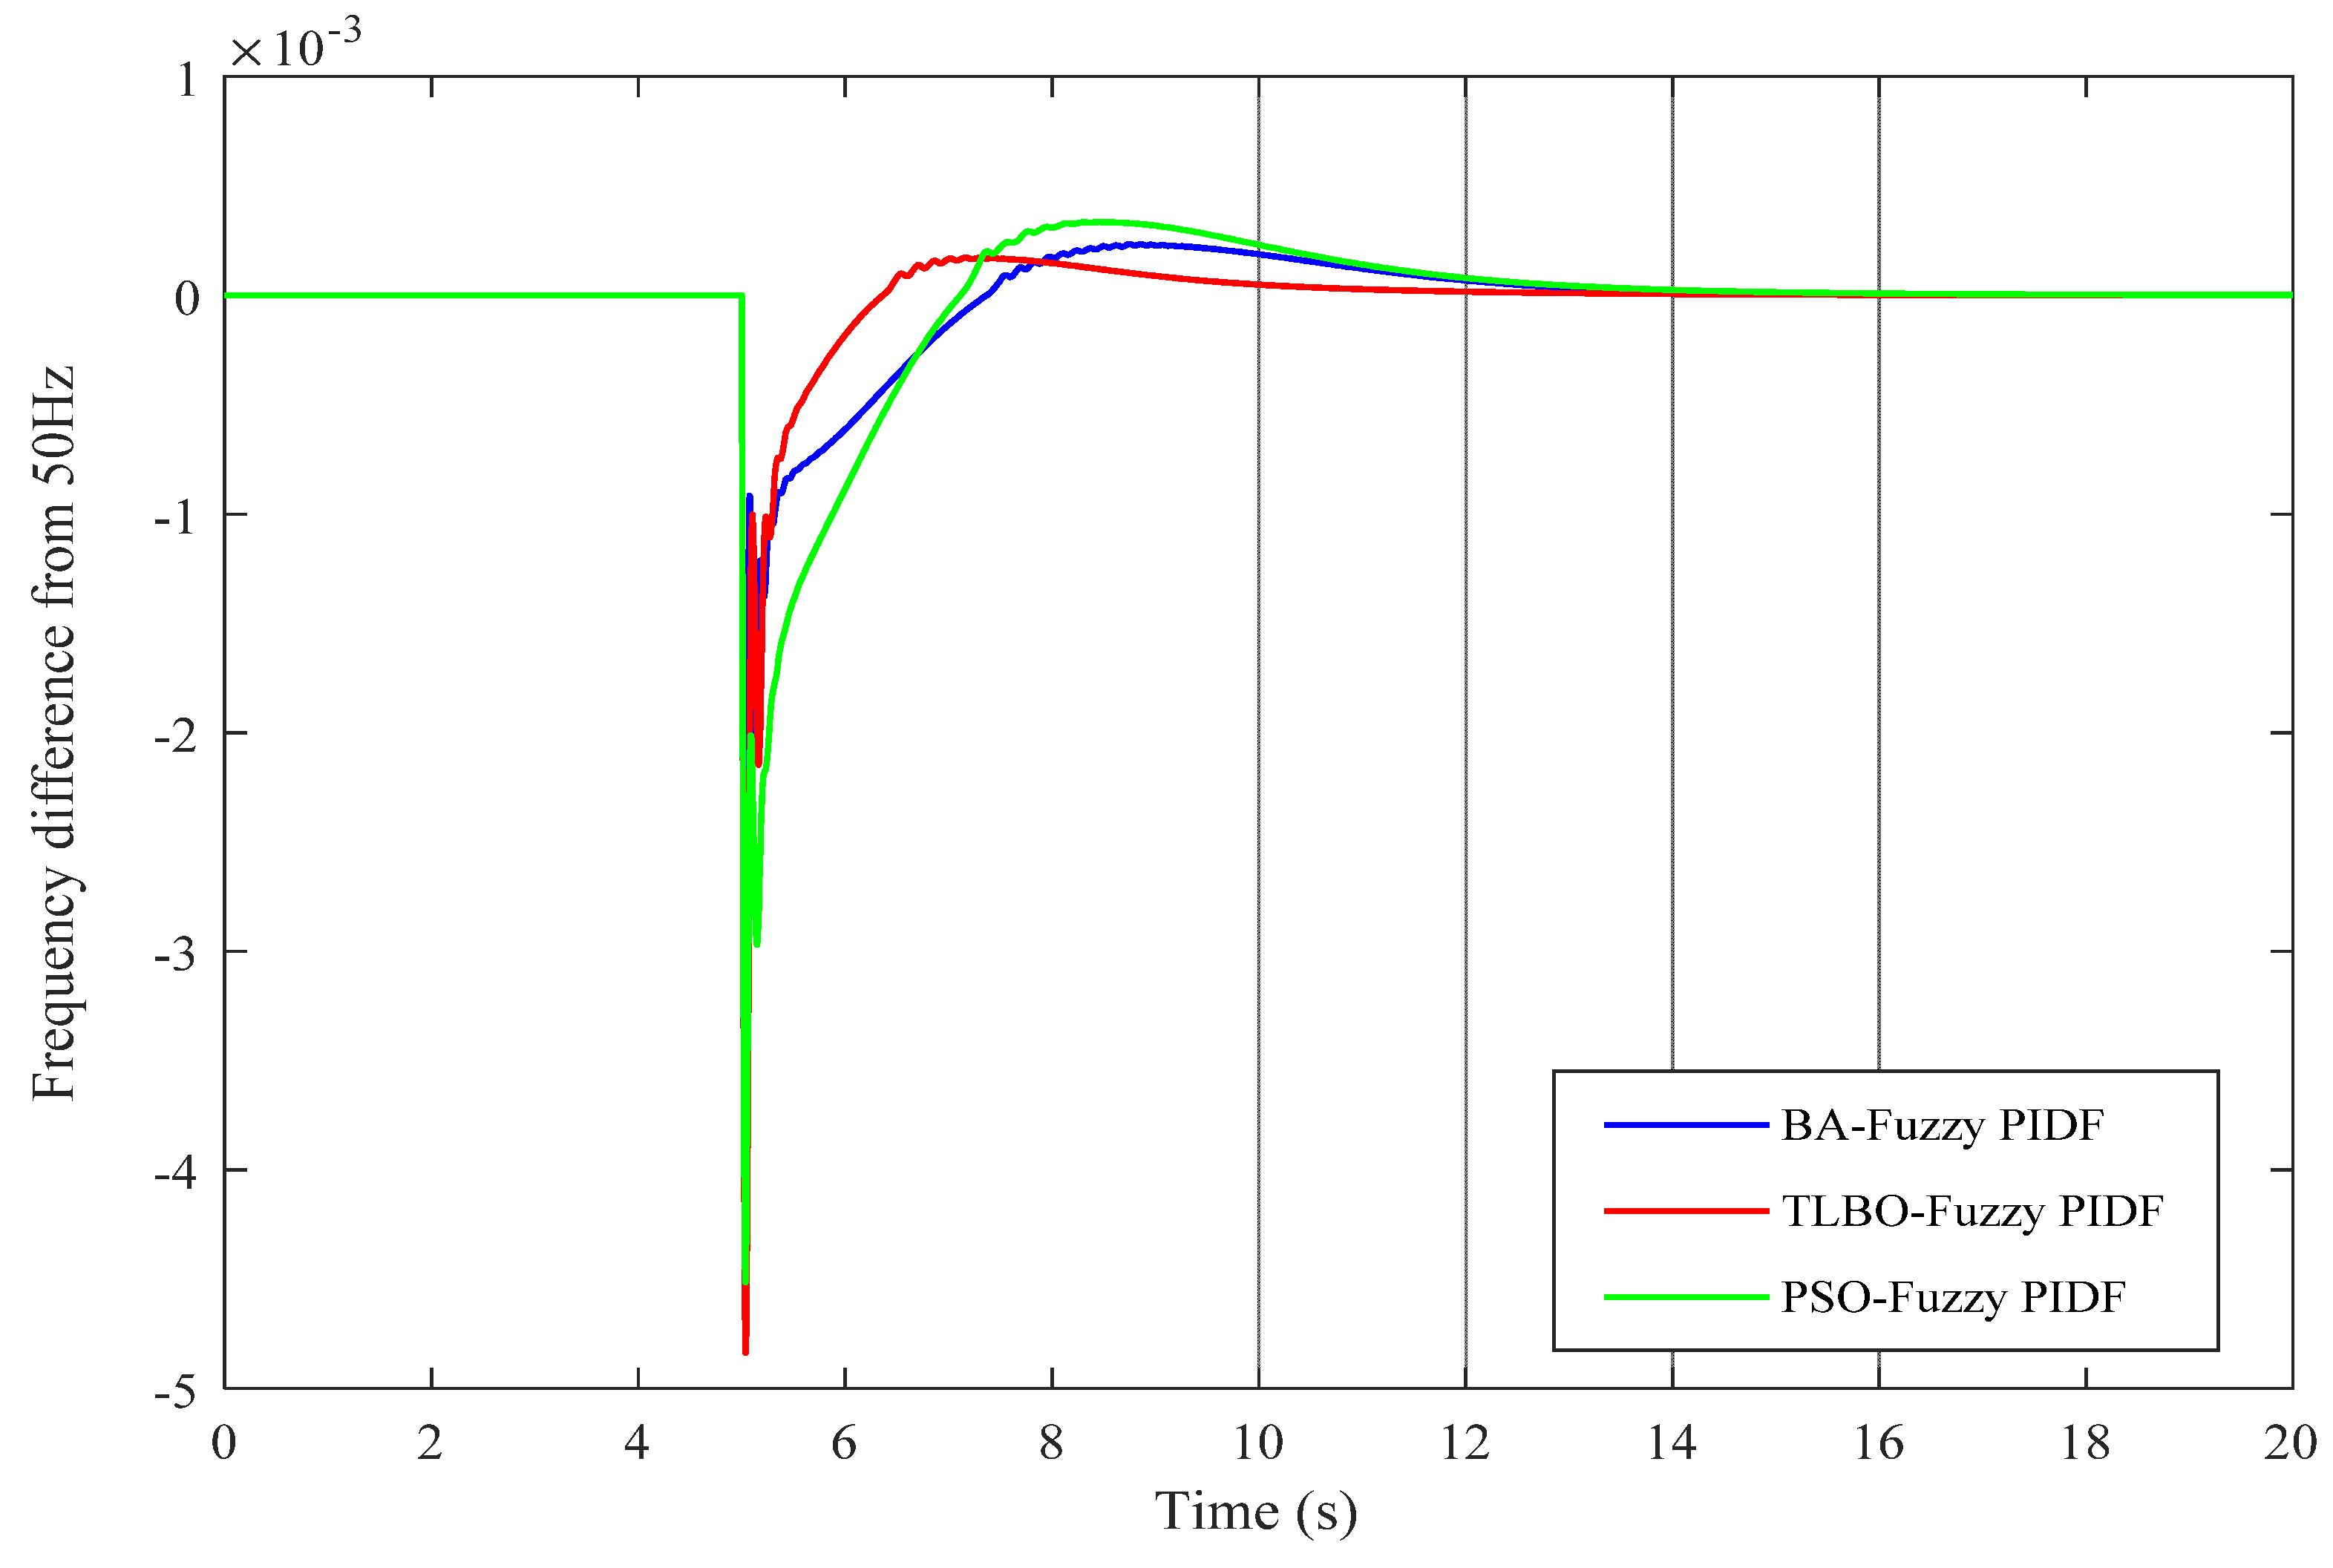
Designs 05 00050 g015
Figure 16. Comparison of three controllers tuned by BA based on ITAE for LFC of the GB system in scenario 2 with 0.053 pu load disturbance.
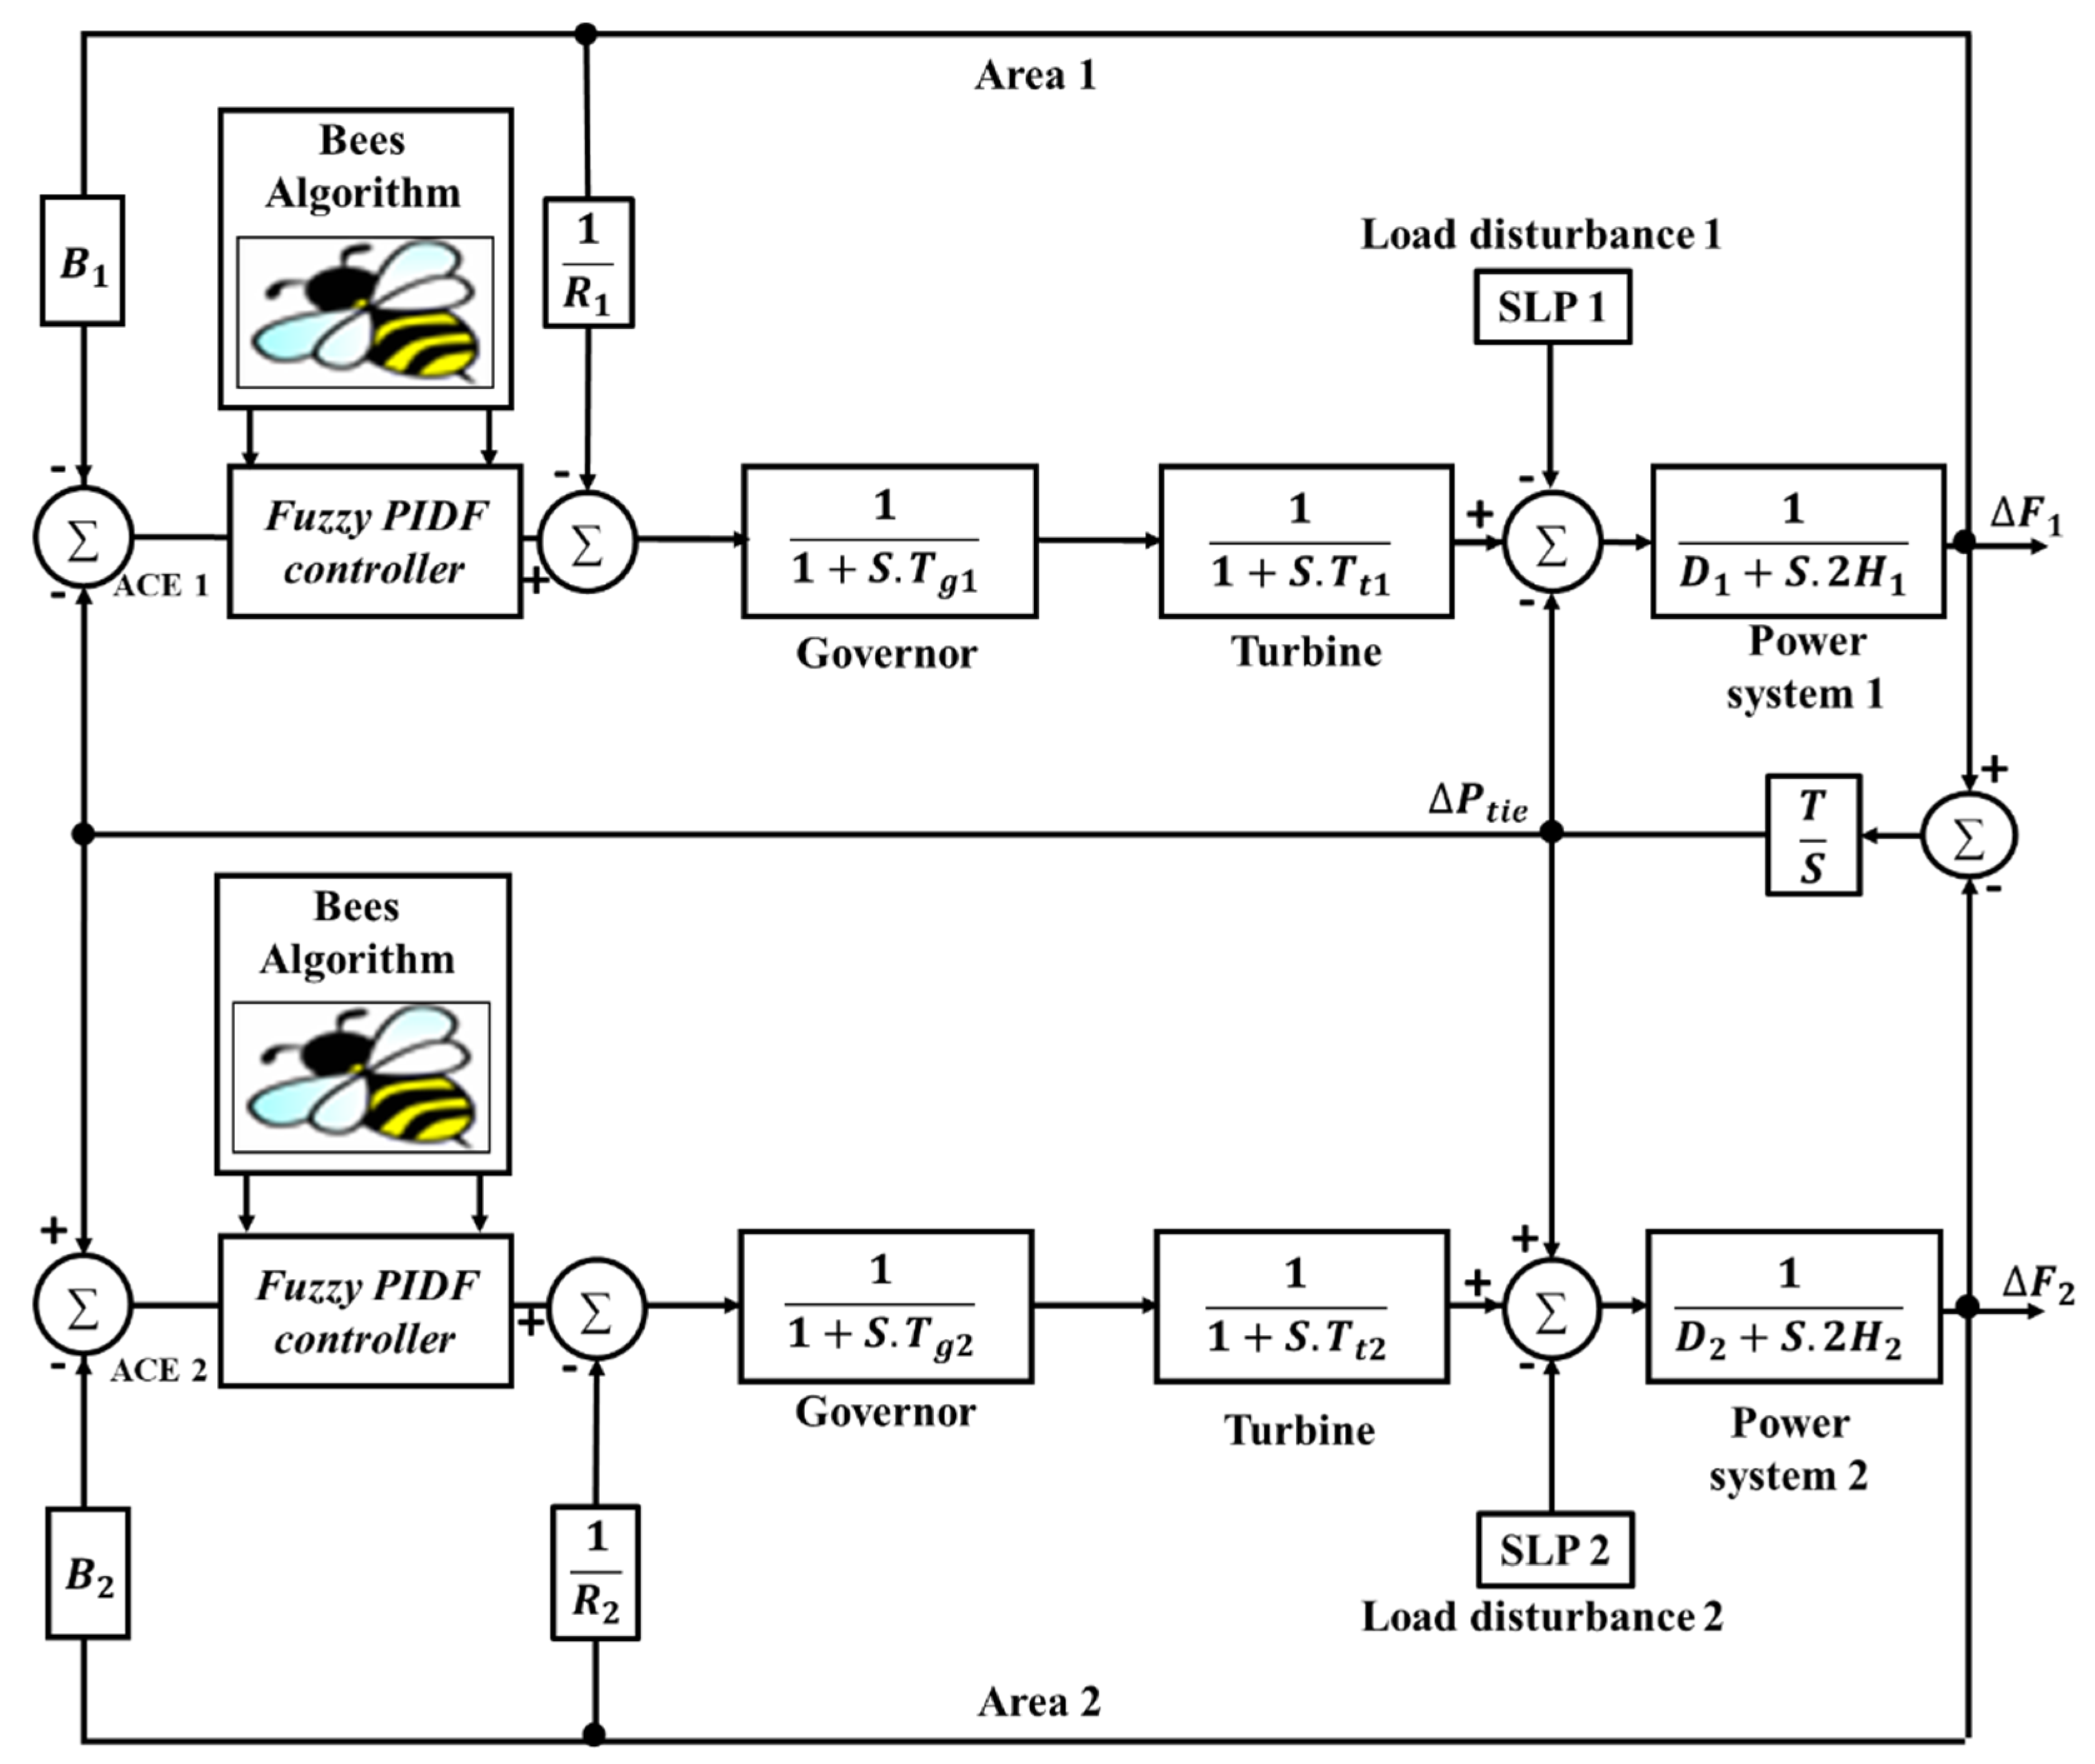
Designs 05 00050 g016
Figure 17. Transfer function model of the investigated dual-area power system.
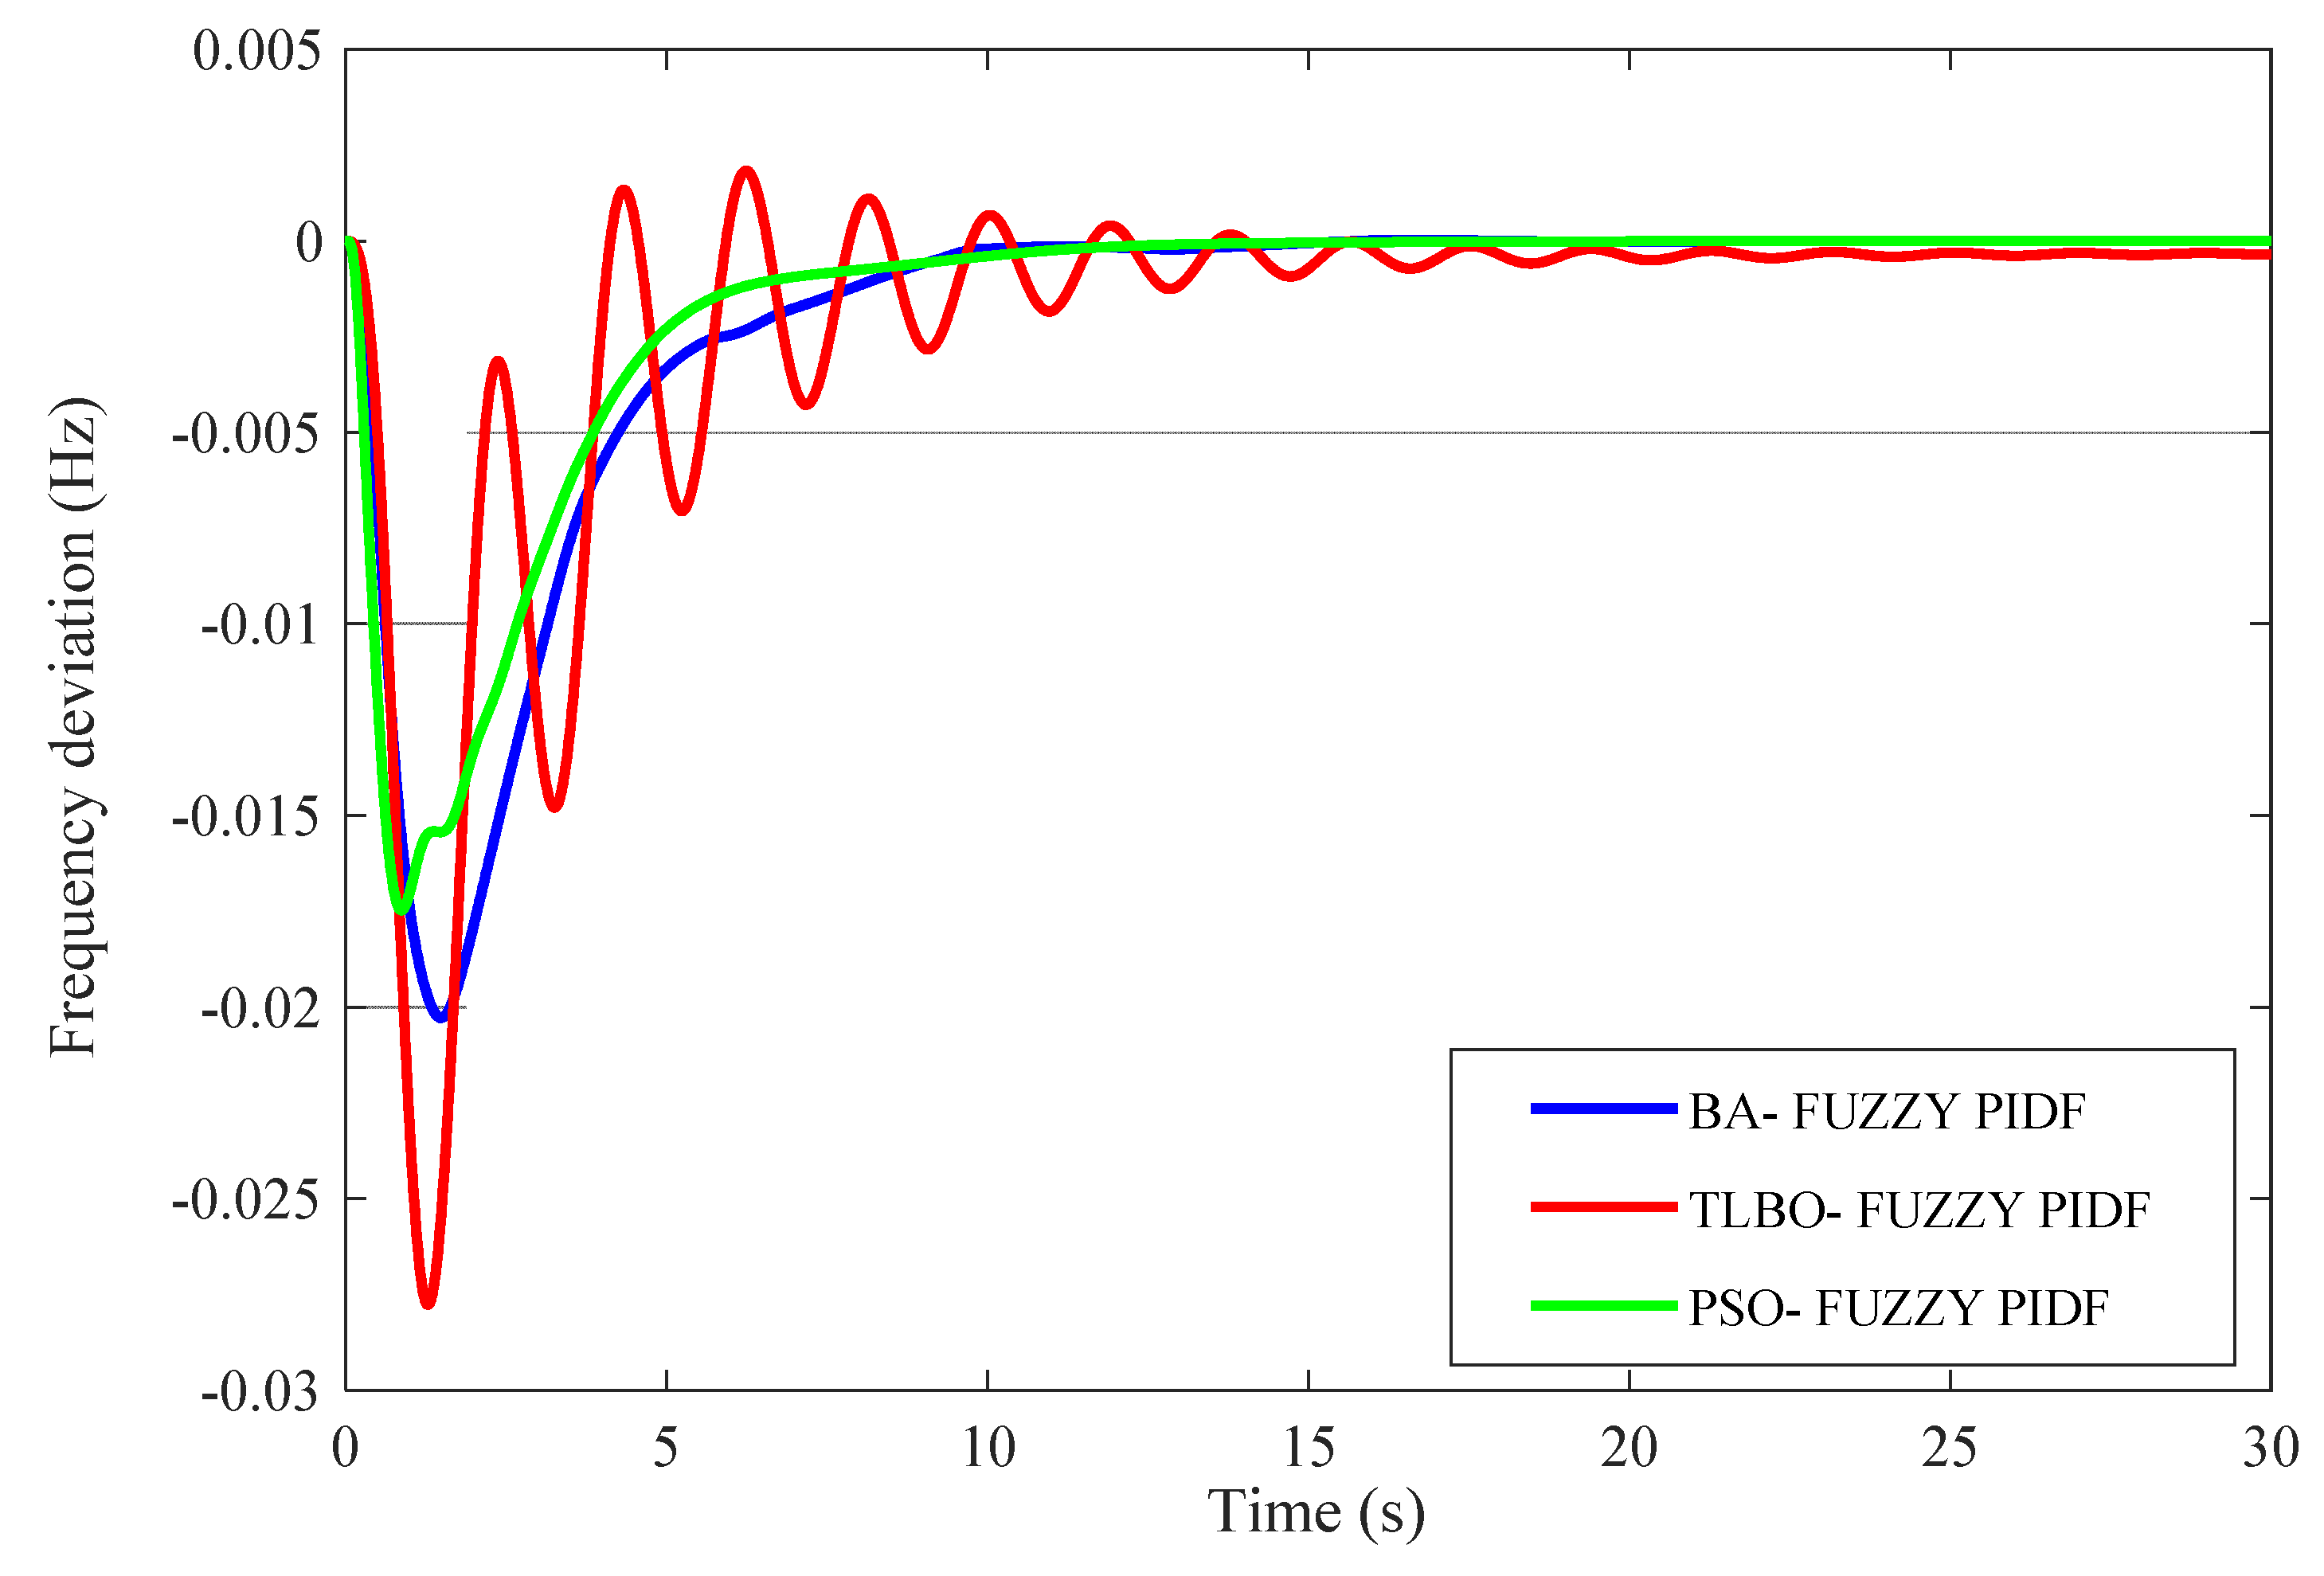
Designs 05 00050 g017
Figure 18. Frequency deviation in area 1 (∆F1).
Designs 05 00050 g018
Figure 19. Frequency deviation in area 2 (∆F2).
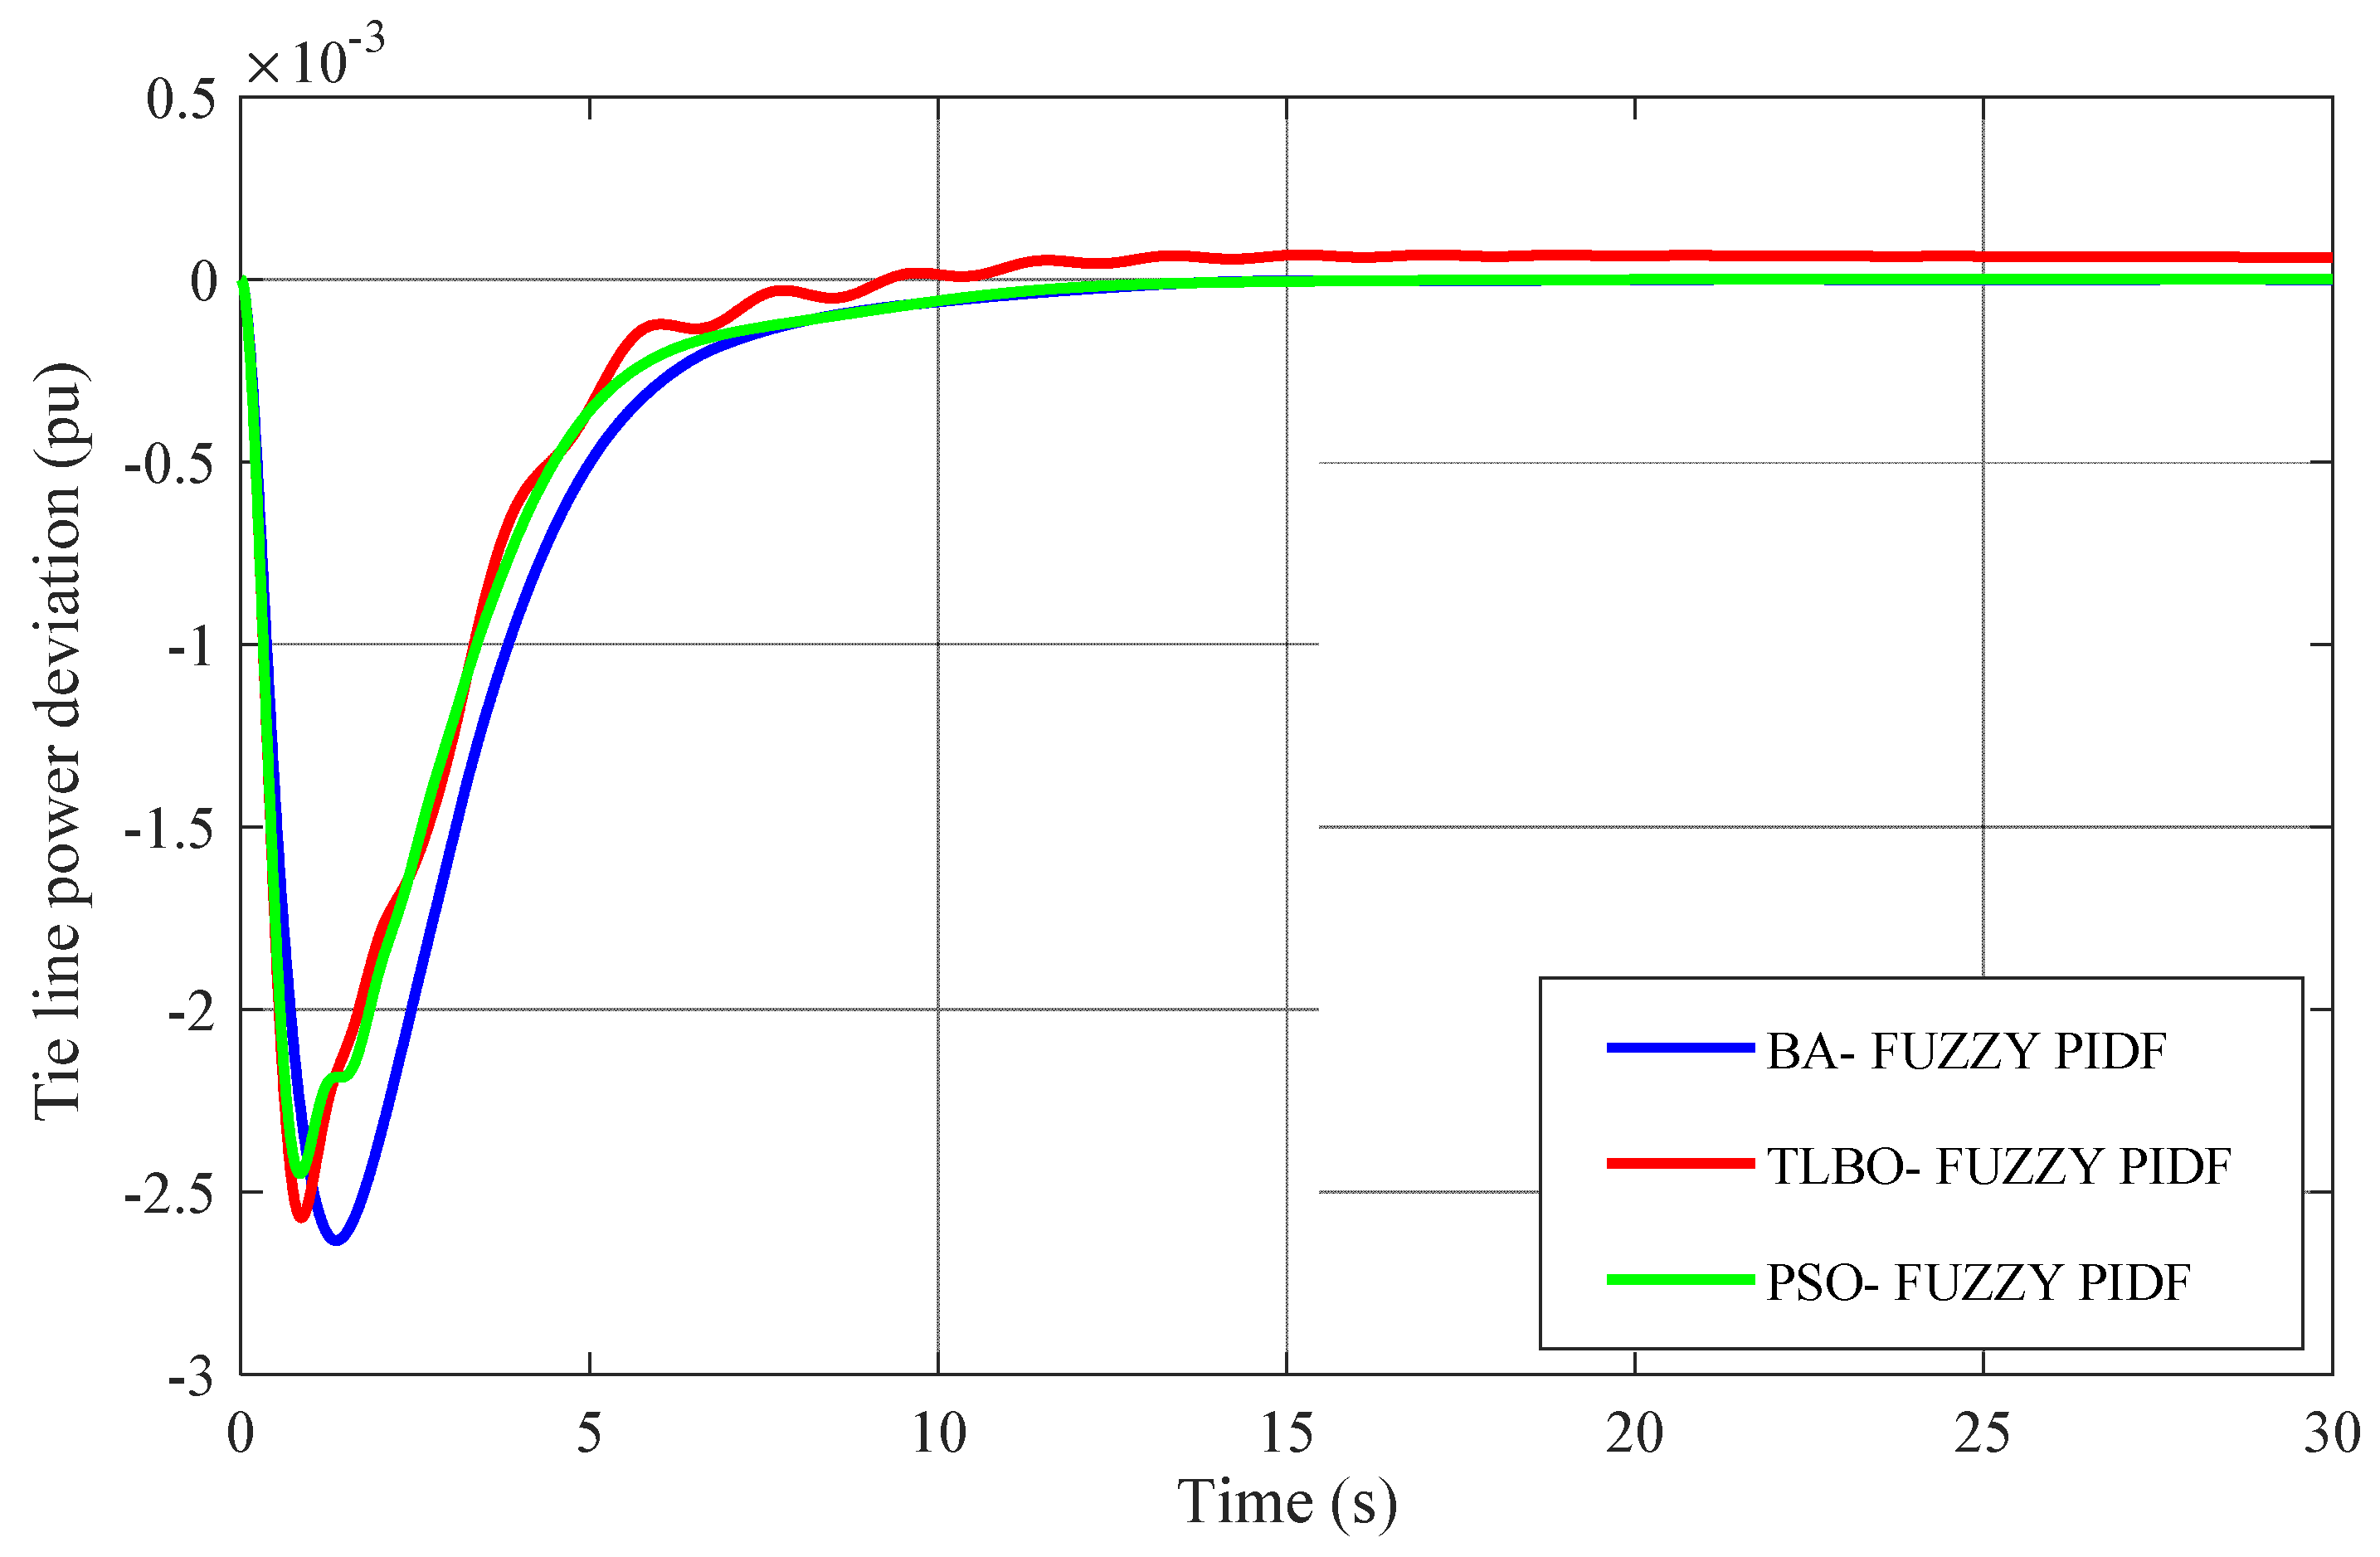
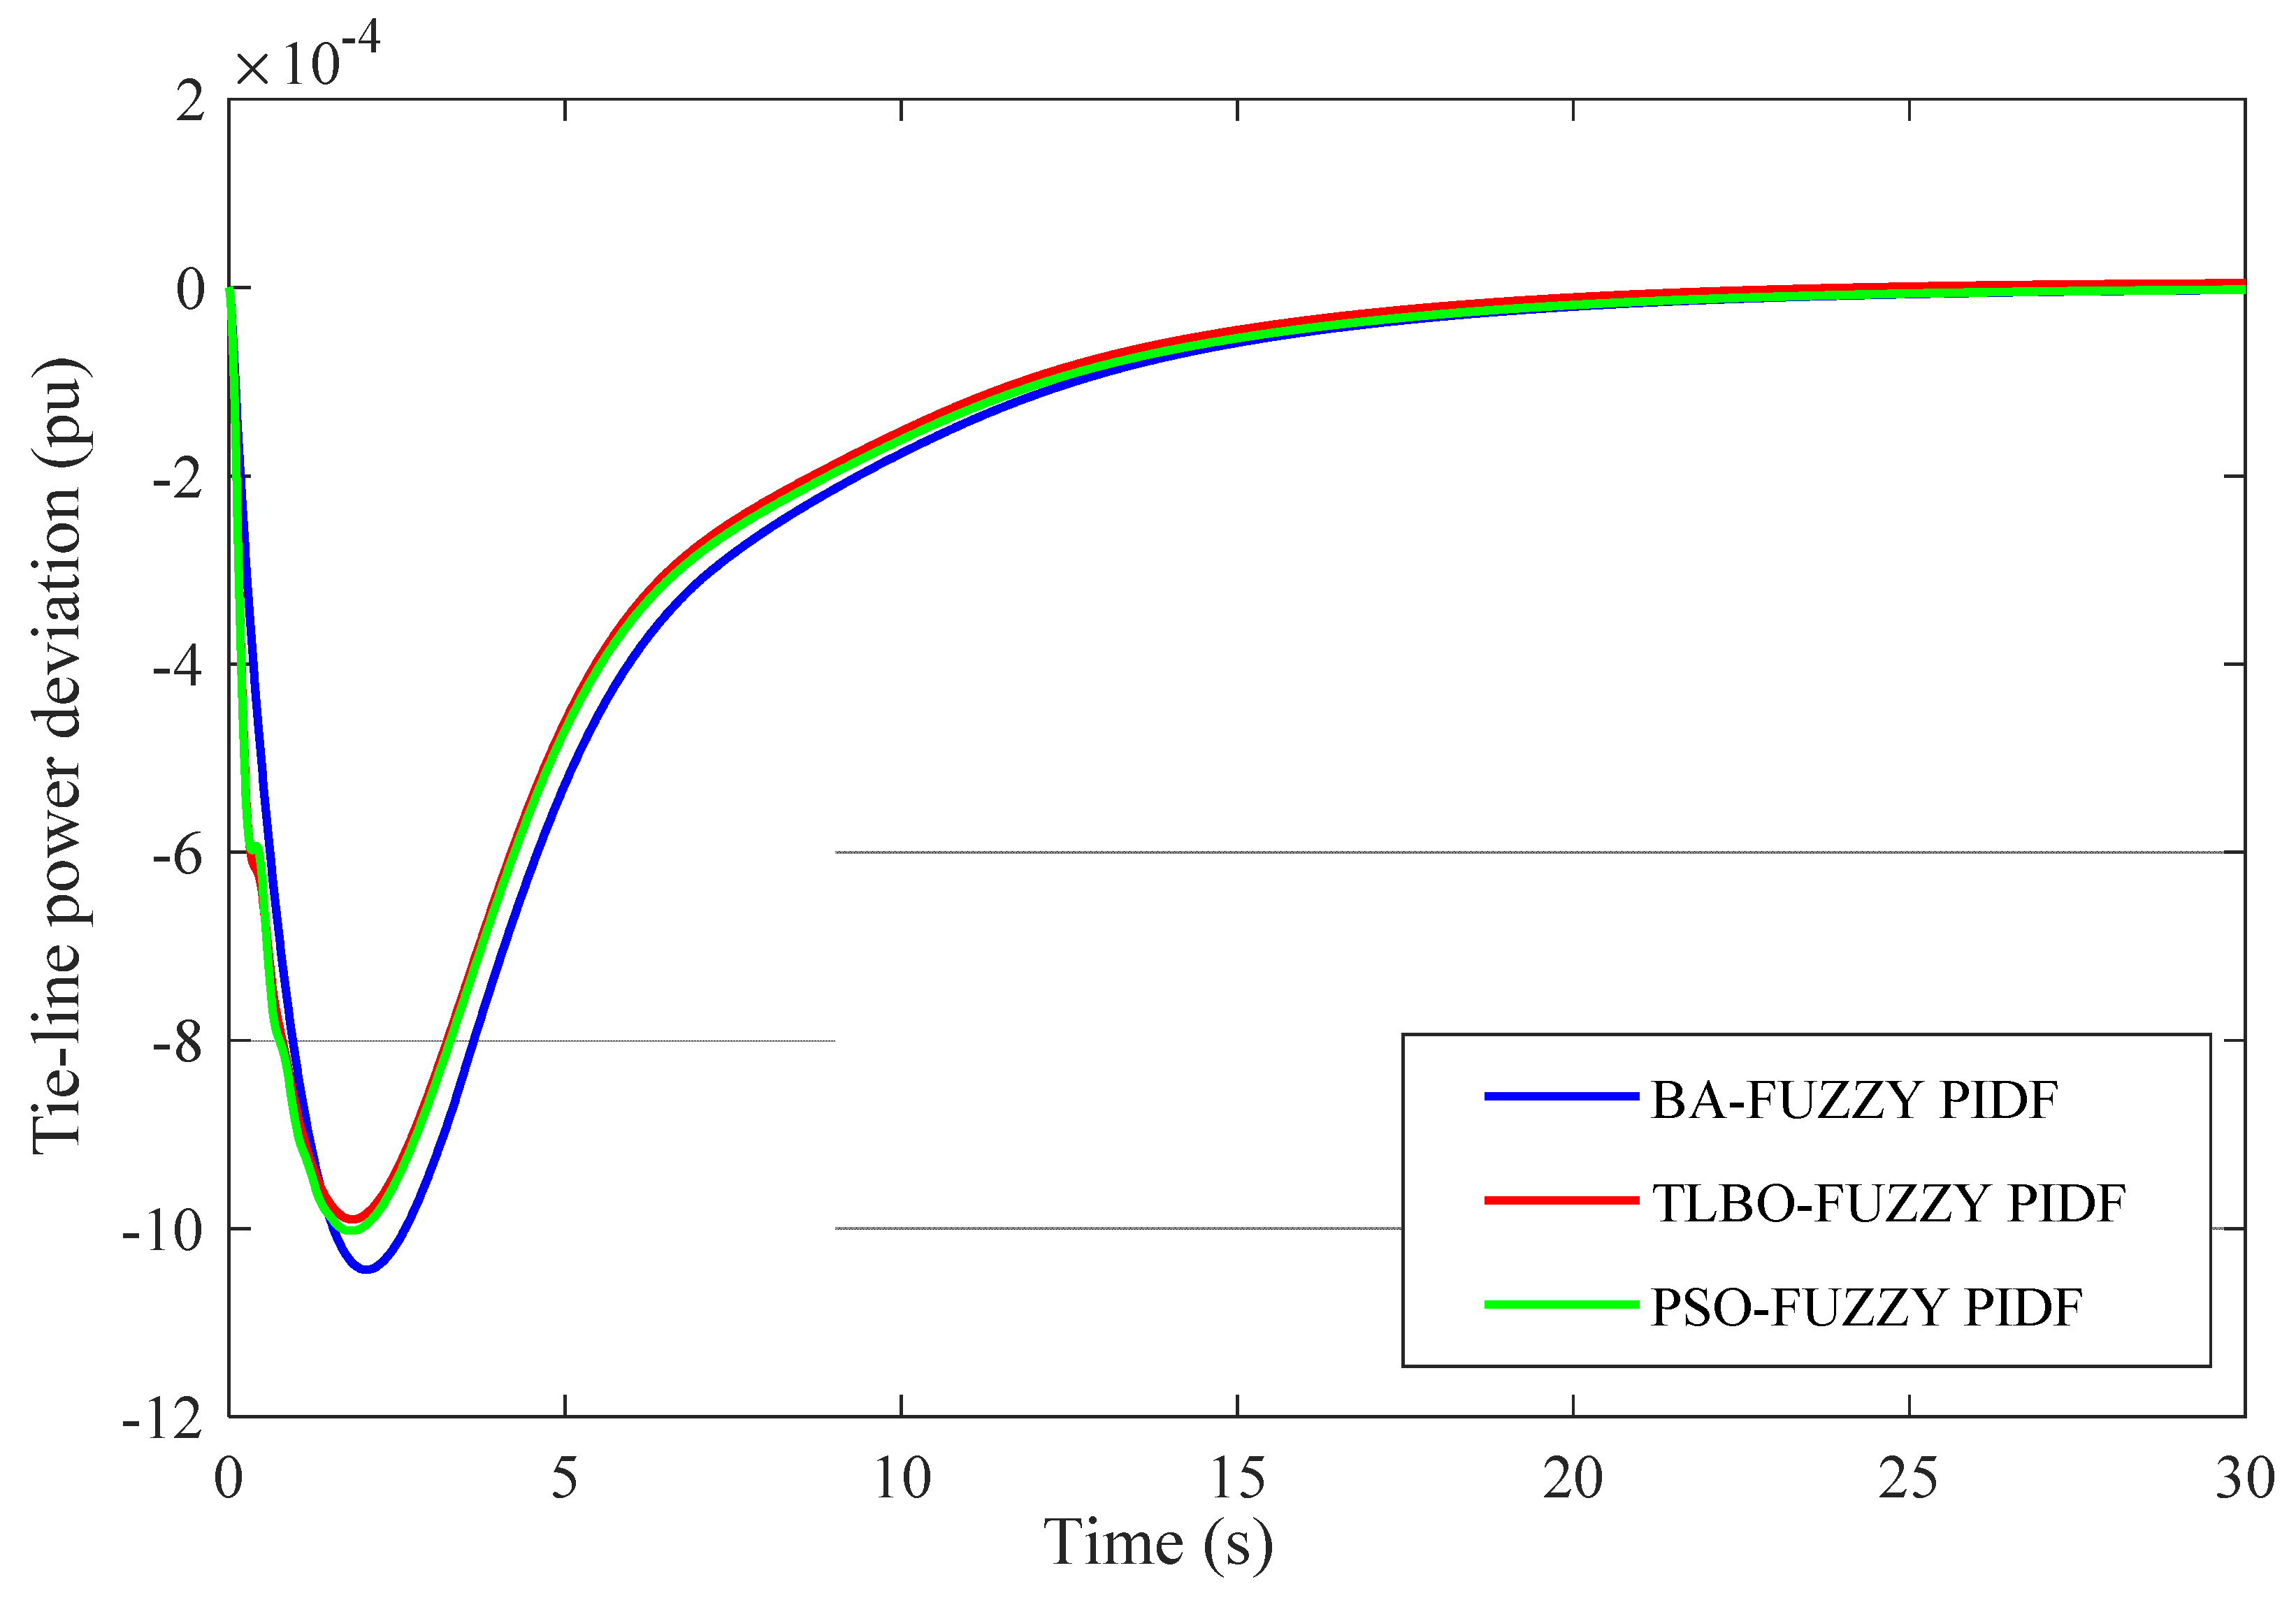
Designs 05 00050 g019
Figure 20. Tie-line power deviation (∆Ptie).
Designs 05 00050 g020
Figure 21. Frequency deviation in area 1 (∆F1) under parametric uncertainties.
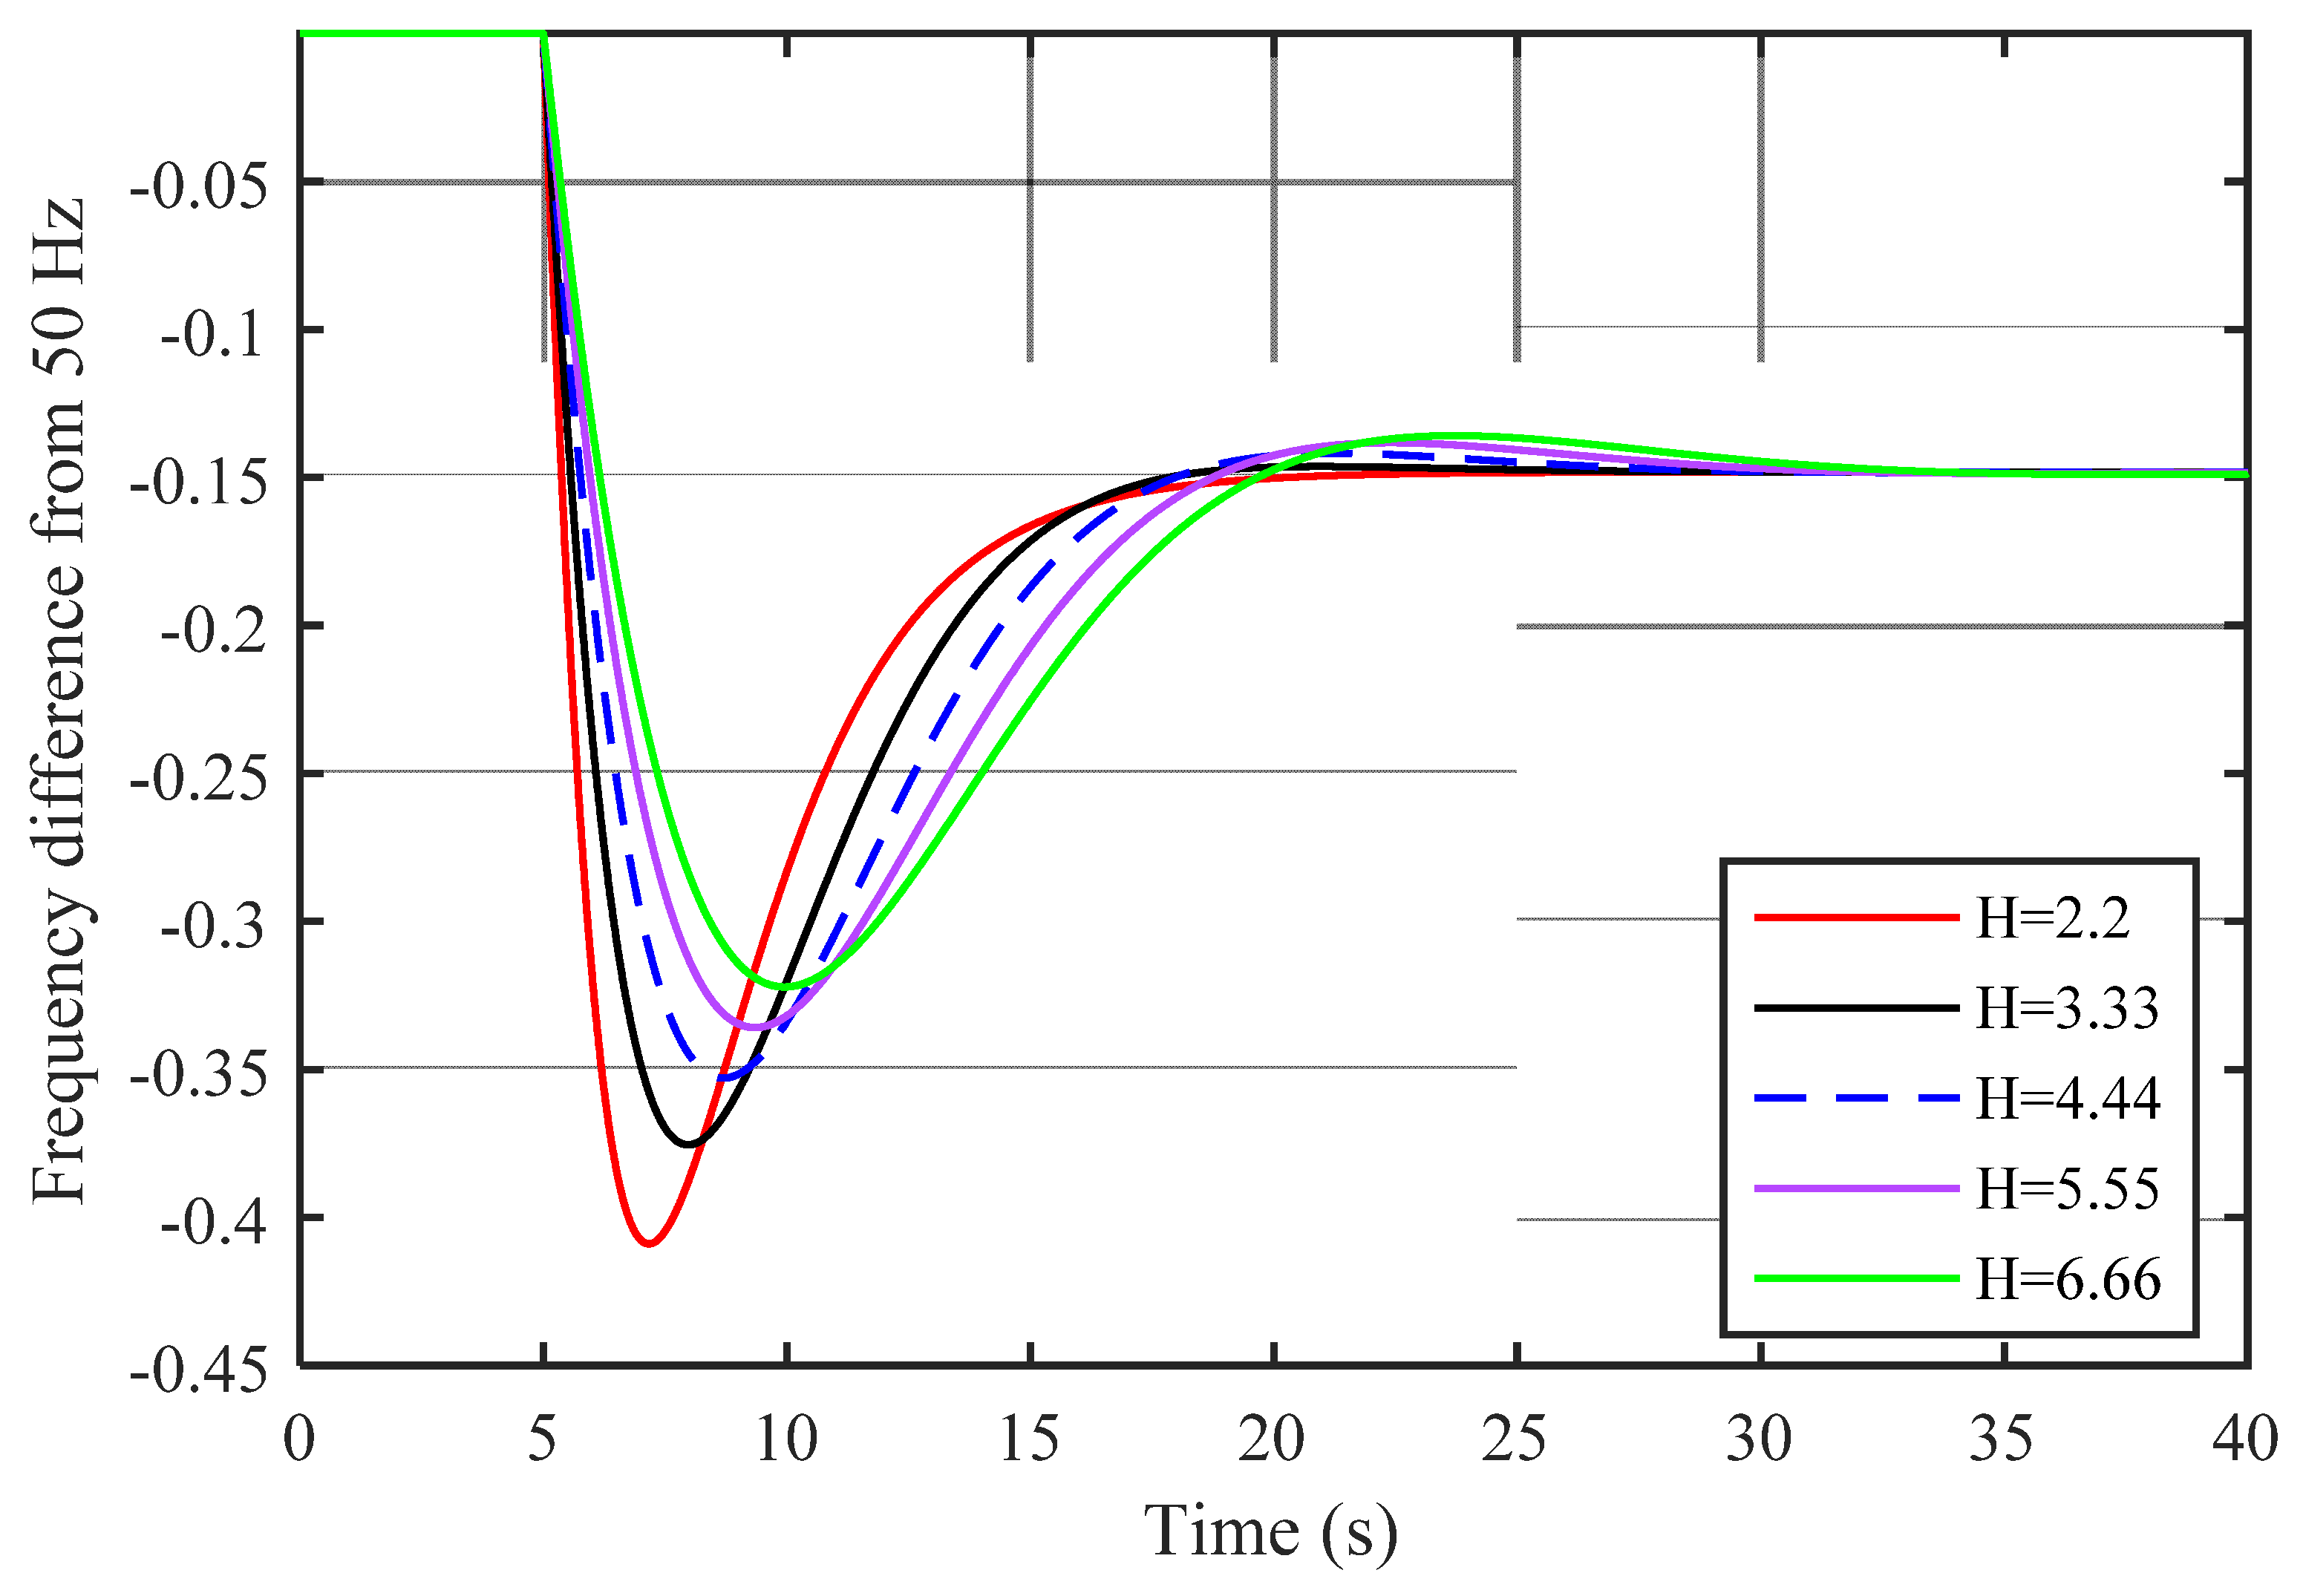
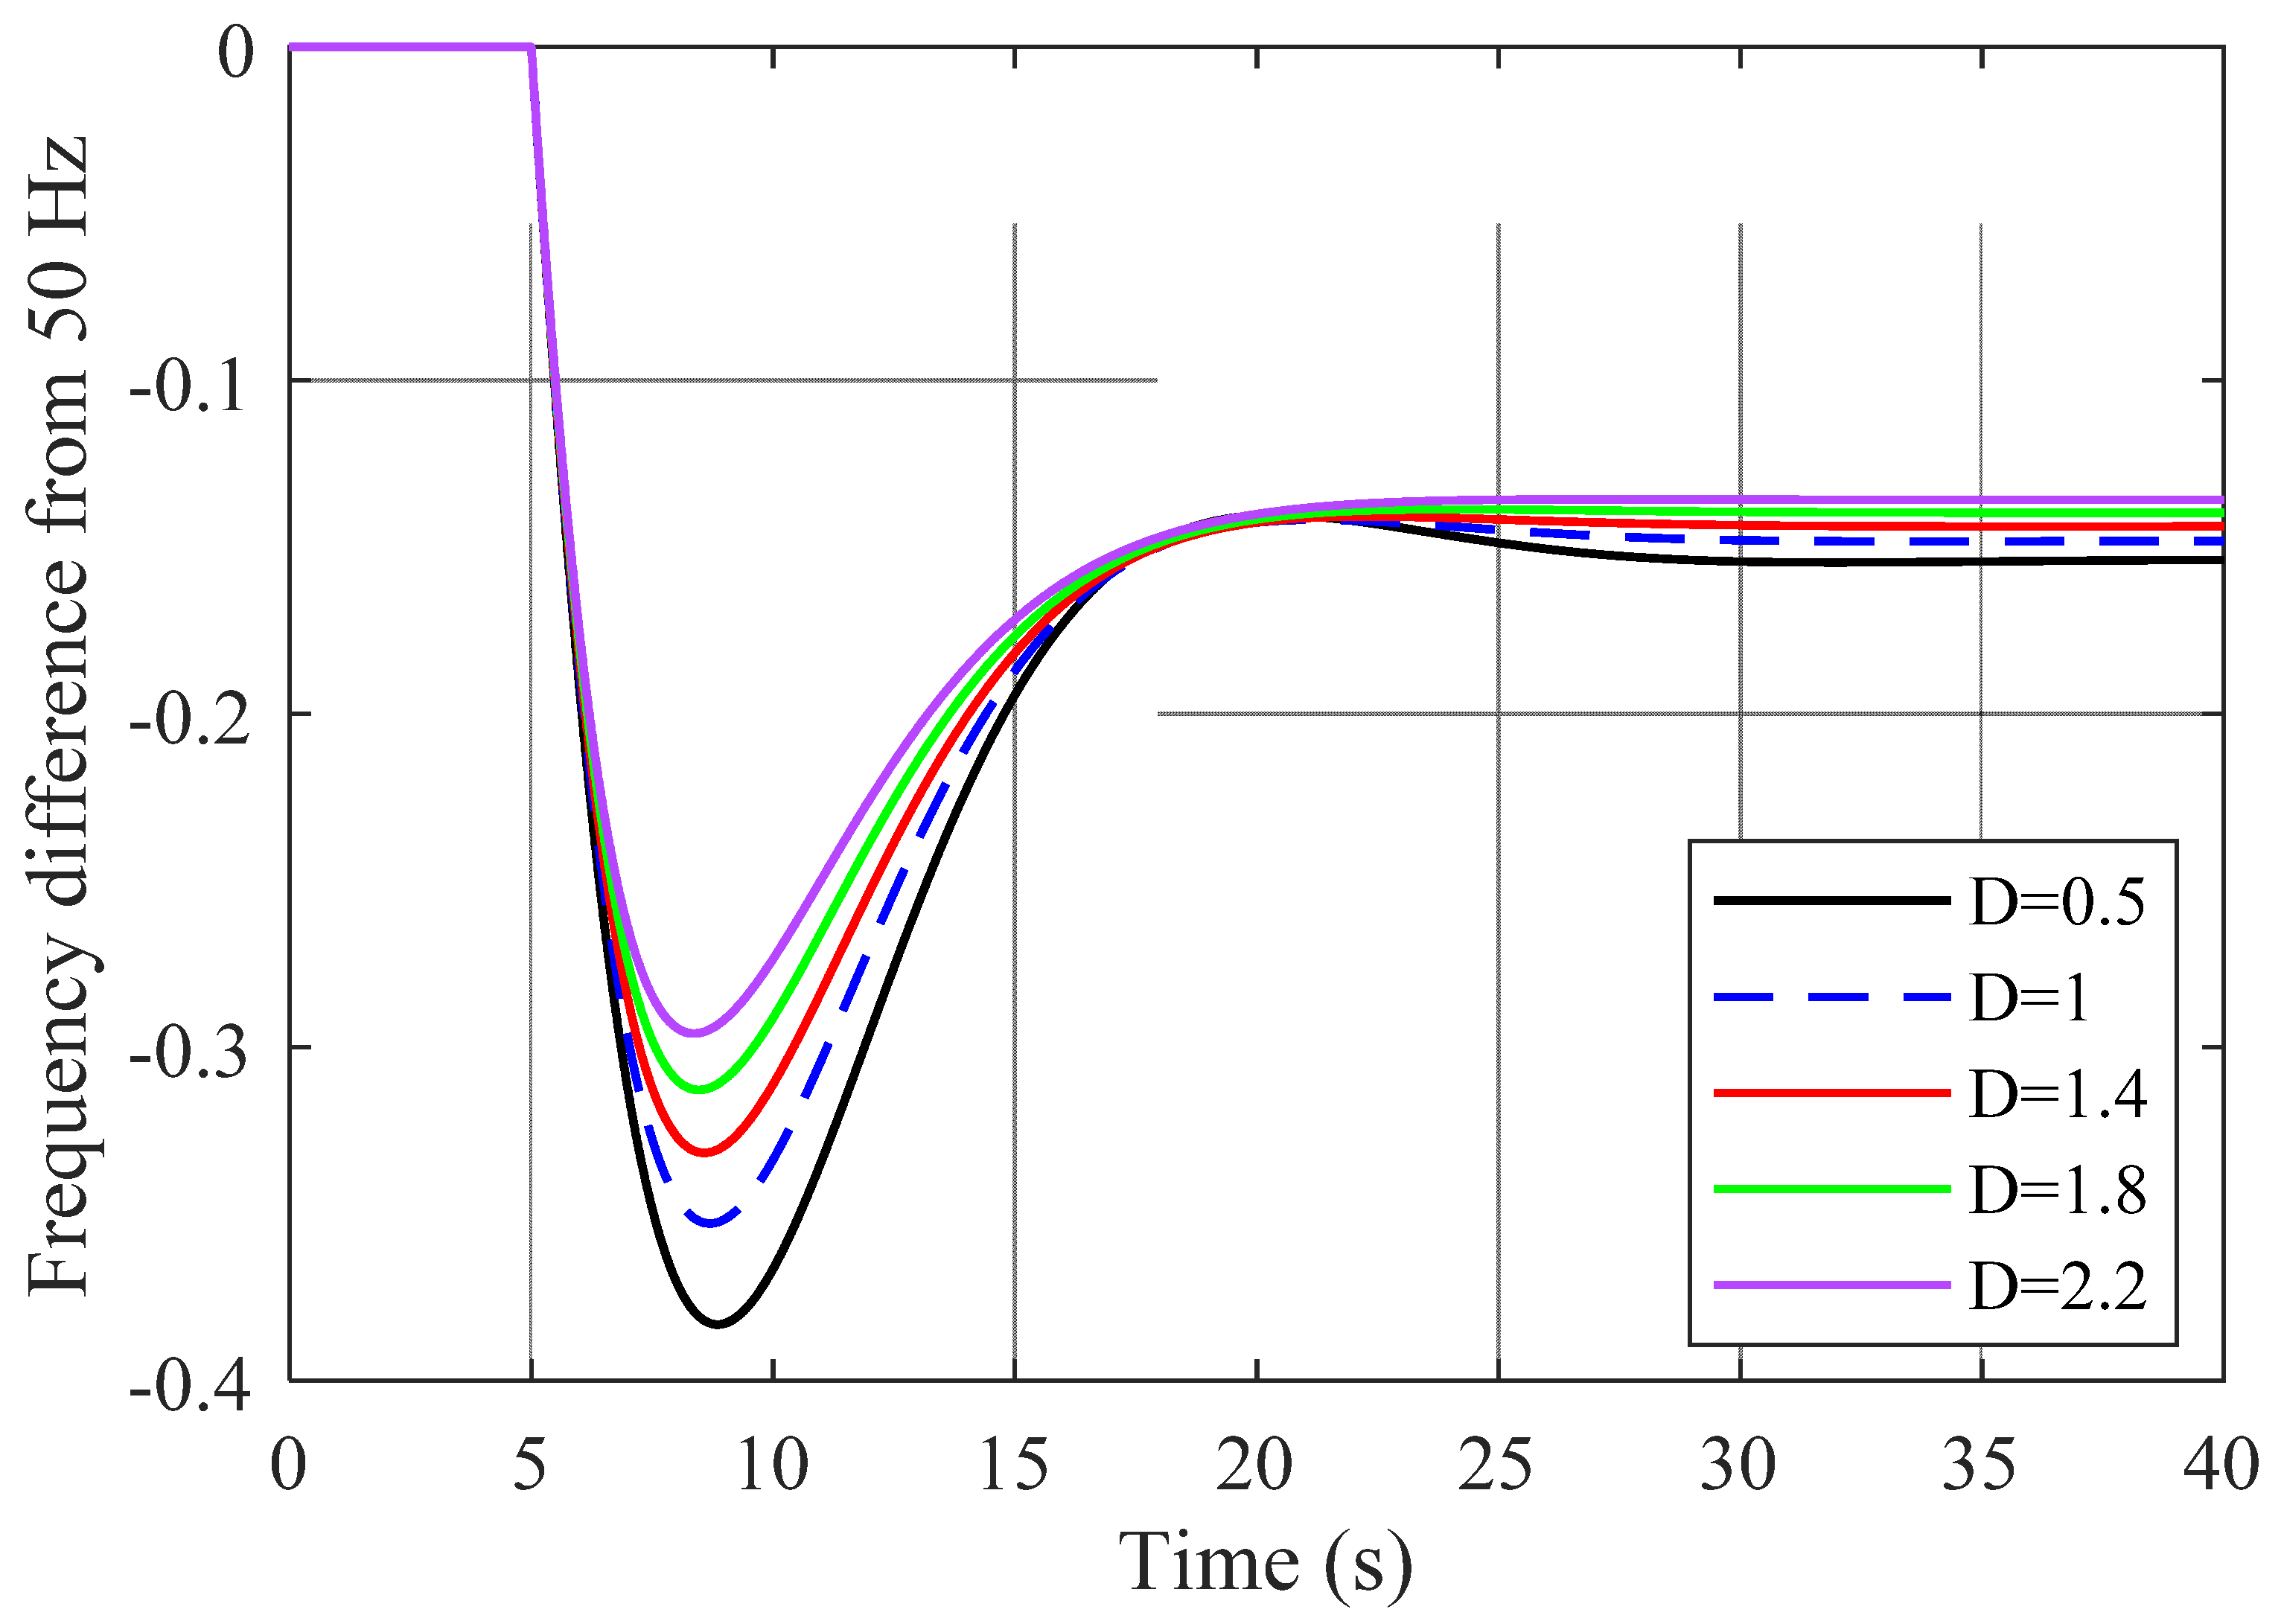
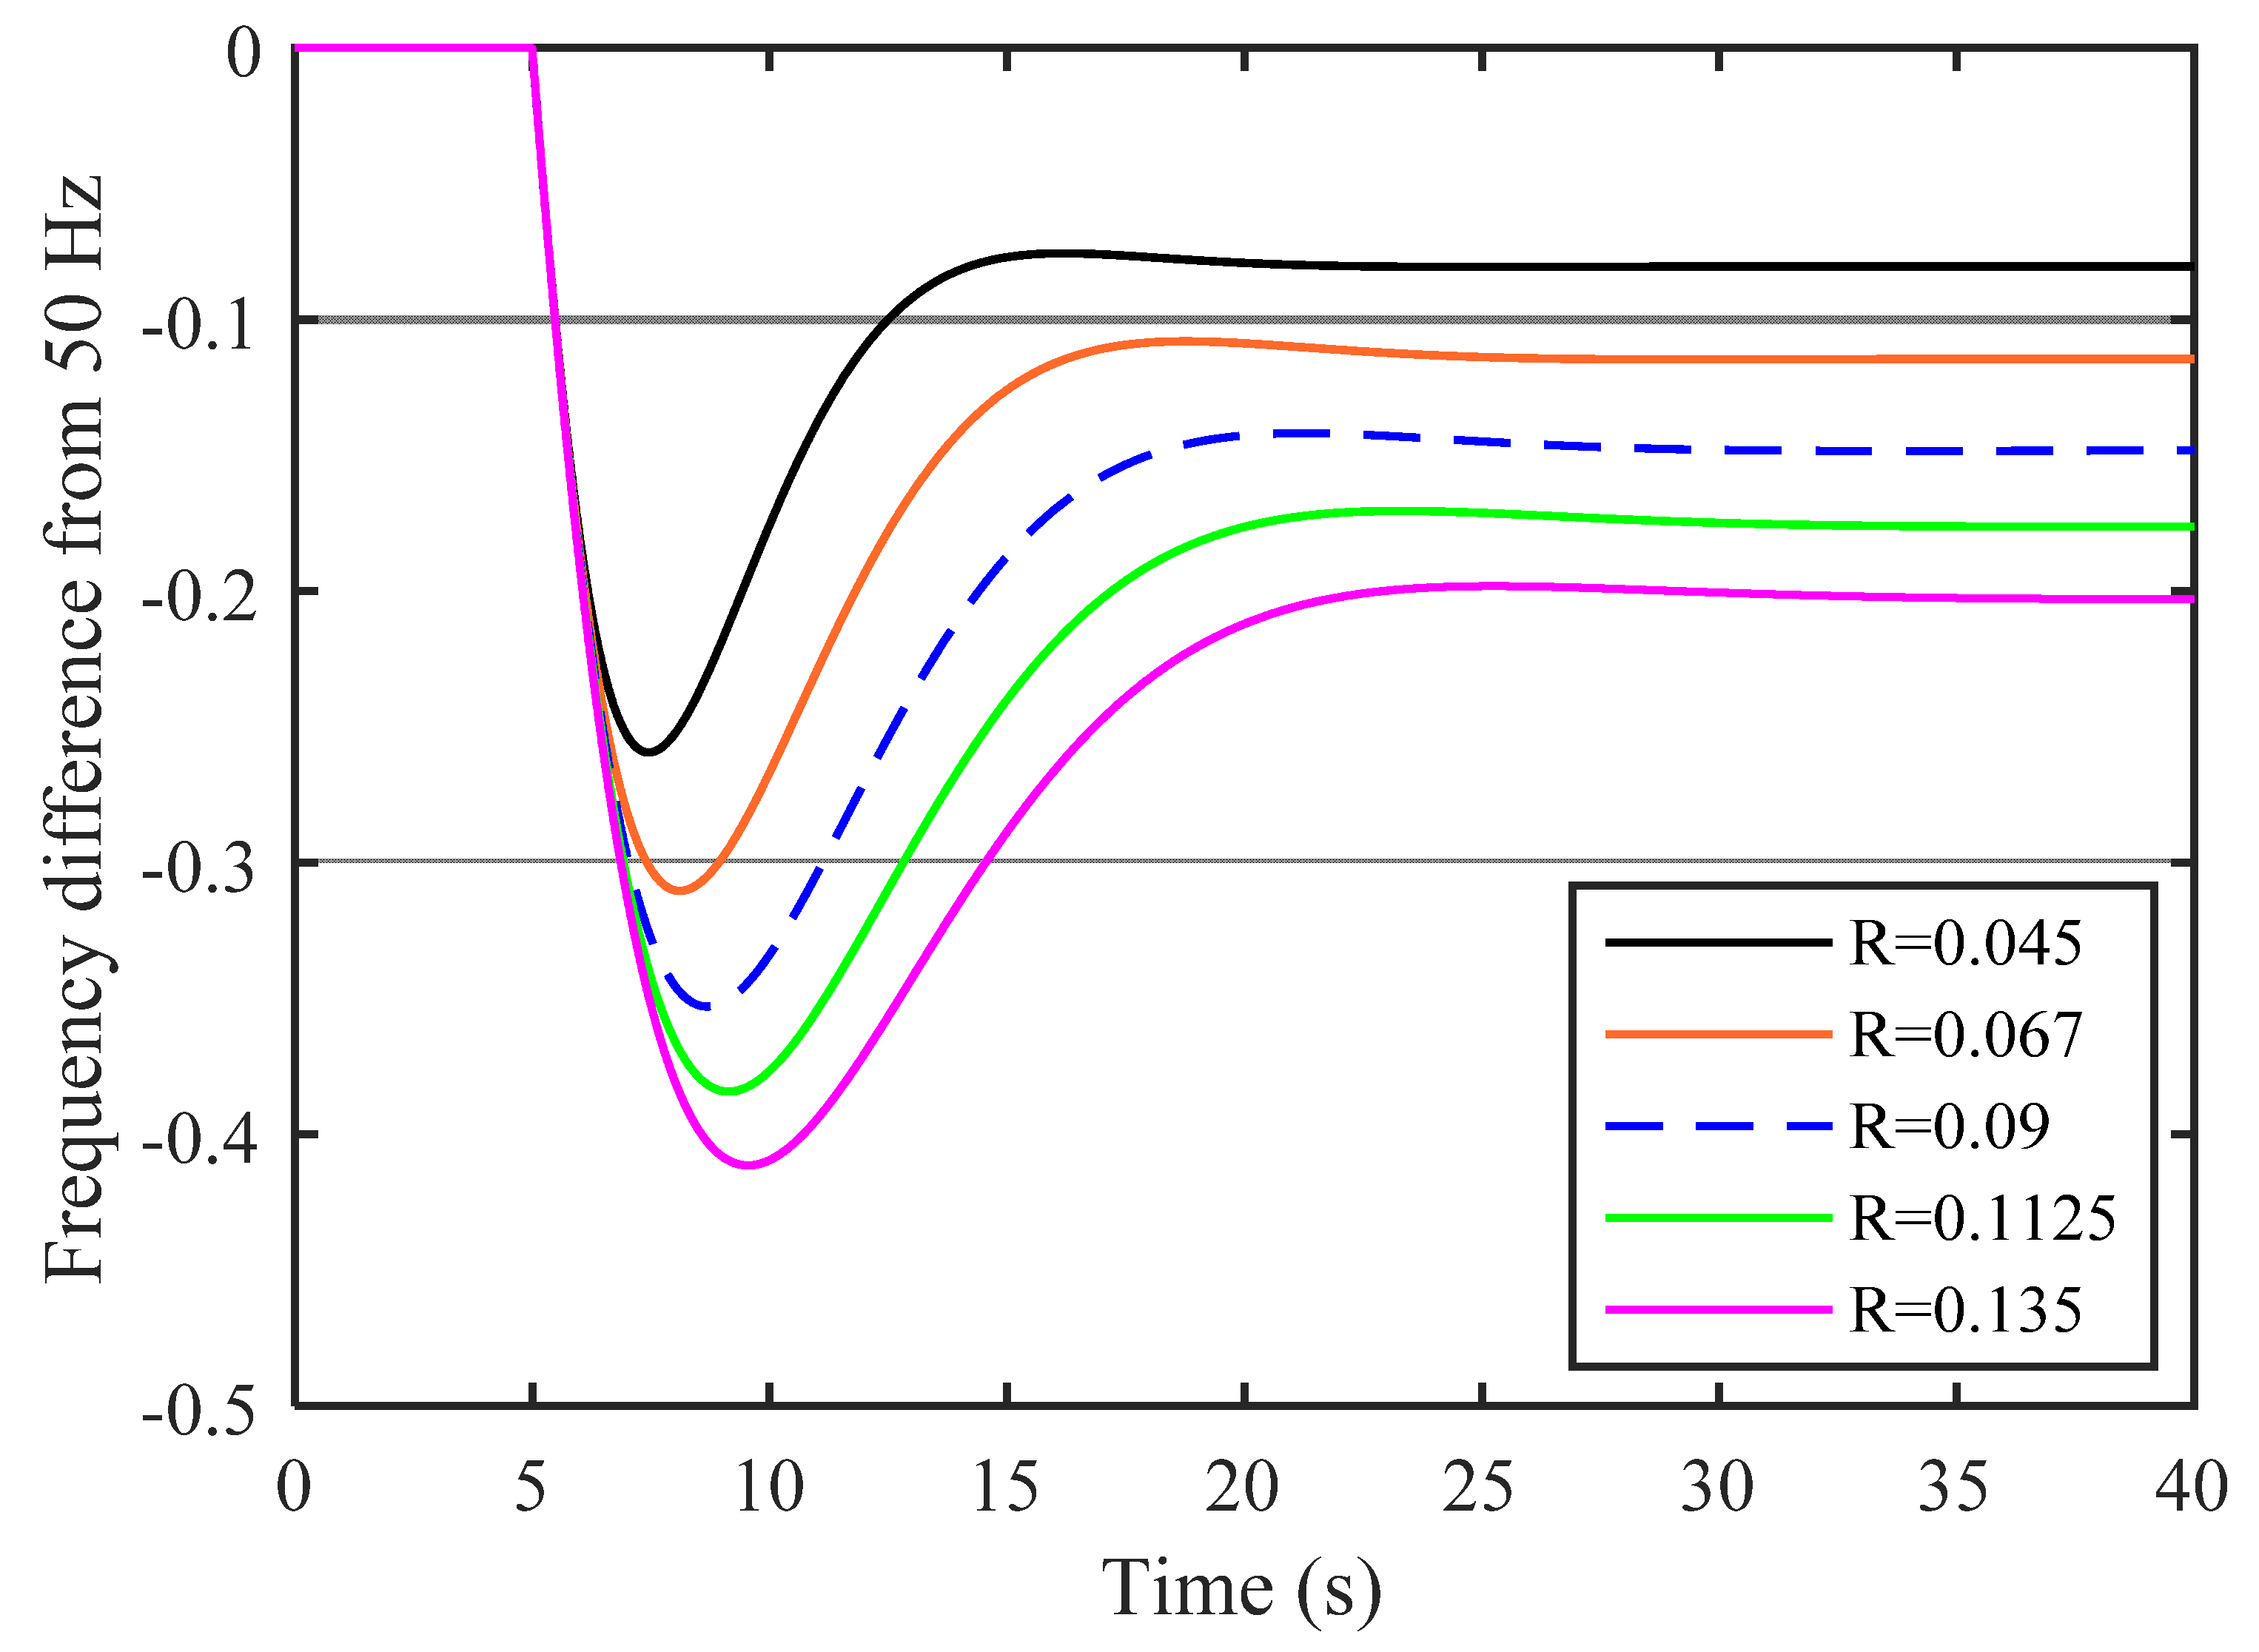
Designs 05 00050 g021
Figure 22. Frequency deviation in area 1 (∆F2) under parametric uncertainties.
Designs 05 00050 g022
Figure 23. Tie-line power deviation (∆Ptie) under parametric uncertainties.
Designs 05 00050 g023
Table 1. Frequency limits for the GB power system.
Frequency Constraints (Hz)Case Description
±0.2System frequency in normal operational conditions and the acceptable frequency deviation following a generation loss or connecting demand to ±300 MW.
±0.5The maximum deviation in frequency when generation units over 300 MW and of up to 1320 MW is lost.
−0.8The maximum deviation in frequency following a generation loss over 1320 MW and up to 1800 MW, requiring restoration of frequency to a minimum of 49.5 Hz in 60 s.
Table 2. Parameters for the simplified model of the power system.
RTgT1dT1gTtHeqDEv
−0.09 pu0.2 s2 s12 s0.3 s8.88 s1 pu1.35 pu
Table 3. Fuzzy rule base of the proposed controller.
∆F∆F
NBNSZPSPB
NBNBNBNBNSZ
NSNBNBNSZPS
ZNBNSZPSPB
PSNSZPSPBPB
PBZPSPBPBPB
Table 4. The BA parameters.
nmenepnspngh
301261170.011
Table 5. The PSO parameters.
No. ParticlesWminWmaxC1C2CR
300.40.9220.65
Table 6. Optimal gains of PID and FOPID with different algorithms for GB power system.
Proposed Optimization Algorithms/Controller Parameters
ControllerParametersBATLBOPSO
KP404040
PID-ISEKI18.6118.637318.6347
KD404040
KP404040
PID-ITAEKI2.30442.3832.3129
KD16.148314.52315.1724
KP404040
KI404040
FOPID-ISEKD404040
λ0.55840.558050.5562
μ0.34410.34500.3439
KP404040
KI404040
FOPID-ITAEKD404040
λ0.890.8720.8953
μ0.3880.31840.236
Table 7. Frequency response performances with PID tuned by different algorithms and designed by minimizing ISE.
ControllerUsh in HzOsh in HzTs in sErrorISE × 10−5
BA-PID−0.13010.0914833.77702.891
PSO-PID−0.13010.0914833.79302.891
TLBO-PID−0.13010.0914333.79402.891
Table 8. Frequency response performances with PID tuned by different algorithms and designed by minimizing ITAE.
ControllerUsh in HzOsh in HzTs in sErrorITAE
BA-PID−0.18403.51 × 10−39.425600.1515
PSO-PID−0.18593.71 × 10−39.279200.1508
TLBO-PID−0.18705 × 10−313.858000.1553
Table 9. Frequency response performances with FOPID tuned by different algorithms and designed by minimizing ISE.
ControllerUsh in HzOsh in Hz × 10−4Ts in sErrorISE × 10−6
BA-PID−0.128.918.01452.727.8
PSO-PID−0.127.87.95362.767.8
TLBO-PID−0.128.828.01372.737.8
Table 10. Frequency response performances with FOPID tuned by different algorithms and designed by minimizing ITAE.
ControllerUsh in HzOsh in HzTs in sErrorITAE
BA-PID−0.12820.0458.04500.0581
PSO-PID−0.13240.04639.082600.0558
TLBO-PID−0.13030.04178.739700.0566
Table 11. Optimal gains of Fuzzy PIDF with different algorithms for GB power system.
ProposedOptimization Algorithms/Controller Parameters
ControllerParametersBATLBOPSO
K13.412.993.88
K2404029.72
Fuzzy PIDFKP29.914026.60
ISEKI18.5939.9917.82
KD20.9314.99814.59
KC404040
K120.373.9557.1590
K238.1214.99724.2973
Fuzzy PIDFKP19.2539.99618.83
ITAEKI38.14407.68
KD4.2914.9953.889
KC404040
Table 12. 
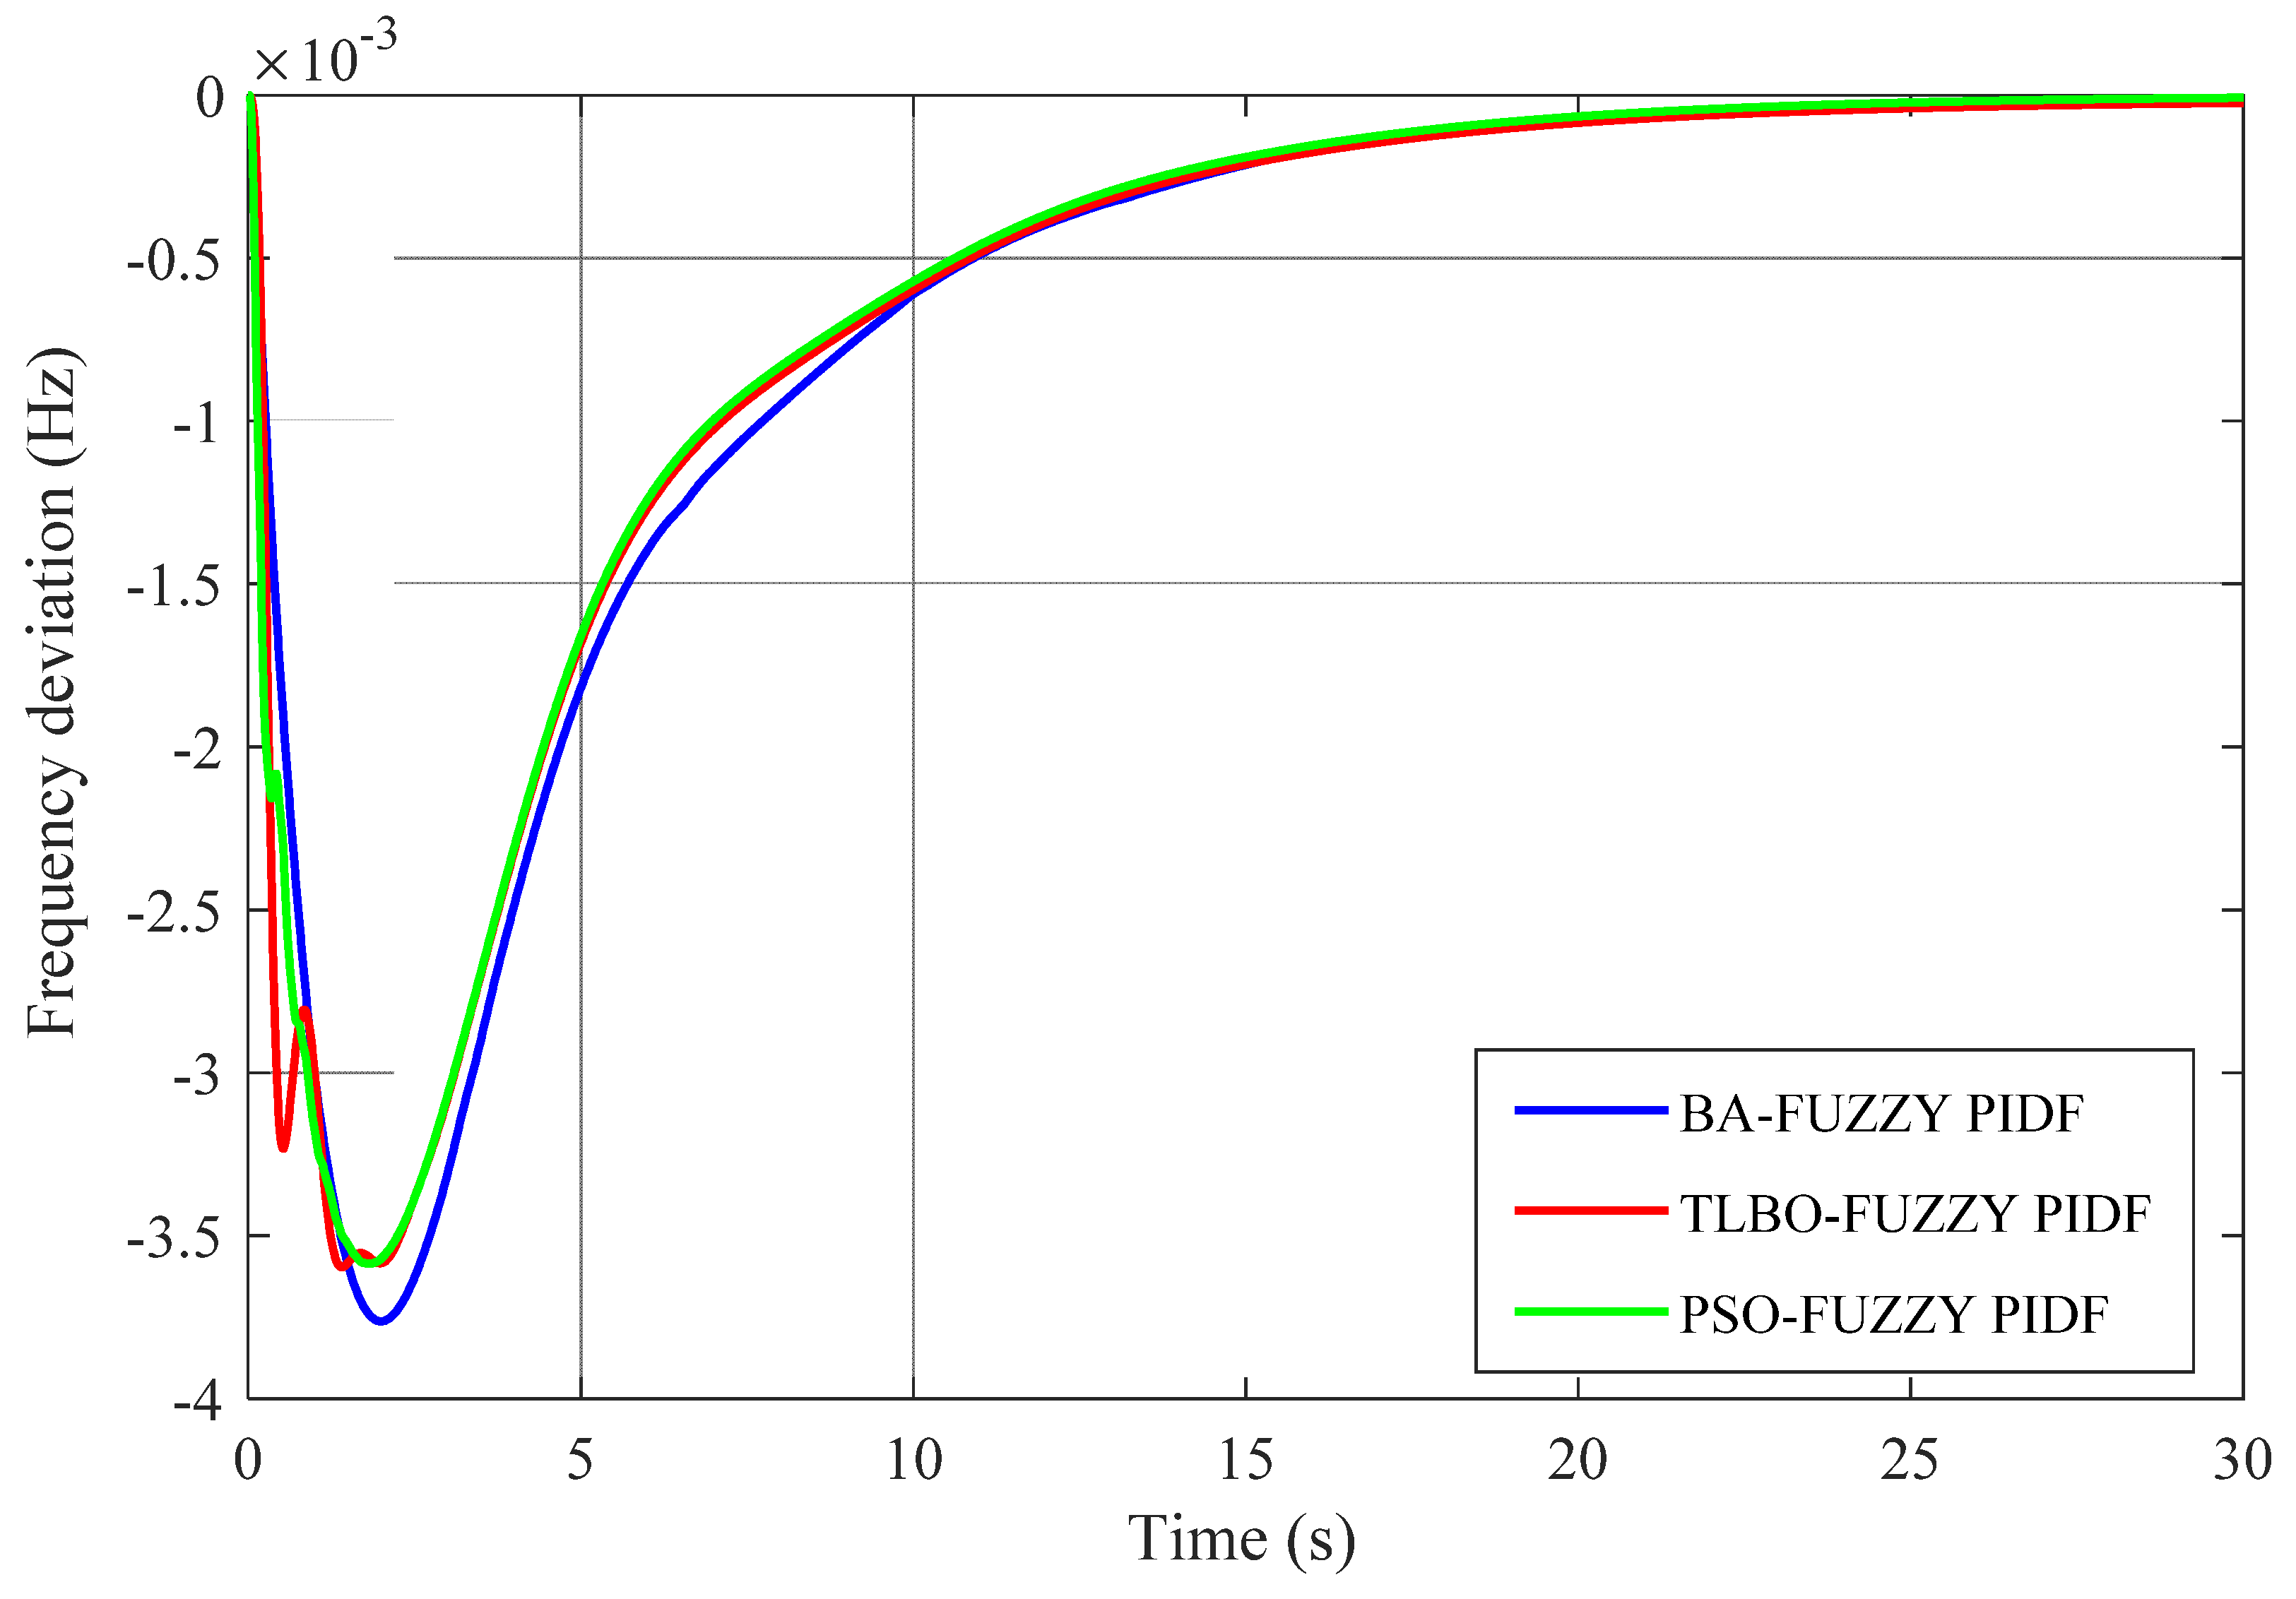
Frequency response performance with Fuzzy PIDF controllers designed via ISE.
ControllerUsh in HzOsh in HzTs in sErrorISE × 10−10
BA-Fuzzy PIDF−0.00282.37 × 10−411.794106.71
PSO-Fuzzy PIDF−0.00452.8 × 10−411.7689015.2
TLBO-Fuzzy PIDF−0.00481.75 × 10−48.852306.88
Table 13. Frequency response performance with Fuzzy PIDF controllers designed via ITAE.
ControllerUsh in HzOsh in HzTs in sErrorITAE
BA-Fuzzy PIDF−0.00572.15 × 10−48.377600.000391
PSO-Fuzzy PIDF−0.007933.7 × 10−413.630300.001065
TLBO-Fuzzy PIDF−0.00434.9 × 10−410.938900.000495
Table 14. The variation range of the parameters in the two scenarios.
ScenariosParametersNominal Value Variation RangeNew Value
Scenario1Tg0.2+50%0.3
Heq4.44+50%6.66
D1−50%0.5
R−0.09−50%0.045
Scenario2Tg0.2−50%0.1
Heq4.44−50%2.22
D1+50%1.5
R−0.09+50%0.135
Table 15. Frequency response performances with different BA-tuned controllers designed via ISE for scenario 2.
ControllerUsh in HzOsh in Hz Ts in sErrorISE
BA-Fuzzy PIDF−0.00422.68 × 10−412.6106.77 × 10−10
BA-FOPID−0.14109.40−2.75 × 10−30.0454
BA-PID−0.126022.0900.1643
Table 16. Frequency response performance with different BA-tuned controllers designed via ITAE for scenario 2.
ControllerUsh in HzOsh in Hz Ts in sErrorITAE
BA-Fuzzy PIDF−0.0062.68 × 10−48.2200.0004
BA-FOPID−0.1430.02015.1600.0454
BA-PID−0.178020.75−4 × 10−30.1643
Table 17. Frequency response performance with BA tuned different controllers designed via ITAE for scenario 2.
ControllerUsh in HzOsh in Hz Ts in sErrorITAE
BA-Fuzzy PIDF−0.00832.8 × 10−48.2200.00056
BA-FOPID−0.1710.060313.04−3 × 10−40.0779
BA-PID−0.2465 × 10−314.4200.203
Table 18. Frequency response performances with BA-tuned controllers designed via minimizing ITAE in scenario 2 with 0.053 pu load disturbance.
ControllerUsh in HzOsh in HzTs in sErrorITAE
BA-Fuzzy PIDF−0.00982.7 × 10−48.02100.00058
BA-FOPID−0.1910.02815.16−3.1 × 10−40.06096
BA-PID−0.239020.75−5.5 × 10−40.22020
Table 19. Frequency response performances with different controllers.
ControllerController Gains of Area 1Controller Gains of Area 2
K1K2KP1KI1KD1KF1K3K4KP2KI2KP2KF2
Fuzzy PIDF-BA0.403222298.48410.26481.00810.91331.97301.988993.8922
Fuzzy PIDF-TLBO 0.0351.99921.99861.998681.999599.06061.96020.037070.44351.30030.01999.7446
Fuzzy PIDF-PSO0.0222221002220.0151.403511.21
Table 20. Frequency response performances with different controllers.
ControllerFrequency in Area 1Frequency in Area 2Tie-Line Power DeviationITAE
Ush in HzOsh in HzTs in sUsh in HzOsh in HzTs in sUsh in puOsh in puTs in s
Fuzzy PIDF-BA0.04140.00416.94010.0038019.29910.0010019.3600.0361
Fuzzy PIDF-TLBO 0.08680.00405.75440.0036019.32730.00099018.8930.0304
Fuzzy PIDF-PSO0.08900.00405.71750.0036019.10200.0010019.1540.0330
Table 21. The parameters of the testbed system under parametric uncertainties.
ParametersNominal ValuesVariation RangeNew Values
Area 1Area 2Area 1Area 2
Tg0.20.3+50%0.30.45
Tt0.50.6+50%0.750.9
B20.616.9−50%10.38.45
D0.60.9−50%0.30.45
H54+50%7.56
Table 22. Frequency response performances with different controllers.
ControllerFrequency in Area 1Frequency in Area 2Tie-Line Power DeviationITAE
Ush in HzOsh in HzTs in sUsh in HzOsh in HzTs in sUsh in puOsh in puTs in s
Fuzzy PIDF-BA0.11400.01315.98580.020309.37810.0026010.4530.03094
Fuzzy PIDF-TLBO 0.14580.01115.43780.02780.0018314.8180.00260.0000659.37690.0511
Fuzzy PIDF-PSO0.14650.01155.44680.0175010.2690.0024010.4210.02535
Publisher’s Note: MDPI stays neutral with regard to jurisdictional claims in published maps and institutional affiliations.

