Abstract
The purpose of this paper is to propose a novel process failure mode and effect analysis (PFMEA) approach for the reliable design of assembly activities to prevent product defects due to errors during the assembly of complex products. PFMEA is approached as an integrated method that, in addition to implementing recommended actions, supports the design of worksheets, equipment, and layout of the assembly lines of complex systems, early in the design phase of the product. As a result, the innovative design-job element sheets (D-JESs), which report work instructions to the operator for assembly cycles, are defined before the design of the production and assembly process. The modification of the PFMEA structure, the implementation of proper recommended actions, and the designs of D-JESs, equipment, and assembly layout, early in the design phase of the product, are the novel contributions of the paper. The integrated method assures to effectively design the assembly process directly during the product design to avoid errors that could promote dissatisfaction of the end-users. It is practical to use and does not require large investments, implementation of new technologies, or complex additional training. Its practical application is demonstrated using a case study concerning a manufacturer of train wagons via manual assembly lines.
1. Introduction
The philosophy of build-in reliability (BIR) is widely adopted by current manufacturing industries, as customers demand greater reliability for all products [1]. The BIR principles are used during the early stages of product development (i.e., design and industrialization) to ensure that both wear-out and special failure mechanisms are eliminated (or strongly reduced and controlled) from the useful life of the product. Specifically, BIR describes the entire set of tools that support product and process design to ensure that customer’s expectations for reliability are fully satisfied throughout the whole life of the product. In other words, BIR is a systematic, streamlined, concurrent engineering program in which reliability engineering is weaved into the total development cycle. BIR process encompasses a variety of tools and practices and describes the overall order of deployment that an organization needs to follow to design reliability into its products.
In reference [2], Mettas presents an interesting discussion concerning tools and techniques in support of product reliability improvement breaking down the BIR (or design for reliability, DFR) process into six key activities, which are: define, identify, analyze and assess, quantify and improve, validate and monitor, and control. By dividing the process into these activities, analysts can identify and group the different tools, and provide a roadmap that can easily be followed, as well as easily mapped into a product development process. Understanding when, what, and where to use the wide variety of the available reliability engineering tools will help to achieve the reliability mission of an organization. This aspect is becoming more important with the increasing complexity of systems often characterized by low volume, high variety, and low production rate. In this context, it is far less expensive to prevent problems early in product development than fix problems after production launch. In other words, to properly implement BIR, it is necessary to identify the various possible failure modes associated with a product or a service.
A systematic tool of BIR that can present this peculiarity is the process failure modes and effects analysis (PFMEA). A very important aspect of the BIR project includes the PFMEA as a tool generally used to examine how the reliability of a product (or service) can be guaranteed during the manufacturing and assembly processes. If correctly applied [3], PFMEA is an important tool able to emphasize how the manufacturing process can be improved to ensure that the assembly operations are accomplished as intended in a safe and reliable manner, with minimal downtime, scrap, and rework [4]. Although PFMEA is a well-established method extensively used in a variety of industries [5], it can present important shortcomings related to the fact that it is applied during a preliminary stage of product development. In this phase only product design data, not yet consolidated, are available. This aspect implies difficulties in the execution of the PFMEA. For example, in reference [6], Teng and Ho present some of these problems:
- It can be difficult to use the PFMEA information in the overall quality system operation to achieve the goal to improve the product/process design;
- It is not always clear which activities in the process are the most critical to monitor and control;
- It is not easy to define a well-trained and balanced team. There are problems related to the cooperation among team members, especially when they have different personal backgrounds and come from different functions;
- The representation of the cause and the effect chain is not always clear;
- There are difficulties at the co-ordination level.
In addition, if a product is complex, the number of possible failure modes can be great, rendering PFMEA too large to be practical. Probably, the timing of the PFMEA process at the design stage can be considered the main critical aspect of this tool. According to this, in reference [7], Johnson and Khan propose a case study for PFMEA conducted in 150 supplier companies of the automotive industry showing that most of the surveyed suppliers see PFMEA as additional administrative work which wastes a lot of time and gives back few benefits.
In order to overcome these aspects, several authors have suggested integrating the FMEA tool with other methods (see, for example, [8] and [9]). More recently, in reference [10], Spreafico et al. analyzed a representative pool of scientific papers (220) and patents (109), to overview the evolution of the methods and to try to understand whether they effectively improve it. A summary classification of the integrated tools and techniques developed in complex systems, that can be useful to solve the problems cited above, is reported as follows:
- Root cause analysis [11] and Ishikawa diagrams [12] to facilitate the cause and effect representation to better understand the failure behavior of components in the system;
- Introduction of infographics [13] to represent the results and the relations among the identified failures;
- Mathematical and statistical methods (i.e., Fuzzy logic [14]) to overcome the drawbacks of diversified and imprecise judgments when team members have different expertise;
- Quality Function Deployment (QFD) method [15] has operated through the analysis of the requirement alternatives from a customer perspective helping PFMEA to identify the associated risks for the alternatives.
It is possible to observe that all these methods and tools offer integrated solutions useful to face narrow and specific problems: they make it possible to obtain satisfying accuracy but unfortunately with a large increase in complexity and effort. Furthermore, they increase the difficulty to manage (i) large bills of materials that mutually interact in complex systems and (ii) product assembly instructions in early design stages based only on design (i.e., limited) information. Hence, these integrated-approaches risk oversizing an analysis that, due to its simplicity, should help the analysts to identify and correct the failure modes that have a detrimental effect on the system and to guarantee product reliability during the stages of production.
In this paper, we present a novel method to overcome these limits proposing a revised general PFMEA method that can be adopted and deployed with a few modifications across different industries in a way that will fit well into the overall Product Development Process. The novel approach can be systematically applied as a support tool to define the product assembly instructions in early design stages supporting the design of the job element sheets, of the equipment, and of the assembly line layout.
A job element sheet (JES) is a document that provides detailed information to support the successful execution of a specific and consolidated job element [16]. JESs are used in Lean manufacturing companies to obtain fundamental standardization and continuous improvement [17]. In this manuscript, JES is opportunely renamed design-job element sheet (D-JES) to highlight the fact that D-JES is designed when the production and assembly process has not yet been started, being based only on design data. The purpose of the D-JESs, which summarize all essential information obtained during PFMEA, is to overcome the gap between engineering information and shop floor knowledge. They are complete sheets located at the assembly stations and can be used as useful support for the operators so that the assembling operations can be correctly executed. Hence, the realization of D-JES is an important outcome of the PFMEA, which supports the product development from the design phase. So, the problem-solving activity is surely more helpful and effective because there are more margins of modifications during the design phase.
In order to fill the crucial gaps stated above, the main challenges addressed by the paper are the following:
- To propose a novel PFMEA approach for the reliable design of assembly activities to prevent product defects due to errors during assembly of complex products;
- To propose an integrated method that in addition to implementing recommended actions, supports the design of worksheets, equipment, and assembly line for complex systems, early in the design phase of the product;
- To propose a practical-to-use method, which does not require large investments, implementation of new technologies, and complex additional training.
The paper is organized as follows. In the second section, the background for the proposed methodological method is provided. A practical application is commented on in the third section using a real industrial implementation concerning a manufacturer of train wagons via manual assembly lines and is presented within the paper as a case study. Finally, the fourth section is devoted to conclusions and proposals for future possible developments.
2. Methodology
2.1. General Procedure
The novel procedure that is proposed in this paper is based on the traditional PFMEA whose main objective is finding and correcting weaknesses of the product before it gets into the hands of the customer [4].
“(P)FMEA is one of the most used root-cause problem-solving tools with cause and effect (CED) diagram, interrelationship diagram, current reality tree, and the 5-Whys analysis [18]. Different from other more sophisticated problem-solving techniques, the PFMEA does not involve advanced statistical tools and is particularly suitable to be integrated into several industrial contexts. An Ishikawa diagram, i.e., a CED diagram, does not single out the root cause of the problem because all causes look equally important. Effort can be wasted on identifying causes that have little effect on the problem. The lack of rigor is the main drawback of the 5-Whys analysis, as the analysts are not required to test for sufficiency the root causes generated. In reference [19], Latino et al. stated that people tend to use this tool as individuals and not in a team, and they rarely back up their assertions with evidence.
In our study, PFMEA was conducted in collaboration with different expertise to validate the failure modes found during the analysis. Therefore, to maintain operational simplicity and speed in carrying out the analysis, mathematical and statistical approaches have not been used and more complex techniques have not been considered. Nevertheless, the purpose for which we use this tool in our approach offers a guarantee of its adequacy.
Specifically, PFMEA is approached as an integrated method and tool that, in addition to implementing recommended actions, supports the design of worksheets, equipment, and assembly line layout of complex systems, early in the design phase of the product.
For this reason, it is necessary to integrate conventional aspects of PFMEA based on the probability of failure, the chance of non-detection, and severity with technical considerations such as components involved, tools, and equipment used in the production process. The production and the assembly process are studied before the PFMEA. The decomposition of the manufacturing process is divided into the following steps (Table 1):

Table 1.
Example of identification and decomposition of the specific steps for a process failure mode and effect analysis (FMEA).
- Identification of the specific steps of the manufacturing or assembly process for analysis purposes. System steps are defined by a set of activities belonging to the same operational area (i.e., acceptance and storage, production and design stage, and quality control phase);
- Where appropriate, splitting of process steps in activities/tasks (where a task is a set/group of elementary activities), and finally in elementary operations.
The decomposition of the production and the assembly process must be well known and available during a PFMEA for the following reasons:
- The decomposition gives the sequence to properly conduct the analysis: in this way, it is carried out according to the sequential order in which the elementary operations are executed within the process step under consideration;
- Each step of the analysis takes on well-defined boundaries. This aspect is not a limit of the method because, during the analysis of a step, it is always possible to annotate considerations that regard other tasks and elementary operations.
2.2. General Procedure
Once the decomposition is performed, the PFMEA analysis can be started. Many published standards cover the scope and general procedure of FMEAs. Table 2, which is inspired by Automotive Industry Action Group (AIAG) [20], can be used to conduct this analysis, pursuing our goals of proper implementation of the methodology and giving regularity to the analysis. The PFMEA is divided into six steps presented in the sequence they should be developed to fill the columns of the table in an orderly and identifiable way.

Table 2.
Table used to conduct the analysis.
STEP 1. Clear explanation of the function of elementary operations
In this step, a clear definition of the function of all the elementary operations involved in the process is required. A “function” is what the operation is intended to do, usually under a given standard of performance or requirement. This is the primary purpose of the manufacturing or assembly operation. Identifying the function of the elementary operation is fundamental since it allows recognizing the cases in which the operation is not carried out correctly and, consequently, the effects of such failure.
STEP 2. Identification and explication of the components involved in the elementary operations
The components that are involved directly in the operation and that can be indirectly affected are identified. The identification and explication allowed highlighting the components that, directly or indirectly, can fail if the operation is carried out incorrectly.
STEP 3. Definition of equipment and tools
This column contains all the tools and equipment available to complete the elementary operation. This aspect is useful for finding alternative tools or equipment to lower the likelihood of making mistakes during the operations.
STEP 4. Identification of potential failure mode, failure effects, and causes of failure events
A “failure mode” is how the item or operation potentially fails to meet or deliver the intended function and associated requirements [4]. An “effect” is the consequence of the failure on the system or on the end-user. The “cause” is the specific reason for the failure, preferably found by asking “why” until the root cause is determined. For PFMEAs, the cause is the manufacturing or assembly deficiency that results in the failure mode.
STEP 5. Evaluating the risk level for each failure and ranking the failure for the criticality assessment
Traditionally, the criticality evaluation to prioritize the failure modes of the product or system under analysis is executed by developing a risk priority number (RPN). To this purpose using linguistic terms the chance of the failure mode occurrence (O), the chance of the failure being undetected (D), and the severity of its failure effect (S) are evaluated on a numeric scale from 1 to 10. Well known “conversion” tables (see, for example, [4,20,21]) report the typical basis for the linguistic judgment scales used to estimate the three quantities which are used to calculate the RPN value as follows:
RPN = O ∙ D ∙ S
STEP 6. Writing the recommended actions
Recommended actions are the tasks recommended by the team to reduce or eliminate the risk associated with potential causes of failure. In identifying the recommended actions, the team should consider existing controls, relative prioritization of the issue, and effectiveness of the corrective actions. Then, the team should assign the recommended actions to the person responsible, to efficiently execute them. RPNs should be recalculated after the implementation of the corrective actions to check their efficiency and to control whether the risks have gone down.
2.3. Definition of the Design-Job Element Sheets
JESs consist of a set of work procedures establishing the best methods and sequences for each process and each worker, where a job element represents a minimum action or group of actions required to advance the job or to add value to the product [16].
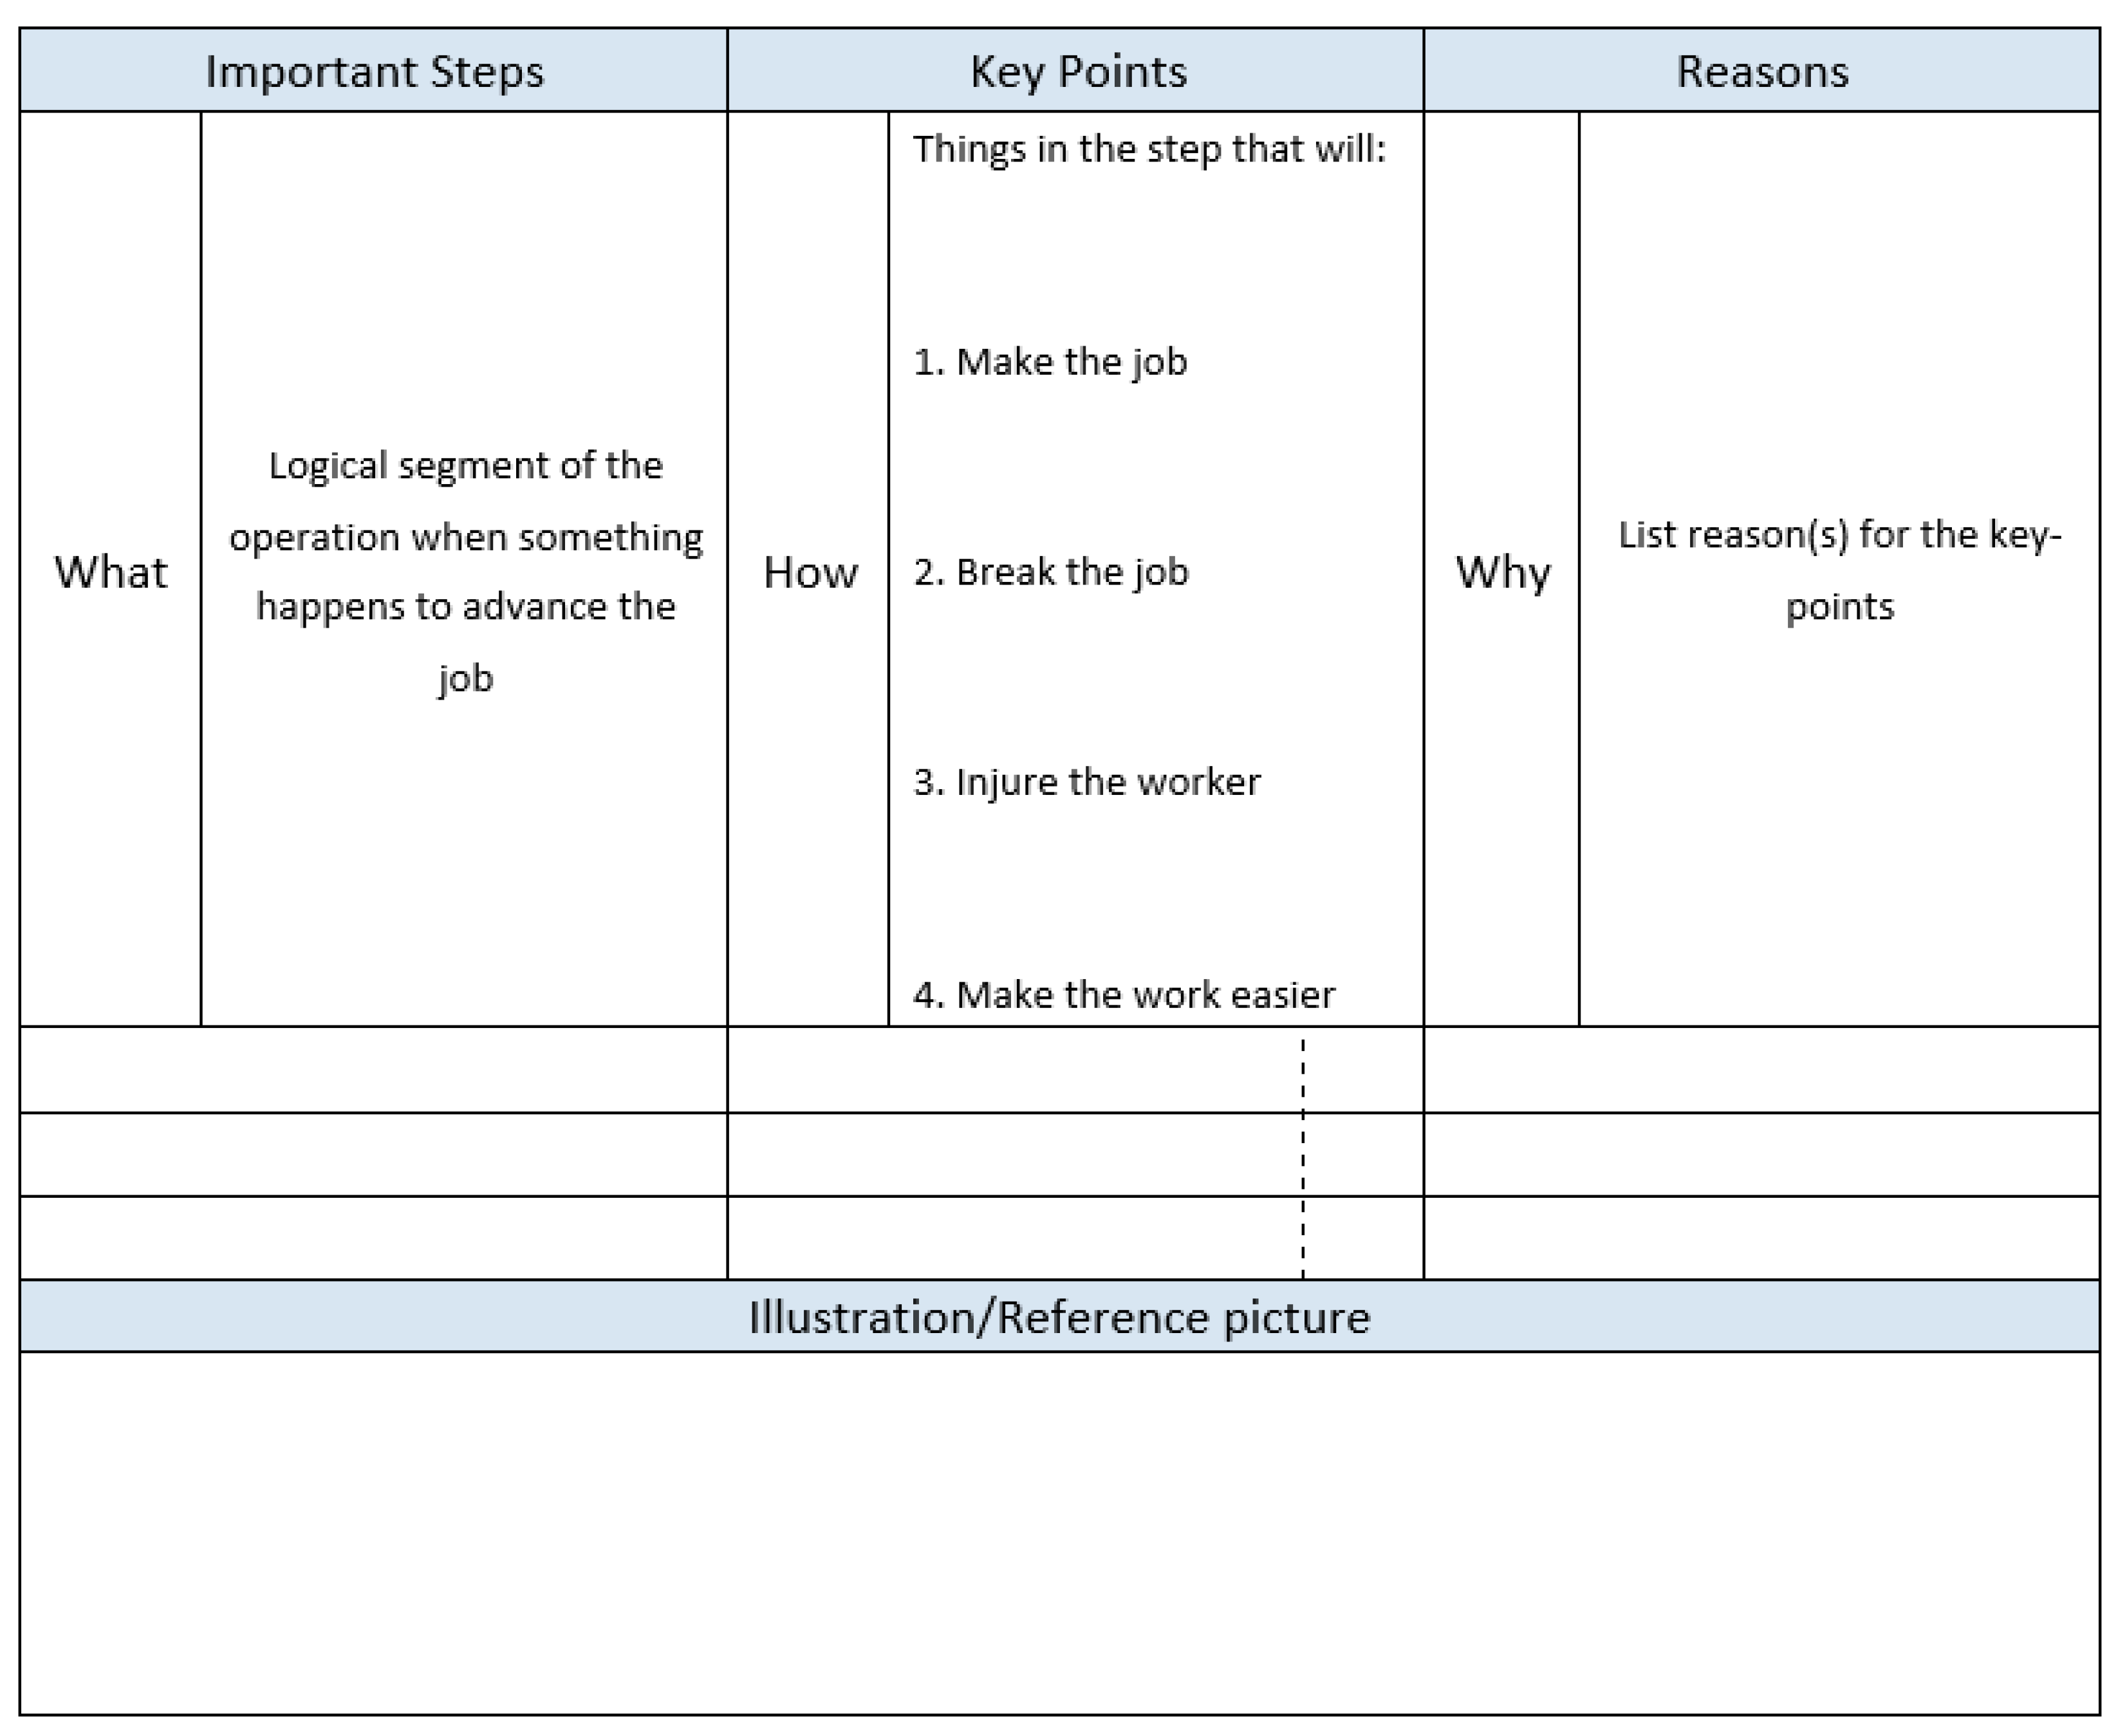
Traditionally, a JES (Figure 1) is a module, usually paper-based, that provides detailed information to support the successful execution of a specific job, listing what to do (important steps), how to do it (key points), and why to do it (reasons). A key point is defined as any part of the important step that can make or break the job, injure the worker, or make any part of the important step easier to do [17]. JESs are tools for the lead, supervisor, or manager of that area, and they are placed facing away from the operator to facilitate the manager’s easy access to the information [16].
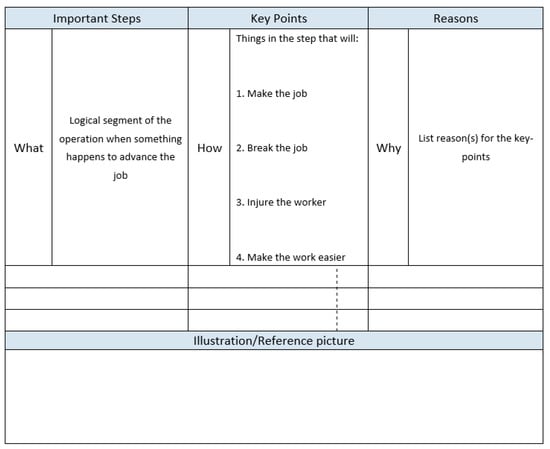
Figure 1.
Conventional job element sheet.
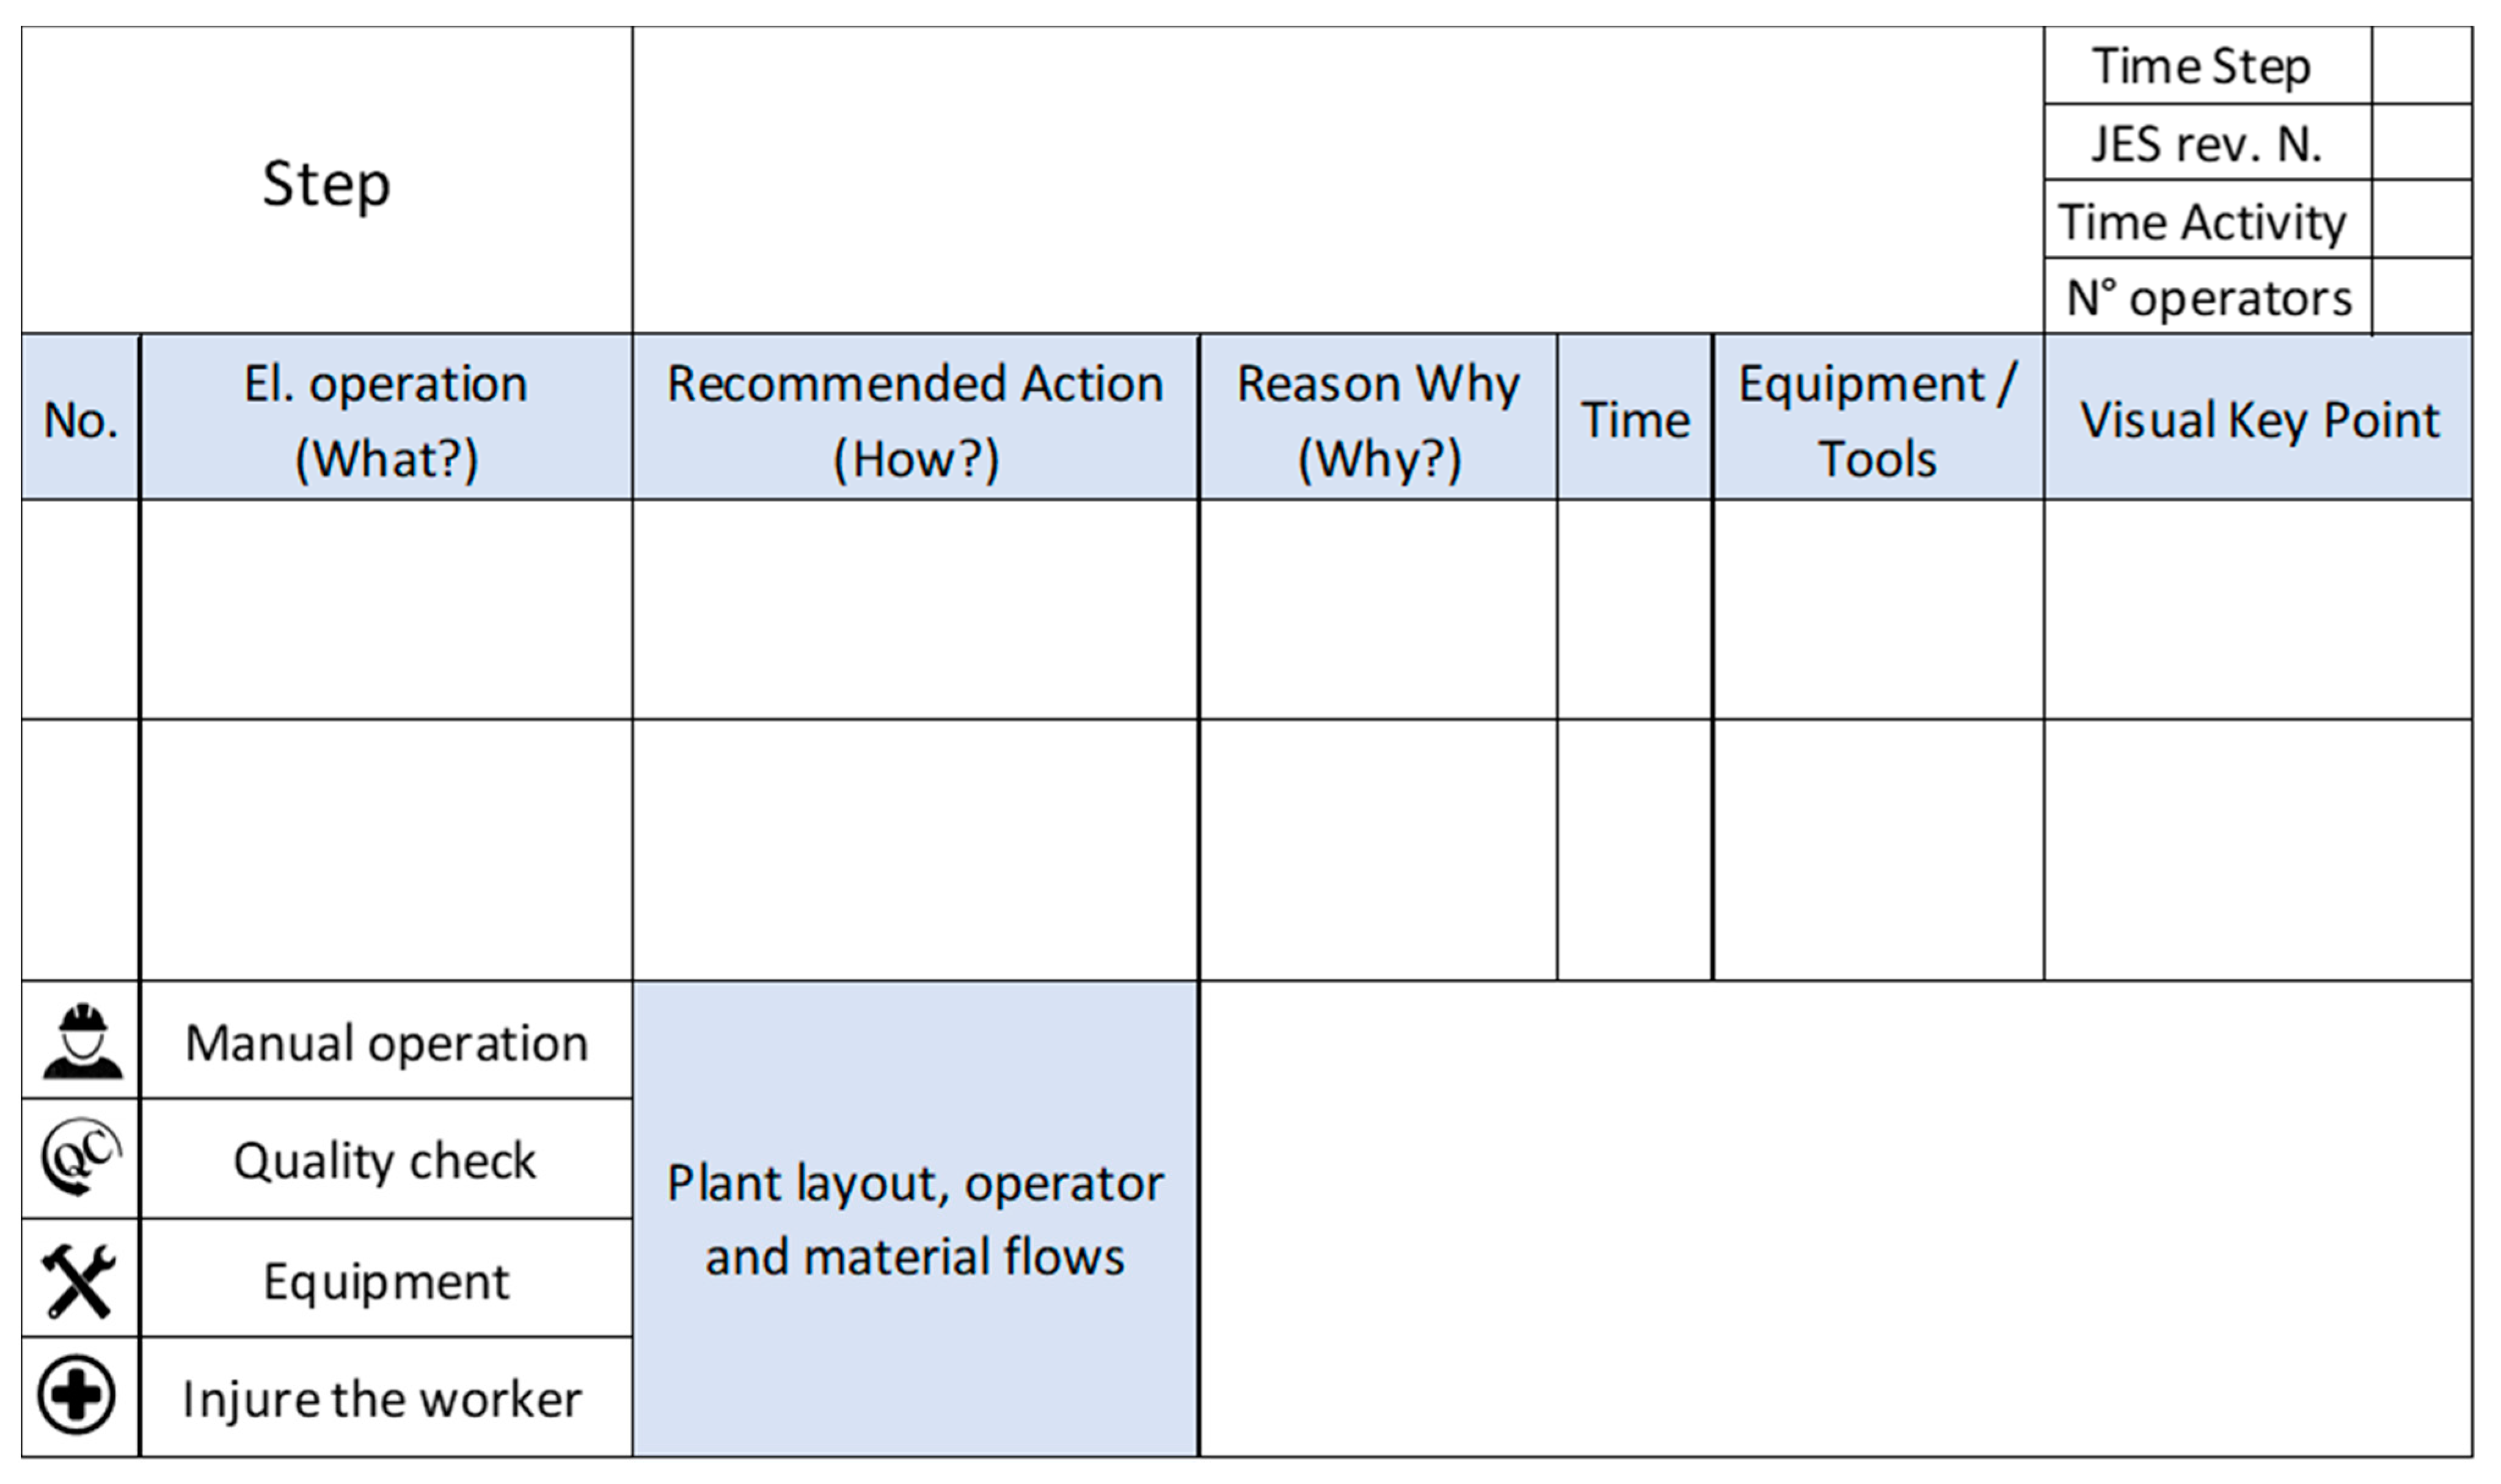
JESs are designed when the production and assembly process have already been designed, representing the culmination of the Lean production process. For this reason, in comparison with the traditional JES, the modules here proposed are named design-job element sheets (D-JESs) (Figure 2) to highlight the fact that the production and the assembly process have not yet been designed. D-JESs are work instructions that guide the operator in the correct fulfillment of all the assembly operations by making available all the key information collected during the PFMEA analysis.
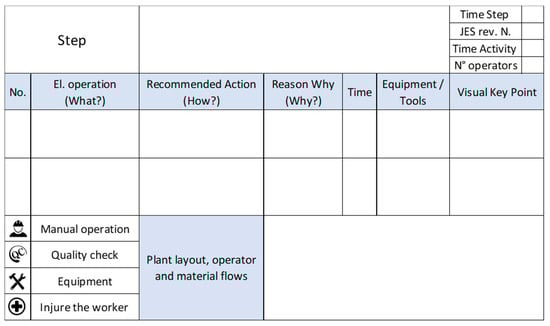
Figure 2.
Design-job element sheet (D-JES).
D-JESs, in analogy with JESs, are divided into steps, where each step is an elementary operation. Elementary operations and key points are used to facilitate understanding as well as a way of standardizing the format. The actions that are recommended with PFMEA could be interpreted as key points indications to complete the various elementary operations. In addition, columns highlighted in Table 2 have been studied to record the sequence of the job, to diagram the operator movement, to incorporate material usage and flow, and to estimate the expected time for the elementary operation.
D-JES should be posted in the work area to ensure that the work is always done in the same way, regardless of the operator who executes it.
Therefore, D-JES can include one or more drawn schematics, put hand sketches, diagrams, parts, or layouts.
The D-JES proposed in this paper has several benefits, in comparison with the conventional JES (Table 3):

Table 3.
Summary comparison between job element sheets (JESs) and D-JESs.
- It provides, for each activity, a continuously updated module that contains all the fundamental assembly information collected during PFMEA analysis, about the elementary operation, components involved, tools, equipment, and safety aspects;
- It supports the operators to the fulfillment of all assembly operations;
- It is a useful tool for fast and effective training and a synthetic way to standardize the work optimizing the skill transfer to new employees;
- It permits establishing a starting point from which it is possible to improve.
The last point requires further consideration. The main aim of this integrated approach is to achieve a more reliable, efficient, and standardized production and assembly process. So, it is necessary to proceed with a continuous updating of the D-JES modules whenever feedback from the field is collected.
3. Case Study
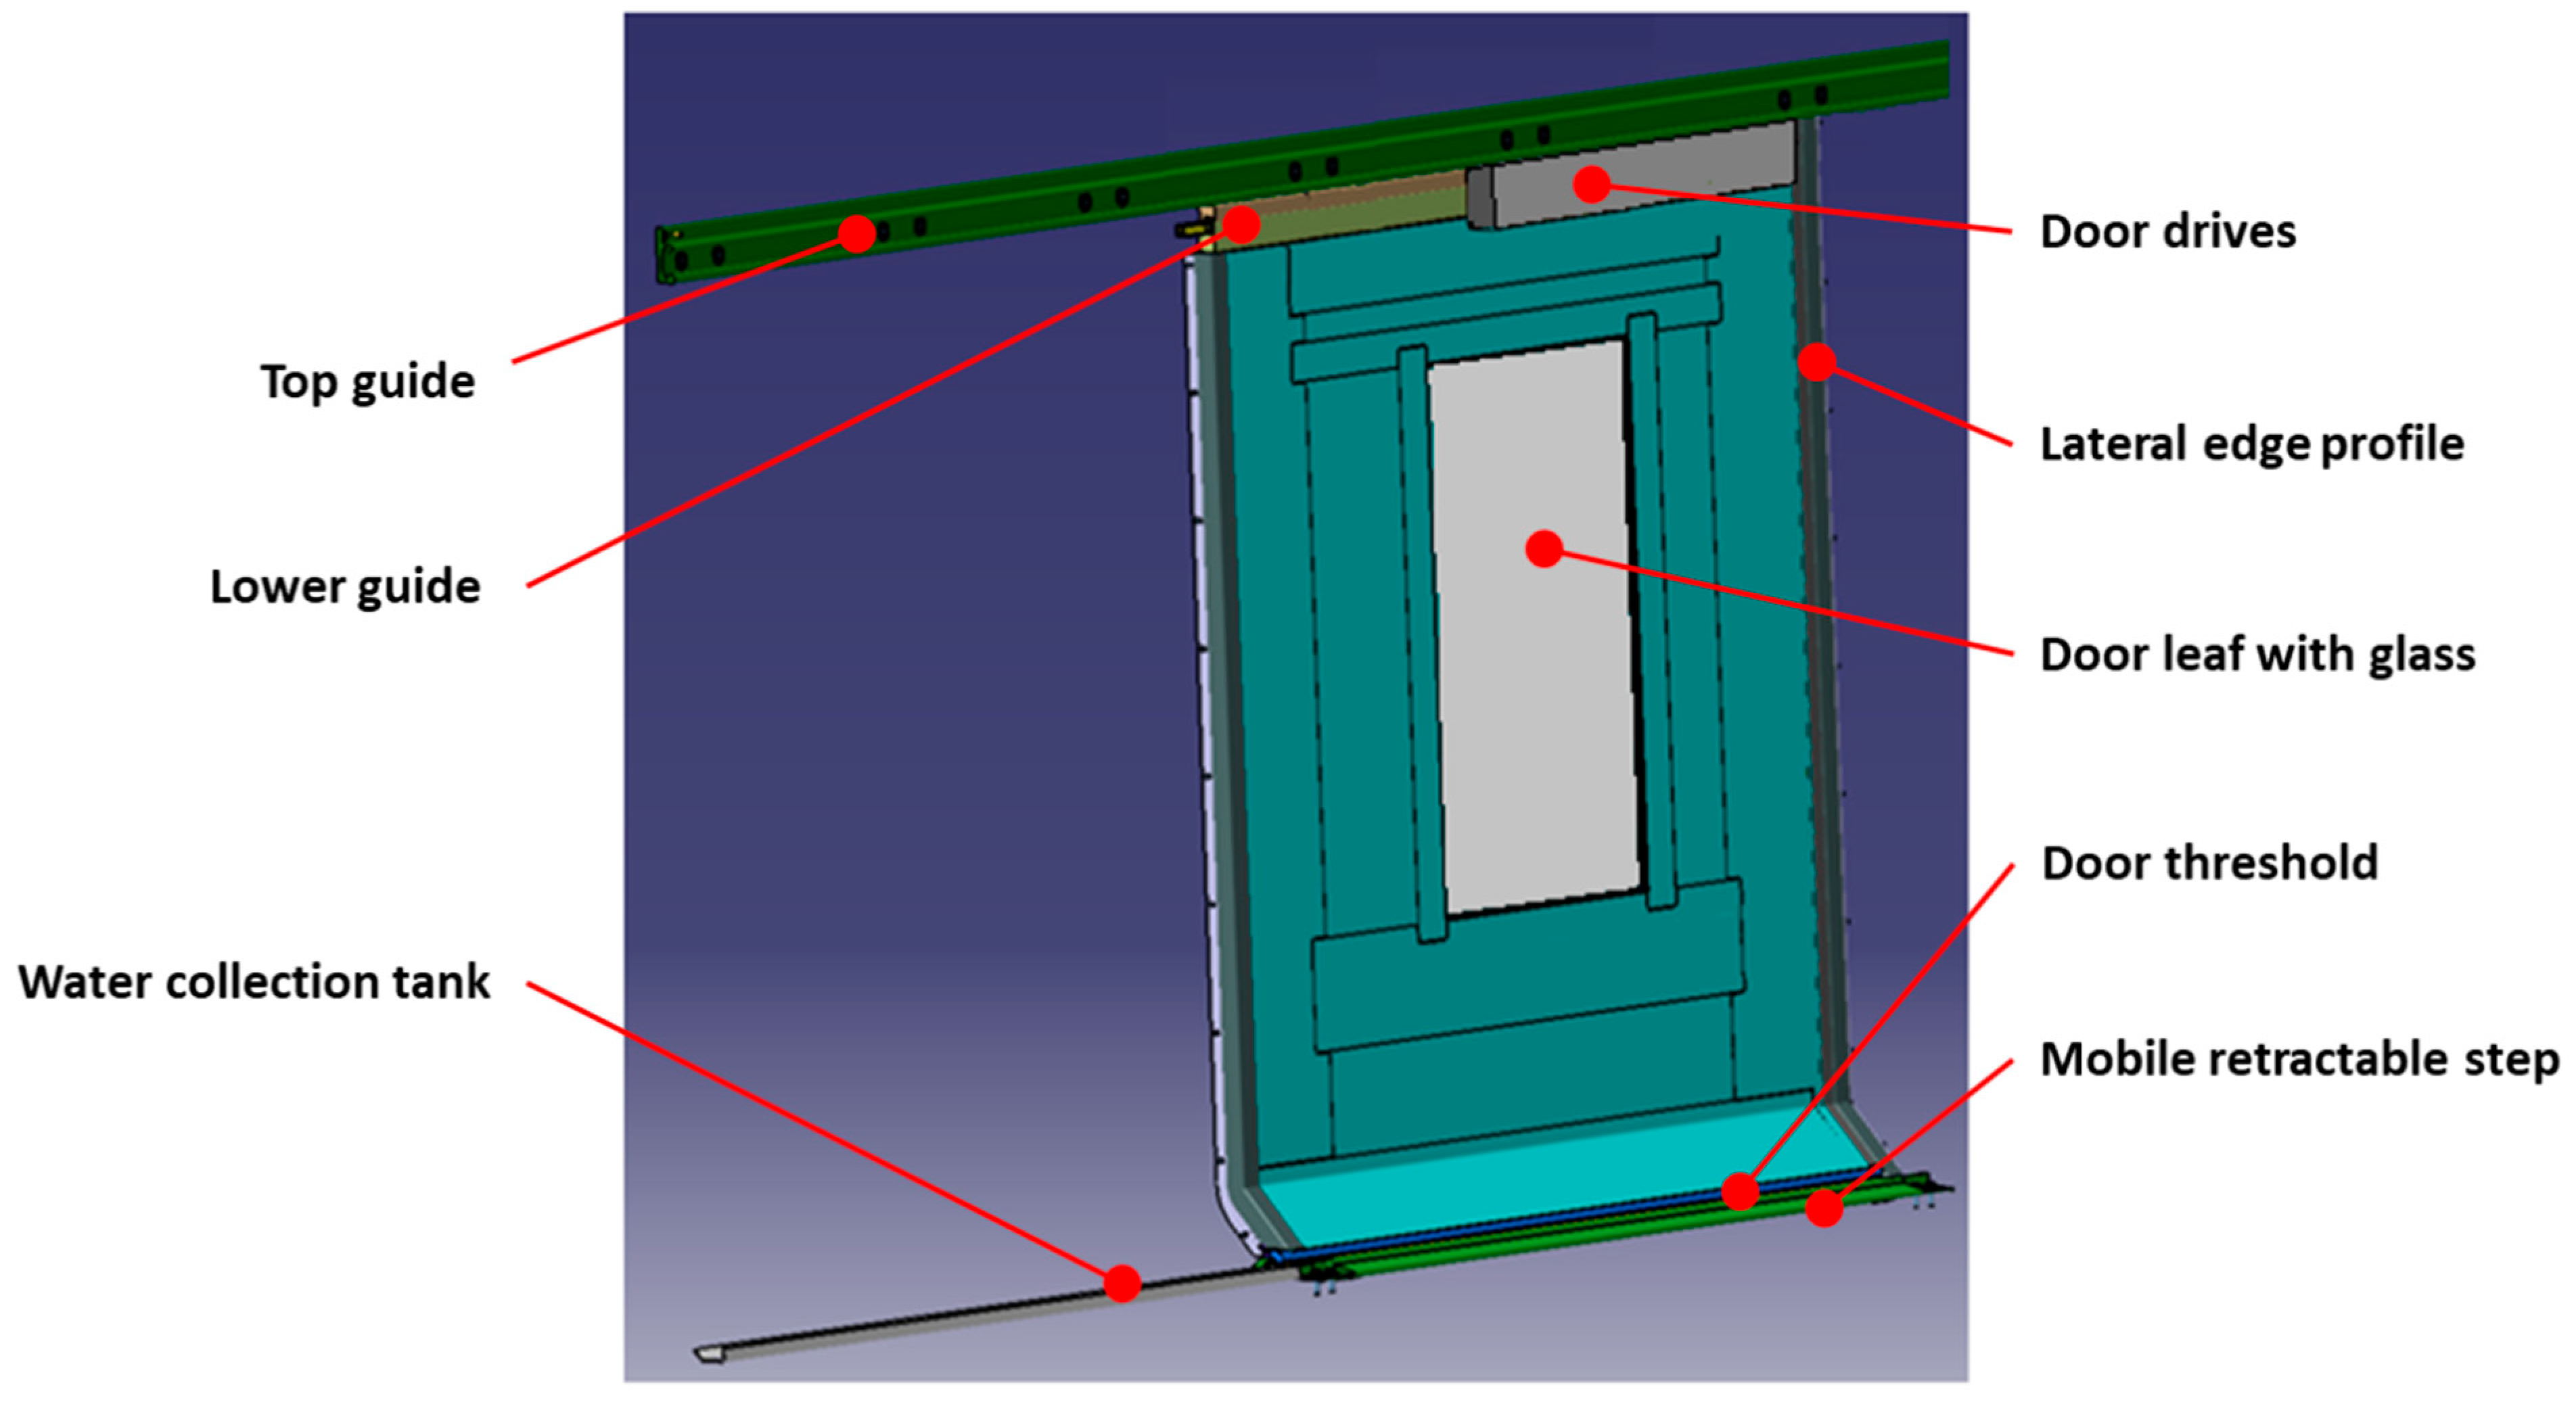
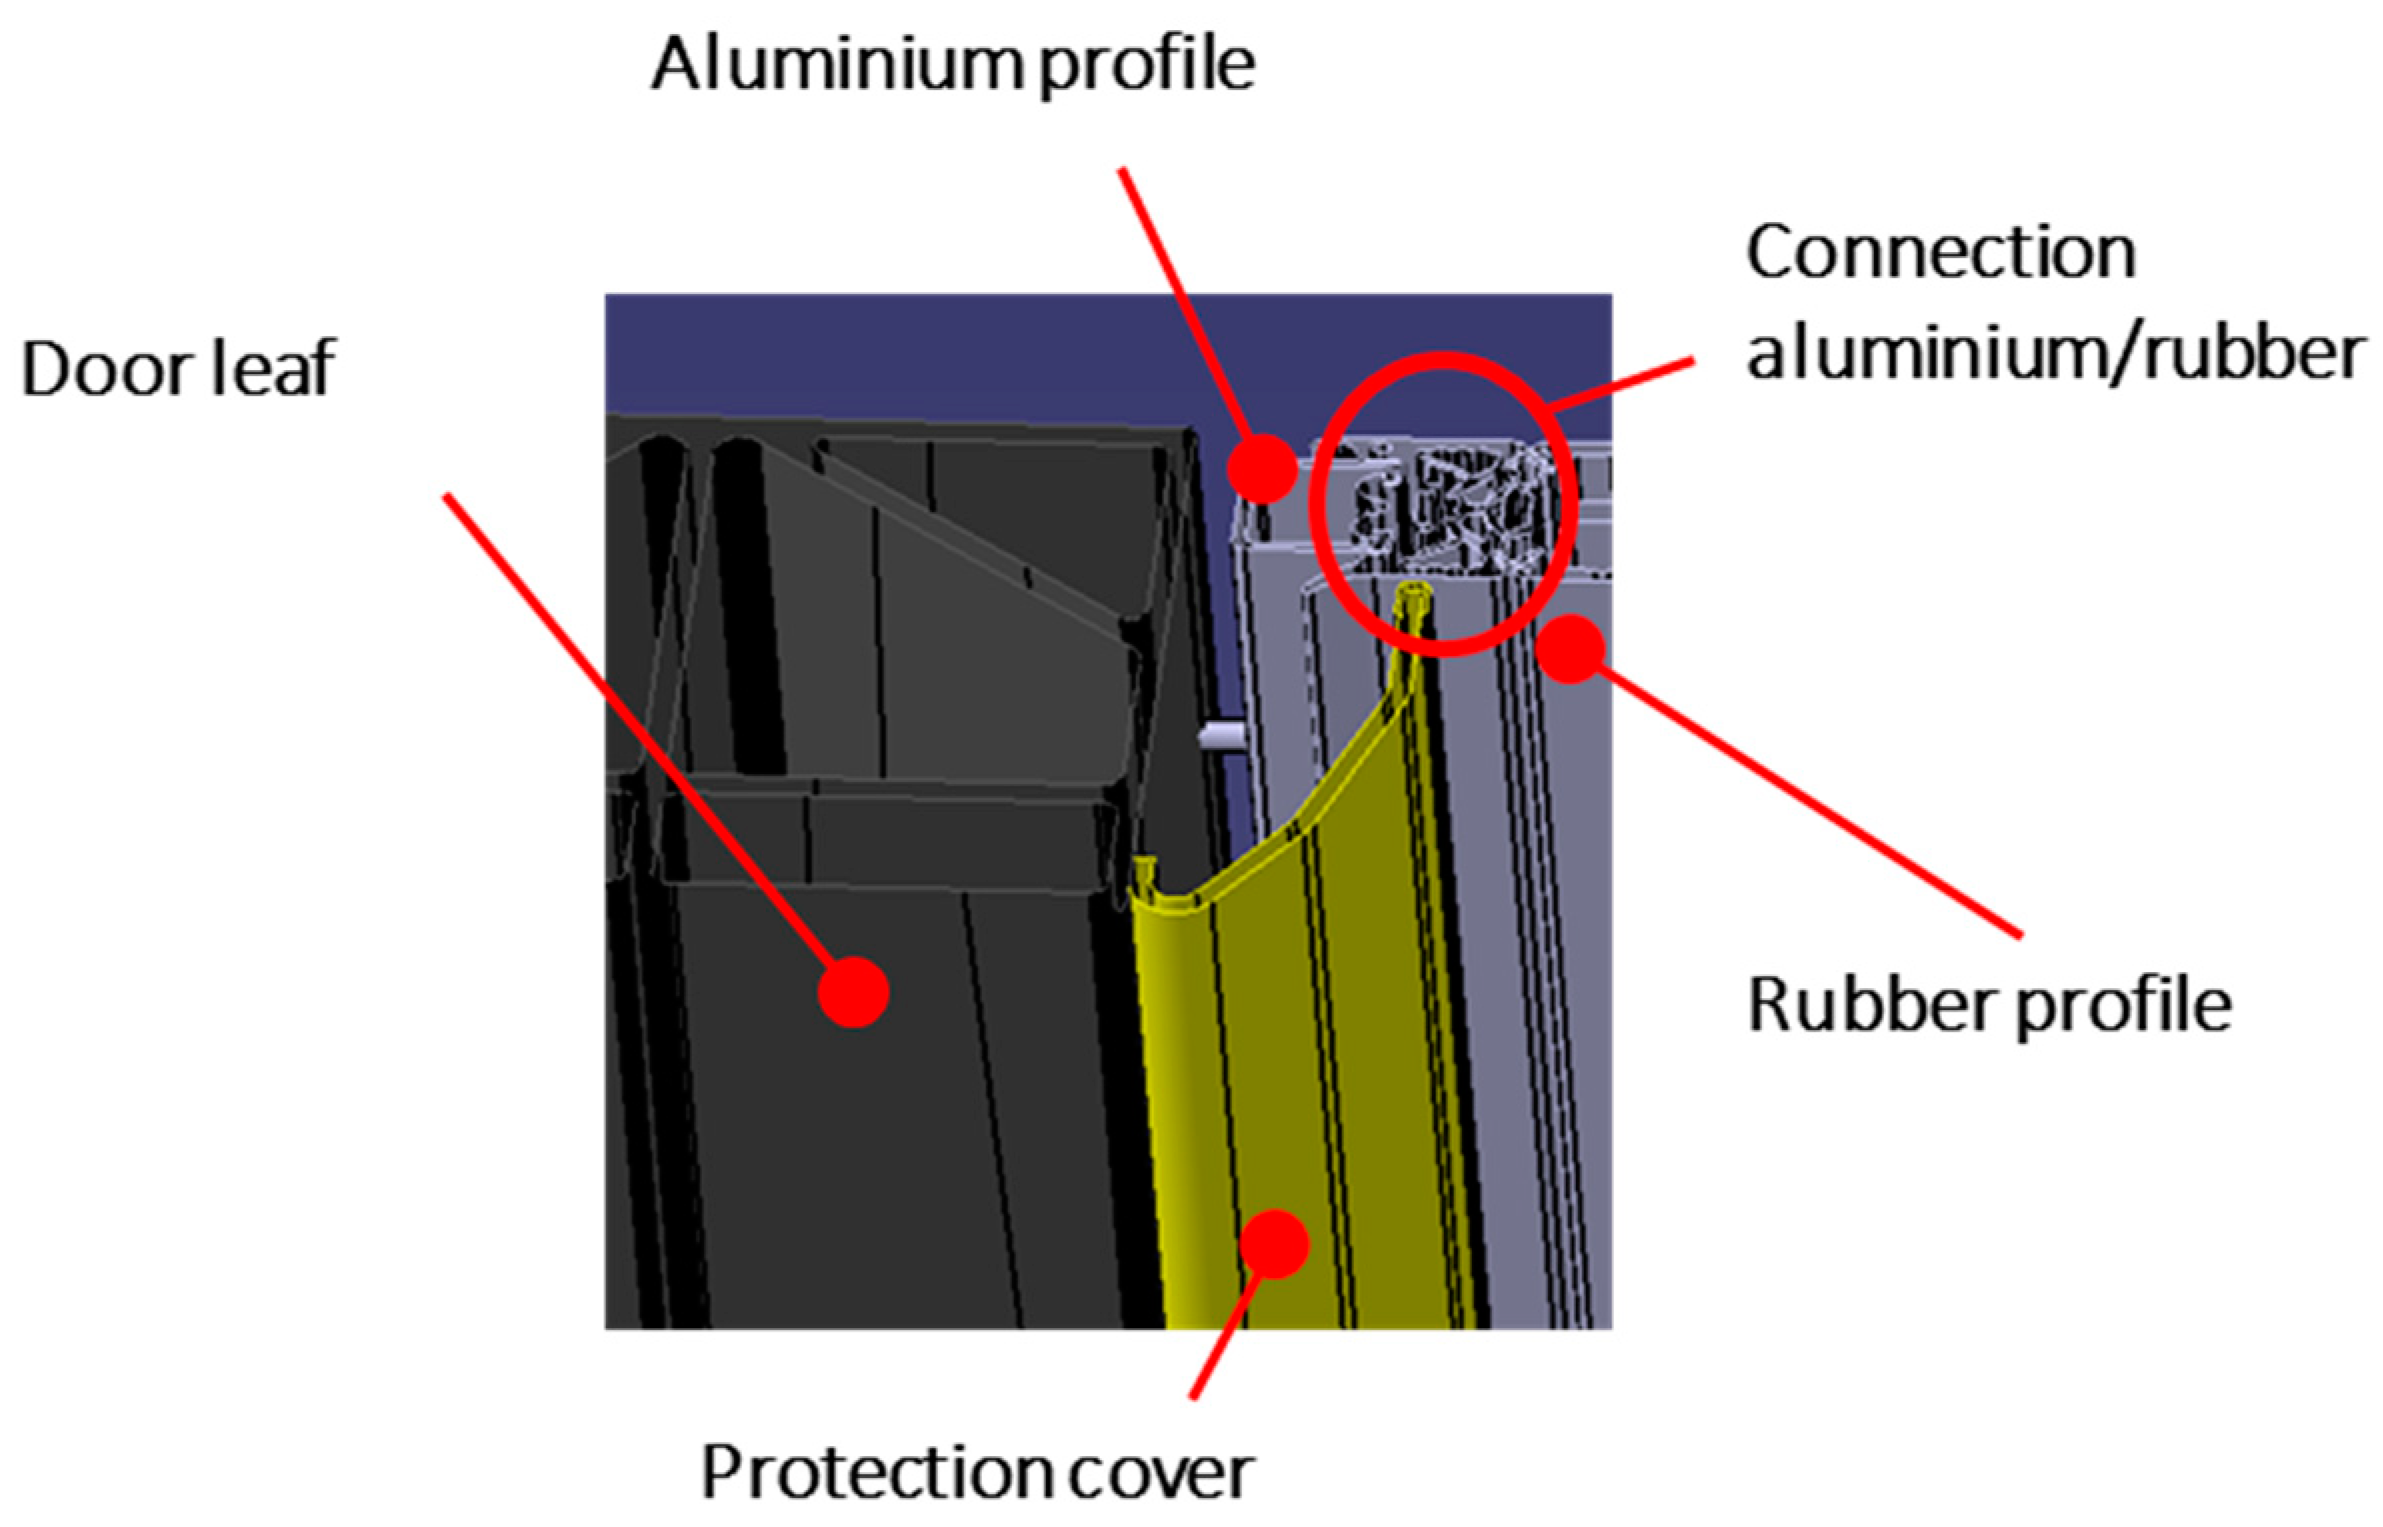
In this section, to demonstrate the effectiveness and usefulness of the novel methodology here proposed, it has been applied to an industrial case study which refers to a company that produces and assemblies train wagons. In particular, the integrated PFMEA approach proposed in this paper has been recognized by the company’s top management as a valid method and tool for the analysis of the procedure and risk assessment which can offer critical assistance to analysis and support the design of the production and assembly process. Under a potential out of service, the train access door was selected for the analysis as a critical component (Figure 3). Train doors are “pocket doors”, and they are equipped with mobile retractable steps to compensate for the horizontal gap between train and platform.
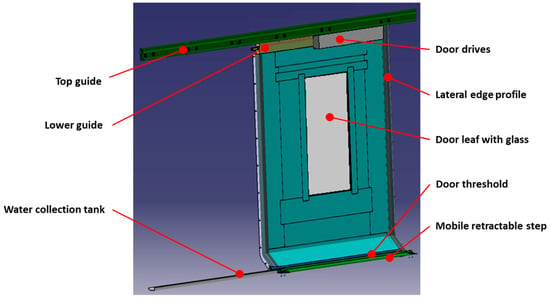
Figure 3.
Train access door.
The PFMEA methodology was conducted within a workgroup led by a responsible production manager. The team was composed of academician personnel and company experts in different areas such as design, manufacturing, material handling, quality, maintenance, and logistic suppliers. The group has worked for six months, mainly through roundtable discussions. During meetings many different and qualitative technical opinions and judgments have been collected. Then, the responsible production manager assured that the right scores were correctly collocated into occurrence, detection, and severity columns. A brief description of the technical data used to assign the different scores and then to evaluate the RPN is reported in the following:
- The chance of failure (occurrence) is evaluated as a function of the mean time between failures (MTBF) (Table 4). The few available MTBF values collected in the past by the company are then integrated by the experiences of the team personnel;
 Table 4. Summary comparison between JESs and D-JESs.
 - The chance of non-detection is evaluated adopting the scores reported in Table 5. The scores are defined following the experiences of the maintenance staff. It is evident that the more visible a failure is, then the more the probability of detection grows;
 Table 5. Ratings for the detection of a failure mode.
 - The severity of the failure effect is calculated adopting the score reported in Table 6. As one can see, the linguistic judgments are completely devoted both to operator and user safety aspects and to customer dissatisfaction (out of service of the vehicle). More specifically, faults, besides creating malfunctions and disruptions, can also have important effects on the safety of operators during assembly operations and on train users. As an example, loosening or falling of the door leaf can compromise the safety of the operator and/or the end-user. Consequently, the severity index was conceived taking into account the company’s sensibility towards safety issues and compliance with the law.
 Table 6. Ratings for the severity of a failure mode.
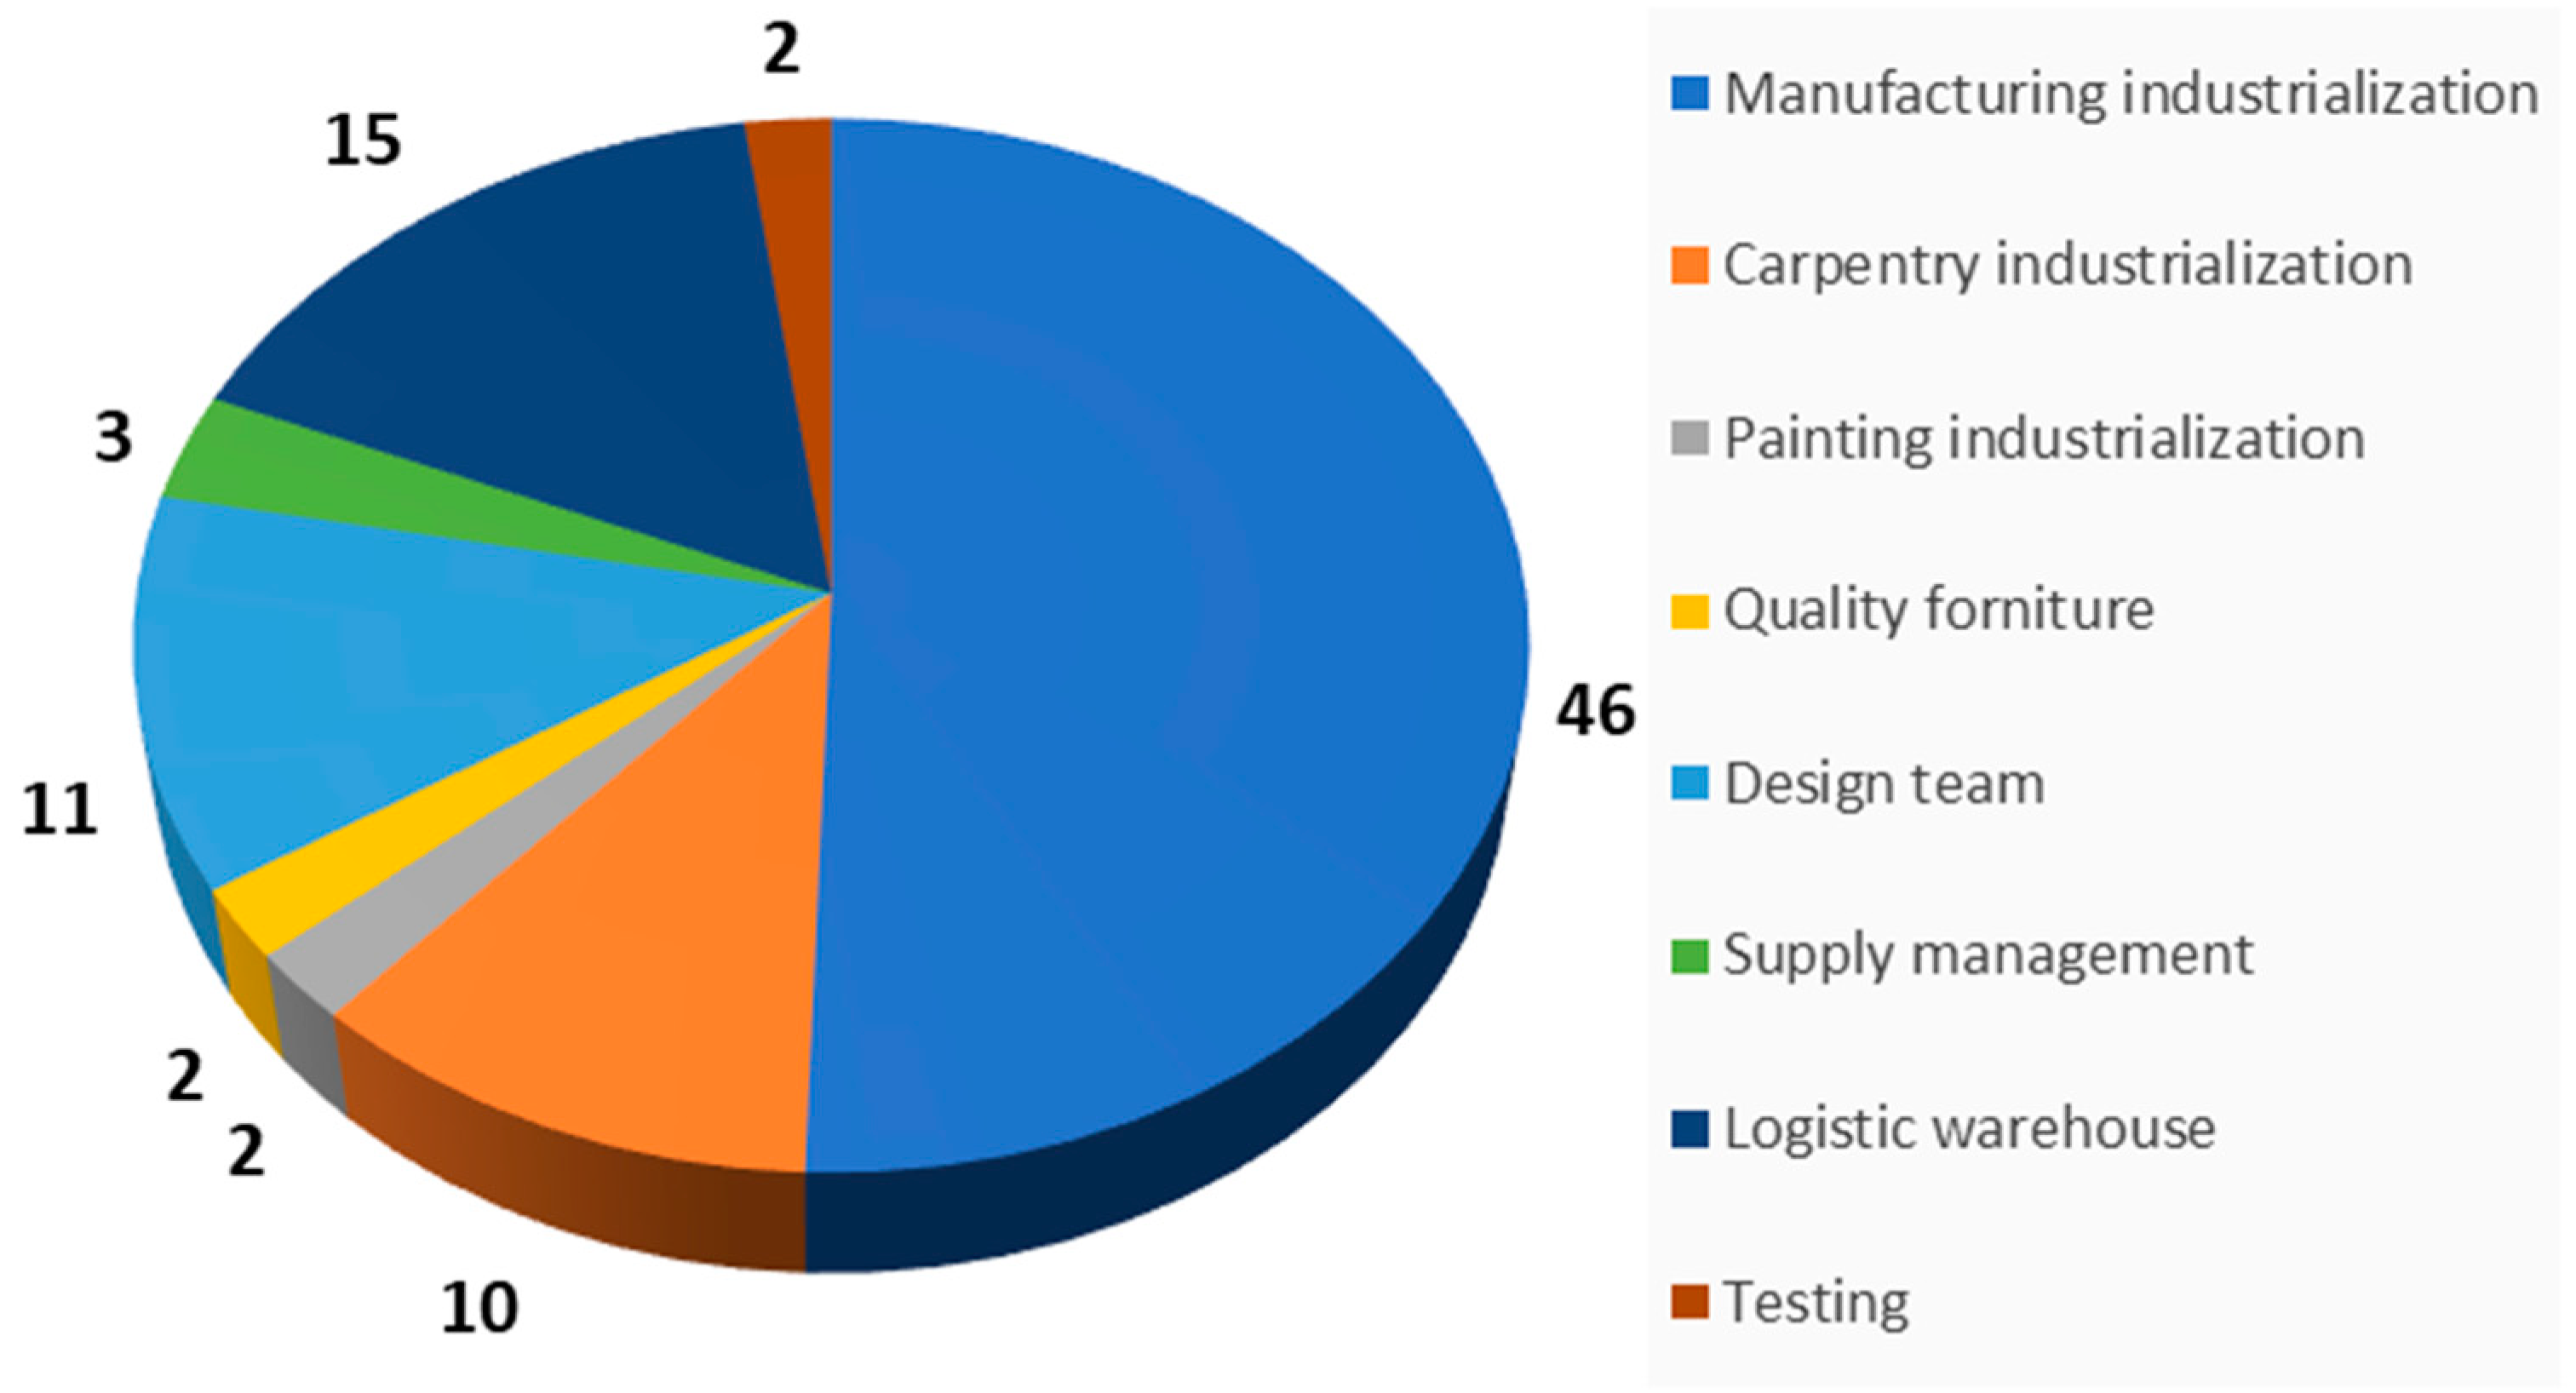
During the train door analysis, many activities with high-risk rates have been intercepted. If they are incorrectly executed, the operation of the component can be inhibited, or the production process can be slowed down. Over 200 lines of PFMEA module have been filled and 91 different recommended actions (Figure 4) have been submitted to their respective experts to correctly achieve the intended elementary operations making production and assembly processes more efficient. Generally, corrective actions should be taken at any time, but in this specific case study, the team decided to apply them when RPN or severity indices exceed 100 and 8, respectively. These situations can be possible when a product malfunction occurs and/or operator and end-user safety could be compromised.
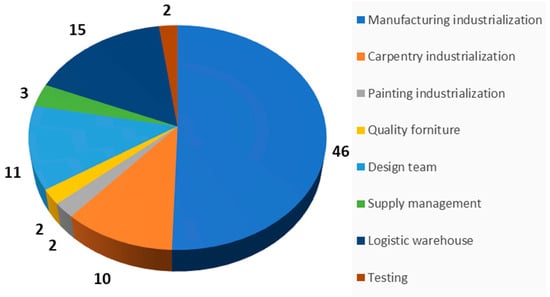
Figure 4.
Recommended actions submitted to their respective experts.
In addition, PFMEA analysis has been developed to design the D-JESs supporting the design of worksheets, equipment, and layout of the train access door.
In Figure 5 the installation of the lateral edge profile is presented. The lateral edge profile is a door component and it is made of an aluminum profile covered with a rubber profile. The temporary removal of the rubber profile from the aluminum one, necessary to fix the lateral edge profile to the door leaf, is presented. Finally, the rubber profile is put back on the aluminum profile.
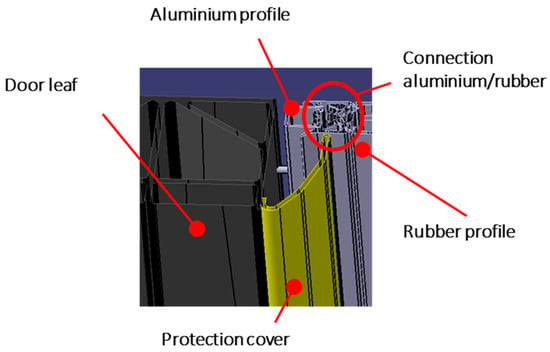
Figure 5.
Installation of the lateral edge profile.
Three potential error causes are highlighted in Table 7 and, consequently, different separate PFMEA lines have been filled.

Table 7.
An example of a scheme to present process failure mode and effect analysis (PFMEA) results.
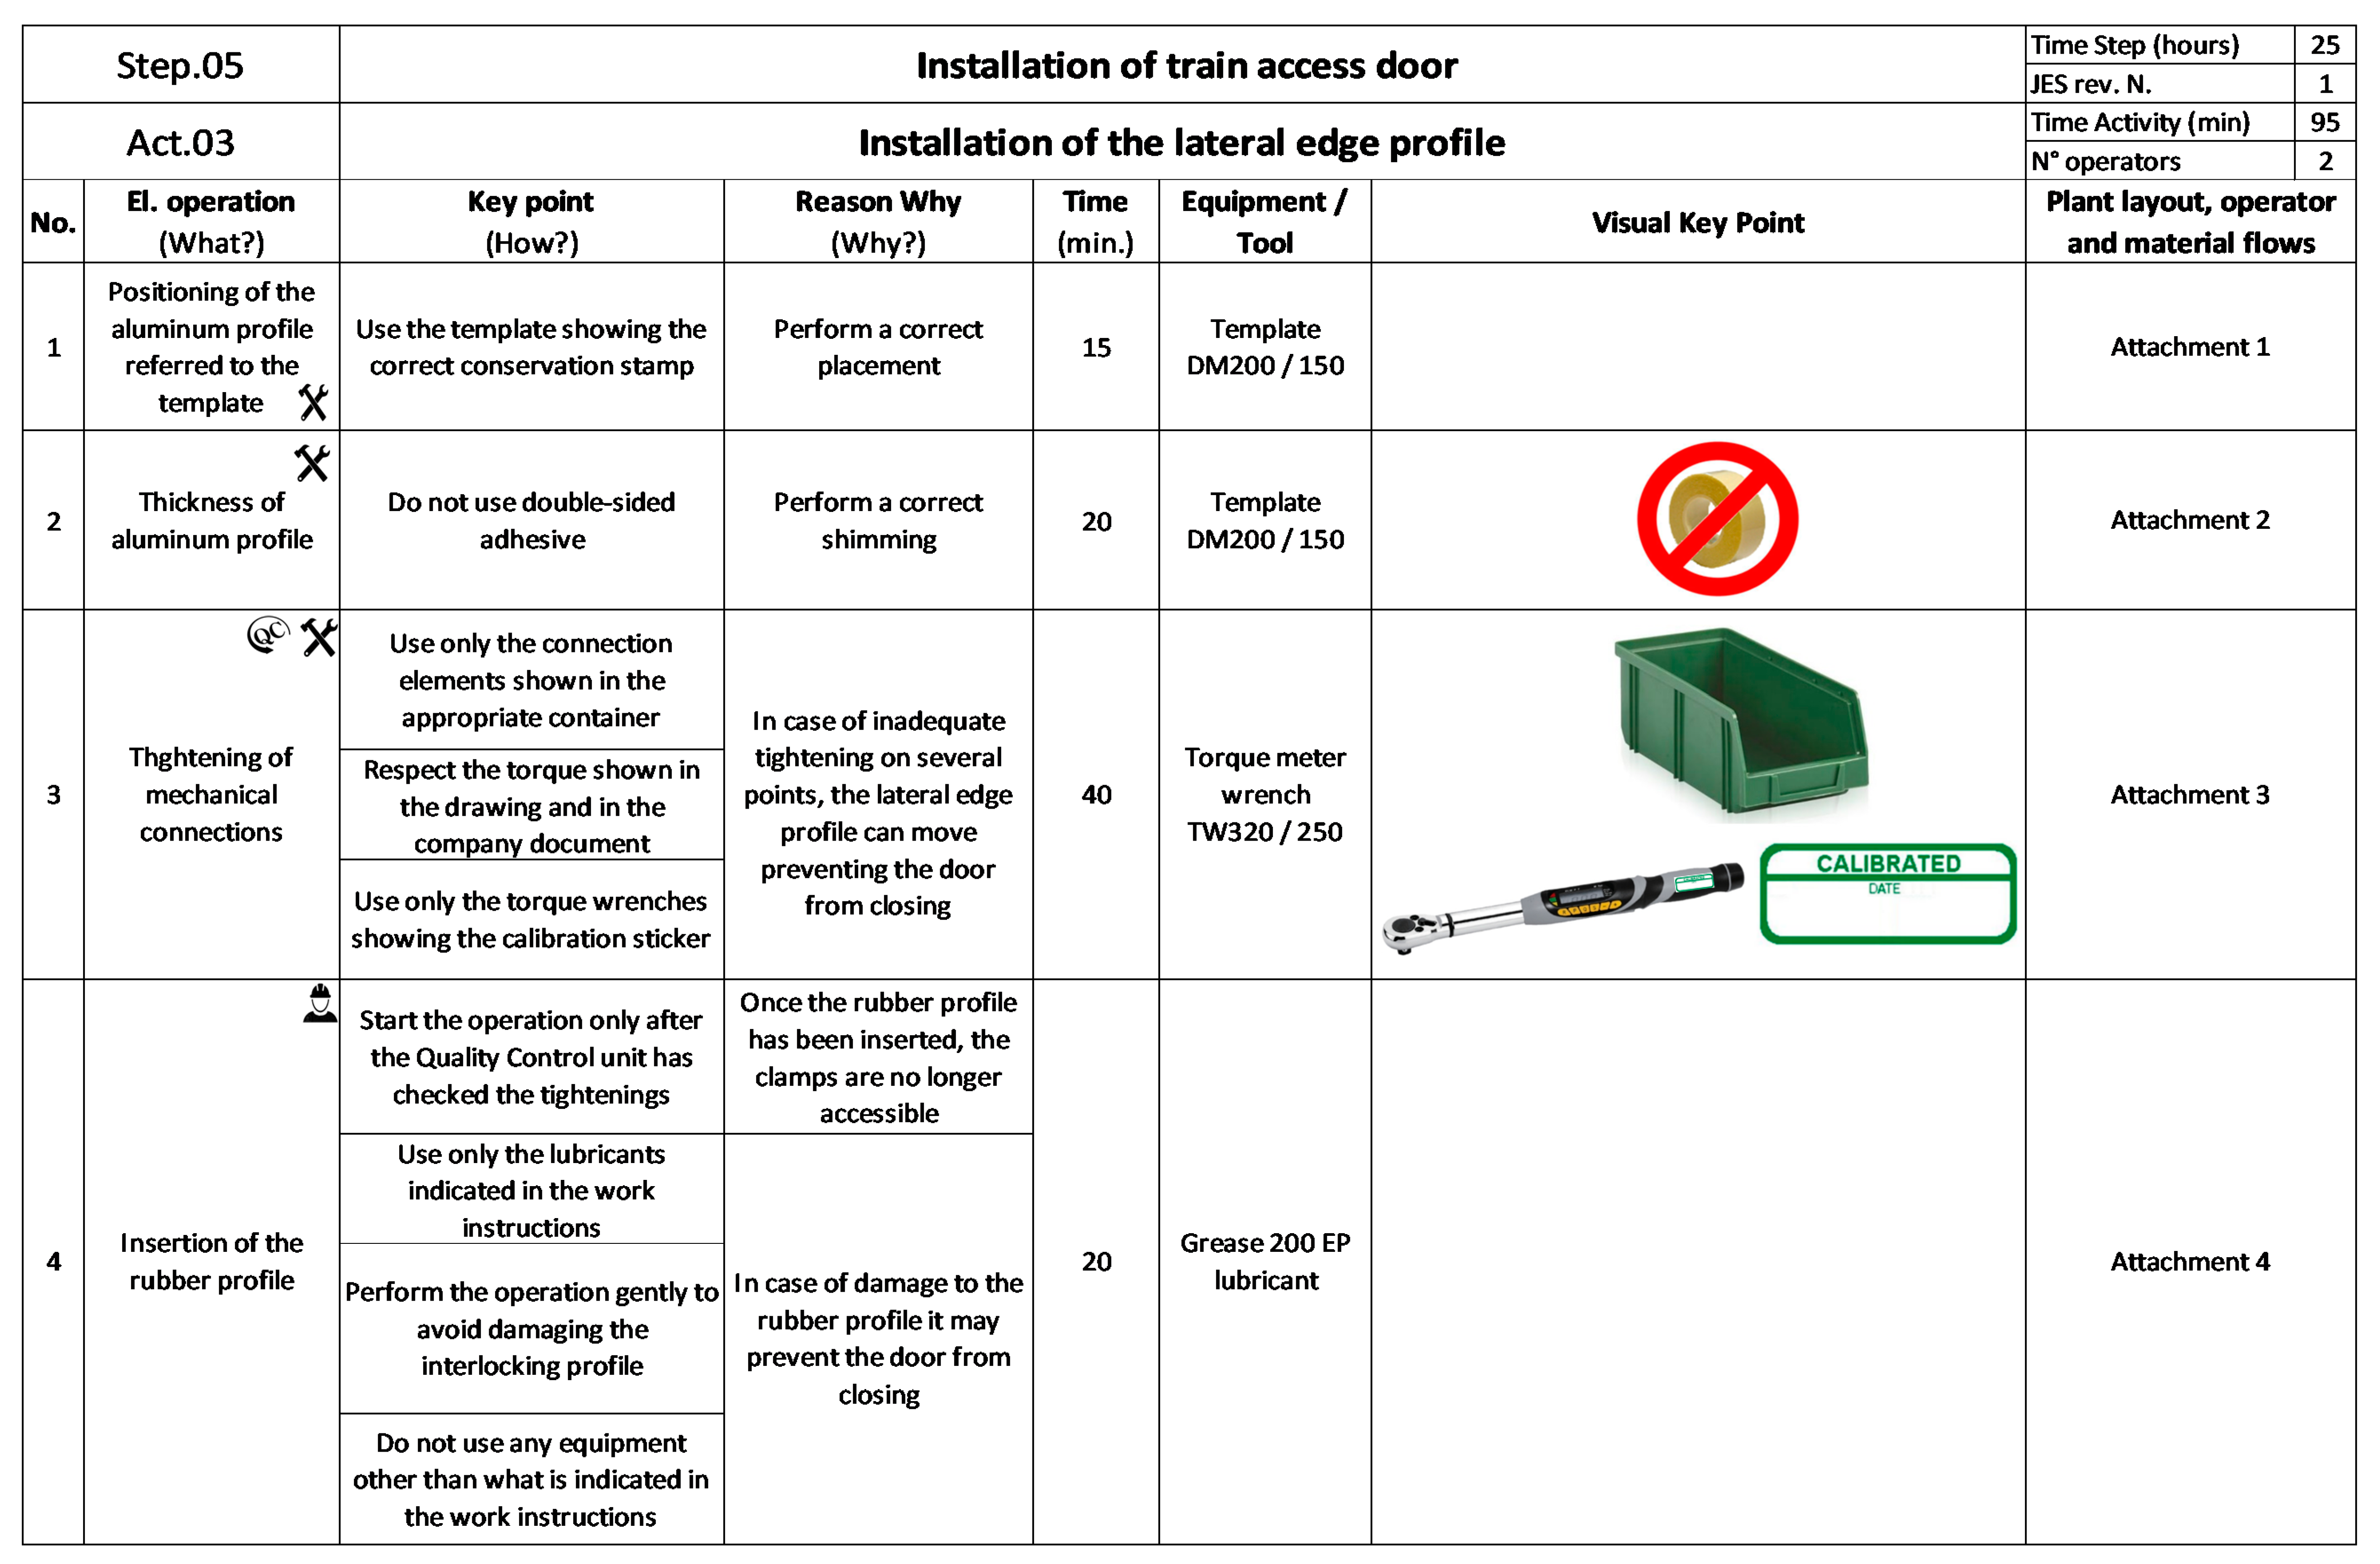
The corrective solutions report (i) precautions to be taken to properly carry out the step, (ii) indications for the supplier documentation, and (iii) design requirements such as tightening torques, tool to be used, compatible lubricants. All this technical information, which involves different expertise (manufacturing industrialization, design team, and supply management), are opportunely reported into the specific D-JES module. The D-JES for the installation of the lateral edge profile (Figure 6) presents:
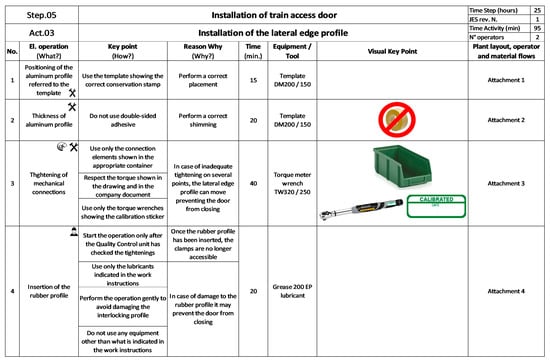
Figure 6.
Example of D-JES module related to the installation of the lateral edge profile.
- The process, activity, and elementary operations involved in the production and assembly processes and the approximate amount of time required for that process, activity, and elementary operation;
- Tools and equipment used in the production process;
- Visual indications about tools, equipment, and documents that can facilitate/compromise the job or injure the worker;
- Recommended actions for operators to avoid errors when working on a specific job;
- The minimum number of operators required for each operation.
In addition, the sequential number of the D-JES revision is reported. Thus, it is possible to know how many D-JESs, related to the same activity, have been written. This information is important to keep track of the necessary attempts to design and, subsequently, to standardize the production and the assembly process.
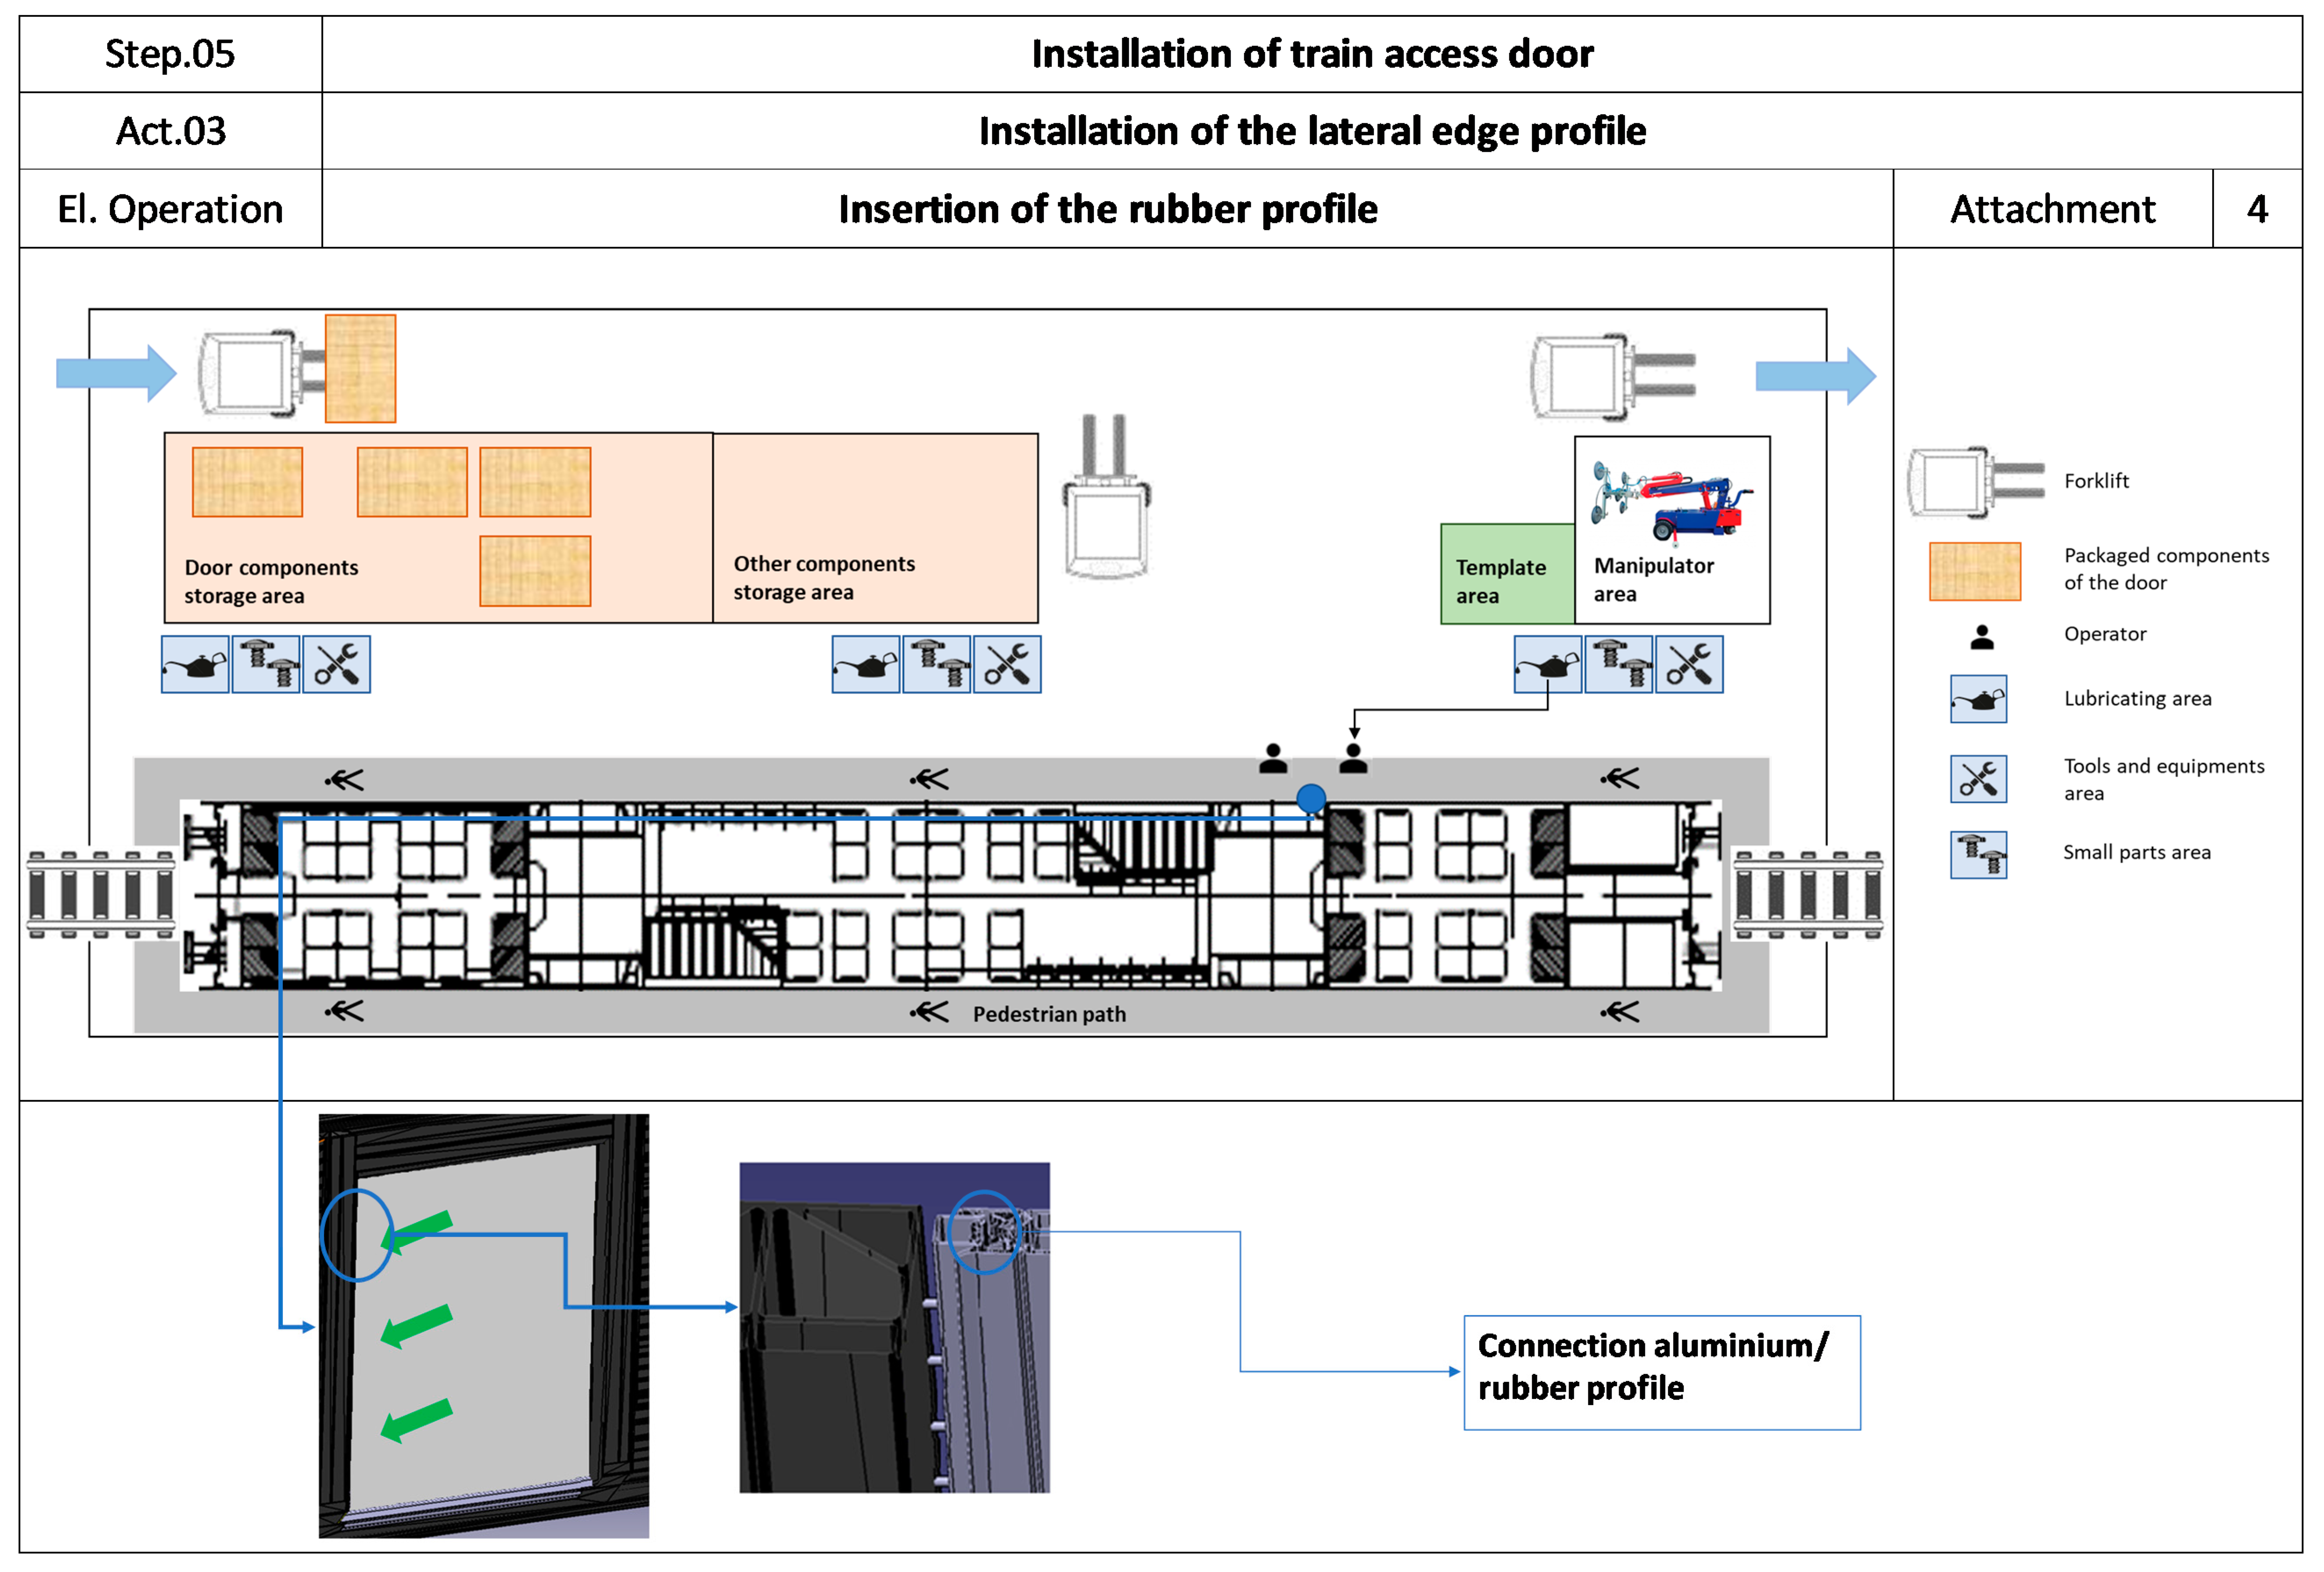
The D-JES can include one or more attachments that report:
- The schematic layout of the plant, as envisaged when the D-JES is being drawn up, with operator and material flows;
- Schematic sketches or 3D images of the product where the operator’s attention must be focused during the execution of the job.
In Figure 7 the Attachment N°4 referred to the insertion of the rubber profile of the lateral edge profile is shown.
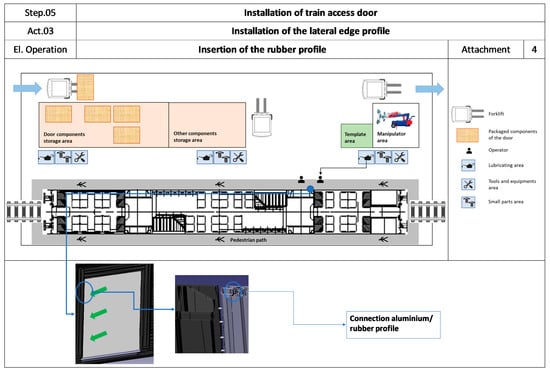
Figure 7.
Example of attachment of D-JES module related to the installation of the lateral edge profile.
4. Conclusions
Nowadays, BIR is becoming an essential requirement for product development. However, the task of BIR can be resource-intensive since root cause identification is necessary. If a product is complex, the number of possible failure modes can be great, rendering BIR too large to be practical. A systematic tool of BIR able of overcoming this complexity is the PFMEA. In this work, PFMEA is approached as an operative tool able to bridge the gap between design information and industrialization activities to support the design of the D-JESs, equipment, and assembly line layout for complex systems.
The novel approach is characterized by several peculiar advantages. To begin with, (i) the development of the D-JES(s), equipment, and assembly line layout for complex systems during a reliability PFMEA analysis assures that the PFMEA is no longer seen as an additional time-consuming administrative effort [7], but rather as a powerful initial design tool for the industrialization process of the product. The novel method is very simple and practical to use and does not require large investments, implementation of new technologies, or complex additional training. It can be effectively adopted to improve a product under development since the design phase, to support operators to the perfect fulfillment of all operations. The philosophy of continuous improvement can be applied to the determination both of product reliability and efficiency focusing on the various steps of the manufacturing/assembling systems used to manufacture the products [1]. Finally, D-JES, differently from traditional JES [16], provides, for each activity, a module that contains all the fundamental assembly information collected during PFMEA analysis, about the elementary operation, components involved, tools, equipment, and safety aspects. D-JESs are conceived to support the operator during the execution of a specific job. To achieve this goal, a continuous updating of the modules is required, every time production feedback is obtained.
The effectiveness and the usefulness of the novel approach have been demonstrated using an industrial case study about a train access door where a complete PFMEA analysis has been carried out. Many corrective actions have been introduced within the company to increase the reliability of the access door. D-JES modules have been created to support the operator during the execution of a specific job. Hence, for each elementary operation involved in the production and assembly process, tools and equipment, visual indications that can facilitate the job, recommended actions to avoid job errors, and safety precautions are recorded. According to the results obtained in the case study, the company’s top management is now evaluating the possibility to extend the analysis to other train critical components such as toilets, heating ventilation and air conditioning (HVAC), and fire systems.
Future activities of the present research will concern the definition of a new configuration of the integration of PFMEA and D-JESs that can be effectively applied in industries where the assembly activities are not always executed in the same way due to high possible contingencies and variability of the allowable operations, such as in the assembly and mounting of complex customized industrial plants at a customer’s factory.
Future activity can also concern the possibility to prioritize the recommended actions, using not only the RPN but also other criteria, such as the economic aspect and the ease of implementation, that are unavoidable to execute a rational and effective selection of improvement activities.
Author Contributions
Conceptualization, M.B., D.C., R.G. and L.M.; methodology, M.B. and L.M.; validation, R.G. and L.M.; investigation, D.C. and L.M.; writing—original draft preparation, M.B., D.C., R.G. and L.M.; supervision, M.B. and R.G. All authors have read and agreed to the submitted version of the manuscript.
Funding
This research received no external funding.
Conflicts of Interest
The authors declare no conflict of interest.
References
- Tan, C.M. Customer-focused build-in reliability: Case study. Int. J. Qual. Reliab. Manag. 2003, 20, 378–397. [Google Scholar]
- Mettas, A. Design for Reliability: Overview of the Process and Applicable Techniques. Int. J. Perform. Eng. 2010, 6, 577–586. [Google Scholar]
- Stamatis, D.H. Failure Mode and Effect Analysis: FMEA from Theory to Execution, 2nd ed.; American Society for Quality, Quality Press: Milwaukee, WI, USA, 2003. [Google Scholar]
- Carlson, C.S. Effective FMEAs: Achieving Safe, Reliable, and Economical Products and Processes Using Failure Mode and Effects Analysis; Wiley & Sons: Hoboken, NJ, USA, 2012. [Google Scholar]
- Liu, H.C.; Liu, L.; Liu, N. Risk evaluation approaches in failure mode and effects analysis: A literature review. Expert Syst. Appl. 2003, 40, 828–838. [Google Scholar] [CrossRef]
- Teng, S.H.; Ho, S.Y. Failure mode and effects analysis: An integrated approach for product design and process control. Int. J. Qual. Reliab. Manag. 1996, 13, 8–26. [Google Scholar] [CrossRef]
- Johnson, K.G.; Khan, M.K. A study into the use of the process failure mode and effects analysis (PFMEA) in the automotive industry in the UK. J. Mater. Process. Technol. 2003, 139, 348–356. [Google Scholar] [CrossRef]
- Rebello, S.; Goyal, N.K. Software system reliability and safety assessment: An extended FMEA approach. Int. J. Reliab. Saf. 2010, 4, 366–380. [Google Scholar] [CrossRef]
- Braglia, M.; Gabbrielli, R.; Marrazzini, L. Risk Failure Deployment: A novel integrated tool to prioritize corrective actions in failure mode and effects analysis. Qual. Reliab. Eng. Int. 2020. [Google Scholar] [CrossRef]
- Spreafico, C.; Russo, D.; Rizzi, C. A state-of-the-art review of FMEA/FMECA including patents. Comput. Sci. Rev. 2017, 25, 19–28. [Google Scholar] [CrossRef]
- Sharma, R.K.; Kumar, D.; Kumar, P. Modelling and analysing system failure behaviour using RCA, FMEA and NHPPP models. Int. J. Qual. Reliab. Manag. 2007, 24, 525–546. [Google Scholar] [CrossRef]
- Mariajayaprakash, A.; Senthilvelan, T. Failure detection and optimization of sugar mill boiler using FMEA and Taguchi method. Eng. Fail. Anal. 2013, 30, 17–26. [Google Scholar] [CrossRef]
- Kara-Zaitri, C.; Keller, A.Z.; Barody, I.; Fleming, P.V. An improved FMEA methodology. In Proceedings of the Annual Reliability and Maintainability Symposium, Orlando, FL, USA, 29–31 January 1991; pp. 248–252. [Google Scholar]
- Bowles, J.B.; Peláez, C.E. Fuzzy Logic Prioritization of Failures in a System Failure Mode, Effects and Criticality Analysis. Reliab. Eng. Syst. Saf. 1995, 50, 203–213. [Google Scholar] [CrossRef]
- Imannai, B.; Greenough, R.M.; Kay, J.M. A decision support tool based on QFD and FMEA for the selection of manufacturing automation technologies. Robot. Comput. Integr. Manuf. 2008, 24, 501–507. [Google Scholar]
- Soltero, C.; Boutier, P. The 7 Kata—Toyota Kata, TWI, and Lean Training; CRC Press: Boca Raton, FL, USA, 2012. [Google Scholar]
- Dennis, P. Lean Production Simplified, Third Edition: A Plain-Language Guide to the World’s Most Powerful Production System; CRC Press: Boca Raton, FL, USA, 2016. [Google Scholar]
- Murugaiah, U.; Jebaraj Benjamin, S.; Srikamaladevi Marathamuthu, M.; Muthaiyah, S. Scrap loss reduction using the 5-whys analysis. Int. J. Qual. Reliab. Manag. 2010, 27, 527–540. [Google Scholar] [CrossRef]
- Latino, M.A.; Latino, R.J.; Latino, K.C. Root Cause Analysis—Improving Performance for Bottom-Line Results, 5th ed.; CRC Press: Boca Raton, FL, USA, 2019. [Google Scholar]
- Chrysler LLC; Ford Motor Company; General Motors Corporation. Potential Failure Mode and Effect Analysis (FMEA) for Tooling and Equipment: Machinery FMEA; Distributed by the Automotive Industry Action Group (A.I.A.G): Southfield, MI, USA, 2001. [Google Scholar]
- Chang, D.S.; Sun, K.L.P. Applying DEA to enhance assessment capability of FMEA. Int. J. Qual. Reliab. Manag. 2006, 26, 629–643. [Google Scholar] [CrossRef]
Publisher’s Note: MDPI stays neutral with regard to jurisdictional claims in published maps and institutional affiliations. |
© 2021 by the authors. Licensee MDPI, Basel, Switzerland. This article is an open access article distributed under the terms and conditions of the Creative Commons Attribution (CC BY) license (http://creativecommons.org/licenses/by/4.0/).

