The Effects of Structural Breaks on Energy Resources in the Long Run. Evidence from the Last Two Oil Price Crashes before COVID-19
Abstract
:1. Introduction
2. Materials and Methods
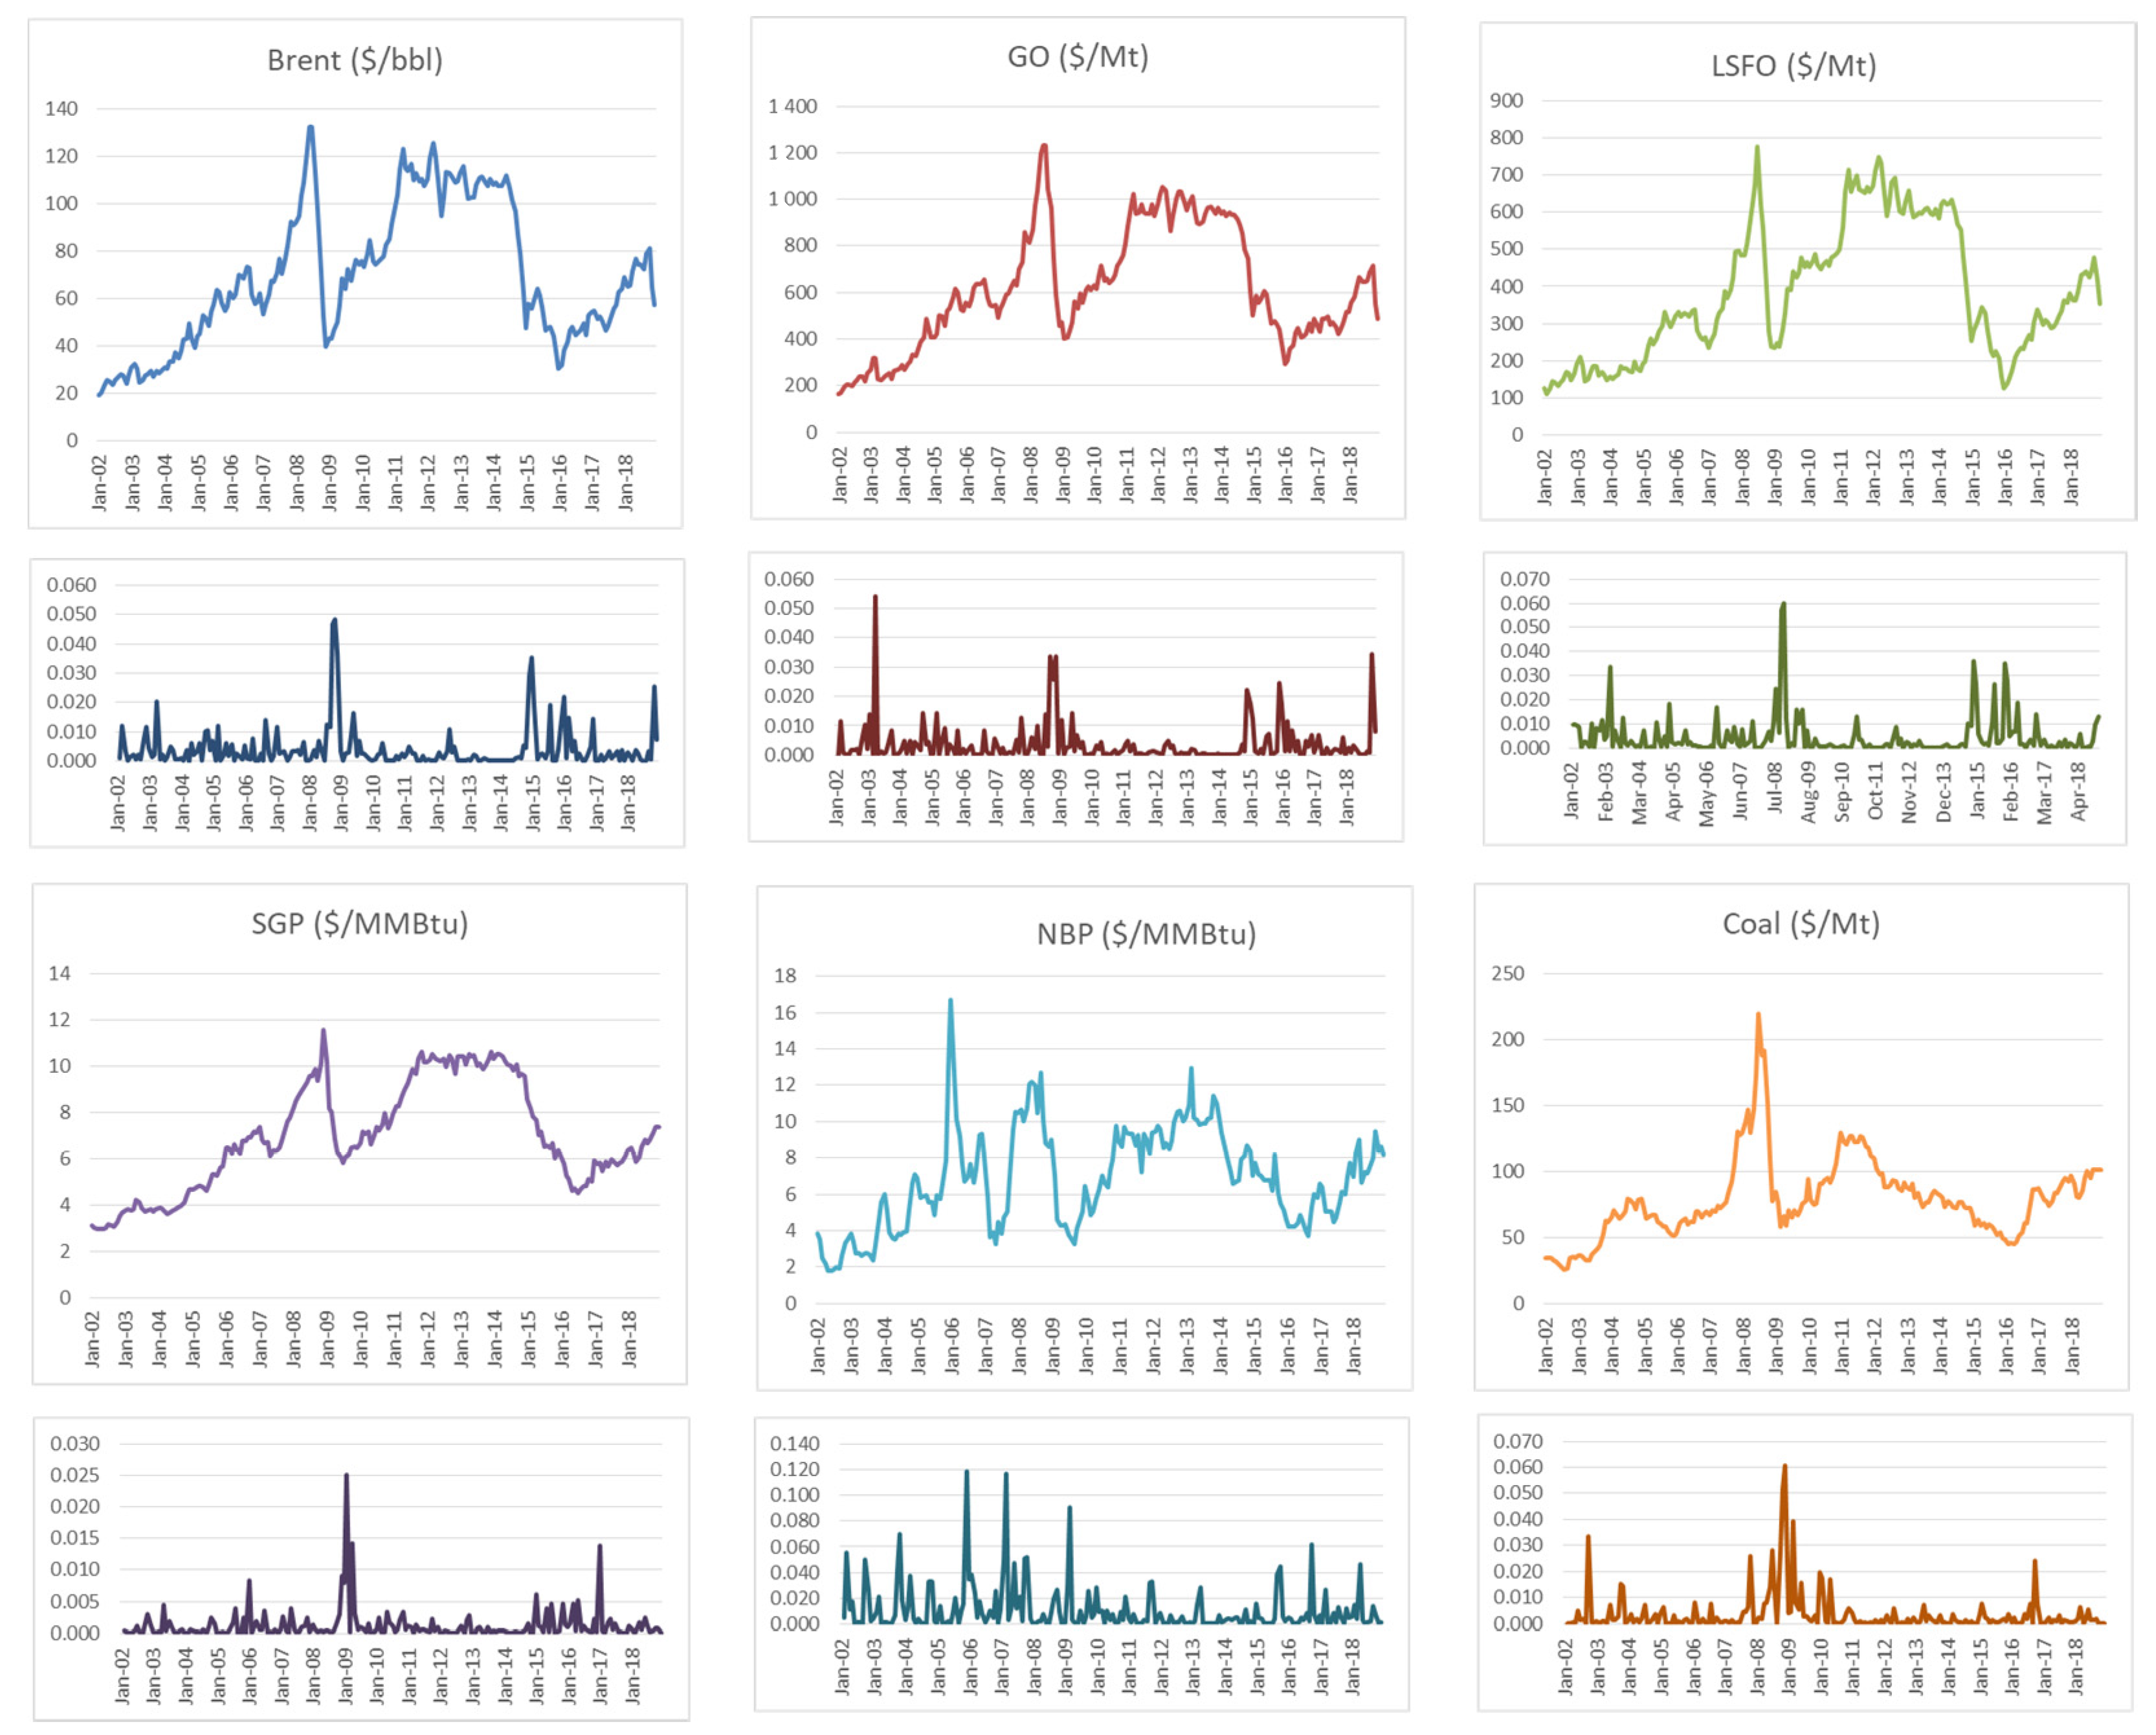
2.1. Data Definition
2.2. Methodological Issues
- (i)
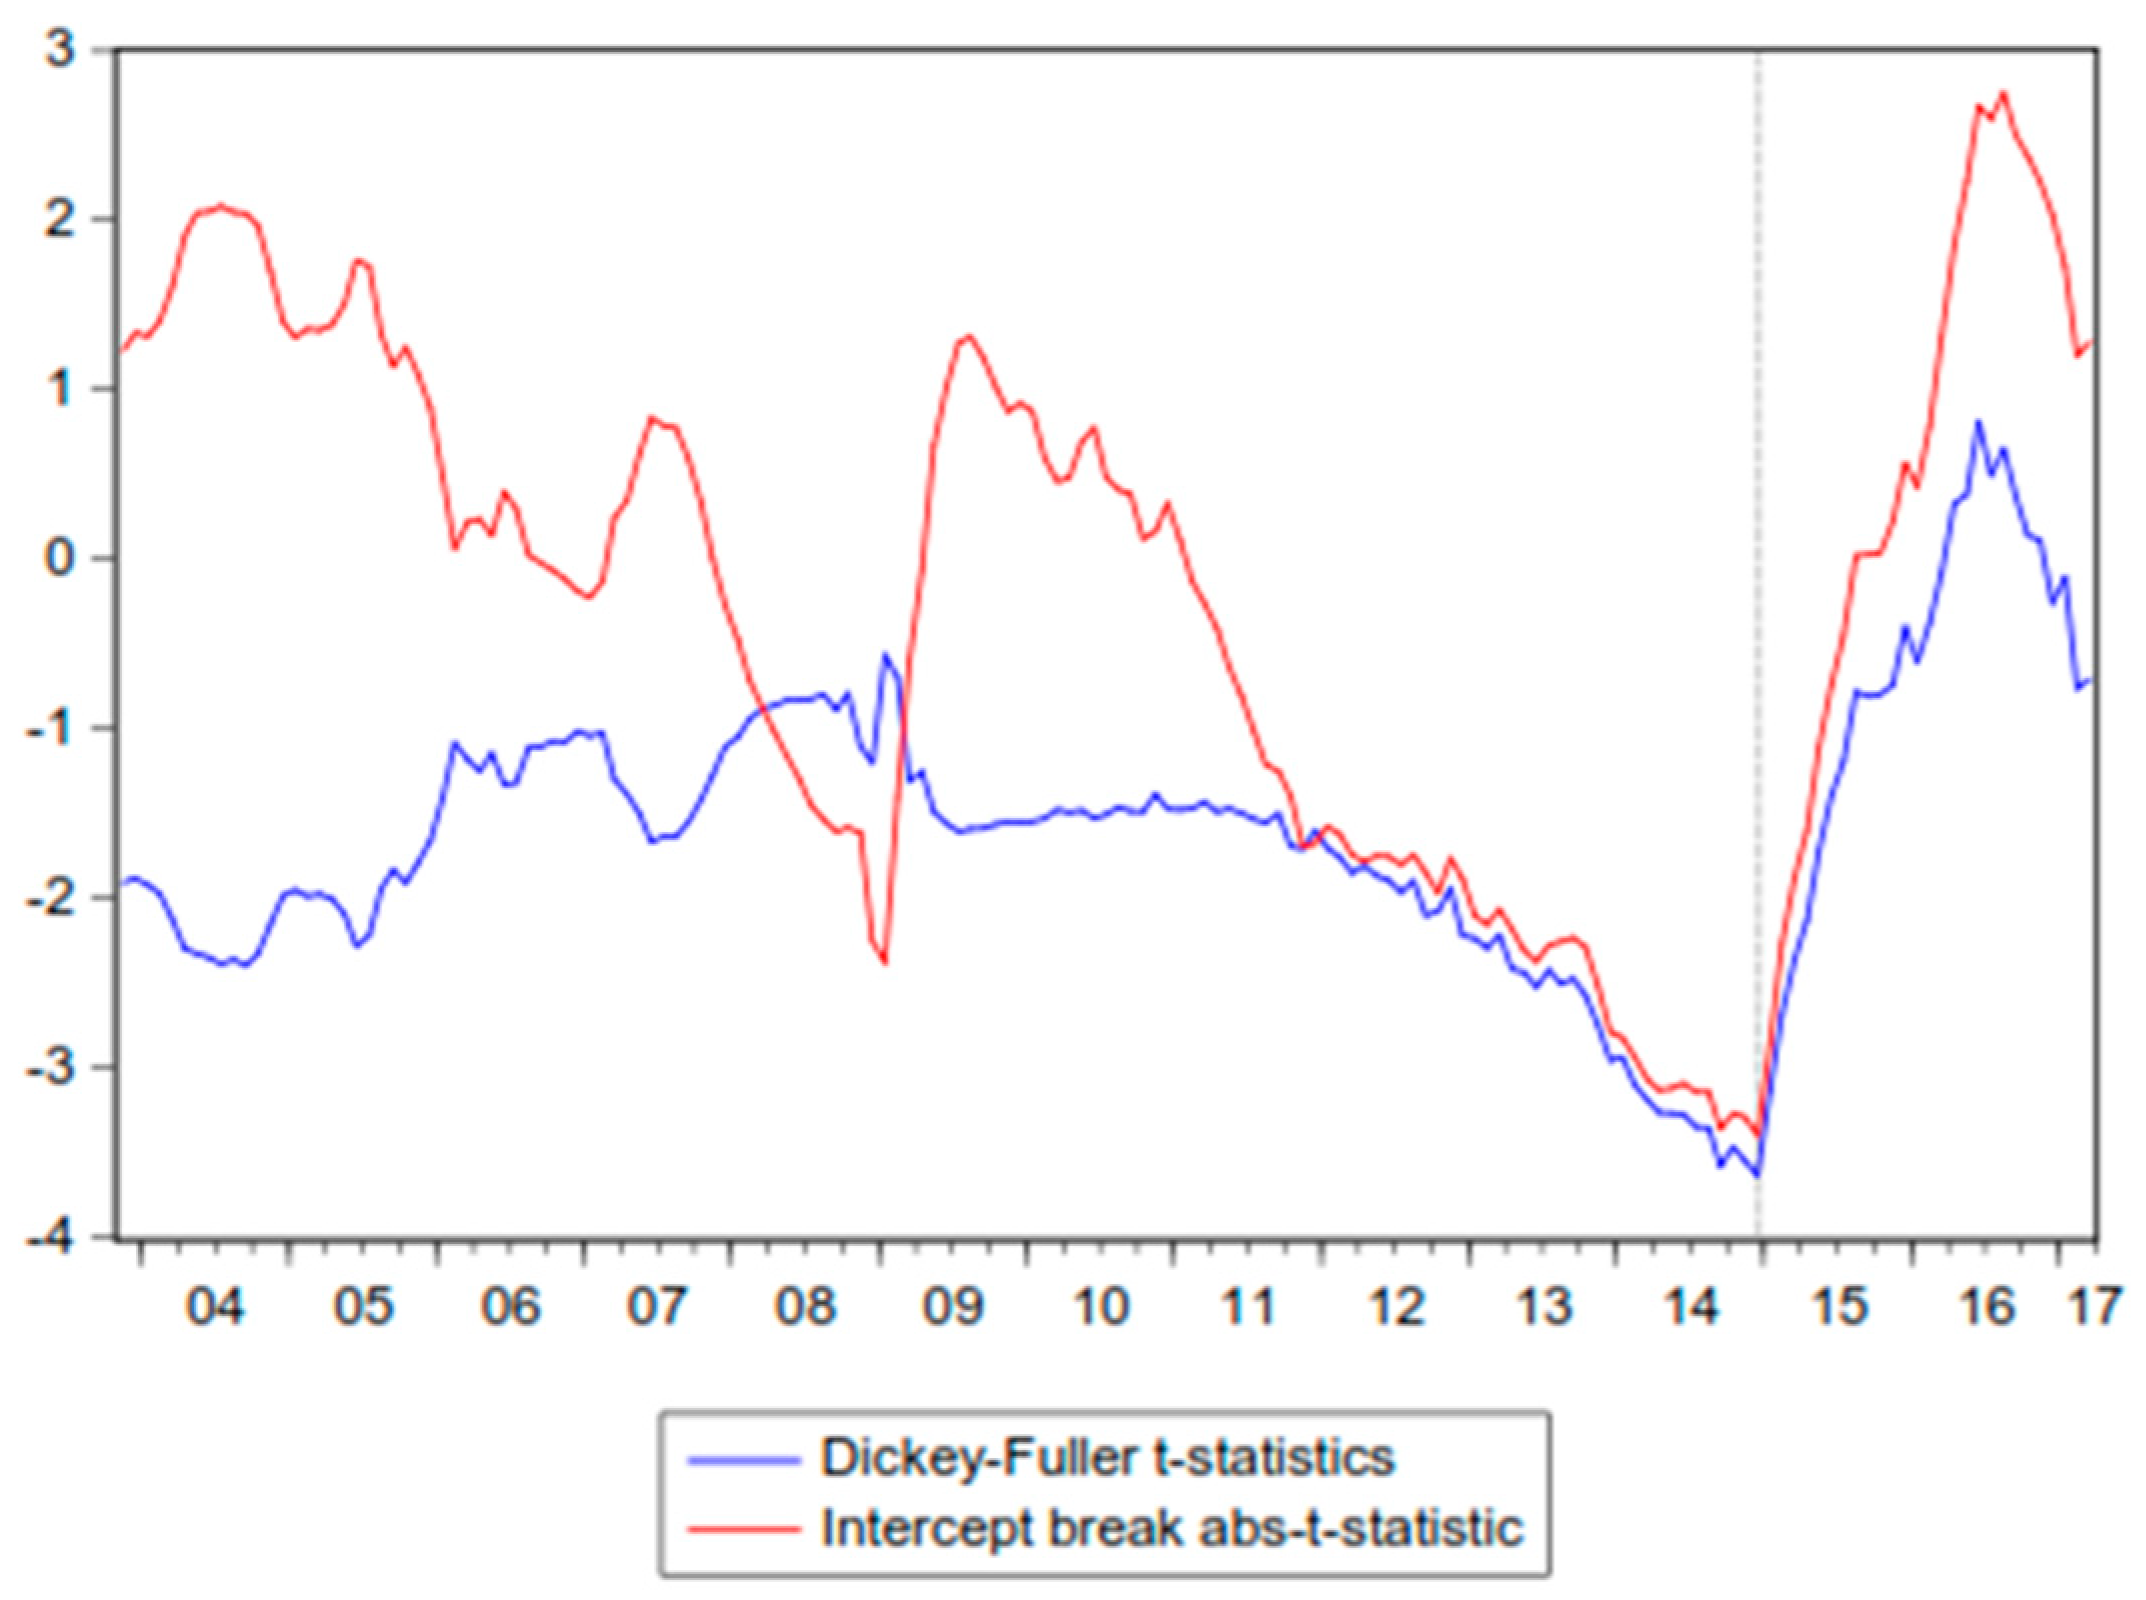
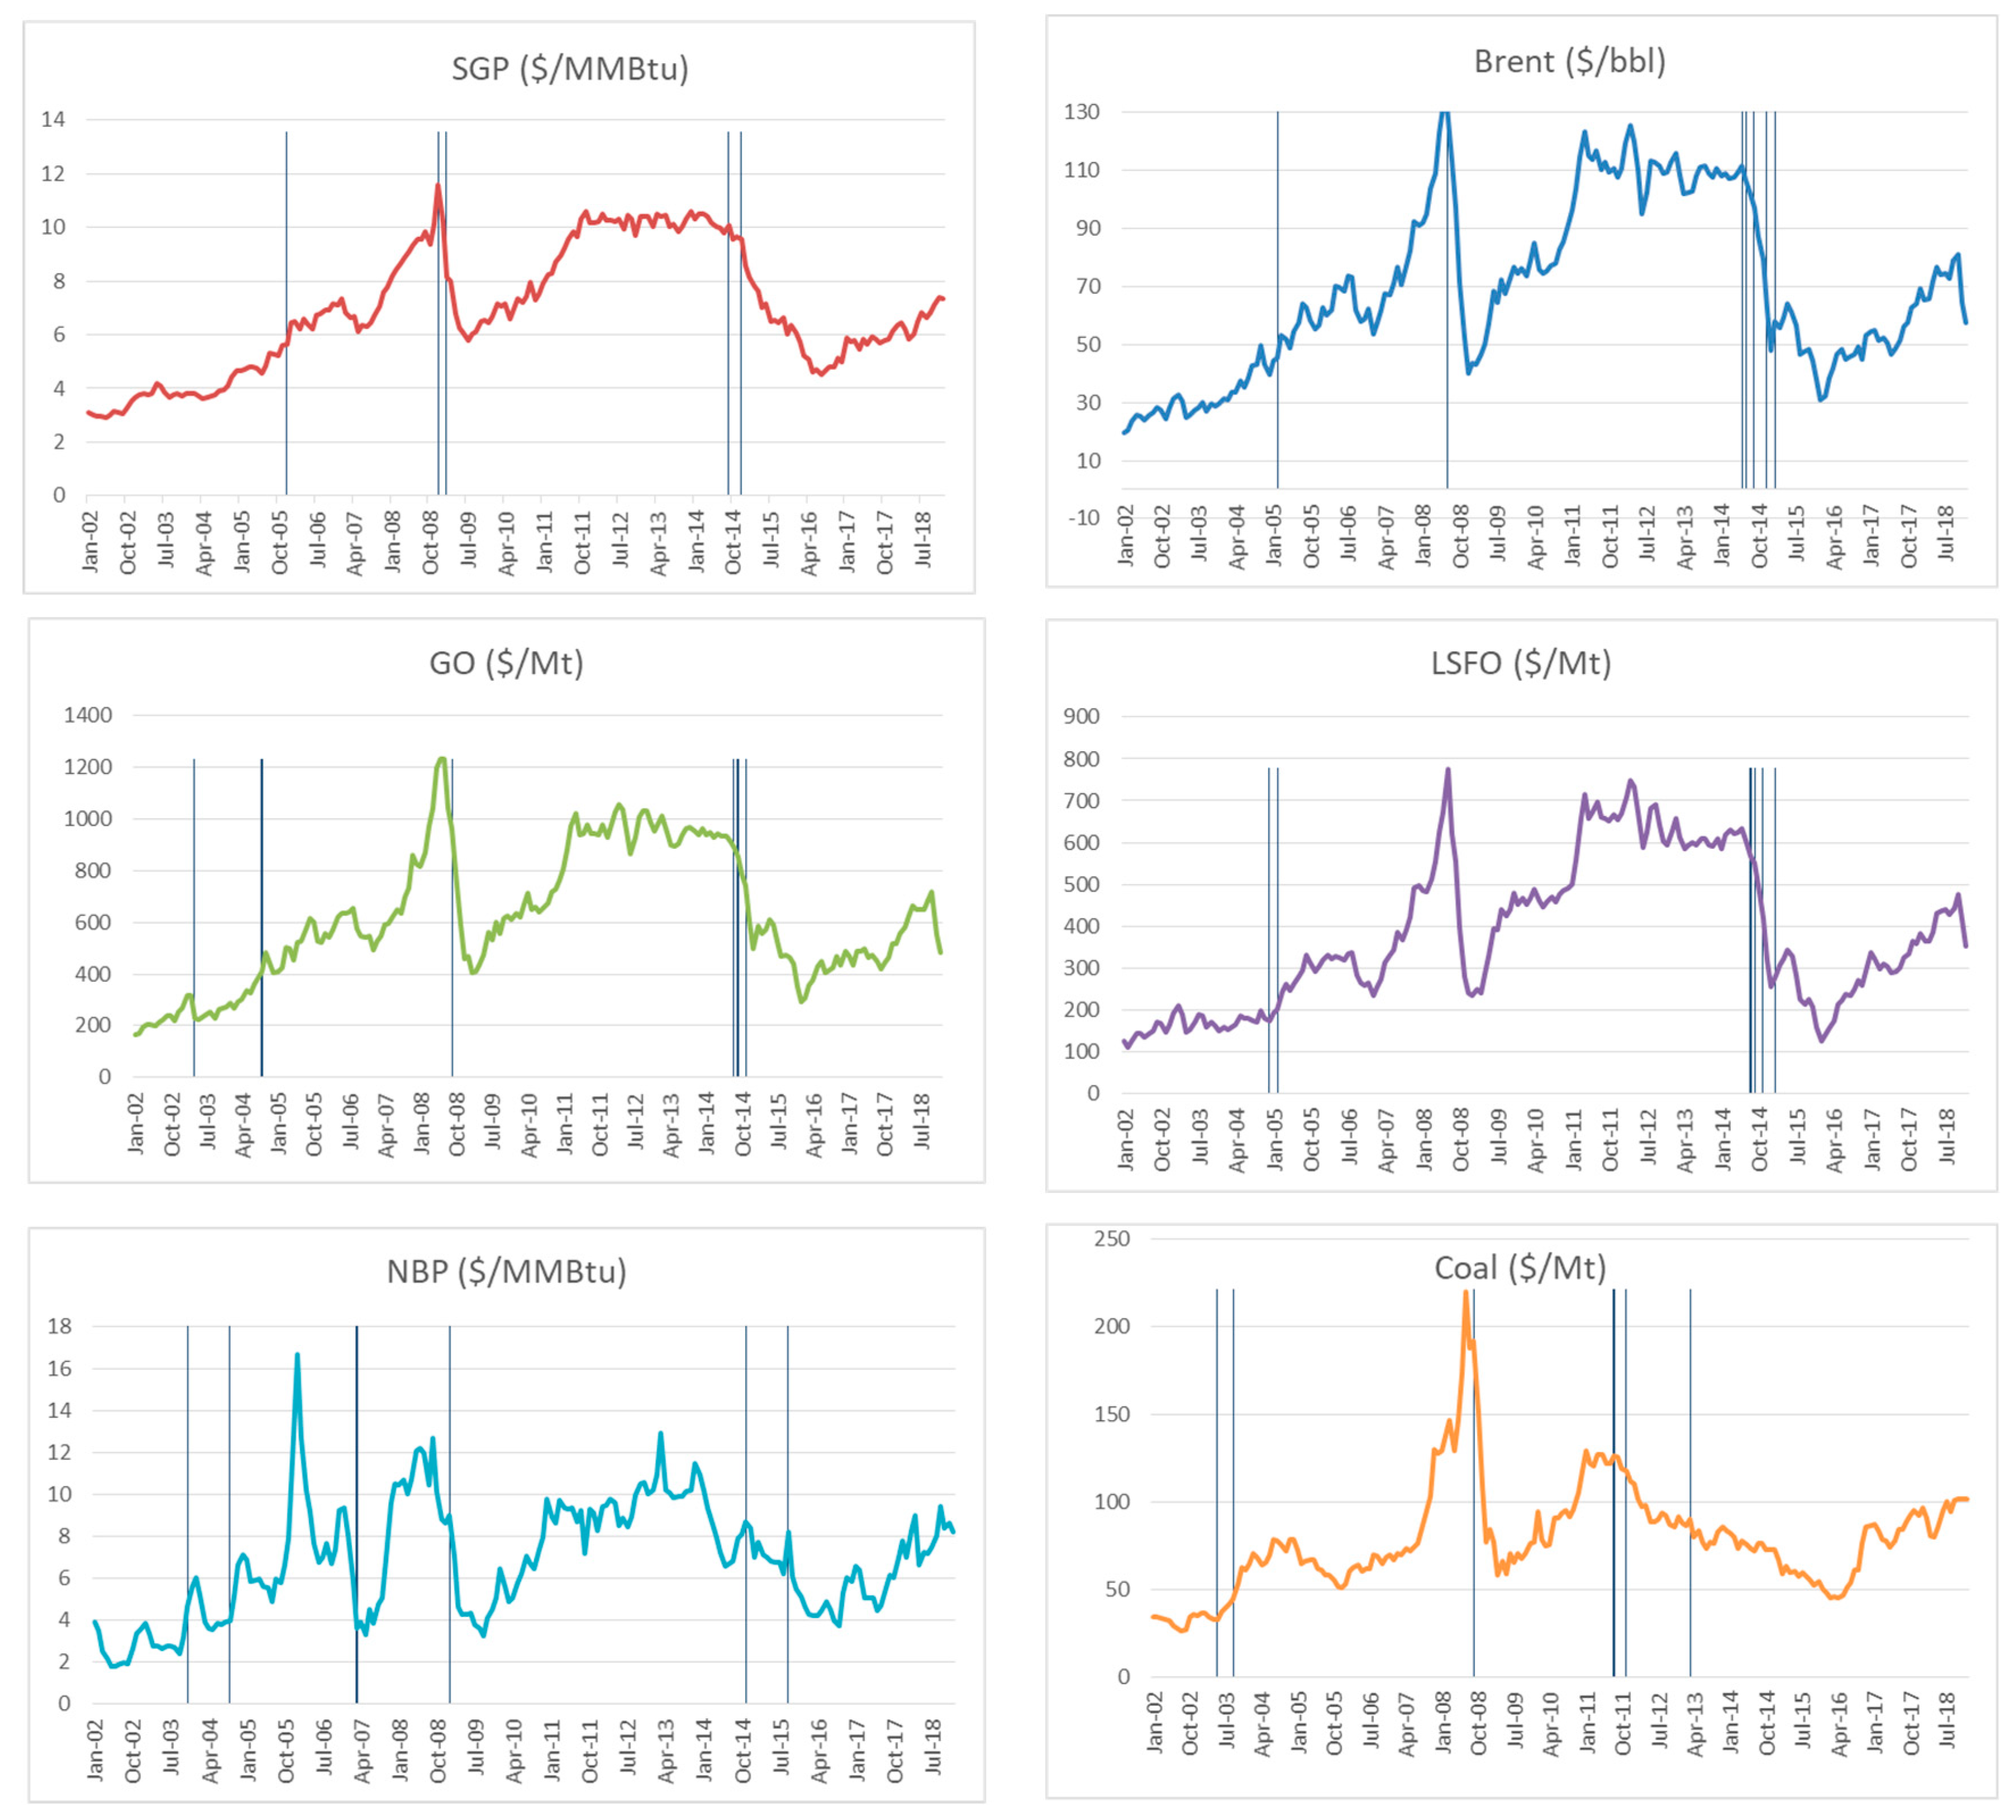
- Zivot and Andrews (ZA) [20] and Perron and Vogelsang (VP) [21]. These unit root tests have in common that they endogenize the choice of the break point proposing to estimate the break date such that it gives the most weight to the trend stationary alternative, i.e., either minimizing the Dickey–Fuller statistic or optimizing a statistic which tests the significance of one or more of the coefficients on the trend break dummy variables.
- (ii)
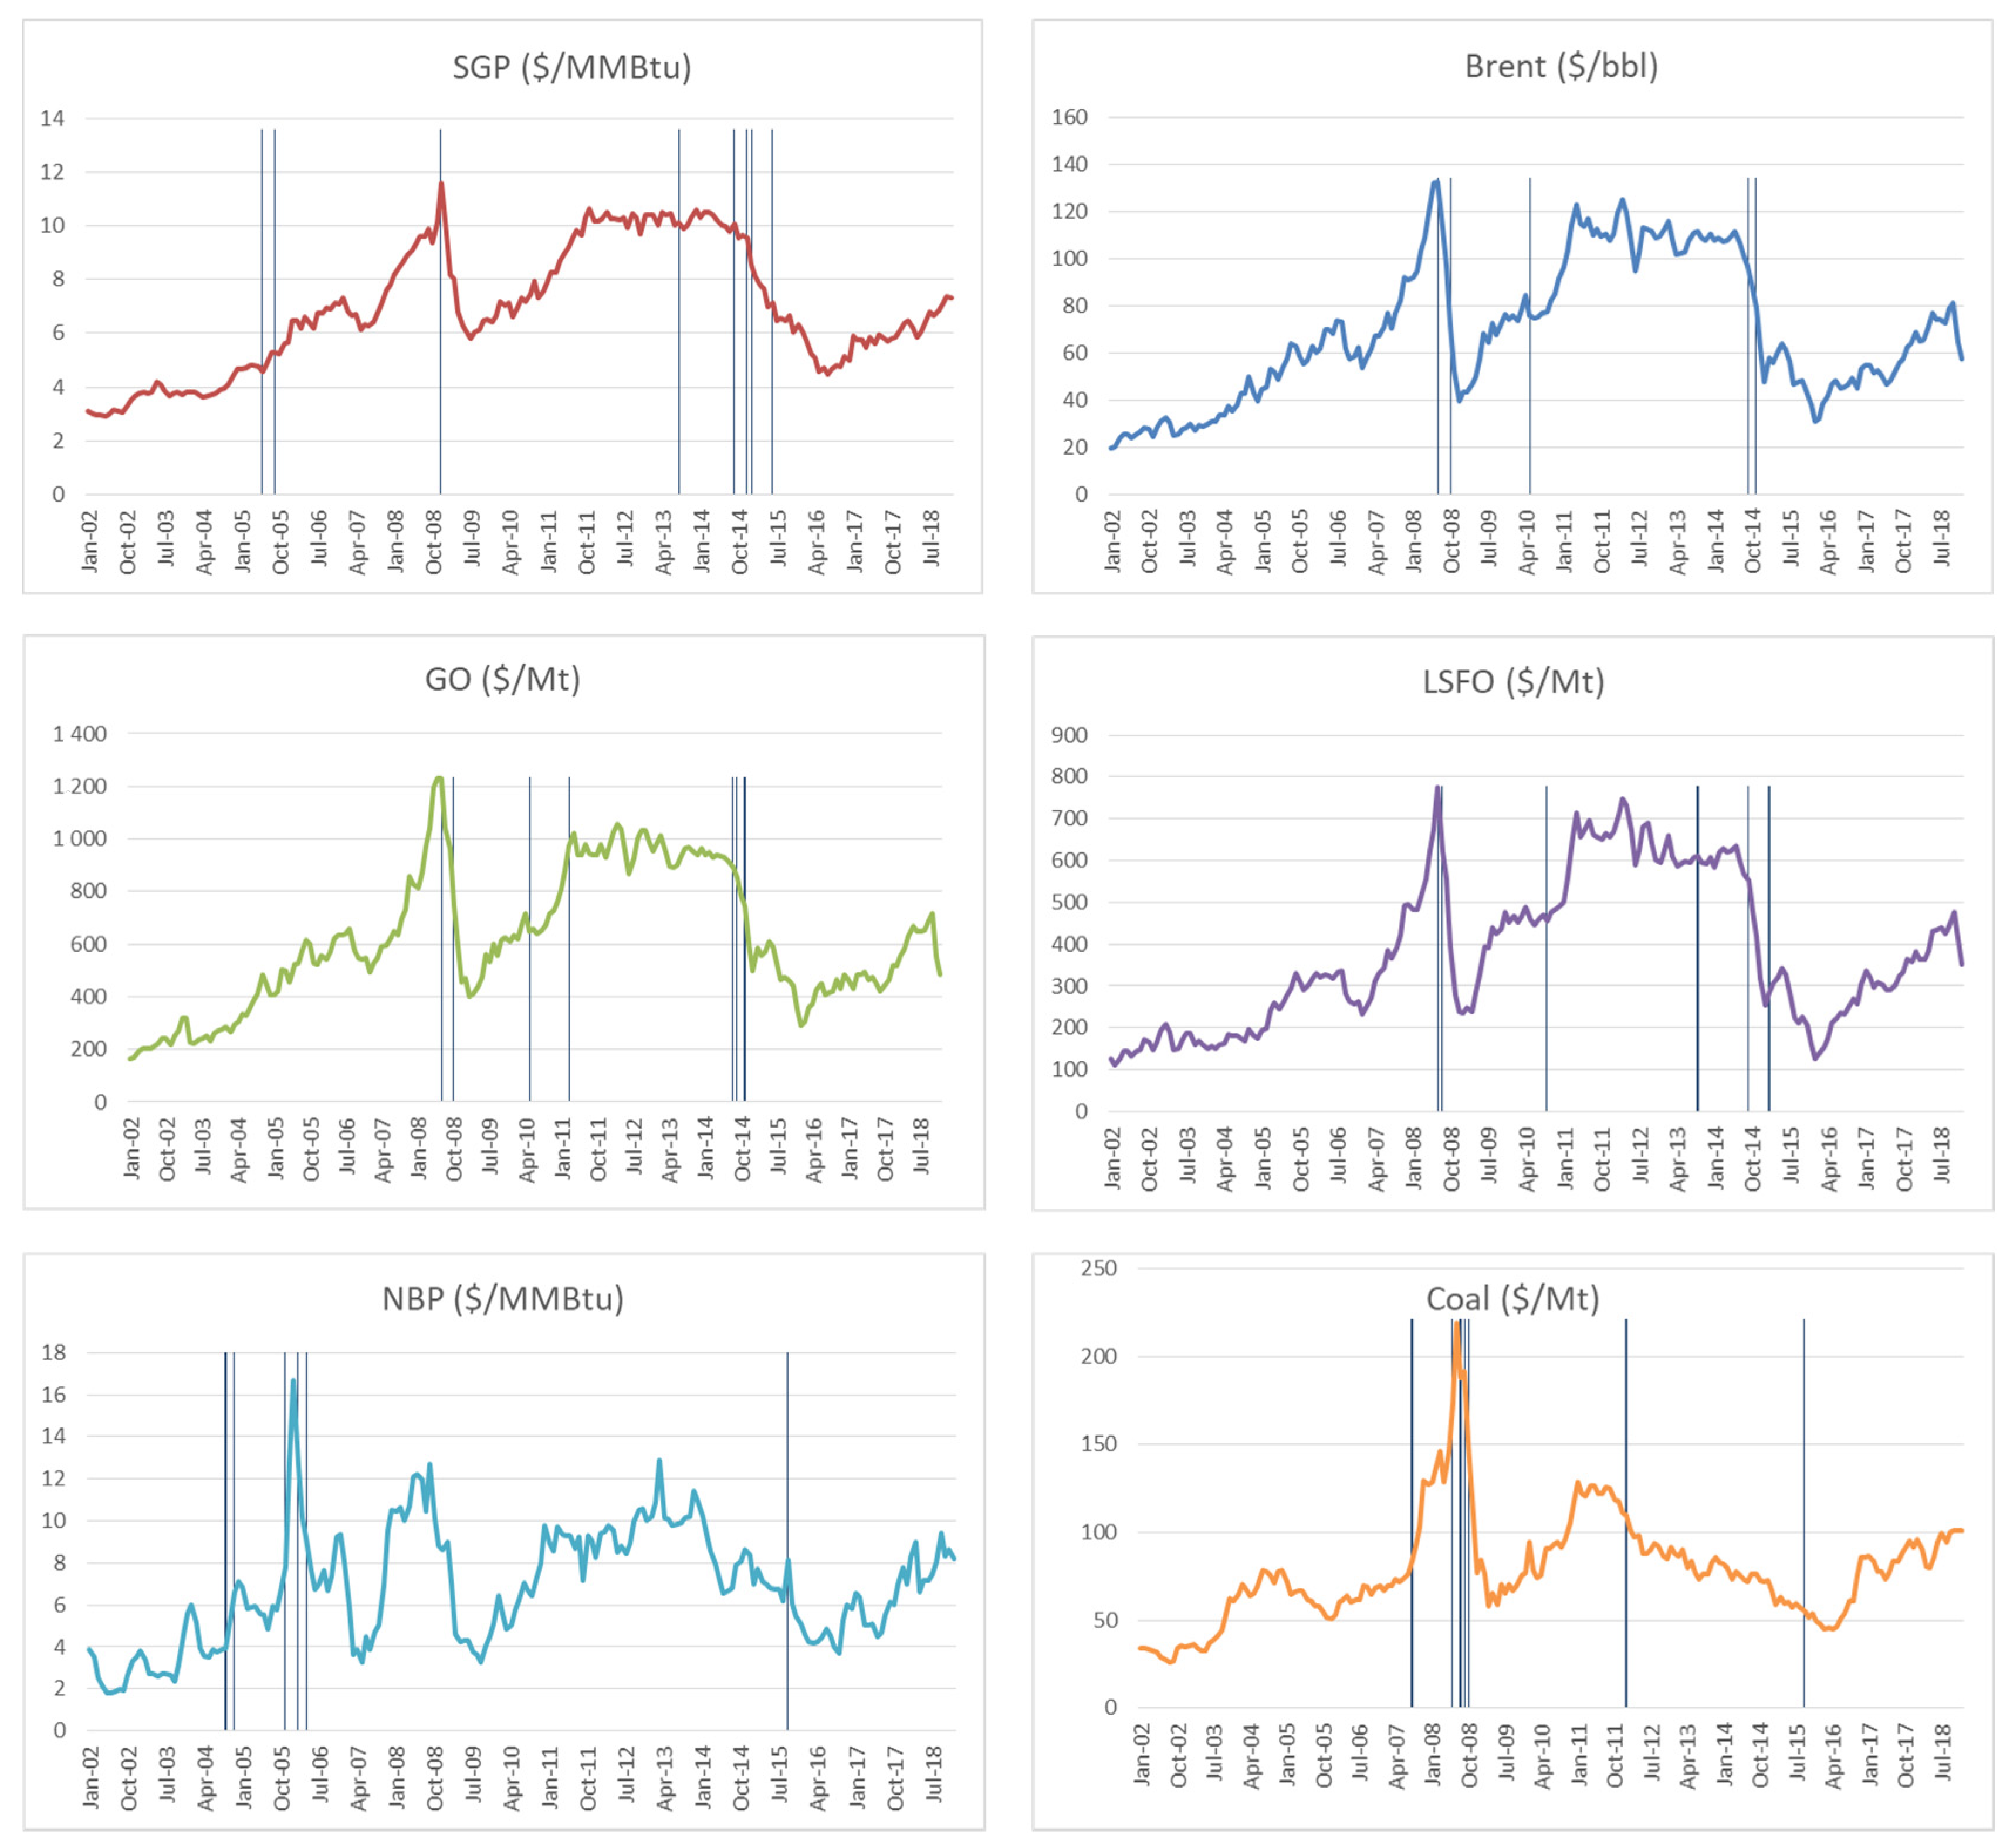
- Lumsdaine and Papell (LP) [22]. This specification extends the ZA design to introduce a unit root testing procedure that allows for two structural breaks, although, unfortunately, it leads to results that are heavily dependent on break size [23]; however, implementing this framework has clear advantages, as it provides less (or stronger) evidence against the unit root hypothesis than that given by Perron, plus it provides valuable information as to whether structural breaks have significantly contributed to a change in trend or not.
- (iii)
- Saikkonen and Lütkepohl [24] and Lanne et al. (LLS) [25] extended Saikkonen and Lütkepohl [26], and Lanne et al. [27] tests respectively—these tests are considered in turn extensions of the tests of Elliot, Rothenberg and Stock [28], which are based on estimating the deterministic term first by generalized least squares (GLS) and subtracting it from the time series. It has to be noted that [26,27] tests have the convenient feature that they allow for smooth transitions through different shift functions what may be more reasonable than assuming an abrupt shift. Moreover, tests statistics are easy to compute for quite general shift functions and allow the possibility to include seasonal dummies in addition to a constant or linear trend line.
- (iv)
- Lee and Strazicich (LS) [29,30]. These testing methodologies propose one and two break Lagrange multiplier (LM) unit root tests as alternatives to the ZA and LP tests respectively. In contrast to the ADF (augmented Dickey–Fuller) type of tests, the LM unit root test has the advantage that it is unaffected by breaks under the null, and therefore solves the issue about the asymptotic validity of the null distributions described above. The breakpoint estimation scheme is similar to those in the ZA and LP tests; i.e., the breakpoints are determined to be where the test statistic is minimized. While the LM test offers an improvement over procedures that only allow for breaks under the trend stationary alternative, it is recognized to be substantially undersized for large breaks, whereas it has difficulties in identifying small break dates [23]. As a result of continuous progress made on this area, Ming et al. [31] proposed a new unit root test that adopts the residual augmented least squares (RALS) procedure to gain improved power when the error term follows a non-normal distribution. These new tests using the RALS procedure are more powerful than the usual LM test which does not incorporate information on non-normal errors, and it is not free of nuisance parameters that indicate the locations of a structural break.
- (v)
3. Results
3.1. Generic Unit Root Tests
3.2. Unit Root Tests with One Structural Break
3.3. Unit Root Tests with Two Structural Breaks
4. Discussion
5. Conclusions
Author Contributions
Funding
Conflicts of Interest
References
- Perron, P. The Great Crash, the Oil Price Shock, and the Unit Root Hypothesis. Econometrica 1989, 57, 1361–1401. [Google Scholar] [CrossRef]
- Baffes, J.; Kshirsagar, V. Sources of volatility during four oil price crashes. Appl. Econ. Lett. 2016, 23, 402–406. [Google Scholar]
- Van Eyden, R.; Difeto, M.; Gupta, R.; Wohar, M.E. Oil price volatility and economic growth: Evidence from advanced economies using more than a century’s data. Appl. Energy 2019, 233–234, 612–621. [Google Scholar] [CrossRef] [Green Version]
- Van Robays, I. Macroeconomic Uncertainty and Oil Price Volatility. Oxf. Bull. Econ. Stat. 2016, 78, 671–693. [Google Scholar] [CrossRef]
- Su, X.; Zhu, H.; You, W.; Ren, Y.; Hwang, M.J.; Huang, B.N. Heterogeneous effects of oil shocks on exchange rates: Evidence from a quantile regression approach. Springer Plus 2016, 5, 1187. [Google Scholar] [CrossRef] [Green Version]
- Bachmeier, L.; Soheil, R. Oil shocks and stock return volatility. In The Quarterly Review of Economics and Finance; Elsevier: Amsterdam, The Netherlands, 2018; Volume 68(C), pp. 1–9. [Google Scholar]
- Huang, S.; Haizhong, A.; Gao, X.; Sun, X. Do oil price asymmetric effects on the stock market persist in multiple time horizons? Appl. Energy 2017, 185, 1799–1808. [Google Scholar] [CrossRef]
- Foster, E.; Contestabile, M.; Blazquez, J.; Manzano, B. The unstudied barriers to widespread renewable energy deployment: Fossil fuel price responses. Energy Policy 2017, 103, 258–264. [Google Scholar] [CrossRef]
- Baffes, J.; Dennis, A. Long Term Drivers of Food Prices. In Working Paper 2013; World Bank: Washington, DC, USA, 2013. [Google Scholar]
- Cansado-Bravo, P.; Rodríguez-Monroy, C. Persistence of Oil Prices in Gas Import Prices and the Resilience of the Oil-Indexation Mechanism. The Case of Spanish Gas Import Prices. Energies 2018, 11, 3486. [Google Scholar] [CrossRef] [Green Version]
- Weijermars, R. Economic appraisal of shale gas plays in Continental Europe. Appl. Energy 2013, 106, 100–115. [Google Scholar] [CrossRef]
- Durlauf, N.; Philips, C. Trends versus Random Walks in Time Series Analysis. Econometrica 1988, 56, 1333–1354. [Google Scholar] [CrossRef]
- Harris, D.; Harvey, D.I.; Leybourne, S.J.; Taylor, A.M.R. Testing for a Unit Root in the presence of a possible break in trend. Econom. Theory 2009, 25, 1545–1588. [Google Scholar] [CrossRef] [Green Version]
- Perron, P.; Yabu, T. Testing for shifts in trend with an integrated or stationary noise component. J. Bus. Econ. Stat. 2009, 27, 369–396. [Google Scholar] [CrossRef]
- Kejriwal, M.; Perron, P. A sequential procedure to determine the number of breaks in trend with an integrated or stationary noise component. J. Time Ser. Anal. 2010, 31, 305–328. [Google Scholar] [CrossRef]
- Carrion-i-Silvestre, J.L.; Kim, D.; Perron, P. GLS-based unit root tests with multiple structural breaks both under the null and the alternative hypotheses. Econom. Theory 2009, 25, 1754–1792. [Google Scholar] [CrossRef]
- Harvey, D.I.; Leybourne, S.J.; Taylor, A.M.R. Testing for unit roots in the possible presence of multiple trend breaks using minimum Dickey–Fuller statistics. J. Econom. 2013, 177, 205–284. [Google Scholar] [CrossRef]
- Harvey, D.I.; Leybourne, S.J.; Taylor, A.M.R. Unit root testing under a local break in trend. J. Econom. 2012, 167, 140–167. [Google Scholar] [CrossRef]
- Hamilton, J.D. Time Series Analysis; Princeton University Press: Princeton, NJ, USA, 1994. [Google Scholar]
- Zivot, E.; Andrews, D.W.K. Further evidence on the great crash, the oil-price shock, and the unit-root hypothesis. J. Bus. Econ. Stat. 1992, 10, 251–270. [Google Scholar]
- Vogelsang, T.J.; Perron, P. Additional tests for a unit root allowing for a break in the trend function at an unknown time. Int. Econ. Rev. 1998, 39, 1073–1100. [Google Scholar] [CrossRef] [Green Version]
- Lumsdaine, R.; Papell, D. Multiple trend breaks and the unit root hypothesis. Rev. Econ. Stat. 1997, 79, 212–218. [Google Scholar] [CrossRef]
- Narayan, P.K.; Narayan, S.; Popp, S. Energy consumption at the state level: The unit root null hypothesis from Australia. Appl. Energy 2010, 87, 1953–1962. [Google Scholar] [CrossRef]
- Saikkonen, P.; Lütkepohl, H. Testing for a unit root in a time series with a level shift at unknown time. Econom. Theory 2012, 18, 313–348. [Google Scholar] [CrossRef] [Green Version]
- Lanne, M.; Lütkepohl, H.; Saikkonen, P. Test Procedures for Unit Roots in Time Series with Level Shifts at Unknown Time, Discussion Paper; Humboldt-Universitat Berlin: Berlin, Germany, 2001. [Google Scholar]
- Saikkonen, P.; Lütkepohl, H. Testing for unit roots in time series with level shifts. Allg. Stat. Arch. 2000, 85, 1–25. [Google Scholar] [CrossRef] [Green Version]
- Lanne, M.; Lütkepohl, H.; Saikkonen, P. Comparison of unit root tests for time series with level shifts. J. Time Ser. Anal. 2002, 23, 667–685. [Google Scholar] [CrossRef] [Green Version]
- Elliott, G.; Rothenberg, T.; Stock, J. Efficient Tests for an Autoregressive Unit Root. Econometrica 1996, 64, 813–836. [Google Scholar] [CrossRef] [Green Version]
- Lee, J.; Strazicich, M.C. Minimum LM Unit Root Test with One Structural Break; Economics Bulletin, Vol 33. Working Paper; Department of Economics, Appalachain State University: Boone, NC, USA, 2004. [Google Scholar]
- Lee, J.; Strazicich, M.C. Minimum LM Unit Root Test with Two Structural Breaks. Rev. Econ. Stat. 2003, 63, 1082–1089. [Google Scholar] [CrossRef]
- Ming, M.; Lee, J.; Payne, J. RALS-LM unit root test with trend breaks and non-normal errors: Application to the Prebisch-Singer hypothesis. Stud. Nonlinear Dyn. Econom. 2017, 21, 31–45. [Google Scholar] [CrossRef]
- Kim, D.; Perron, P. Unit root tests allowing for a break in the trend function at an unknown time under both the null and alternative hypotheses. J. Econom. 2009, 148, 1–13. [Google Scholar] [CrossRef]
- Perron, P.; Zhu, X. Structural breaks with deterministic and stochastic trends. J. Econom. 2005, 129, 65–119. [Google Scholar] [CrossRef]
- Hamilton, J. A New Approach to the Economic Analysis of Nonstationary Time Series and the Business Cycle. Econometrica 1989, 57, 357–384. [Google Scholar] [CrossRef]
- Dickey, D.A.; Fuller, W.A. Distribution of the Estimators for Autoregressive Time Series with a Unit Root. J. Am. Stat. Assoc. 1979, 74, 427–431, JSTOR. Available online: www.jstor.org/stable/2286348 (accessed on 14 November 2020).
- Kwiatkowski, D.; Phillips, P.C.B.; Schmidt, P.; Shin, Y. Testing the Null Hypothesis of Stationarity against the Alternative of a Unit Root. J. Econom. 1992, 54, 159–178. [Google Scholar] [CrossRef]
- Sen, A. Performance of unit-root tests when ‘form of break’ is misspecified under the alternative. In Proceedings of the Annual Meeting of the American Statistical Association, Washington, DC, USA, 5–9 August 2001. [Google Scholar]
- Energy Charter Secretariat. Putting a Price on Energy; International coal Pricing: Washington, DC, USA, 2010. [Google Scholar]
- Saunders, T. Developments in Thermal Coal Markets; Bulletin; June Quarter 2015; Reserve Bank of Australia: Sydney, Australia, 2015. [Google Scholar]
- Jonathan, S. Is There a Rationale for the Continuing Link to Oil Product Prices in Continental European Long-Term Gas Contracts? Oxford Institute for Energy Studies: Oxford, UK, 2007. [Google Scholar]


| Variable | Mean Price Level | Standard Deviation | Coefficient of Variation (%) | Skewness | Kurtosis |
|---|---|---|---|---|---|
| InSGP | 1.87 | 0.36 | 0.19 | −0.41 | 2.25 |
| InBrent | 4.13 | 0.47 | 0.11 | −0.41 | 2.31 |
| InGasoil | 6.32 | 0.46 | 0.07 | −0.55 | 2.66 |
| InFuel oil | 5.82 | 0.50 | 0.09 | −0.23 | 1.95 |
| InNBP | 1.83 | 0.45 | 0.25 | −0.66 | 2.94 |
| InCoal | 4.29 | 0.38 | 0.09 | −0.31 | 3.56 |
| Ln Price in Levels | Ln Price 1st Differences | |||||||
|---|---|---|---|---|---|---|---|---|
| Without Trend | With Trend | Without Trend | With Trend | |||||
| Stat | ADF | KPSS | ADF | KPSS | ADF | KPSS | ADF | KPSS |
| Brent | 0.283 | 6.625 | −2.302 | 3.471 | −3.761 | 0.367 | −3.895 | 0.051 |
| GO | 0.469 | 6.559 | −2.250 | 3.499 | −3.607 | 0.437 | −4.586 | 0.051 |
| LSFO | 0.341 | 6.777 | −3.434 | 3.336 | −3.692 | 0.190 | −5.341 | 0.063 |
| SGP | 0.813 | 8.262 | −1.450 | 3.851 | −12.960 | 0.369 | −13.122 | 0.097 |
| NBP | −0.390 | 4.779 | −3.299 | 1.895 | −11.444 | 0.039 | −8.537 | 0.036 |
| Coal | 0.704 | 4.574 | −3.434 | 2.512 | −11.883 | 0.132 | −11.883 | 0.081 |
| cValue | −1.942 | 0.463 | −3.443 | 0.146 | −1.944 | 0.463 | −3.443 | 0.146 |
| Model | Model | Inference | |||||||||||
|---|---|---|---|---|---|---|---|---|---|---|---|---|---|
| Crash | Mixed | Crash | Mixed | ||||||||||
| Variable | t-Statistic | Value | Break Date | Value | Break Date | Inference | Variable | t-Statistic | Value | Break Date | Value | Break Date | |
| Brent | tαZA | −4.422 | June 2014 | −4.196 | September 2014 | N-S | SGP | tαZA | −3.618 | September 2014 | −2.489 | June 2005 | N-S |
| tθ | −4.440 | September 2014 | −4.261 | September 2014 | N-S | tθ | −3.642 | December 2014 | −2.480 | June 2005 | N-S | ||
| tIδI | −4.425 | July 2014 | −3.493 | May 2010 | N-S | tIδI | −3.642 | December 2014 | −1.047 | June 2015 | N-S | ||
| τ | −1.614 | February 2015 | - | - | N-S | τ | −2.260 | February 2009 | - | - | N-S | ||
| tαλ | −3.918 | July 2014 | −3.493 | May 2010 | N-S | tαλ | −1.690 | February 2015 | −2.547 | August 2013 | N-S | ||
| tαLS | −1.703 | December 2014 | −2.604 | November 2014 | N-S | tαLS | −1.202 | December 2014 | −2.128 | September 2014 | N-S | ||
| Gasoil | tαZA | −3.937 | August 2014 | −3.688 | August 2014 | N-S | NBP | tαZA | −4.289 | September 2004 | −4.630 | September 2004 | N-S |
| tθ | −3.956 | August 2014 | −3.718 | September 2014 | N-S | tθ | −4.579 | September 2003 | −4.642 | September 2003 | N-S | ||
| tIδI | −3.956 | August 2014 | −3.270 | May 2010 | N-S | tIδI | −4.290 | September 2004 | −4.149 | February 2006 | N-S | ||
| τ | −1.625 | April 2003 | - | - | N-S | τ | −3.505 | March 2007 | - | - | S | ||
| tαλ | −3.514 | October 2014 | −3.254 | September 2014 | N-S | tαλ | −4.431 | September 2004 | −4.384 | November 2005 | S | ||
| tαLS | −1.582 | November 2014 | −2.391 | November 2014 | N-S | tαLS | −2.875 | November 2003 | −3.328 | February 2006 | N-S | ||
| Fuel oil | tαZA | −5.139 | September 2014 | −5.010 | September 2014 | N-S | Coal | tαZA | −3.077 | November 2011 | −3.257 | September 2008 | N-S |
| tθ | −5.165 | September 2014 | −5.034 | September 2014 | S | tθ | −3.490 | May 2003 | −3.060 | August 2008 | N-S | ||
| tIδI | −5.165 | August 2014 | −3.734 | September 2010 | S | tIδI | −3.490 | May 2003 | −3.060 | August 2008 | N-S | ||
| τ | −2.057 | February 2015 | - | - | N-S | τ | −2.346 | August 2011 | - | - | N-S | ||
| tαλ | −4.530 | October 2014 | −3.823 | August 2008 | N-S | tαλ | −2.976 | March 2014 | −3.617 | June 2008 | N-S | ||
| tαLS | −1.730 | November 2014 | −2.515 | September 2014 | N-S | tαLS | −1.678 | September 2003 | −2.435 | October 2008 | N-S | ||
| Model | Model | Inference | |||||||||||
|---|---|---|---|---|---|---|---|---|---|---|---|---|---|
| Crash | Mixed | Crash | Mixed | ||||||||||
| Variable | t-Stat | Value | Break Date | Value | Break Date | Inference | Variable | t-Stat | Value | Break Date | Value | Break Date | |
| Brent | LP | −5.382 | July 2008 | -6.097 | July 2008 | N-S | SGP | LP | −5.253 | December 2008 | −5.058 | December 2008 | N-S |
| September 2014 | September 2014 | December 2014 | December 2014 | ||||||||||
| LS | −1.821 | February 2005 | −3.173 | October 2008 | N-S | LS | −1.281 | December 2005 | −2.783 | September 2005 | N-S | ||
| December 2014 | November 2014 | December 2014 | January 2015 | ||||||||||
| GO | LP | −4.911 | September 2008 | −5.658 | July 2008 | N-S | NBP | LP | −5.108 | January 2009 | −5.682 | April 2006 | N-S |
| September 2014 | September 2014 | November 2014 | September 2015 | ||||||||||
| LS | −1.708 | September 2004 | −3.071 | October 2008 | N-S | LS | −3.161 | November 2003 | −3.625 | November 2004 | N-S | ||
| November 2014 | March 2011 | September 2015 | September 2015 | ||||||||||
| LSFO | LP | −5.668 | December 2004 | −5.777 | July 2008 | N-S | Coal | LP | −3.765 | September 2008 | −4.310 | September 2008 | N-S |
| September 2014 | September 2014 | March 2013 | January 2012 | ||||||||||
| LS | −1.851 | February 2005 | −3.416 | September 2013 | N-S | LS | −1.782 | September 2003 | −2.836 | August 2007 | N-S | ||
| November 2014 | February 2015 | March 2013 | September 2015 | ||||||||||
| SGP | Brent | Go | LSFO | NBP | Coal | |
|---|---|---|---|---|---|---|
| ZA | September 2014 | June 2014 | August 2014 | September 2014 | September 2004 | November 2011 |
| VP | December 2014 | July 2014 | August 2014 | August 2014 | September 2004 | May 2003 |
| LS1 | December 2014 | December 2014 | November 2014 | November 2014 | November 2003 | September 2003 |
| LLS | February 2009 | February 2015 | April 2003 | February 2015 | March 2007 | August 2011 |
| LP2A | December 2008 | July 2008 | September 2008 | December 2004 | January 2009 | September 2008 |
| LP2B | December 2014 | September 2014 | September 2014 | September 2014 | November 2014 | March 2013 |
| LS2A | December 2005 | February 2005 | September 2004 | February 2005 | November 2003 | September 2003 |
| LS2B | December 2014 | December 2014 | November 2014 | November 2014 | September 2015 | March 2013 |
| SGP | Brent | Go | LSFO | NBP | Coal | |
|---|---|---|---|---|---|---|
| ZA | July 2005 | June 2014 | August 2014 | September 2014 | September 2004 | September 2008 |
| VP | July 2015 | May 2010 | May 2010 | September 2010 | February 2006 | August 2008 |
| LS1 | September 2014 | November 2014 | November 2014 | September 2014 | February 2006 | October 2008 |
| KP | 2013-8 | September 2014 | September 2014 | August 2008 | November 2005 | June 2008 |
| LP2A | December 2008 | July 2008 | July 2008 | July 2008 | April 2006 | September 2008 |
| LP2B | December 2014 | September 2014 | September 2014 | September 2014 | September 2015 | January 2012 |
| LS2A | September 2005 | October 2008 | October 2008 | September 2013 | November 2004 | August 2007 |
| LS2B | January 2015 | November 2014 | March 2011 | February 2015 | September 2005 | September 2015 |
Publisher’s Note: MDPI stays neutral with regard to jurisdictional claims in published maps and institutional affiliations. |
© 2020 by the authors. Licensee MDPI, Basel, Switzerland. This article is an open access article distributed under the terms and conditions of the Creative Commons Attribution (CC BY) license (http://creativecommons.org/licenses/by/4.0/).
Share and Cite
Cansado-Bravo, P.; Rodríguez-Monroy, C. The Effects of Structural Breaks on Energy Resources in the Long Run. Evidence from the Last Two Oil Price Crashes before COVID-19. Designs 2020, 4, 49. https://doi.org/10.3390/designs4040049
Cansado-Bravo P, Rodríguez-Monroy C. The Effects of Structural Breaks on Energy Resources in the Long Run. Evidence from the Last Two Oil Price Crashes before COVID-19. Designs. 2020; 4(4):49. https://doi.org/10.3390/designs4040049
Chicago/Turabian StyleCansado-Bravo, Pablo, and Carlos Rodríguez-Monroy. 2020. "The Effects of Structural Breaks on Energy Resources in the Long Run. Evidence from the Last Two Oil Price Crashes before COVID-19" Designs 4, no. 4: 49. https://doi.org/10.3390/designs4040049
APA StyleCansado-Bravo, P., & Rodríguez-Monroy, C. (2020). The Effects of Structural Breaks on Energy Resources in the Long Run. Evidence from the Last Two Oil Price Crashes before COVID-19. Designs, 4(4), 49. https://doi.org/10.3390/designs4040049


