It should be noted that only two machines were analyzed using the KHB methodology to demonstrate its effectiveness. Better output could be obtained by undertaking the same steps with other machines as well. Tables 3–6 and Equations (5)–(8) show the interdependencies between the saw and coating machines in changing the cycle time, number of operations, and the block %. Increasing or decreasing the cycle time of the saw machine affected the number of operations and the block %, while increasing or decreasing the cycle time of the coating machine affected the number of operations only.
For the saw machine, decreasing the cycle time increased the block % of both the saw and coating machines, so increasing or decreasing the cycle time would not be efficient in optimizing the production line. On the other hand, decreasing the cycle time of the coating machine would be very efficient, as the interdependency was the number of operations, and with decreasing cycle times, the number of operations would increase. The data for the variable cycle times of the production line are described in
Table 2a,b.
Table 2a shows the impact on the saw machine for changing the cycle time of both saw and coating machines whereas
Table 2b shows the impact on the coating machine for changing the cycle time of both saw and coating machines.
4.5.1. Measuring Interdependency in the Saw and Coating Machines
Figure 15 and
Table 3,
Table 4,
Table 5 and
Table 6 show the interdependencies between the saw and coating machines. To identify the interdependency of the process, the cycle times were decreased/increased, and the impact was measured for machine idle time, block % and number of operations.
Table 2 shows the consequent output when changing the cycle time in the simulation. A simulation was run with a run-time of 4500 min for each of the values of the cycle time. There was only one change made in each simulation to pinpoint the impact on the consecutive functions. In
Table 2, we can see that with decreasing cycle times in the saw machine to 4 and 3, busy % decreased to 4.27 % and 3.2 %, the number of operations increased to 48 and block % increased to 94.1 % and 95.64 % for the saw machine. When the cycle time decreased to 4 and 3, the coating machine was affected, with a decrease in idle % to 2.79 % and 2.37 %, an increase in busy % to 41.33 % and 41.94 %, an increase in the number of operations to 31, a block % of 55.43 % and 55.24 % and a total process output of 146 and 145. The data for increasing and decreasing cycle times for both the saw and coating machines and their consequent output are stored in
Table 2. The interdependencies between the saw and coating machines for changing cycle times of the saw machine are described in
Table 3 and
Table 4 and in Equations (5) and (6).
For decreases in the cycle time of the saw machine, the resulting output was as follows for both the saw and coating machines.
This resulted in an interdependency equation, as follows:
Figure 15 shows the effect on both the saw and coating machines for decreases in the cycle time of the saw machine. The changes had similar effects on the number of operations and block %. With a cycle time decrease, both block % and Nop increased. Therefore, it could be determined that decreases in the cycle time of the saw machine would have common interdependencies with the number of operations and block percentage.
Table 2 shows that increases in the cycle time of the saw machine affected both the saw and the coating machine. For a cycle time of 12 and 8, the saw machine’s busy % increased to 12.27 % and 8.18 %, the number of operations remained the same, and block % decreased to 83.72 % and 89.62 %. The coating machine was affected, with a decrease in busy % to 39.67 % and 40 %, the number of operations at 29 and 30 and block % at 53.47 % and 54.22 %, while total output decreased to 139 and 136. Similar simulations were run for decreasing and increasing cycle times of the coating machine, and the consequent values are stored in
Table 2. The resulting output for the coating machine is described in
Table 5 and
Table 6 and in Equations (7) and (8).
For increasing the cycle time of the saw machine, the output was as follows.
This resulted in an interdependency equation as follows:
4.5.2. Measuring Interdependency for the Coating Machine
To measure the interdependency of the coating machine relative to the saw machine, it was crucial to analyze the effect of increasing/decreasing cycle times of the coating machine. This effect is shown in
Table 5.
This resulted in an interdependency equation for the coating and saw machine as follows:
For decreases in the cycle time of the coating machine, the consequent output is shown in
Table 6.
This resulted in an interdependency equation as follows:
To increase the efficiency of the process, it was required to decrease the block % of the saw machine. In
Section 4.5 and
Figure 13, the optimized output was 421 [
10]. The optimization was done based on process identification through data and through finding the bottleneck. In the proposed approach, the optimization was done considering both the bottleneck and the interdependency.
Figure 15 and
Table 3,
Table 4,
Table 5 and
Table 6 show the interdependency between the saw and coating machines (number of operations and block %).
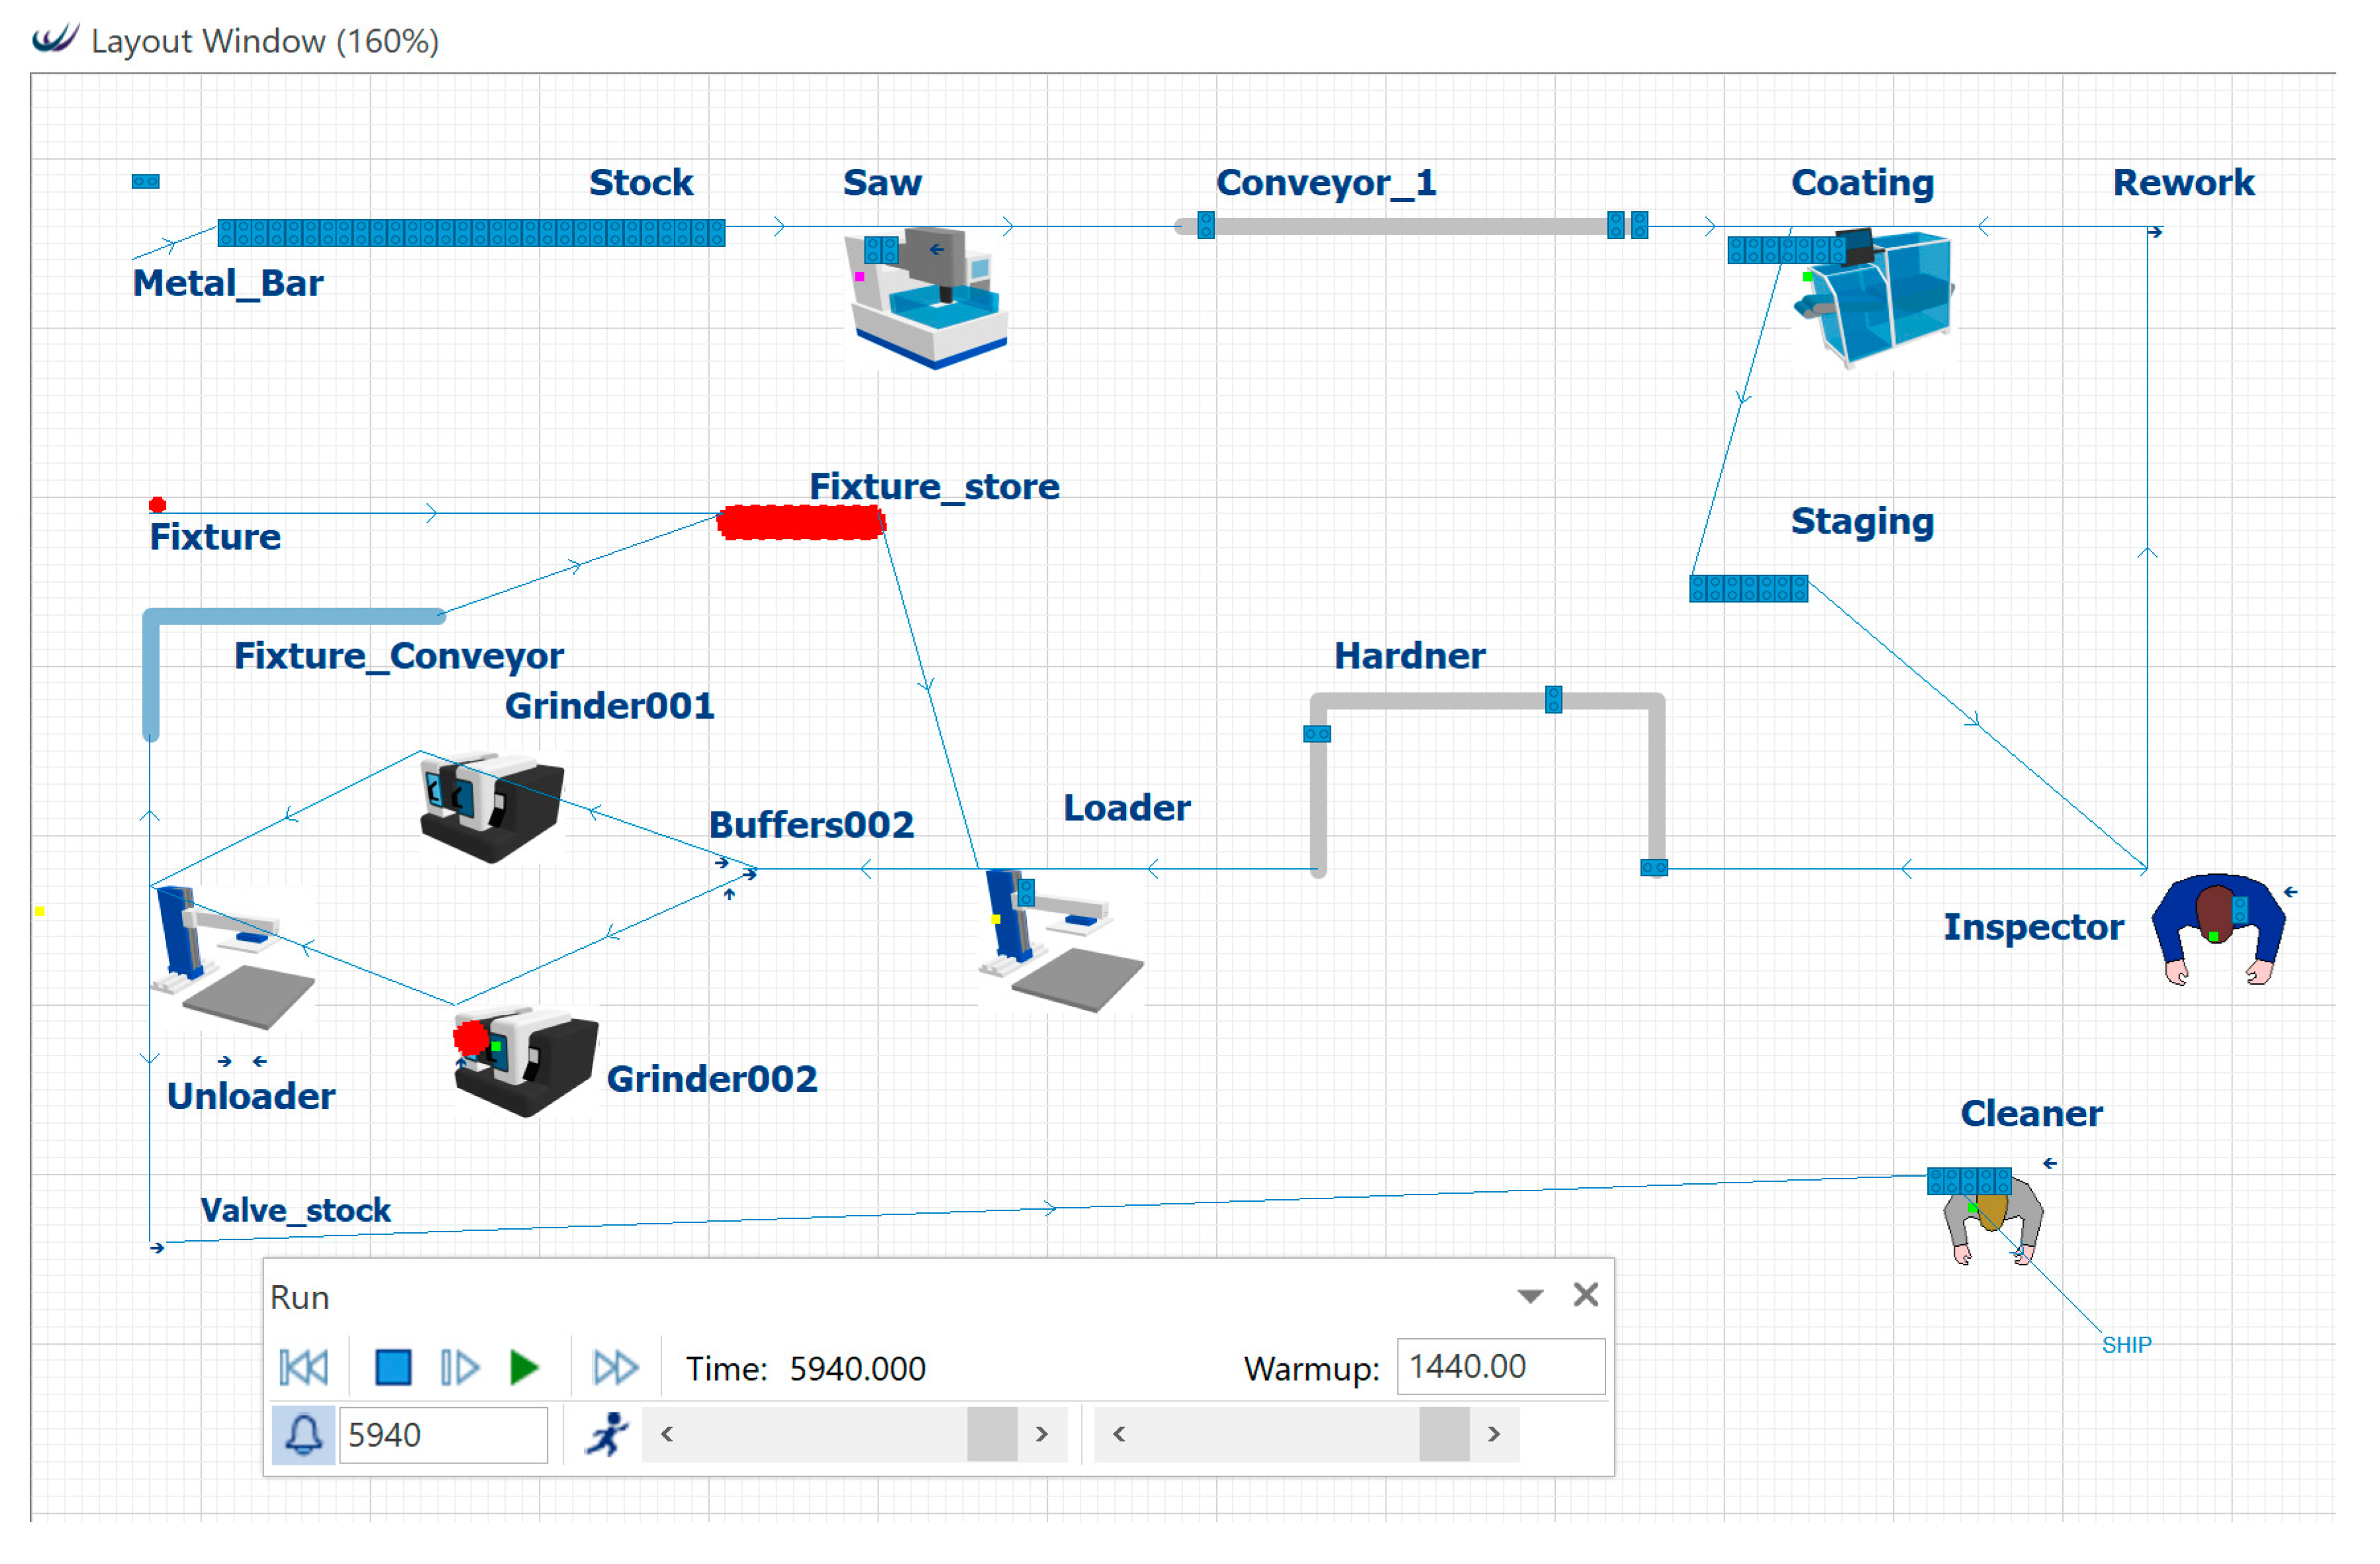
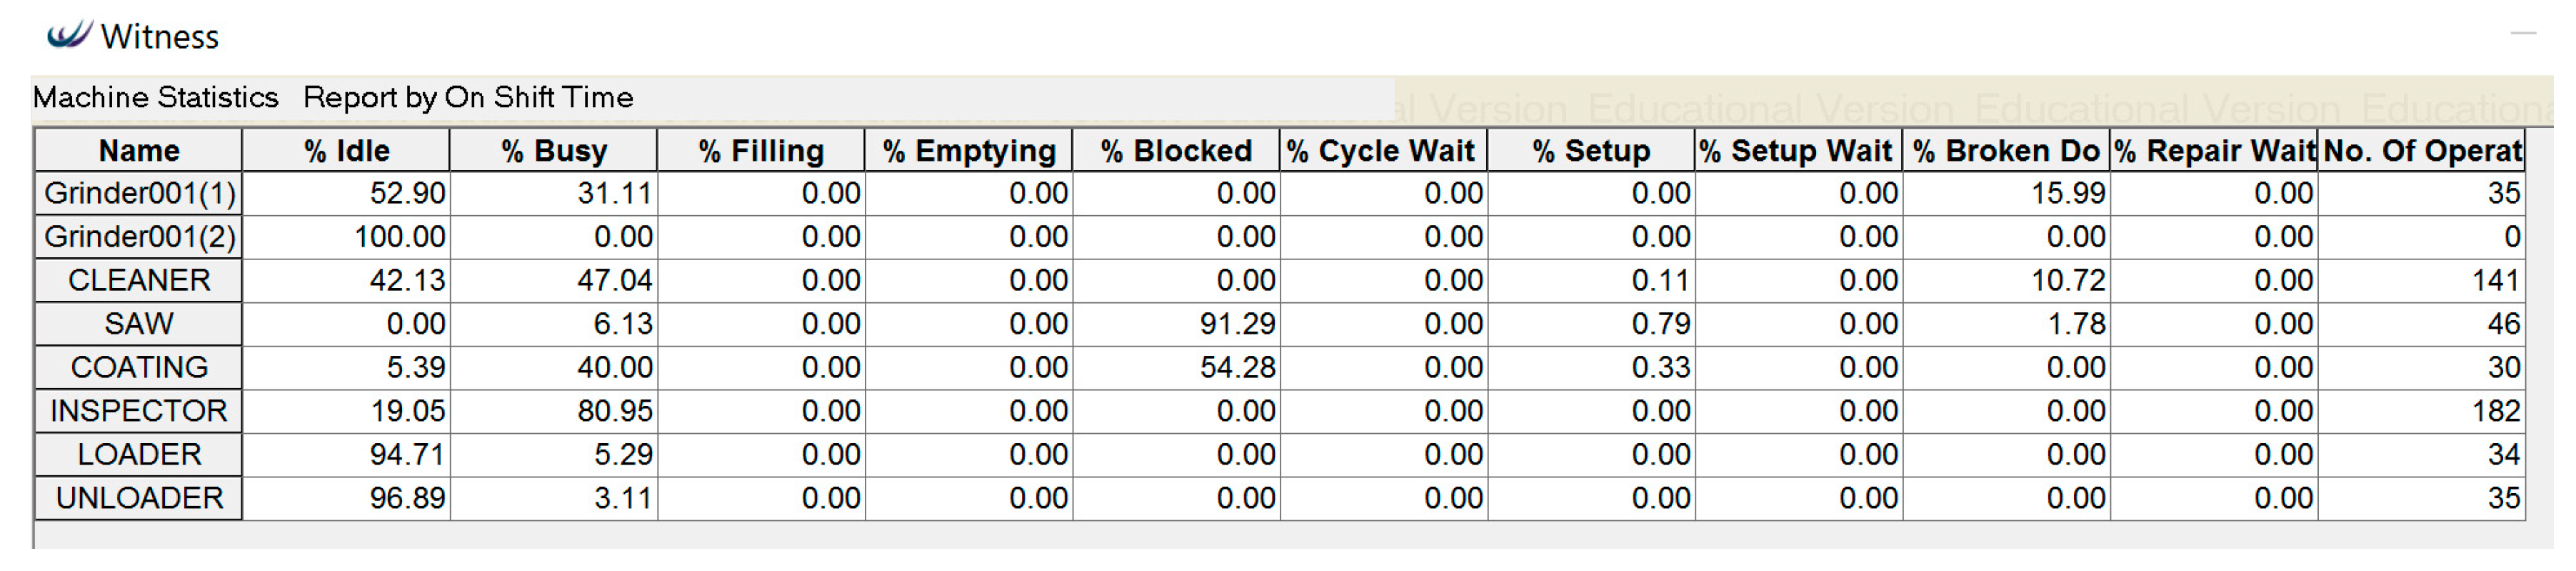
Figure 10 shows simulation data on the existing process. In the existing process, the coating machine had a much higher cycle time compared to the saw machine. The interdependency showed that bringing any change to the cycle time of the coating machine affected the block % and number of operations.
Figure 10 shows that the block % of the saw machine was 91.29% and that the coating machine was at 54.28%. To increase the efficiency according to the interdependency, we needed to decrease the block %.
The blockage that was created on the saw machine was because of the capacity of the coating machine. As the coating machine had a higher cycle time, it could not process the same amount of parts produced by the saw machine. The valve manufacturing process has sequential interdependence, where the output of one unit is being used as the input for the following unit. Because of the differences in the number of operations performed by both machines, the saw machine would stop working after a certain number of operations when the difference between the number of operations exceeded the stocking capacity of the conveyor. To avoid this problem, a stock buffer was added to reduce that blockage between the saw and coating machines. Incorporating these aspects, the output increased to 504 compared to 421 (as calculated in our previous work [
10]) with the same budget. The values used to optimize the model are described in
Table 7. The bottleneck of the process was the inspection area, which was balanced using extra inspectors and cost the biggest amount. This showed an increase of approximately 20% in output by using the KHB methodology. It should be noted that only two machines (the saw and coating machines) were analyzed through the newly proposed method, and further analysis could lead to even higher output.
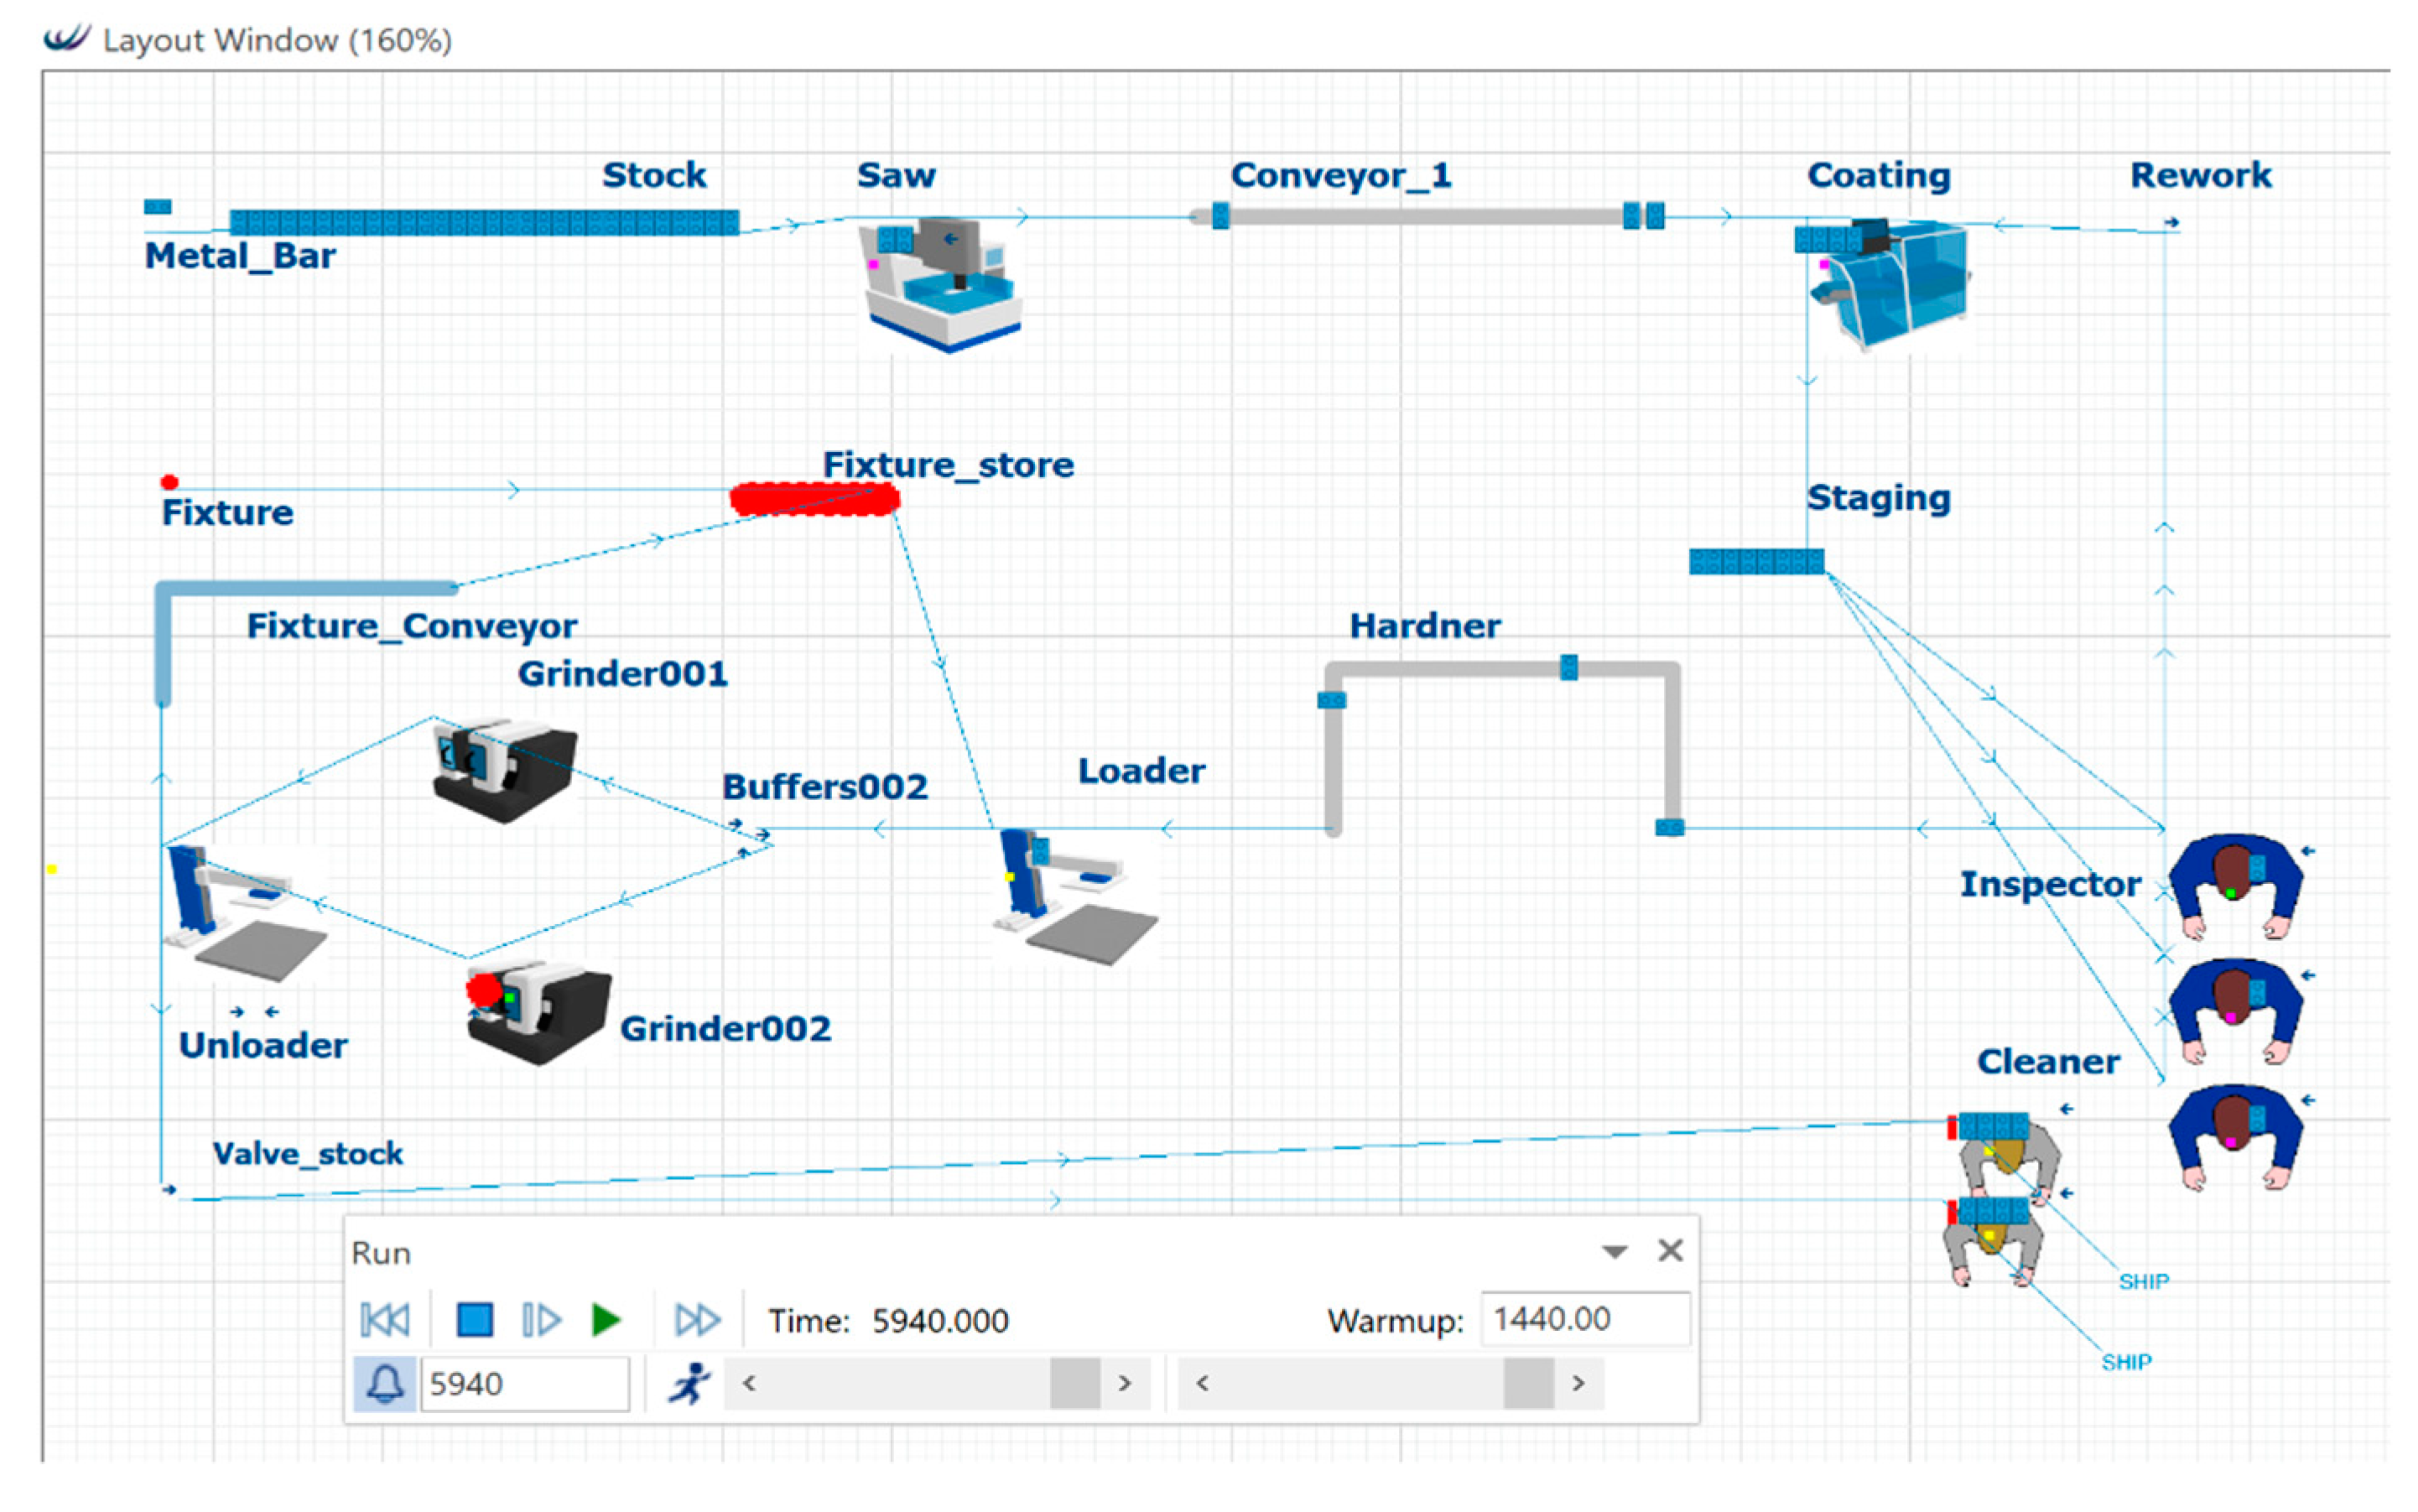
The optimized simulation model and data based on the interdependency are shown in
Figure 16 and
Figure 17, respectively. This result was 20% higher than our previous optimization based on DDPR [
10].
The cycle time and batch size of the coating machine were compensated for and were changed to 47.5 and 7 to balance the interdependency between the saw and coating machines, which included the block % and number of operations.
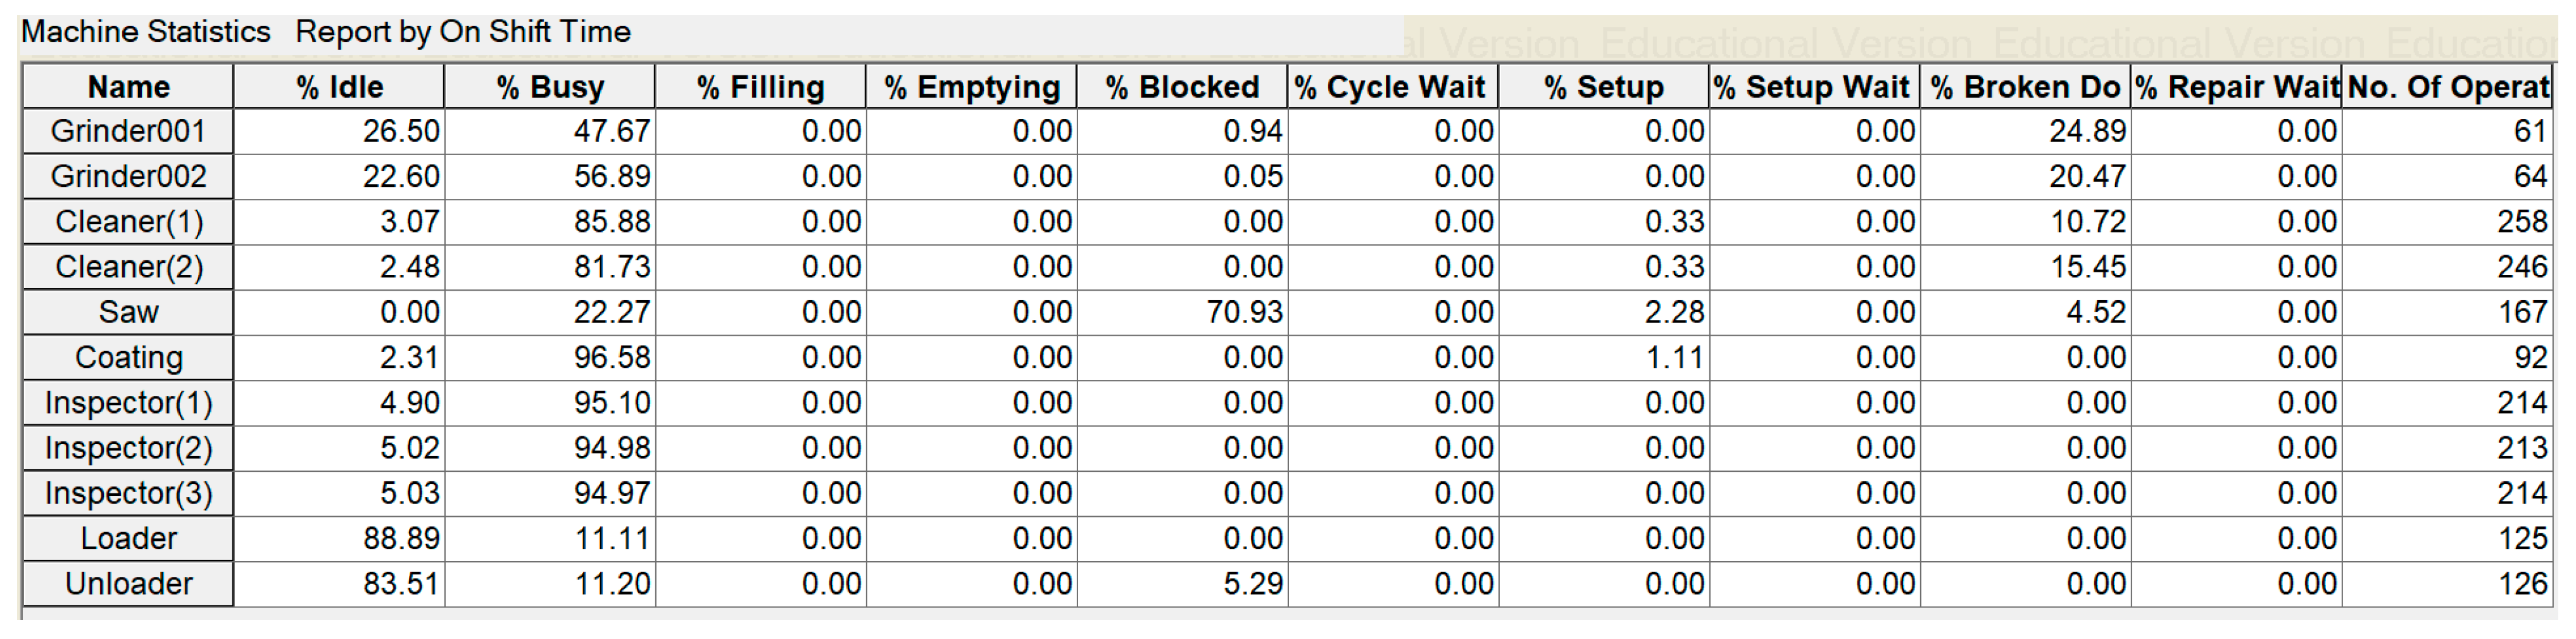
Figure 18 shows that the block % of the saw and coating machines was reduced to 70.93% and 0.00% from 91.29% and 54.28% in the existing process (see
Figure 10). The number of operations went up to 167 and 92 from 46 and 30.
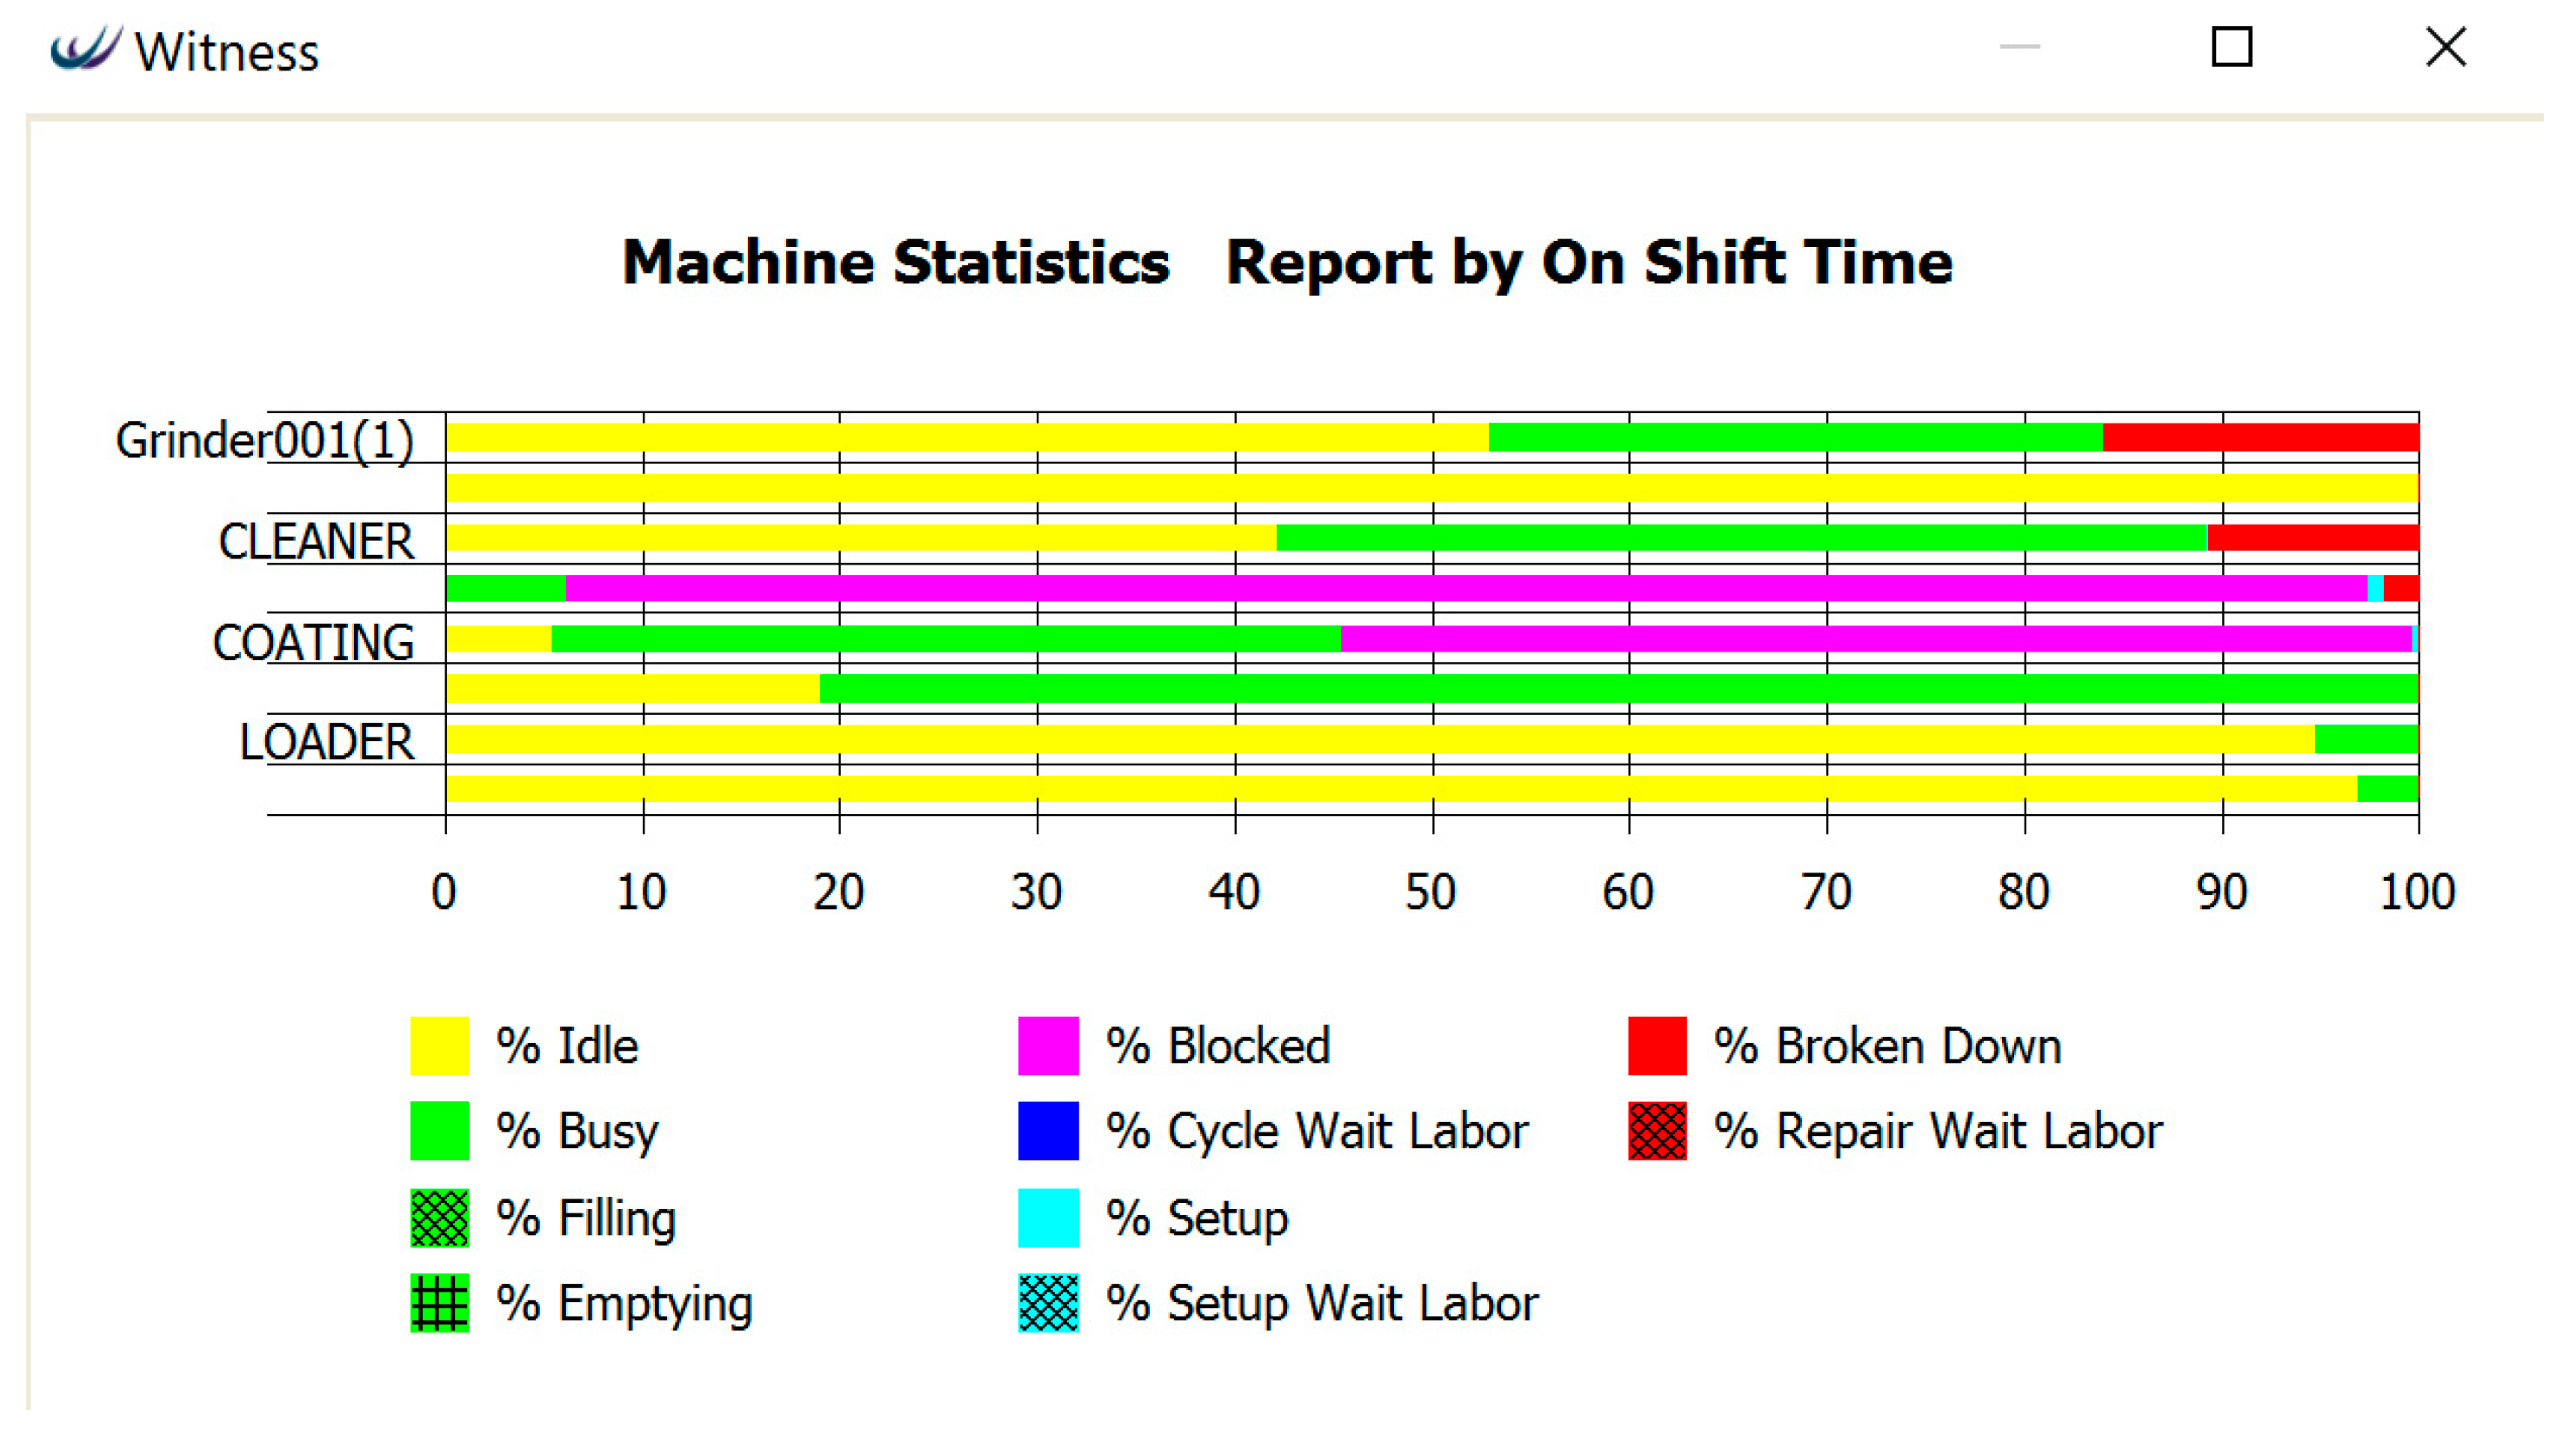
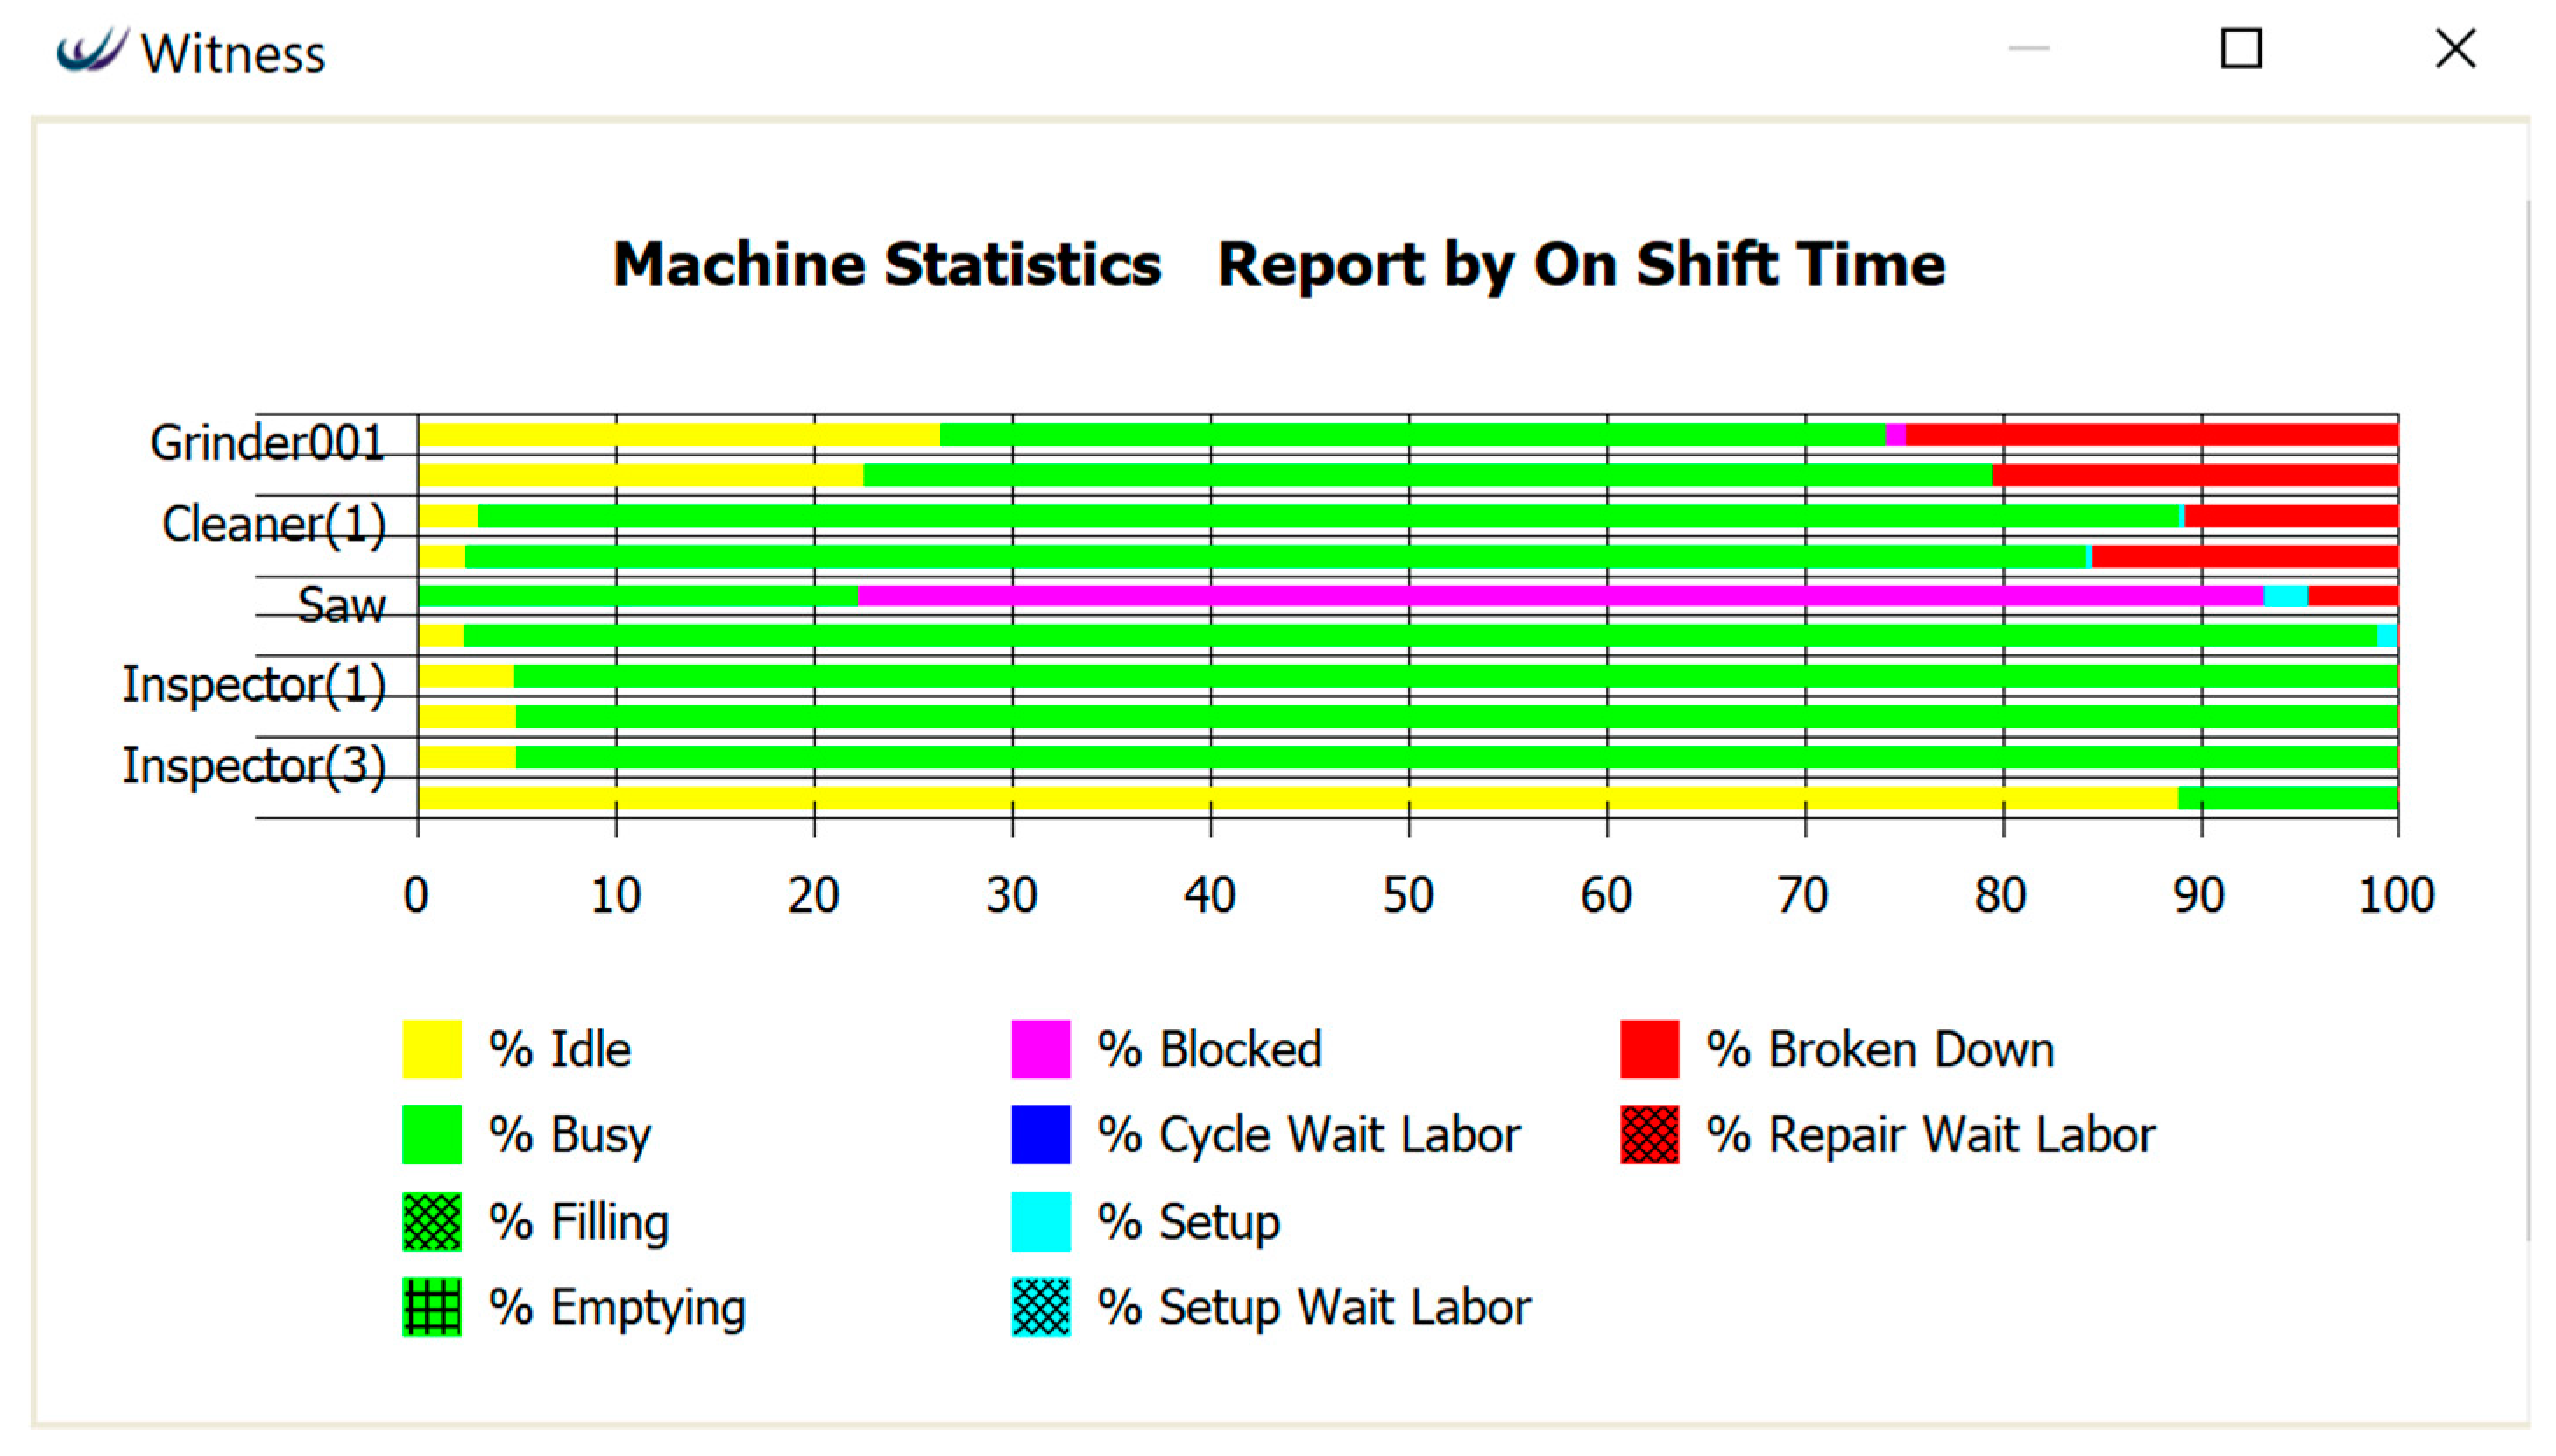
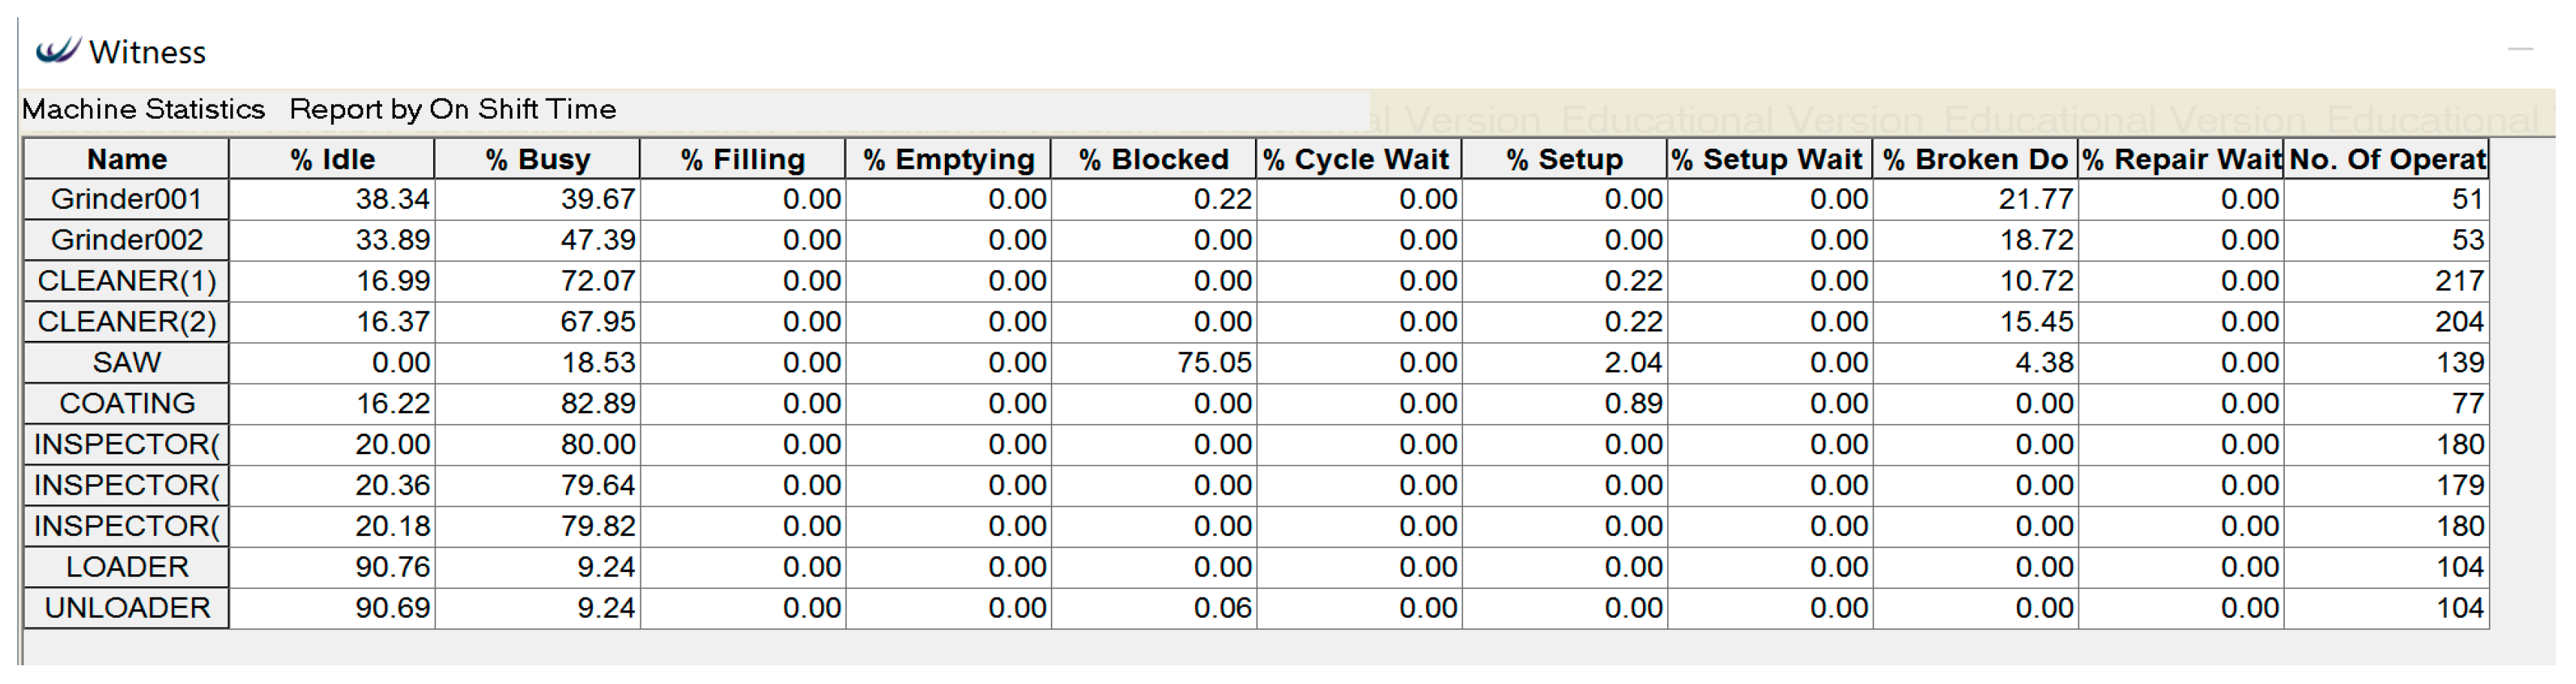
Figure 19 represents the machine statistics in terms of shift times of the optimized model. It shows that the saw machine had the highest amount of block %, although it was reduced almost by 22% from the existing process. The block % could be further reduced by decreasing the cycle time of the coating machine or by increasing the stock capability of the saw area.
Figure 17 shows that the optimized cycle time for the coating machine was 47.5, while the data from the saw machine and the coating machine were considered. It took a certain amount of resources to reduce the cycle time from 60 to 47.5 and provide a maximum output of 504. The production of the coating machine depended on the production of the saw machine. Two different scenarios were considered based on process identification:
The production of the coating machine was affected if the output was not equivalent to the production of the saw machine, as the sawed bar had to wait on the conveyor and the saw machine would be blocked until the coating machine completed the coating of a similar number of bars. Considering the bottleneck and the existing model, the simulation showed the coating and the inspector had the highest busy percentage. However, because of the relationship between the saw machine and the coating machine after a certain number of operations, the bars queued between the saw and the coating machine. If the cycle time of the coating machine was decreased or the batch size was increased, this problem could be solved up to a certain time. However, if the opposite happened (for example, if the number of operations of the saw machine was less than the coating machine), it would not be efficient to increase or decrease the cycle time, as it would not add any extra value to the output. Considering both scenarios, we needed to compensate for the cycle time between the saw machine and coating machine and added an extra buffer in between the conveyor and the saw machine to eliminate the interdependencies to decrease the block %. The CEA considered the effects of the changes made to the cycle time or batch size and set up a bridge between the two steps. Therefore, if the total output of the saw machine N(P) ≥ the total number of outputs of the coating machine N(Q) or vice versa, the output from P would wait in the buffer, which decreased the blockage from the saw machine. A similar output could be achieved by decreasing the cycle time on the coating machine by 20% and increasing the batch size from 6 to 7. In that case, the inspection area was affected, which increased the production costs. In this manufacturing process, adding substeps between the saw machine and the conveyor increased the efficiency of the process and reduced the implementation cost by about 15%. This clearly showed the effectiveness of the KHB method in optimizing a process.

 ,
, 


