Determining Simulation Parameters of Prototype Door Hinge for Correlation between Simulation and Experimental Results in United Nations Economic Commission for Europe Regulation No: 11 Tests

Abstract
:1. Introduction
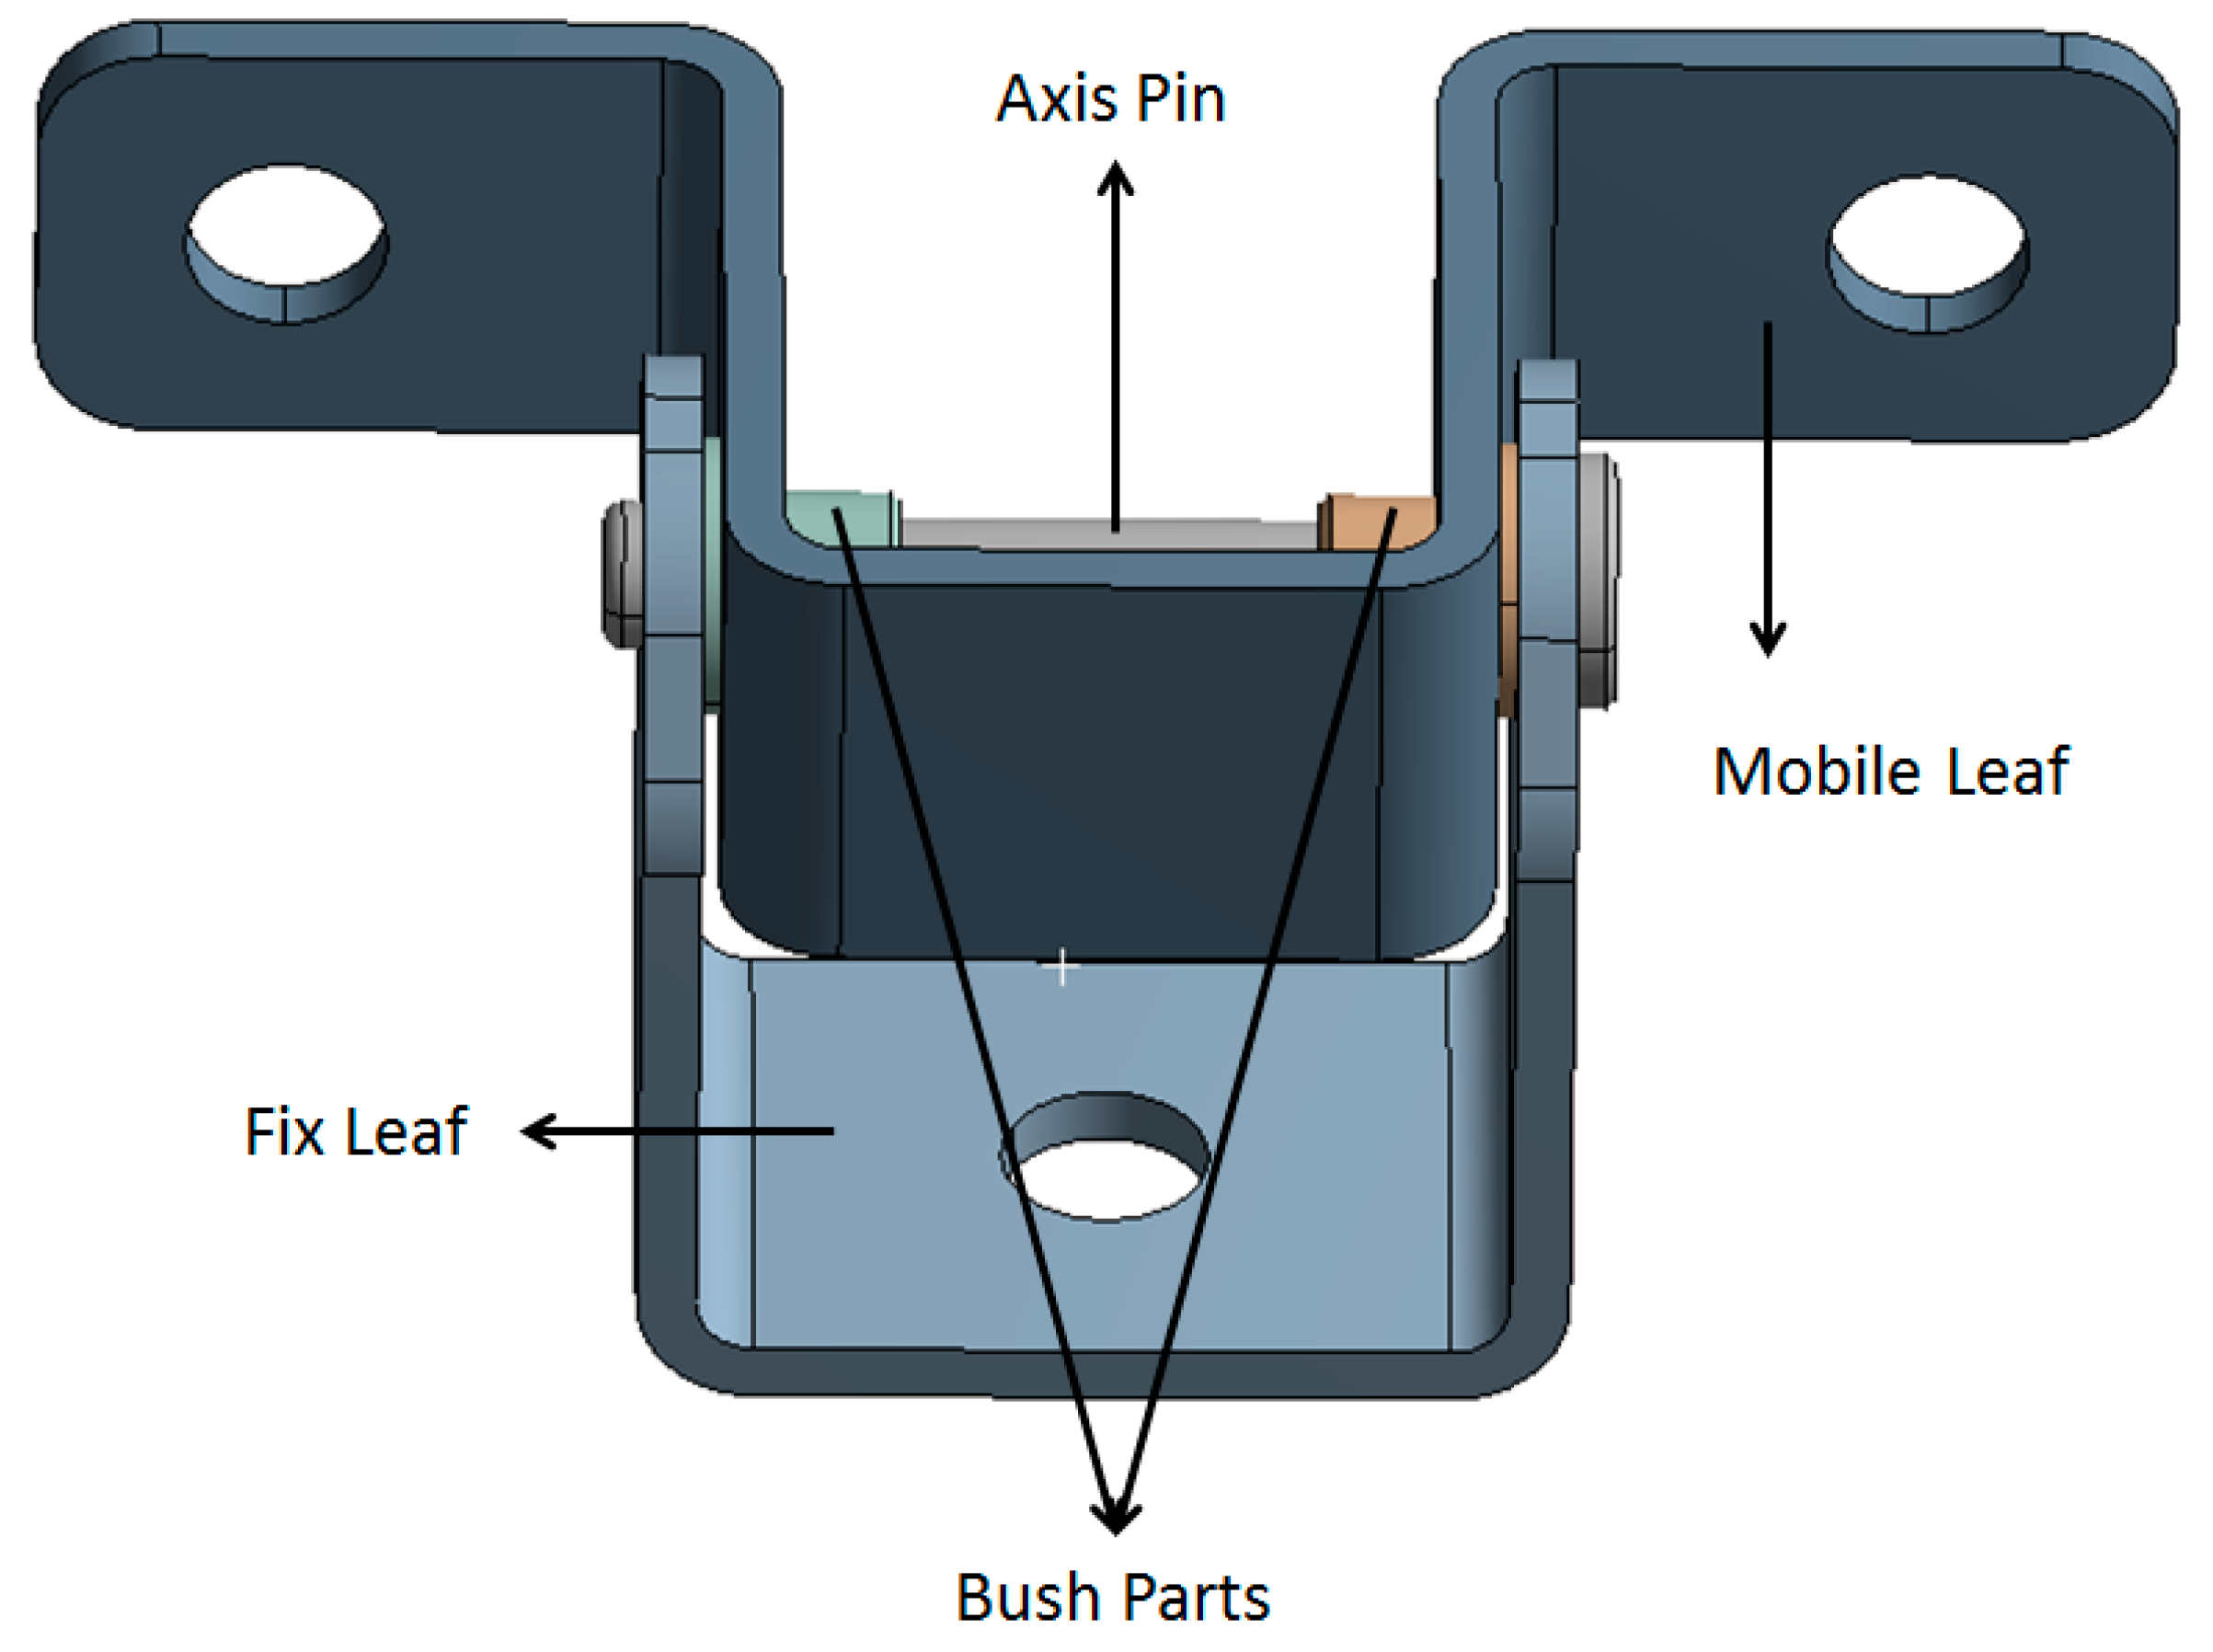
1.1. Commercial Door Hinge
1.2. United Nations Economic Commission for Europe (UNECE R11)
1.2.1. Aim and Scope of Regulation
1.2.2. Regulation Procedure and Acceptance Criteria
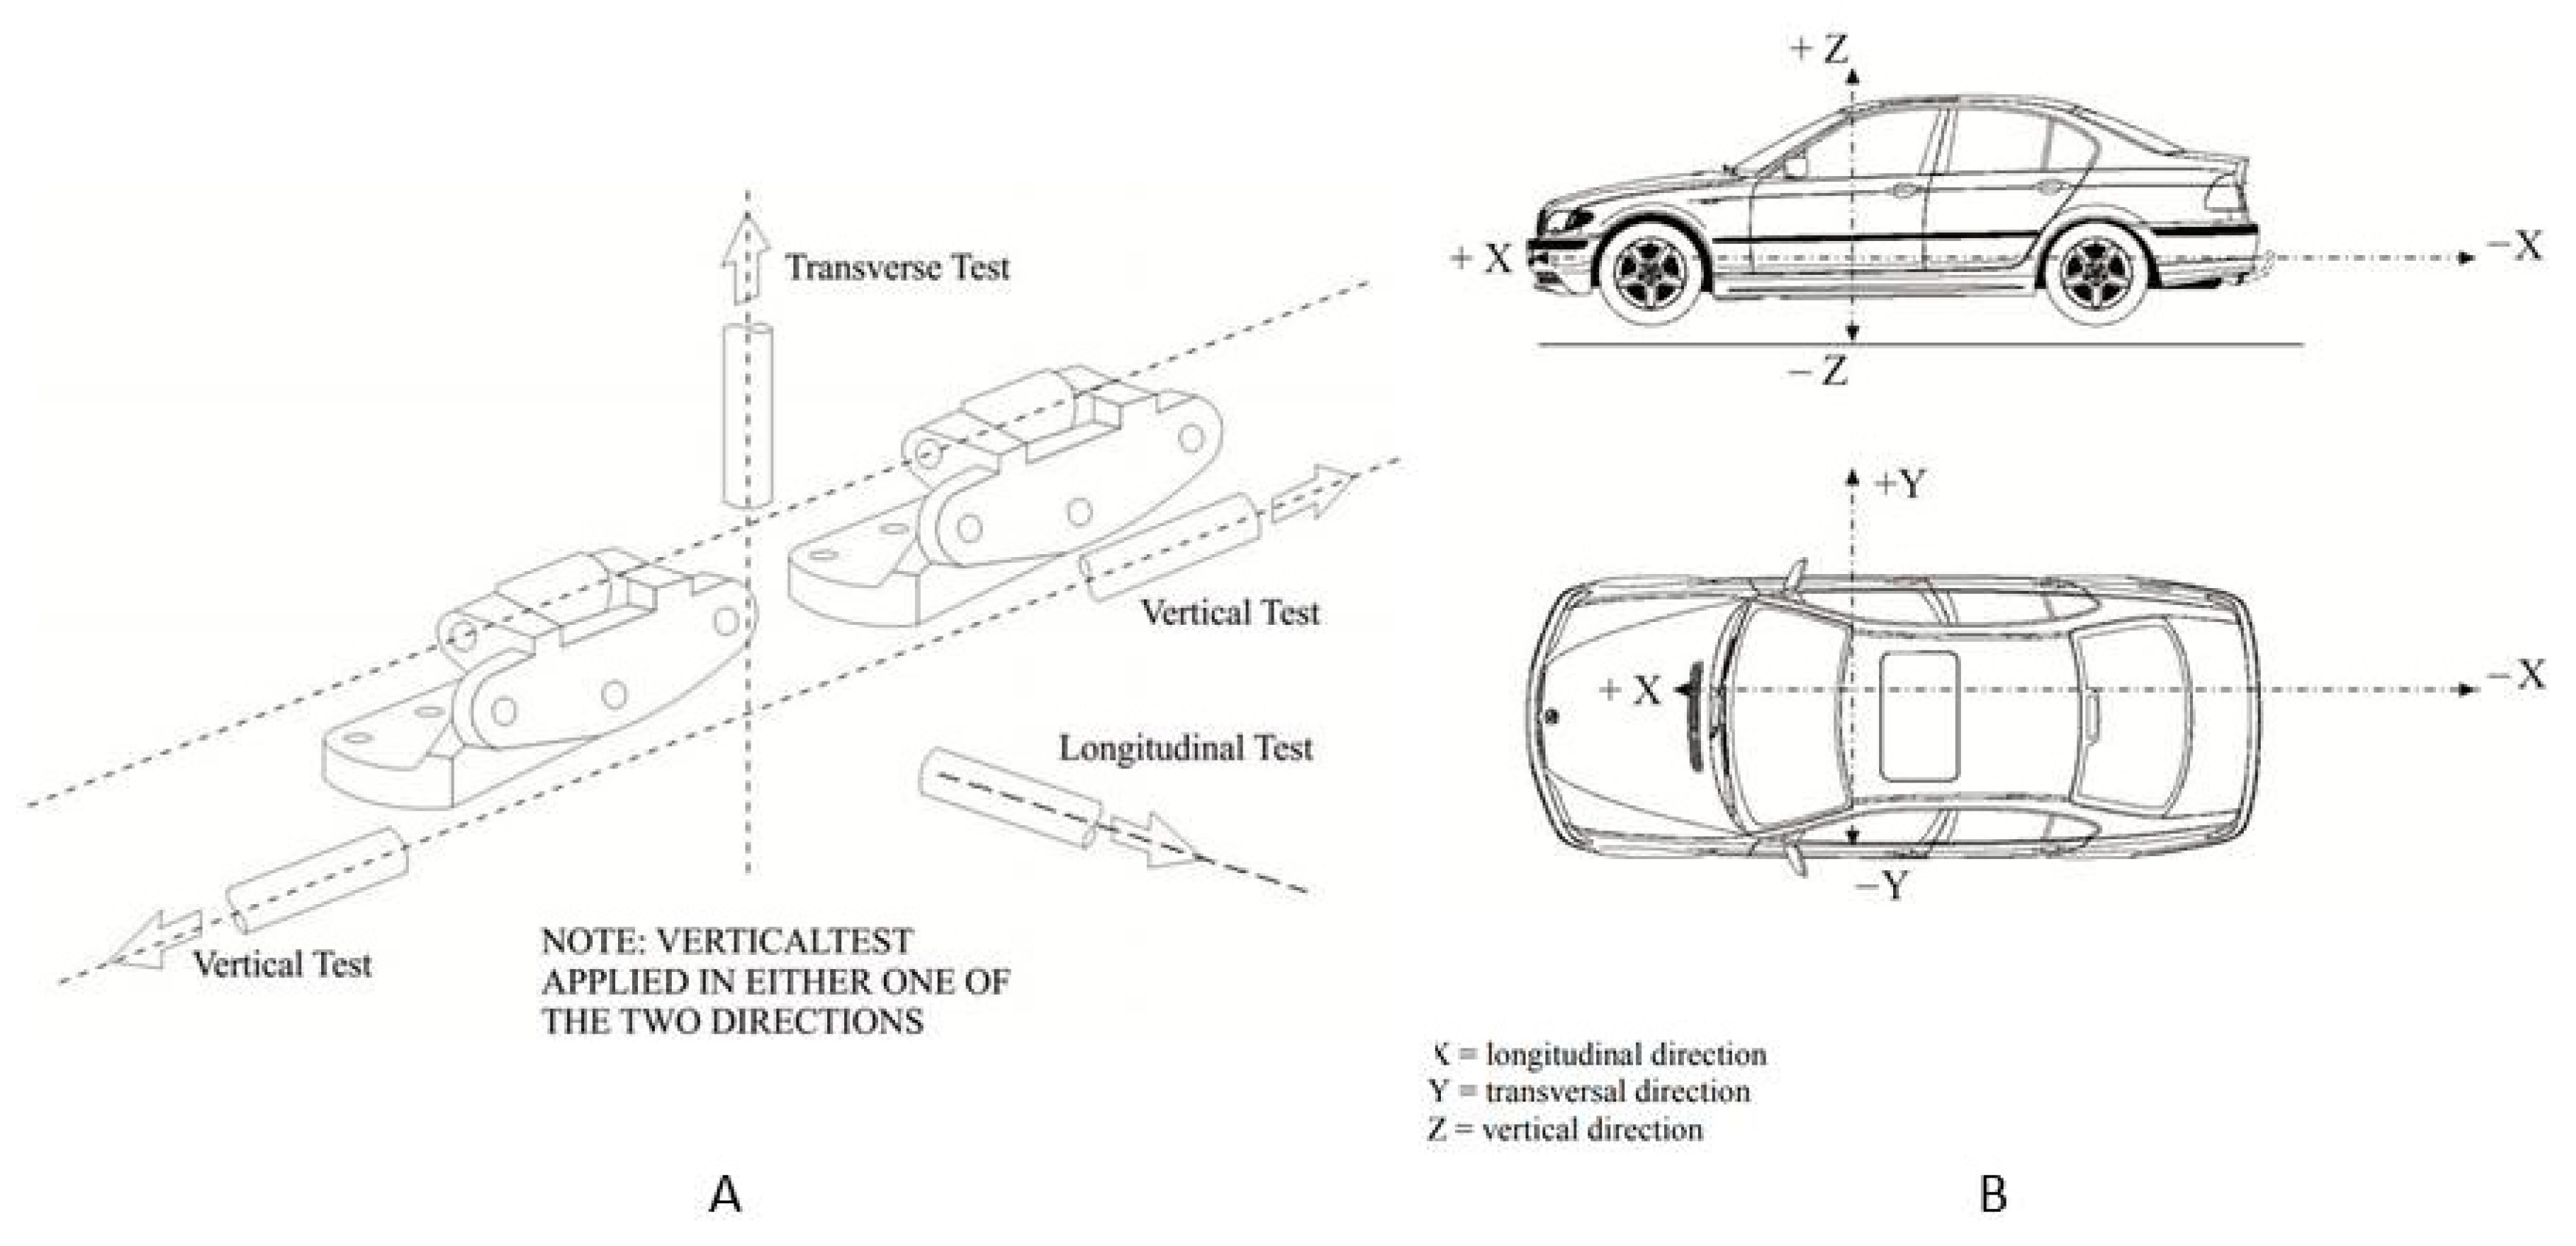
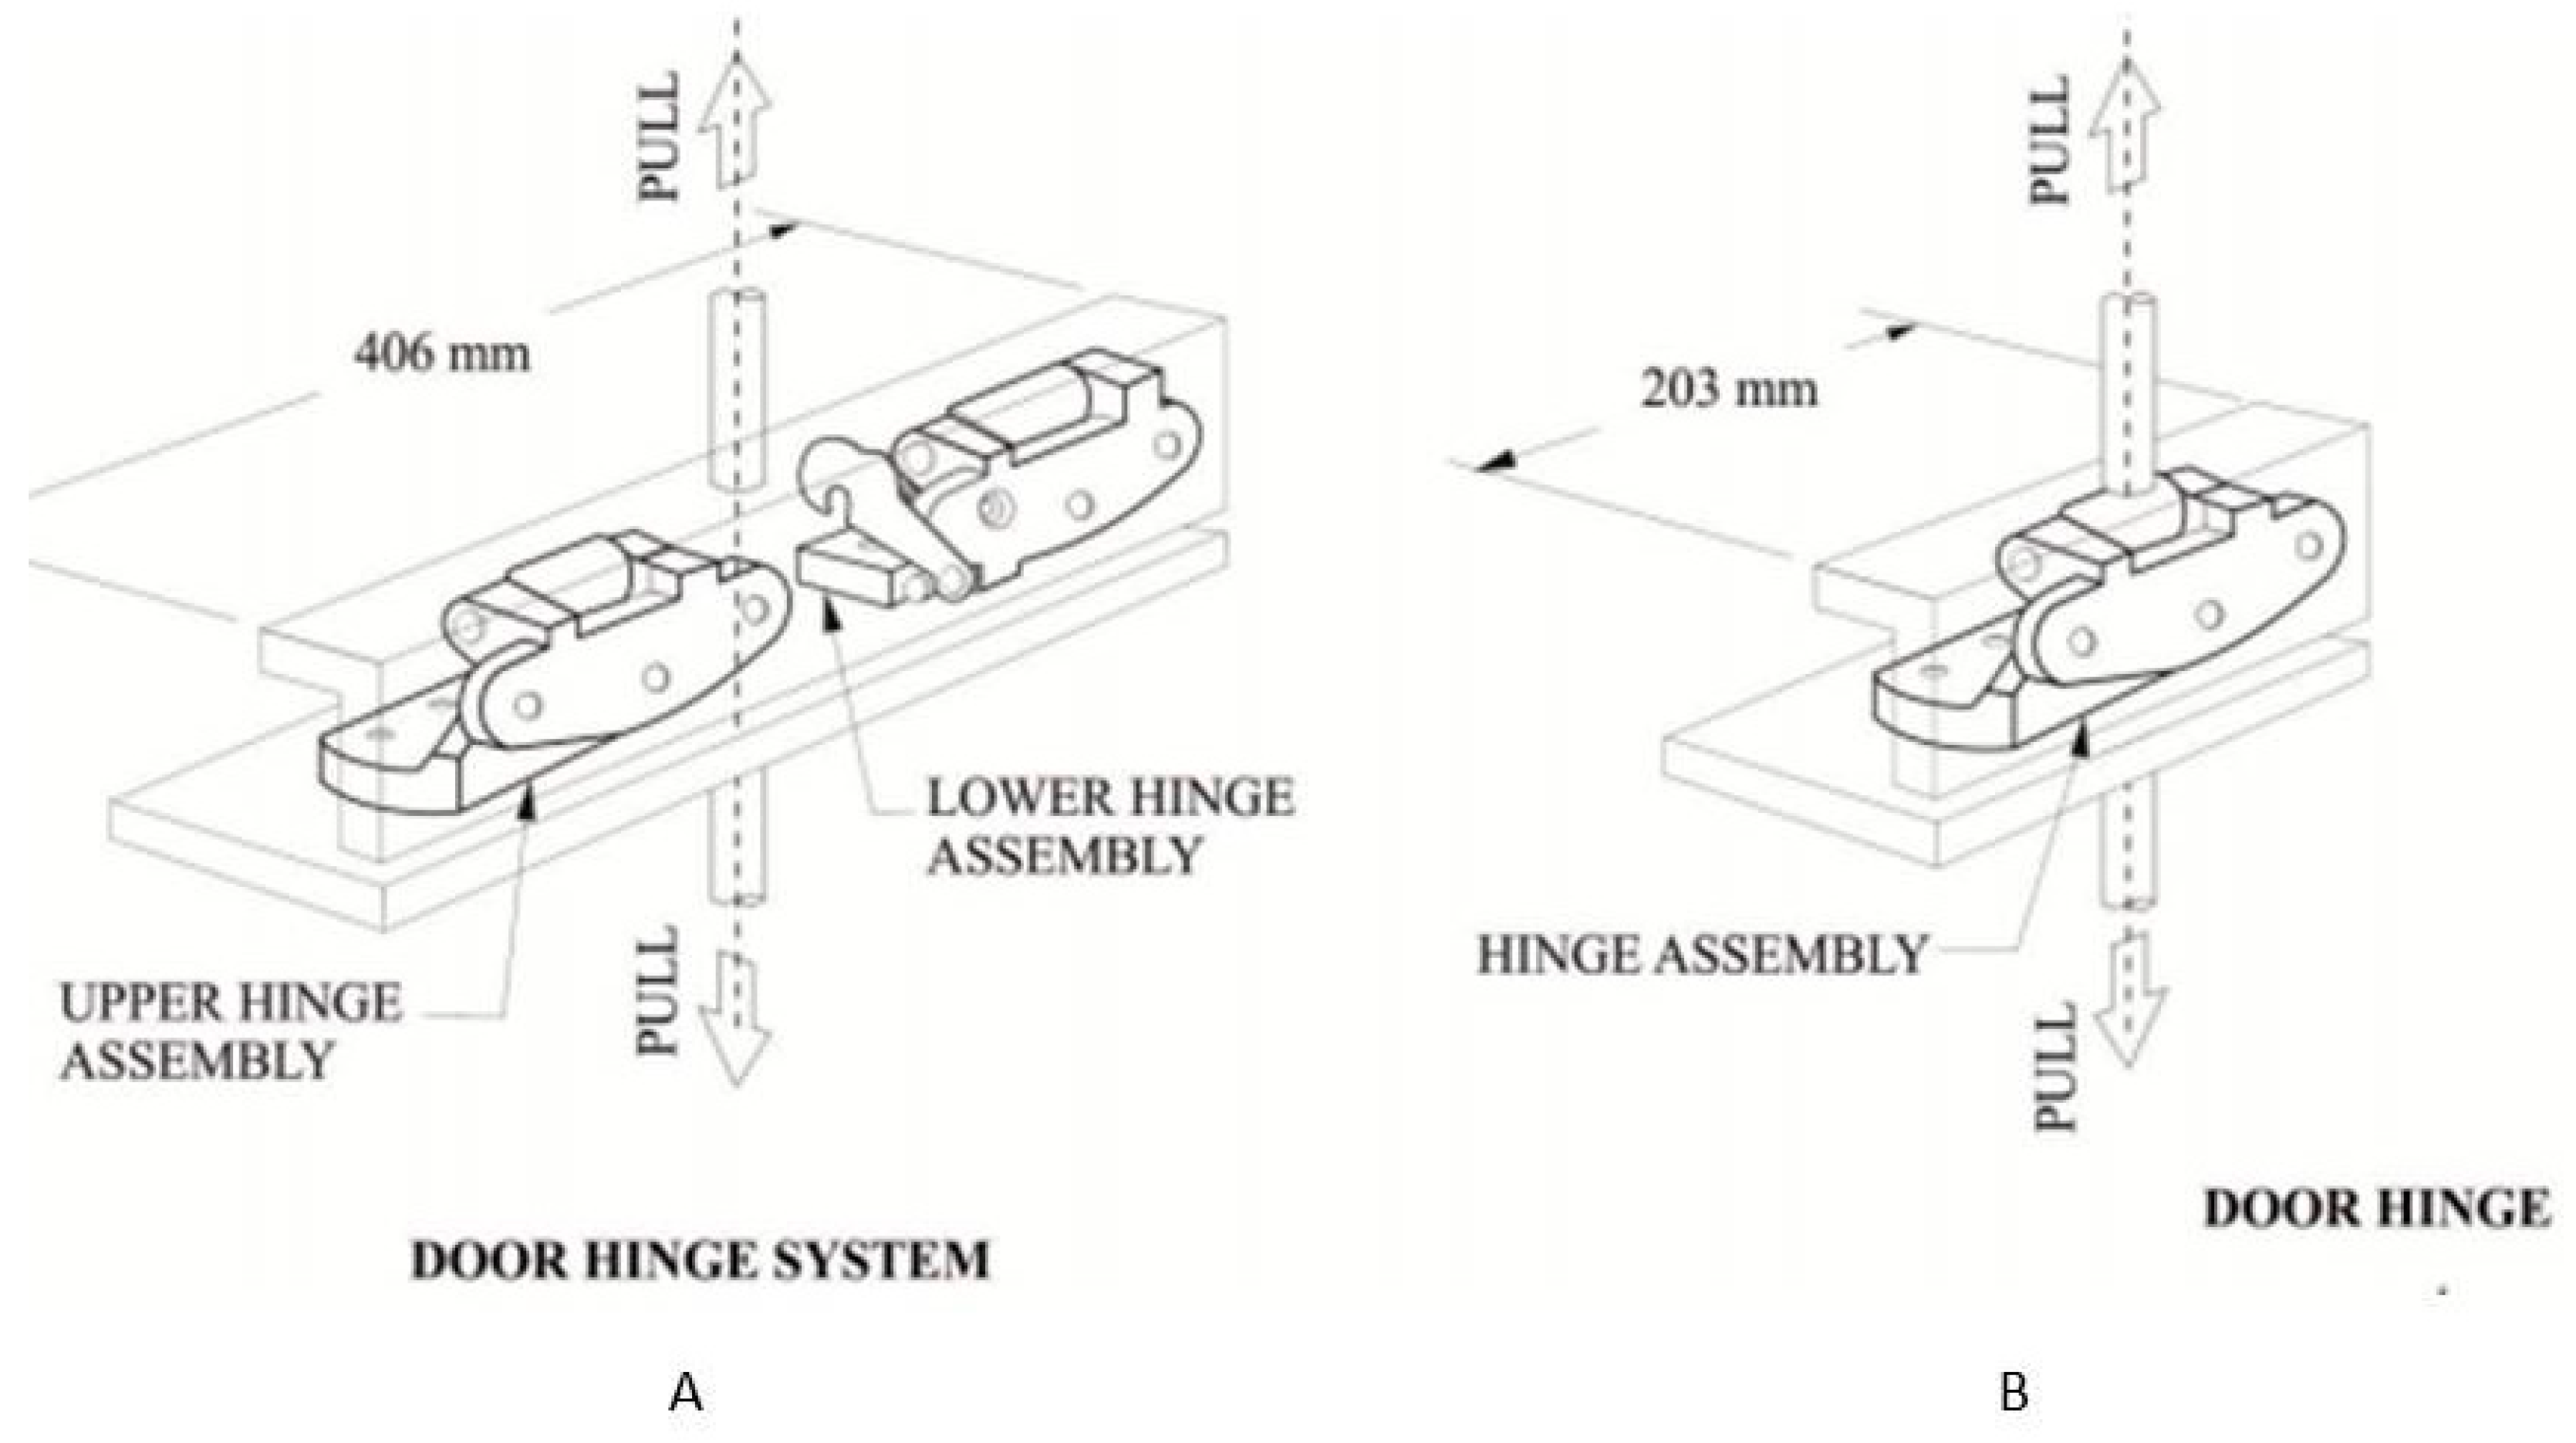
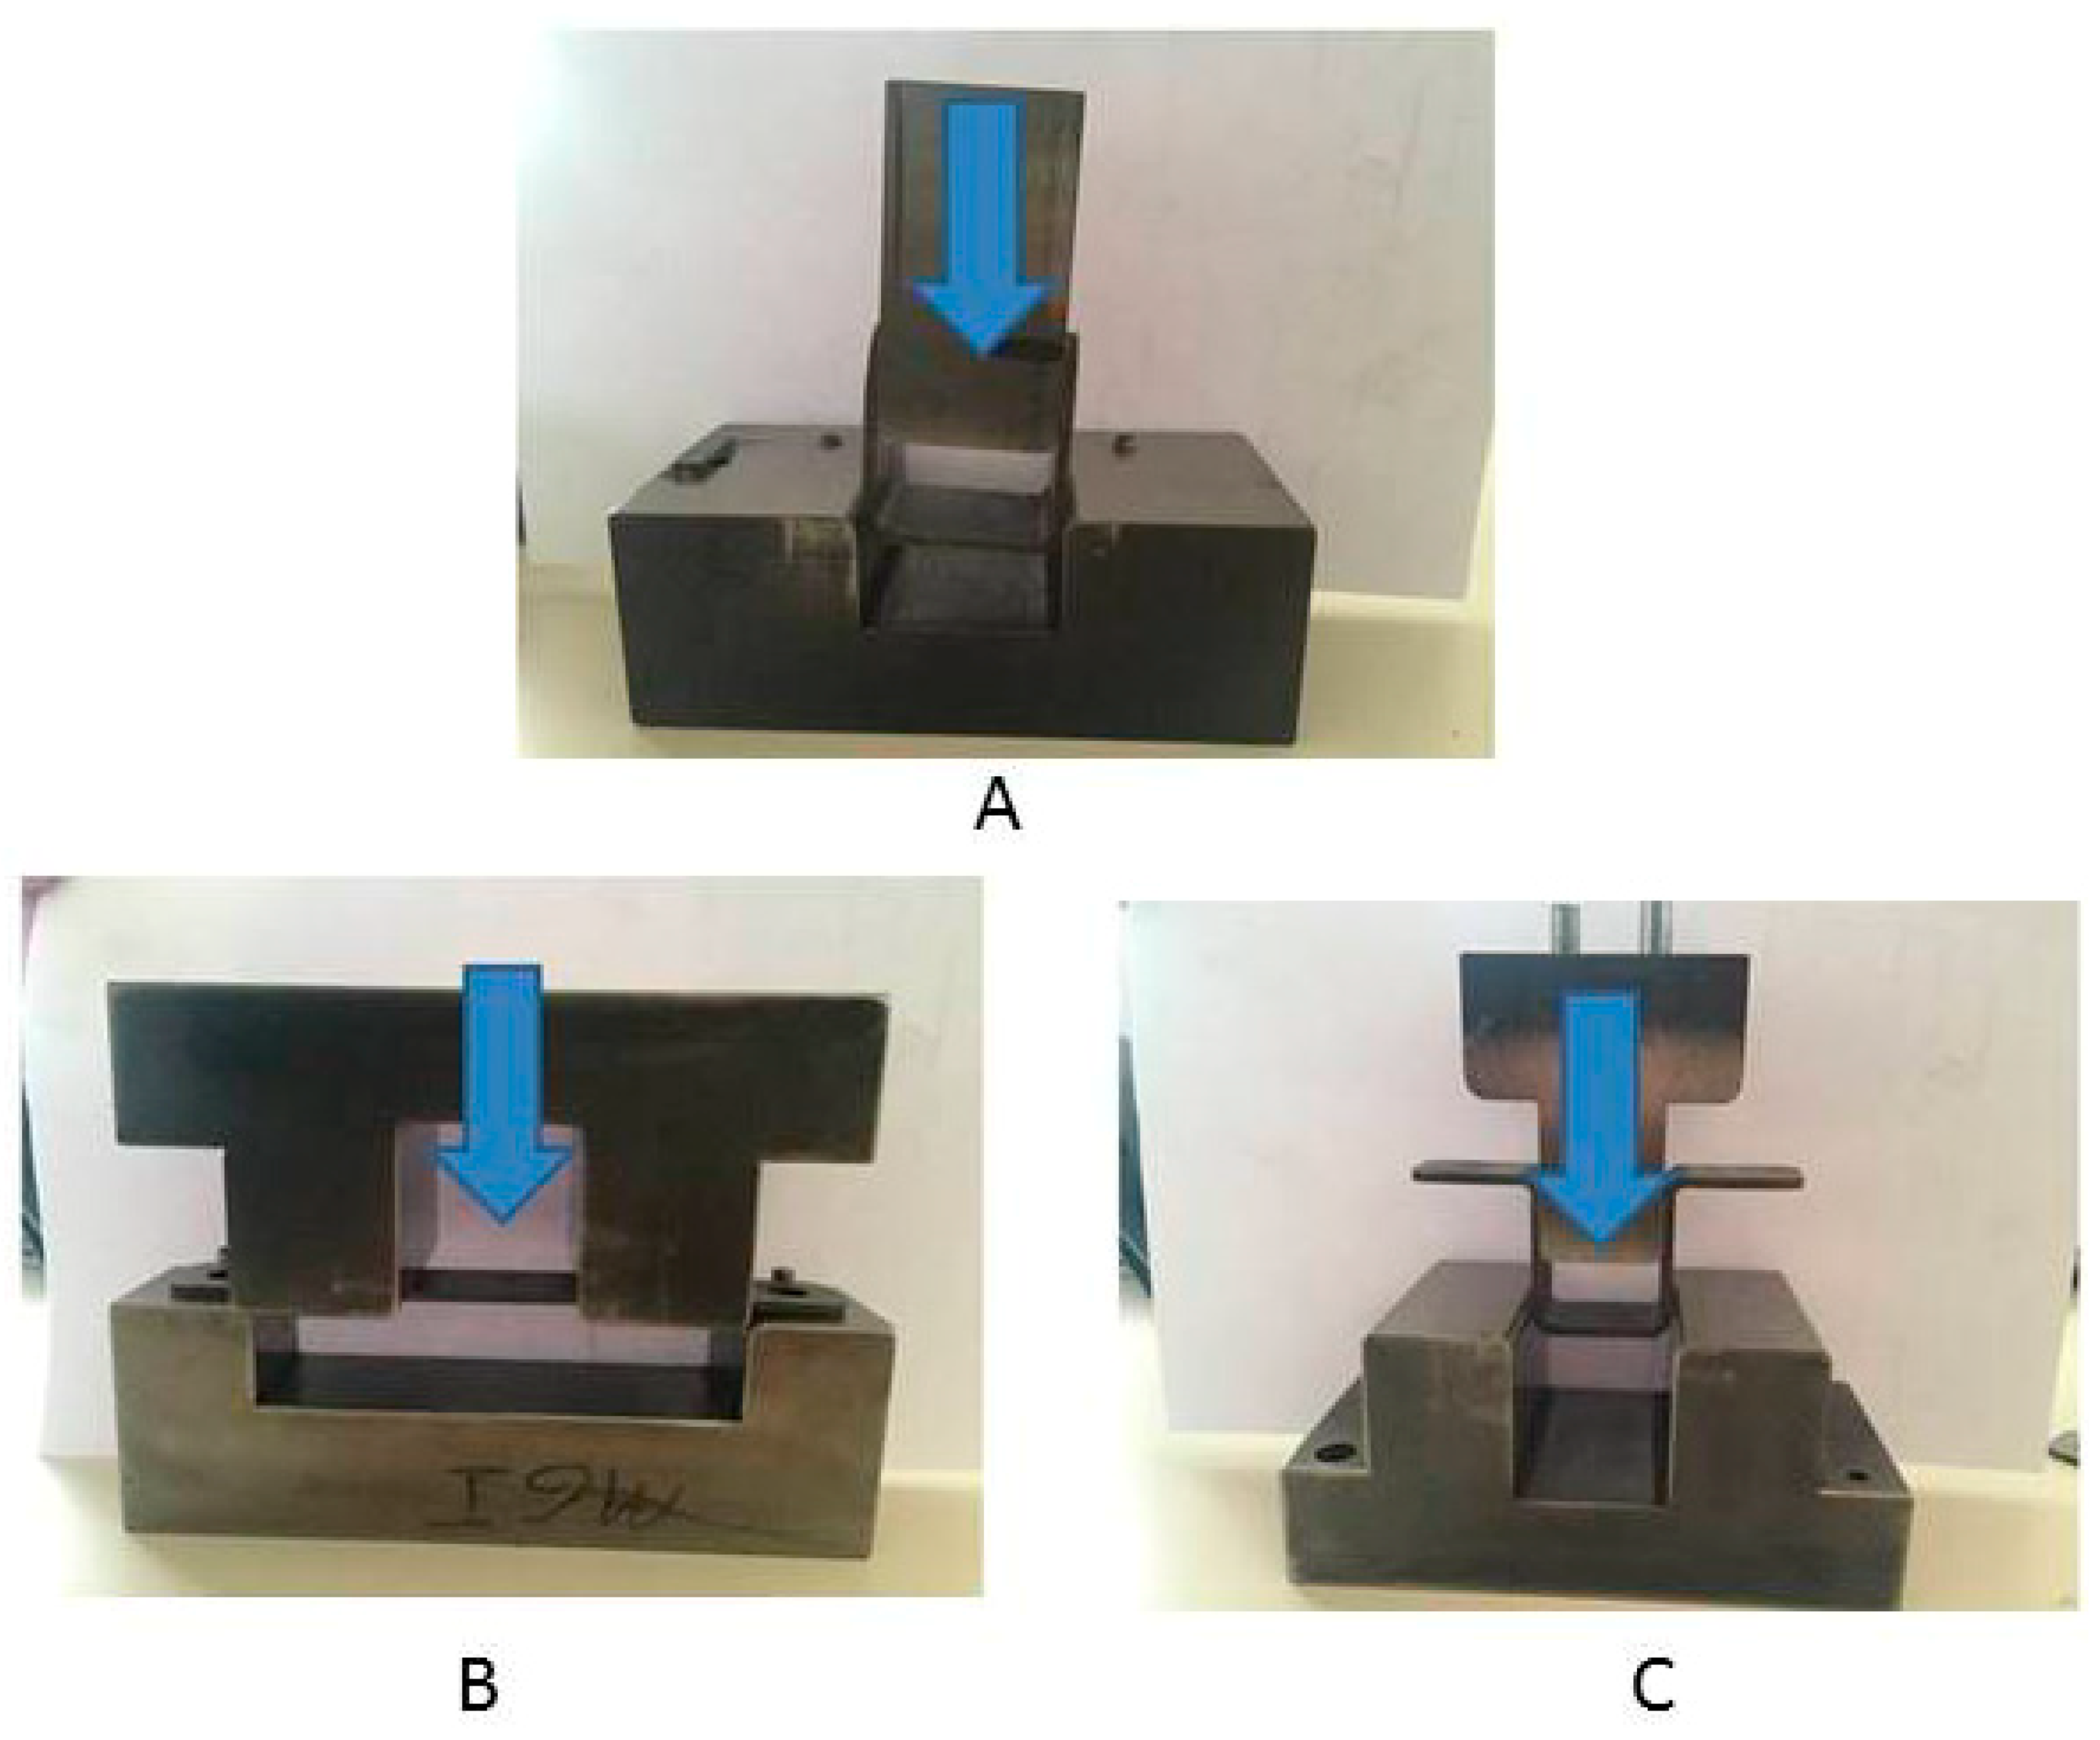
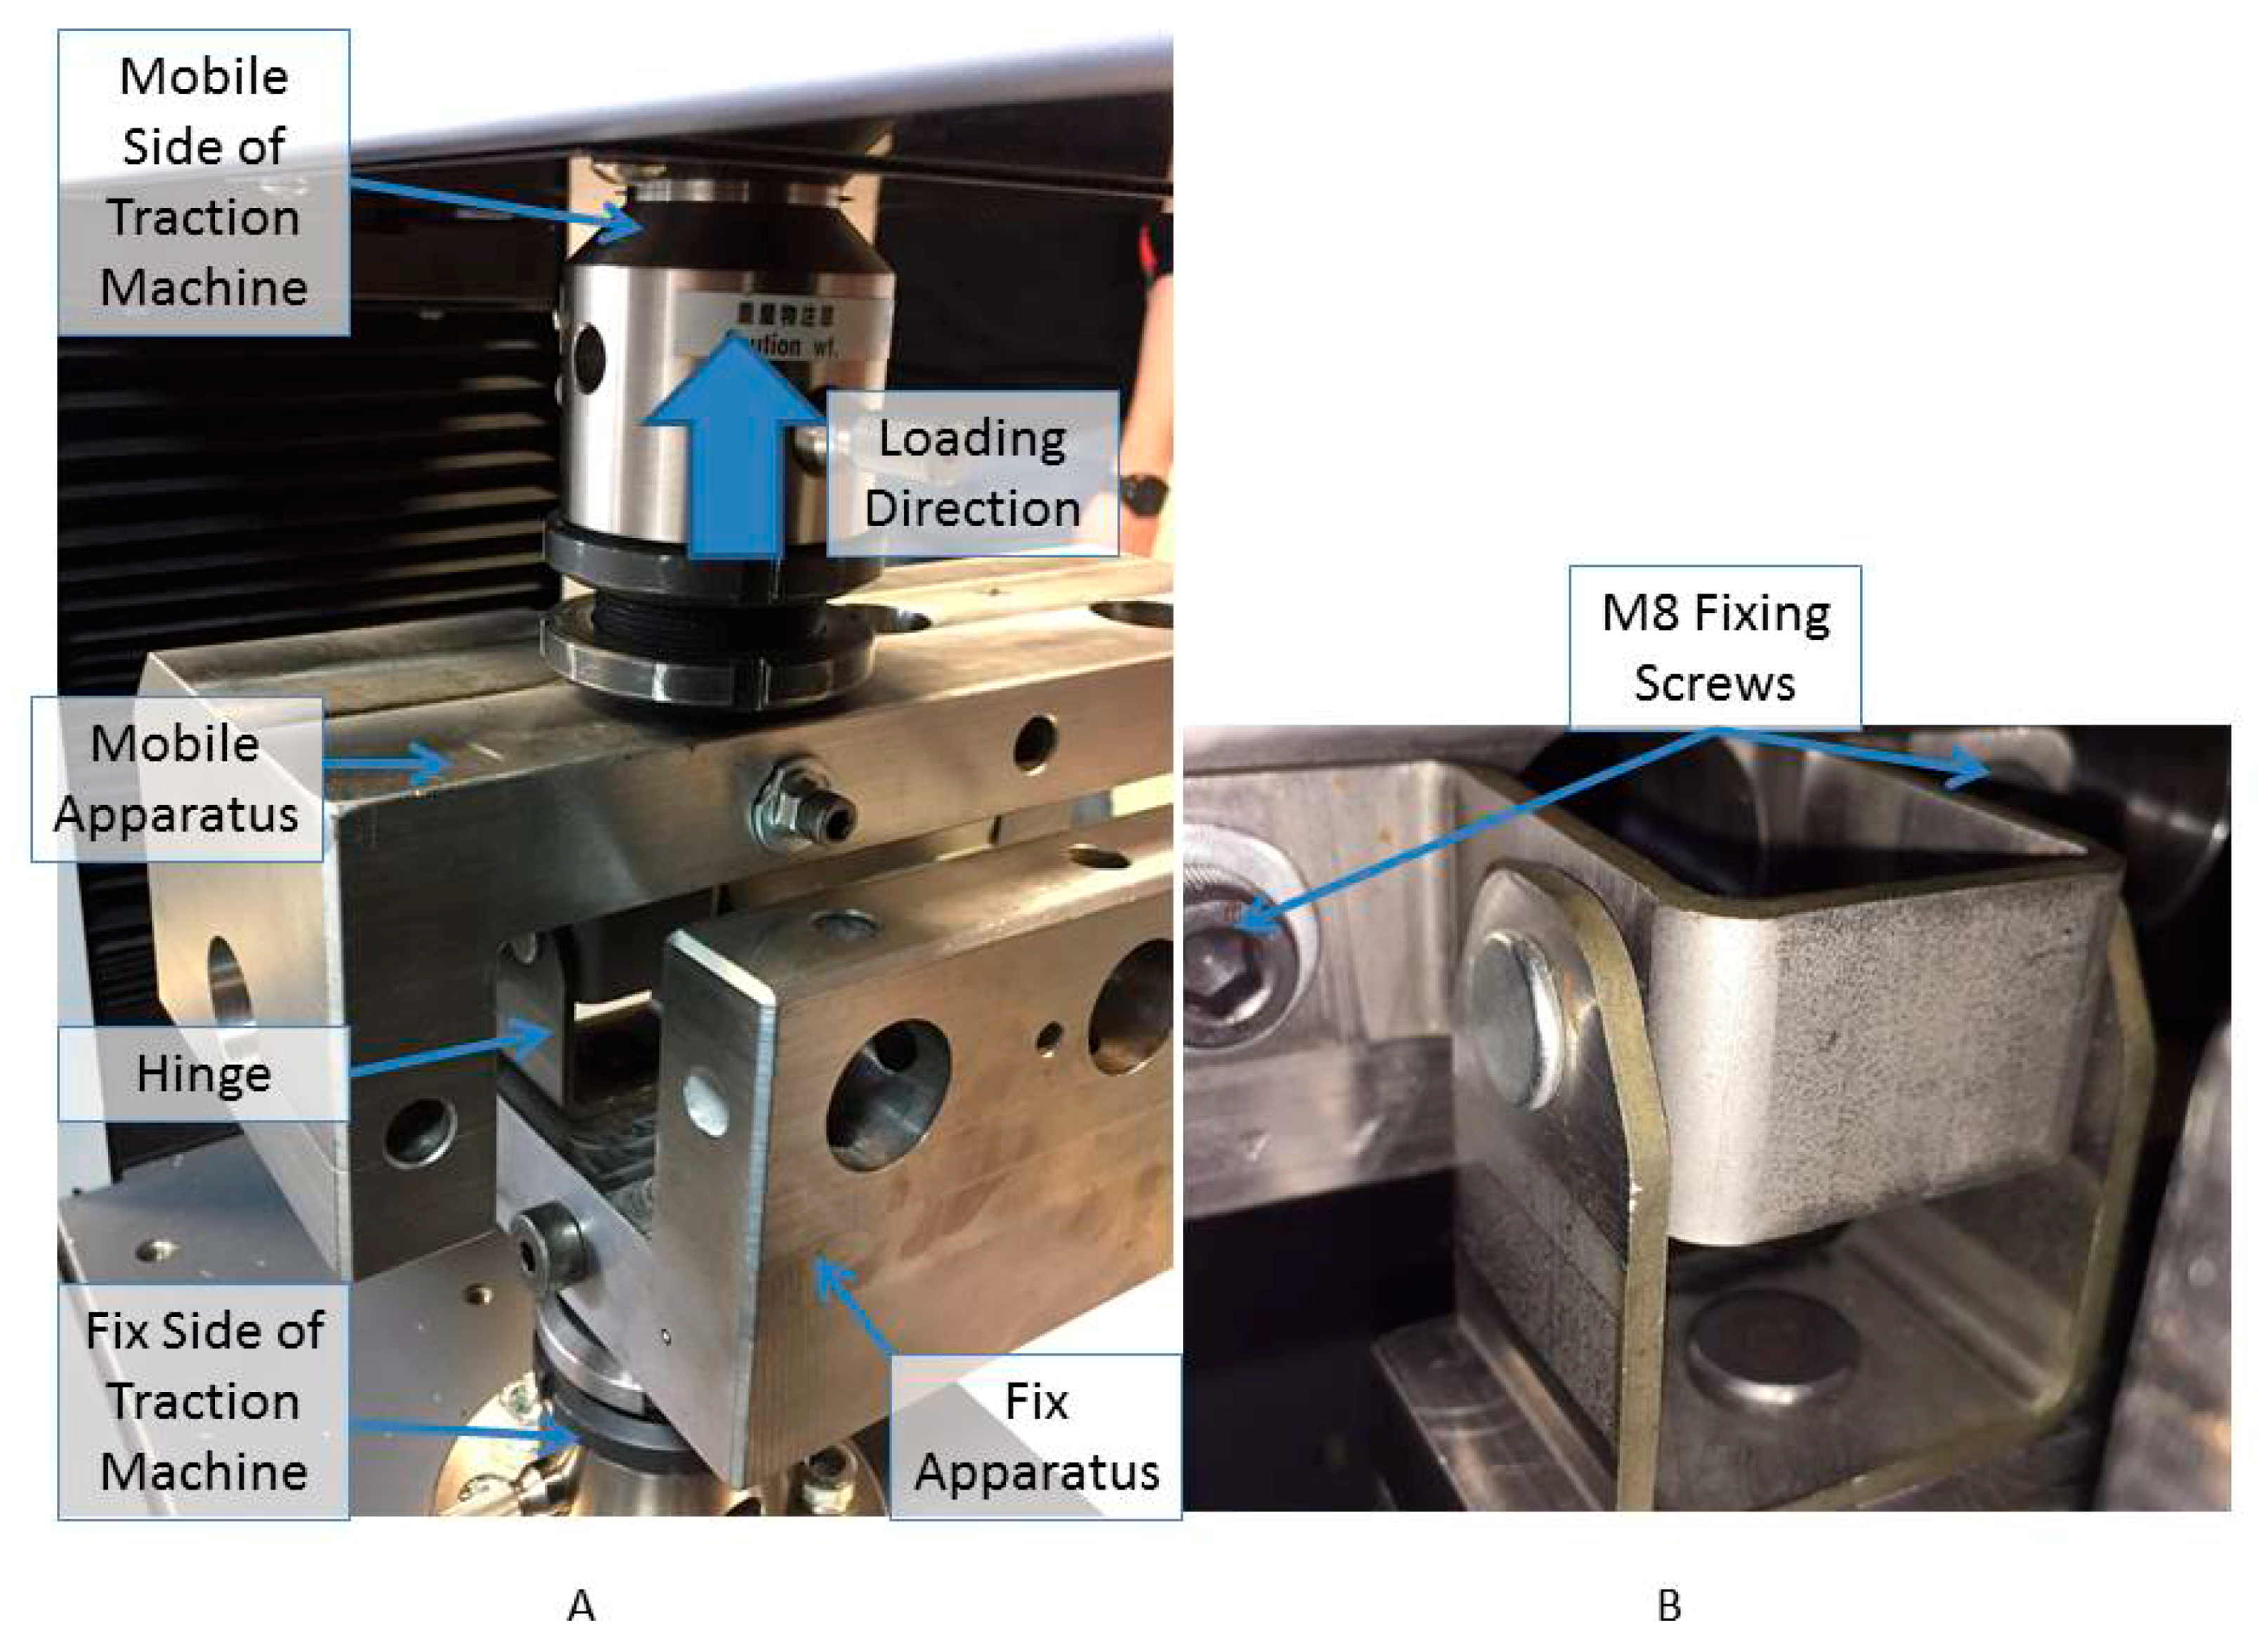
1.2.3. Static Test Apparatus
1.3. Literature Study
1.4. Motivation and Objective
2. Materials and Methods
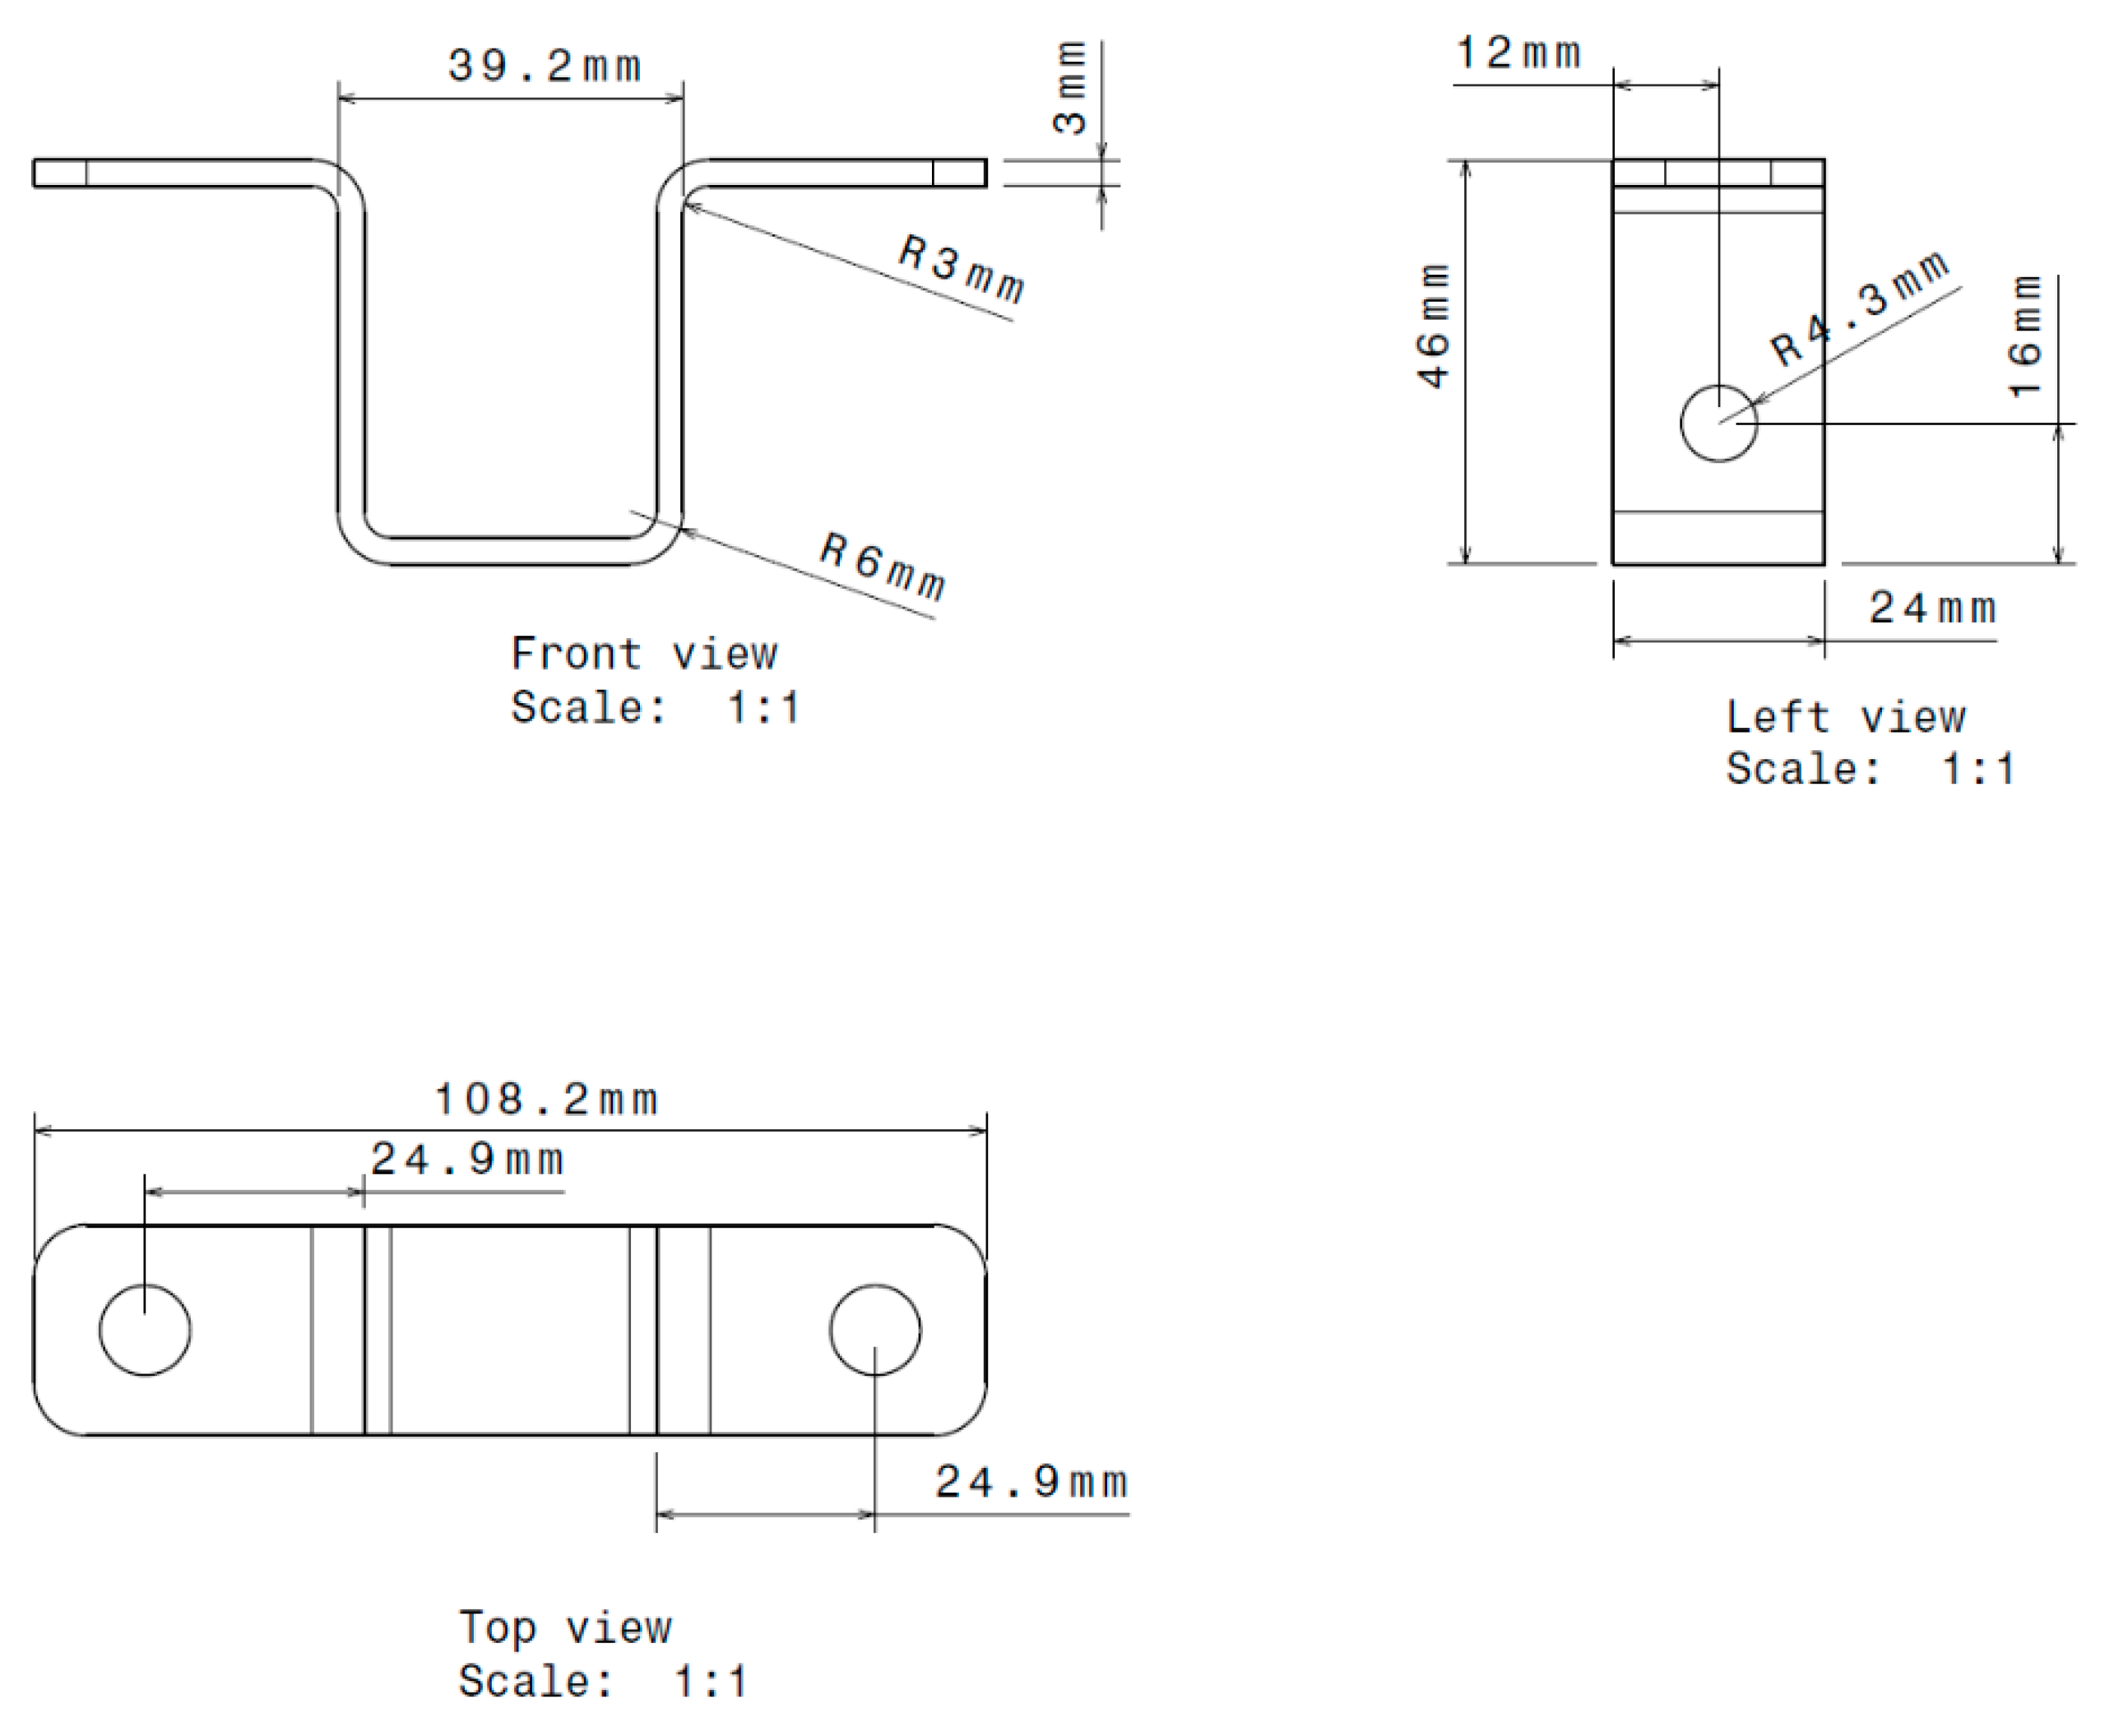
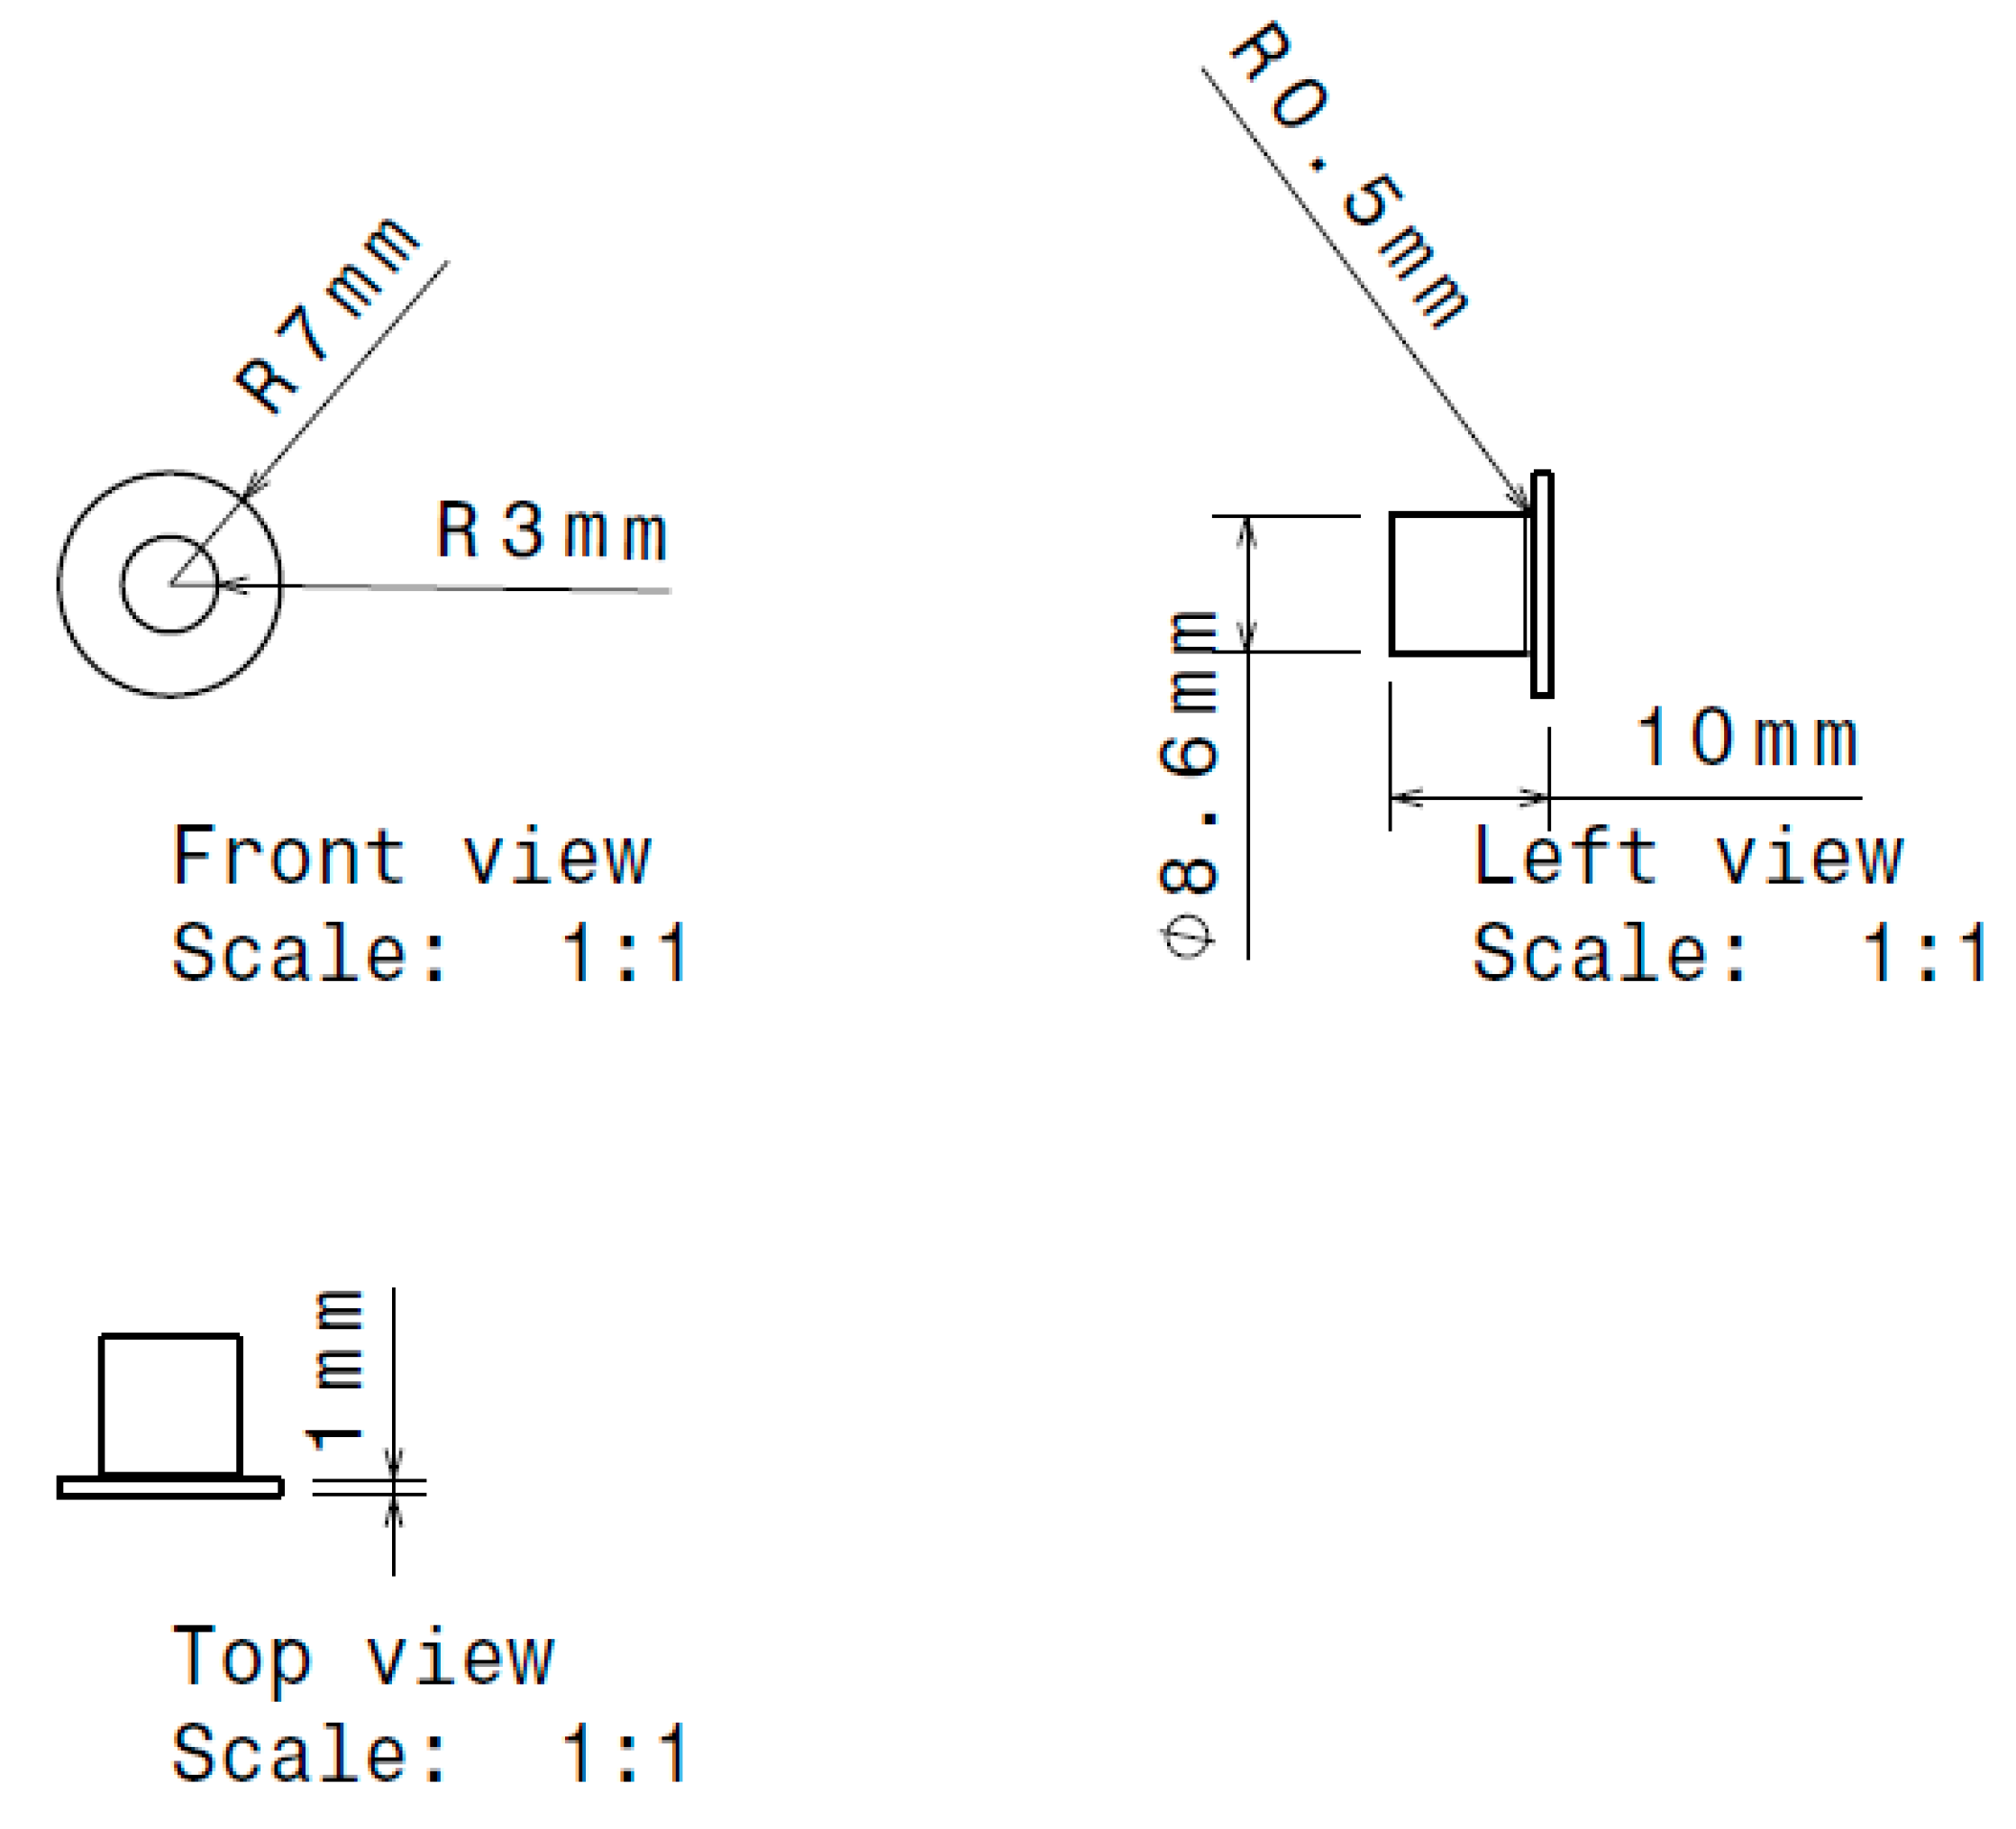
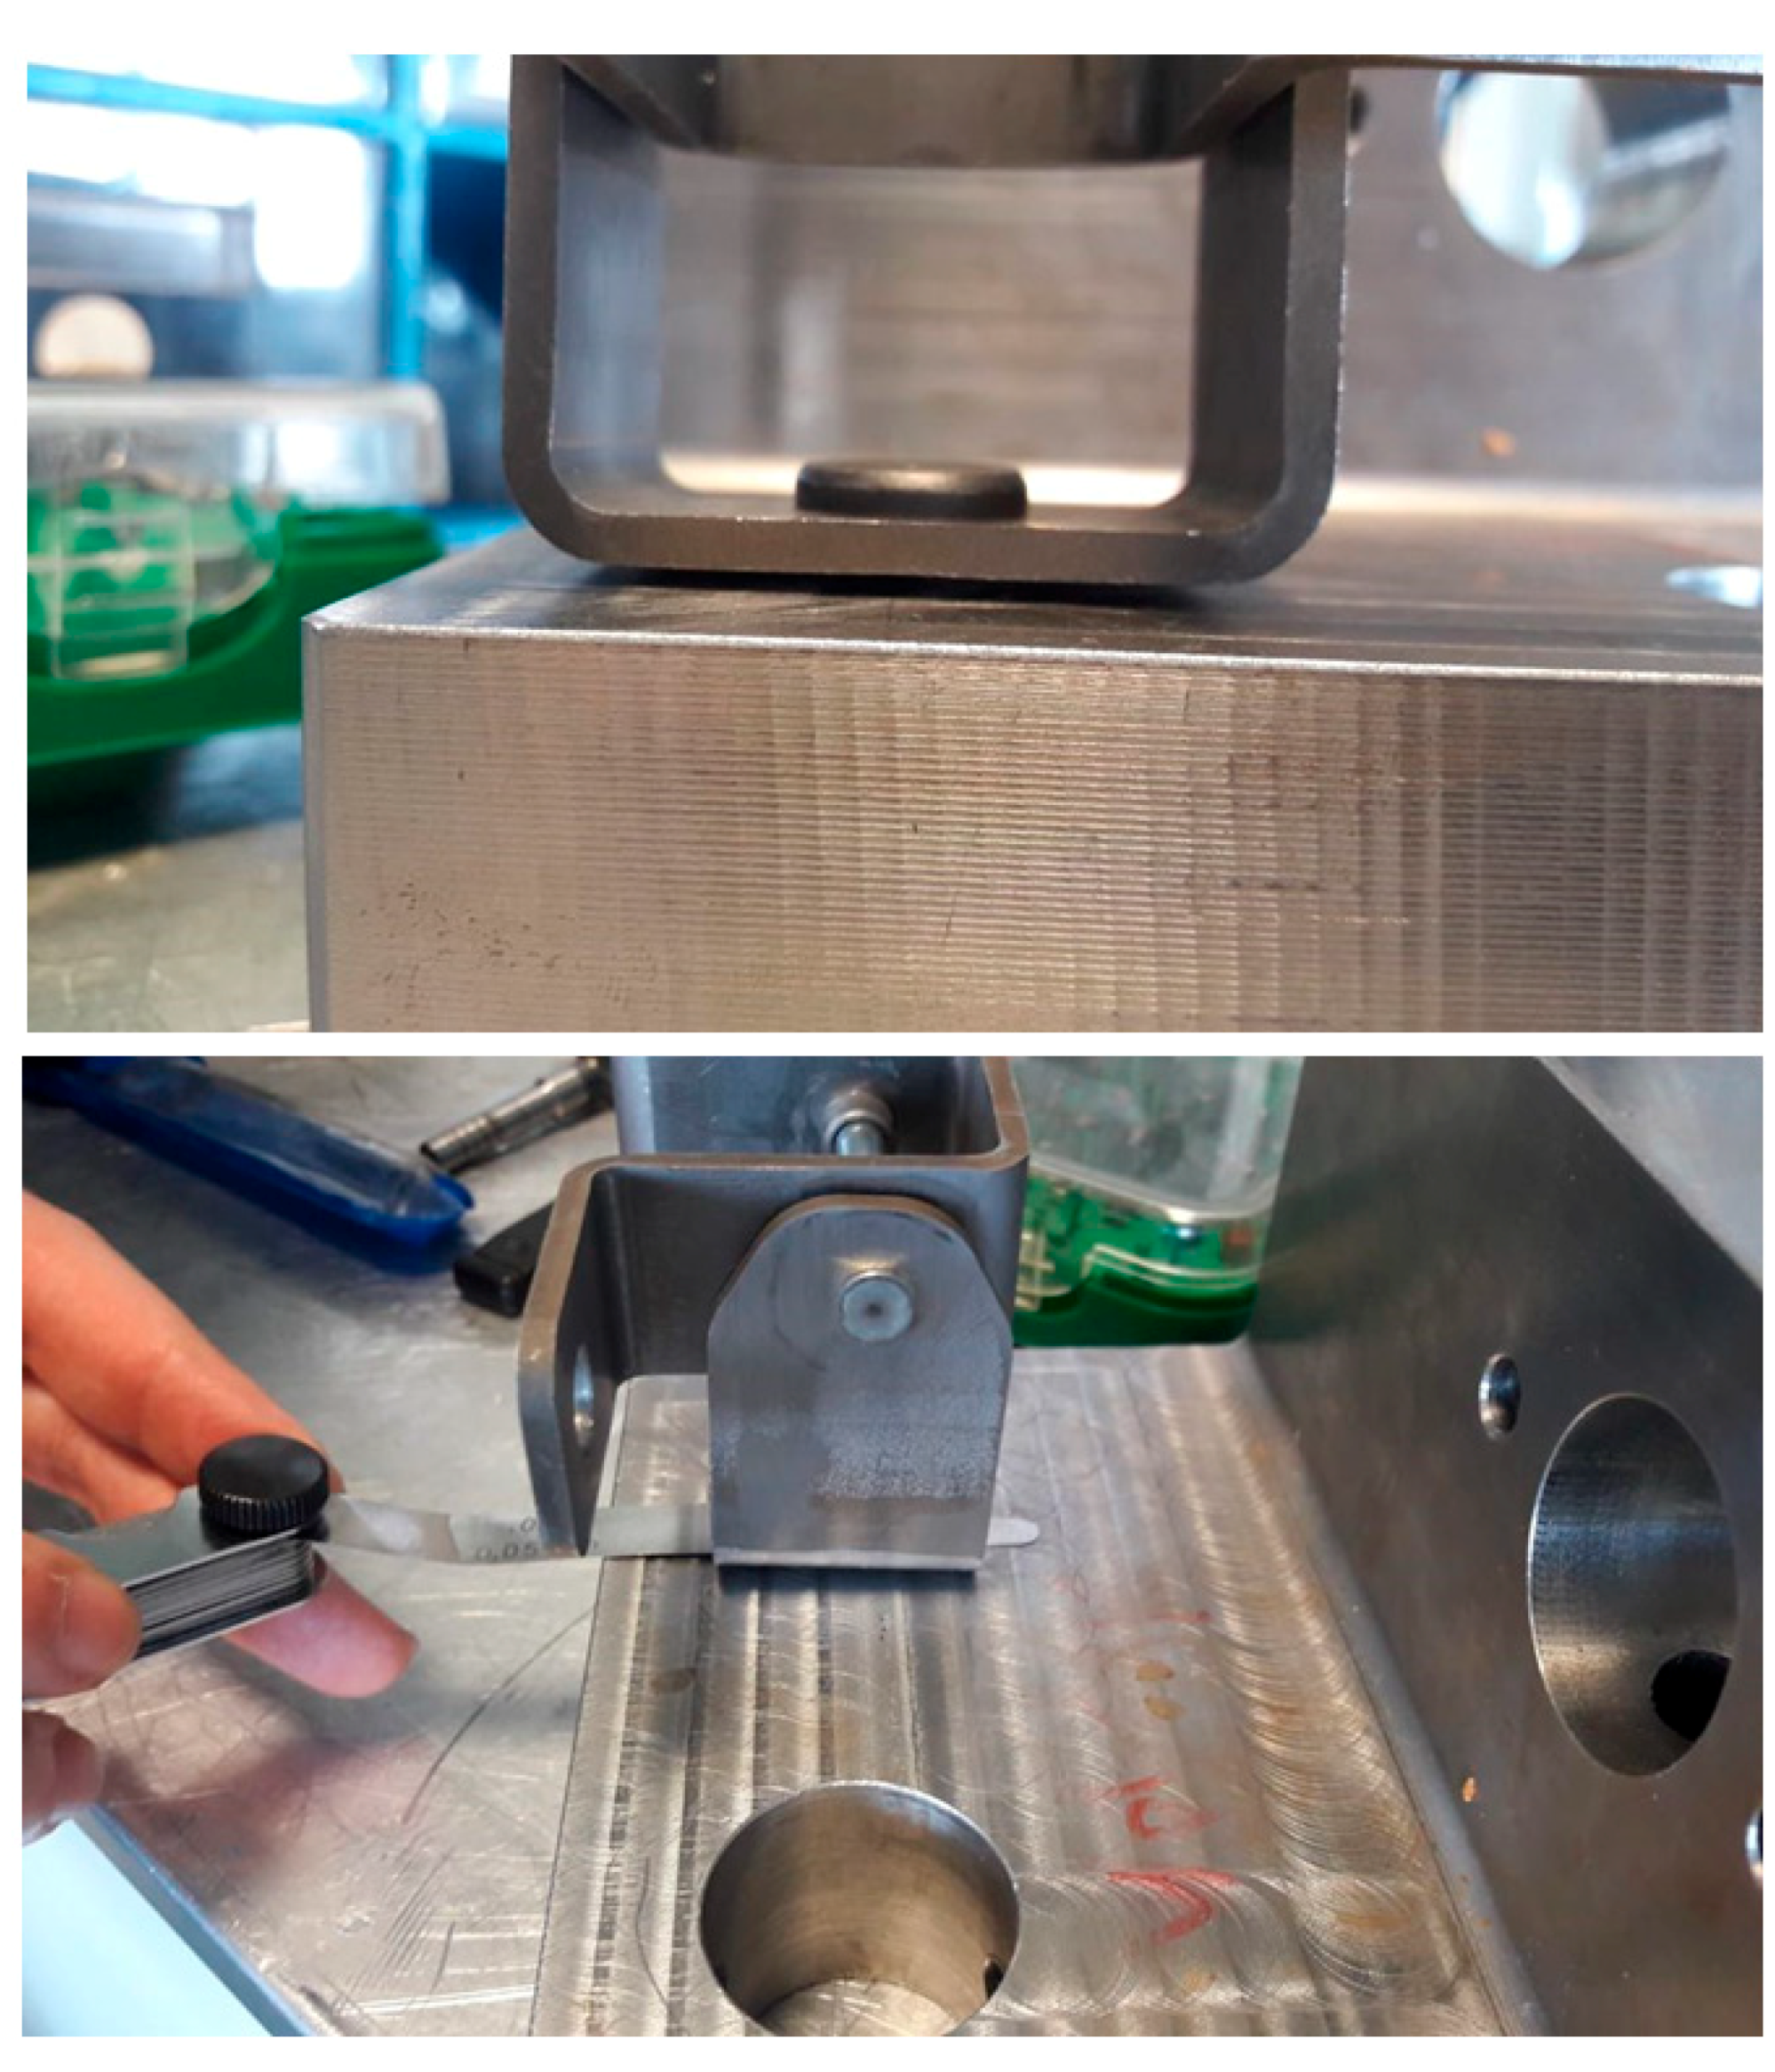
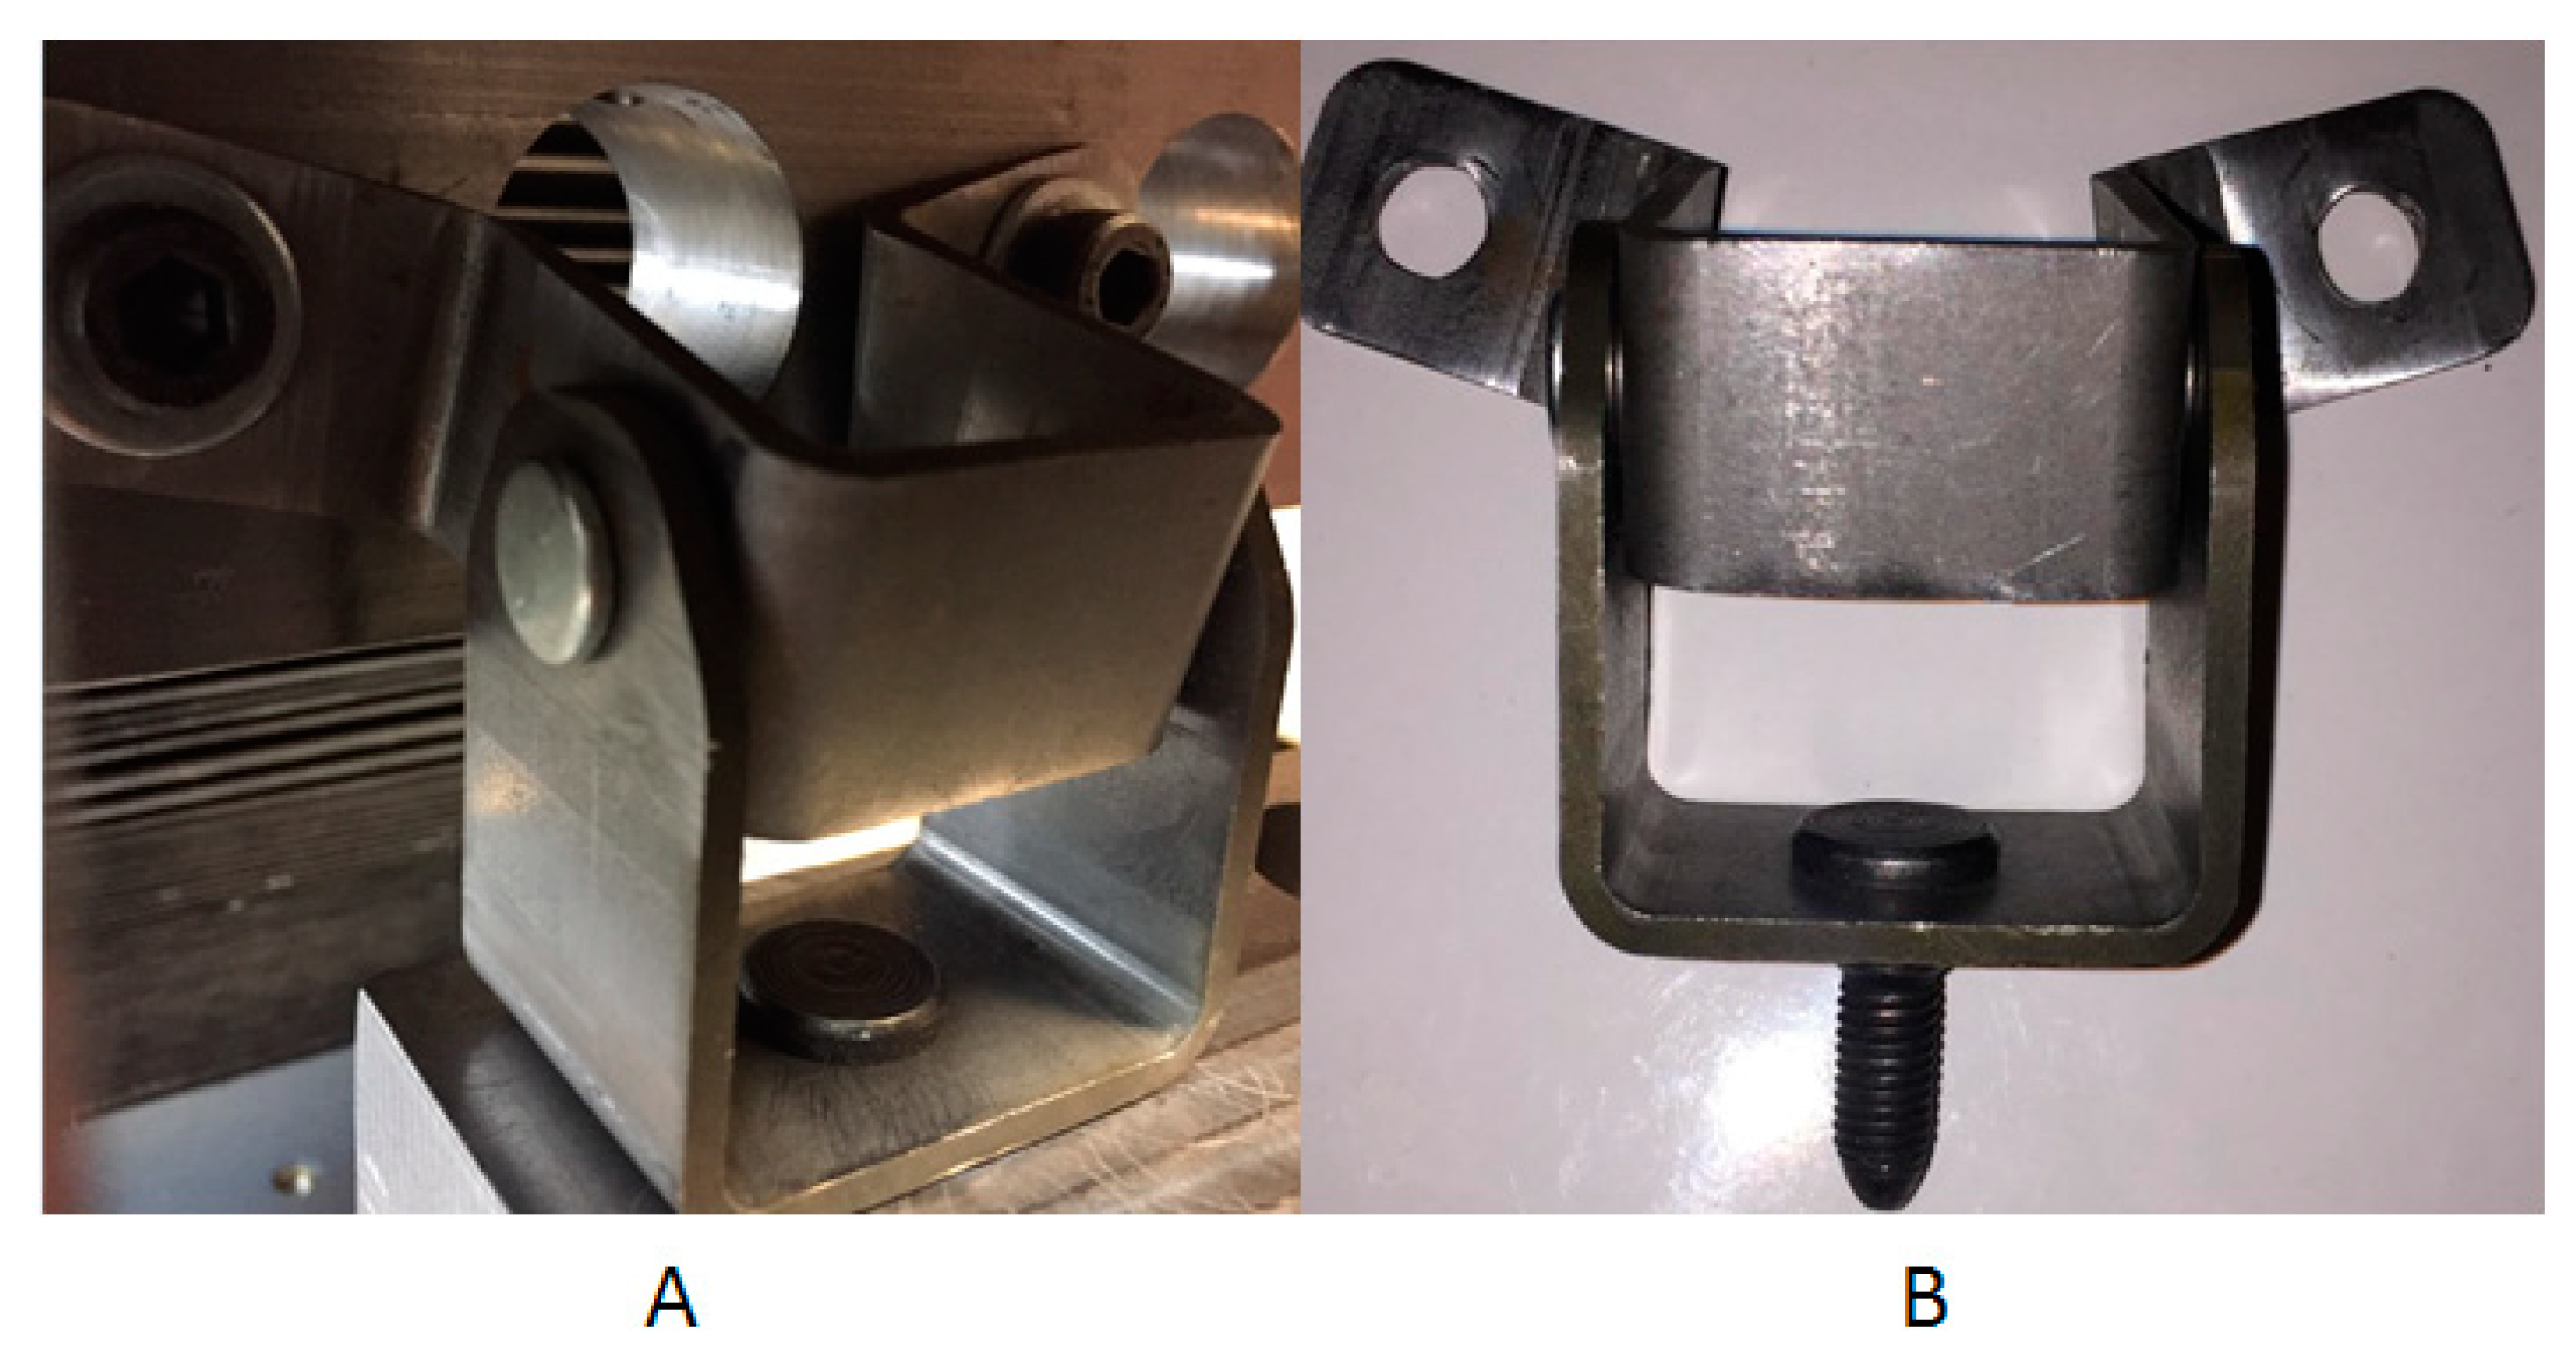
2.1. Dummy Model Design and Production
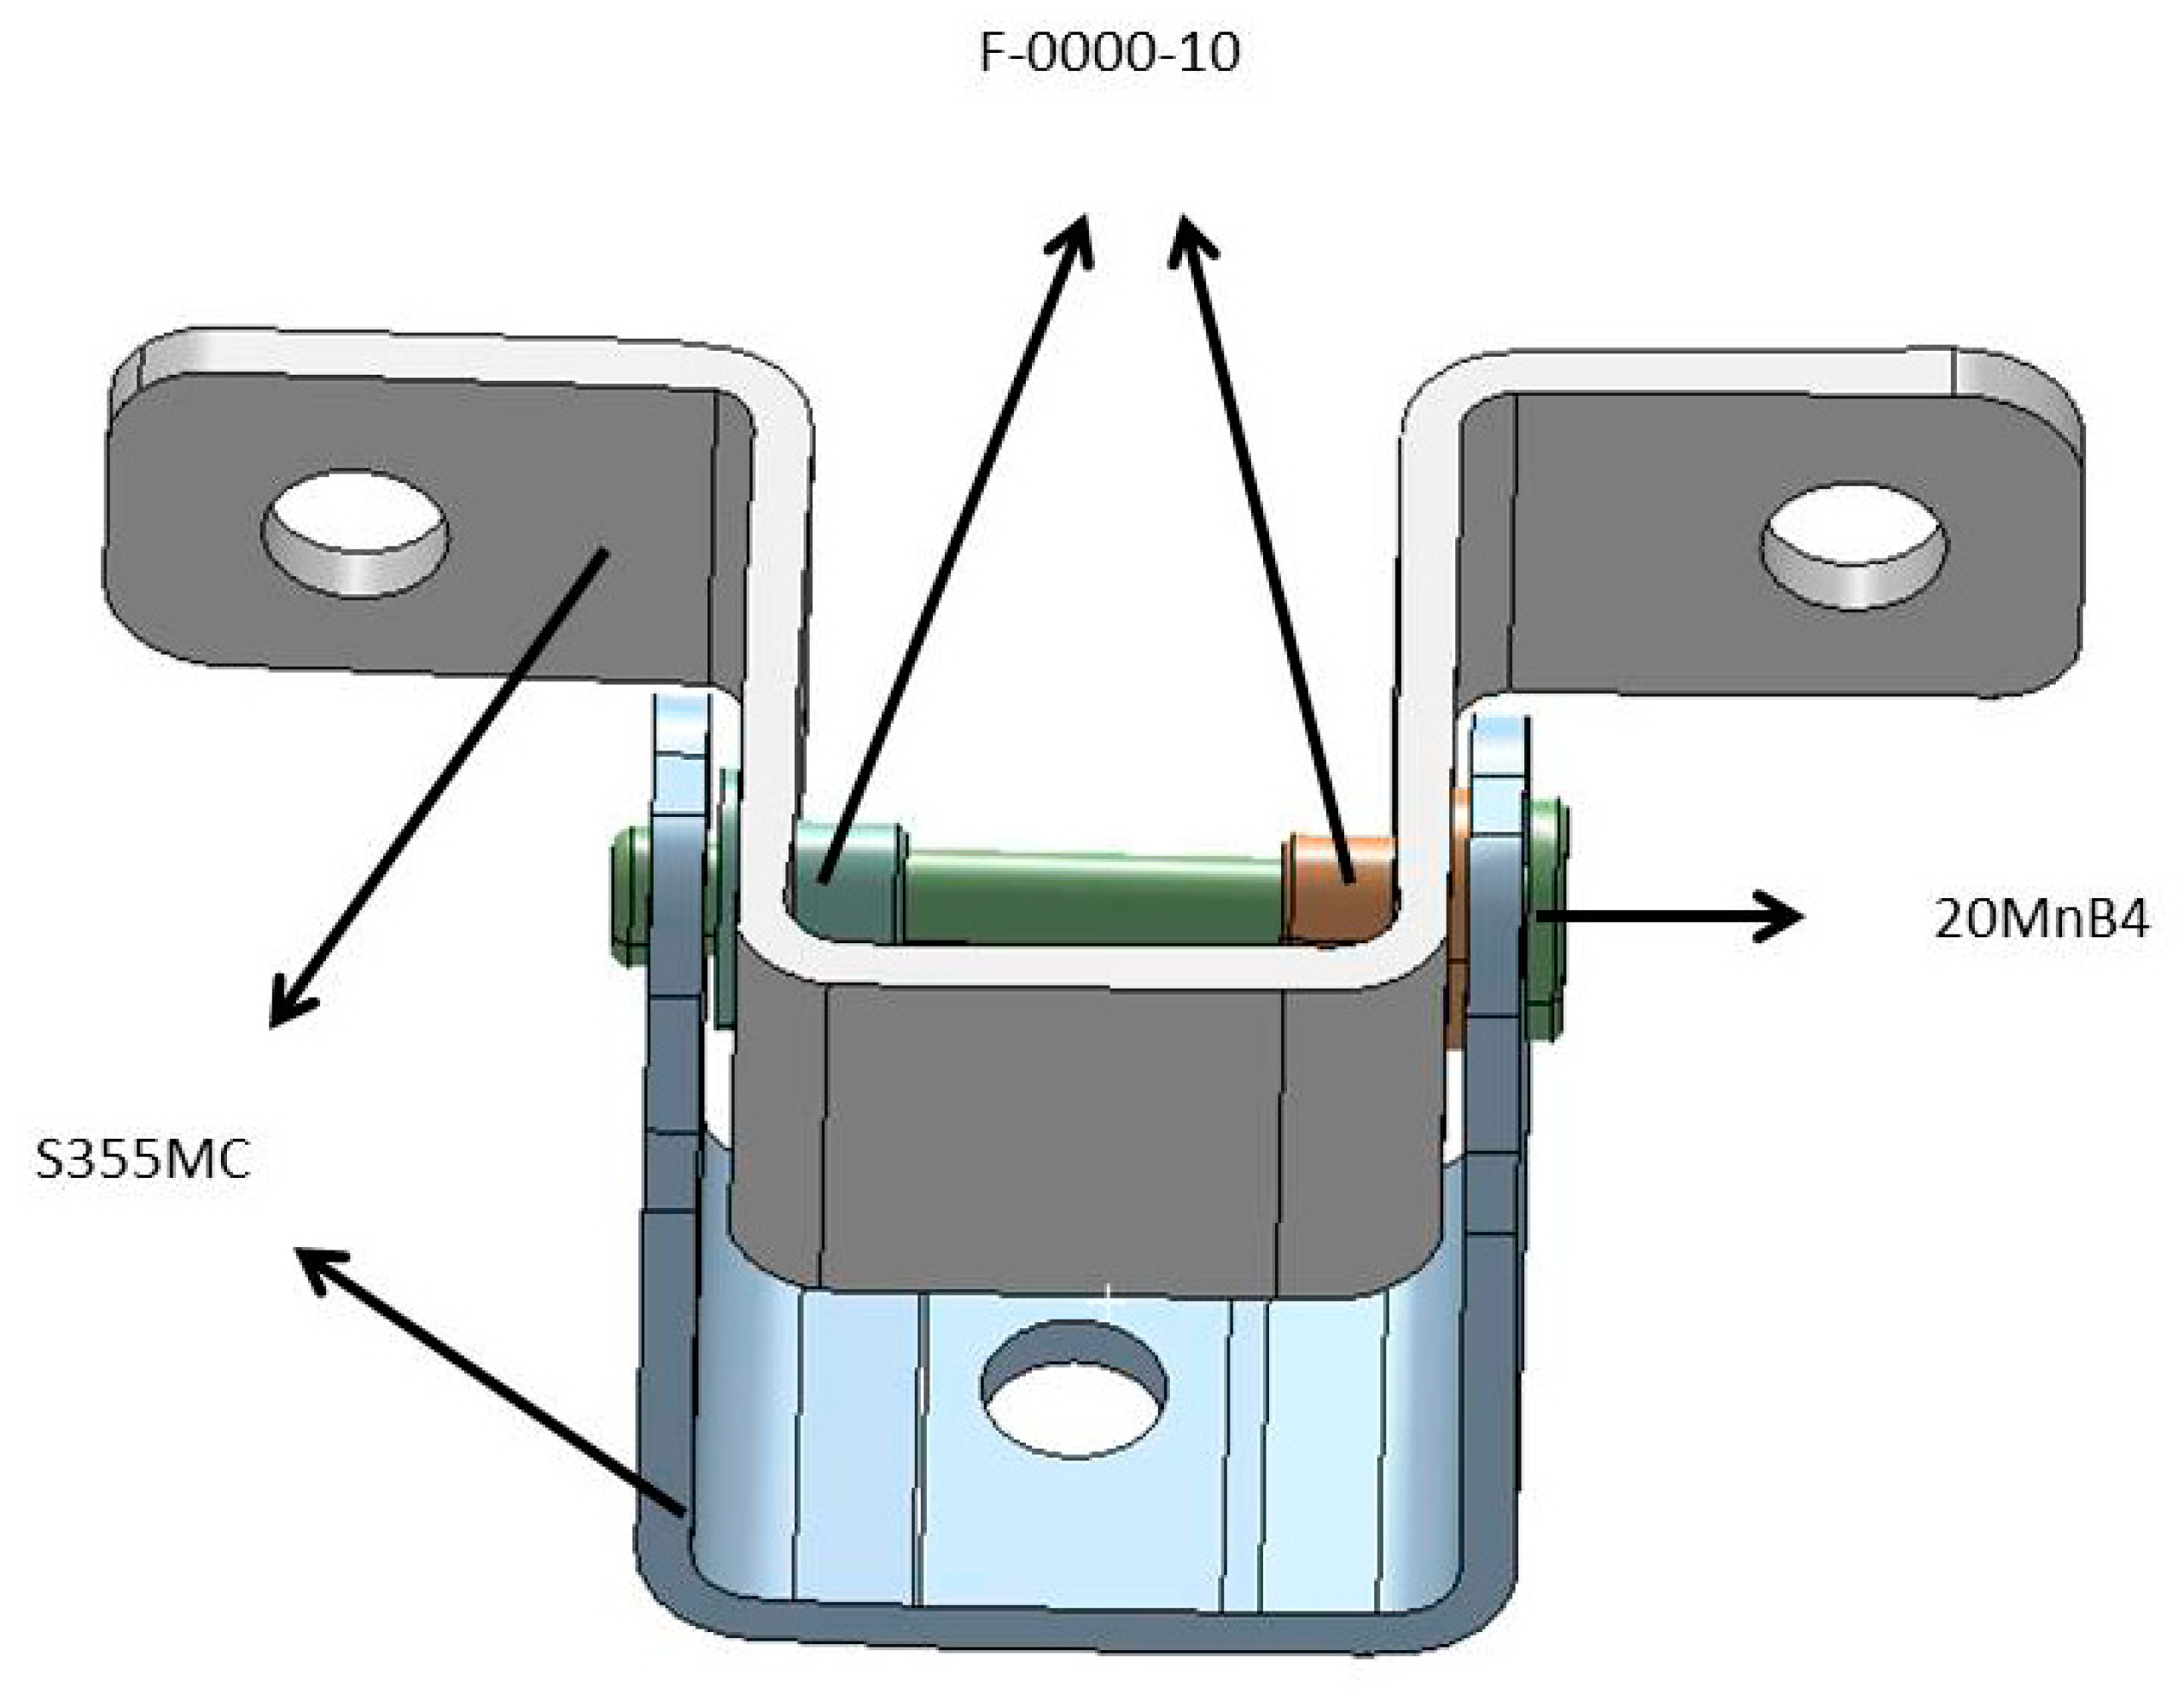
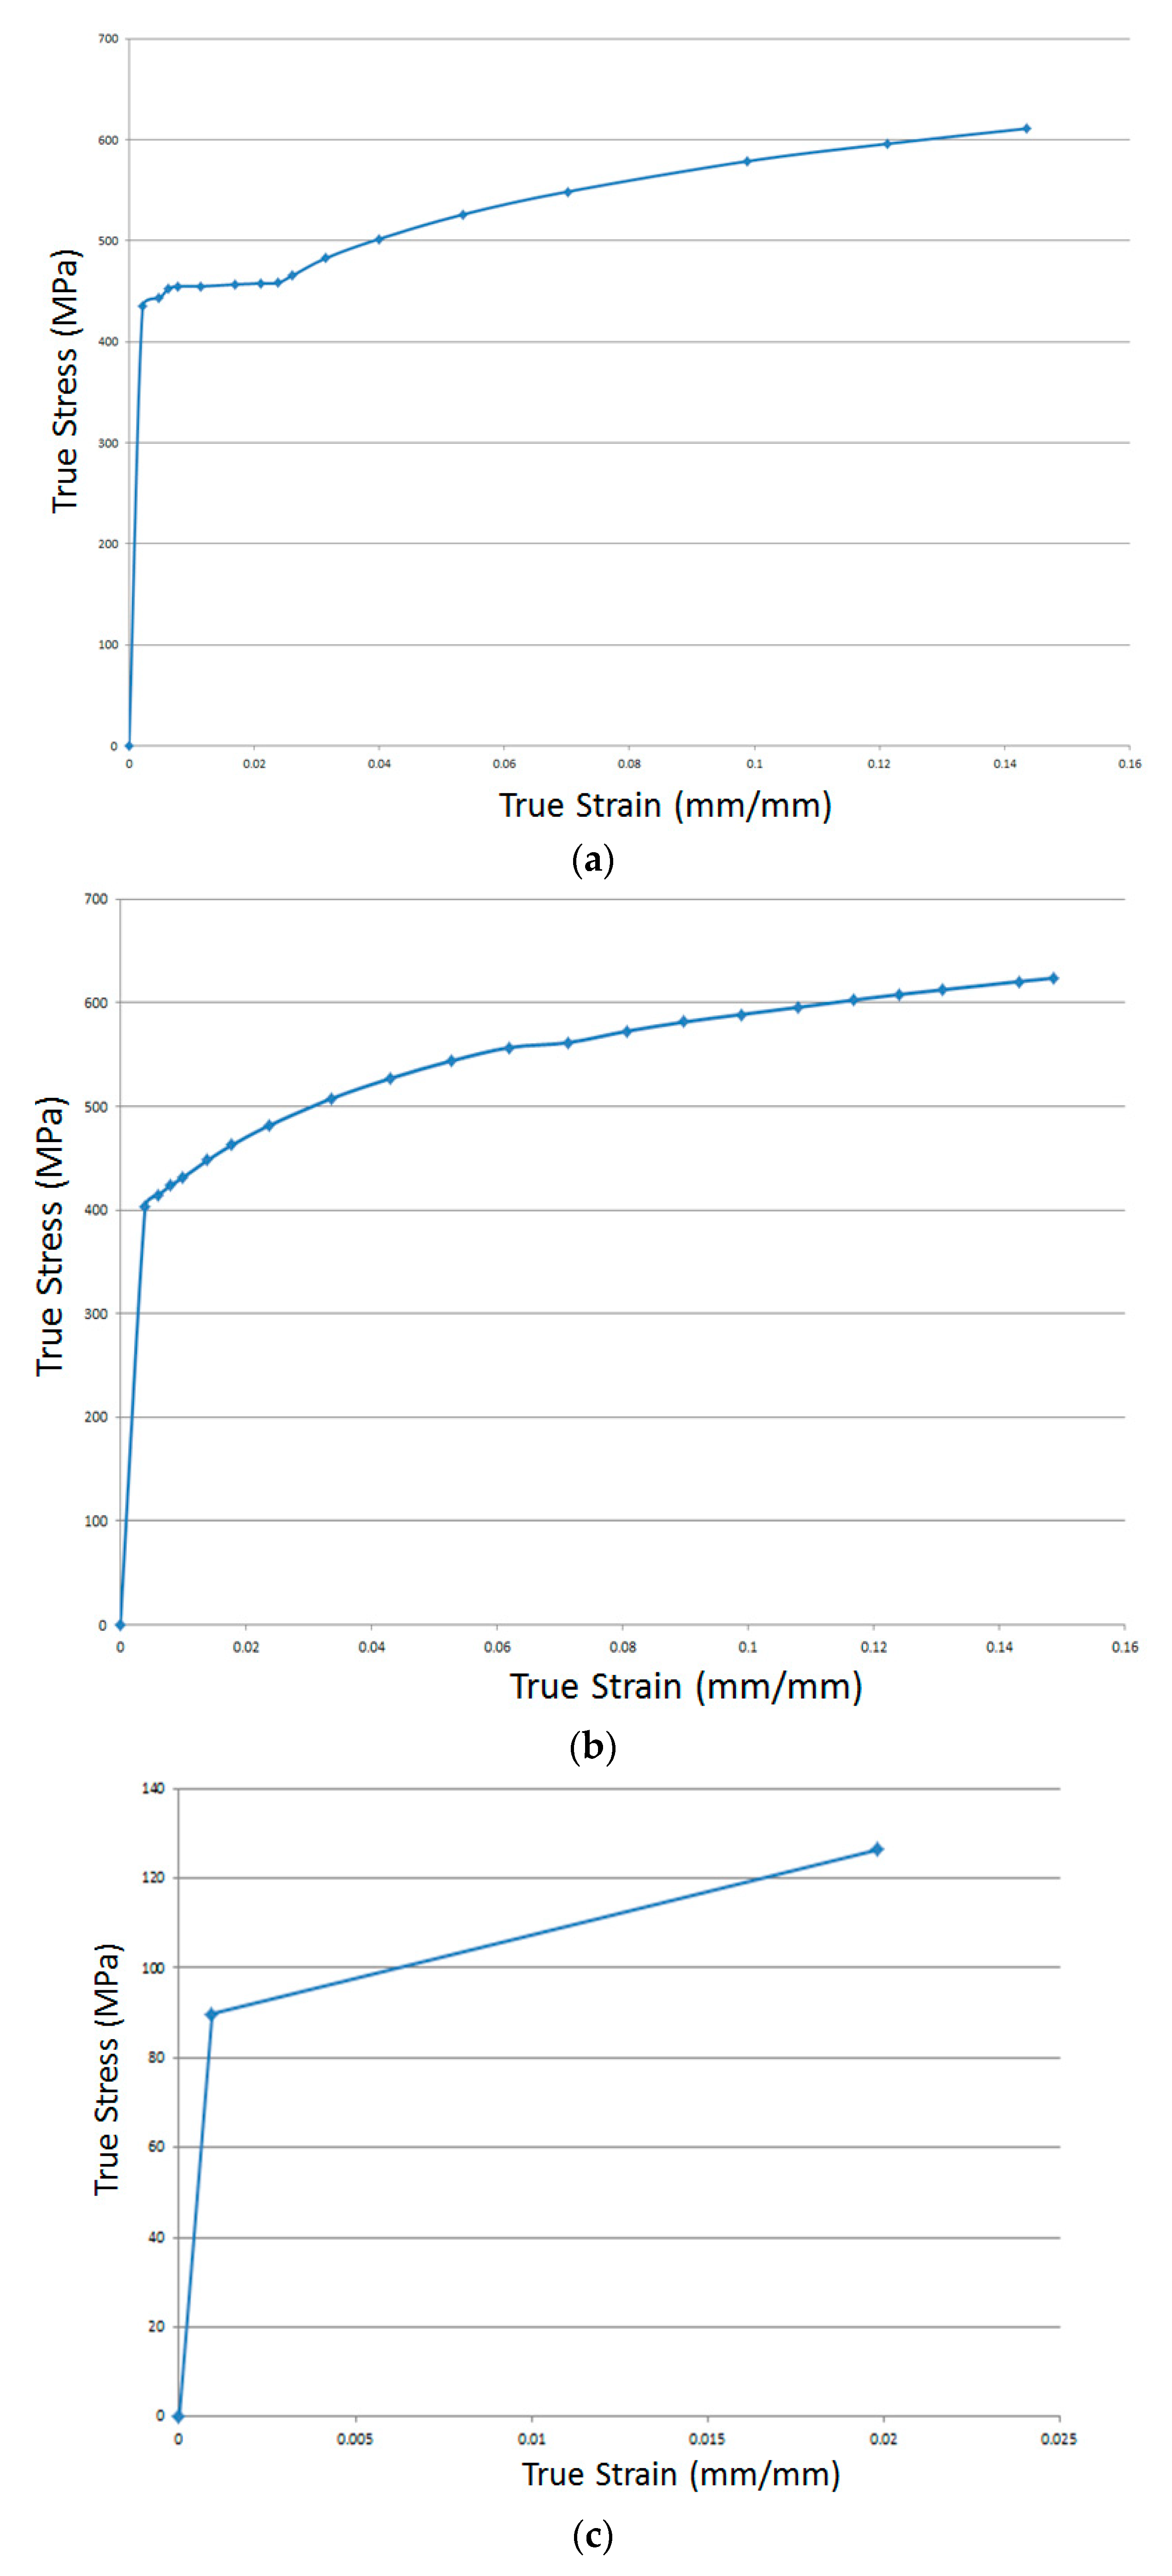
2.2. Material Data
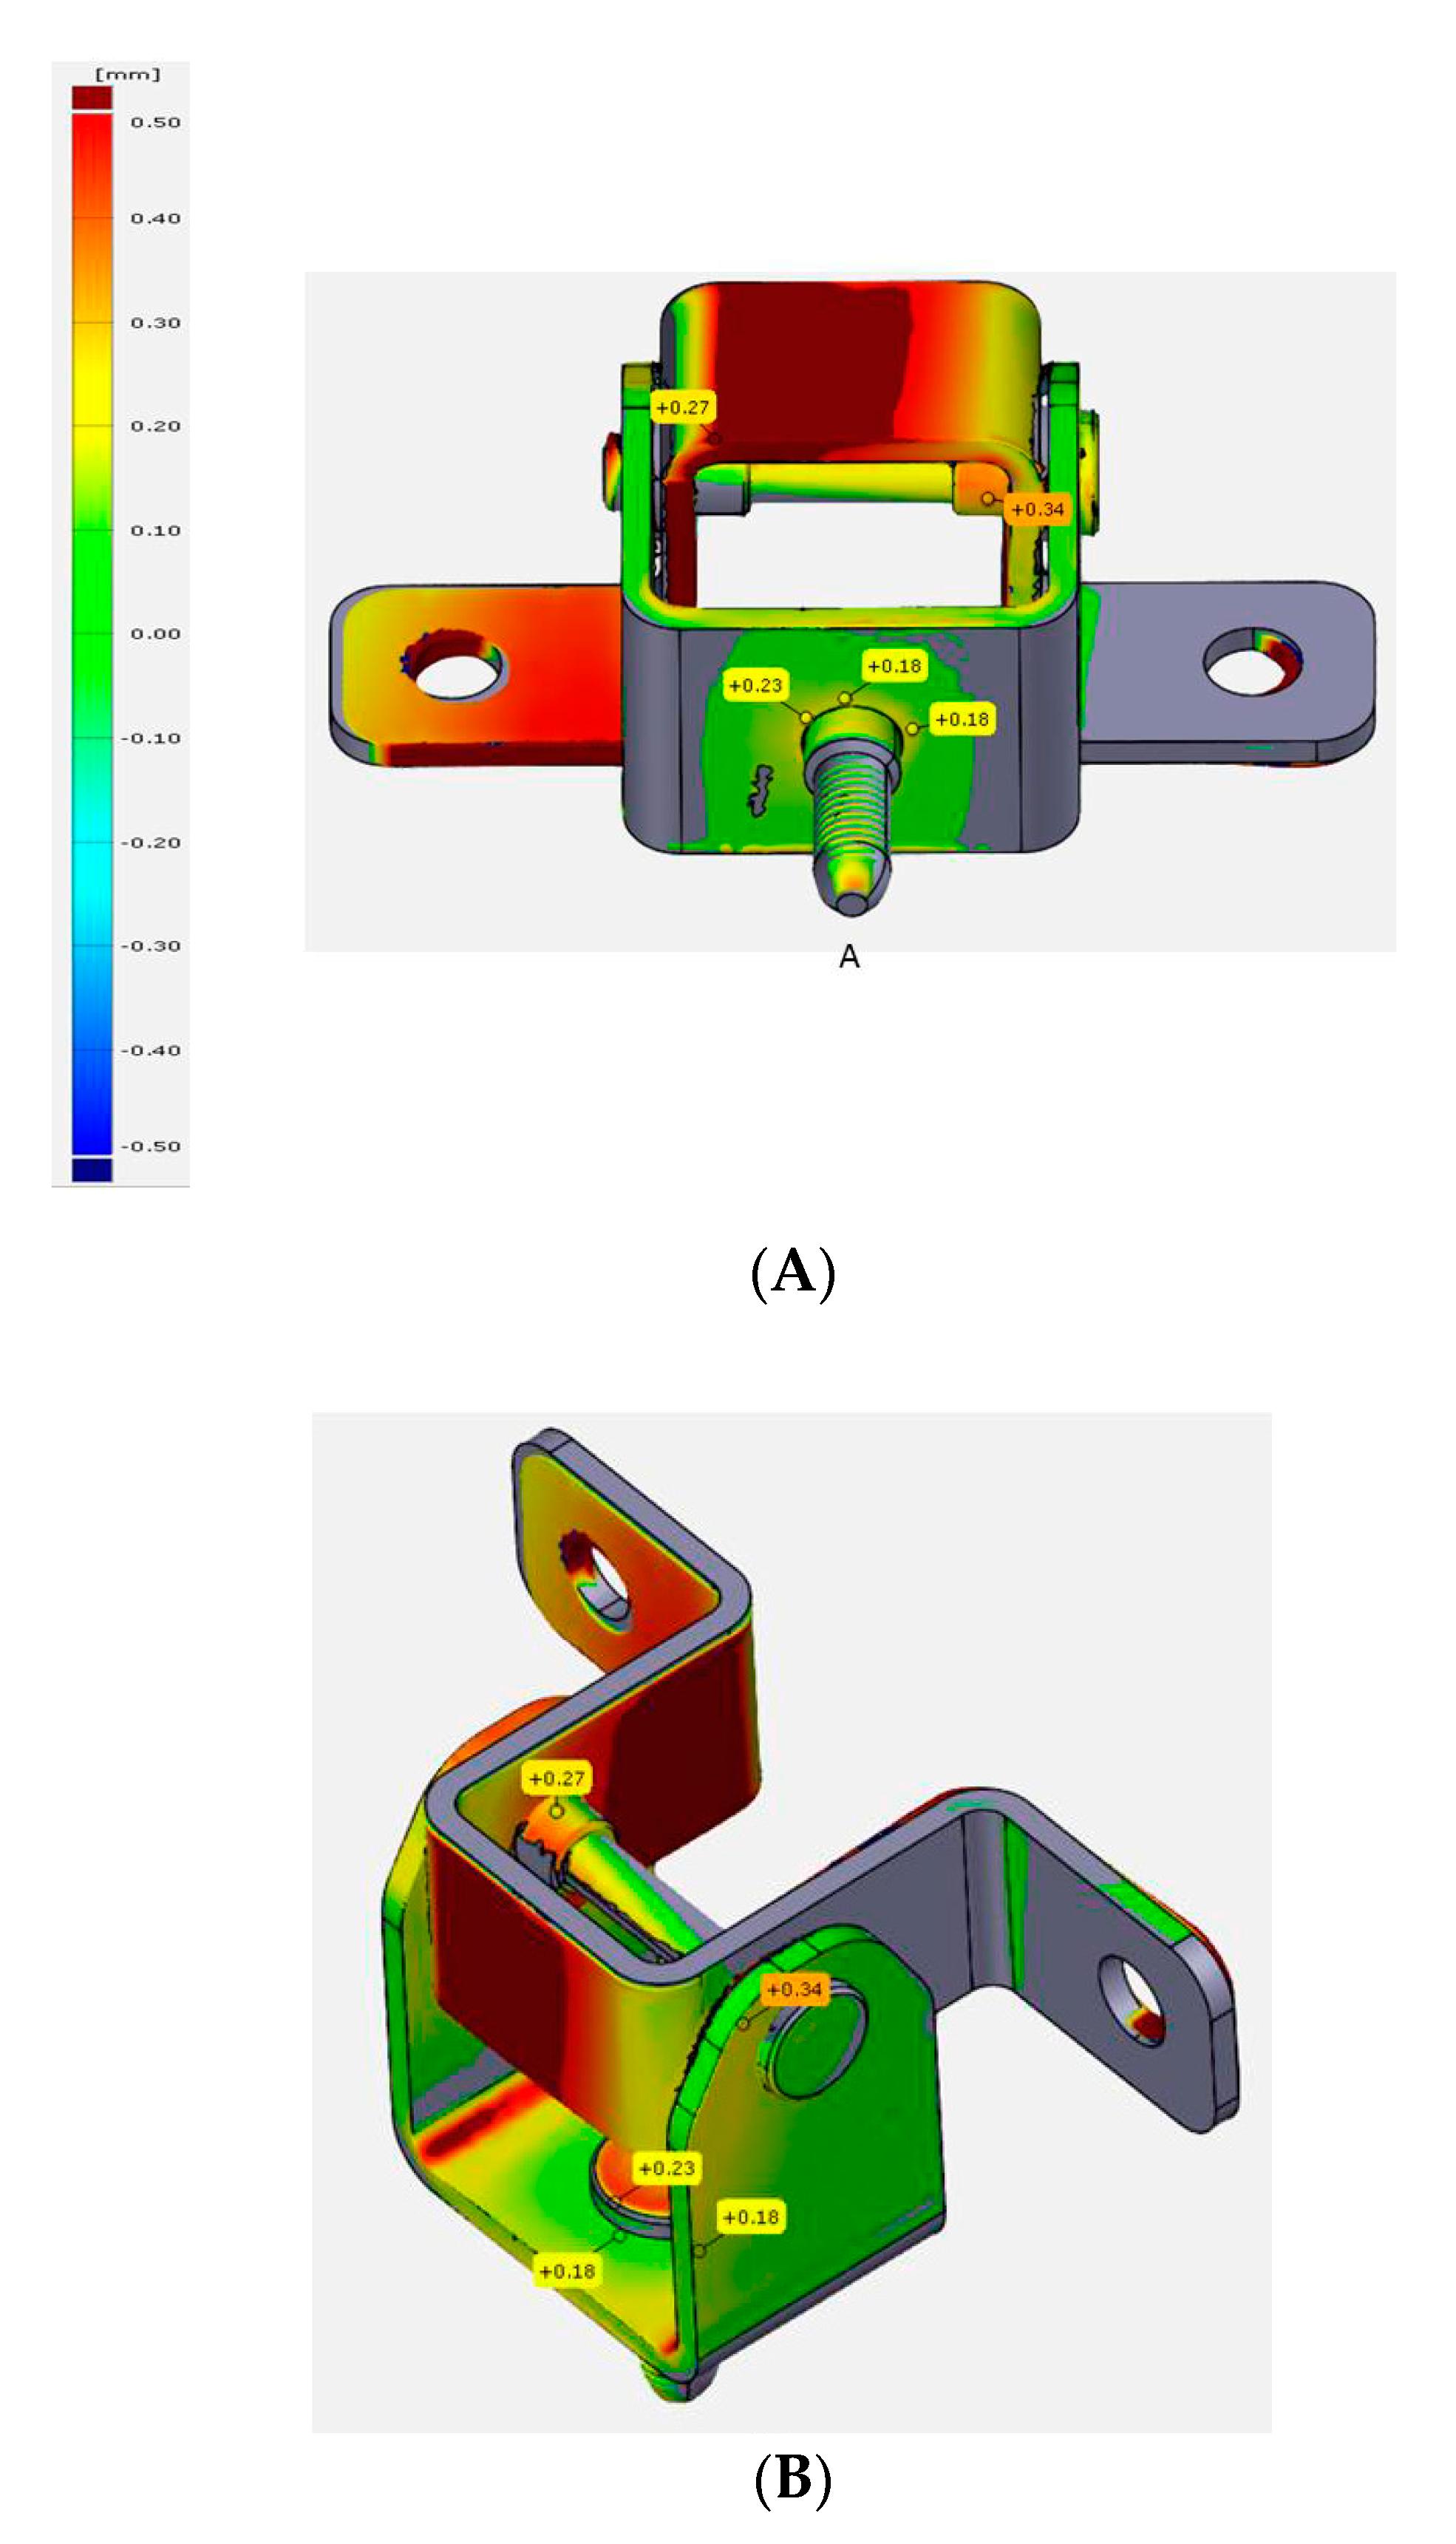
2.3. Finite Element Model (FEM)
2.3.1. Simulation Parameters for Evaluation
Geometrical Difference
Friction Coefficient
Bush Material Effect
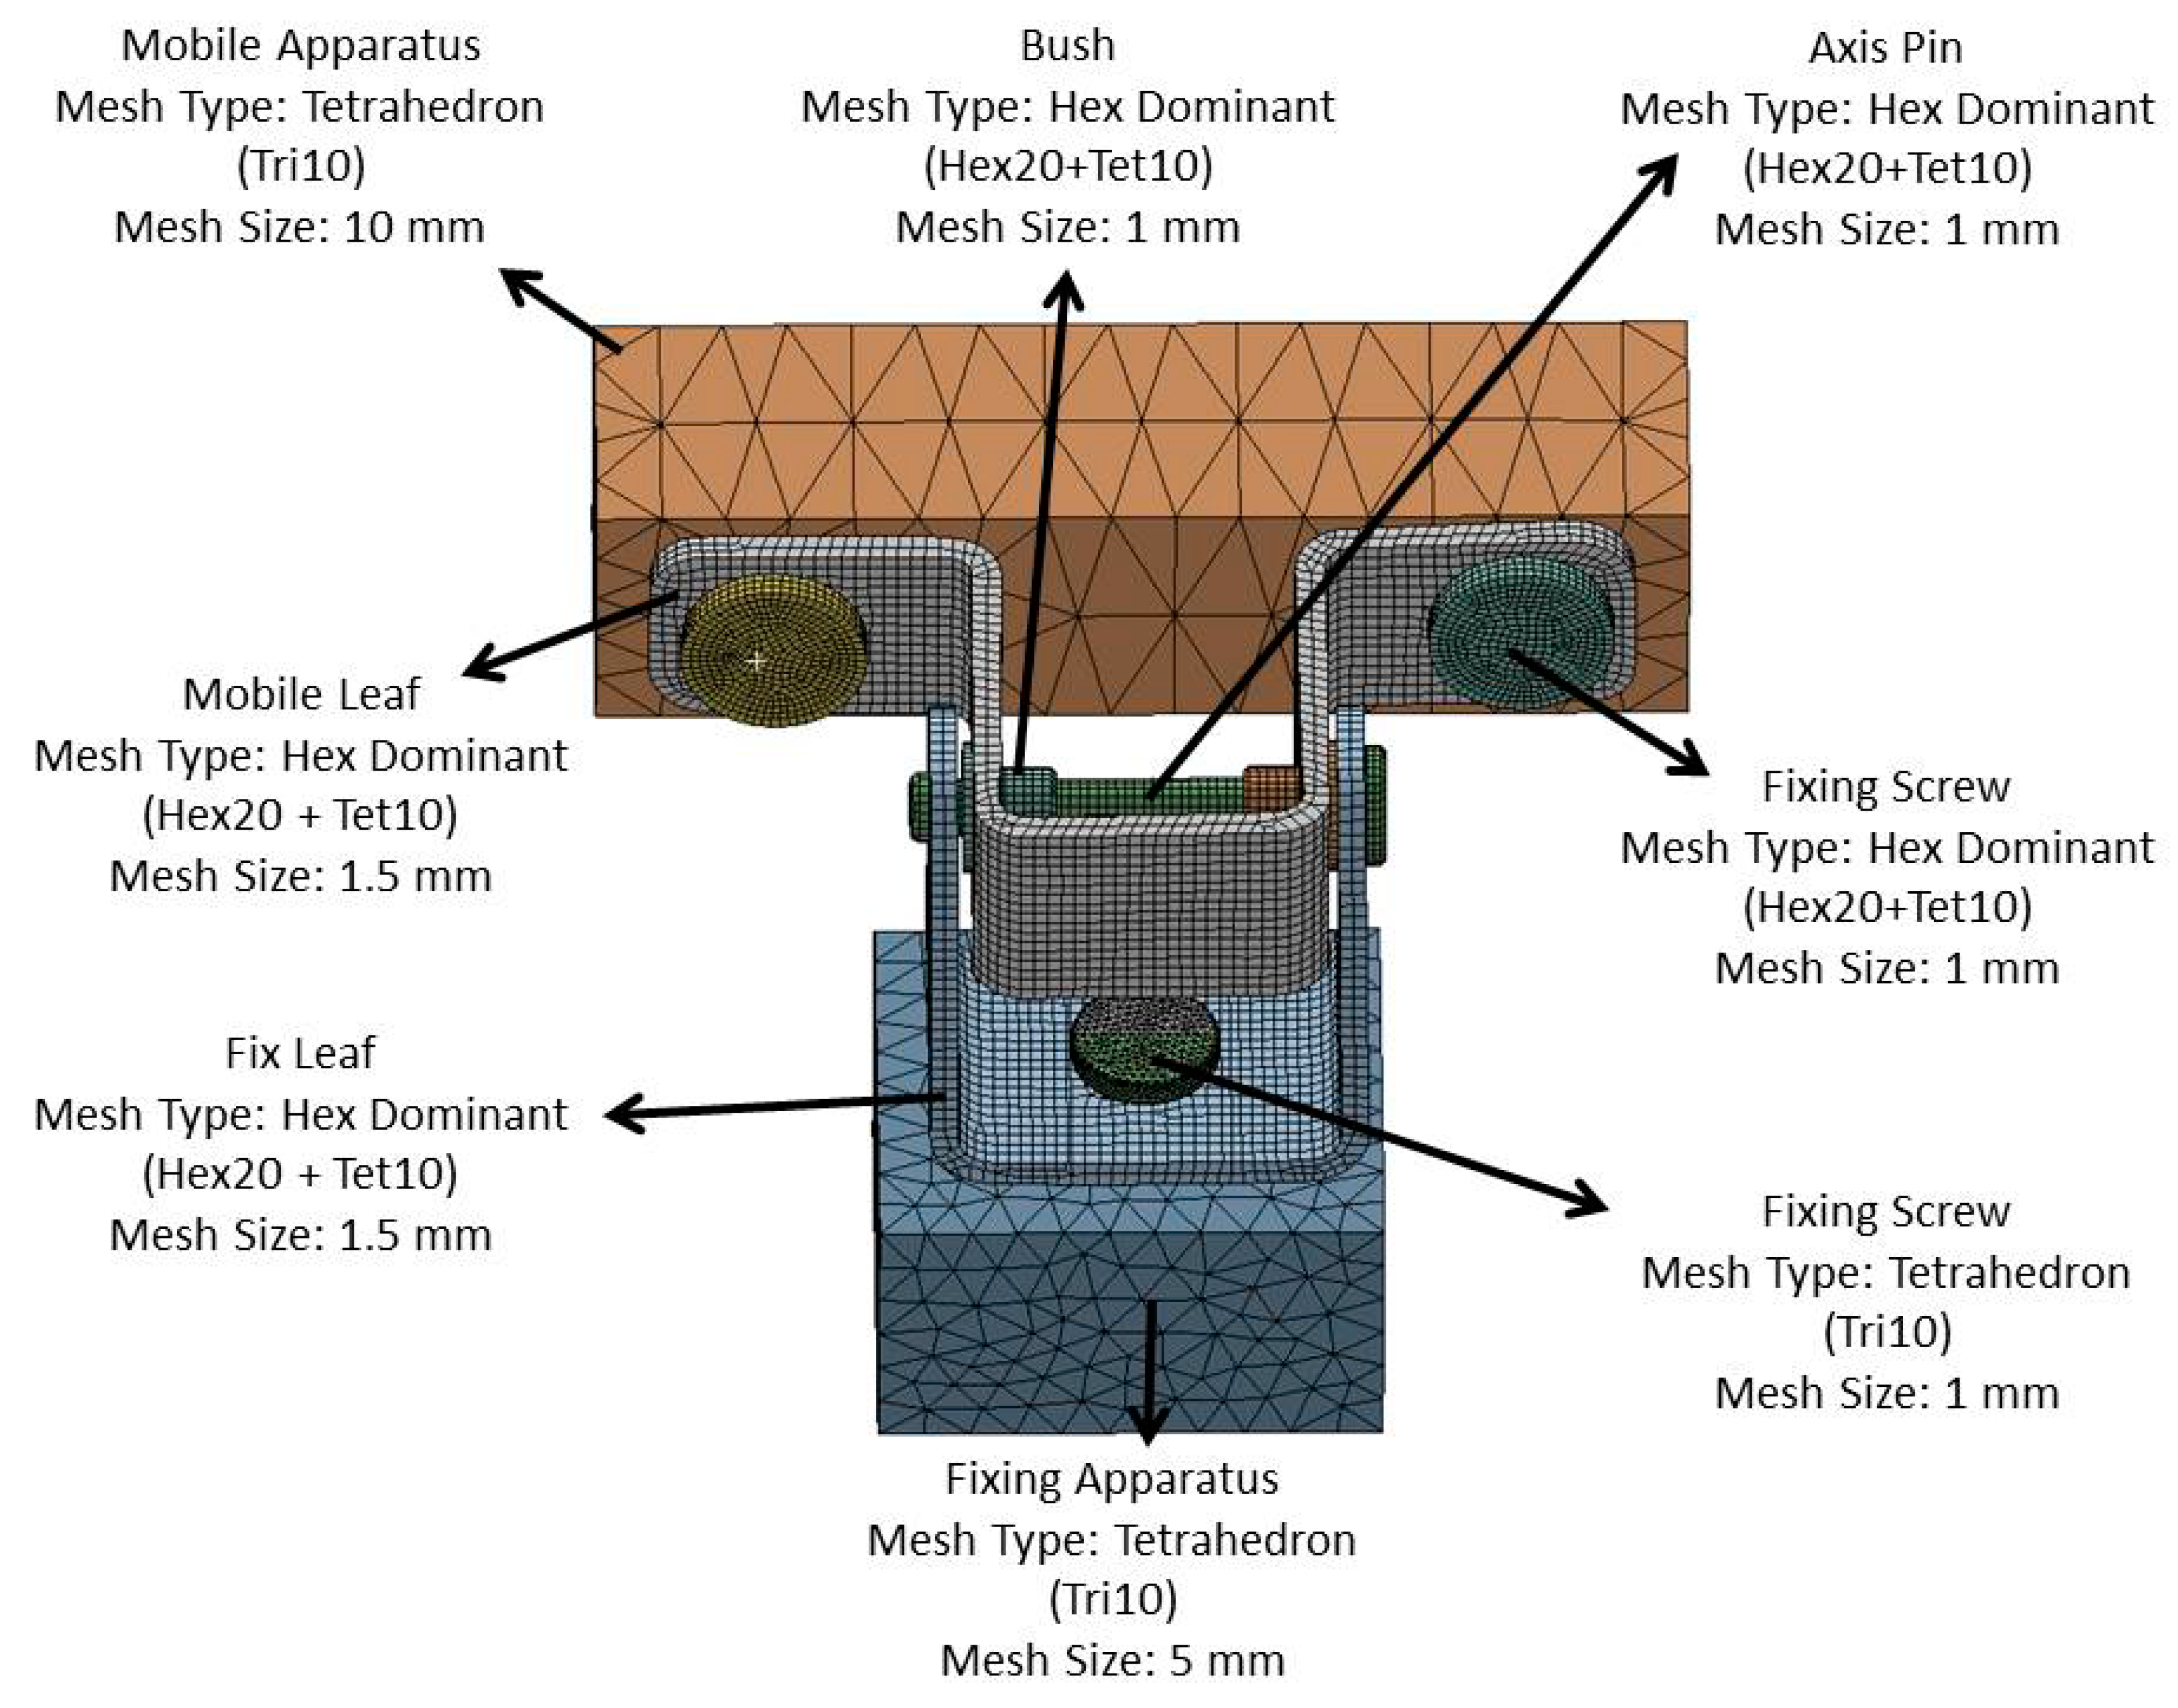
2.3.2. Mesh
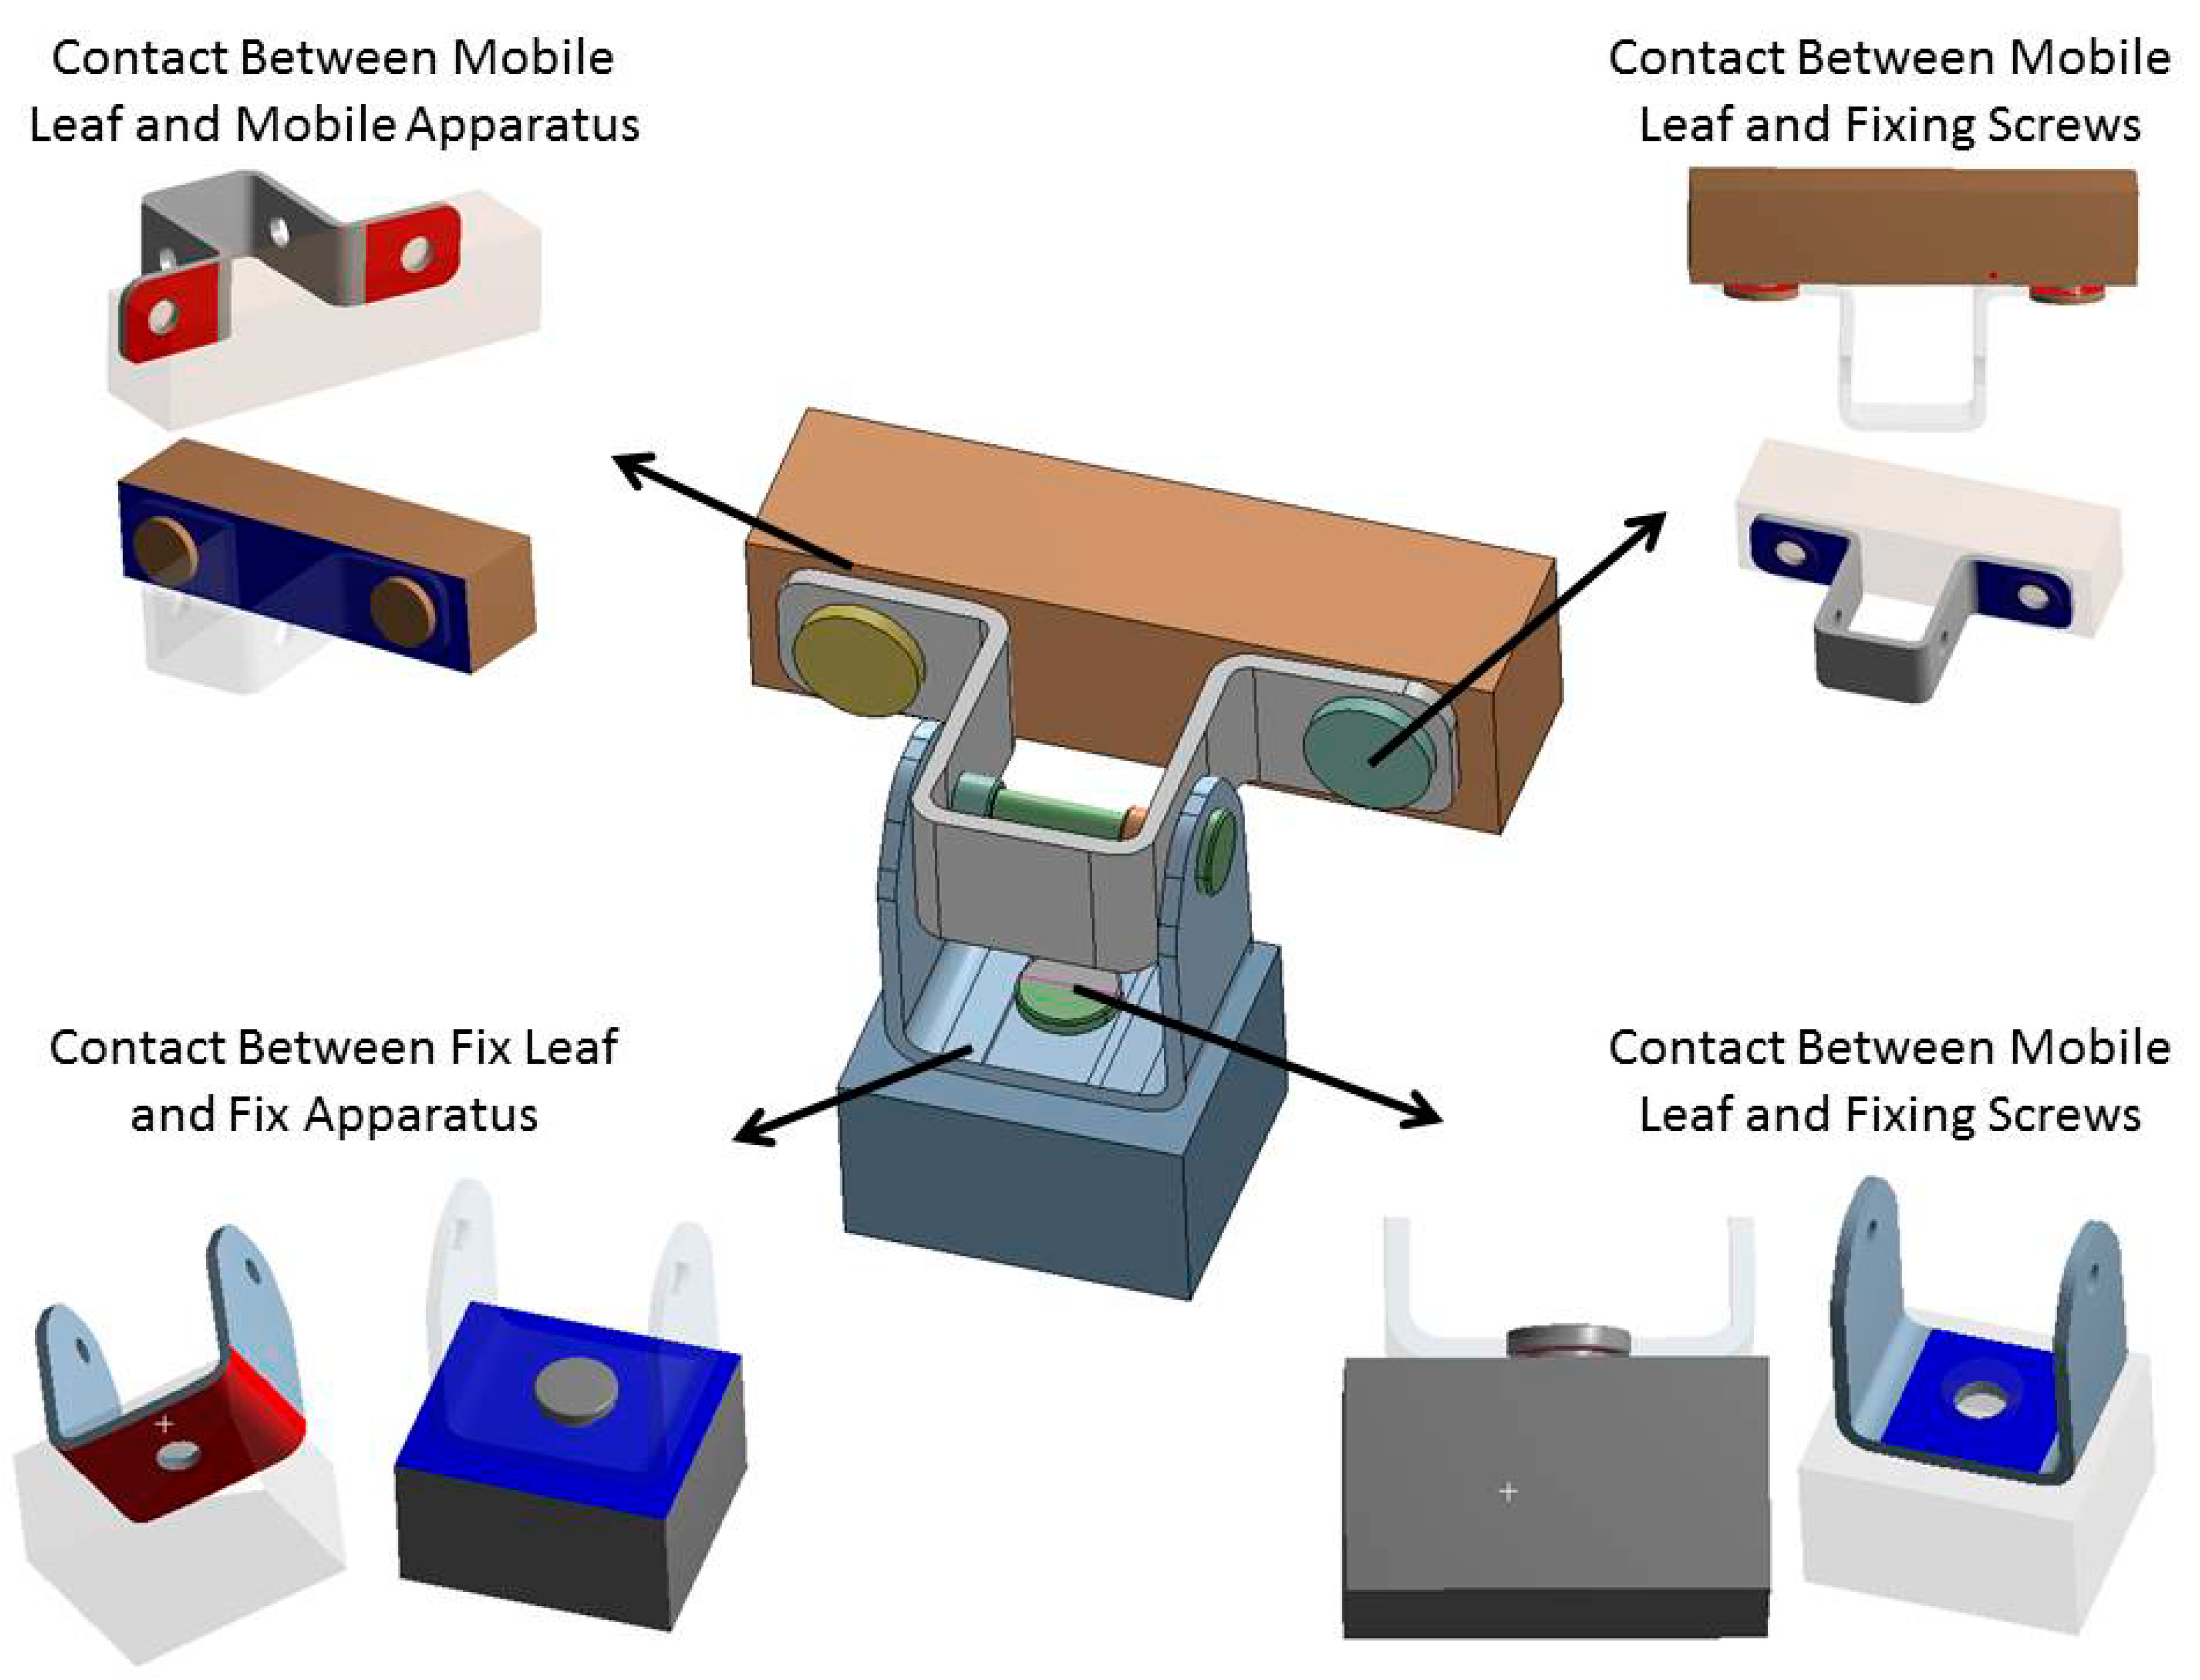
2.3.3. Contact Definition
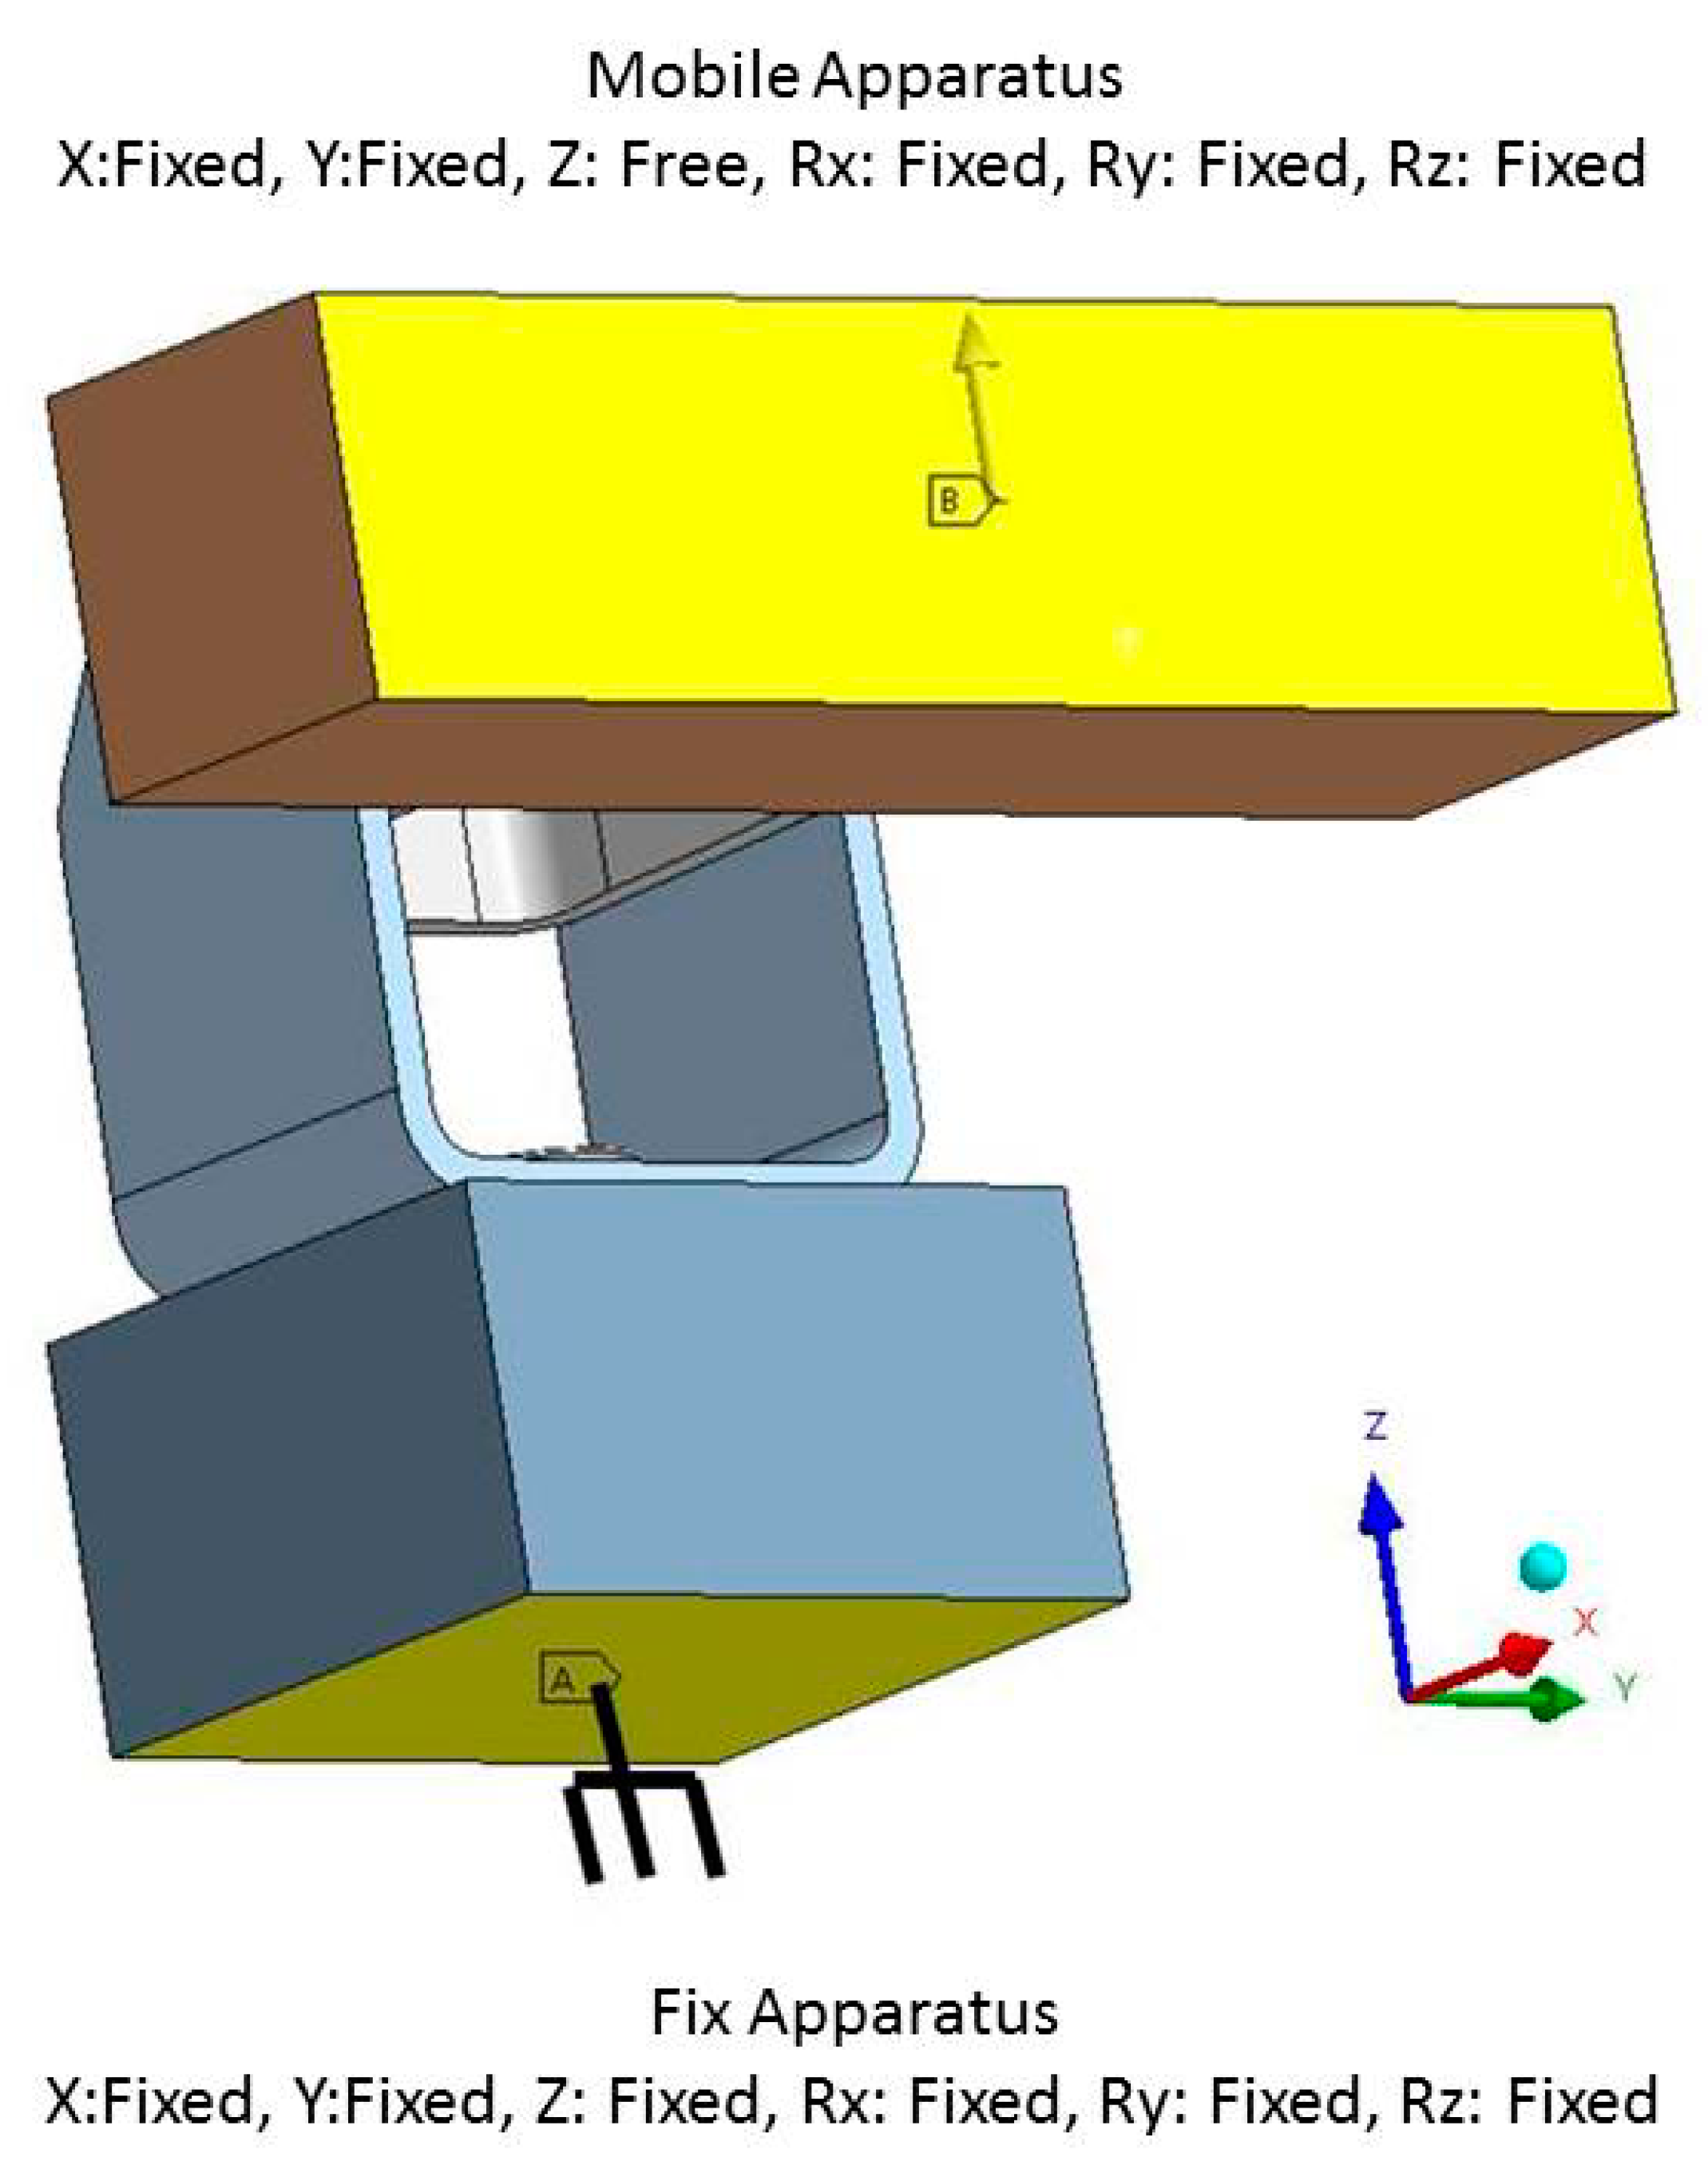
2.3.4. Boundary Conditions
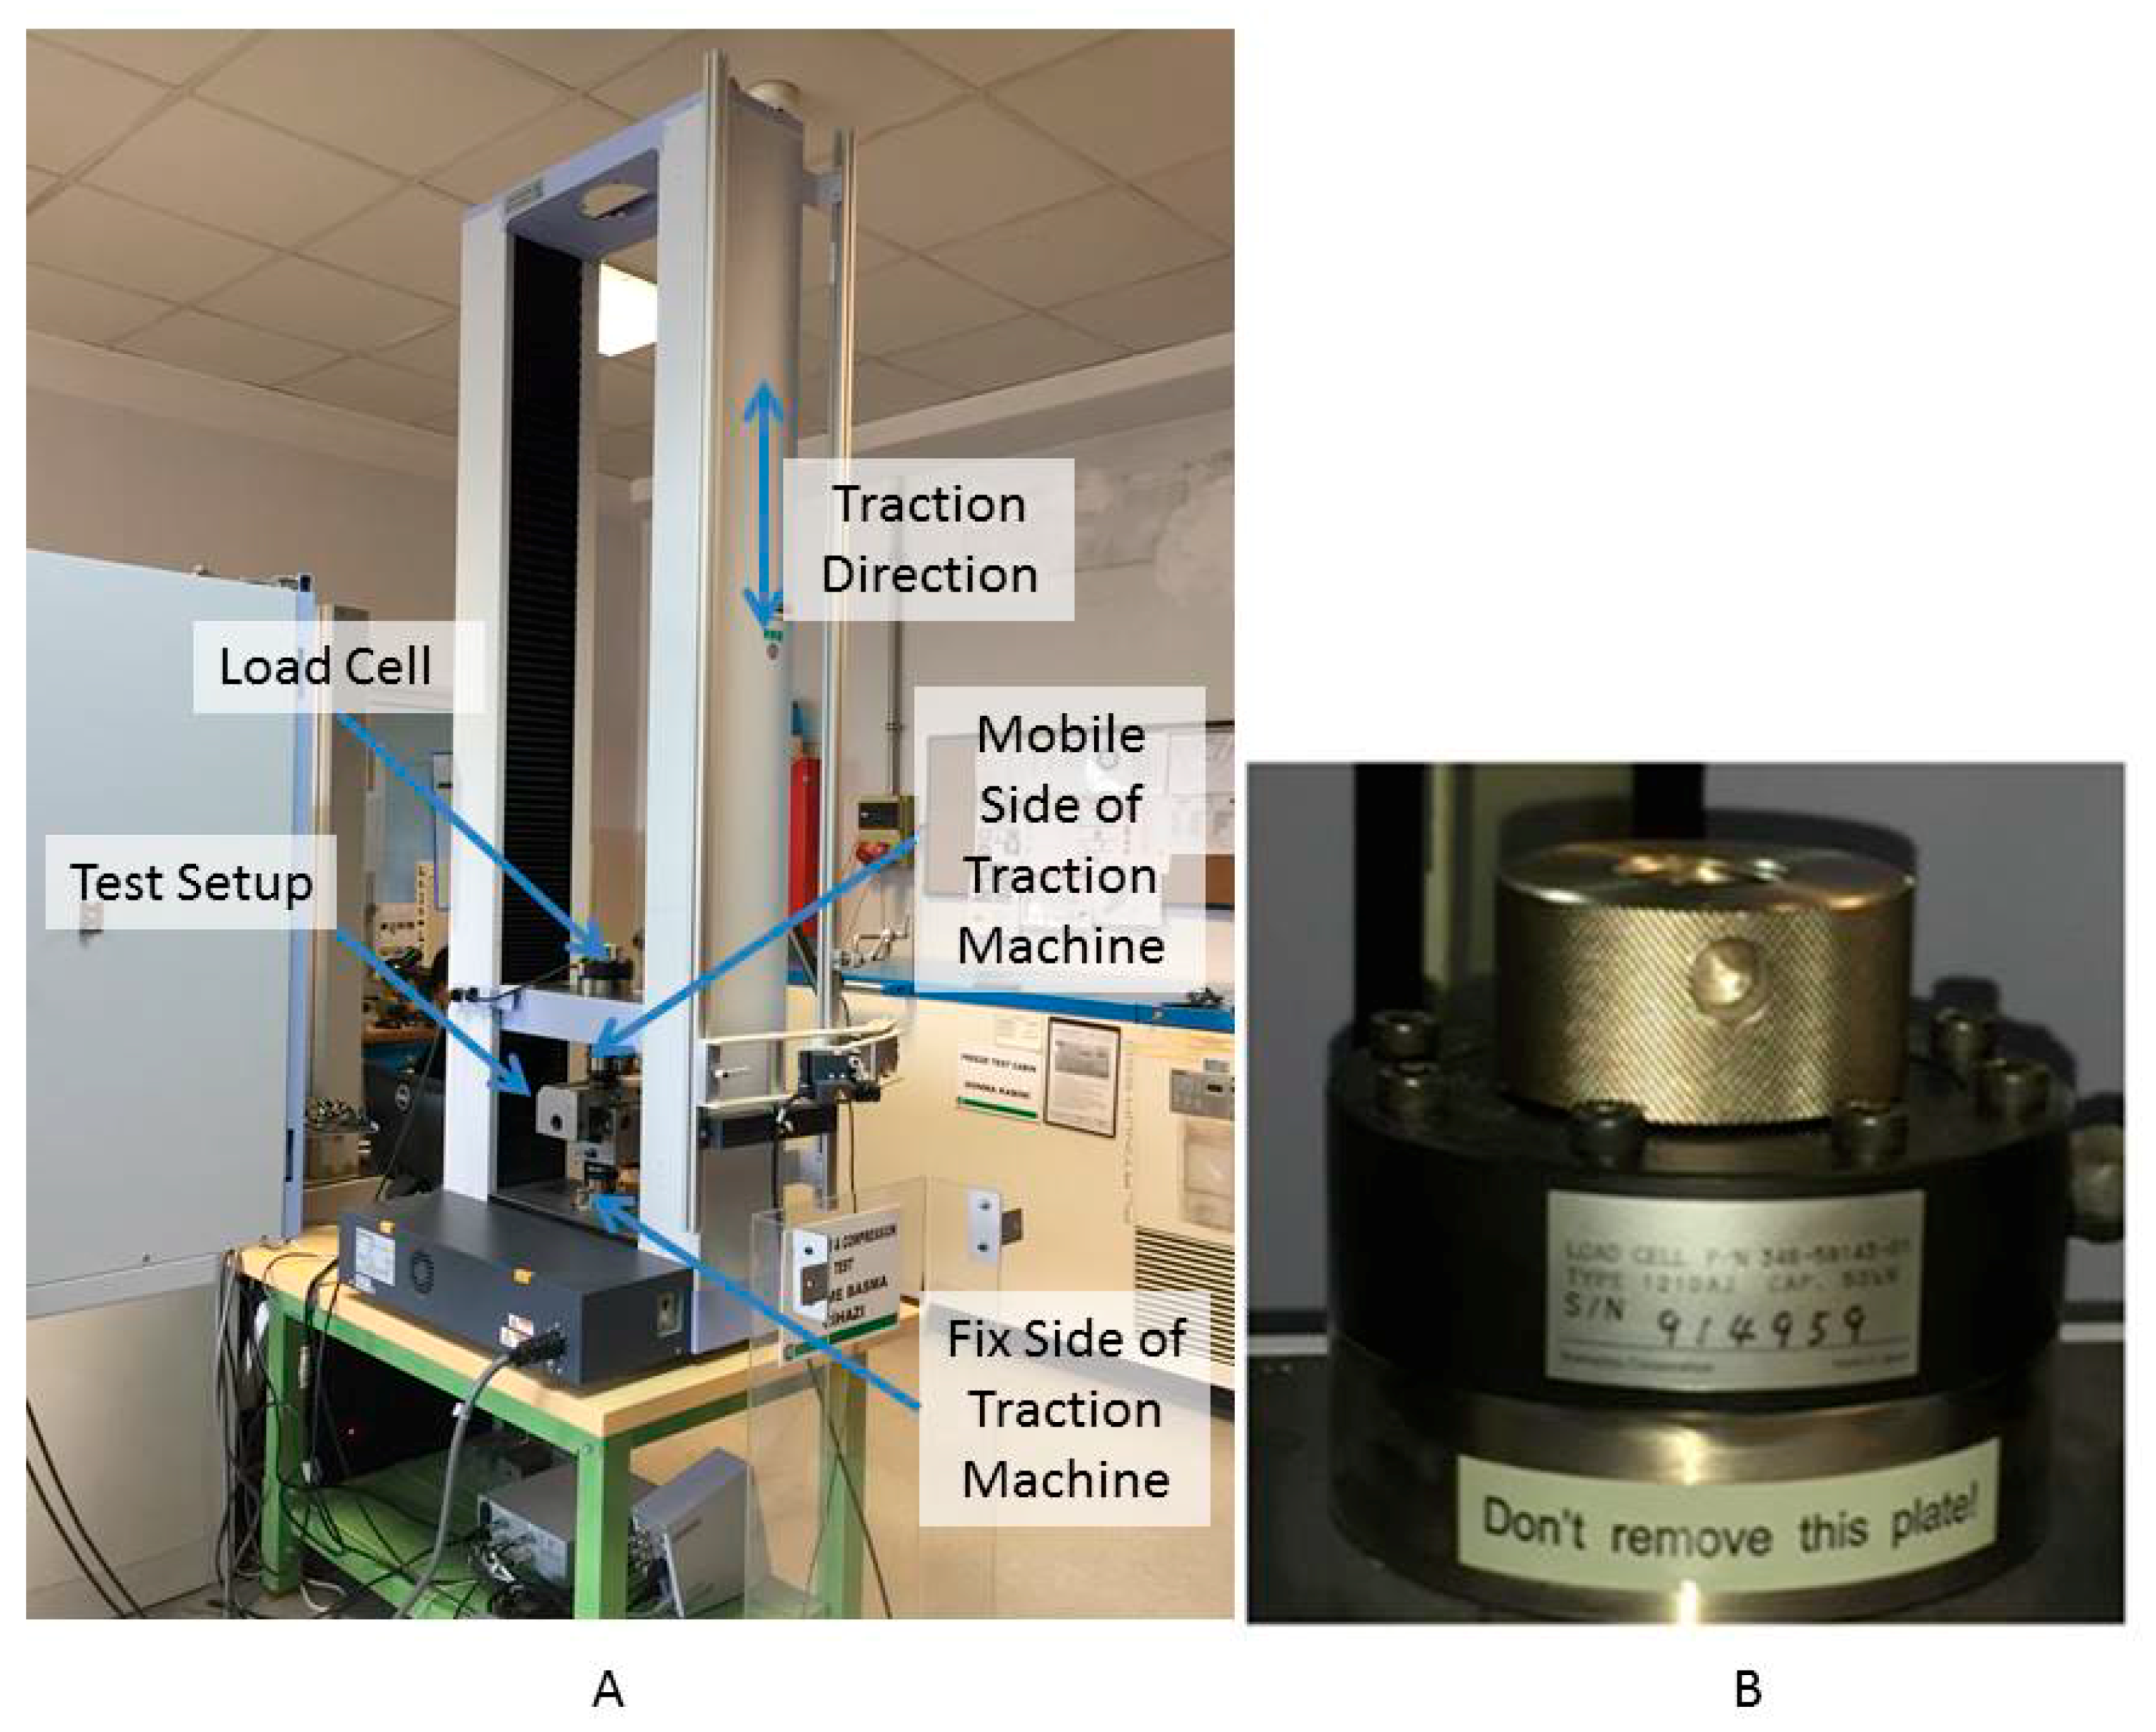
2.4. Experimental Tests
3. Results and Discussion
3.1. Phase-1
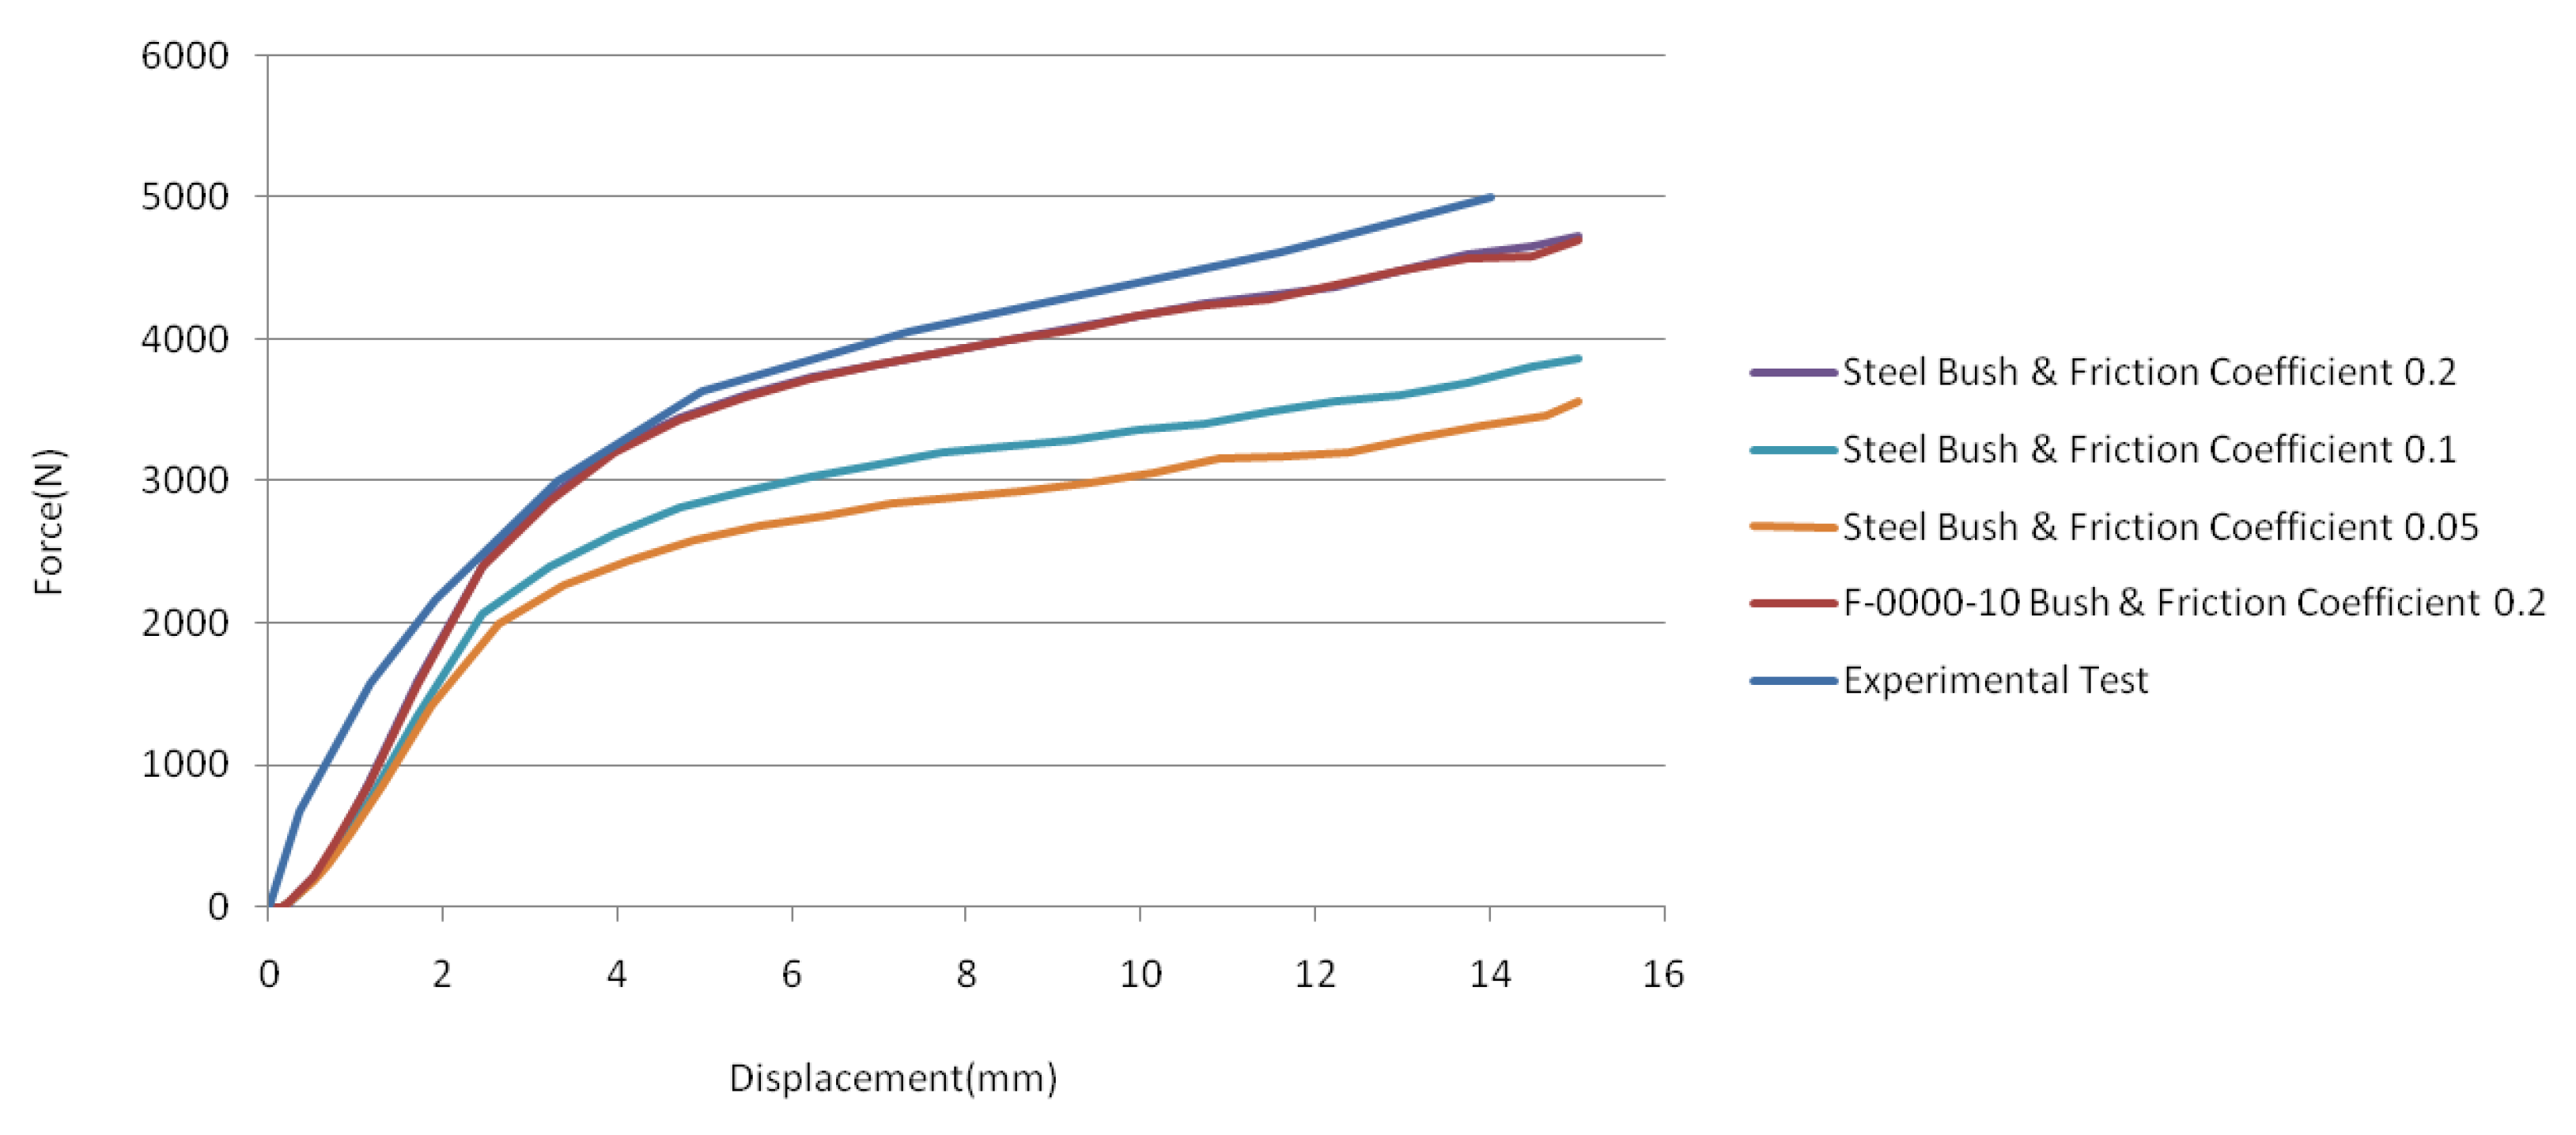
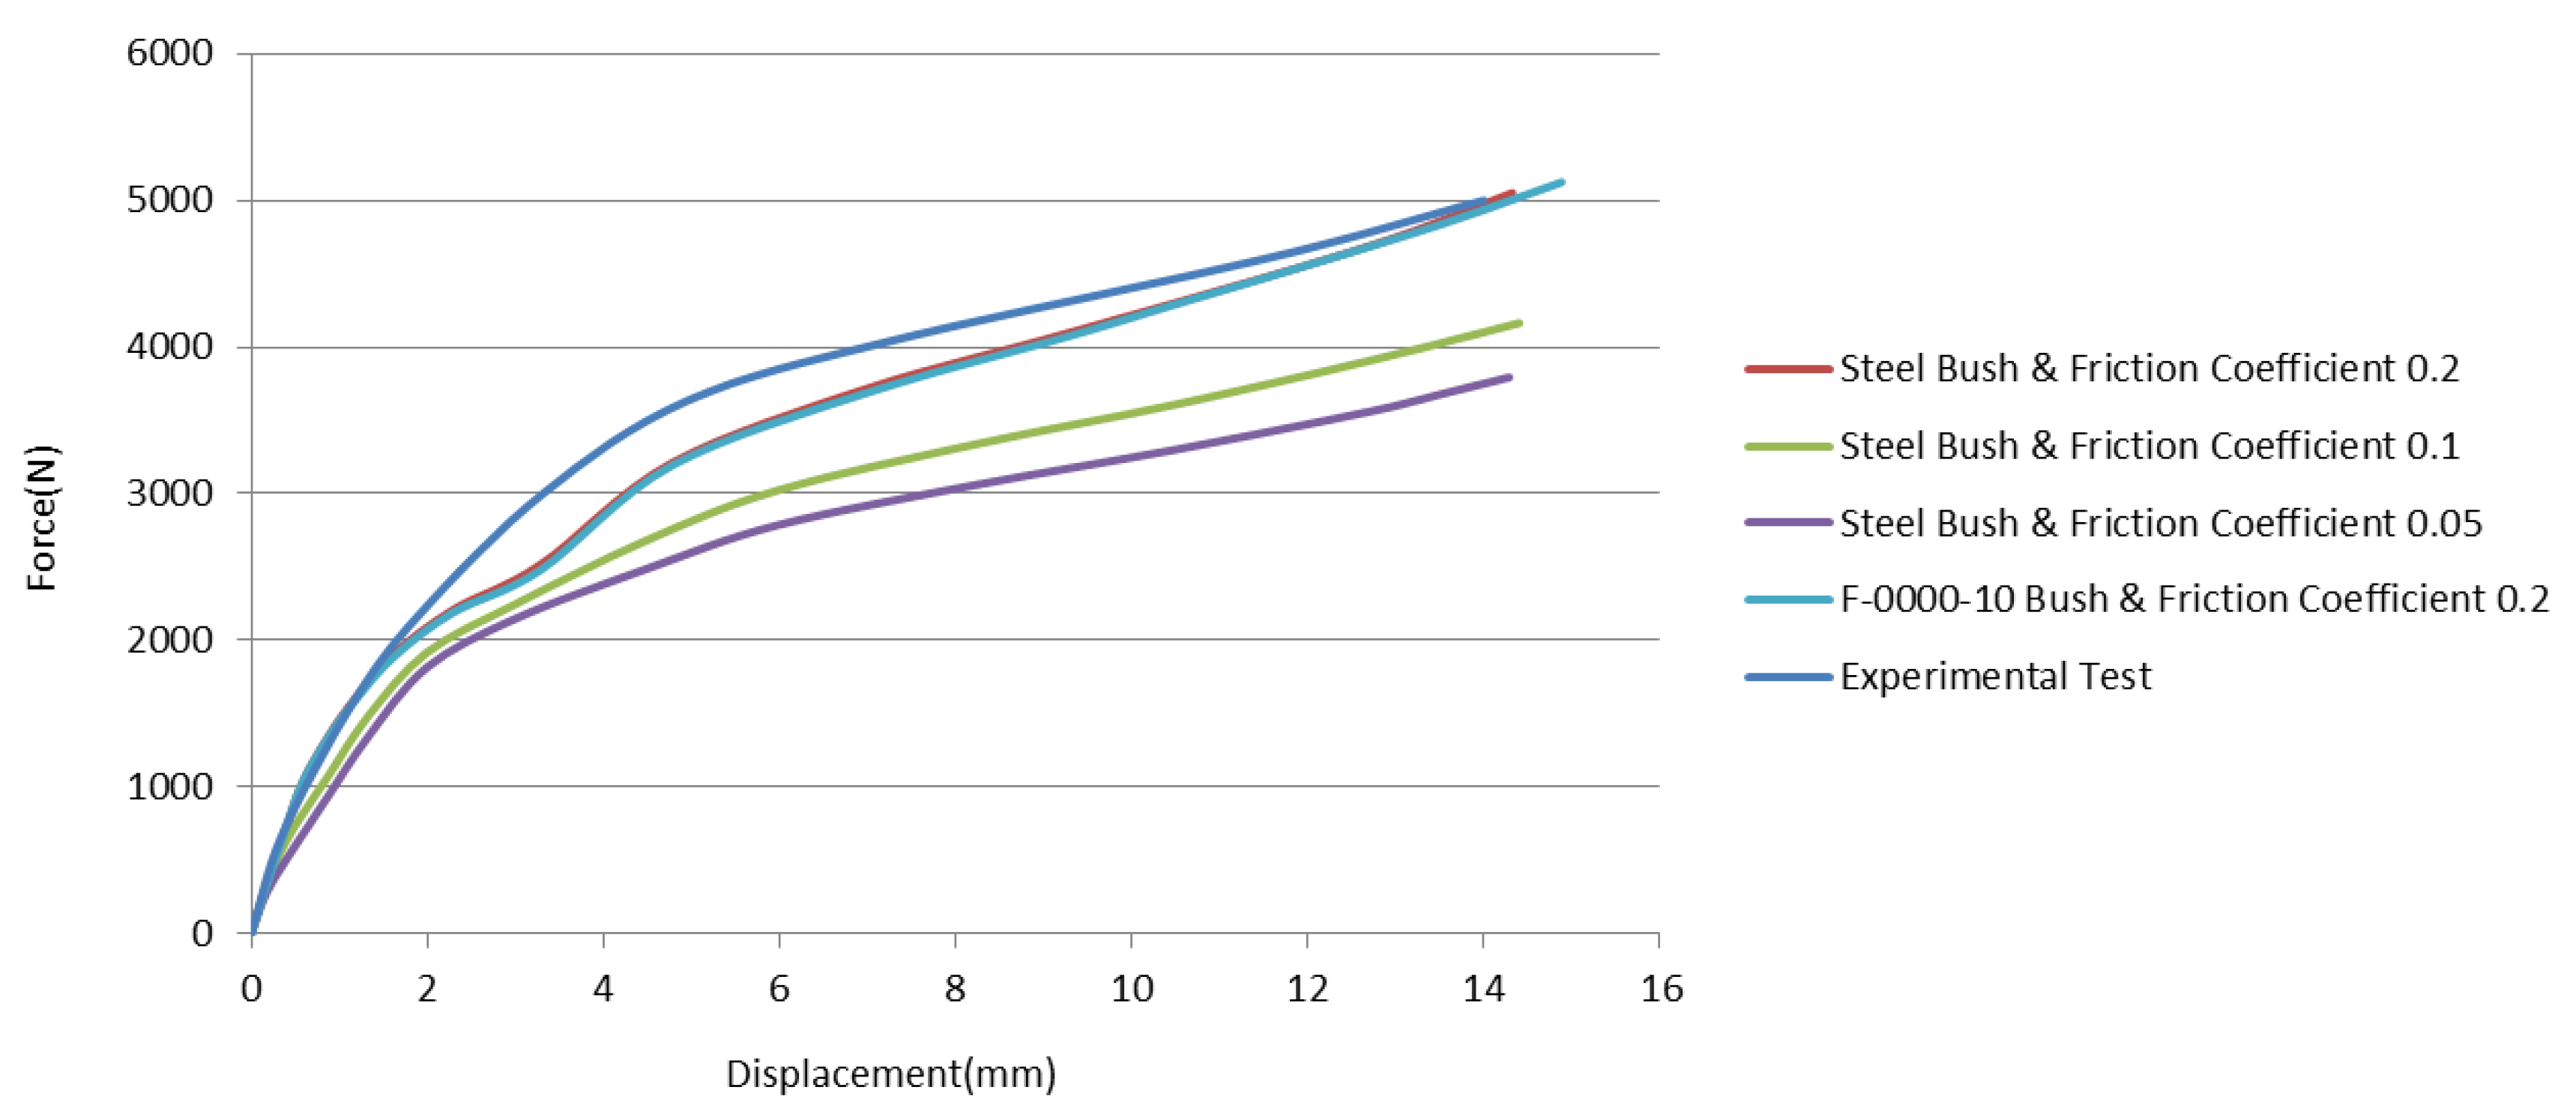
Friction Coefficient and Bush Material Effects for Z-Direction Loading
3.2. Phase-2
Friction Coefficient and Bush Material Effects for Z-Direction Loading
4. Conclusions
Author Contributions
Funding
Conflicts of Interest
References
- Dogan, S.; Guven, C.; Karpat, F.; Dogan, O.; Yilmaz, T.G. Experimental Verification and Finite Element Analysis of Automotive Door Hinge. In Proceedings of the ASME 2014 International Mechanical Engineering Congress and Exposition, Montreal, QC, Canada, 14–20 November 2014. [Google Scholar] [CrossRef]
- More, N.D.; Jadhav, T.A. Stress Analysis and Optimization of Car Door Hinge. Available online: http://www.ierjournal.org/mit.php (accessed on 12 October 2018).
- United Nations Economic Commission for Europe (UNECE). Available online: https://www.unece.org/fileadmin/DAM/trans/main/wp29/wp29regs/2013/R011r2e.pdf (accessed on 9 October 2018).
- Tufekci, M.; Yılmaz, T.G.; Yüce, C.; Dogan, O.; Karpat, F. Otomobil kapi mentesesinin bilgisayar destekli tasarimi, Analizi ve Doğrulanması; Otomotiv ve Yan Sanayi Sempozyumu ve Sergisi: İstanbul, Türkiye, 2015. [Google Scholar]
- Tufekci, M.; Karpat, F.; Yuce, C.; Dogan, O.; Yilmaz, T.G.; Kaya, N. Design optimization of aluminum hinge parts for lightweight vehicles: Performance, durability and manufacturability. Int. J. Mech. Prod. Eng. 2015, 3, 6–13. [Google Scholar]
- Yılmaz, T.G.; Tufekci, M.; Karpat, F. A study of lightweight door hinges of commercial vehicles using aluminum instead of steel for sustainable transportation. Sustainability 2017, 9, 1661. [Google Scholar] [CrossRef]
- Bayraktar, M.; Bilyaz, H.; Demir, C. Kinematic, kinetic and fatigue analyses of cup hinge with brake. Sak. Univ. J. Sci. 2018, 2. [Google Scholar] [CrossRef]
- Toan, N.D.; Seogou, C.; Junyoung, P.; Yeongsung, S.; Youngsuk, K. Finite element method simulations to improve press formability of door hinge. J. Mater. Eng. Perform. 2008, 18, 1005–1011. [Google Scholar] [CrossRef]
- Darwish, S.; Hussein, H.M.A.; Gemeal, A. Numerical study of automotive doors. Int. J. Eng. Technol. 2012, 12, 82–92. [Google Scholar]
- Turna, Ş. Analysis of True Stress Constitutive Equations; Sakarya University: Sakarya, Turkey, 2008. [Google Scholar]
- Metal Powder Industries Federation Standard 35-SP. Available online: https://www.mpif.org/News/TabID/164/ArtMID/586/ArticleID/123/New-MPIF-Standad-35-Materials-Standard-Released.aspx (accessed on 8 May 2018).
- Ansys Mechanical Plasticity Material Model User Guide. Available online: https://www.sharcnet.ca/Software/Ansys/15.0.7/en-us/help/wb_sim/ds_plasticity.html (accessed on 8 March 2018).
- Ansys Mechanical Contact Definition User Guide. Available online: https://www.sharcnet.ca/Software/Ansys/16.2.3/en-us/help/wb_sim/ds_Contact_Definition.html (accessed on 1 October 2018).


| Material Name | FEA Material Models | Elasticity Modulus (MPa) | Yield Stress (MPa) | Rupture Stress (MPa) | Elongation (%) |
|---|---|---|---|---|---|
| Steel | Isotropic Linear | 200,000 | No Plasticity | No Limit | No Limit |
| F-0000-10 | Isotropic Non-linear | 96,500 | 89.6 | 124 | 0.02 |
| S355MC | Isotropic Non-Linear | 194,300 | 434.95 | 611.07 | 0.14 |
| 20MnB4 | Isotropic Non-Linear | 200,000 | 403.05 | 636.04 | 0.1486 |
| Simulation No | UNECE R11 Acceptance Criteria | Simulation Parameters | Results (mm) | Error (%) | |||
|---|---|---|---|---|---|---|---|
| Geometry | Friction Coefficient | Bush Material | Simulation | Experimental | |||
| 1 | No Separation at Hinge Leaves Under Required Effort | Perfect Geometrical Data | 0.2 | Linear Steel | 12.959 (No Separation) | 11.589 (No Separation) | 10.57 |
| 2 | Perfect Geometrical Data | 0.1 | Linear Steel | 16.5 (No Separation) | 29.76 | ||
| 3 | Perfect Geometrical Data | 0.05 | Linear Steel | 17.1 (No Separation) | 32.22 | ||
| 4 | Perfect Geometrical Data | 0.2 | F-0000-10 | 10.85 (No Separation) | 6.81 | ||
| 5 | 3D Scan | 0.2 | Linear Steel | 8.31 (No Separation) | 8.31 | ||
| 6 | 3D Scan | 0.1 | Linear Steel | 22.74 (No Separation) | 22.74 | ||
| 7 | 3D Scan | 0.05 | Linear Steel | 25.23 (No Separation) | 25.23 | ||
| 8 | 3D Scan | 0.2 | F-0000-10 | 6.24 (No Separation) | 6.24 | ||
© 2019 by the authors. Licensee MDPI, Basel, Switzerland. This article is an open access article distributed under the terms and conditions of the Creative Commons Attribution (CC BY) license (http://creativecommons.org/licenses/by/4.0/).
Share and Cite
Erol, O.; Güler Özgül, H. Determining Simulation Parameters of Prototype Door Hinge for Correlation between Simulation and Experimental Results in United Nations Economic Commission for Europe Regulation No: 11 Tests. Designs 2019, 3, 17. https://doi.org/10.3390/designs3010017
Erol O, Güler Özgül H. Determining Simulation Parameters of Prototype Door Hinge for Correlation between Simulation and Experimental Results in United Nations Economic Commission for Europe Regulation No: 11 Tests. Designs. 2019; 3(1):17. https://doi.org/10.3390/designs3010017
Chicago/Turabian StyleErol, Onur, and Hande Güler Özgül. 2019. "Determining Simulation Parameters of Prototype Door Hinge for Correlation between Simulation and Experimental Results in United Nations Economic Commission for Europe Regulation No: 11 Tests" Designs 3, no. 1: 17. https://doi.org/10.3390/designs3010017
APA StyleErol, O., & Güler Özgül, H. (2019). Determining Simulation Parameters of Prototype Door Hinge for Correlation between Simulation and Experimental Results in United Nations Economic Commission for Europe Regulation No: 11 Tests. Designs, 3(1), 17. https://doi.org/10.3390/designs3010017