Article

A Low-Cost Temperature-Controlled Chamber Fabricated for Materials Testing

by
Sabastine Chinedu Ezike
1,*,
Aderemi Babatunde Alabi
1,2,
Amarachukwu Nneka Ossai
1 and
Adebayo Olaniyi Aina
1
1
Department of Physics and Materials Science, Kwara State University, Malete 241104, Nigeria
2
Department of Physics, University of Ilorin, Ilorin 240103, Nigeria
*
Author to whom correspondence should be addressed.
Designs 2018, 2(3), 25; https://doi.org/10.3390/designs2030025
Submission received: 21 May 2018 / Revised: 4 July 2018 / Accepted: 12 July 2018 / Published: 22 July 2018

Abstract

:
This paper presents a low-cost temperature-controlled chamber based on the natural radiation principle. The temperature-controlled chamber assembled using a 1.0 mm thick aluminum sheet equipped with expanded polystyrene lagging material, temperature controller, K-type thermocouple and solid-state relay. A high precision temperature sensor (K-type thermocouple) attached to the sample under test (SUT) near the instrument’s measuring point gives a feedback signal to the temperature integrated derivative (TID) controller. The accuracy of temperature readings from the chamber investigated and the chamber itself, calibrated with temperature sensor by Fluke, show temperature readings that correspond to the set temperature values. In addition, perovskite thin film deposited on a glass substrate of 75 × 25 mm was tested and the temperature readings equally correspond to the temperature set values. This low-cost and low-energy-consumption chamber could use in laboratories in the developing world where there is scarce power supply.

Graphical Abstract

1. Introduction

A temperature controlled-chamber is an apparatus used to monitor the effects of temperature on the material under test. Manufacturing, engineering, food processing and packing industries carry out environmental tests. These climatic-related environmental tests are pressure, temperature, humidity and moisture, as well as mechanical environmental tests to ascertain the products’ performance in various conditions. Environmental related tests needed before releasing products to the market, to ensure that the company’s reputation is not negatively affected, or to avoid unnecessary cost if the manufactured products fail on the market.
Conventional temperature and humidity chambers are comprised of air circulating fans, refrigerator unit, electric heater and humidifier. The temperature and humidity chamber consumes much energy during its operation [1,2]. Studies show environment chambers with various devices, materials, and physical configurations. Leftcourt et al., (2001) designed and described the operating characteristics of an environmental chamber (7.4 × 10.5 × 3.4 m) which investigated the influence of gaseous emissions from animal housing facilities and manure processing technologies on environmental conditions. Here, mass airflow for the chamber was set in the range of 5.6 to 28.8—air exchange per hour and, with some limitations, measured and controlled within 1% of the set point [3]. The design and operating features of the temperature chamber equipped with temperature and humidity sensors, which accommodated forty-two rabbits, were attributed its dimension of 13 × 4.7 × 3.1 m. The system makes a decision within a minute and controlled by Arduino platform planned by its integrated development environment (IDE) software. Two experiments carried out based on (a) without rabbit; and (b) with rabbits, showed that the chamber provided precise temperature control during heat stress studies in rabbits [4]. In the work of Ashara et al., (2015) titled “Design and simulation of temperature control of chamber based on automatic fan speed control”, the inner temperature of fabricated chamber automatically determines the speed of an electric fan. Sensor and microcontroller, fan and interface circuit are the components of the chamber. It works in a way that, when the inner temperature of the chamber is above the set value by the user, the fan would automatically trigger ON, and if below the set temperature value, the fan goes OFF [5]. Enjing et al., (2014) successfully used a platinum resistance temperature sensor in a designed chamber to test temperature. Single-chip computers processed data and the control circuit heated up according to the predictive control model. The system can set the preset temperature through the keyboard on the instrument panel and the displayed shows the temperature for real-time in the test chamber [6]. Mensah and Choi (2017), adopted a variable speed compressor to the refrigerating unit in a temperature and humidity chamber. The energy consumption in the chamber reduced, and temperature and humidity achieved stability, according to the increment of temperature setting in the chamber [1]. Feng et al., (2015), developed a low-cost integrated constant-temperature chamber with high precision, based on the natural convection principle. The chamber has low energy consumption, and is both less expensive and easily assembled [7].
The National Institute of Standard and Technology (NIST), which minimized the measurement uncertainty of an invented molecular measuring machine [8], developed a spherical temperature chamber with a multiplayer. They reported that stable temperature of 20 ± 0.001 °C achieved when the room maintained at 17 ± 0.01 °C. Billionth Uncertainty Precision Engineering (BUPE) constructed a high-precision constant-temperature chamber for an ultra-precision coordinate-measuring machine [9]. The cuboid-shaped chamber divides into four layers. They include an adiabatic layer, an acoustic insulation layer, a vacuum layer, and a measuring layer. The stability performance of temperature in the measurement layer reached 20 ± 0.001 °C. Many other research institutes have studied the temperature-controlled environment for nanotechnology application [10].
Here, we present a fabricated and calibrated low-cost temperature-controlled chamber that uses an electric filament bulb, rather than a metal halide lamp.

2. Materials and Methods

This section lists the tools and equipment used in this research and provides explanation of the methods employed in this research.

2.1. Materials Selection

The temperature environmental chamber is an enclosed box where the temperature was controlled. During the fabrication of the chamber, 1 mm thick of aluminum sheet was the case of the chamber. In addition, resistant to corrosion and being relatively cheap was the reasons behind its consideration. Filament bulbs (40 W each) (Global Sources, ShenZhen, China) provided the heat in the chamber. The window of the chamber is the transparent perspex glass (Lucite International, Darwin, United Kingdom). Rubber Fitting (Shenzhen Hon Ye Jie Technology com., Ltd, Shenzhen, Guangdong, China) placed on the front wall of the chamber created airtight with the door chamber and reduced heat losses. Expanded polystyrene (Polymer Technology and Services, Southpark Dr, Murfreesboro, TN, USA) was the lagging material on the outer walls of the inner chamber. Polystyrene foams are good thermal insulators [11] and have low thermal conductivity (0.032–0.033 Wm−1 K−1), low weight [12], low cost and melting point temperature of ~240 °C. RTV Silicone Sealant (ABRO 2000, South Bend, IN, USA) was an epoxy material on glass and rubber. It stacked together with the outer surface of the inner chamber and the expanded polystyrene (lagging) materials. Figure S1 shows the image of both Silicone sealant and Polystyrene materials.
A wooden bar (Mechanical laboratory, Malete, Nigeria) reinforced the door of the chamber. Its thickness size, availability and low cost contributed in selection of this material. A galvanized flat (Liaocheng Xinzheng Steel Co. Ltd, Shandong, China) bar reinforce the wall of the outer chamber. The choice of this material depended on its rigidity, which strengthened the walls of the Aluminum sheet. Temperature Controller), Solid State Relay and K-type thermocouple (Focus Sensing and Control Technology co., Ltd, Hefei, Anhui, China) controls, switches and detects, respectively, the temperature required in the chamber. Temperature Controller has display range of −199~1800 °C and the power consumption ≤5VA. Figure S2 shows the image of temperature controller/solid state relay/thermocouple (temperature sensor).
We considered the number and size of samples, dimension of filament bulbs and thermocouple during the design of the chamber. This chamber’s design meets test samples size of each dimension 20 × 20 mm and the space between one sample and another was 20 mm. The lengths of thermocouple and filament bulbs were 180 mm and 95 mm, respectively.

2.2. Fabrication Analysis

There was consideration of giving gap between two filament bulbs, of each dimension 95 mm, placed opposite to each other in the chamber to avoid touching. This made the choice of the chamber having dimensions of 210 × 260 × 360 mm where 210 × 260 mm is the base area. The length and width of the base area of the chamber are 260 and 210 mm, respectively.
The base area of the chamber was 54,600 mm2 considering the sample dimensions of 20 mm × 20 mm. The base of the chamber accommodated Six (6) samples placed along its length. The space occupied in the chamber by the samples was 39,600 mm2. The area of the chamber not occupied by the samples was 15,000 mm2.
The required temperature required in the chamber was determined using Stefan–Boltzmann’s law of thermal conductivity [13] as stated in Equation (1).
P = δAεT4
where δ is the Stefan’s constant (5.6696 × 10⁻⁸ W/(m2 K4), ε is the emissivity constant of material (aluminum) which is 0.025 [14], T is the temperature of aluminum surface in Kelvin (K), P is the power radiated in the filament bulbs and A, is the surface area of the aluminum material which is 0.0378 m2. The temperature radiated from three filament bulbs (120 W) in the chamber was calculated, using Equation (1) stated above, as 1223.38 K.
Equation (2) is Fourier law [15] used to calculate the power losses in the chamber.
P = kA∆Tt
The thermal conductivity of the expanded polystyrene is k (0.033 WmK). P is the power loss in the chamber while t is thickness of the expanded polystyrene material with thickness of 100 mm. A is the area of the expanded polystyrene material which comprises the area of the outer wall of the chamber with area of 447,400 m2, and ∆T is the temperature difference between the inside and outside the lagging material. The temperature difference was 100 K. Then, power loss via the cladding was 14.77 W. The power used in the chamber was 105.229 W. The duration (t) of battery rated 100 AH–12 V (Shenzhen Eagle Battery Co., Ltd, Shenzhen, Guangdong, China), calculated using Equation (3):
t = E P
where E is the electrical energy and P is the power. It shows that the battery connected to inverter (Luminous Power Technologies Ltd, Gurgaon, Haryana, India) could last for 10 h before discharging completely.
The electric circuit of the chamber comprises temperature controller, electric filament bulbs, solid-state relay, K-type thermocouple and wires (Cutix Plc., Nnewi, Nigeria) shown in Figure 1. Electrical filament bulb illuminates the perovskite thin films in the chamber. The amount of temperature received by the perovskite thin films relayed to the temperature controller by solid-state relay. K-type thermometer detects the thin films is displayed on the board of temperature controller.

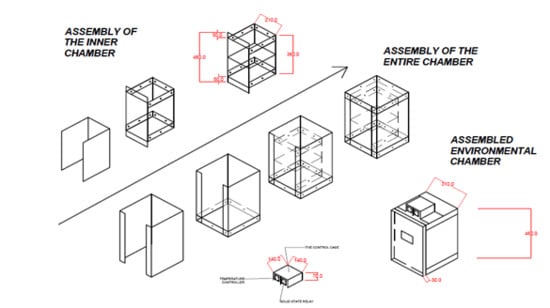
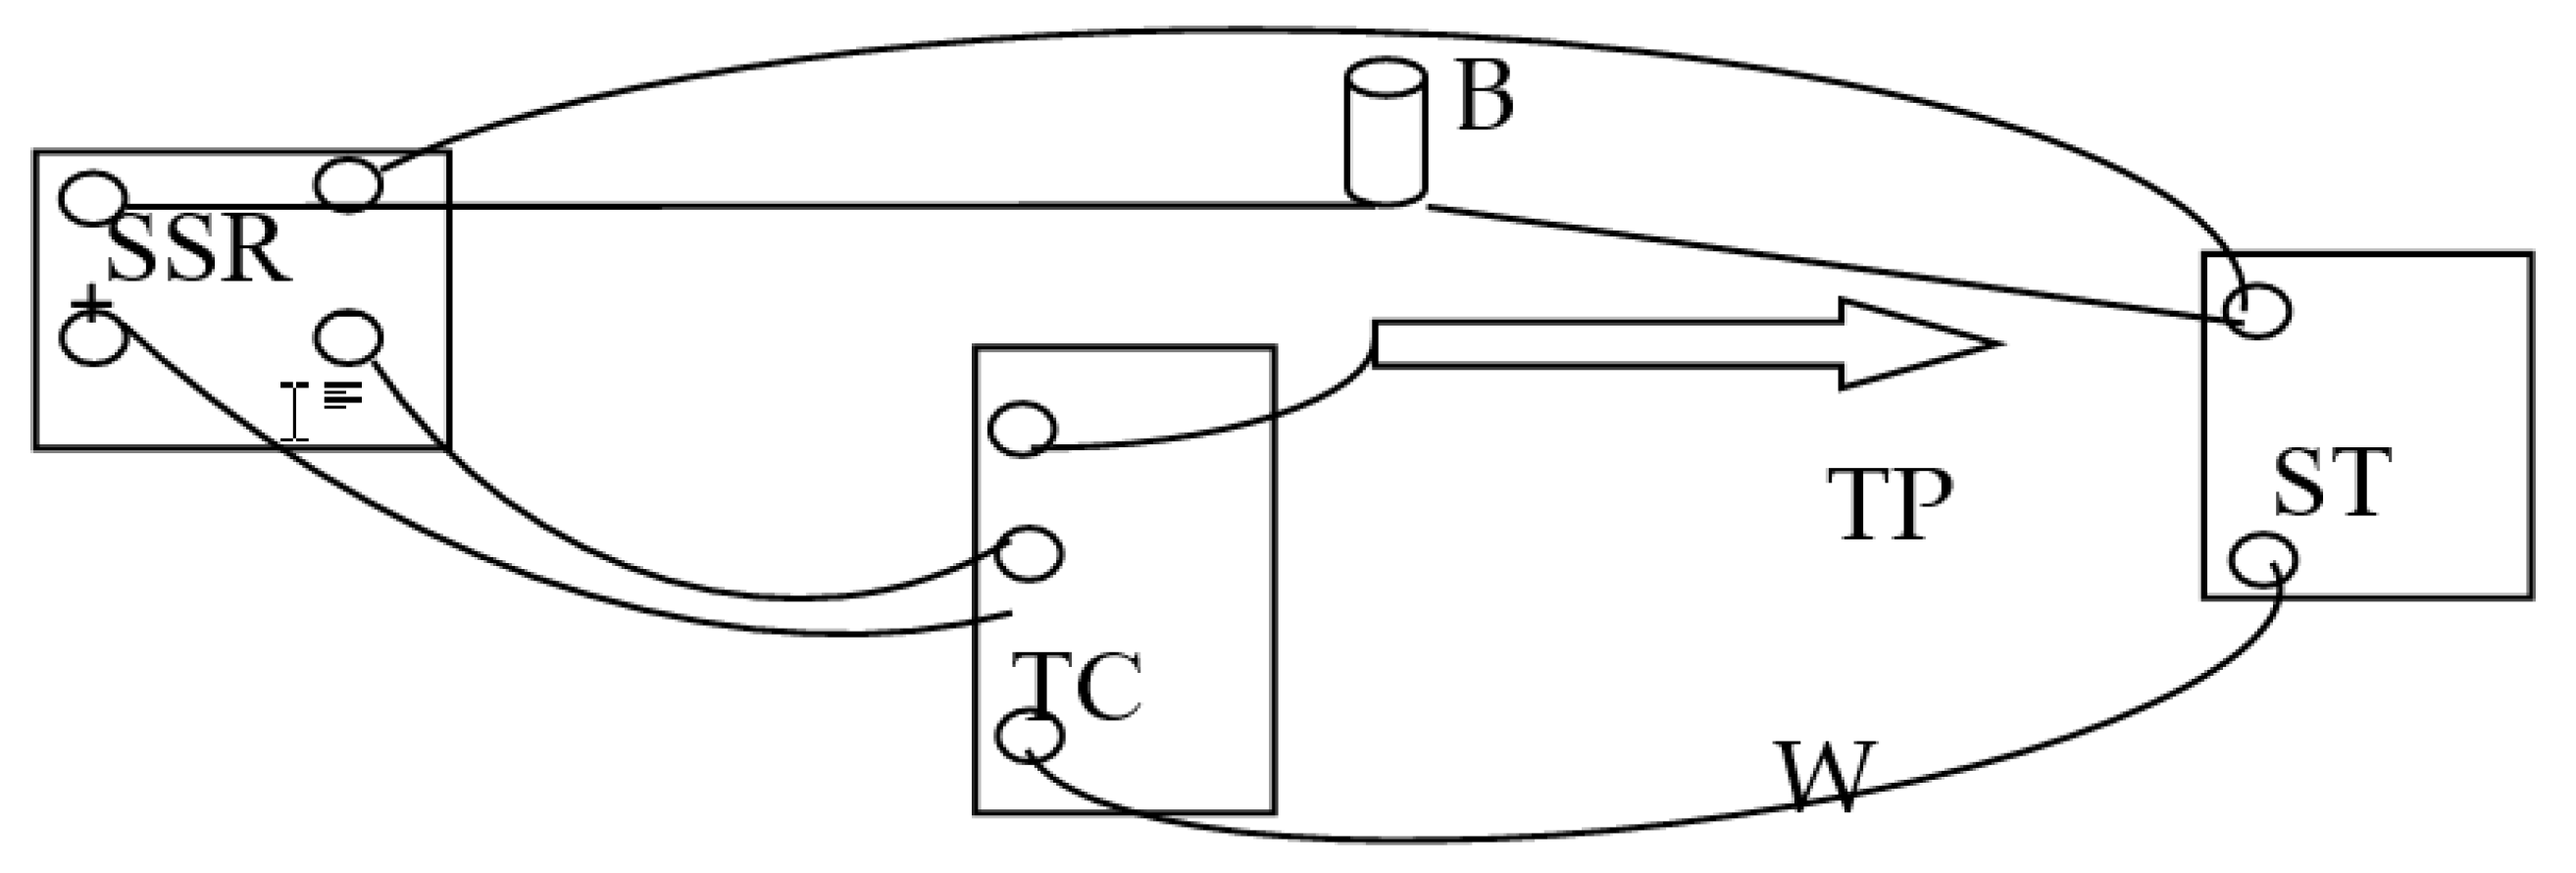
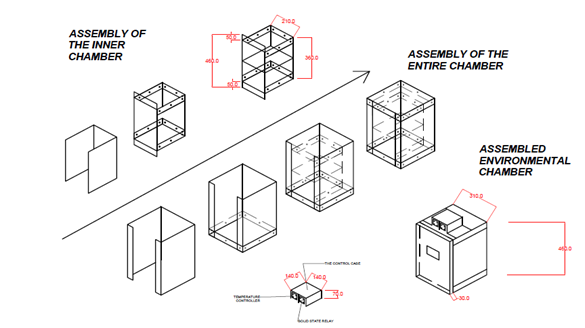
2.3. Chamber Development

Development of the chamber began with the surface development of the casings, which comprises the inner and outer casings of the chamber. Here, the surface development of inner casing of dimension 730 × 360 mm and the aluminum sheet was marked out into three as shown in Figure S3.
The end parts of the marked out aluminum sheet were folded with the help of 40” metal folding machine (3-In-1/1.0 × 1016 ) as shown in Figure S4. The dimension of inner casing was 360 × 210 mm after folded.
The top and bottom covers of the chamber, with dimensions of 360 × 310 mm, was marked out and cut off from aluminum sheet. At the corners of the cut off aluminum sheet, 50 mm removed and the edges folded as shown in Figure S5. Also, the intermediate base was marked out with dimensions of 260 × 210 mm. Outer casing and top/bottom covers of the chamber developed in the same way as described in the case of the inner casing in Figure S3. The dimensions of the outer casing and covers (bottom and top) are 460 × 310 mm and 410 × 410 mm, respectively as shown in Figure S5. The dotted points on the marked out aluminum sheet are for riveting. The chamber was rivet using hand drilling machine with right drill bit.
The door of the chamber was fabricated using aluminum sheet of 620 × 470 mm dimensions. At the edges of the aluminum sheet, 80 mm was cut-off and it formed window of 110 × 70 mm as in the Figure S6. The back cover of the chamber formed from a sheet of aluminum of 460 × 310 mm. Finally, we inserted wooden bar at the folded region of the door to strengthen it.
During chamber fabrication, we deployed K-type thermocouple of 2 mm diameter in the chamber at 2.5 mm above the intermediate base of the chamber. The essence of deploying thermocouple at the position was to have contact with the perovskite thin film material under test. The material to be tested is perovskite thin-film (500 nm thick) deposited on 1 mm thick glass substrate.

3. Results

3.1. Functional Constructed Chamber

The constructed and functional temperature chamber is as shown in Figure S7. Table 1 shows the respective costs of materials used in chamber fabrication. The total cost of fabricating the chamber is about three hundred and sixty five Dollars ($365.24). Unlike the cost of conventional temperature controlled chambers, the cost of the fabricated chamber is very cheap.

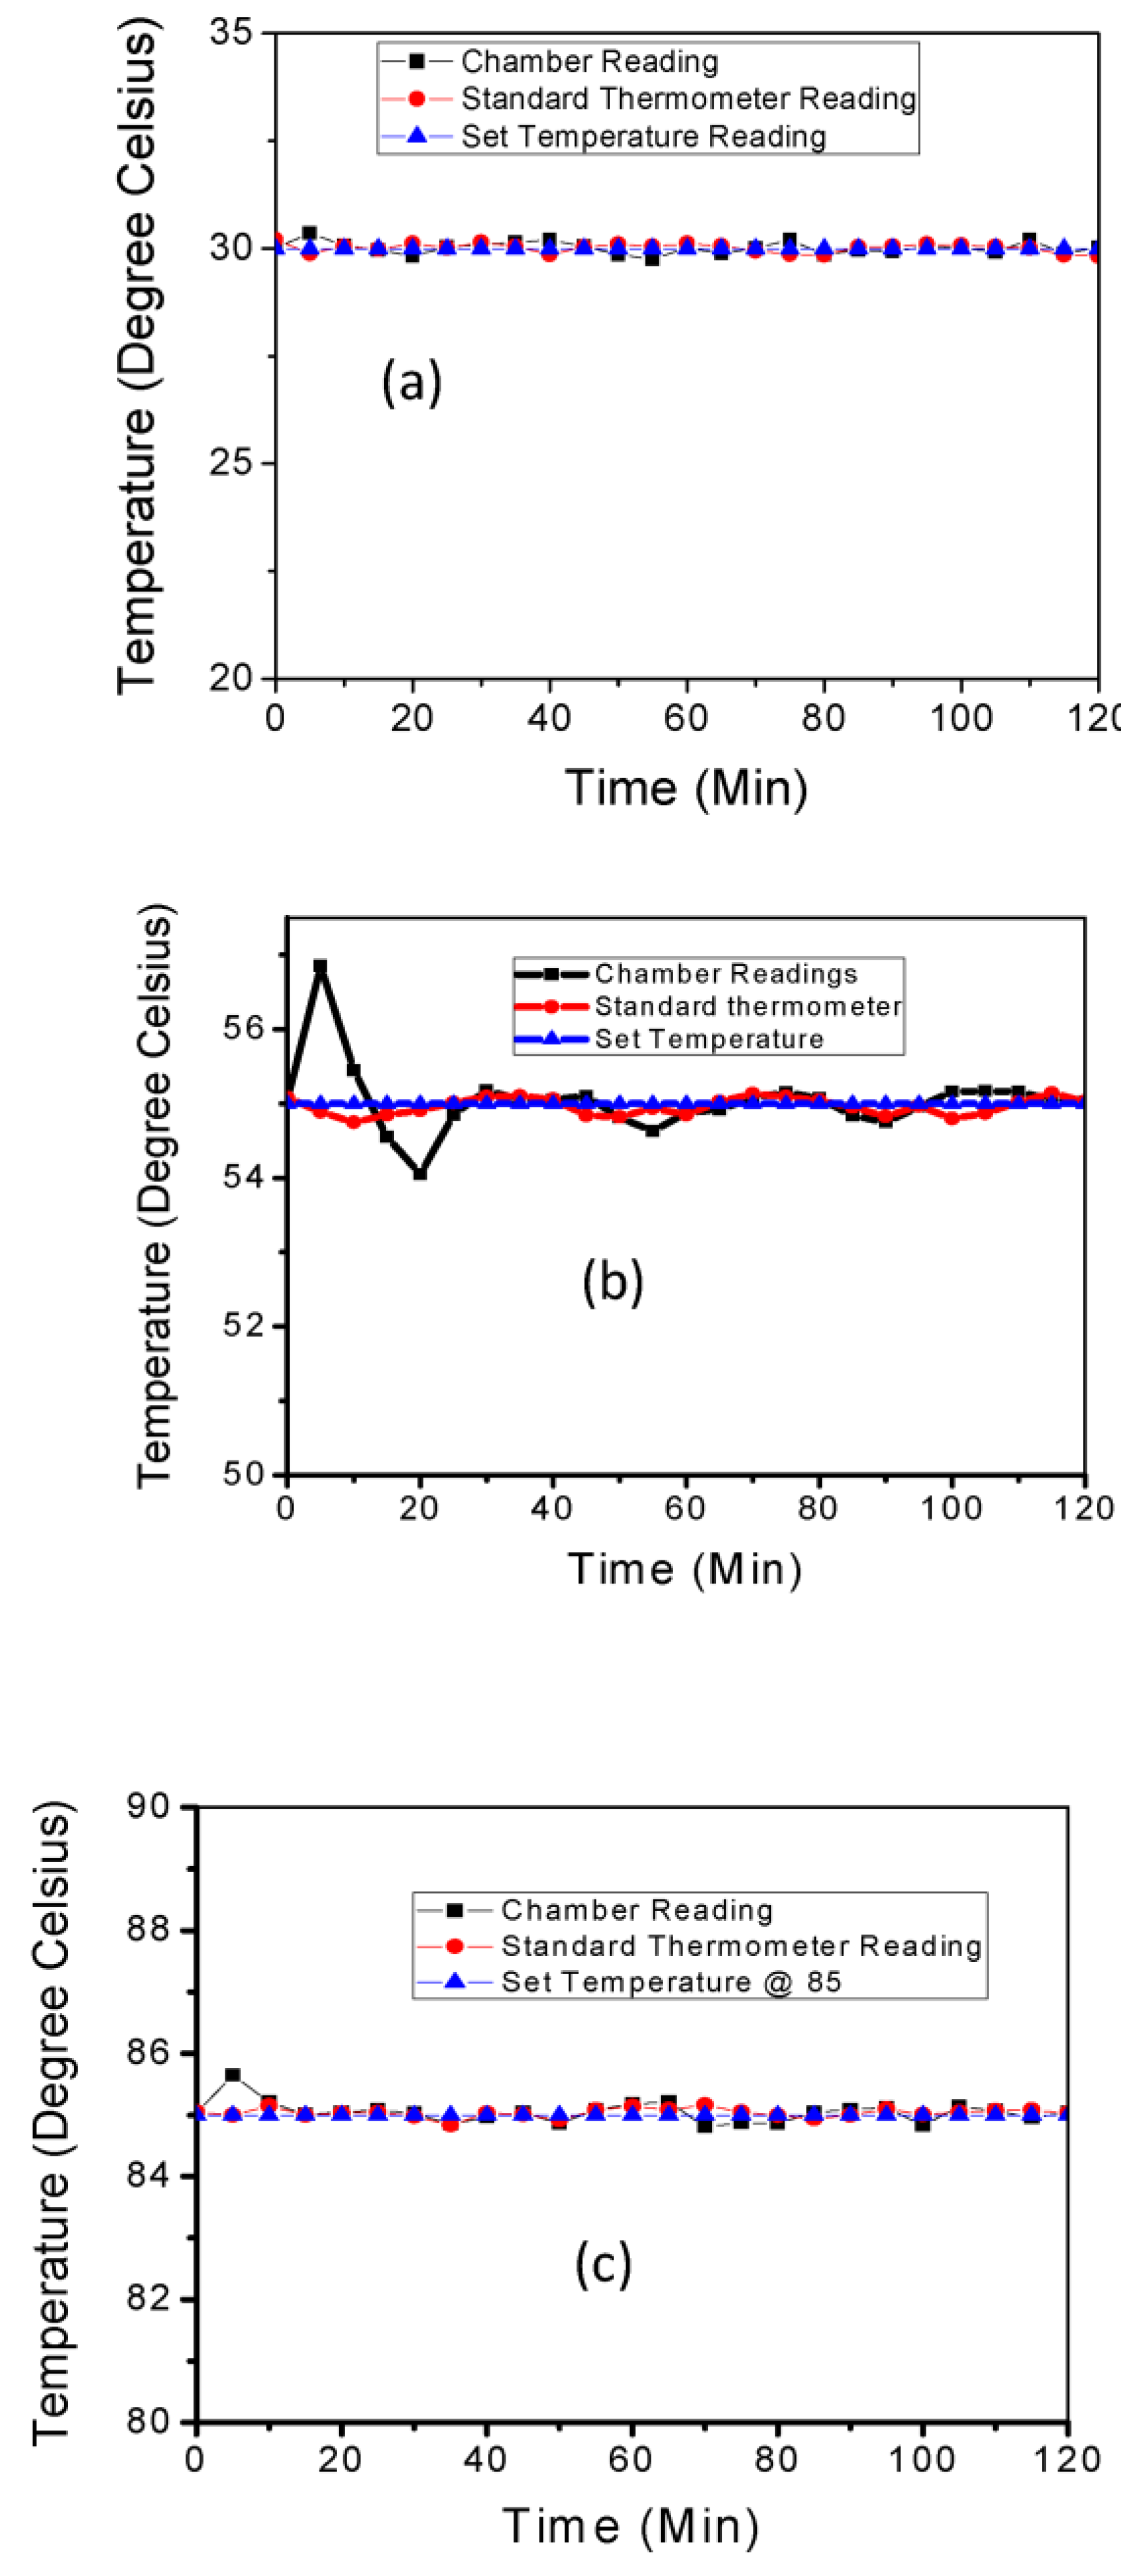
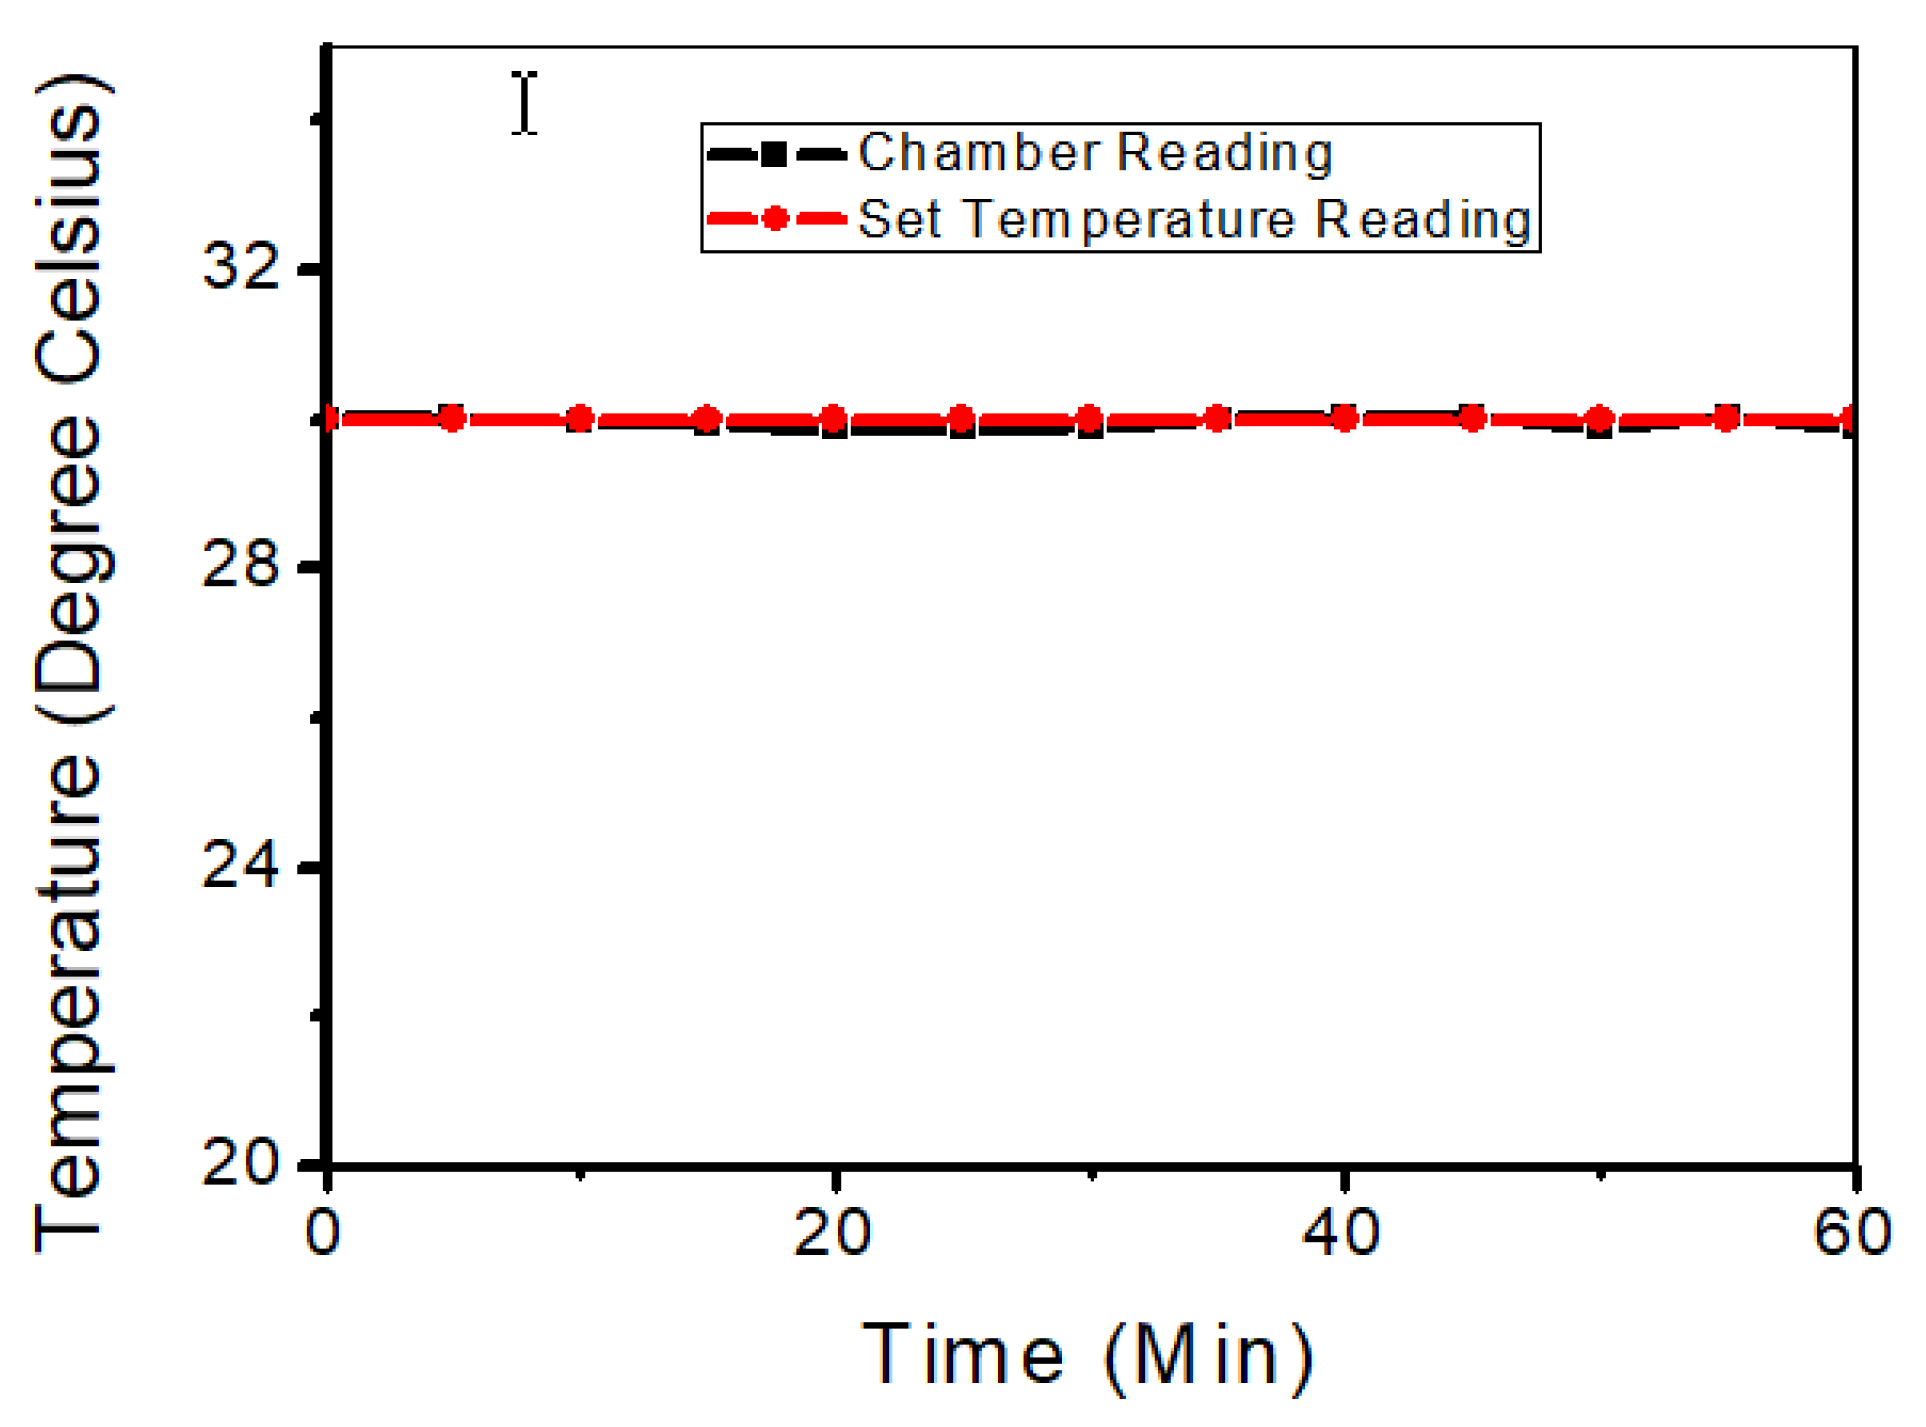
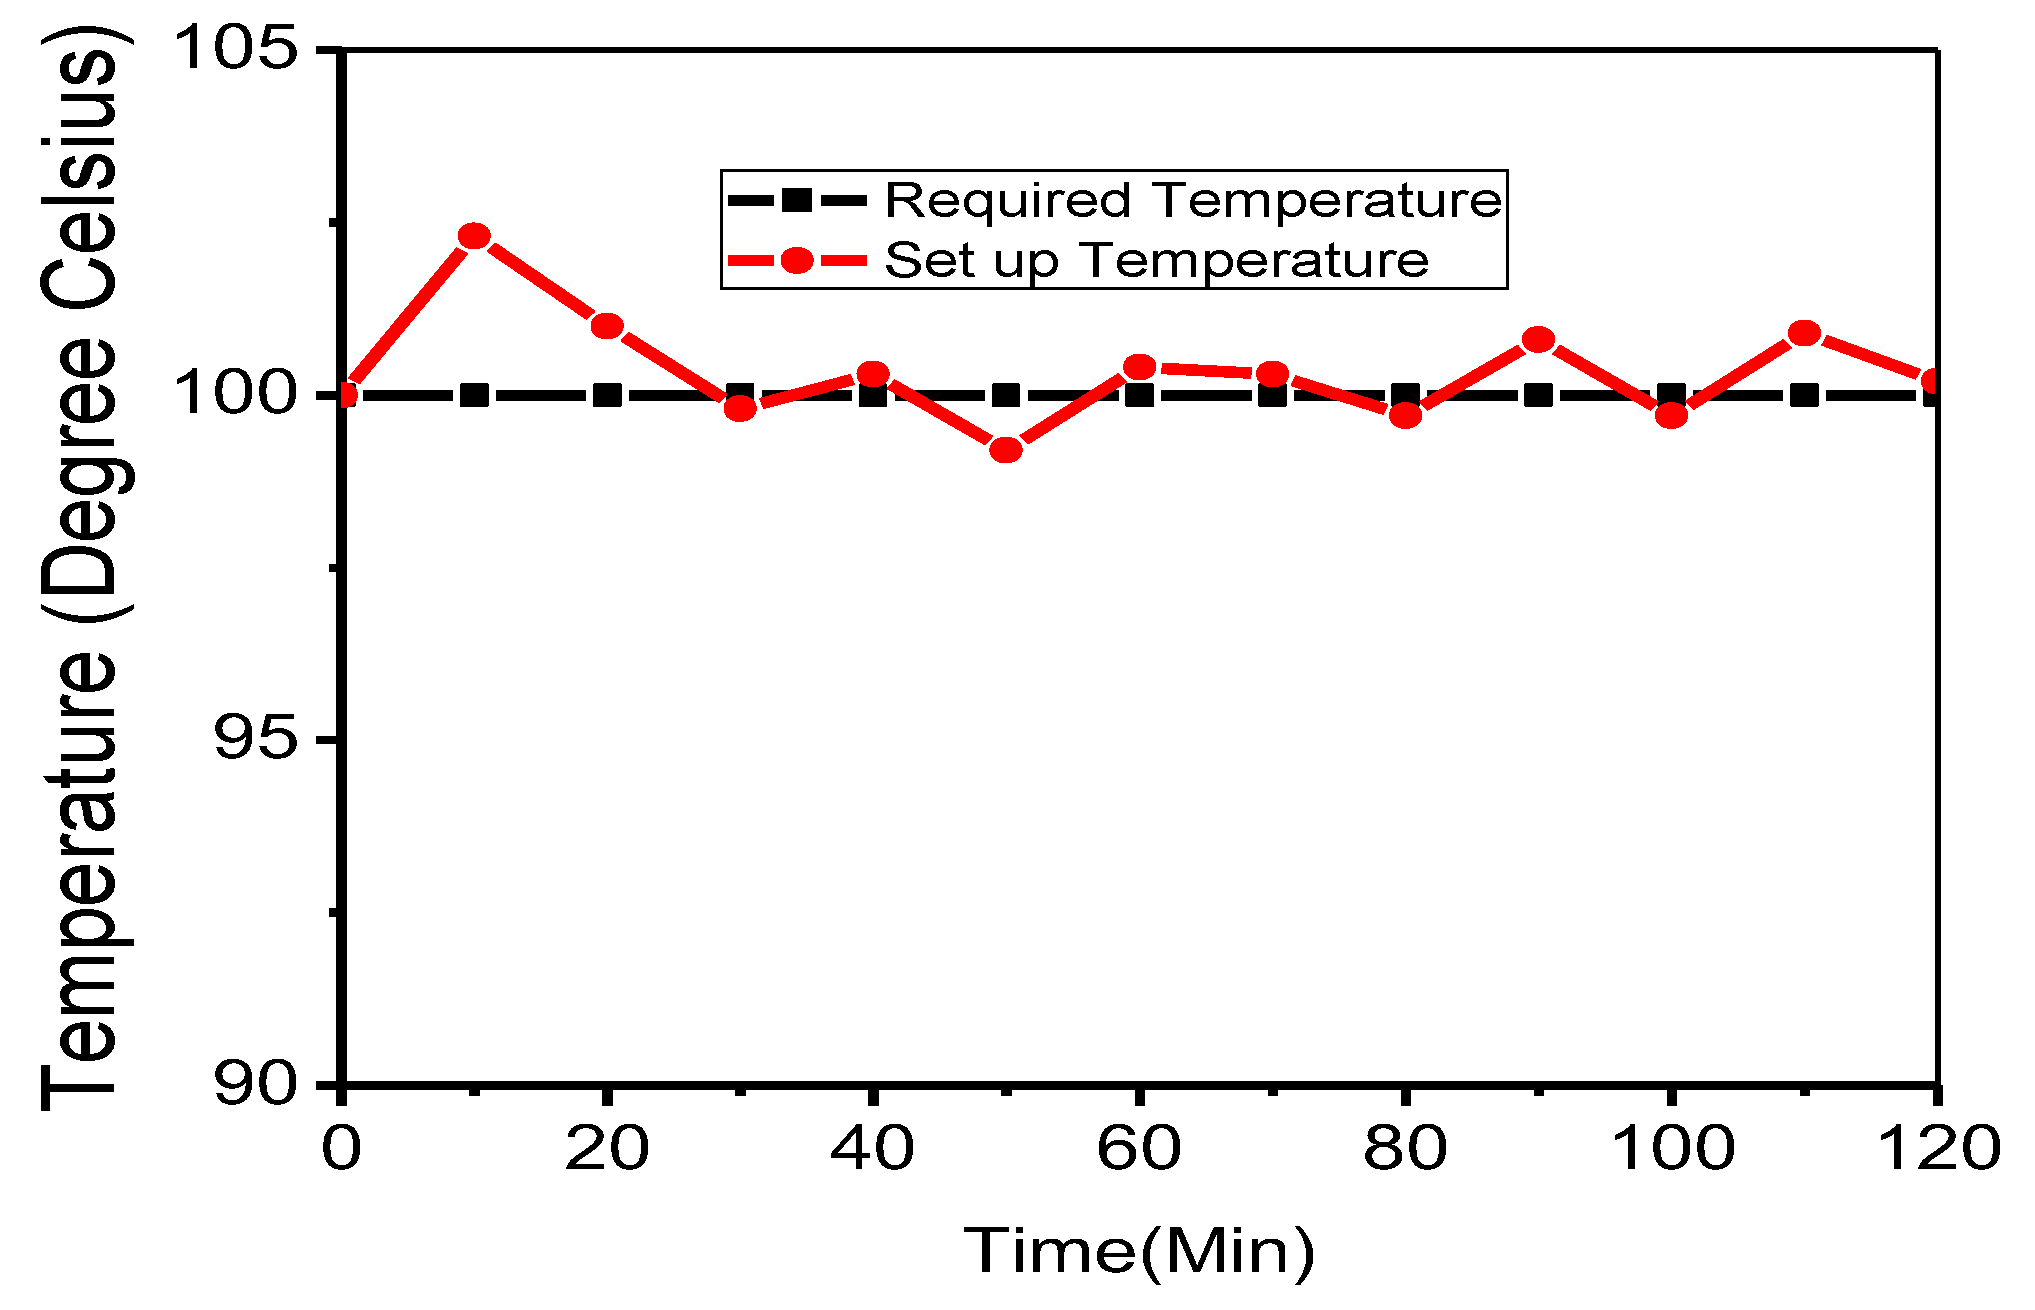
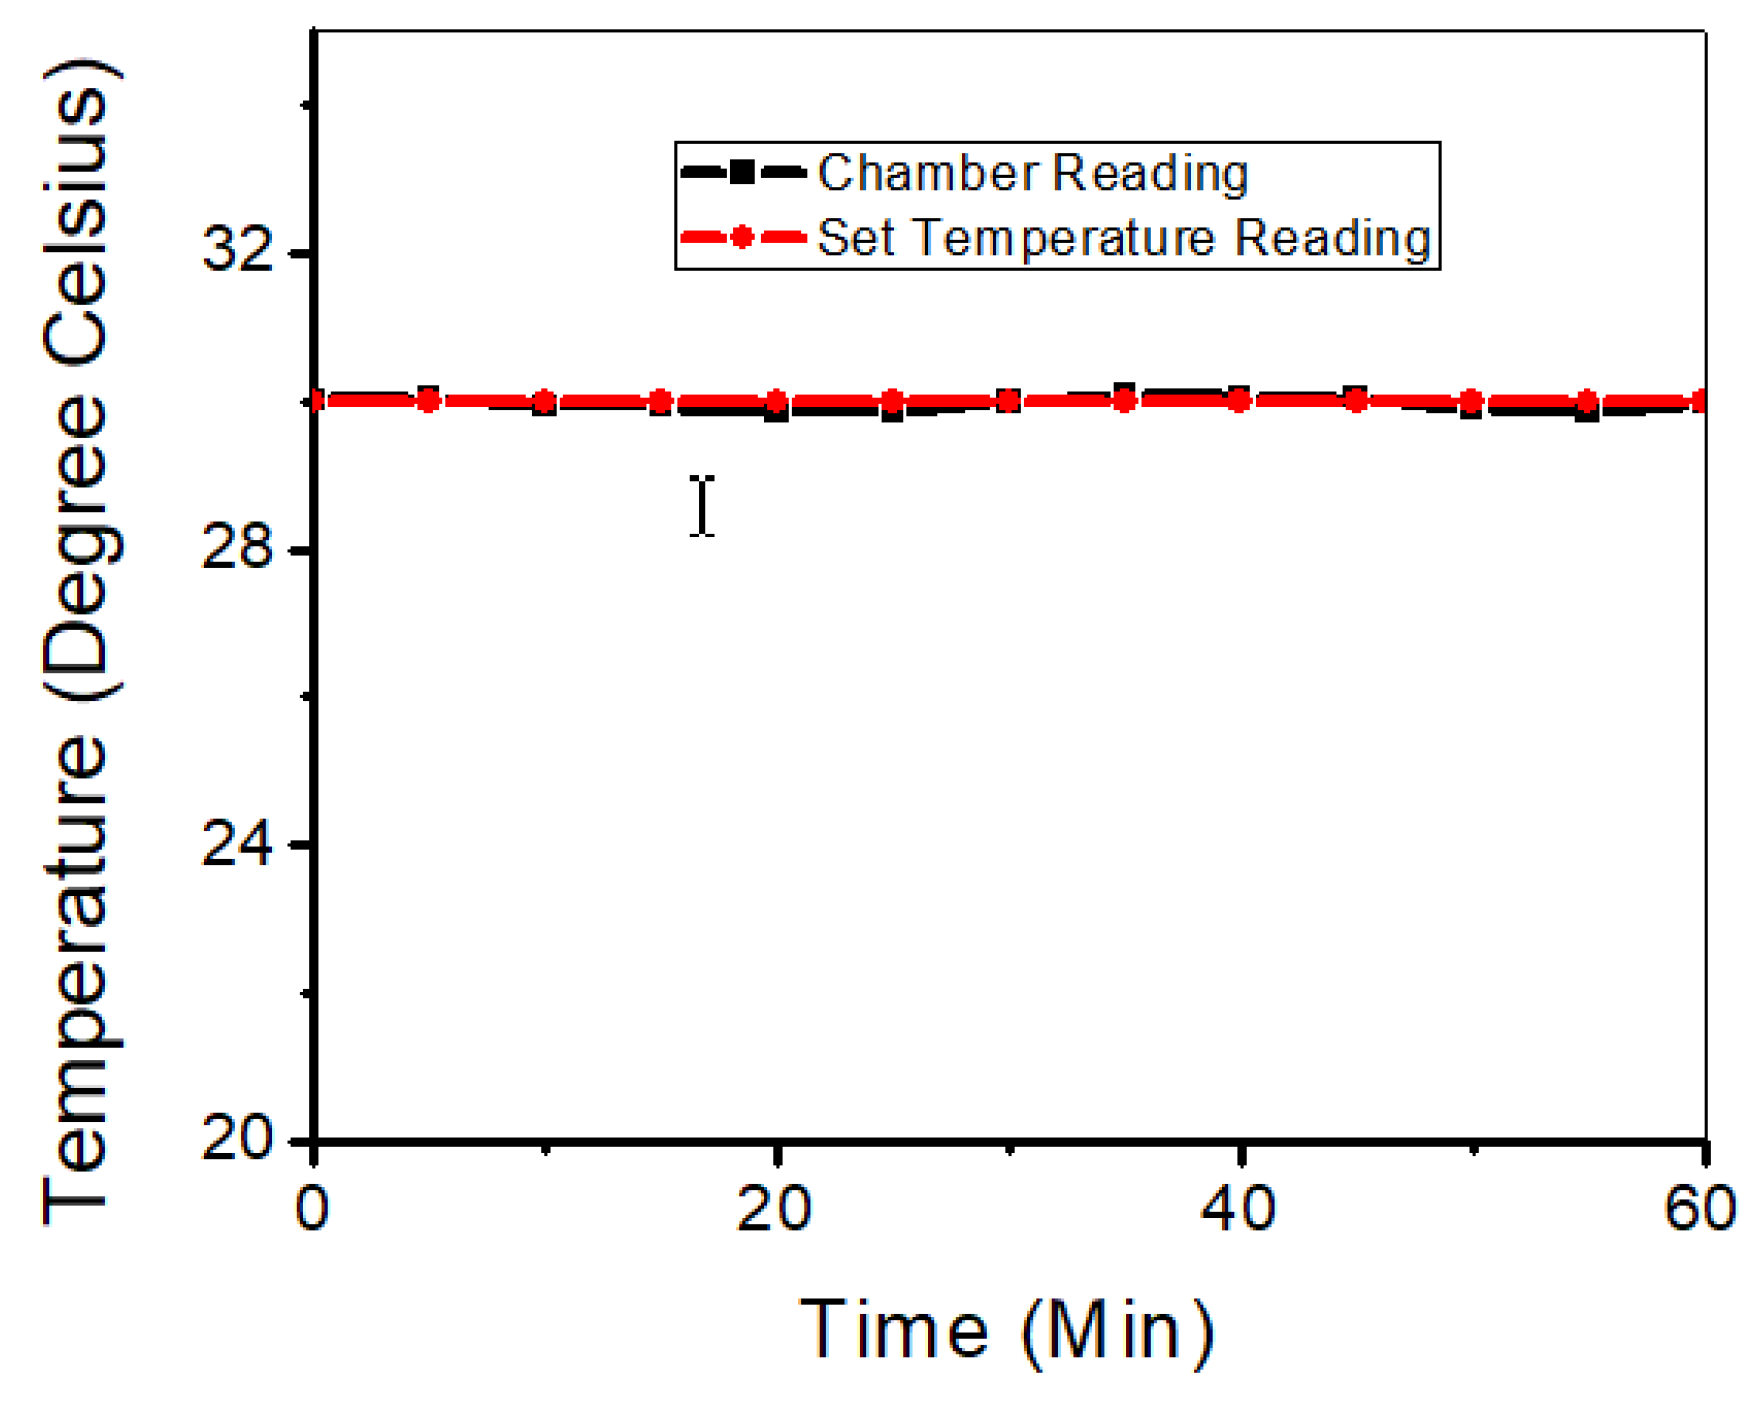
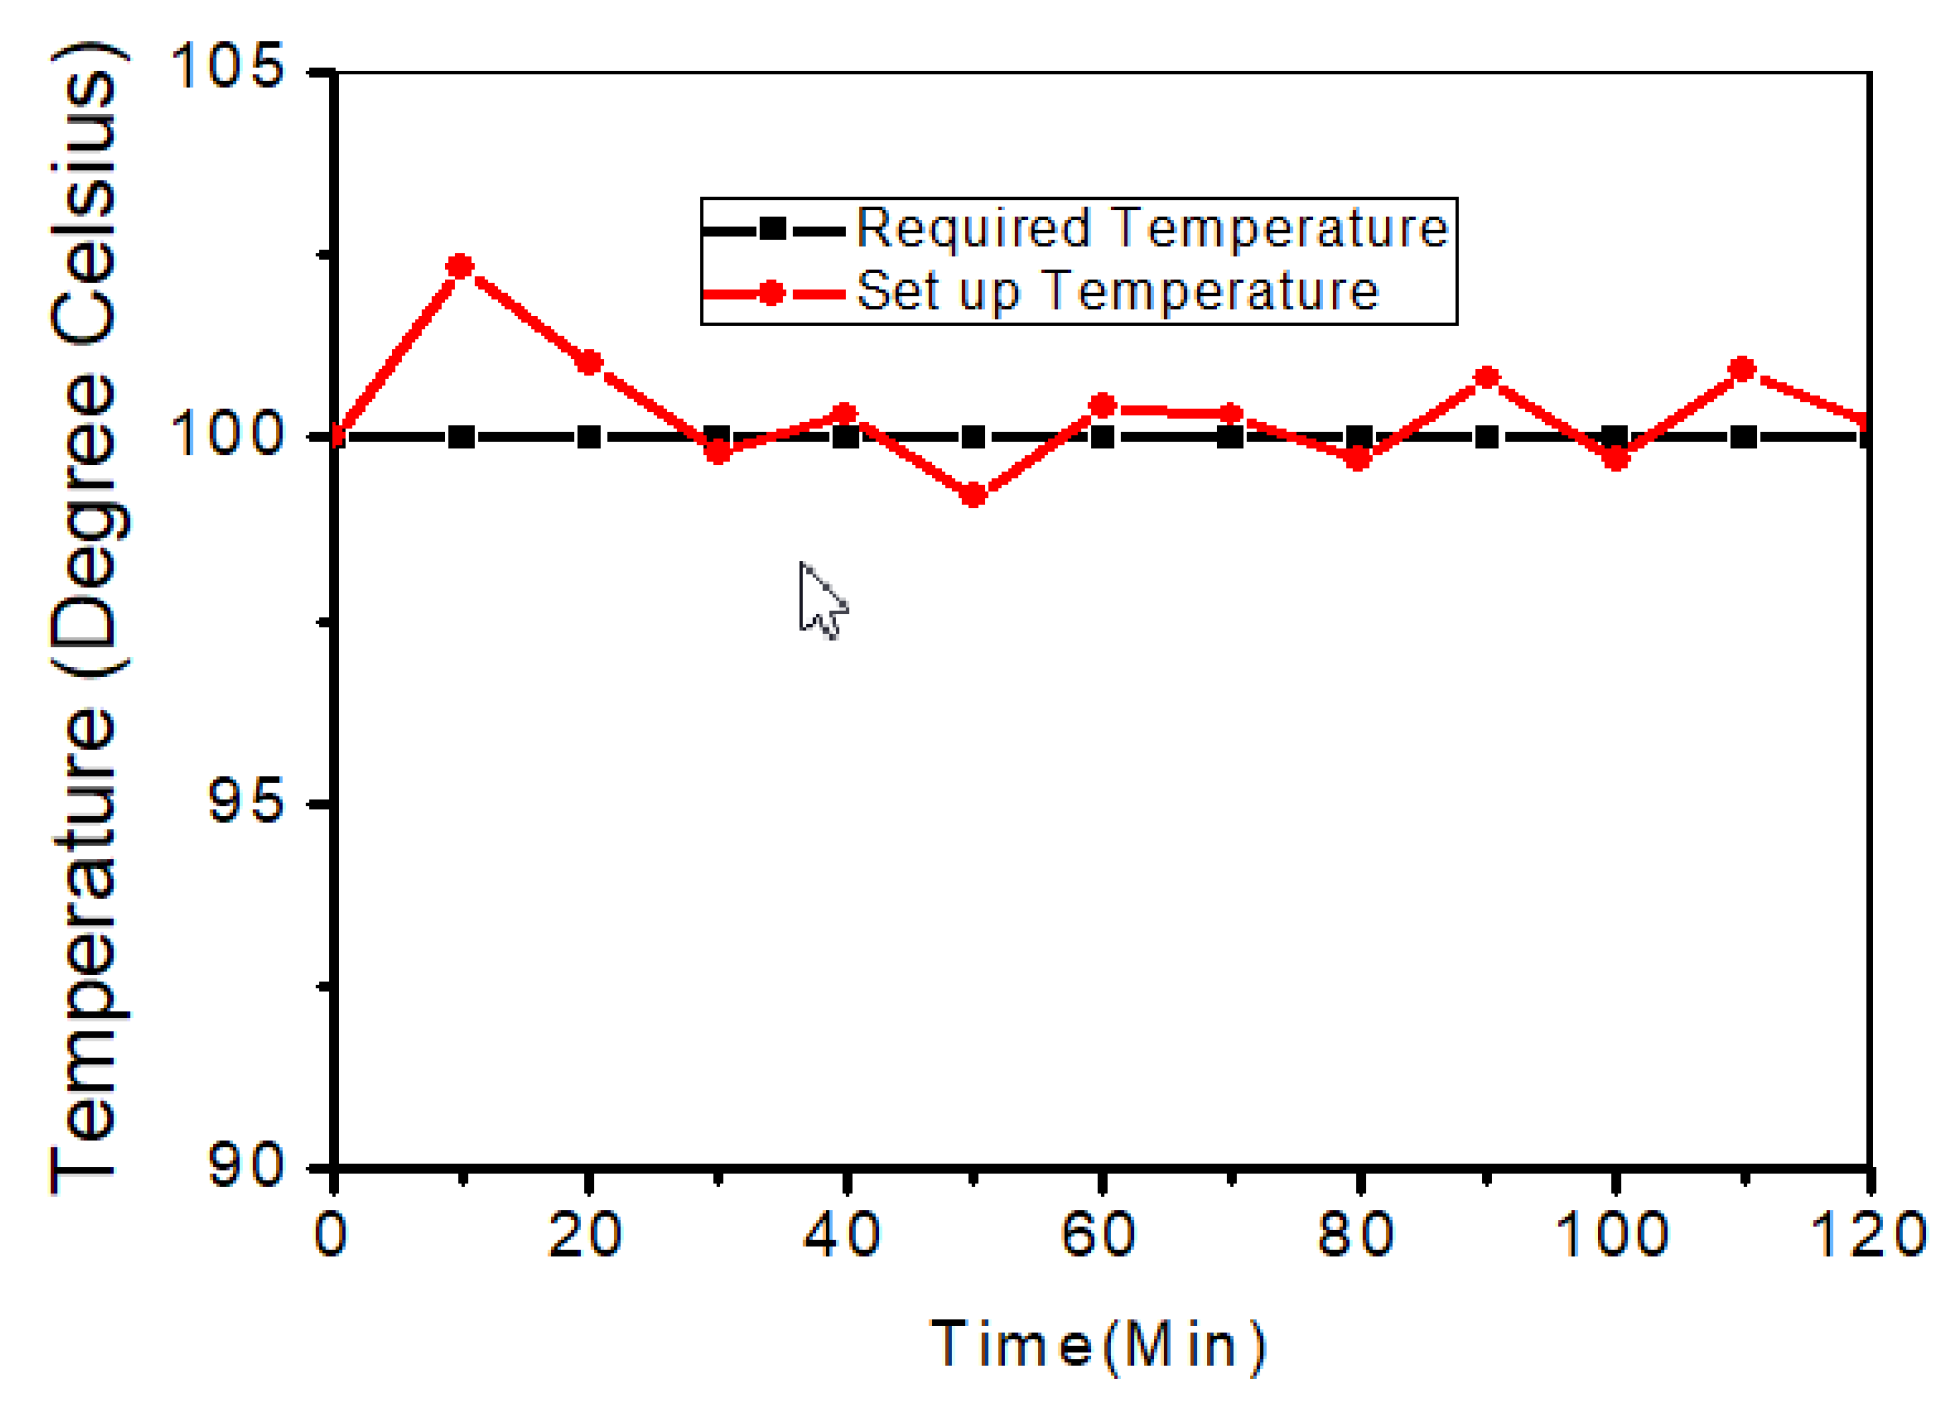
3.2. Chamber Testing and Its Calibrations

After its fabrication, the chamber was tested and calibrated to ensure that it regulates the temperature during materials testing. During the chamber testing, 100 °C was set as the required temperature of the chamber. The maximum and minimum temperatures recorded in the chamber were 102.30 °C and 99.20 °C, respectively. The Figure 2 above shows the test performance of the chamber.
The mean temperature recorded in the chamber is 100.35 ± 0.78 °C. This shows that the chamber could perform optimally as a temperature-controlled chamber.
Furthermore, the Standard thermometer by Fluke deployed in chamber calibrated it at three different temperatures of 30 °C, 55 °C and 85 °C.
At the respective calibrated temperatures of 30 °C, 55 °C and 85 °C, the output temperatures from reference and K-type thermocouple, with accuracy and precision of 1.1 °C at 0 °C and ±0.1 °C, respectively, in the chamber monitored at every five (5) min for one hundred and twenty (120) min as shown in Figure 3a–c gave the performance of the chamber.
Table 2 has the readings of the calibrated chamber at 30 °C, 55 °C and 85 °C compared to the reference thermometer readings. It shows large deviations from set-point values in which their tolerance limits are less than the values at 5 min of heating of the chamber. This shows that the chamber was well lagged to avoid heat loses to the surrounding. The temperature in the chamber rises and falls around the set temperatures.
Also, the thermocouple was placed was placed at 80 mm left and right of the original position, as shown in Figure 4 and Figure 5, to ascertain if the heat distribution in the chamber was uniform. Table 3 shows the temperature values of heat distribution in the chamber.

3.3. Material Test (Perovskite Thin Film)

The average temperature reading from a glass substrate of 75 × 25 × 1 mm deposited with perovskite thin film placed on an intermediate base of the chamber was 54.98 ± 0.032 °C, attached with K-type thermocouple at a set temperature of 55 °C as shown in Figure 6. The temperature values detected by a K-type thermocouple attached to the substrate shows that temperature reading is comparable to the average temperature reading from the chamber.

4. Discussions

Calibration of the chamber at different temperatures with reference thermometer shows corresponding readings at the respective set temperatures. This shows optimized parameters used during chamber fabrication. The choice of materials in fabricating the chamber led to better results. Choice of lagging material (expanded polystyrene) which has low heat conductivity at a range of 0.032–0.033 Wm−1 K−1 and moderate melting point temperature ≈240 °C attributed to its enhanced performance. This material prevented heat losses on the surface of the inner chamber since its conductivity is low and could not transfer appreciable quantity of heat to the outer wall of the chamber. In addition, the enhanced conductivity of aluminum sheet (1 mm) contributed to the chamber’s performance as shown in Table 1. Aluminum is a metal that conducts heat easily and its heat retention is low. Expanded polystyrene reduced heat loss and 1 mm aluminum sheet reduced the cost of fabricating the chamber.
The use of electric filament bulbs as a source of heat to the chamber made the design simple and affordable. The 40 W bulbs reduced energy consumption from the battery unlike other high power rated filaments. The choice of this material (filament bulbs) makes it attractive to most of the developing world.
Calibration results in Table 2, shows that the temperature sensor responds very well to any temperature change. At the set temperature value, the solid-state relay (SSR) communicates to the temperature controller and cuts-off connections from the source (battery or main supply) of the filament bulbs. This reconnects when the temperature value is less than the set value temperature and triggers the bulbs ON. When the set value temperature is very close to the temperature detected by the sensor, the intensity of light from the filament reduced until it goes OFF as it attains set value temperature.
The deviation from the mean temperature readings in reference thermometer at different temperature set values varied slightly. Deviation values from the temperature sensor are higher than that of the reference thermometer. The variation in time-dependent temperature differences between air and measuring sensor attributed to deviation values from the thermocouple and reference thermometer. Temperature sensor’s sensitivity to temperature changes could also contribute to the variation. Large deviations occurred at set-point values of 30 °C, 55 °C and 85 °C at 5 and 20; 5 and 55; and 5 min, respectively. These could be due to thermocouple trying to regulate the temperature to the set-point value and led to ramping above the set-point value. This could contribute to the occurrence of temperature values exceeding their tolerance limits.
Later, the placement of temperature sensor at 80 mm left and right from its original position in the chamber and left to measure the temperature at the new positions for 60 min. In Table 3, the temperature readings of 30 °C were in agreement with the values in Table 2. Variations in temperature with time followed the same pattern as shown in Figure 4 and Figure 5. This shows that there is even distribution of air temperature in the chamber. The deviation in average temperature at 30 °C at three different positions shows that sample(s) placed directly to the filament bulbs could experience more heating effect than when it placed at the other positions due concentric distribution of heat by filament bulbs. Attaching K-type thermocouple to the substrate material and tested at a temperature of 55 °C yielded temperature value of 54.98 ± 0.032 °C. This shows that the chamber could effectively be used to control temperature for materials testing as its set temperature reading corresponds with average temperature readings.

5. Conclusions

A low-cost temperature-controlled chamber, with inner dimension 210 mm × 260 mm × 360 mm, fabricated for materials testing. Mean temperature of 100.35 ± 0.78 °C recorded in the chamber at set temperature of 100 °C during chamber testing. Reference thermometer (Fluke 1523) calibrated the chamber at 30 °C, 55 °C, and 85 °C for one hundred and twenty (120) min at an interval of 5 min. The readings of the calibrated chamber were 30.012 ± 0.137 °C, 55.0345 ± 0.4644 and 85.0440 ± 0.1723 °C and that of the reference thermometer readings were 30.0124 ± 0.1025, 54.9636 ± 0.1158 and 85.0336 ± 0.0717 for 30, 55 and 85 °C, respectively. This shows that performance of the chamber could be up to expectation as its calibrated readings correspond with that of reference thermometer. The readings of a temperature sensor placed 80 mm left/right of its original position was in agreement with the values when calibrated. This shows that there is even distribution of air temperature in the chamber. Finally, the average temperature reading from a glass substrate of 75 × 25 × 1 mm deposited with perovskite thin film placed on the intermediate base of the chamber with thermocouple touching the glass substrate was 54.98 ± 0.032 °C at a set temperature of 55 °C. During material testing, perovskite thin film material heated up and it took ca. 5 min to heat up the sample to 55 °C. This shows that the chamber is effective to test the effects of temperature on materials as its set temperature reading corresponds with the average temperature reading from the material under test.

Supplementary Materials

The following are available online at https://www.mdpi.com/2411-9660/2/3/25/s1, Figure S1: Polystyrene lagging material and RTV silicone sealant, Figure S2: Temperature sensor, solid-state relay and temperature controller, Figure S3: Inner compartment of the surface developed chamber, Figure S4: Folding marked out aluminum sheet by metal folding machine, Figure S5: The outer compartment of the chamber, Figure S6: Developed door of the chamber, Figure S7: Constructed and functioning temperature chamber.

Author Contributions

S.C.E. conceived and designed the chamber; A.N.O. and S.C.E. fabricated the chamber and calibrations; A.B.A., A.O.A. and S.C.E. analyzed the data; A.O.A. and S.C.E. contributed materials; S.C.E. and A.B.A. wrote the paper.

Funding

This research received no external funding.

Acknowledgments

The authors would like to, especially acknowledge Dr. G.M.Z. Kana of the Department of Materials Science and Engineering in Kwara State University, Malete, R.A. Raji, Mohamed Adamu and Ibrahim Wale Oseni of the Department of Mechanical Engineering, Kwara State University Malete, for their constructive opinions in the technical discussions.

Conflicts of Interest

The authors declare no conflicts of interest.

References

  1. Mensah, K.; Choi, J.M. Energy Consumption and Stability Investigation of Constant Temperature and Humidity Test Chamber. Int. J. Air-Cond. Refrig. 2017, 25, 1750010. [Google Scholar] [CrossRef]
  2. Han, Y.; Meyer, S.; Dkhissi, Y.; Weber, K.; Pringle, J.M.; Bach, U.; Spiccia, L.; Cheng, Y.-B. Degradation observation of encapsulated planar CH3NH3PbI3 perovskite solar cells at high temperatures and humidity. J. Mater. Chem. A 2015, 3, 8139–8147. [Google Scholar] [CrossRef]
  3. Lefcourt, A.M.; Buel, B.; Tasch, U. Large environmental chamber: Design and operating characteristics. Appl. Eng. Agric. 2001, 17, 691–701. [Google Scholar] [CrossRef]
  4. Garcia-Diego, F.J.; Pascual, J.J.; Marco-Jimerez, F. Technical Note: Design of large variable temperature chamber for heat stress studies in rabbits. World Rabbit Sci. 2011, 19, 225–231. [Google Scholar] [CrossRef]
  5. Ashara, G.S.; Vyas, D.S. Design, and simulation of temperature control of chamber based on automatic fan speed control. In Proceedings of the National Conference on Emerging Trends in Computer, Electrical & Electronics (ETCEE-2015), Rajkot, Gujara, India, 14 March 2015. [Google Scholar]
  6. Zhang, E.; Yuan, H.; Fu, J.; Jiang, X.; Hu, D. The design of temperature control system of test chamber based on the predictive control algorithm. In Proceedings of the Fourth International Conference on Instrumentation and Measurement, Computer, Communication, and Control, Harbin, China, 18–20 September 2014. [Google Scholar]
  7. Feng, J.; Li, R.-J.; Fan, K.-C.; Zhou, H.; Zhang, H. Development of a Low-Cost and Vibration-Free Constant-Temperature Chamber for Precision Measurement. Sens. Mater. 2015, 27, 329–340. [Google Scholar]
  8. Kramar, J.A. Nanometre resolution metrology with the Molecular Measuring Machine. Meas. Sci. Technol. 2005, 16, 2121. [Google Scholar] [CrossRef]
  9. Kim, S.W. New design of precision CMM based upon volumetric phase-measuring interferometry. Ann. Manuf. Technol. 2001, 50, 357–360. [Google Scholar] [CrossRef]
  10. Fan, K.C.; Fei, Y.T.; Yu, X.F.; Chen, Y.J.; Wang, W.L.; Chen, F.; Liu, Y.S. Development of a low-cost micro-CMM for 3D micro/nano measurements. Meas. Sci.Technol. 2006, 17, 524. [Google Scholar] [CrossRef]
  11. Products: Graphite Enhanced Polystyrene. Available online: www.neotherm.ie/neographite_031_graphite_enhanced_polystyrene.html (accessed on 13 February 2018).
  12. Market Study on Expandable Polystyrene. Available online: www.ceresana.com/en//marketstudies/plastics/expanded-polystrene (accessed on 13 February 2018).
  13. Lévesque, L. Law of cooling, heat conduction and Stefan—Boltzmann radiation laws fitted to experimental data for bones irradiated by the CO2 laser. Biomed. Opt. Express 2014, 5, 701–712. [Google Scholar] [CrossRef] [PubMed]
  14. Bartl, J.; Baranek, M. Emissivity of aluminum and its importance for radiometric measurement. Meas. Sci. Rev. 2004, 4, 31–36. [Google Scholar]
  15. Wu, L.-A.; Segal, D. Fourier’s law of heat conduction: Quantum mechanical master equation analysis. Phys. Rev. E 2008, 77, 060101(R). [Google Scholar] [CrossRef] [PubMed]
Figure 1. Circuit diagram in the temperature chamber.Legend: TC—Temperature Controller; B—Electrical filament Bulb; SSR—Solid State Relay; ST—Electrical Socket; TP—Thermocouple; W—Electrical Wire.
Designs 02 00025 g001
Figure 2. Test result of chamber performance.
Designs 02 00025 g002
Figure 3. Calibration results of the chamber with respect to reference digital thermometer at (a) 30 °C; (b) 55 °C; and (c) 85 °C.
Designs 02 00025 g003
Figure 4. Plot of Temperature versus time when Temperature sensor placed at 80 mm right of original position.
Designs 02 00025 g004
Figure 5. Plot of Temperature versus time when Temperature sensor placed at 80 mm left of original position.
Designs 02 00025 g005
Figure 6. Temperature versus time during material testing.
Designs 02 00025 g006
Table 1. Cost analysis of materials in fabrication of the chamber.
S/NMaterialSpecificationQuantityPrice ($)Total Price ($)
1Aluminium sheet1 mm (thick)137.4437.44
2Rivets 1 packet1.971.97
3Wire2.5 mm4 yards1.154.59
4Filament bulb40 W30.330.99
5Temperature/Solid State Relay/SensorMypin117.3817.38
6Labor 313.1139.34
7Lamp holder 30.391.17
8Battery100 AH–12 V198.3698.36
9Inverter 1131.15131.15
Total 332.39
10Overhead Cost 32.8532.85
Grand Total 365.24
Table 2. The temperature reading from K-type thermometer and thermocouple deployed in the chamber.
Set Temperature (°C)MeanTemperature Reading from K-Type Thermocouple (°C)Mean Temperature Reading from Reference Thermometer (°C)Standard Deviation of Temperature Reading from K-Type Thermocouple (°C)Standard Deviation of TemperatureReading from Reference Thermometer (°C)
3030.012030.0124 ± 0.1372 ± 0.1025
5555.034054.9636 ± 0.4644 ± 0.1158
8585.044085.0336 ± 0.1723 ± 0.0717
Table 3. Temperature readings of thermocouple placed at 80 mm right (r) and left (l) of original position.
Set Temperature (°C)Mean Temperature Reading from Thermocouple (°C)Standard Deviation of Temperature Reading from Thermocouple (°C)
30 r29.965±0.08482
30 l29.956±0.08119

