Article

Parametric Study of the Behavior of Longitudinally and Transversally Prestressed Concrete under Pure Torsion

C-MADE-Centre of Materials and Building Technologies, Department of Civil Engineering and Architecture, University of Beira Interior, Edifício II das Engenharias, Calçada Fonte do Lameiro, 6201-001 Covilhã, Portugal
*
Author to whom correspondence should be addressed.
Designs 2018, 2(2), 12; https://doi.org/10.3390/designs2020012
Submission received: 28 March 2018 / Revised: 19 April 2018 / Accepted: 20 April 2018 / Published: 24 April 2018
(This article belongs to the Special Issue Integrated Sustainable Building Design, Construction and Operation)

Abstract

:
Among several analytical models to describe the behavior of reinforced concrete (RC) and longitudinally prestressed concrete (LPC) beams under torsion, the Modified Variable Angle Truss Model (MVATM) is particularly efficient to capture the behavioral states of the member until failure and agree well with experimental results. This article aims to extend the MVATM to cover transversally prestressed concrete (TPC) beams under torsion. The changes in the formulation and calculation procedure of the original VATM, in order to include the influence of transversal prestress, are presented. The extended MAVTM is then used to compute the global response of LPC and TPC beams under torsion with similar total prestress reinforcement ratios, namely the torque–twist curves. The obtained predictions are then compared and discussed. It is shown that for the ultimate loading, transversal prestress constitutes also an effective solution to improve the behavior of the beams under torsion. However, transversal prestress is less effective to delay the cracked state. Finally, it is also shown that when prestress is distributed in both longitudinal and transversal direction, the global response of the beams under torsion is further improved, namely the resistance torque and the torsional stiffness in the cracked state.

Graphical Abstract

1. Introduction

Several theoretical models have been developed to predict the behavior of Reinforced Concrete (RC) beams under torsion. Among those models, the Space Truss Analogy (STA), originally proposed by Rausch in 1929 [1], has a high historical value and is the base model of the European Model Code since 1978 and also the ACI Code since 1995. Successive developments of the original STA have been proposed by several authors, such as Andersen in 1935 [2], Cowan in 1950 [3], Lampert and Thurlimann in 1969 [4], Elfgren in 1972 [5] and Collins and Mitchell in 1980 [6], among others.
Among the referred developments of the STA, the Variable Angle Truss Model (VATM) proposed by Hsu and Mo in 1985 [7,8] has been widely used by researchers. VATM was the first model which aimed to unify the treatment of RC and Longitudinally Prestressed Concrete (LPC) beams. Some simplified versions of the VATM were proposed later by other authors, namely Rahal and Collins in 1996 [9], Bhatti and Almughrabi in 1996 [10] and Wang and Hsu in 1997 [11]. However, these models only allow computing the ultimate torsional strength of the beams and usually do not incorporate the influence of prestress.
The original VATM is able to predict the behavioral state of RC and LPC beams throughout the entire loading history, although good results are observed only for high loading levels [7,8]. This is because VATM assumes that the response of the beam starts from the cracked state and also because it neglects the influence of the concrete core for plain beams.
To solve this issue, Jeng and Hsu in 2009 [12], Jeng et al. in 2010 [13] and Jeng in 2015 [14] proposed the Softened Membrane Model for Torsion (SMMT) to model RC and LPC beams. This model predicts well the entire torque (T)–twist (θ) curve of the beams. Since SMMT constitutes an extension of the Softened Membrane Model (SMM) for RC membrane elements under shear [15], the mathematical treatment and the solution procedure is somehow complex. When compared with VATM, this latter provides a simpler physical understanding of how a cracked RC or LPC beam behaves under torsion.
For this reason, Bernardo et al. in 2012 [16] and in 2015 [17] proposed new developments of the original VATM, namely the Modified VATM (MVATM) and the Generalized Softened VATM (GSVATM). These models are also able to predict well the entire T–θ curves of RC and LPC beams under torsion [18,19,20].
Nowadays it is well known that prestress, if rationally applied, increases the resistance to θ cracking and also the stiffness of concrete beams, including for beams under shear or torsion. This is because prestress generates a compressive stress state which, in combination with the shear stress due to the torsional moment, results in a biaxial stress state (shear + compression). This biaxial stress state delays the concrete cracking. Furthermore, since the tensile strength of concrete does not increase in the same proportion as compressive strength increases, it is not possible to reach the full potential of concrete in structures for which resistance is governed by tensile stresses due often to shear or torsion. Therefore, prestress can also increase the torsional strength and allow for a larger area of the concrete cross section to be effective. For these reasons, longitudinal prestress is a current technique used in beams under high torsional loads, such as in girders of curved bridges [21]. Transversal prestress is also sometimes used in box girders to solve problems related with high shear stress in the vertical walls due to shear forces. In such members, high torsional moments can simultaneously exist, which increases even more the shear stress in the walls. In this case, transversal prestress can be used to solve the problem due to combined shear forces and torsional moments. None of the previously referred theoretical models for torsion cover transversal prestress.
In this study, the MVATM is extended to cover TPC beams under torsion. The changes in the original VATM formulation are presented separately for each behavioral state of the beam (as also performed in the original MVATM), namely: non-cracked state, transition between non-cracked and cracked state and cracked state until failure. Calculation algorithms and solution procedures are also presented.
Since no experimental results with TPC beams under torsion were found in the literature, and since the predictions from MVATM were already checked against experimental results for LPC beams under torsion [18,20], this study presents a theoretical parametric study to compare the global behavior of LPC and TPC beams under torsion. This study aims to check if transversal prestress is also an efficient technique to improve the torsional behavior of the beams.

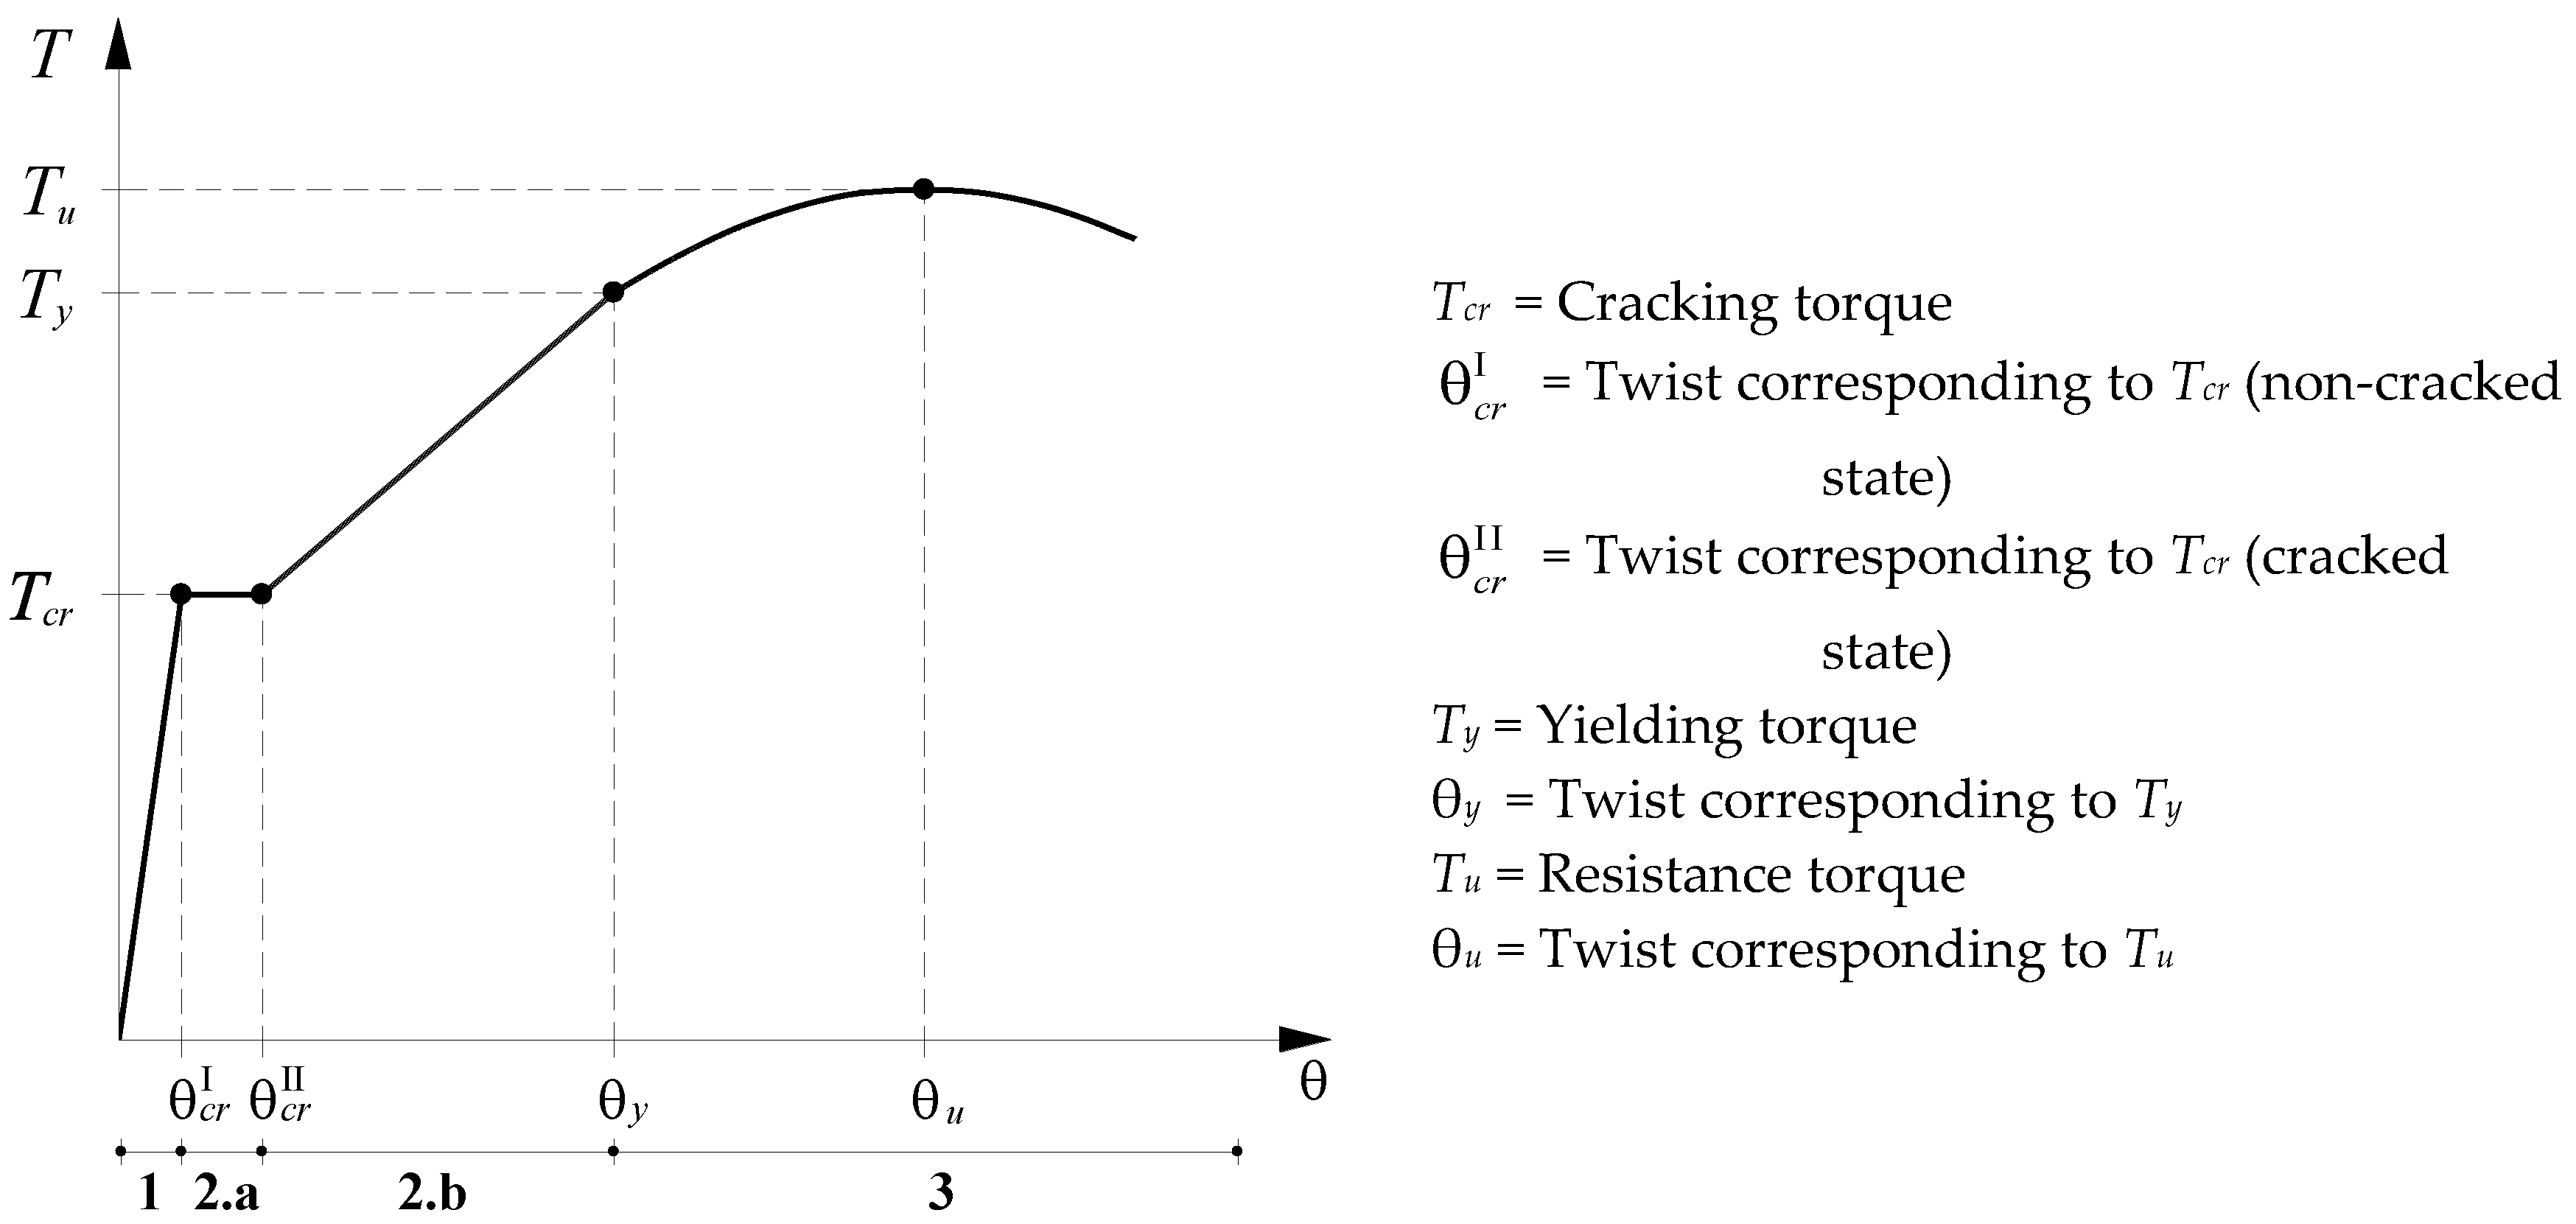
2. Modified Variable Angle Truss Model (MVATM)

In previous studies [16,18,20], the MVTAM was validated for RC and LPC beams under torsion. This section summarizes the MVATM formulation (Table 1 and Table 2) and solution procedure for LPC beams. The MVATM is extended to TPC beams in Section 3.

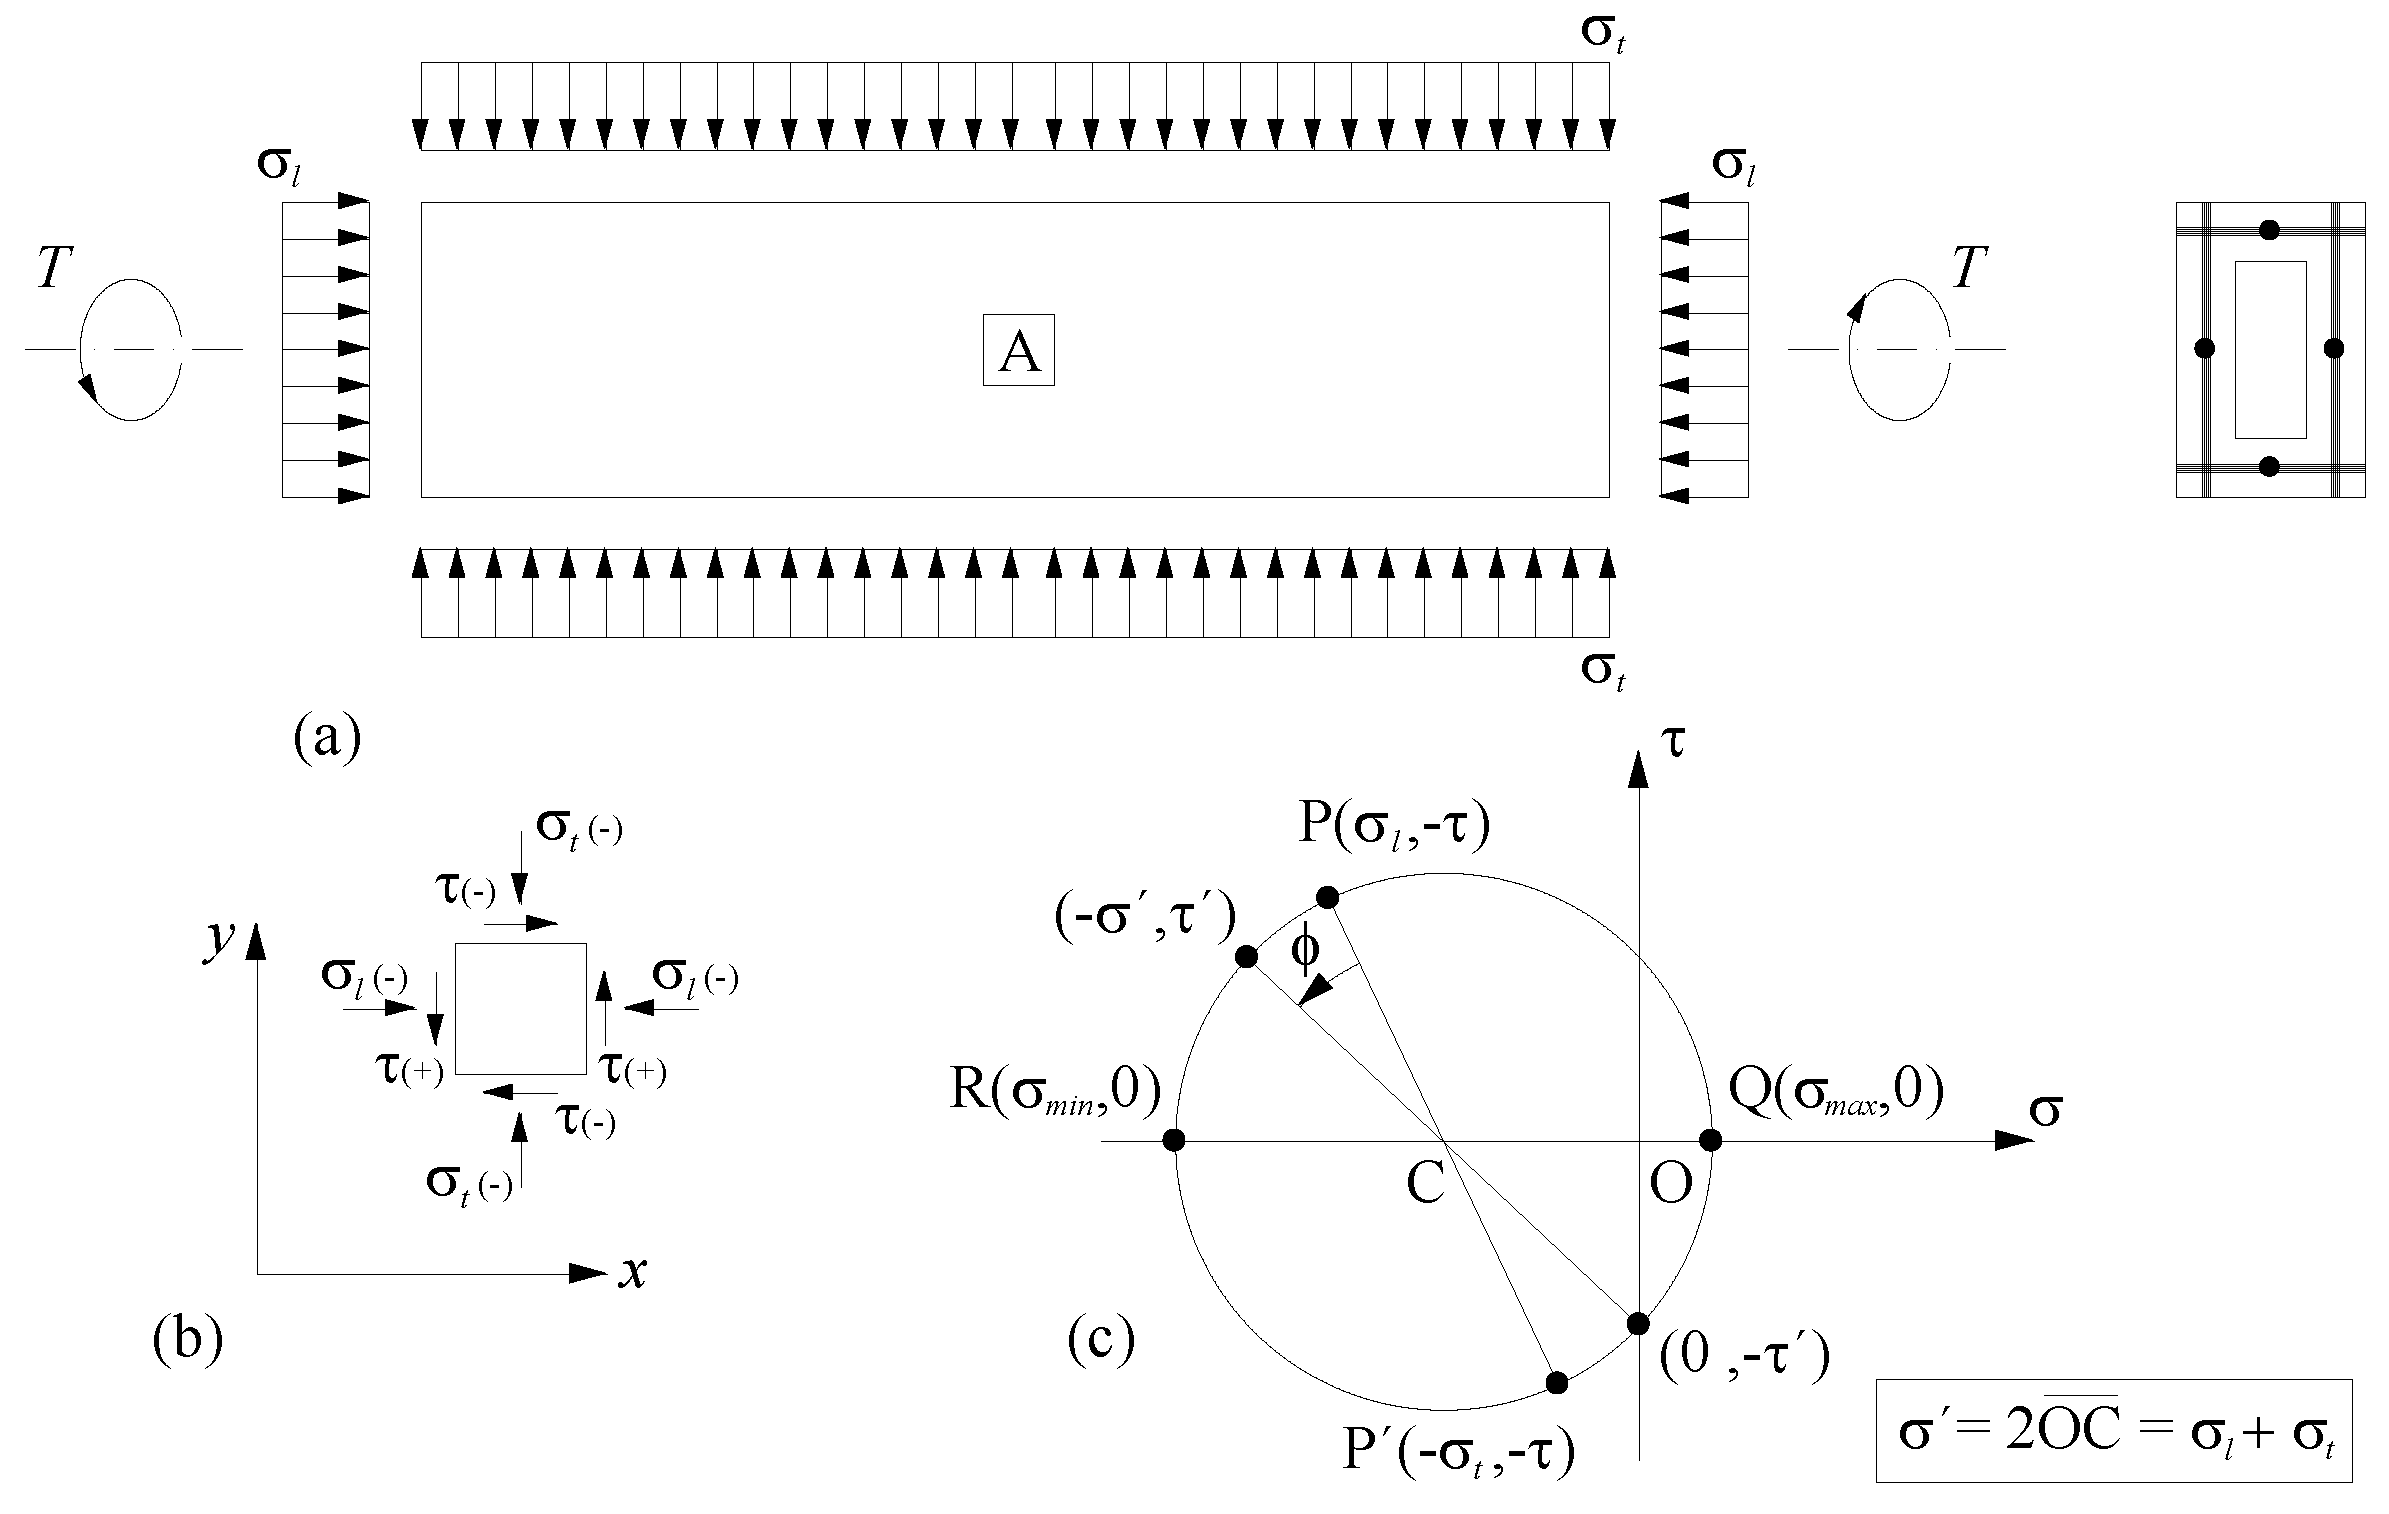
2.1. Non-Cracked State

Figure 1 shows a typical T–θ curve for a RC or LPC beam under torsion. The computation of the theoretical T–θ curve from the MVATM [16,18,20] for the non-cracked state (Zone 1 in Figure 1) requires 3 equilibrium equations to compute the torque, T, the effective thickness of the equivalent hollow section, td, and the angle of the inclined concrete struts from the horizontal axis of the beam, α, (see Equations (1)–(3) in Table 1). MVATM also requires 3 compatibility equations to compute the strain in the transversal reinforcement, εt, the strain in the longitudinal reinforcement, εl, and the twist, θ (Equations (6)–(8) in Table 1).
The cracking torque (Tcr) sets the upper limit for Zone 1 (Figure 1). Tcr is calculated from an equation based on the Bredt’s Thin Tube Theory, which incorporates a prestress factor to account for the prestress (Equation (9) in Table 1). Bonded reinforcement delays the concrete cracking, so the calculation of the effective cracking torque (Tcr,ef) accounts for the influence of the torsional reinforcement ratio (both longitudinal, ρl, and transversal, ρt) (Equation (10) in Table 1). Prestress reinforcement is also accounted if bonded to the concrete and if located in the outer area of the concrete cross section.
For the non-cracked state, MVATM incorporates the contribution of the concrete in tension (which is neglected in the VATM) for both longitudinal and transversal directions. In addition, MVATM also incorporates the contribution of the concrete core for plain beams (which is also neglected in the VATM). This is performed using the homogenization technique for both directions and also by computing an equivalent thickness heq for the concrete in tension (Figure 2), which is assumed to be effective to carry the internal forces along with the torsional reinforcement (Equations (4) and (5) in Table 1). Figure 2 illustrates the equivalent hollow section with wall’s thickness heq assumed by MVATM and also the cross section of the concrete strut (with unitary width) with the corresponding strain and stress diagrams along its effective thickness td.
The cross section illustrated in Figure 2 is used to calculate the depth of the center line of the shear flow, the area of the effective tensile concrete and the dimensions of the concrete core (for plain beams). In this study, ACI code [22] is used to compute heq (Equation (13) in Table 1).
To characterize the behavior of the concrete in compression in the diagonal struts and the behavior of the reinforcement in tension, average stress (σ)–strain (ε) relationships are assumed accounting for the softening (concrete) and stiffening (reinforcement) effects. The σ–ε relationship for concrete in compression used in this study is the one proposed by Belarbi and Hsu in 1991 [23] (Equations (45) and (46) in Table 3) with softening coefficients for the maximum stress (βσ) and for the strain corresponding to maximum stress (βε) proposed by Zhang and Hsu in 1998 [24] (Equations (47)–(50) in Table 3). In addition, the σ–ε relationship for non-prestress reinforcement in tension proposed by Belarbi and Hsu in 1995 [25] (Equations (58)–(61) in Table 4) and the σ–ε relationship for prestress reinforcement in tension proposed by Ramberg–Osgood, as presented in [8] (Equations (65) and (66) in Table 5), are also used.
The compressive stress in the concrete diagonal struts, fd, is defined as the average stress of a non-uniform stress diagram (Figure 2) (Equation (51) in Table 3). In Figure 2, parameters A, B, and C are the maximum stress, average stress and the stress diagram resultant (Equations (52)–(54) in Table 3), respectively. Parameter k1 in Equation (51) is computed by integrating Equations (45) and (46) (k1 = B/A according to Figure 2).
For the non-cracked state, the strains in the longitudinal non-prestress and prestress reinforcement, εl and εp, which are need to calculate the stresses, fl and fp, must be computed accounting for the initial compressive strain due to prestress, εdsi, and also for the state before concrete’s decompression (Equations (62) and (63) in Table 4 and Equations (67) and (68) in Table 5). The effective compressive strain ε d s in the outer fiber of the concrete strut must also be computed accounting for this initial strain and state (Equations (55) and (56) in Table 3).
The influence of the concrete core in the torsional stiffness of plain beams is incorporated by correcting the twists θ previously calculated with the theoretical model for the non-cracked state. The correction consists to add the torsional stiffness of the concrete core to the torsional stiffness of the equivalent hollow section (Equations (18)–(21) in Table 1).
To compute the solution points of the theoretical T–θ curve in the non-cracked state, an iterative solution procedure based on a trial-and-error technique is used. Figure 3 shows the flowchart of the calculation algorithm for hollow (Figure 3a) and plain (Figure 3b) sections. Figure 3b only presents the needed additional part of the flowchart with respect to Figure 3a. The calculation procedure ends when the effective cracking torque is reached.

2.2. Cracked State

When the effective cracking torque (Tcr,ef) is reached, the influence of concrete in tension vanishes from the longitudinal and transversal equilibrium equations. From this point, the resultant forces in both directions are equilibrated only by the longitudinal and transversal reinforcement, including prestress reinforcement (Equations (23) and (24) in Table 2). This induces a sudden increase of the twist (Zone 2.a in Figure 1), as it is experimentally observed for plain beams. For hollow beams, experimental tests show that Zone 2.a is not clearly observed [26] (Figure 1). For such beams, MVATM usually estimates a negligible length for Zone 2.a [16].
Despite concrete reaches its tensile strength in the outer area of the cross section, for plain beams the influence of the concrete core still remains after cracking [27].
In the cracked state, the equivalent hollow section (with thickness heq) assumed for the non-cracked state is no longer used to compute the area limited by the center line of the shear flow, neither its perimeter. After concrete cracking, the effective wall thickness is considered to be equal to the effective thickness of the concrete struts, td, computed from the VATM [7,8]. The center line of the shear flow is now assumed to be located at td/2 (Equations (25) and (26) in Table 2).
Since in the cracked state the beam already reached the concrete’s decompression, the calculation of the strains in the longitudinal non-prestress and prestress reinforcement, εsl and εp, to calculate the stresses, fsl and fp, is performed with Equation (64) in Table 4 and Equation (69) in Table 5, respectively. In the same way, the effective compressive strain ε d s in the outer fiber of the concrete strut is computed from Equation (57) in Table 3.
To estimate Zone 2.a in Figure 1, the calculation procedure presented in Table 2 is only performed until Tcr,ef is reached (the calculation procedure for Zones 2.b and 3 is described in Section 2.3). From the obtained results, only the point of the T–θ curve corresponding to T = Tcr,ef is used since the objective of this section is only to estimate Zone 2.a.
The target of this section is illustrated in Figure 4b for plain sections. Zone 2a corresponds to the horizontal landing, with T = Tcr,ef and θ c r I θ θ c r I I . The value of θ c r I corresponds to the abscissa of the intersection point between the horizontal level for T = Tcr,ef and the theoretical T–θ curve computed with MVATM for the non-cracked state (Section 2.1). The value of θ c r I I corresponds to the abscissa of the intersection point between the same horizontal level and the theoretical T–θ curve computed with MVATM for the cracked state.
Figure 4 illustrates how the corrections are implemented to draw the final theoretical T–θ for RC hollow and plain beams (Figure 4a,b), respectively), starting from the point corresponding to the cracking torque (Tcr,ef).
Based on the aforementioned, the iterative calculation procedure to compute the T–θ curve presented in Section 2.1 needs to be corrected for the cracked state (Table 2). The flowchart for the calculation algorithm is illustrated in Figure 5a (hollow sections) and Figure 5b (plain sections), with α′ and td′ calculated from Equations (2) and (3) (see Table 1), respectively.

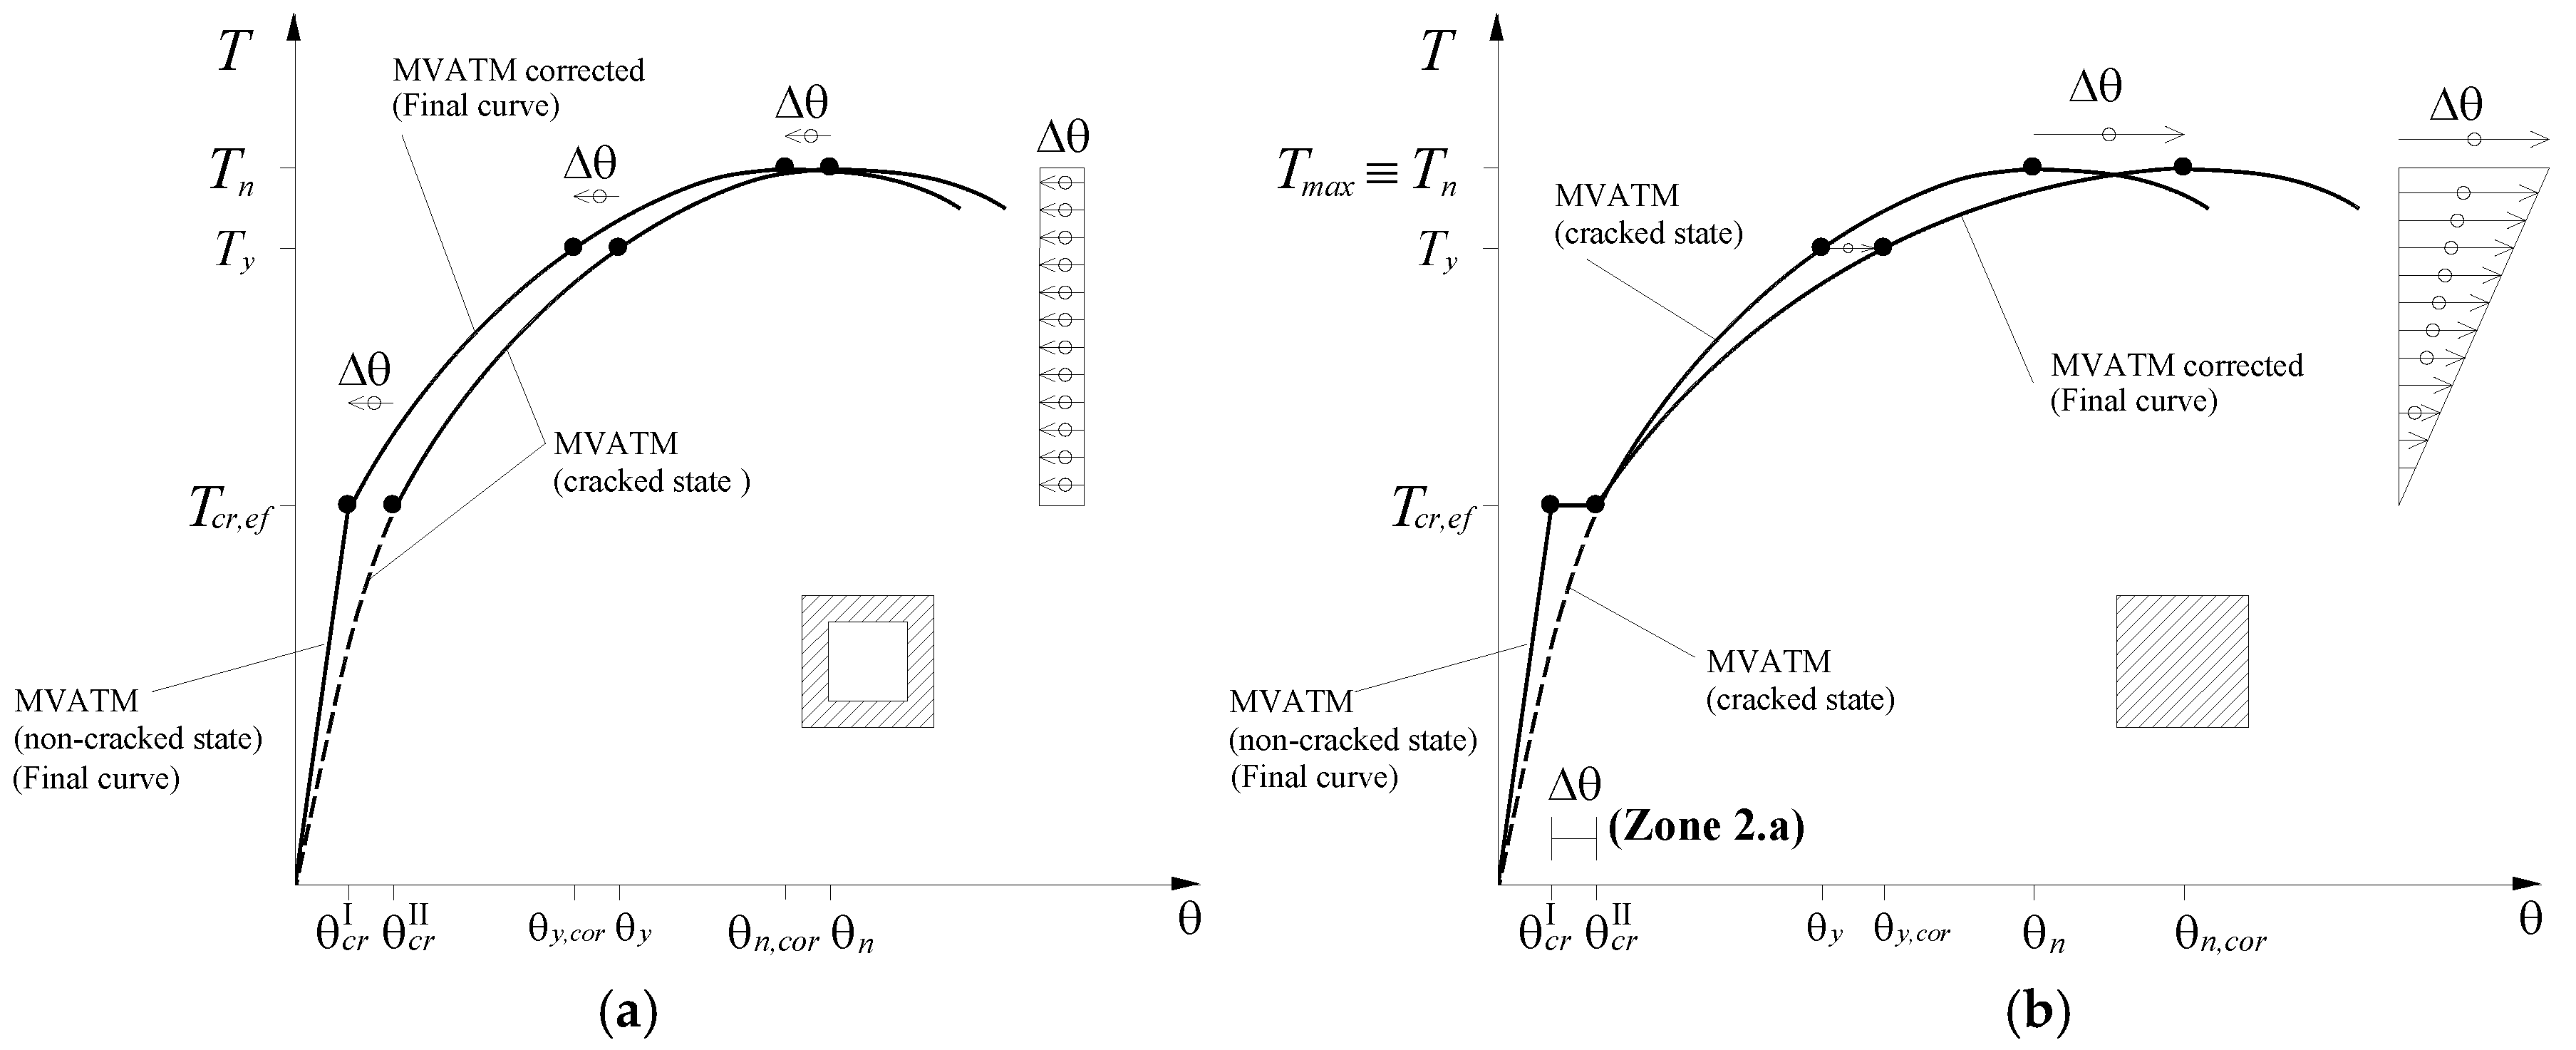
2.3. Zones 2.b and 3 (Cracked and Ultimate States)

The theoretical T–θ curve from MVATM for the cracked state, computed as presented in Section 2.2, is not fully valid for Zone 2.b and 3 (Figure 1), since the model incorporates the influence of the concrete core for plain sections. Earlier studies [27,28] shown that the influence of the concrete core for the cracked torsional stiffness of the beam decreases as the torsional moment increases. This influence is residual in the ultimate state. Then, for plain beams a criterion is adopted in this study to correct the T–θ curve calculated from MVATM for the cracked state (Section 2.2), starting from Tcr,ef to the maximum torque Tu. Since the concrete core mainly influences the torsional stiffness in the cracked state [27,28], only the twists θ are corrected in the T–θ curve. The correction method for plain beams consists as follows: from Tcr,ef to Tu the influence of the concrete core is gradually reduced by decreasing linearly the “external” dimensions of the concrete core. Full dimensions and null dimensions are considered for Tcr,ef and Tu, respectively (Equations (35)–(41) in Table 2). For θ ≥ θu the corrections are made by assuming that the influence of the concrete core no more exists (Equation (42) in Table 2). The criterion to correct the T–θ curve of plain beams, for the cracked and ultimate state, is illustrated in Figure 4b. A linear variation for Δ θ is assumed from Tcr,ef to Tu.
For hollow beams, the T–θ curve is firstly calculated with MVATM for the cracked state (Section 2.2). Since no concrete core exists and since MVATM always predicts a narrow Zone 2.a ( Δ θ in Figure 1), a small correction of the twists is performed because, as previously referred, no experimental Zone 2.a is usually observed for hollow beams. For this, all the twists of the T–θ curve, starting from point ( θ c r I I ; Tcr), are translated to the left by Δ θ (Equations (43) and (44) in Table 2). The criterion to correct the T–θ curve for hollow beams, for the cracked and ultimate state, is illustrated in Figure 4a.
The flowcharts for the calculation algorithm for MVATM in cracked state, including the correction criteria for the twists, are illustrated in Figure 5a (hollow sections) and Figure 5b (plain sections). Only the new/different part of the flowchart is presented in Figure 5b.
The theoretical failure point of the beam under torsion is defined as follows: either the maximum compressive strain in the outer fiber of the concrete struts, εds (Figure 1), or the tensile strain for the torsional reinforcement, εs, reaches its ultimate conventional value (εcu and εsu, respectively).

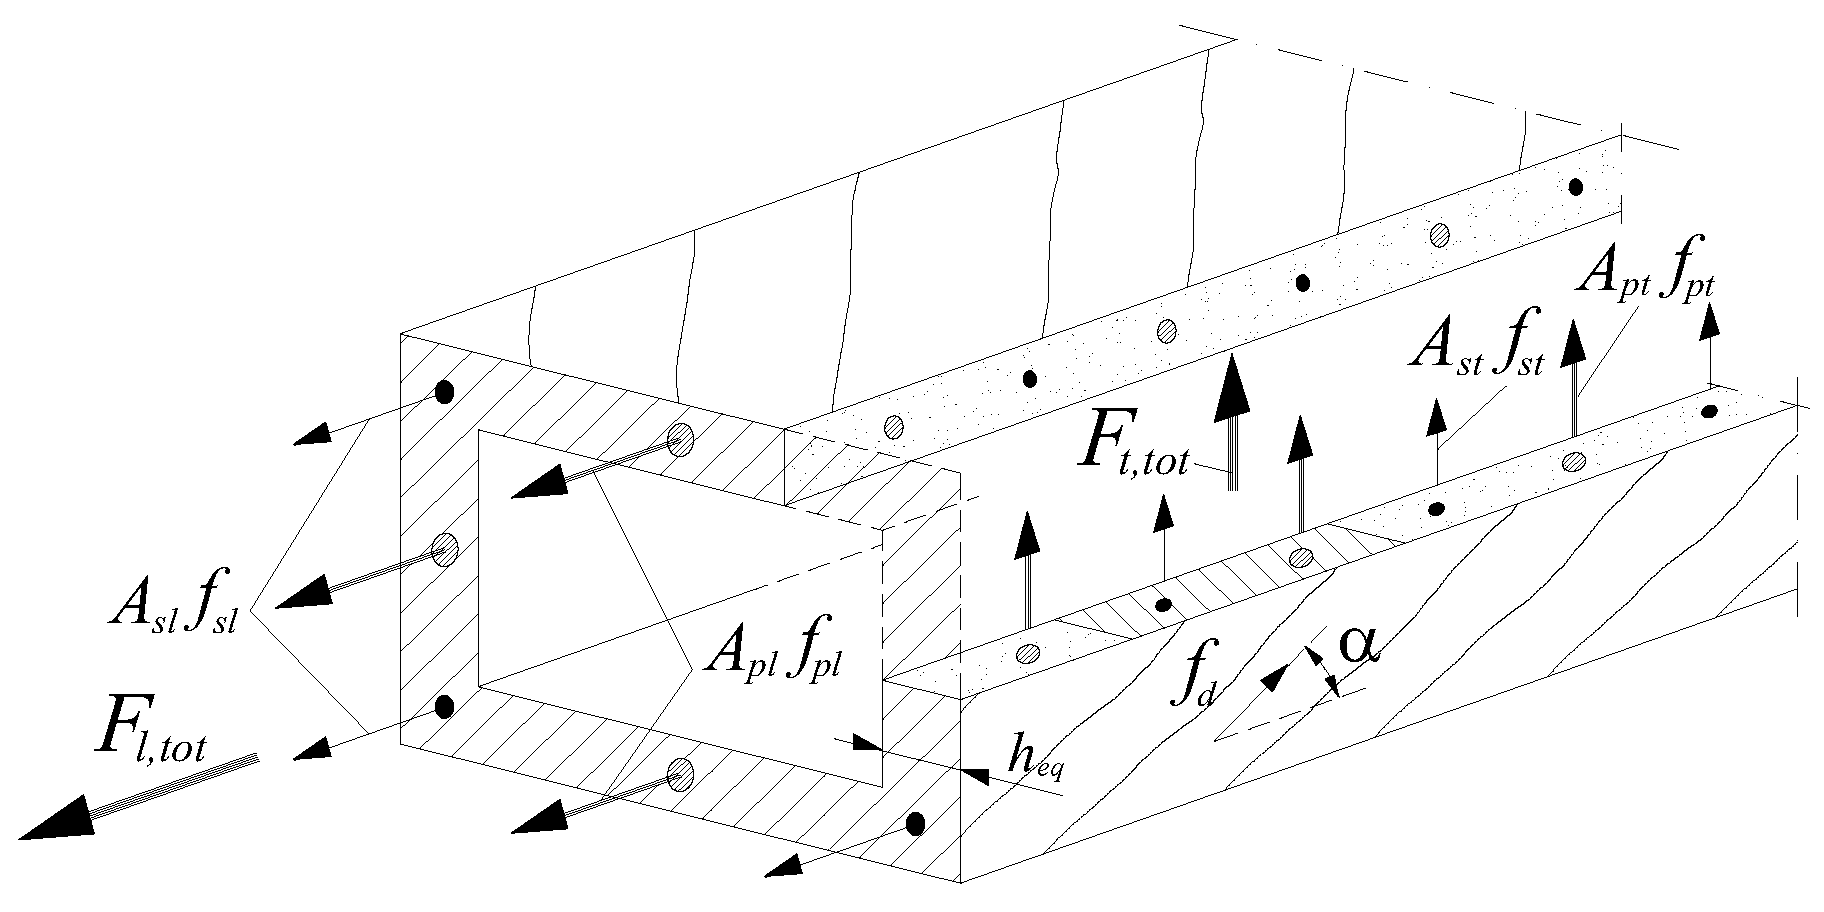
3. Extension of the MVATM for TPC Beams

In this section, the MVATM is extended to cover both longitudinally and transversally prestressed concrete beams. The aim is to propose a generalization of the MVATM for PC beams for which RC, LPC and TPC beams constitutes particular cases. Thus, the MVATM is generalized to beams with combined longitudinal and transversal prestress (LTPC beams).

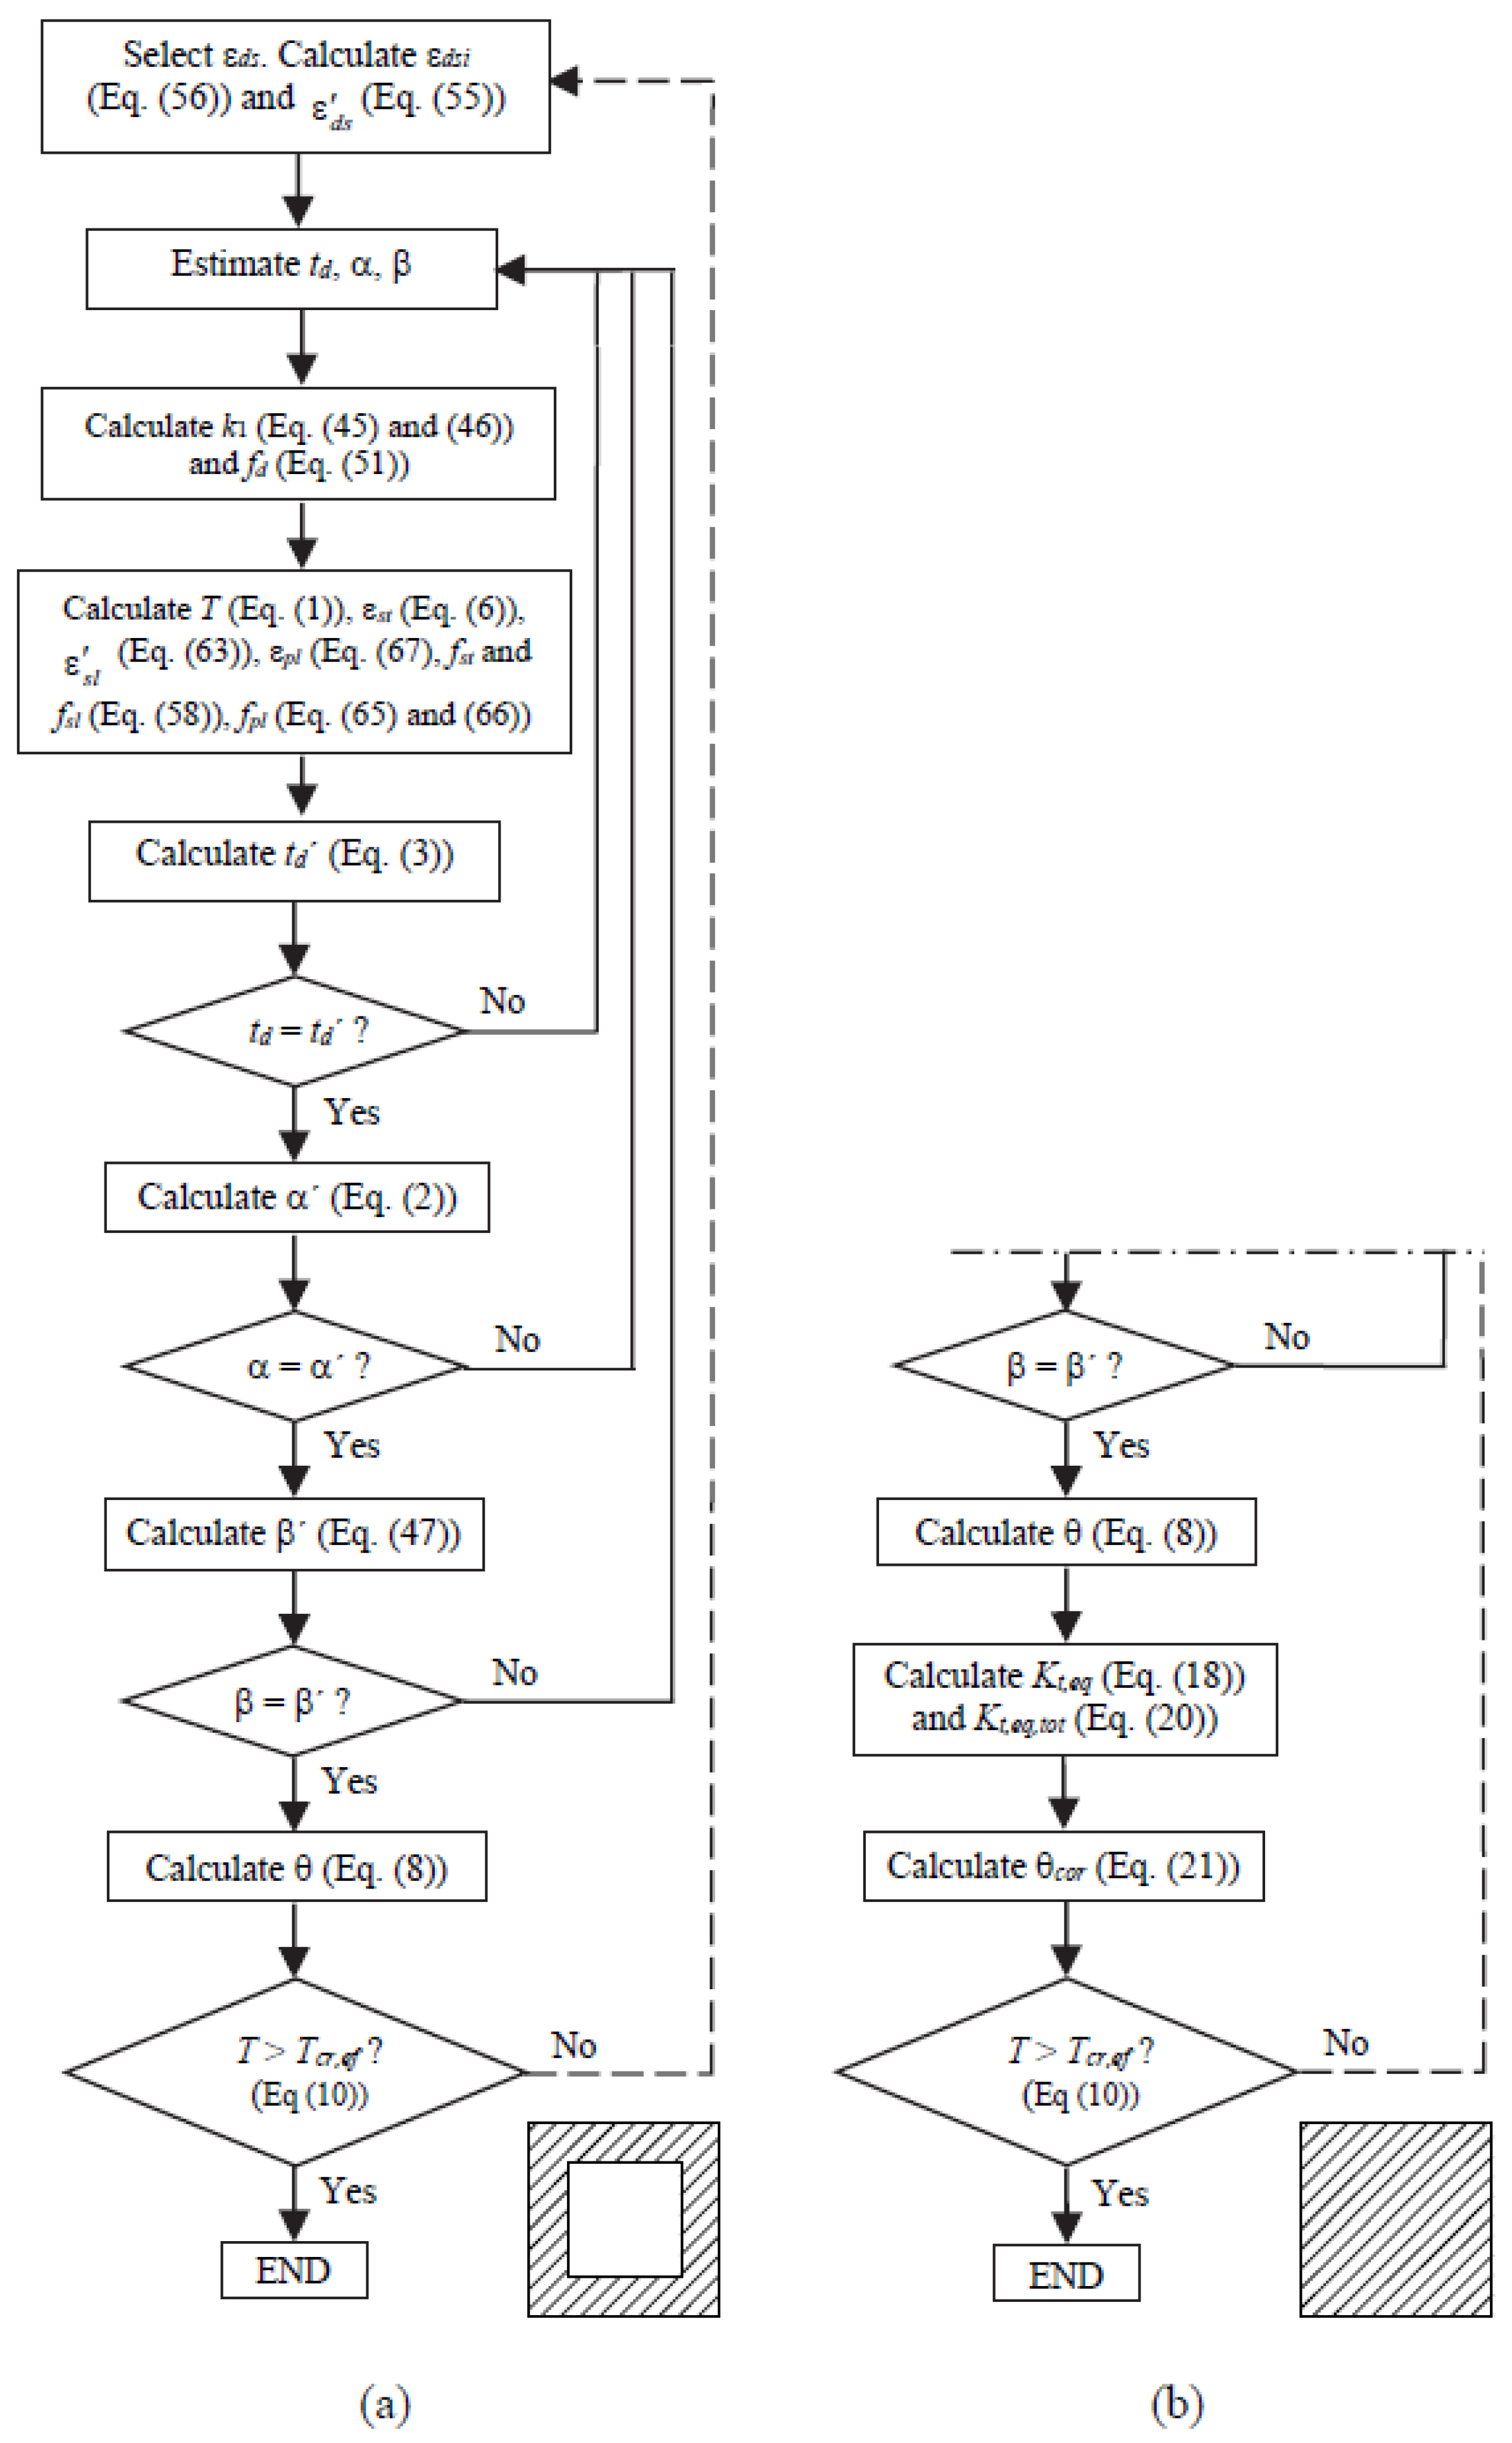
3.1. Non-Cracked State

As previously referred, the upper limit of Zone 1 (Figure 1) is set up with the effective cracking torque Tcr,ef, which is computed from Equation (9) (Table 1) and remains valid both for RC and LPC beams. For TPC or LTPC beams, the failure criterion for concrete under biaxial state, from which Hsu in 1984 [29] proposed the prestress factor incorporated in Equation (9) ( 1 + 10 ( f c p / f c ) ) for LPC beams, must be reviewed.
Let us first consider a hollow beam under a torsional moment, T, combined with a longitudinal prestress stress state, σ, as illustrated in Figure 6a. The biaxial stress state in the element A of the beam (Figure 6b) can be illustrated by the Mohr’s circle in a σ (normal stress)–τ (shear stress) coordinate system, as illustrated in Figure 6c. Failure of the element A will occur when the biaxial stress state reaches a critical value.
For LPC beams, Hsu in 1984 [29] used the Cowen’s failure criterion from 1952 [3], which constitutes a simplification of the Mohr’s failure criterion. This criterion is defined by the following equations which allow to compute the maximum shear stress τ:
τ f c = 0.0396 + 0.120 σ f c 0.1594 ( σ f c ) 2
τ f c = 1 ( f c f t ) 1 + ( f c f t ) σ f c ,
Equation (71) is applied if failure is governed by compression, while Equation (72) is applied if failure is governed by tension. f t is the concrete strength in tension and σ is the concrete compression stress due to the longitudinal prestress.
For usual prestress levels, failure is generally governed by tension [29]. Then, prestress factor is computed from Equation (72). Assuming f c / f t = 10 , Equation (72) can be written as follows:
τ f c = 1 ( f c f t ) 1 + 10 σ f c γ
The prestress factor γ is the ratio between the strength of a beam with and without prestress. Such prestress factor γ is incorporated in Equation (9) (Table 1) to compute the cracking torque.
In this study, for TPC or LTPC beams the prestress factor is obtained in a similar way as previously described. Let us now consider a hollow TPC beam under torsion (Figure 7a). The stress state of the element A (Figure 7b) is illustrated by the Mohr’s circle in Figure 7c.
Comparing Figure 7c and Figure 6c, it can be stated that the unique difference between Mohr’s circles is that Points P and P’ are symmetrical with respect to the σ axis. Then, the Cowen’s failure criterion gives the same prestress factor as the one given from Equation (72). Equation (9) from Table 1 is still valid to compute the cracking torque for TPC beams, being σ the concrete compression stress due to transversal prestress.
For a LTPC hollow beam under torsion (Figure 8a), the stress state of the element A (Figure 8b) is illustrated by the Mohr’s circle in Figure 8c, where σl and σt are the concrete stresses due to longitudinal and transversal prestress, respectively. Comparing Figure 8c and Figure 6c it can be stated that the element A must rotate at an angle Ø (Figure 8c) to meet the same stress conditions (normal stress only in one direction) as for the element A for LPC beam in Figure 6. After element A is rotated, the normal stress in the vertical face is σl + σt (Figure 8c). Then, for LTPC beams the new prestress factor is:
γ = 1 + σ l + σ t f t
One can conclude that for LTPC beams (general case), the cracking torque should be computed from Equation (74) instead of Equation (9) in Table 1.
T c r = 166.1 A c t ( 2.5 f c ( MPa ) ) 1 + 10 σ l + σ t f c   ( × 0.85   if   f c 50   MPa )
If the transversal prestress reinforcement is bonded to the concrete and also located in the outer area of the cross section, it is considered effective to delay concrete cracks. Then the transversal reinforcement ratio, ρt, must also incorporate this reinforcement as follows:
ρ t = A s t u A c s + n p A p t u p A c s p
where Apt is the area of one unit of the transversal prestress reinforcement, up is the perimeter and sp the longitudinal spacing of the reinforcement. Equation (75) should substitute Equation (12).
For TPC beams, the homogenization of the cross section to include the influence of the concrete in tension, for both longitudinal and transversal directions, must also consider the transversal prestress reinforcement. In the same way as presented in Section 2.1 for LPC beams, now the total distributed transversal force, Ft,tot, considers the contribution of the transversal prestress reinforcement as follows (see Figure 9):
F t , t o t = A t h f t / s = ( A t / s + n A c t , e q / s + n p A p t / s p ) f t
Equation (76) substitutes Equation (5) in Table 1 to compute the effective depth of the struts td (Equation (3) in Table 1).
From the VATM [7,8] for RC and LPC beams, the calculation of the angle of the concrete struts, α, can be performed with Equation (77) which is related with the force in the transversal direction, instead of Equation (2) in Table 1.
s e n 2 α = F t , t o t f d t d
For TPC beams, Ft,tot must be computed from Equation (76) in order to incorporate the contribution of the transversal prestress reinforcement.
In order to use one simple equation to calculate α and also to generalize such equation for any type of beam (RC, LPC, TPC or LTPC), an alternative and general equation is proposed. For this, Equation (77) is divided by Equation (2) from Table 1. The new Equation (78) substitutes Equations (77) and (2) from Table 1.
t g 2 α = s e n 2 α c o s 2 α = F t , t o t p o F l , t o t
All the other equations from Table 1 remain unchanged and valid for TPC and LTPC beams.
The reduction factors βσ = βε depends on parameter η (Equation (48) in Table 3), which represents the ratio between the resisting forces in the longitudinal and transversal reinforcement. For TPC beams, parameter η must also account for the resistance force in the transversal prestress reinforcement. Then η is calculated as follows:
η = ρ s l f s l y + ρ p l f p l 0.1 % ρ s t f s t y + ρ p t f p t 0.1 %
ρ p t = A p t u p A c s p
where:
  • ρpt = transversal prestress reinforcement ratio;
  • fpt0.1% = conventional proportional stress of the transversal prestress reinforcement.
Equations (79) and (80) substitute Equations (48) and (48b), respectively, in Table 3.
For TPC beams, the calculation procedure to compute the strain in the transversal prestress reinforcement, εpt, which is need to compute the stress, fpt, should follows identical steps as the ones presented in Section 2.1 for LPC beams. The equations are the following ones:
ε p t = ε p i , t + ε t
ε p i , t = f p i , t E p t
ε s t = ε s t i + ε s t
ε s t i = 2 A p t s p f p i , t 2 A s t s ( E s E c ) + ( A c A h 2 A p t s p ) E c
For LTPC beams, Equations (81) and (82) must be used with Equations (67) and (68) in Table 5, while Equations (83) and (84) must be used with Equations (62) and (63) in Table 4.
In TPC beams, the effective strain in the transversal ordinary reinforcement must be calculated accounting that it undergoes an initial compressive strain εsti due to the transversal prestress. The strain in the transversal reinforcement εst due to the external torque T is calculated with Equation (6) from Table 1.
The outer fiber of the concrete struts also undergoes an initial compressive strain εdsi due to the transversal prestress. If a 45 degrees angle is assumed for the direction of the struts for the pre-cracked state, then εdsi can be simply computed as follows (see Figure 10b):
ε d s i ε s t i c o s   45
For LTPC beams, the outer fiber of the concrete struts undergoes an initial compressive strain due to both longitudinal and transversal prestress. Again, by assuming a 45 degrees angle for the direction of the struts, εdsi can be computed as follows (see Figure 10):
ε d s i ε s l i + ε s t i c o s   45
All the other equations presented in Section 2.1 remains valid for TPC and LTPC beams, including the procedure to correct the twists in order to incorporate the influence of the concrete core for plain beams (Table 1).
For LTPC beams, the flowchart for the calculation algorithm is the same as the one illustrated in Figure 3a (hollow sections) and Figure 3b (plain sections). The differences are only related with the correction of some steps in order to substitute some equations and add new ones:
-
1st step: Select εds. Calculate εdsi (Equation (86)) and ε d s Equation (55));
-
-
4th step: Calculate T (Equation (1)), εst (Equation (6)), ε s l (Equation (63)), ε s t (Equation (83)), εpl (Equation (67), εpt (Equation (81)), fst and fsl (Equations (58)), fpl and fpt (Equations (65) and (66));
-
-
7th step: Calculate α′ (Equation (78));
-
-
12th step: T > Tcr,ef ? (Equation (74));
-

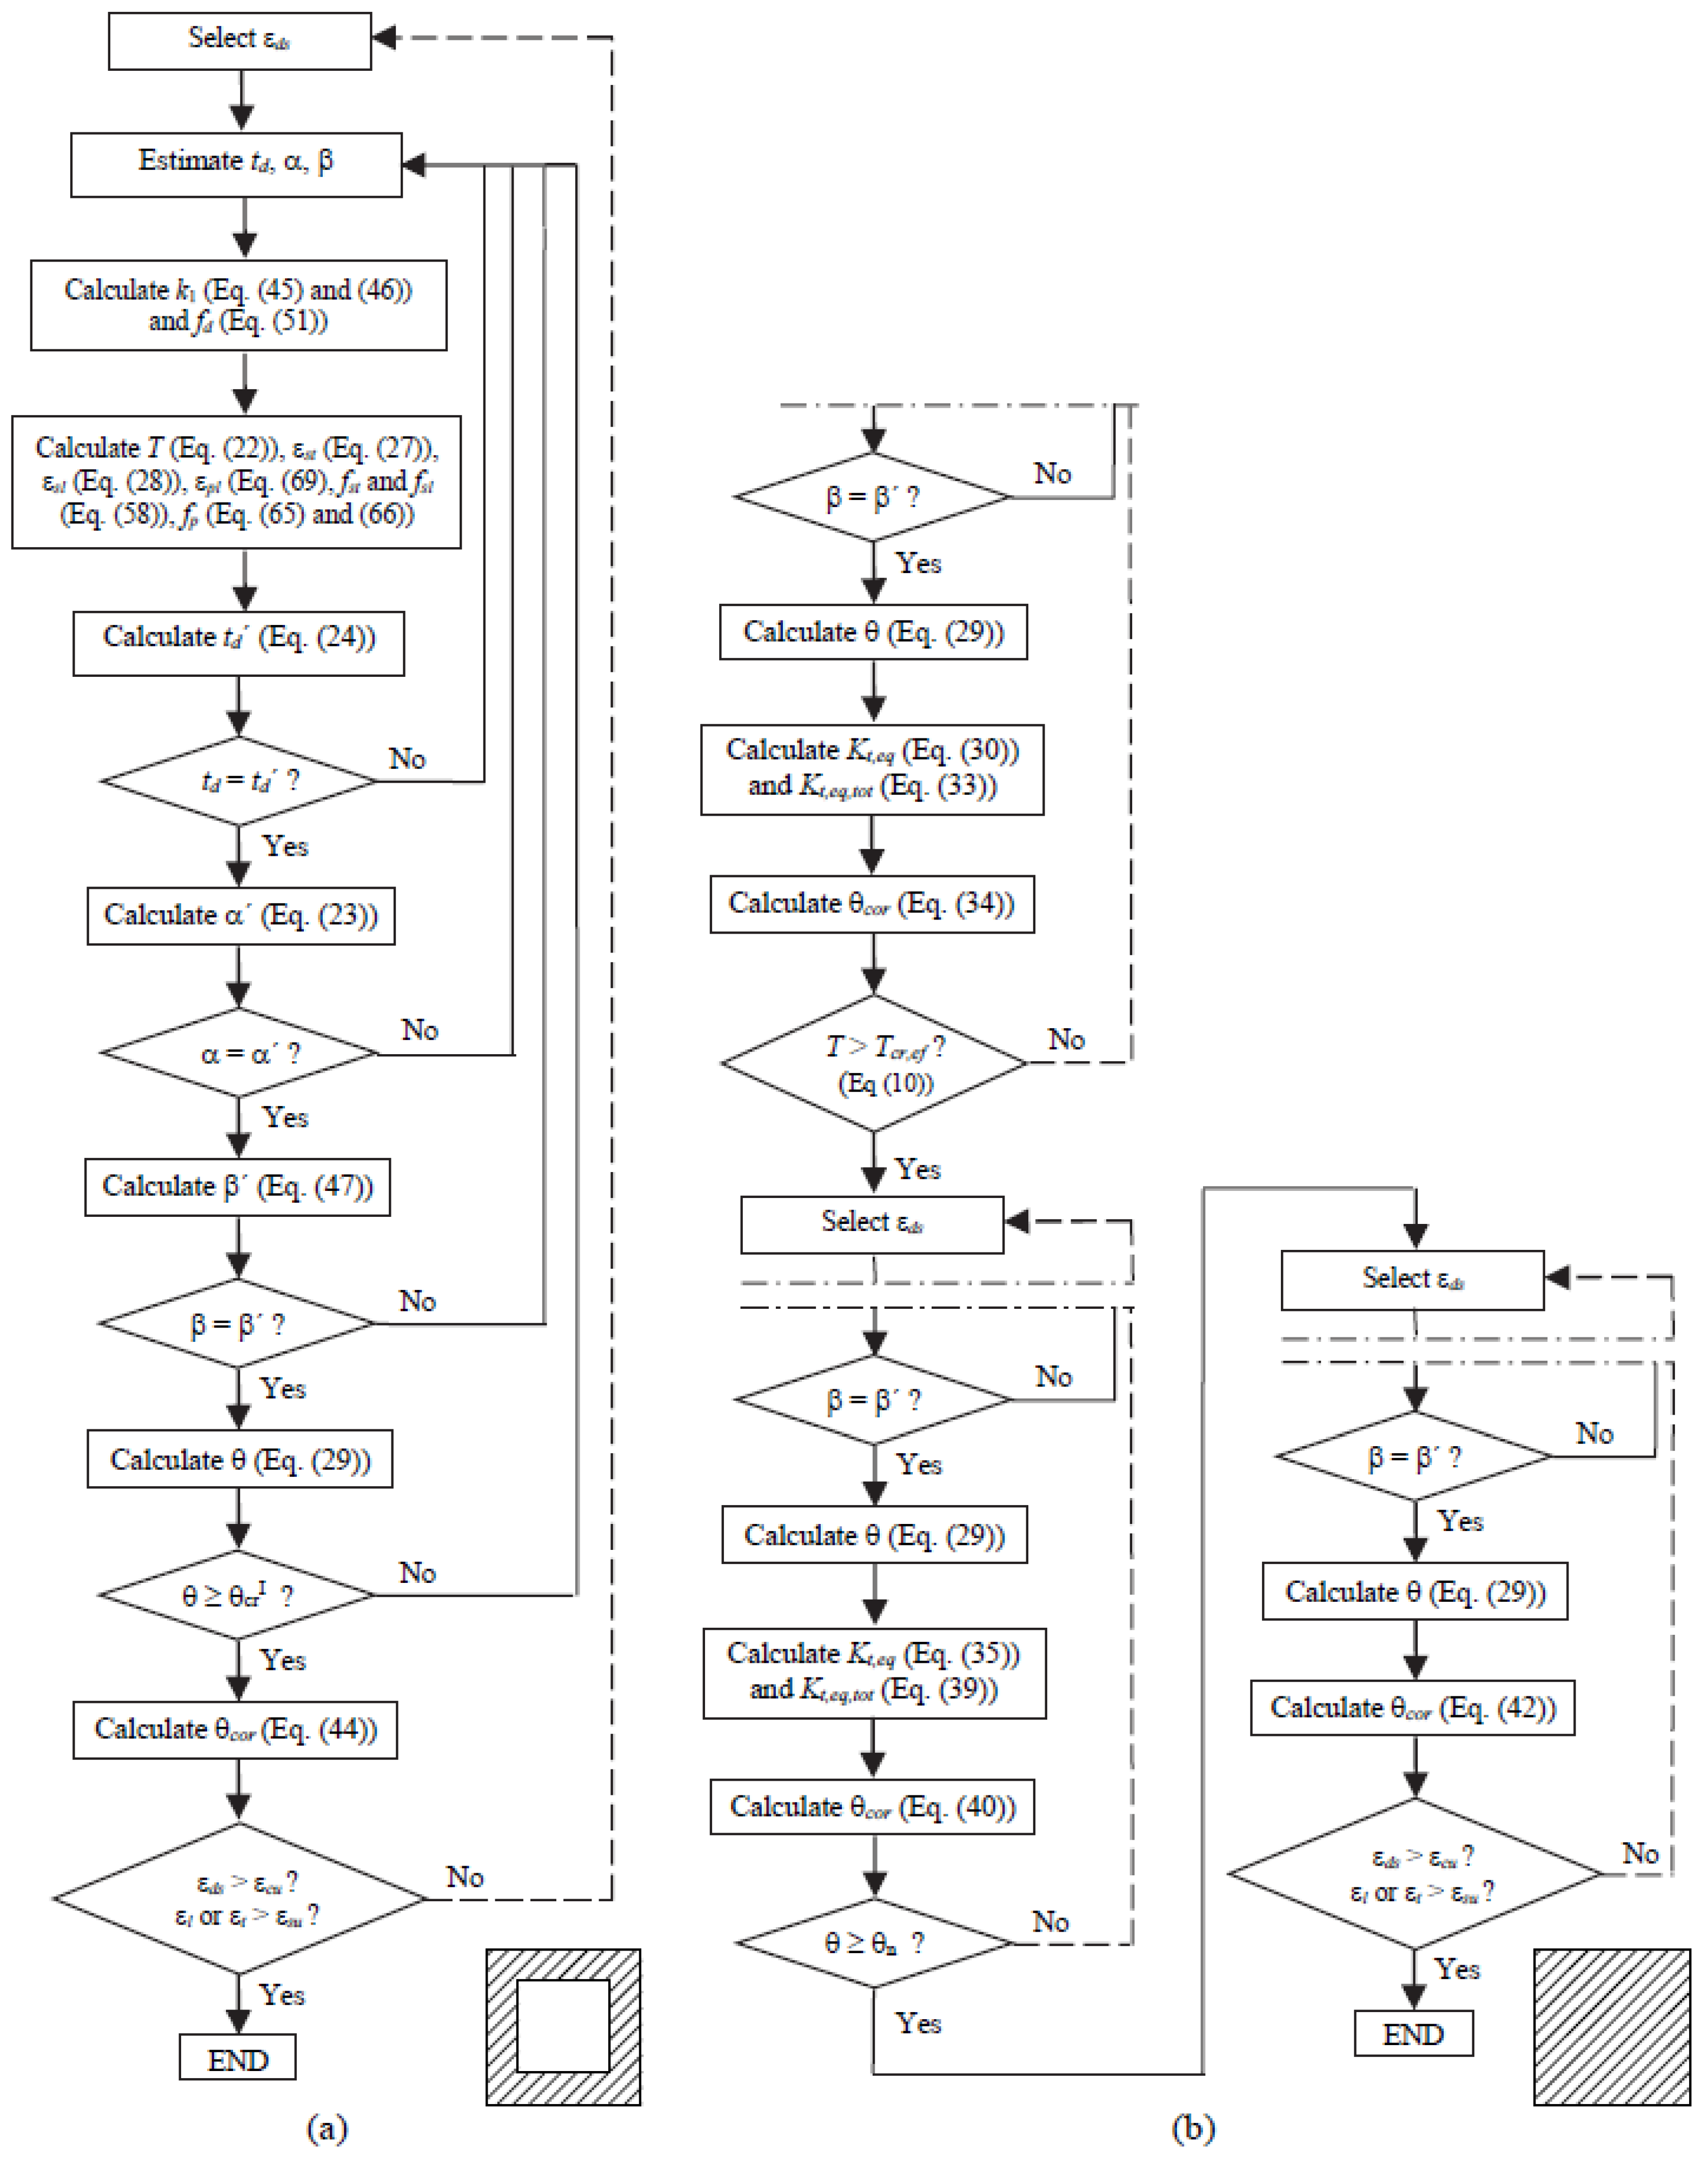
3.2. Zone 2a (Cracked State)

In the same way as described for LPC beams (Section 2.2), after the cracking torque is reached, the influence of the tensile concrete vanishes. Thus, the equilibrium equations incorporate only the forces in the reinforcements, including prestress reinforcement (Asl fsl + Apl fpl and Ast fst/s + Apt fpt/sp for longitudinal and transversal reinforcements, respectively).
From VATM and for RC an LPC beams [7,8], the calculation of the angle of the concrete struts, α, can be performed with Equation (87), which is related with the force in the transversal direction, instead of Equation (23) from Table 2.
s e n 2 α = A s t f s t s f d t d
For TPC beams, Equation (87) must be rewritten in order to replace the transversal force (per unit length) in the ordinary reinforcement (Ast σst/s) by the total transversal force (also per unit length) including both the ordinary and prestress reinforcement (Ast fst/s + Apt fpt/sp):
s e n 2 α = A s t f s t s f d t d + A p t f p t s p f d t d
where fpt is the stress in the transversal prestress reinforcement.
In order to use one simple equation to calculate α and to generalize this equation for any type of beams (RC, LPC, TPC or LPTC beams), an alternative equation is proposed by taking the ratio between Equations (88) and (23) from Table 2. This new equation substitutes Equations (88) and (23) from Table 2.
t g 2 α = s e n 2 α c o s 2 α = A s t f s t s + A p t f p t s p A s l f s l p o + A p l f p l p o
In the same way, since the longitudinal equilibrium equation is also used to compute the effective depth of the concrete struts (td), Equation (24) must also incorporate both the total longitudinal and transversal forces (general case):
t d = A s l f s l p o f d + A s t f s t s f d + A p l f p l p o f d + A p t f p t s p f d
Equation (90) substitutes Equation (24) from Table 2.
All the other equations presented in Section 2.2 remains valid for TPC and LTPC beams.
The flowchart for the calculation algorithm to compute the new T–θ curve for cracked state is the same as the ones illustrated in Figure 5a (hollow sections) and Figure 5b (plain sections), with td′ and α′ calculated with Equations (90) and (89), respectively.

3.3. Zones 2.b and 3 (Cracked and Ultimate States)

The calculation procedure presented in Section 2.3 remains valid, including the procedure to correct the twists in the cracked state to incorporate the influence of the concrete core for plain sections. The flowchart for the calculation algorithm to compute the new T–θ curve for the cracked state is the same as the ones illustrated in Figure 5a (hollow sections) and Figure 5b (plain sections), with the corrections presented in Section 3.2.

4. Theoretical Parametric Study

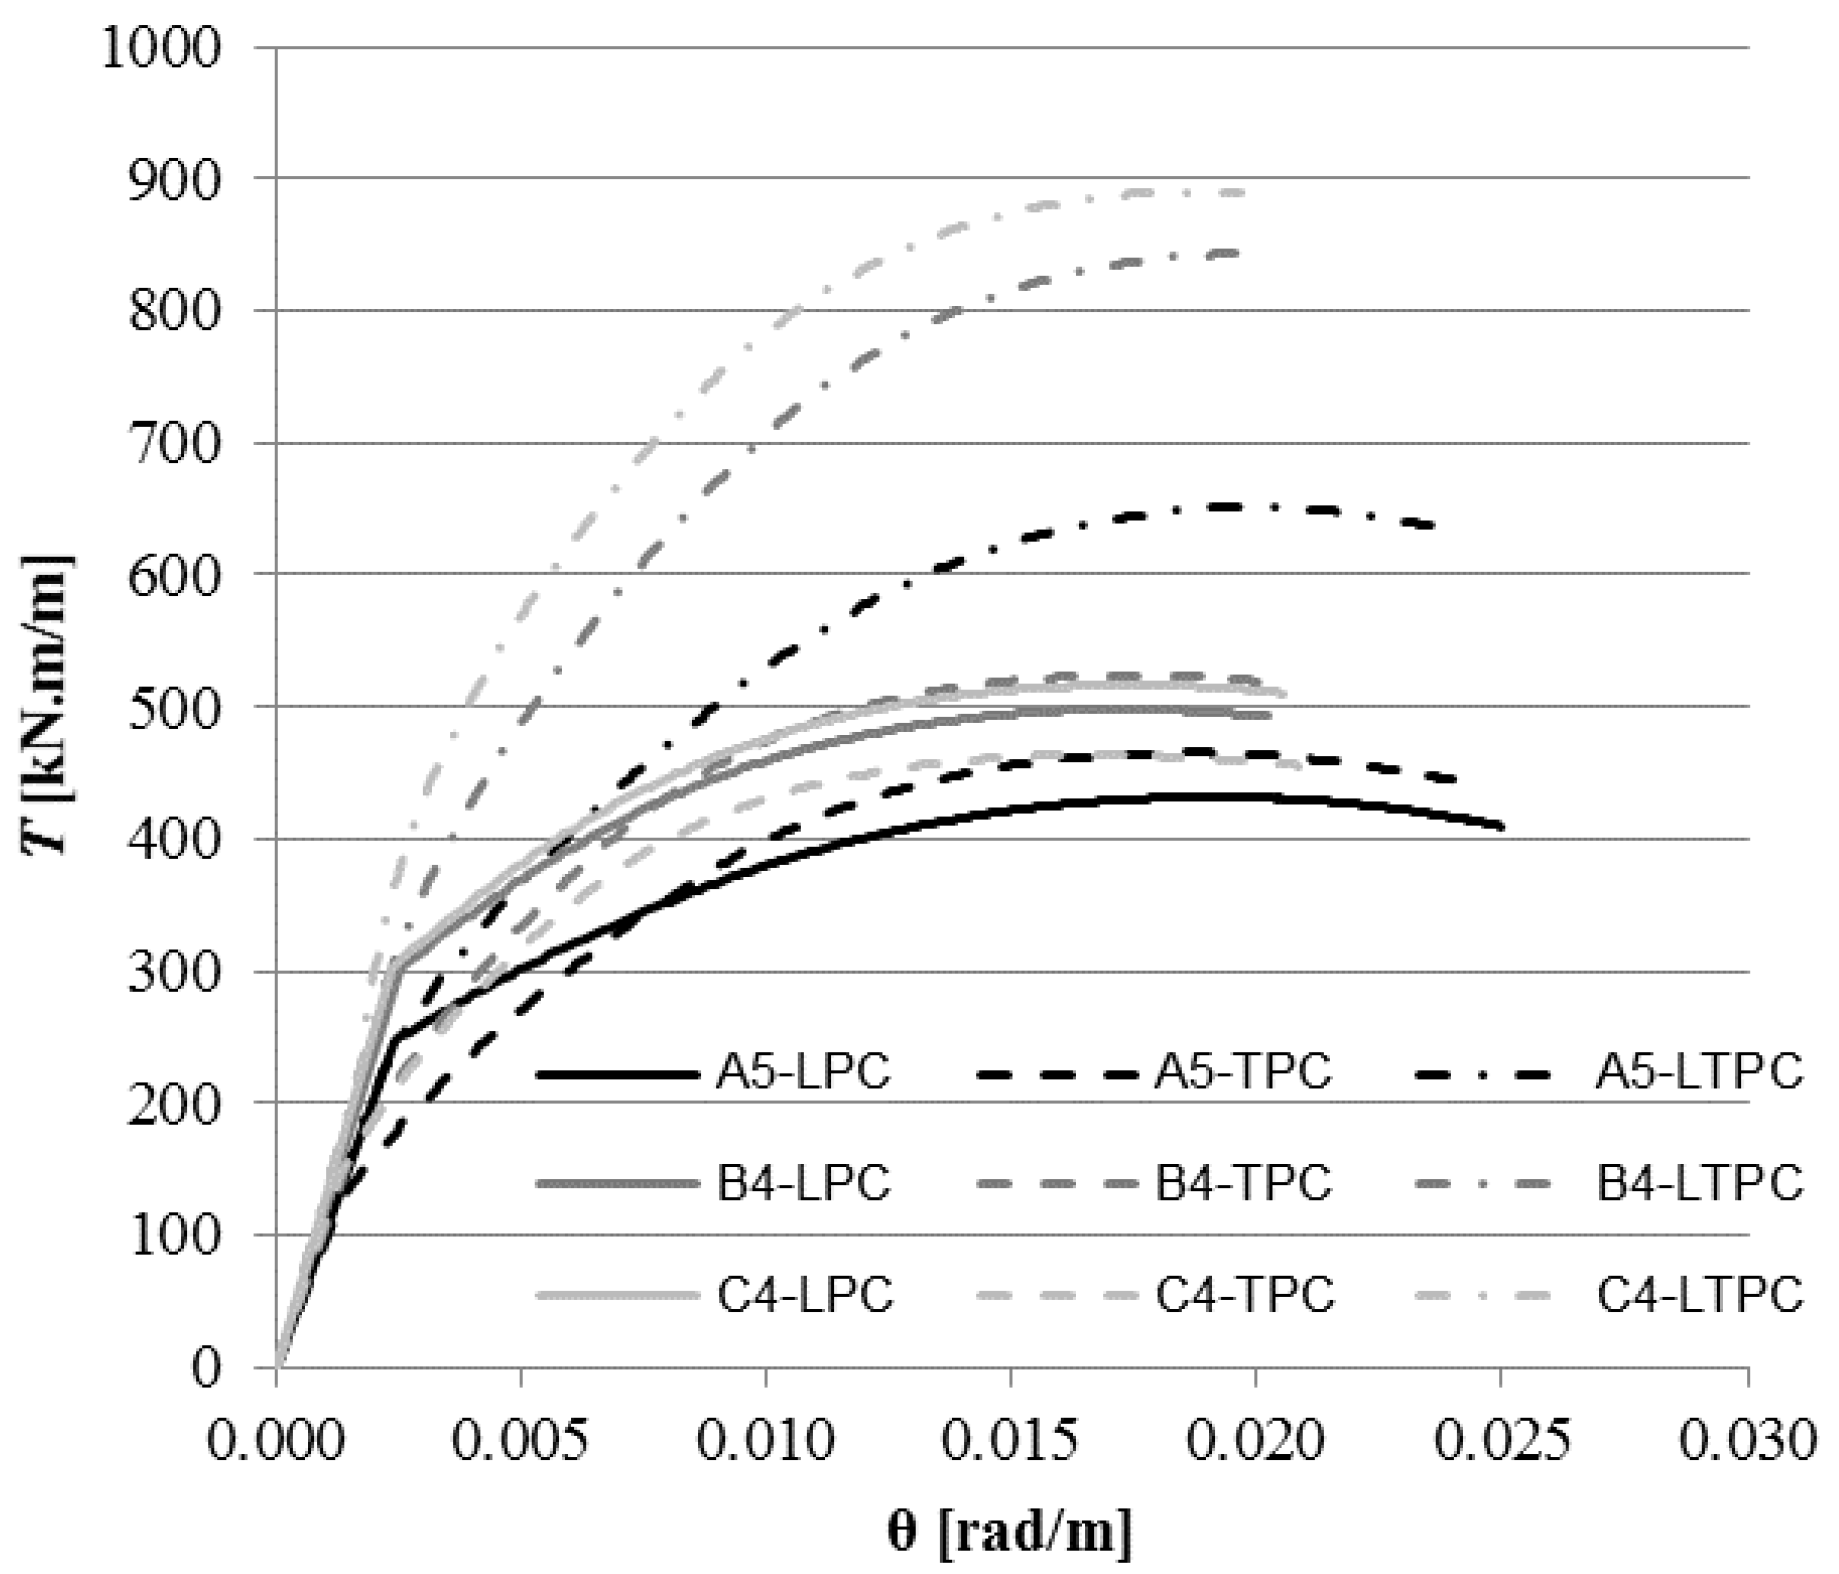
4.1. Reference Beams and Study Variables

In this section, some theoretical results obtained with MVATM extended to TPC beams are used to compare the global behavior under torsion of TPC, LPC and LTPC beams. For this purpose, the series of squared RC hollow beams tested by Bernardo and Lopes in 2009 [26] are used as reference beams. Among the sixteen beams tested by the authors, a set of nine beams were chosen in order to allow grouping beams with similar concrete strength and different torsional reinforcement ratio (including beams with ductile and brittle failure) and also beams with similar torsional reinforcement ratio and different concrete strength (including beams with normal-strength concrete–NSC–and high-strength concrete–HSC).
Table 6 summarizes the geometrical and mechanical properties of the nine chosen squared RC hollow beams, namely: the external width (x) and height (y) of the cross section, the thickness of the walls (t), the distances between centerlines of legs of the closed stirrups (x1 and y1), the area of longitudinal reinforcement (Asl), the distributed area of one branch of the transversal reinforcement (Ast/s, where s is the spacing of transversal reinforcement), the longitudinal reinforcement ratio ( ρ s l = A s l / A c , with A c = x y ) and the transversal reinforcement ratio ( ρ s t = A s t u / ( A c s ) , with u = 2 ( x 1 + y 1 ) ), the average concrete compressive and tensile strength ( f c m f c and f c t m f c r ), the average yielding stress of longitudinal and transversal reinforcement (flym and ftym), the concrete Young’s Modulus (Ec), the compressive strains for concrete (peak stress value, ε o , and maximum value, εcu). For the reinforcement, usual values were adopted for the conventional maximum tensile strain (εlu = εtu = 10‰) and Young’s Modulus (Es = 200 GPa). It should be noted that, for all the nine beams, longitudinal and transversal reinforcement ratios are equilibrated.
For the objectives of this section, the reference beams will be theoretically prestressed in the longitudinal direction (LPC), in the transversal direction (TPC) and in both directions (LTPC). A moderate prestress level is chosen with respect to the concrete compressive strength (fcp) for LPC and TPC beams: f c p = 0.225 f c , with fcp the compressive stress in concrete due to prestress. This value was chosen from the range of allowed values imposed by ACI Code ( f c p , m a x ACI = 0.45 f c ).
To evaluate the efficiency of transversal prestress, when compared with longitudinal prestress, the chosen criteria was to impose the same stress state in the concrete (fcp) for LPC and TPC beams. The areas of prestress reinforcement were chosen so that the prestress reinforcement ratios for each direction are similar. For LTPC beams, the chosen criterion was to assume half of the previously referred prestress level for each direction. With this criterion, the total prestress reinforcement ratio is the same for all the studied beams (LPC, TPC and LTPC), since this quantity is related with the total prestress force to be applied.
For the parametric analysis, the following study variables were considered: the concrete compressive strength ( f c ) and the total reinforcement ratios ( ρ l , t o t = ρ s l + ρ p l , ρ t , t o t = ρ s t + ρ p t , with ρsl, ρst, ρpl and ρpt computed with Equation (48a)–Table 3, Equation (12)–Table 1, Equation (48b)–Table 3 and Equation (80), respectively). To calculate ρpt, it is assumed that up is equal to the perimeter of the center line of the walls.
Table 7 presents the information about prestress for the studied reference beams, namely: the total area of longitudinal prestress reinforcement (Apl), the distributed area of one branch of the transversal prestress reinforcement (Apt/sp, where sp is the spacing of the transversal prestress reinforcement), the ratio of longitudinal and transversal prestress reinforcement (ρpl and ρpt, respectively), the average stress in concrete due to prestress for each direction (fcpl and fcpt, respectively). For the prestress reinforcement, usual values were adopted for the proportional conventional limit stress to 0.1% (fp0.1% = 1670 MPa) and Young’s Modulus (Ep = 195 GPa). The initial stress in the prestress reinforcement for each direction (fpli and fpti) was considered constant and equal to 1350 MPa. This value corresponds to a current chosen design criteria to compute the area of prestress reinforcement, it corresponds to 0.75fpu with fpu the tensile strength of the prestress reinforcement, which is assumed to be equal to 1800 MPa.

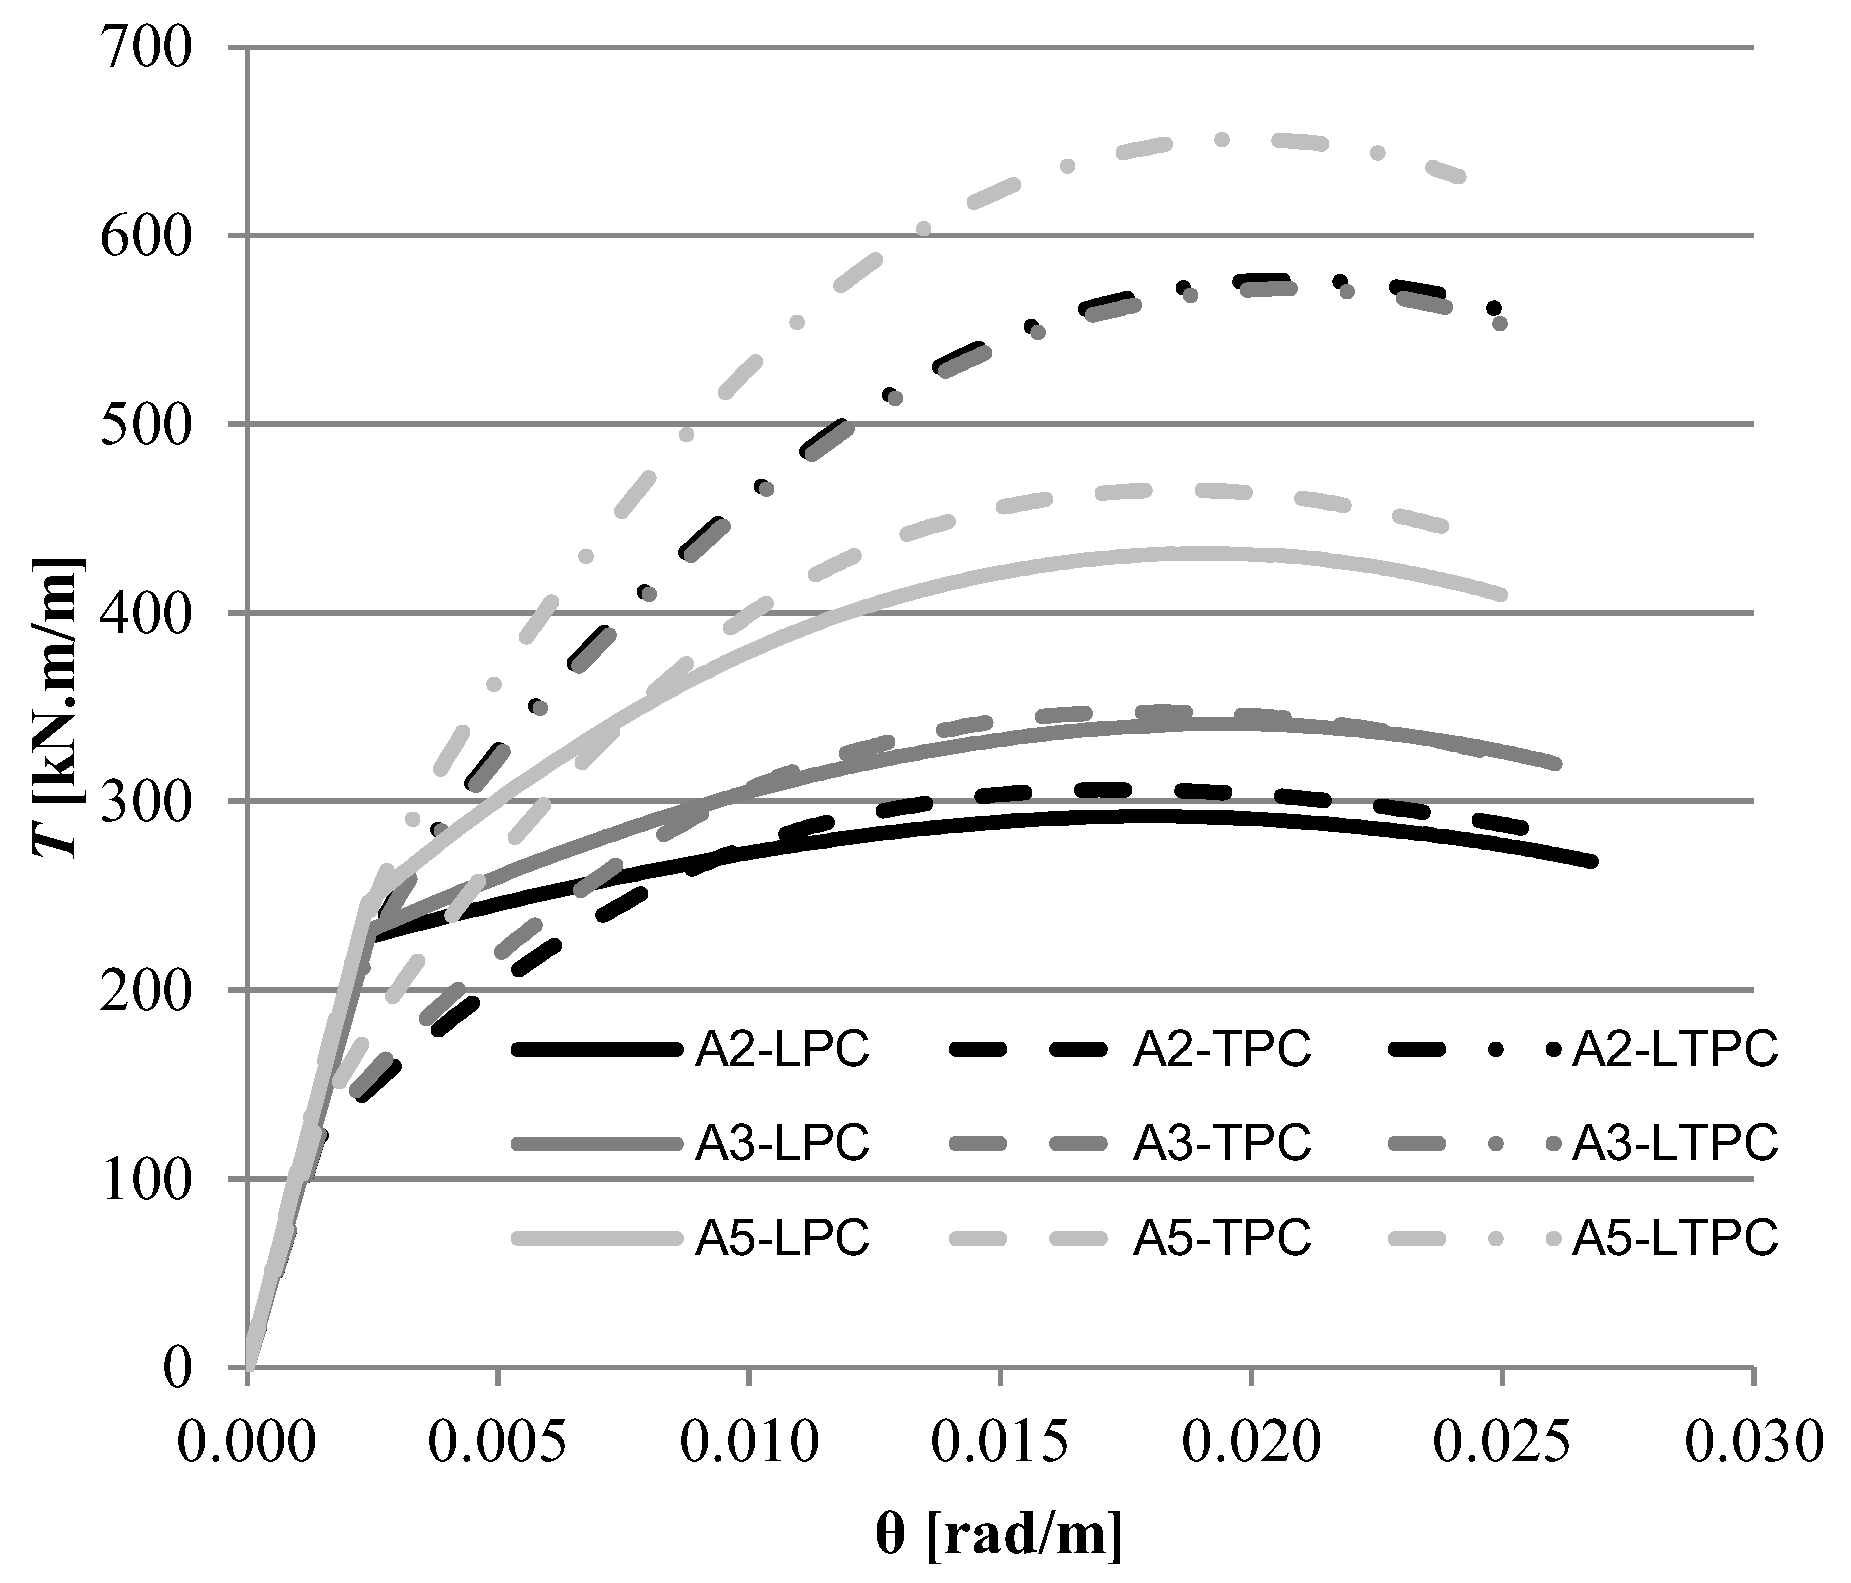
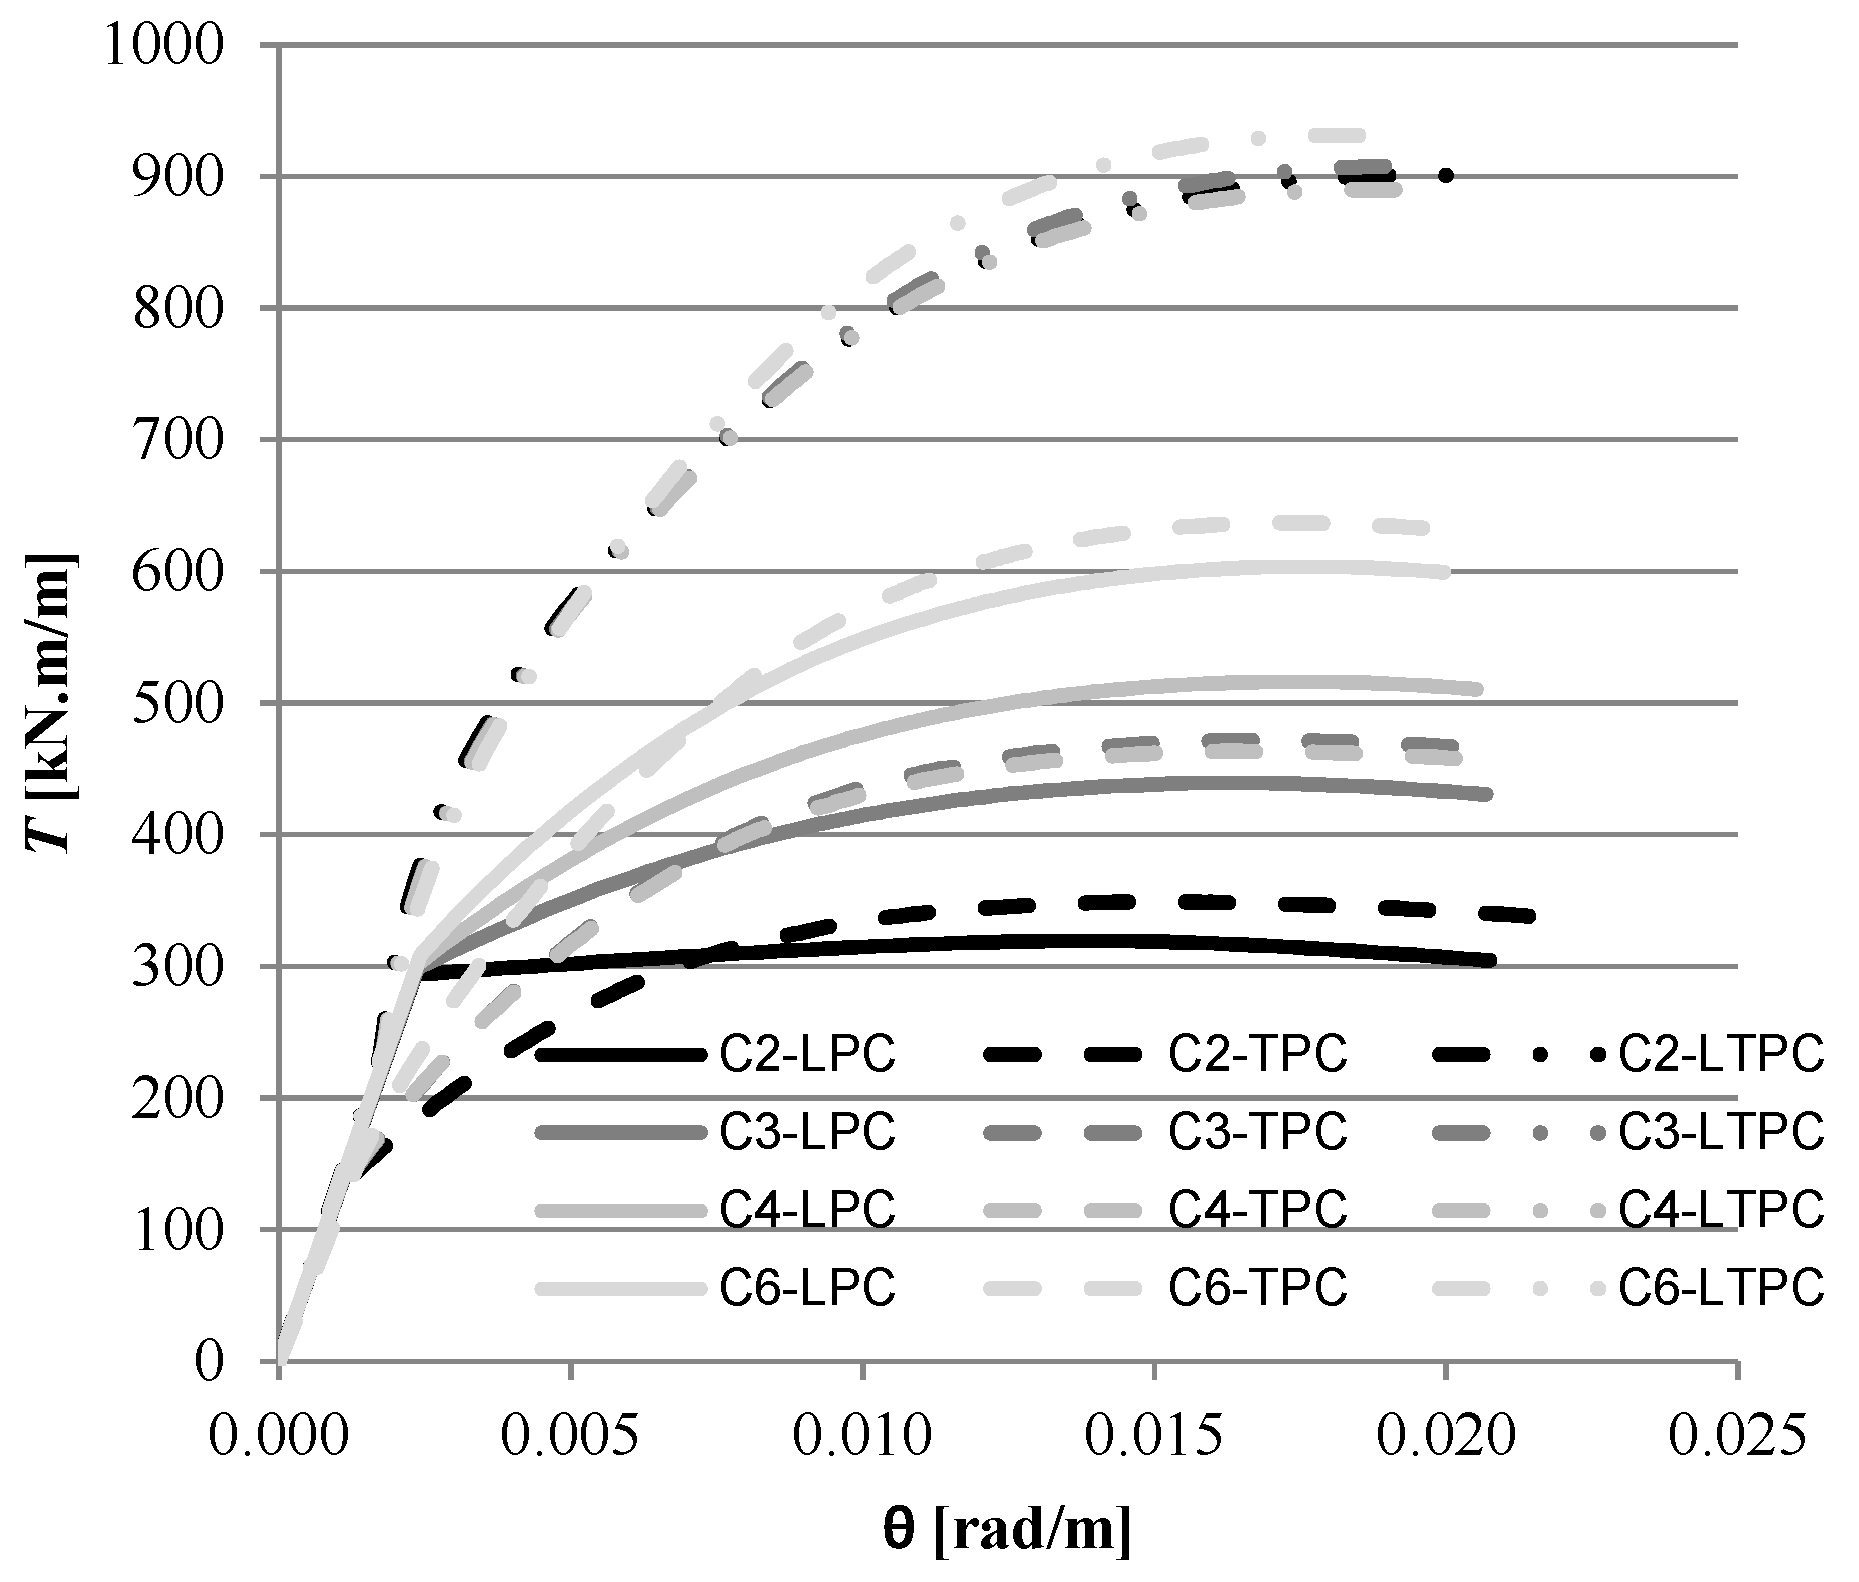
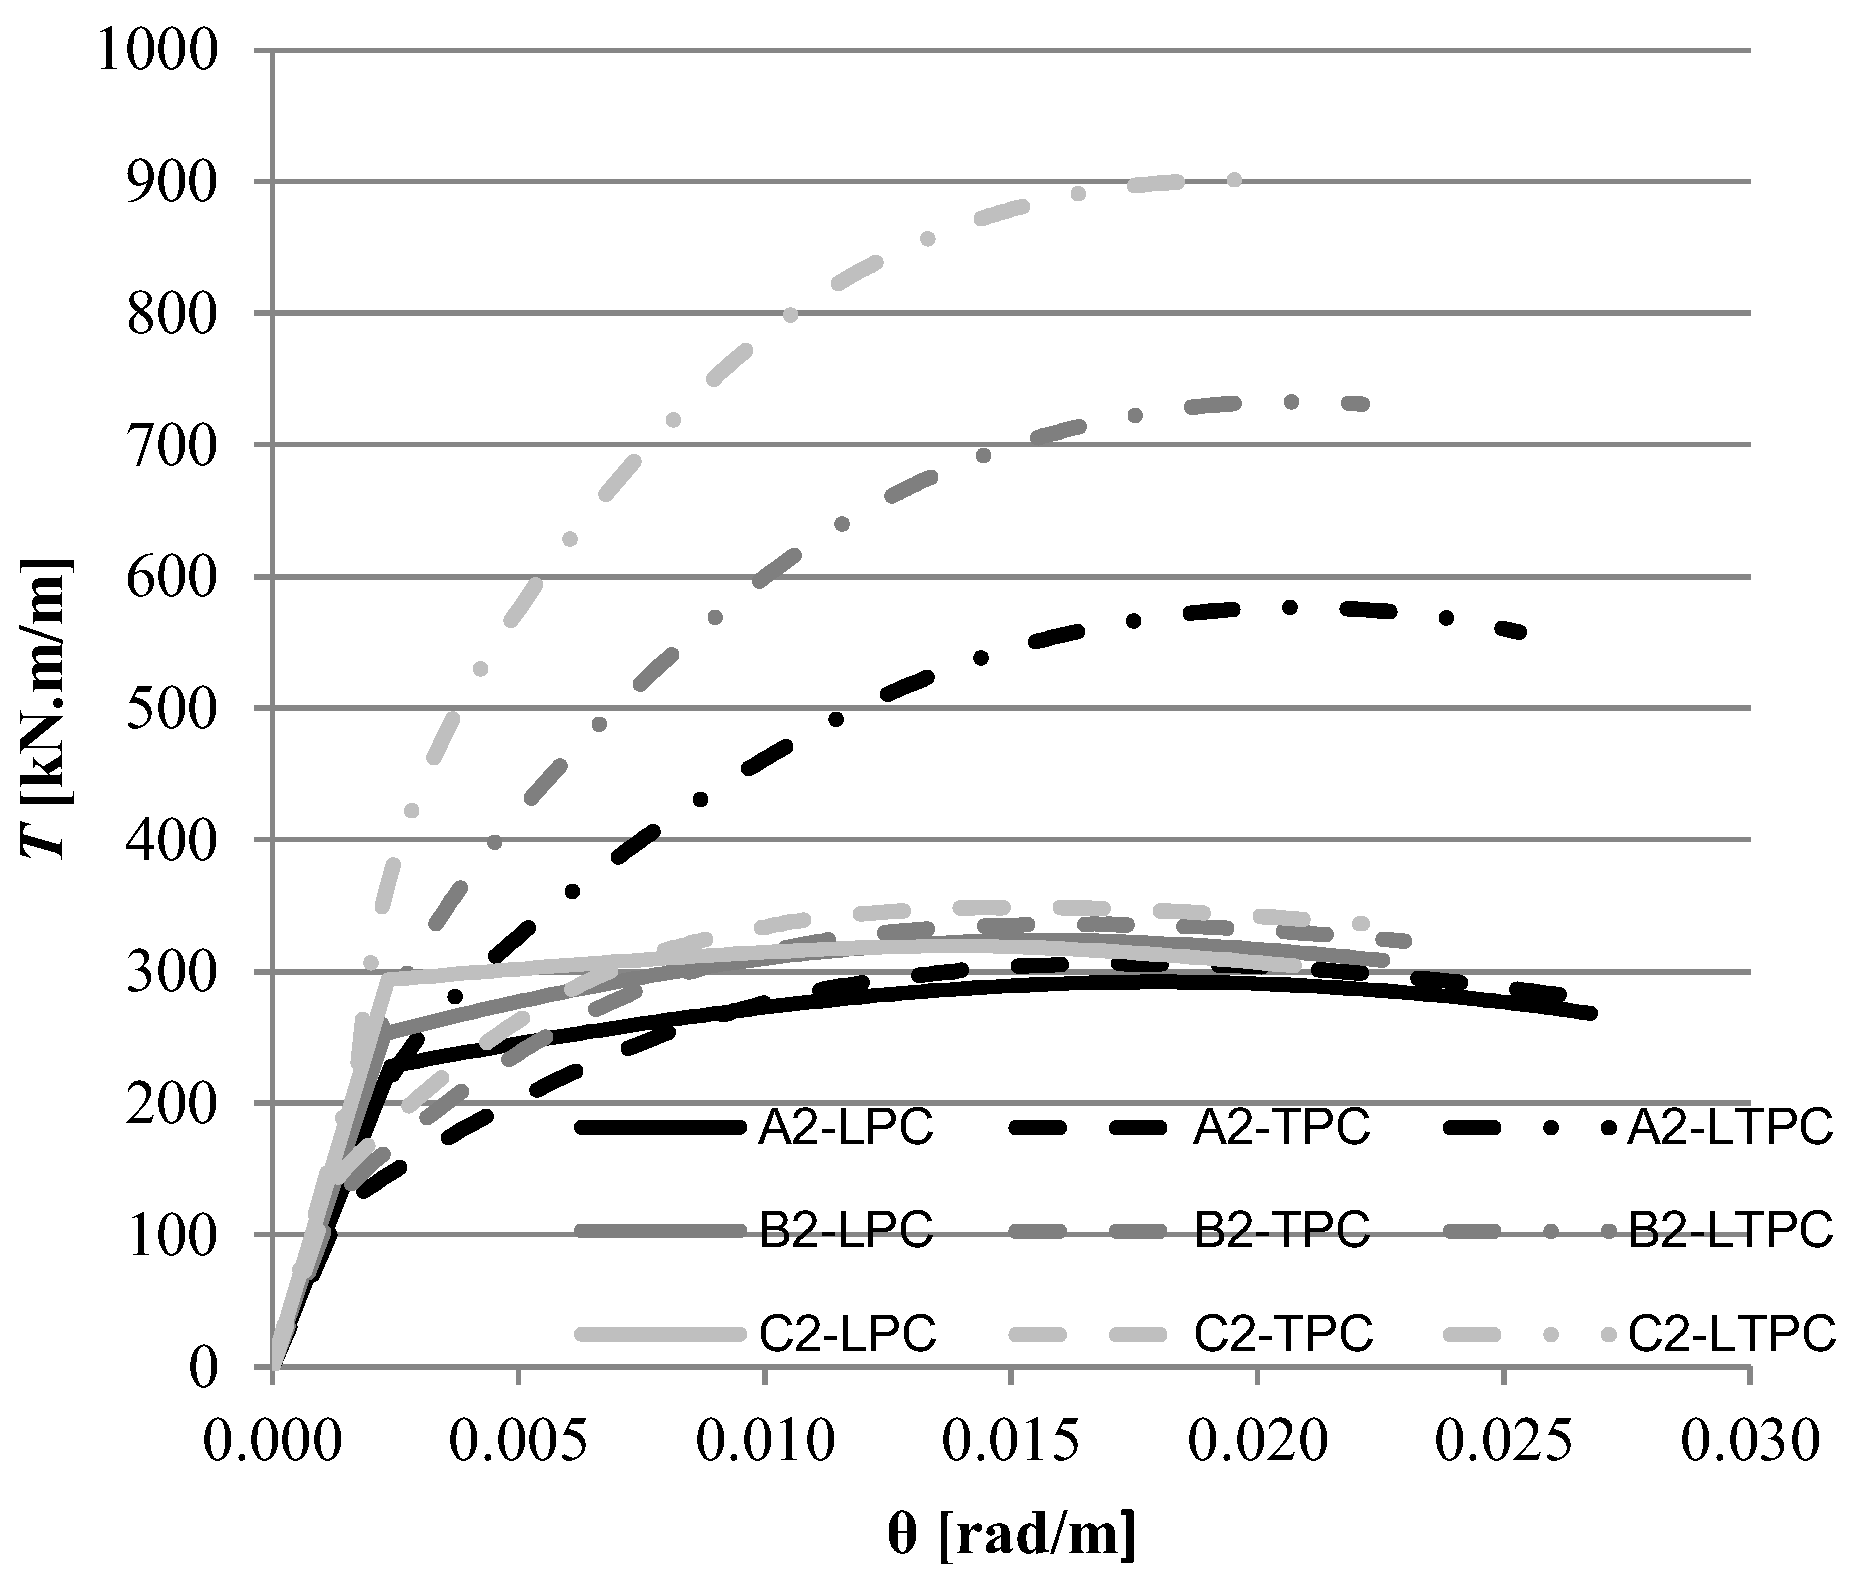
4.2. Comparative Analysis

Based on the extended MVATM presented in this study, the theoretical T–θ curves for all the reference beams presented in Table 6 and Table 7 were computed. The results are presented in Figure 11, Figure 12, Figure 13 and Figure 14. The T–θ curves are grouped for beams with similar concrete strength (Figure 11 for NSC beams and Figure 12 for HSC beams), as well as for beams with similar total reinforcement ratio (Figure 13 for high torsional reinforcement ratio–torsional brittle failure, and Figure 14 for low torsional reinforcement ratio–torsional ductile failure).
From Figure 11, Figure 12, Figure 13 and Figure 14, it can be stated that the cracking torque is higher for LPC beams, when compared with TPC beams. This seems to show that longitudinal prestress is more effective for low loading levels, namely to delay the cracked state. Since the initial average compressive stress in concrete due to prestress is the same (in magnitude) for both LPC and TPC beams, this result show that the cracking torque strongly depends on the prestressing direction. For LTPC beams, the cracking torque is also higher when compared with TPC beams, and similar when compared with LPC beams. Despite LTPC beams incorporate only half of the prestress level for each direction, when compared with LPC and TPC beams, the biaxial compressive stress state in LTPC beams shows to be also effective to delay the cracking state.
For high loading levels, Figure 11, Figure 12, Figure 13 and Figure 14 show that the torsional behavior of LPC and TPC beams with the same prestress level is very similar, namely for the resistance torque. In fact, it should be remembered that for high loading levels, PC beams behaves as current RC beams. The total reinforcement ratio in the prestressing direction is very similar for both LPC and TPC beams in Figure 11, Figure 12, Figure 13 and Figure 14. Then, from the previous observations it can be stated that transversal prestress seems to be equally effective for the resistance torque when compared with longitudinal prestress.
For LTPC beams, the resistance torque and the torsional stiffness in the cracked state are higher when compared with those of LPC and TPC beams. Despite LTPC beams incorporate the same total amount of prestress reinforcement, as for LPC and TPC beams, the results show that the distribution of the prestress reinforcement in both directions (longitudinal and transversal) is better to enhance the torsional behavior of the beams for the ultimate state.

5. Conclusions

In this study, the MVATM was extended to cover TPC beams under torsion. For this, the changes in the VATM formulation were presented in order to incorporate the influence of transversal prestress, in addition to longitudinal prestress.
Based on the extended MVATM, a global calculation procedure was defined and implemented with an appropriate programming language (DELPHI). The extended MVATM allows to predict the entire T–θ curve for beams under torsion, including RC, LPC, TPC and LTPC beams.
The results from a theoretical parametric study performed with the extended MVATM where presented in order to compare the global behavior of LPC, TPC and LTPC beams with similar total prestress reinforcement ratios. From the theoretical T–θ curves and for beams with prestress in only one direction (LPC and TPC beams), it was observed that, for the ultimate loading and when compared with longitudinal prestress, transversal prestress constitutes an effective solution for beams under torsion. However, for low loading levels, transversal prestress seems to be less effective, namely to delay the cracking torque.
For beams with prestress in both directions (LTPC beams), the results shown that the biaxial compressive stress state due to prestress is also effective to delay the cracking torque. Moreover, LTPC beams shown to have higher resistance torque and torsional stiffness in the cracked state, when compared with LPC and TPC beams. This observation shows that, even with the same total amount of prestress reinforcement, it is better to distribute prestress in both directions (longitudinal and transversal).
The extended MVATM proposed in this study represents an important advance in the attempt to generalize the Space-Truss Analogy for PC beams under torsion. However, it should be noted that experimental results with TPC and LTPC beams under torsion are of great need, namely to help to confirm the main findings of this study.

Author Contributions

Luís Bernardo and Jorge Andrade worked the theoretical model, developed the algorithms and programs. Mafalda Teixeira calculated the reference beams and analyzed the data. Luís Bernardo wrote the paper with reviews by Jorge Andrade and Mafalda Teixeira.

Conflicts of Interest

The authors declare no conflict of interest.

References

  1. Rausch, E. Berechnung des Eisenbetons gegen Verdrehung (Design of Reinforced Concrete in Torsion). Ph.D. Thesis, Technische Hochschule, Berlin, German, 1929. [Google Scholar]
  2. Andersen, P. Experiments with Concrete in Torsion. Trans. ASCE 1935, 100, 949–983. [Google Scholar]
  3. Cowan, H.J. Elastic Theory for Torsional Strength of Rectangular Reinforced Concrete Beams. Mag. Concr. Res. 1950, 2, 3–8. [Google Scholar] [CrossRef]
  4. Lampert, P.; Thurlimann, B. Torsionsversuche an Stahlbetonbalken (Torsion Tests of Reinforced Concrete Beams) Bericht, Nr. 6506-2. Inst. Fur Baustatik ETH Zurich. 1969, 101. (In Germany) [Google Scholar]
  5. Elfgren, L. Reinforced Concrete Beams Loaded in Combined Torsion, Bending and Shear; Division of Concrete Structures, Chalmers University of Technology: Goteborg, Sweden, 1972. [Google Scholar]
  6. Collins, M.P.; Mitchell, D. Shear and Torsion Design of Prestressed and Non-Prestressed Concrete Beams. J. Prestress. Concr. Inst. 1980, 25, 32–100. [Google Scholar] [CrossRef]
  7. Hsu, T.T.C.; Mo, Y.L. Softening of Concrete in Torsional Members—Theory and Tests. J. Am. Concr. Inst. 1985, 82, 290–303. [Google Scholar]
  8. Hsu, T.T.C.; Mo, Y.L. Softening of Concrete in Torsional Members—Prestressed Concrete. J. Am. Concr. Inst. 1985, 82, 603–615. [Google Scholar]
  9. Rahal, K.N.; Collins, M.P. Simple Model for Predicting Torsional Strength of Reinforced and Prestressed Concrete Sections. J. Am. Concr. Inst. 1996, 93, 658–666. [Google Scholar]
  10. Bhatti, M.A.; Almughrabi, A. Refined Model to Estimate Torsional Strength of Reinforced Concrete Beams. J. Am. Concr. Inst. 1996, 93, 614–622. [Google Scholar]
  11. Wang, W.; Hsu, T.T.C. Limit Analysis of Reinforced Concrete Beams Subjected to Pure Torsion. J. Struct. Eng. 1997, 123, 86–94. [Google Scholar] [CrossRef]
  12. Jeng, C.H.; Hsu, T.T.C. A Softened Membrane Model for Torsion in Reinforced Concrete Members. Eng. Struct. 2009, 31, 1944–1954. [Google Scholar] [CrossRef]
  13. Jeng, C.H.; Chiu, H.J.; Chen, C.S. Modelling the Initial Stresses in Prestressed Concrete Members under Torsion. In Structures Congress; ASCE: Orlando, FL, USA, 2010; pp. 1773–1781. [Google Scholar]
  14. Jeng, C.H. Unified Softened Membrane Model for Torsion in Hollow and Solid Reinforced Concrete Members: Modeling Precracking and Postcracking Behavior. J. Struct. Eng. 2015, 141, 04014243. [Google Scholar] [CrossRef]
  15. Hsu, T.T.C.; Zhu, R.R.H. Softened Membrane Model for Reinforced Concrete Elements in Shear. Struct. J. Am. Concr. Inst. 2002, 99, 460–469. [Google Scholar]
  16. Bernardo, L.F.A.; Andrade, J.M.A.; Lopes, S.M.R. Modified variable angle truss-model for torsion in reinforced concrete beams. Mater. Struct. 2012, 45, 1877–1902. [Google Scholar] [CrossRef]
  17. Bernardo, L.F.A.; Andrade, J.M.A.; Nunes, N.C.G. Generalized softened variable angle truss-model for reinforcement concrete beams under torsion. Mater. Struct. 2015, 48, 2169–2193. [Google Scholar] [CrossRef]
  18. Andrade, J.M.A. Modelling of the Global Behavior of Beams under Torsion—Generalization of the Space Truss Analogy with Variable Angle. Ph.D. Thesis, Department of Civil Engineering and Architecture, Faculty of Engineering of University of Beira Interior, Covilhã, Portugal, 2010. (In Portuguese). [Google Scholar]
  19. Taborda, C.S.B. Generalization of the VATM and GSVATM to Model Structural Concrete Beams under Torsion Combined with Uniforme Axial Stress State. Ph.D. Thesis, Department of Civil Engineering and Architecture, Faculty of Engineering of University of Beira Interior, Covilhã, Portugal, 2017. (In Portuguese). [Google Scholar]
  20. Bernardo, L.F.A.; Teixeira, M.M. Modified Softened Truss-Model for PC Beams under Torsion. J. Build. Eng. 2018. in review. [Google Scholar]
  21. Laffranchi, M. Zur Konzeption Gekrümmter Brücken; IBK Report; Institut für Baustatik und Konstruktion: Zürich, Switzerland, 1999. (In Germany) [Google Scholar]
  22. ACI Committee 318. Building Code Requirements for Reinforced Concrete, (ACI 318-14); American Concrete Institute: Farmington Hills, MI, USA, 2014. [Google Scholar]
  23. Belarbi, A.; Hsu, T.T.C. Constitutive Laws of Softened Concrete in Biaxial Tension-Compression; Research Report UHCEE 91-2; University of Houston: Houston, TX, USA, 1991. [Google Scholar]
  24. Zhang, L.X.; Hsu, T.T.C. Behavior and Analysis of 100 MPa Concrete Membrane Elements. J. Struct. Eng. 1998, 124, 24–34. [Google Scholar] [CrossRef]
  25. Belarbi, A.; Hsu, T.T.C. Constitutive Laws of Softened Concrete in Biaxial Tension-Compression. Struct. J. Am. Concr. Inst. 1995, 92, 562–573. [Google Scholar]
  26. Bernardo, L.F.A.; Lopes, S.M.R. Torsion in HSC Hollow Beams: Strength and Ductility Analysis. ACI Struct. J. 2009, 106, 39–48. [Google Scholar]
  27. Bernardo, L.F.A.; Lopes, S.M.R. Theoretical Behavior of HSC Sections under Torsion. Eng. Struct. 2011, 33, 3702–3714. [Google Scholar] [CrossRef]
  28. Bernardo, L.F.A.; Lopes, S.M.R. Behavior of Concrete Beams under Torsion—NSC Plain and Hollow Beams. Mater. Struct. 2008, 41, 1143–1167. [Google Scholar] [CrossRef]
  29. Hsu, T.T.C. Torsion of Reinforced Concrete; Van Nostrand Reinhold Company: New York, NY, USA, 1984. [Google Scholar]
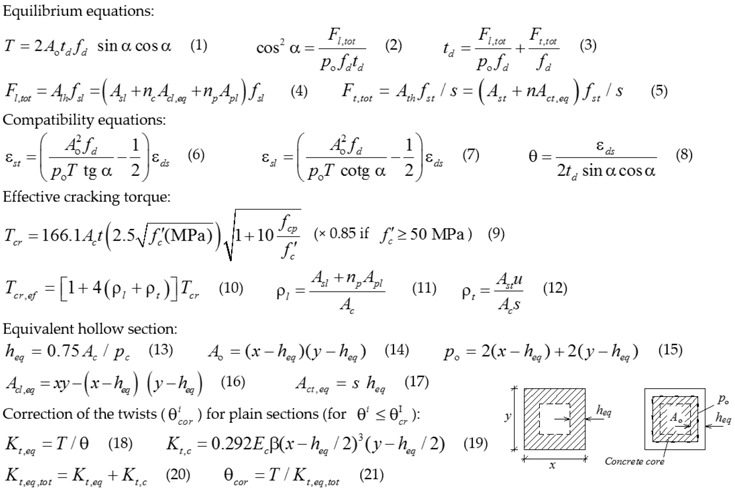
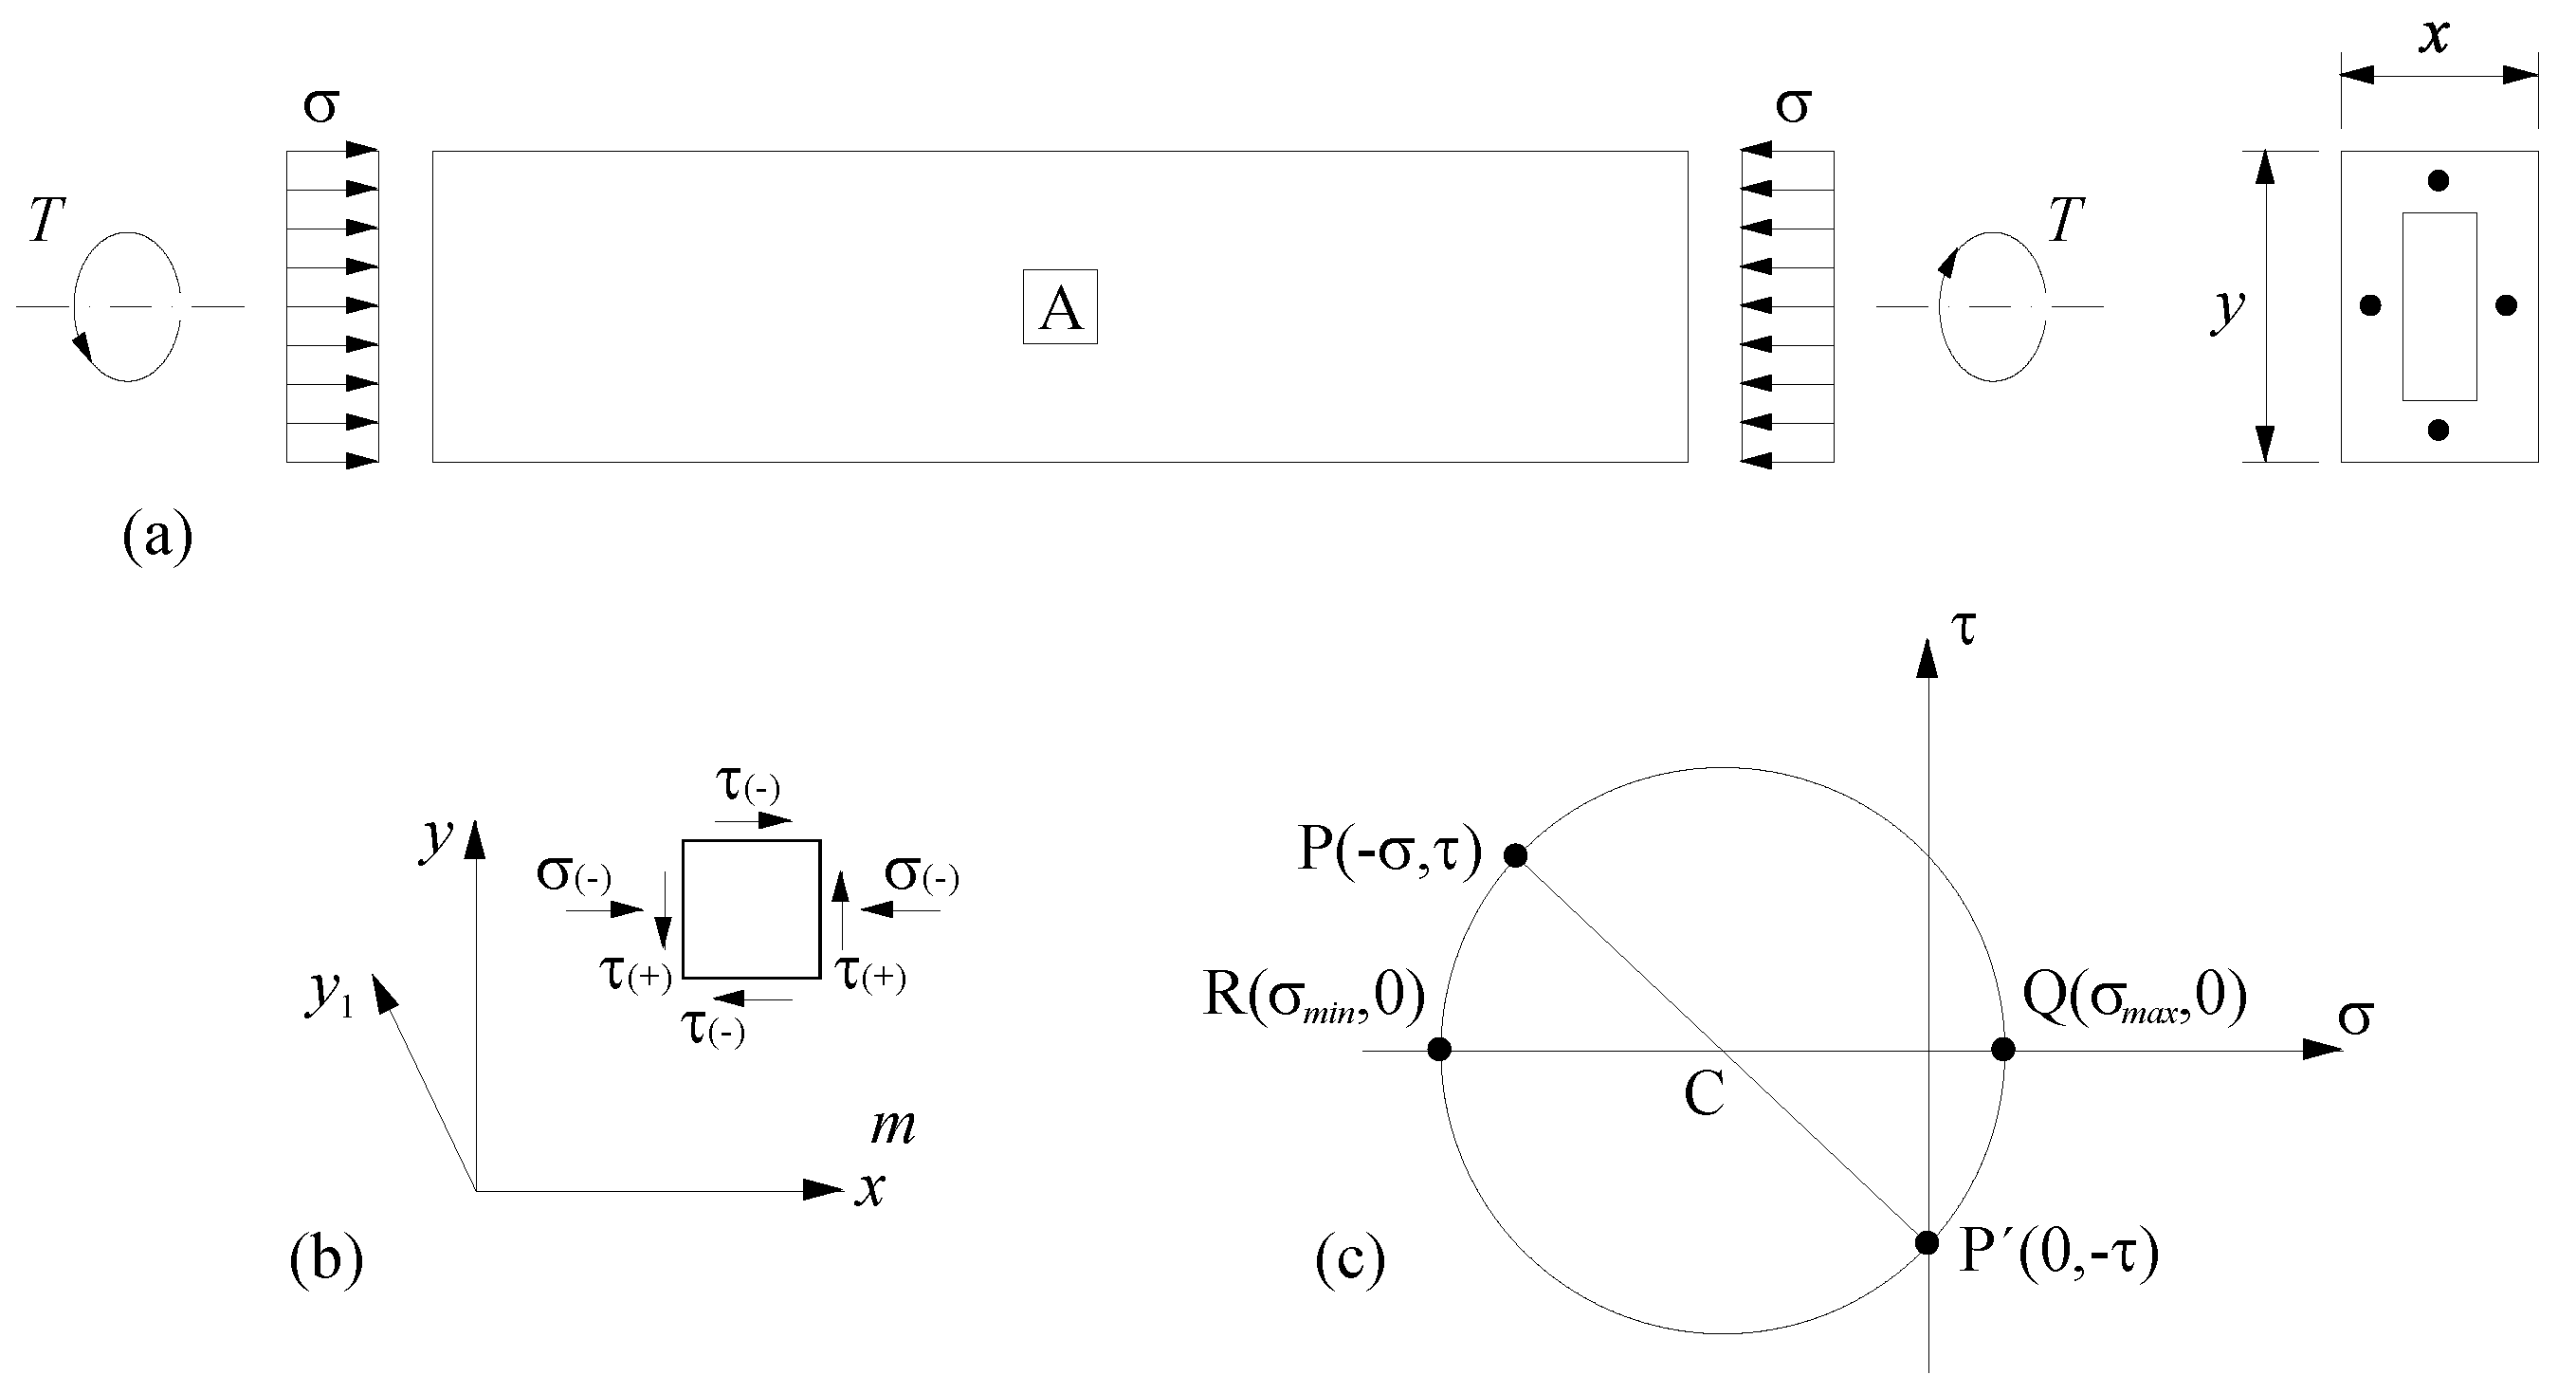
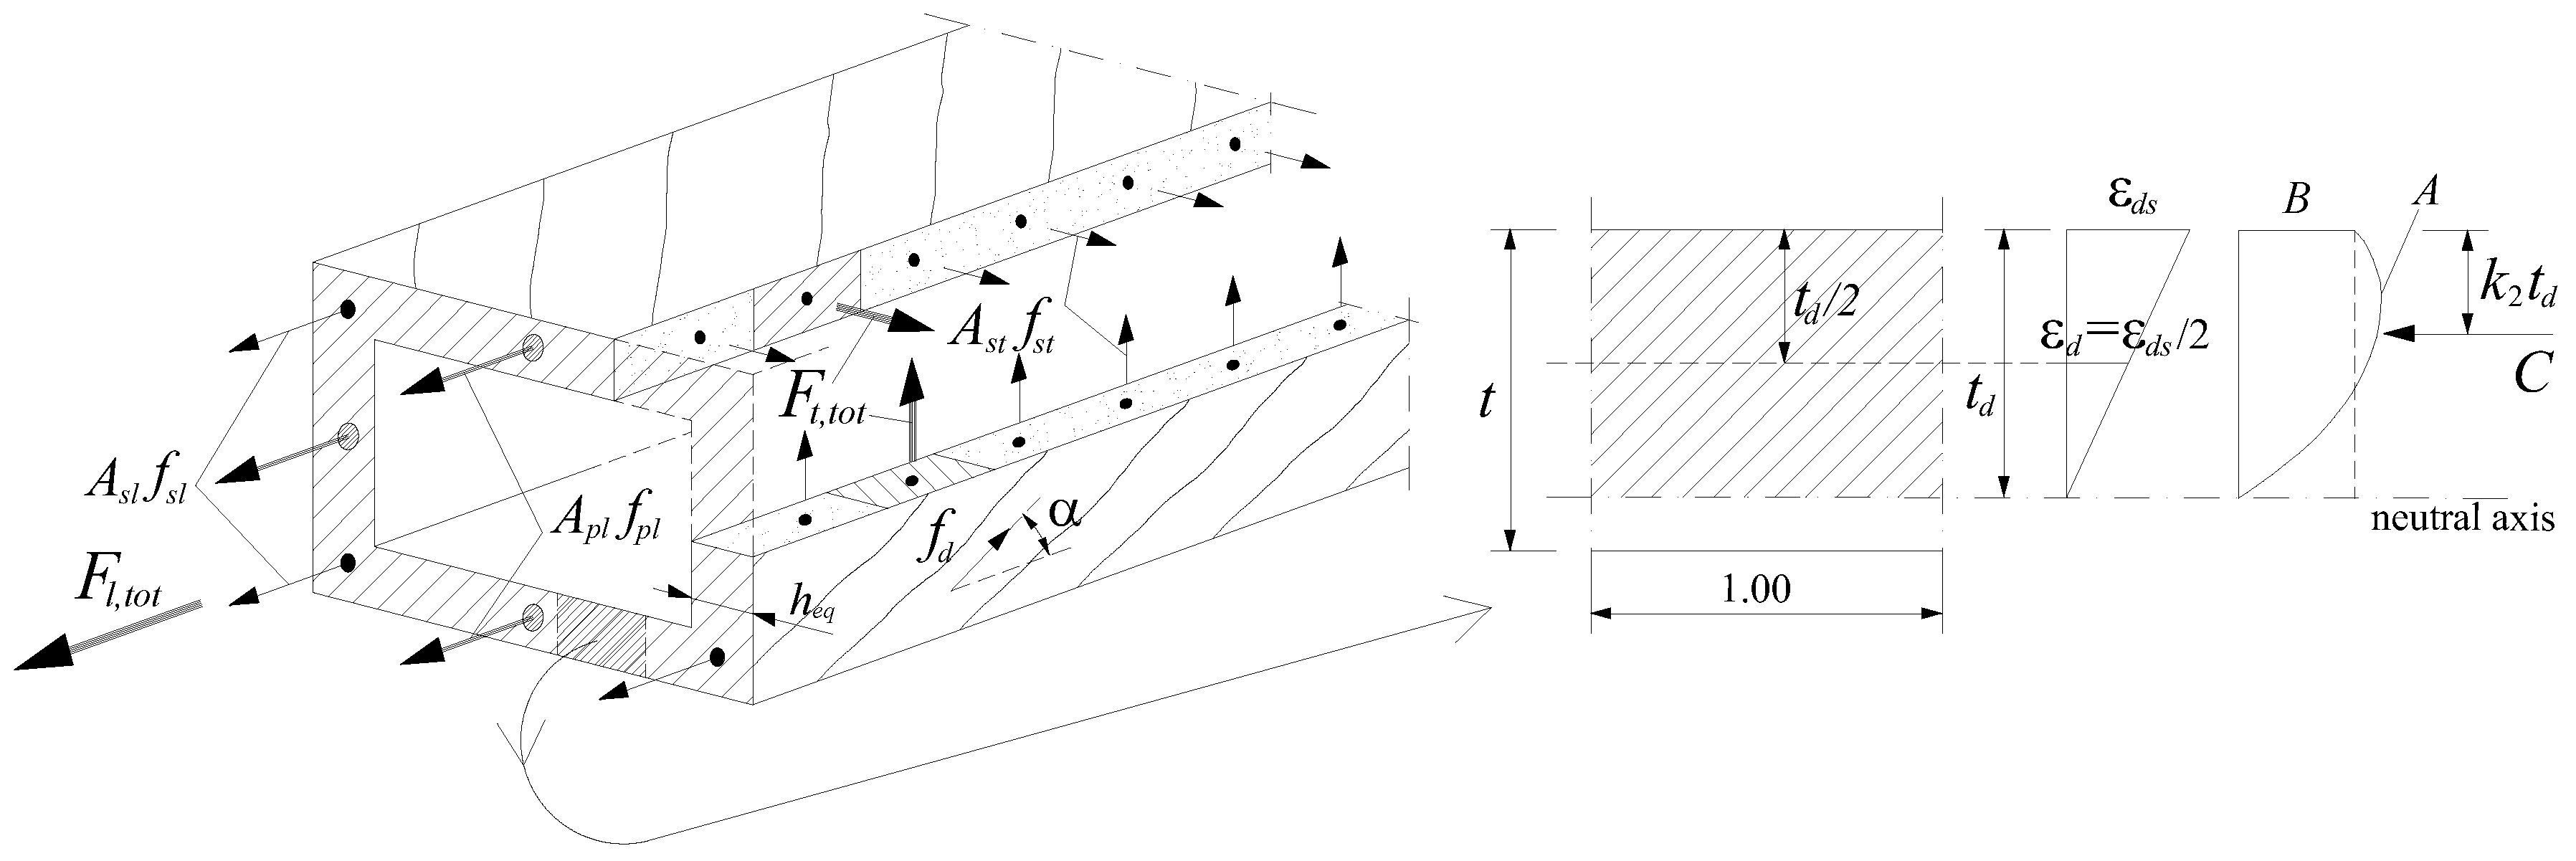
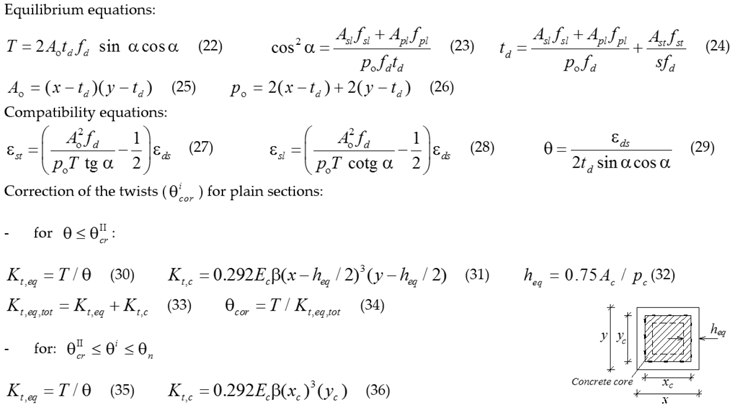
Figure 1. Typical T–θ curve for a RC or LPC beam under torsion.
Designs 02 00012 g001
Figure 2. Equivalent hollow section assumed by MVATM (LPC beams).
Designs 02 00012 g002
Figure 3. Flowchart to compute the T–θ curve from MVATM for the non-cracked state: (a) hollow sections, (b) plain sections.
Designs 02 00012 g003
Figure 4. Corrections of the T–θ curves from MVATM after cracking: (a) hollow sections, (b) plain sections.
Designs 02 00012 g004
Figure 5. Flowchart to compute the T–θ curve from MVATM (cracked state): (a) hollow sections, (b) plain sections.
Designs 02 00012 g005
Figure 6. Stress state for LPC beams under torsion: (a) beam, (b) element A, (c) Mohr´s circle.
Designs 02 00012 g006
Figure 7. Stress state for TPC beams under torsion: (a) beam, (b) element A, (c) Mohr´s circle.
Designs 02 00012 g007
Figure 8. Stress state for LTPC beams under torsion: (a) beam, (b) element A, (c) Mohr´s circle.
Designs 02 00012 g008
Figure 9. Equivalent hollow section assumed by MVATM (LTPC beams).
Designs 02 00012 g009
Figure 10. Initial compressive strain in the concrete struts due to prestress: (a) LPC beams, (b) TPC beams.
Designs 02 00012 g010
Figure 11. T–θ curves for NSC beams.
Designs 02 00012 g011
Figure 12. T–θ curves for HSC beams.
Designs 02 00012 g012
Figure 13. T–θ curves for high torsional reinforcement ratio.
Designs 02 00012 g013
Figure 14. T–θ curves for low torsional reinforcement ratio.
Designs 02 00012 g014
Table 1. MVATM equations for LPC beams: non-cracked state [7,8,16,18,20].
Designs 02 00012 i001
where:
f c = concrete compressive strength (uniaxial);
Ao = area limited by the center line of the flow of shear stresses;
Ac = area limited by the outer perimeter of the section (includes hollow area): A c = x y , with x and y the width and height of the cross section;
Alh; Ath = homogenized steel areas in the longitudinal and transversal direction, respectively;
Acl,eq; Act,eq = equivalent area of effective concrete in tension for the longitudinal and transversal direction,
pc = perimeter of area Ac;
po = perimeter of area Ao;
t = thickness of the wall;
u = perimeter of the centerlines of the closed stirrups: u = 2 ( x 1 + y 1 ) , with x1 and y1 the width and height of the centerlines of legs of the closed stirrups;
s = spacing of the transversal reinforcement;
fd = stress in the diagonal concrete strut;
Asl; Apl = total area of the longitudinal ordinary and prestress reinforcement, respectively;
Ast = area of one unit of the transversal reinforcement;
 εds = maximum compressive strain in the outer fiber in the strut direction;
fsl; fpl = stress in the longitudinal ordinary and prestress reinforcement, respectively;
fst = stress in the transversal reinforcement;
fcp = stress in the concrete due to prestress;
nc = Ec/Es, with Ec and Es the Young’s Modulus for concrete and ordinary reinforcement, respectively;
np = Ep/Es, with Ep and Es the Young’s Modulus for prestress and ordinary reinforcement, respectively;
 ρl; ρt = longitudinal and transversal reinforcement ratio, respectively (see Section 3.1);
Kt,eq = equivalent secant torsional stiffness;
Kt,eq,tot = equivalent total torsional stiffness of the full section (including concrete core);
Kt,c = torsional stiffness of the concrete core;
 β = St. Venant’s coefficient.
Table 2. Equations of MVATM for LPC beams: cracked state [7,8,16].
Designs 02 00012 i002
Designs 02 00012 i003
where:
xc; yc = width and height of the cross section core, respectively;
Δθmax = correction of the twists.
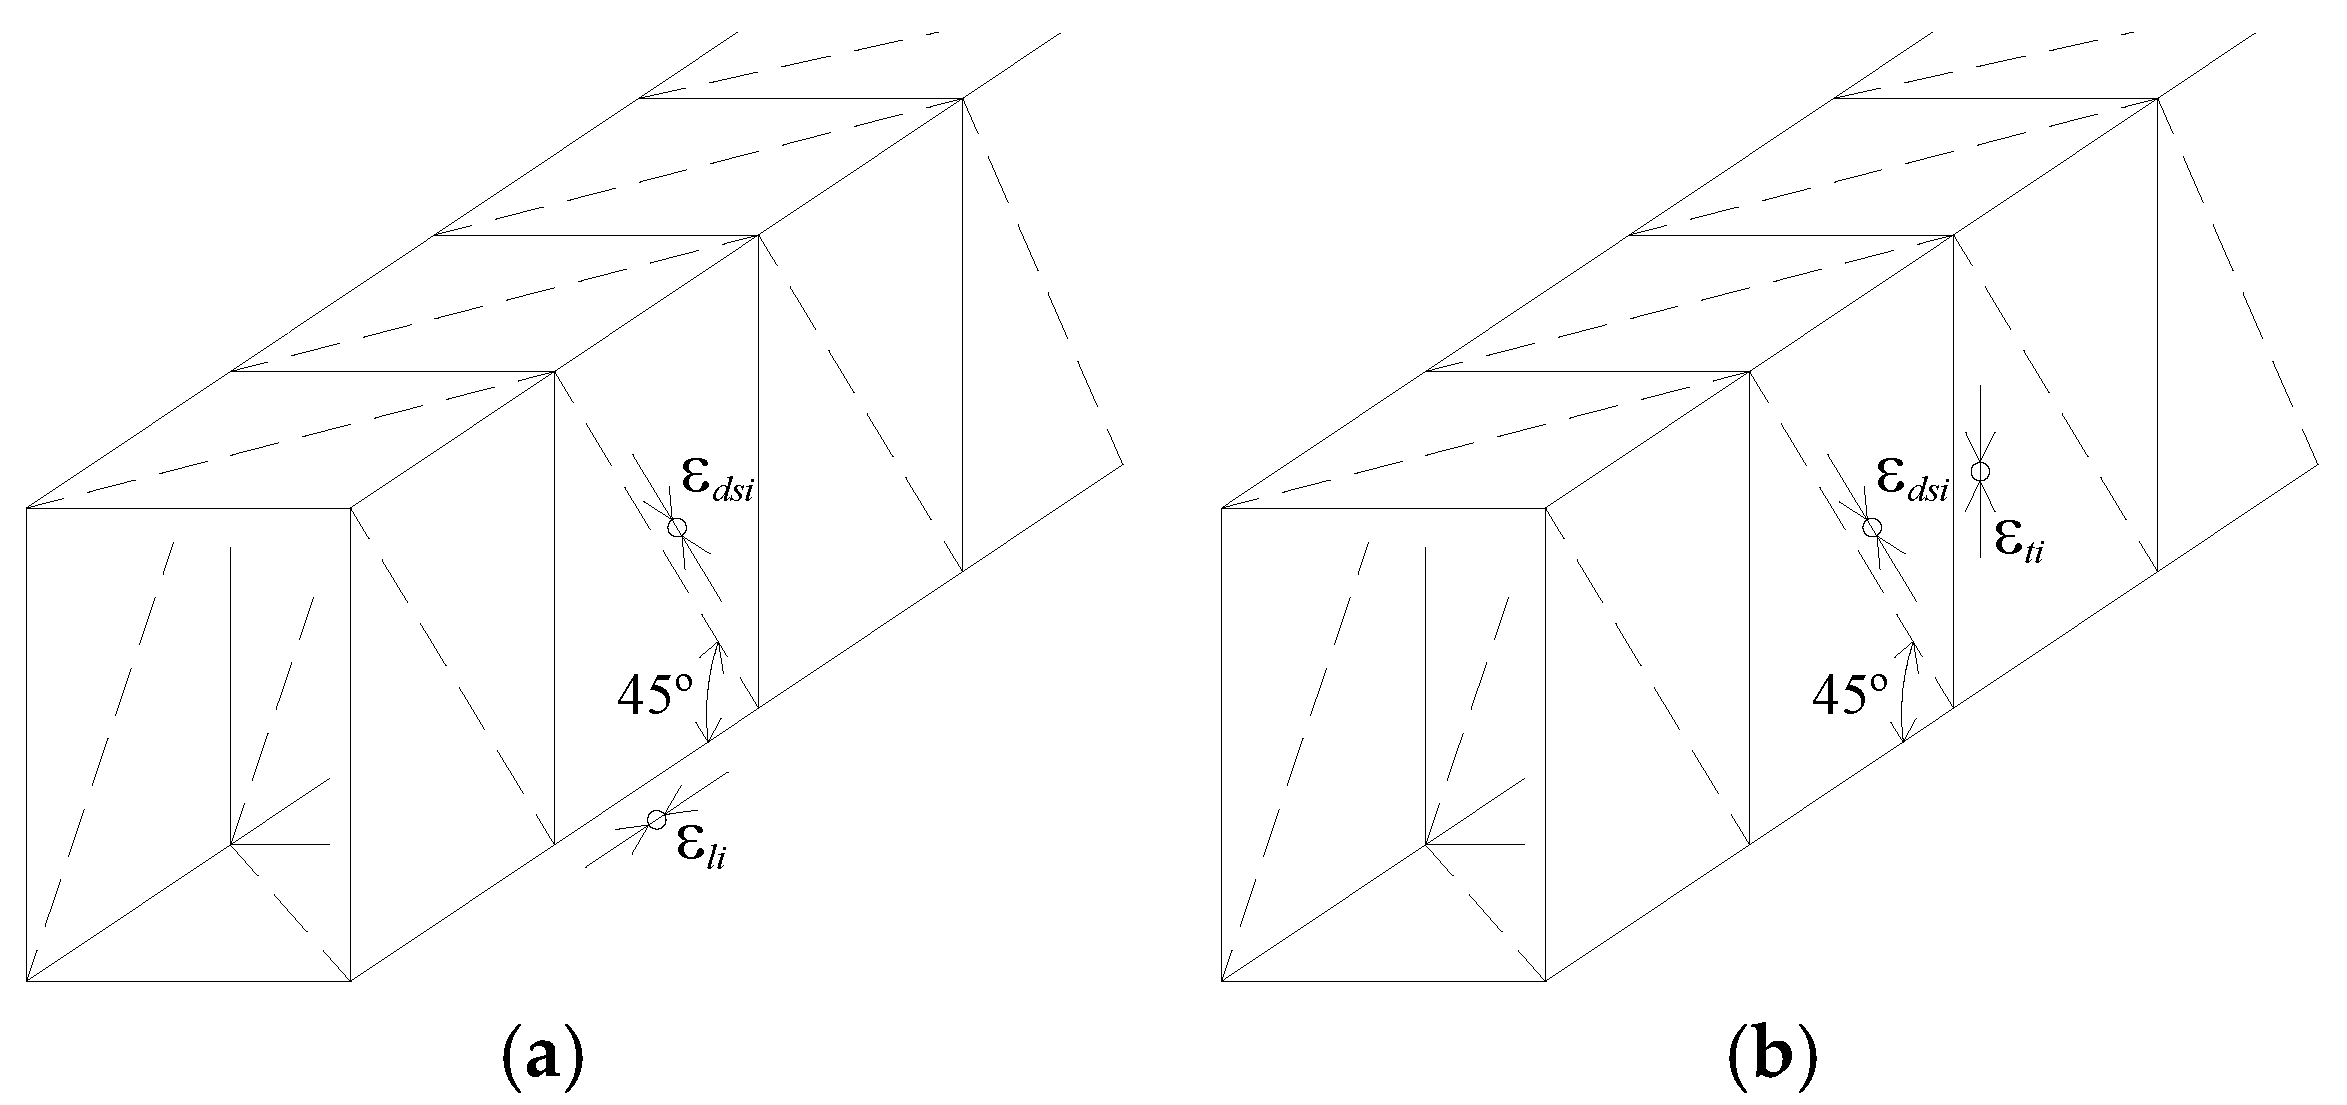
Table 3. σ–ε relationship for concrete in compression.
Designs 02 00012 i004
Designs 02 00012 i005
where:
εo = strain corresponding to f c ;
εc1 = tensile strain in the perpendicular direction to the strut;
εdsi = initial compressive strain in the outer fiber of the concrete strut due to prestress;
ε d s = effective compressive strain in the outer fiber of the concrete strut;
ρl; ρt = longitudinal and transversal reinforcement ratio, respectively (see Section 3.1);
ρp = longitudinal prestress reinforcement ratio (see Section 3.1);
fsly; fsty = yielding stress in the longitudinal and transversal reinforcement, respectively;
fpl0.1% = conventional proportional stress of the longitudinal prestress reinforcement.
Table 4. σ–ε relationship for ordinary reinforcement in tension.
Designs 02 00012 i006
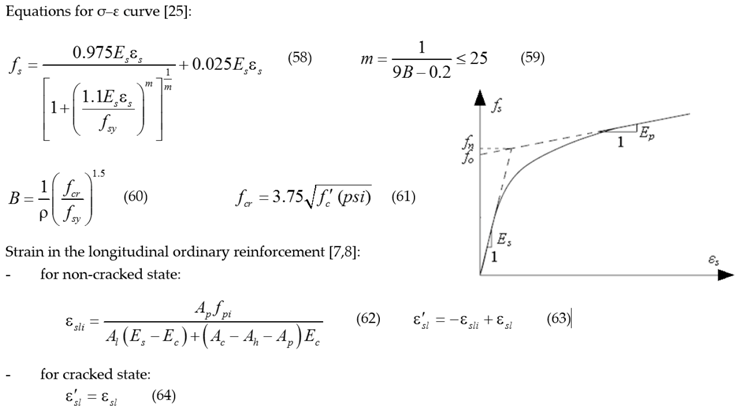
where:
Es; Ec = Young’s modulus of the ordinary reinforcement and concrete, respectively;
Ac = area limited by the external perimeter of the section;
Ah = hollow area of the section (for plain sections: Ah = 0);
fcr = concrete cracking stress;
ρ = reinforcement ratio (see Section 3.1);
εsli = initial compressive strain in the longitudinal ordinary reinforcement;
ε s l = effective strain in the longitudinal ordinary reinforcement;
fsy = reinforcement yielding stress.
Table 5. σ–ε relationship for prestress reinforcement in tension.
Designs 02 00012 i007
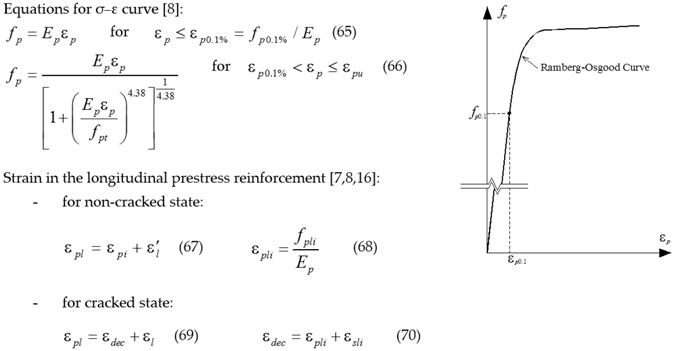
where:
Ep = Young’s modulus of the prestress reinforcement;
fpi = initial stress due to prestress in the prestress reinforcement;
fpt = ultimate stress of the prestress reinforcement;
fp0.1% = conventional proportional stress of the longitudinal prestress reinforcement;
εpl = strain in the prestress reinforcement;
εdec = strain in the prestress reinforcement at concrete’s decompression;
εpli = initial tensile strain in the prestress reinforcement;
εsli = initial compressive strain in the longitudinal ordinary reinforcement;
ε l = effective strain in the longitudinal ordinary reinforcement;
εp0.1% = strain corresponding to fp0.1%.
Table 6. Properties of the reference RC hollow beams [26].
Beamx; y cmT cmx1 cmy1 cmAsl cm2Ast/s cm2/mρsl %ρst %fcm MPafctm MPaflym MPaftym MPaEc GPa ε o %εcu %
A26010.753.853.114.06.30.390.3747.33.567269636.10.200.35
A36010.954.053.518.18.30.500.4946.23.467271535.80.200.35
A56010.452.852.830.714.10.850.8353.13.872467237.50.200.35
B26010.853.353.414.66.70.410.4069.84.167269639.40.210.33
B46011.252.353.632.215.10.890.8979.84.472467241.00.210.31
C26010.053.253.314.06.30.390.3794.84.967269643.20.220.28
C36010.354.554.023.810.50.660.6391.64.872471542.80.220.28
C46010.354.654.530.714.10.850.8691.44.872467242.70.220.28
C66010.453.352.948.322.61.341.3487.54.772472442.20.220.29
Table 7. Prestress values for f c p = 0.225 f c (LPC and TPC) and f c p = 0.1125 f c (LTPC).
TypeLPCTPCLTPC
BeamApl
cm2
ρpl
%
fpli
MPa
fcpl
MPa
Apt/sp
cm2/m
ρpt
%
fpti
MPa
fcpt
MPa
Apl
cm2
Apt/sp
cm2/m
ρpl
%
ρpt
%
fpli
MPa
fcpl
MPa
fpti
MPa
fcpt
MPa
A216.630.46135010.648.440.46135010.648.324.220.230.2313505.3213505.32
A316.480.46135010.408.390.46135010.408.244.200.230.2313505.2013505.20
A518.260.51135011.959.200.51135011.959.134.600.250.2513505.9713505.97
B224.730.69135015.7112.560.69135015.7112.366.280.340.3413507.8513507.85
B429.080.81135017.9614.900.81135017.9614.547.450.400.4013508.9813508.98
C231.600.88135021.3315.800.88135021.3315.807.900.440.44135010.67135010.67
C331.260.87135020.6115.720.87135020.6115.637.860.430.43135010.31135010.31
C431.190.87135020.5715.690.87135020.5715.607.850.430.43135010.28135010.28
C630.090.84135019.6915.170.84135019.6915.057.580.420.4213509.8413509.84

