Article

Design and Evaluation of a UAV-Attached Multisampling Device for Water Collection

1
Department of Business Informatics, Kadyrov Chechen State University, Grozny 366007, Russia
2
Institute of Mathematics, Physics and Information Technology, Kadyrov Chechen State University, Grozny 366007, Russia
3
Faculty of Engineering, Universidad Tecnológica Centroamericana (UNITEC), San Pedro Sula 21112, Honduras
4
Faculty of Information Technology, Electric Power University, Hanoi 10000, Vietnam
5
Grants Department of the Office for Scientific Research and Innovative Activities, Kabardino-Balkarian State University Named After H.M. Berbekov, Nalchik 360004, Russia
6
Department of Machines and Apparatus for Chemical Production, Kazan National Research Technological University, Kazan 420015, Russia
*
Authors to whom correspondence should be addressed.
Designs 2026, 10(3), 58; https://doi.org/10.3390/designs10030058
Submission received: 13 February 2026 / Revised: 29 April 2026 / Accepted: 15 May 2026 / Published: 21 May 2026
(This article belongs to the Collection Editorial Board Members’ Collection Series: Drone Design)

Abstract

Unmanned aerial vehicles (UAVs) have emerged as flexible platforms for environmental monitoring, including water sampling in hard-to-reach or hazardous areas. However, most existing UAV-based sampling solutions are limited to single-point collection or rely on complex fluid routing mechanisms that increase the risk of leakage and cross-contamination. This paper presents a novel ribbon-based multisampling capsule that enables sequential water collection from multiple locations during a single UAV deployment. The proposed mechanism employs a motor-driven ribbon with a single movable orifice that is sequentially aligned with individual sampling containers, allowing controlled intake and closure through a combination of hydrostatic pressure and mechanical sealing. A functional prototype was developed and experimentally evaluated to assess sampling feasibility and operational robustness. Experimental results demonstrate that improvements in sealing significantly reduce leakage events and eliminate dispenser-related carry-over, while enabling repeatable multi-point sampling. In addition, exploratory computational fluid dynamics (CFD) simulations were conducted to characterize hydrodynamic loads acting on the capsule and to support future design iterations, rather than to provide fully converged hydrodynamic validation. The proposed solution offers a practical, lightweight, and mechanically simple approach to UAV-assisted multi-point water sampling, with clear potential for further optimization and field deployment.

1. Introduction

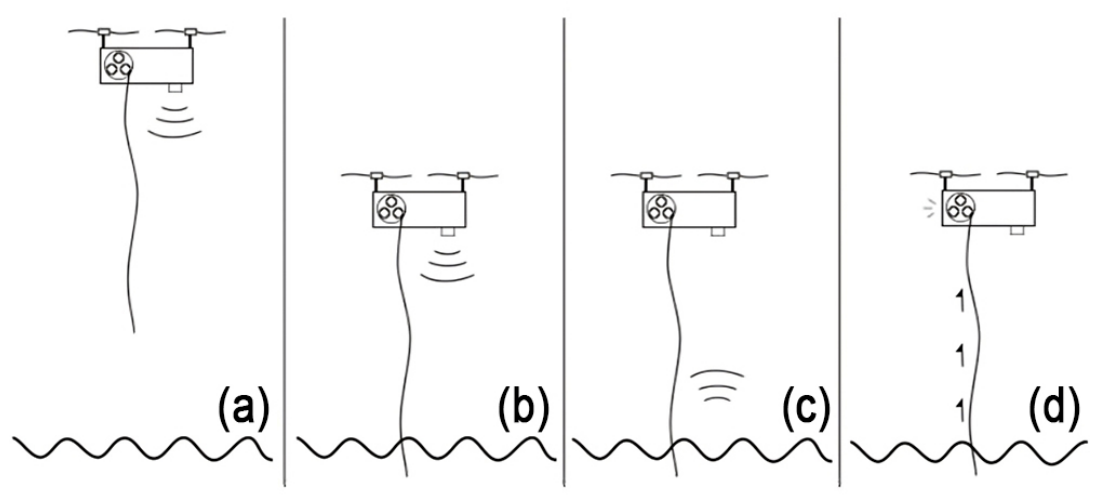
Lately, there has been growing concern about the ecological state of our planet, which needs to be addressed using modern technology. It is essential to apply novel approaches alongside well-proven practices. With advancements in several technological fields, new paths can be initiated to discover the most suitable solutions. Various tools are available for addressing different ecological problems. The three essential components of human existence—land, water, and air—are at risk of becoming uninhabitable. It is evident that there is no single solution to all issues. Therefore, it is necessary to implement a comprehensive approach to solving the problem, dividing the overall problem into smaller, manageable parts. Within this context, the monitoring and sampling of water resources emerge as a critical task, which can be effectively supported by unmanned aerial systems equipped with specialized sampling capsules, enabling safe, flexible, and efficient data collection. Water sampling is addressed through the use of mobile tools integrated with an unmanned aerial vehicle (UAV), emphasizing the significant role that drones play in enabling efficient and flexible sampling operations [1], as they can easily maneuver through complex terrains that are difficult for humans to reach. A design of a water-sampling device in the shape of a plastic container attached to the bottom of a drone [2]. The device consists of several sensors and a peristaltic pump. The structure includes a tube hanging from the container with a vessel at the end. When positioned at the sampling area and at a predetermined height, the peristaltic pump is activated, and the water is drawn through the tube (Figure 1).
Rihong et al. [3] propose a water sampling approach based on a retractable tube stored inside the container and deployed only during sampling, with an additional probing mechanism that is lowered into the water and retracted afterward, thereby reducing the risk of drone destabilization. Similarly, Cengiz et al. [4], building on earlier work [5], present a floating sampling device suspended beneath the drone, where a tube is lowered into the water and sealed at both ends once filled, eliminating the need for a pump while requiring an active sealing mechanism.
Ding et al. [6] focus on a stable sampling mechanism attached to the lower part of the drone, where a manipulator lowers a tube toward the water surface to collect the sample, avoiding the release of vessels or suspended tubes used in earlier designs. Similarly, Peng et al. [7] propose a dual-arm aerial manipulator capable of multiple tasks, where one arm can lower a sampling reservoir while the other seals it with a lid, making the system adaptable to water sampling applications.
However, these approaches are limited to collecting a single sample per flight. To overcome this limitation, Wu et al. [8] introduce a multisampling mechanism incorporating five independent sampling containers that are filled sequentially by repositioning the tube, enabling multiple samples to be collected during a single flight. A related multisampling concept is presented in [9], where capsules are released into the water after lowering the drone; nevertheless, this design is limited to two samples per flight.
All these water sampling approaches rely on drones as transportation platforms to deploy sensing and sampling mechanisms in aquatic environments. Aerial drones equipped with onboard devices can collect water samples, return them to the operator, and even perform basic in situ analyses, as demonstrated in [10]. Beyond aerial systems, underwater drones are widely used for sampling, analysis, and environmental monitoring, as well as for studying aquatic life, including fish behavior [11,12,13]. These platforms may operate autonomously, manually, or in coordination with floating stations to enable extended data collection [14]. In parallel, surface water vehicles navigating on the water surface provide similar monitoring and sampling capabilities [15,16,17], while floating observation stations offer stationary monitoring of surrounding aquatic areas [18,19].
The above review of water-sampling mechanisms accompanied by drones illustrates that considerable progress has been made toward developing effective designs (Table 1). However, each of them lacks a mechanism that can be used for multiple sampling during a single flight. Although two design were capable of multisampling previously mentioned in works [3,8]. However, those mechanisms have one issue it used the same tube to fill various containers, which could affect analytical results. For example, after the first container is filled, water droplets remaining on the inner wall of the tube could contaminate the next sample collected from a different area.
This study proposes a novel multisampling mechanism accompanied by a UAV. Apart from the above mentioned approaches, this device has a compact structure with a neat appearance and a water sampling mechanism. This device illustrates the ability to collect multiple samples in a single flight. Also, separate channels for water suction avoid water mixture in different containers. This approach aims to provide the following advancements in the field of water sampling:
  • Capability for multisampling with a contamination-free sampling process.
The rest of this article is structured as follows: Section 2 describes the steps taken to design the multisampling structure and its operational principles. Section 3 presents the simulation and experimental outcomes and their interpolation. Section 4 exhibits the analysis and decisions made for the improvement of the structure. Finally, Section 5 concludes the key findings, highlights the study’s contributions and limitations, and suggests possible future improvements.

2. Materials and Methods

This section describes the steps taken to design a multisampling device that can be attached to drones. The mechanism should be built in a way that the drone can navigate it to a designated area, with the capability to take multiple samples without any contamination occurring. This work expands the previously built model by improving it to be used [20].

2.1. Design Concept

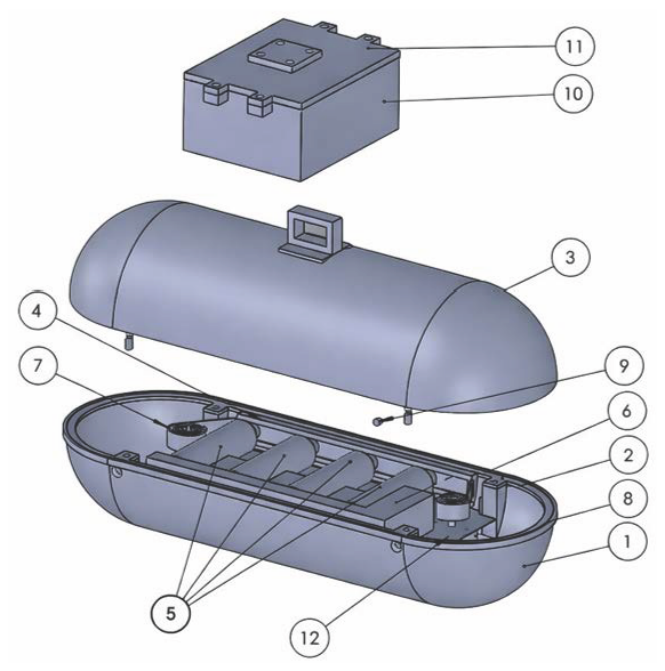
As mentioned, the aim of the work is to design a mechanism capable of taking multiple water samples without contamination. All components of the device can be viewed in Figure 2. The main half of the body is represented by number 1. 2 is the sealing material between the main half of the structure 1 and the second upper half 3. 12 is a supportive platform for other elements 4, 5, 6, 7, and 8 to be connected. 7 is a ribbon passed through a guider 4 rotated by motor 8. The pump is represented by number 6 and the containers by 5. 9 is a sealer for the screw cuts. 10 is a separate structure that has a motor for moving the water sampling device up and down. This device has a lid 11, which is connected to the drone. The proposed design operates based on a sequential, motor-driven control algorithm, which can result in automated multisampling of water. A microcontroller is utilized to govern the operation of the stepper motor and pumping mechanism by using predefined timing and positional parameters. The ribbon with an orifice is placed in a predetermined position, which will be guided by the stepper motor with calculated steps to align the orifice with each container inlet in sequence. Once the orifice is aligned to the desired place, the pump is activated for a specified duration to allow water in. With the sampling completion, the pump is deactivated, and the stepper motor advances the ribbon to isolate the filled container and move to the next sampling.
This process is repeated for all containers, ensuring controlled and contamination-free sampling. The automation minimizes human intervention, reduces operational errors, and ensures repeatability of the sampling procedure under UAV-based deployment conditions.

2.2. Container Design

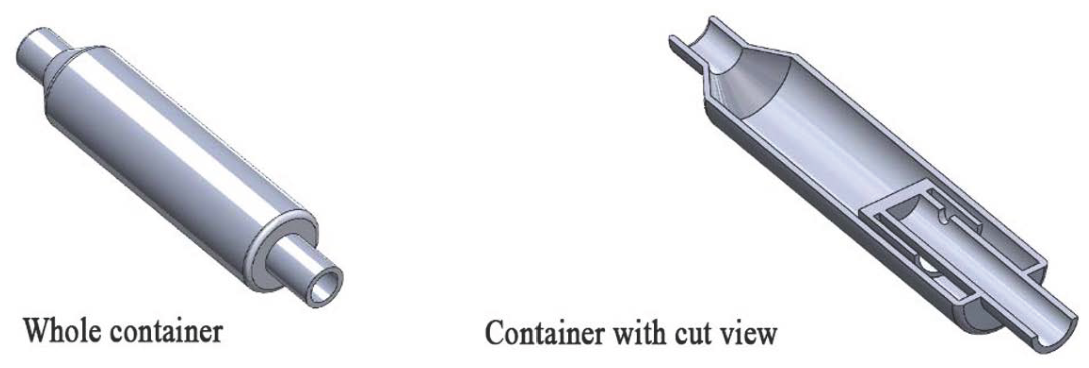
As the whole structure goes underwater, a motor rotates the ribbon, placing the orifice on the ribbon between the carcass and the head of the first container, allowing the water from outside to flow in. To draw water in, the pump is used. The containers are connected to one channel of airflow. When the hole in the ribbon is placed to the first container, air flows only to this container. Due to the closure of the other containers, no water flow occurs. The containers are built in a way (Figure 3) so that when the water is pumped into a container, it doesn’t immediately go to the main channel and contaminate the other containers. Simulations were conducted to visualize and analyze the internal fluid dynamics within the container during the filling process, considering an inflow rate of 3 mL/s (which will be seen later). The last step is when the ribbon is moved to new position so that no water gets in. If further sampling is required, a new desired area is selected, and then the ribbon is moved a certain distance so that the hole occurs between the second container’s head and the cut in the structure.

2.3. Ribbon Mechanism

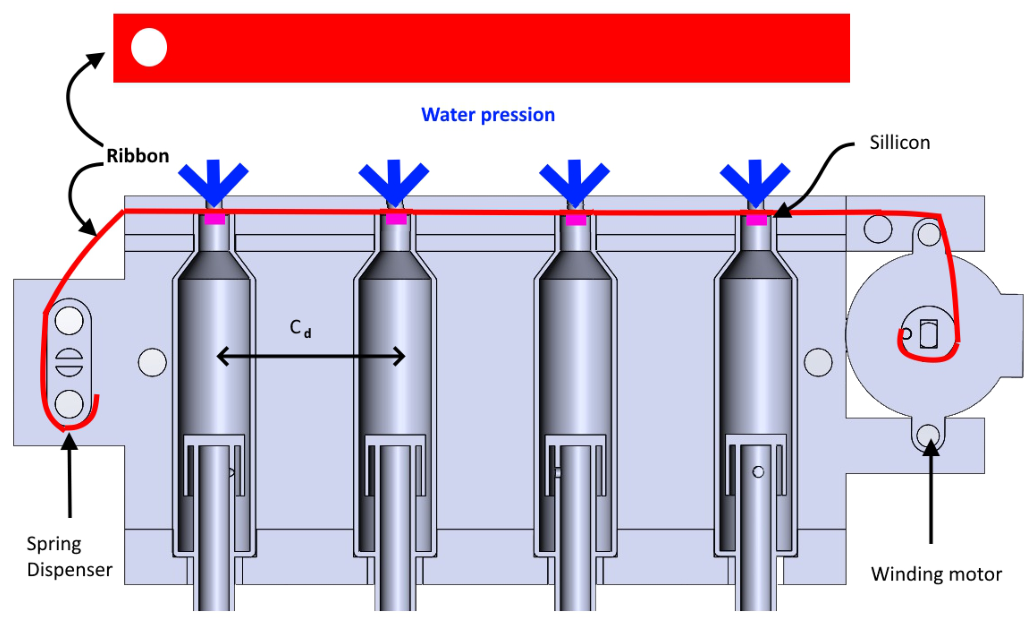
The Figure 4 illustrates the internal multisampling mechanism integrated into the capsule, highlighting the ribbon-guiding system, sealing strategy, and motor-driven actuation. The operation starts at the spring dispenser, where the ribbon is manually wound. The spring applies a restoring force that maintains constant tension along the ribbon during deployment and retraction, compensating for minor misalignments and ensuring stable motion.
From the spring dispenser, the ribbon is guided along the upper section of the structure, passing sequentially over the four water containers before reaching the ribbon winding motor located at the opposite end. The ribbon contains a single orifice, which is initially positioned before the first container. When the system is submerged, the winding motor actuates the ribbon, aligning the orifice with a selected container inlet. This alignment allows water to enter the container due to hydrostatic pressure.
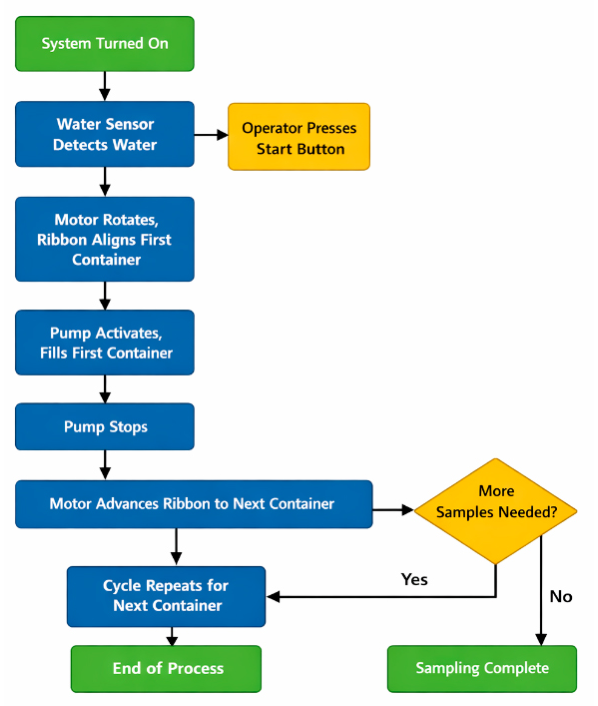
After a predefined sampling time t, the motor advances the ribbon, displacing the orifice away from the inlet and thereby closing the container. The combined effect of water pressure acting on the ribbon and the silicone sealing layer applied at the container heads ensures proper sealing, preventing leakage and cross-contamination between samples. This procedure is repeated sequentially for each container, enabling controlled multisampling using a single movable orifice within a compact mechanical layout. Also Figure 5 illustrates a flow diagram of the sampling cycle.
The displacement of the ribbon required to move the orifice from one container to the next is determined by the center-to-center distance between adjacent containers, denoted as C d . For a stepper motor driving a spool of effective radius r, the required number of motor steps N s to achieve this displacement is given by
N s = C d 2 π r N rev ,
where N rev represents the number of steps per full revolution of the stepper motor. In this case the number of steps per full revolution for the given motor is 2048. This relationship allows precise and repeatable positioning of the ribbon by directly mapping the geometric spacing of the containers to discrete motor commands, enabling reliable sequential water sampling. By observing the image below, it is clear that there are several points where the cut on the ribbon needs to be moved. A sequence of 8 separate actuations will take place for each container to be filled. The ribbon is adjusted to its initial point. By using predetermined values of rotation, the orifice is transferred to designated areas. The required number of motor steps for 8 actuations is: 939, 939, 939, 925, 925, 910, 910, and 910. Pump activations occures only when orific is alighned for water intake, as the first, third, fifth and seventh times it is turned on.
2.4. Structure Evaluation

The capsule was analyzed to understand how the inner mechanism would be impacted by external forces. When carried by the drone, there is a chance that the capsule can experience external impacts. Therefore, it is important to analyze the structure to identify weak spots. For this analysis, moderate boundary conditions were set (Figure 6). Upper part of the capsule, where the string is attached, was constrained in all direction. External forced were applied to both sides (illustrated with red arrows). For the second examination external force was added from above (illustrated with blue arrows). This simple set of boundary conditions allows us to see how the inner components will bear the impact. The material applied in this study was PLA which is the same material used to print the model. It is significant to understand the inner movement of components, as their stability plays a vital role in reducing contamination and ensuring correct operation of the mechanism. After first numerical analysis a refined design of the structure, including all parts, was examined second times with the same boundary conditions. It is worth noting that under normal conditions, the likelihood of a spontaneous impact that would have catastrophic consequences for the structure is low.
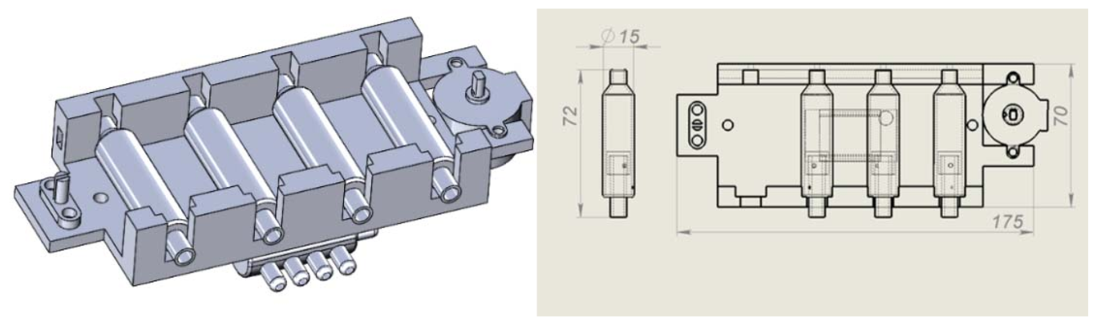
For the real-world experiment, a similar prototype was built. At this stage, the platform was built to examine the workability of the mechanism. A close representation of the designed mechanism was built. Before recreating the model in real life, some changes were introduced to the mechanism itself as discussed above. It was obvious that the mechanism in the concept design was not built to be used directly as it is but rather for illustration of the concept. However, for the working mechanism, only a few changes were introduced, such as correct parameters and slight structural arrangements (Figure 7). Containers were also redesigned and reshaped. The design of the container should allow 3.5 mL of water in when positioned horizontally without leaking from the bottom. When used horizontally, it can take approximately 5 mL of water without leakage. It is worth mentioning that during experimental analyses the head of the containers was modified by applying RTV silicone adhesive for better sealing.
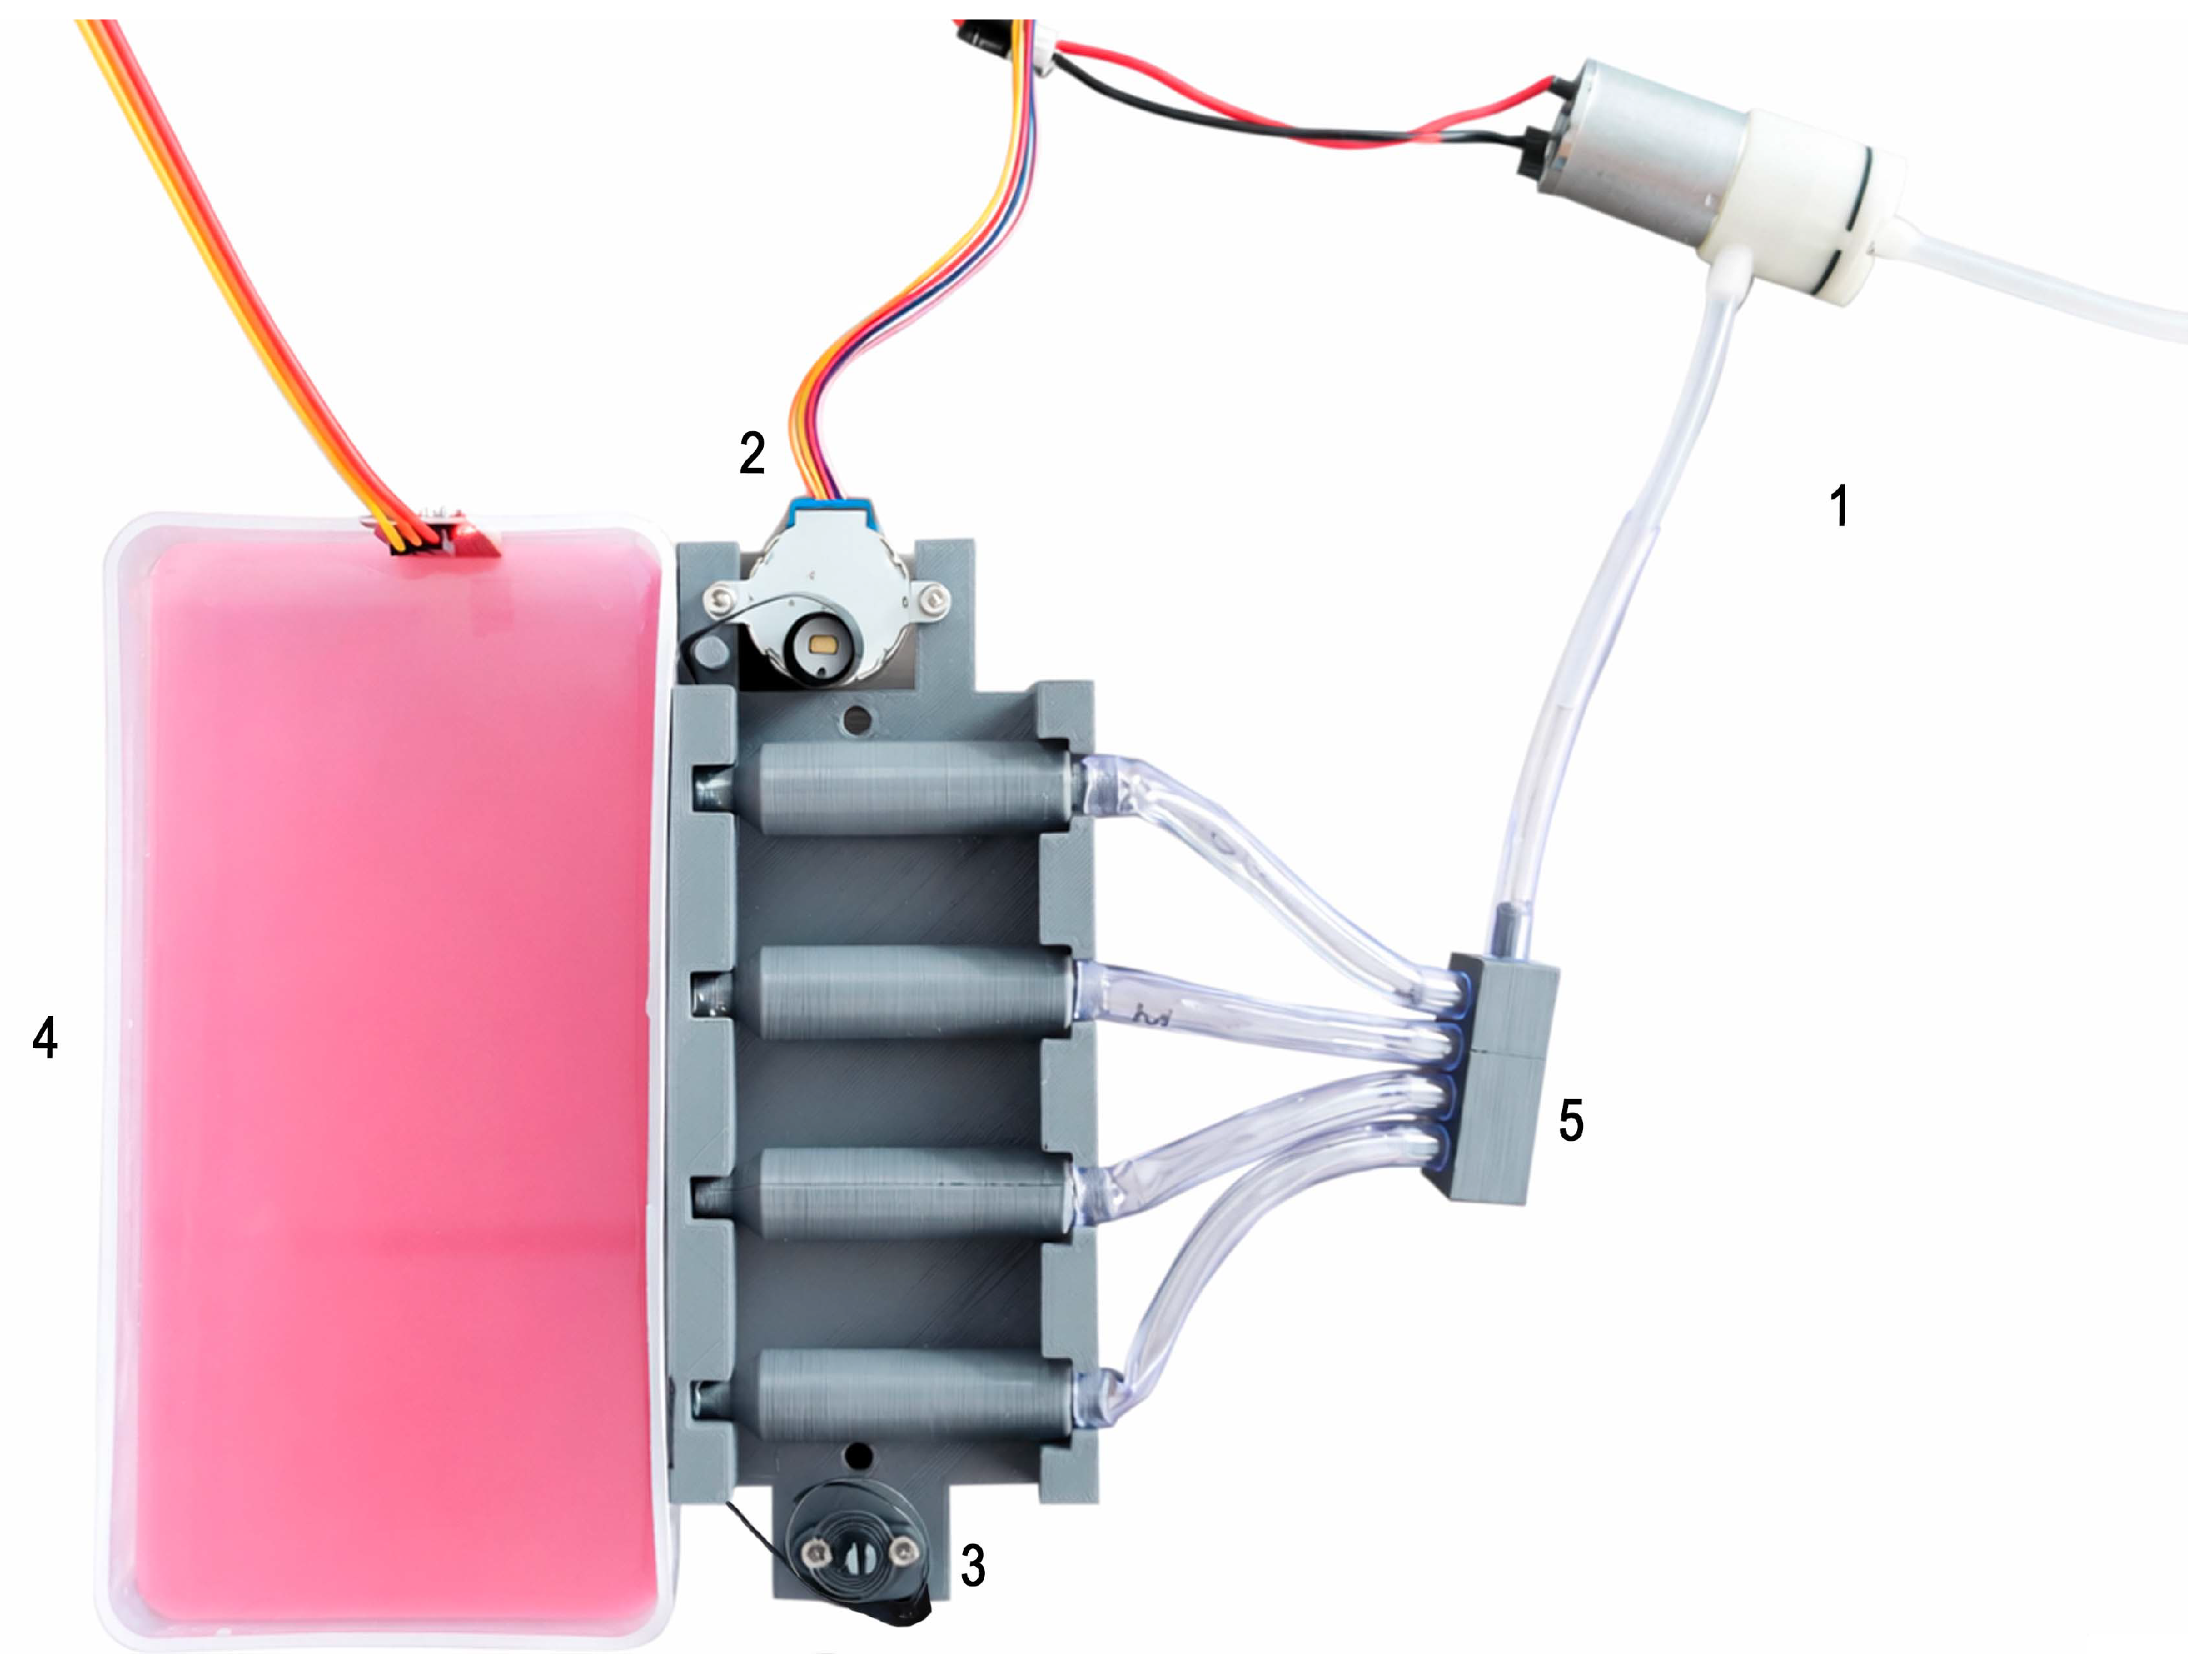
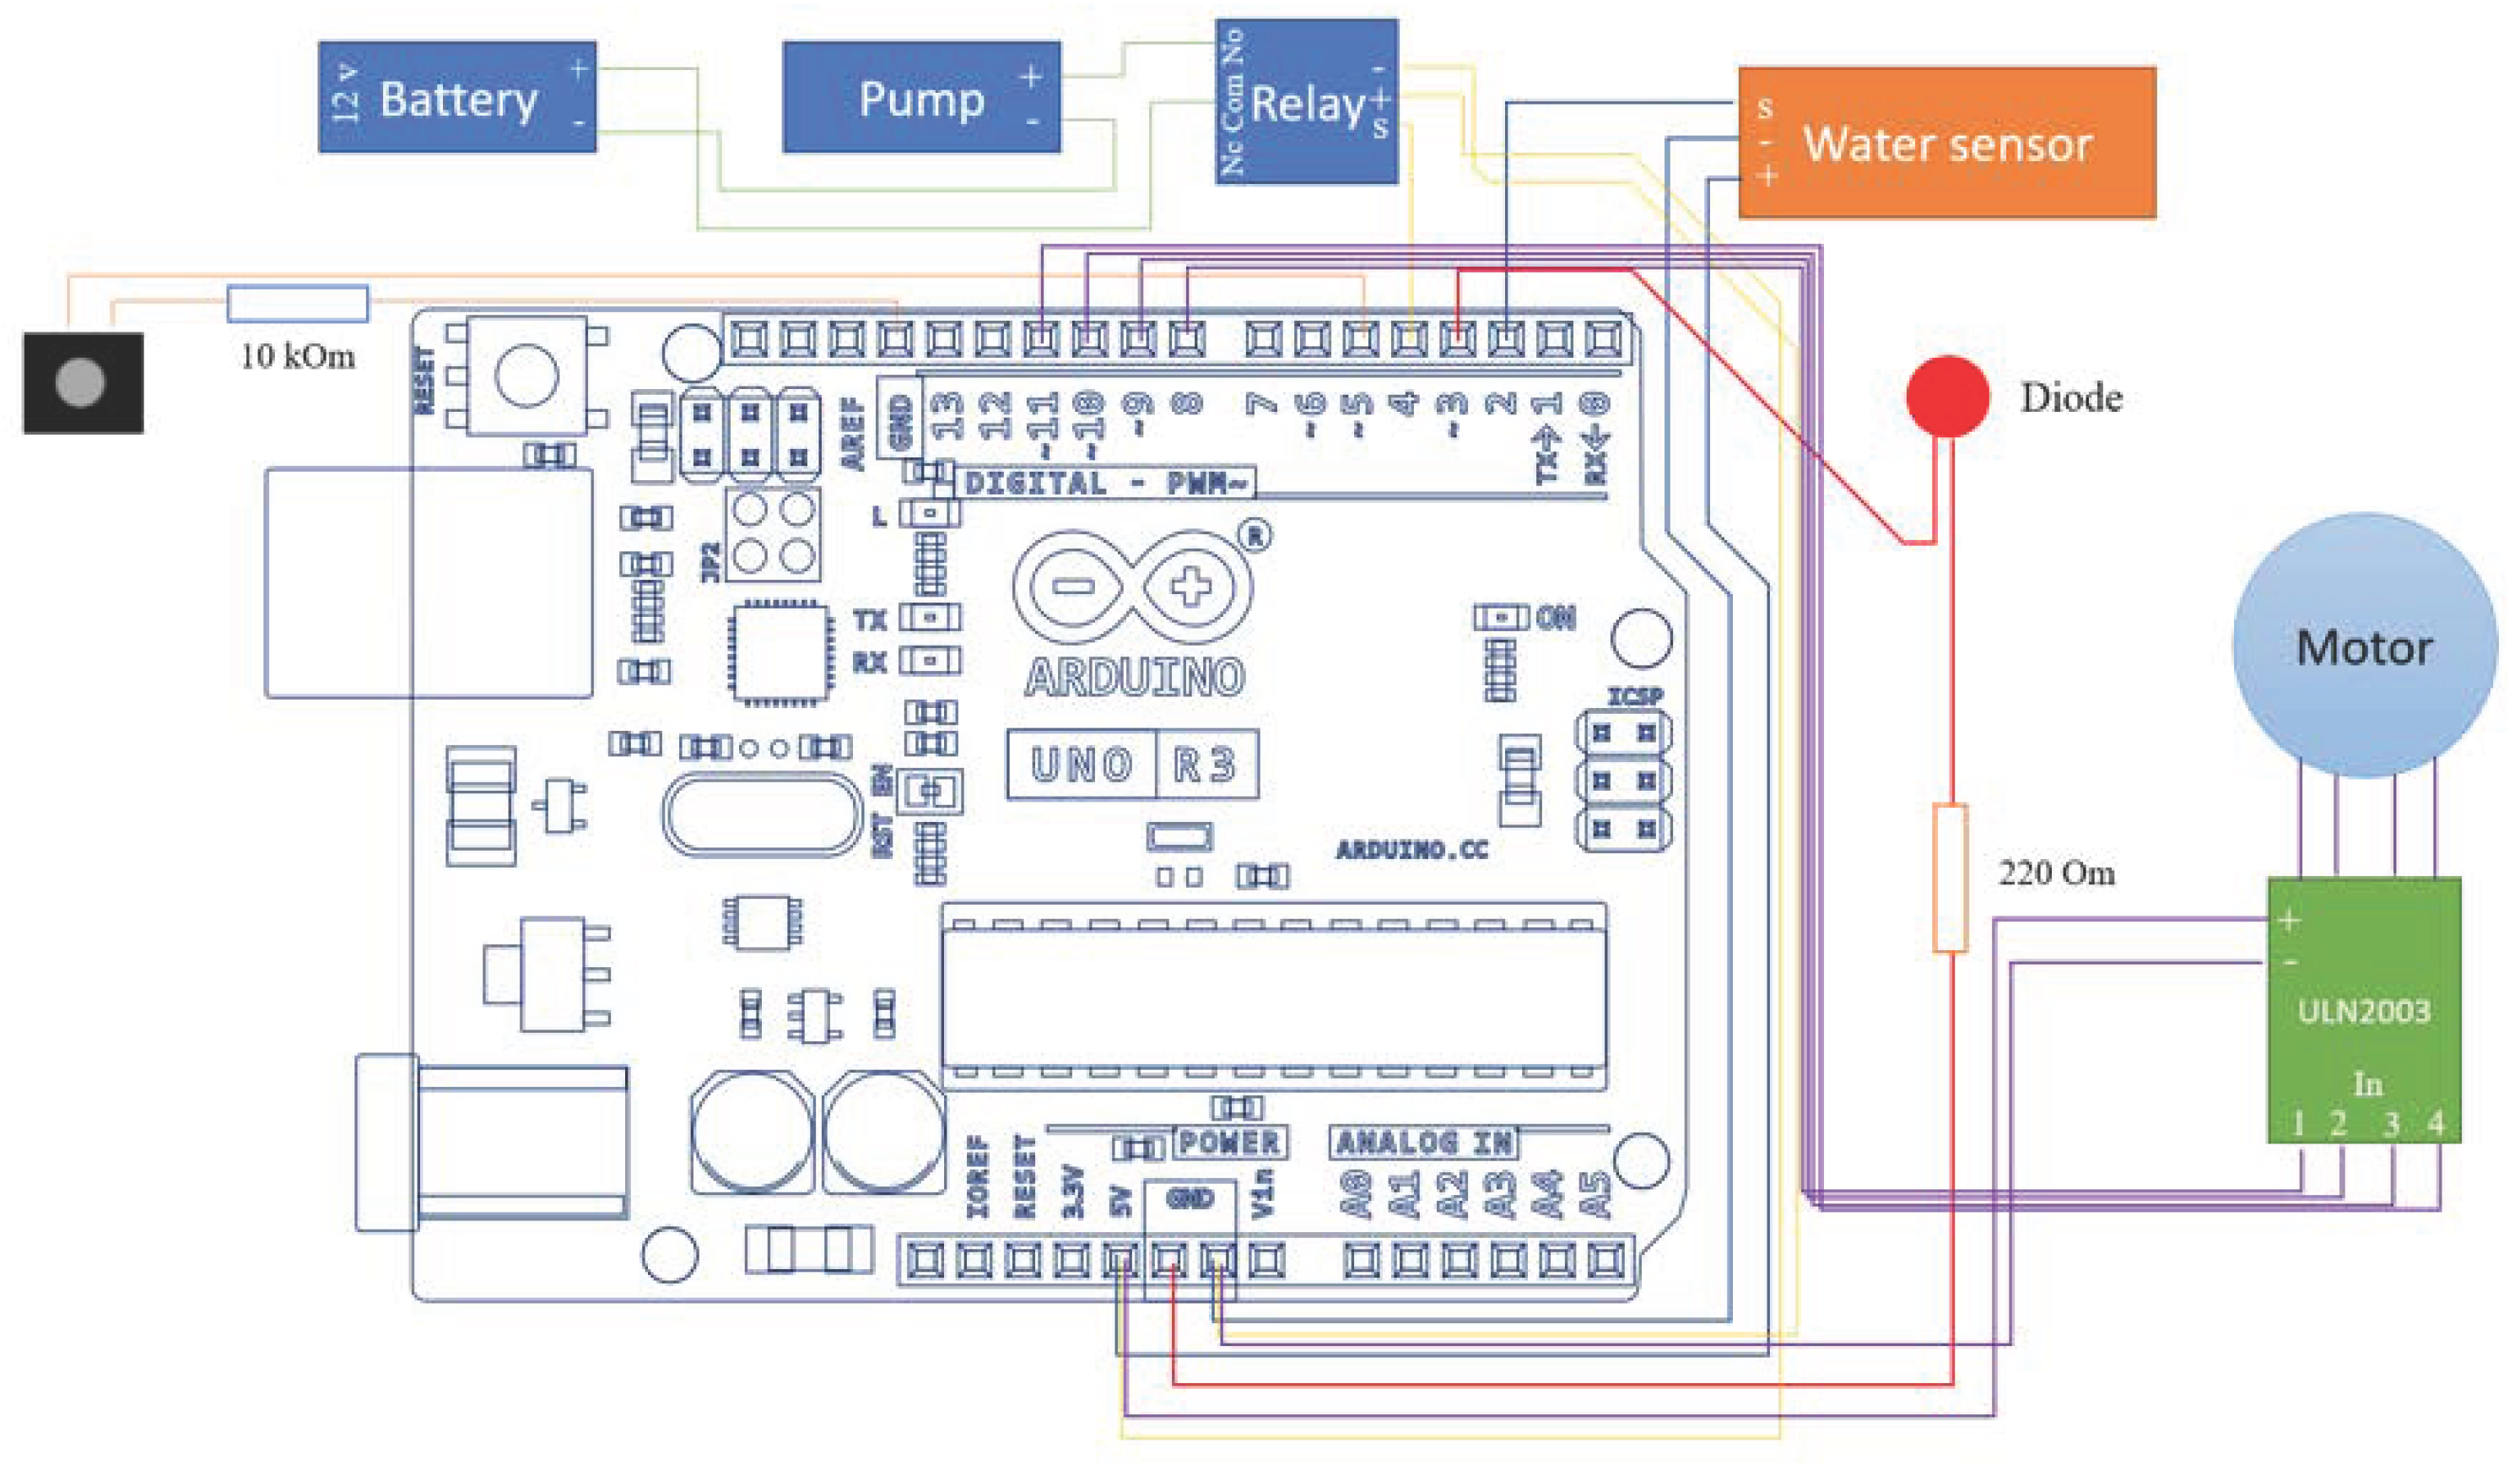
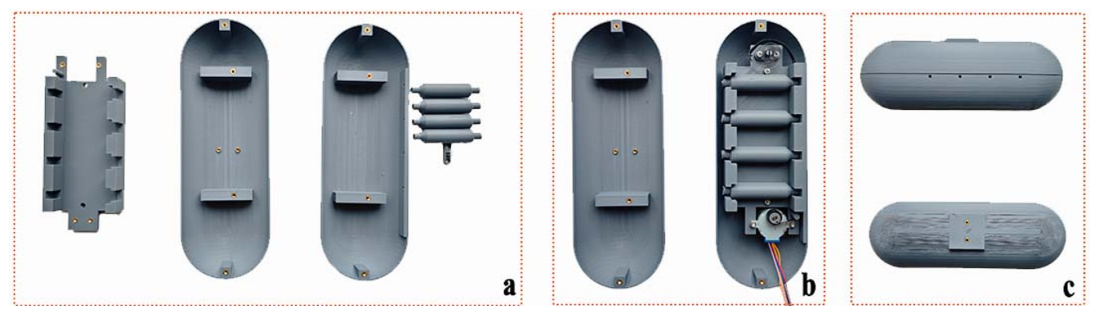
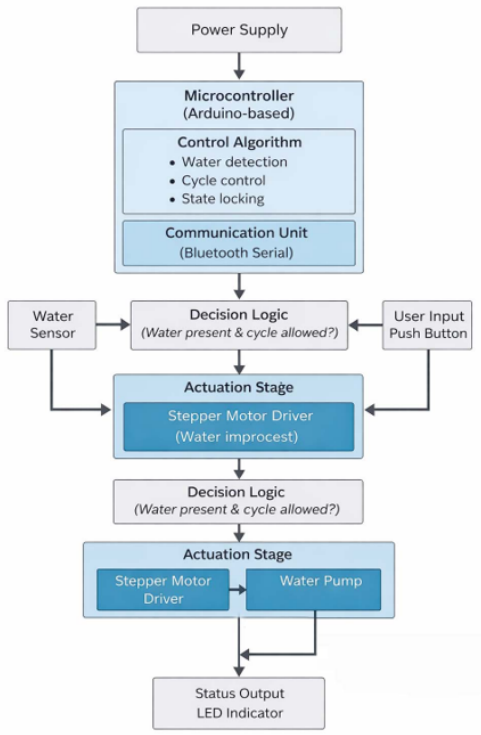
A prototype was created as seen Figure 8 with three separate section. Section (a) shows all printed components, (b) assembled inner components and (c) final fully assembled prototype. The setup for the experiment included 1 pump, 2 motor, 3 the main inner structure that keeps all elements connected, 4 reservoir and 5 dispenser. The setup can be seen in Figure 9. The prototype was printed with a 3D printer using the plastic material PLA. The platform is connected to a reservoir with water. Four containers are placed in the designed cut in the platform. A ribbon is passed through a cut that goes between the outer shell and the head of the container. The motor is placed at the end of containers, as illustrated in Figure 9, to twist the ribbon. Four tubes are connected to the ends of the containers, and the other ends of the tubes are connected to the pump using a dispenser. When the ribbon is positioned correctly, the pump can suck the water in. To control the process, Arduino was used. The electronic components and their connections can be seen in Figure 10. This figure illustrates the electronic architecture of the proposed multisampling device. The system is centered around an Arduino microcontroller which controls all electronic elements. This microcontroller allows the system work in chain path by analyzing data from sensors to actuate the motors and pump for the correct sampling. A program was written to activate the necessary elements in the correct order (Figure 11). The program works as follows: first, the data from the water sensor is observed. The process can be started only when the water sensor detects water. As the water is detected, a signal is sent to the operator (in this case, indicated by a diode). This time, a Bluetooth module with a LED indicator lamp was used, as the distance between the operator and the device was short. The operator starts the process by clicking the start button on the device (smartphone) or by pressing a real button. Then the motor turns to twist the ribbon so that the hole in it aligns with the outer shell and the container’s head. As this process ends, the pump is turned on to suck the water into the first container. Then the ribbon is twisted by the motor to align the hole between the two heads of the containers. The process can be repeated four times to fill all containers.

3. Results

This work produced two different results. The first results were accumulated as the structure was evaluated using engineering tools SolidWorks 2024 to see how it would perform under certain conditions. The second part of this research was done to perform an experiment to test how the created design and the whole mechanism are able to work under conditions close to real-world.

3.1. Finite Element Analysis

The following analysis was performed to understand how the structure behaves in scenarios where it hits an object while attached to the drone.
In order to assess mesh independence in the structural stress analysis of the capsule, three mesh configurations of varying refinement were generated and analyzed (Figure 12). The corresponding stress plots were compared to evaluate the influence of mesh density on the numerical results. This comparison enabled the identification of a mesh-independent criterion, which was then applied consistently across all subsequent stress analyses.
To establish the mesh-independence criterion for the structural analysis, the capsule was subjected to a uniform external pressure of 9.81 kPa applied over its entire outer surface. This loading condition represents the hydrostatic pressure experienced at a depth of approximately 1 m below the water surface. The stress response obtained under this pressure was evaluated for the three different mesh configurations, resulting on the Table 2. The relative differences between successive mesh levels were 3.43% and 2.51%, indicating limited sensitivity of the results to further mesh refinement. Based on these findings, the solution was considered mesh-independent within a 5% tolerance.
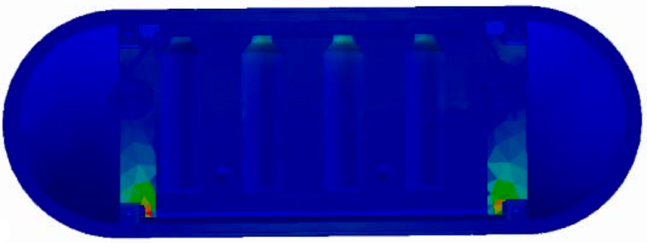
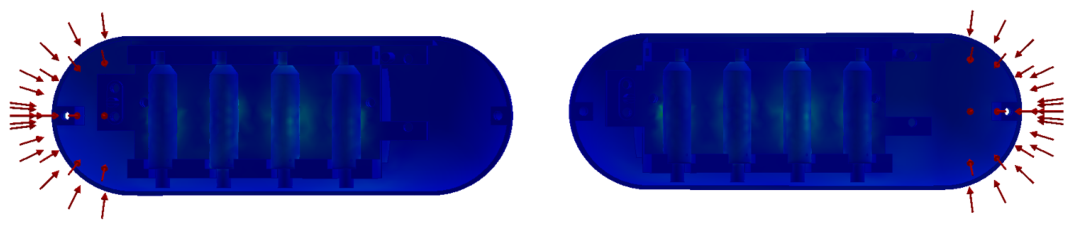
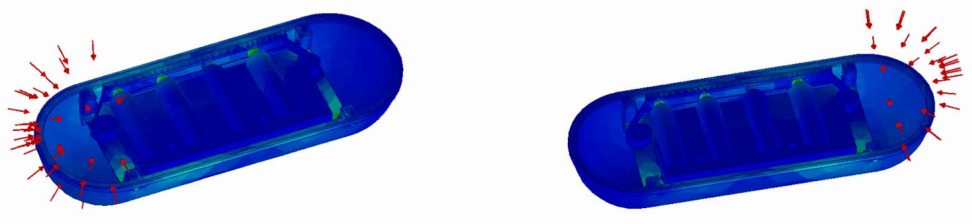
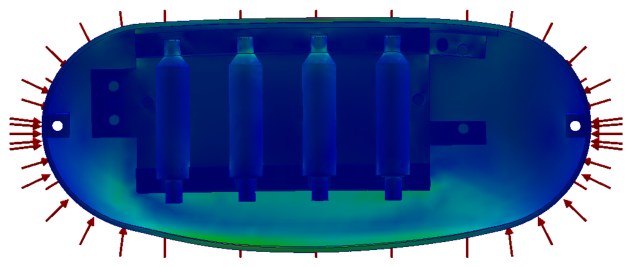
External force was added to both sides of the capsule separately, as mentioned in the methodology section. This type of force can cause inner movement of elements due to the sudden impact felt on the front and rear sides of the capsule. Also, a separate analysis was done by applying force to the bottom part of the capsule. This type of force application can mimic the entrance of the capsule into water. The results for the side impact illustrated that most of the impact is felt by the container heads. The first, second, and fourth containers are mostly deformed. The impact results can be seen in Figure 13. This figure illustrates the results of both forces (left and right). The platform inside the capsule also experienced slight deformations. The impact mostly occurs in the areas where it is connected to the capsule. In the case when force is applied to the bottom of the capsule, the inner structure experiences most of the damage (Figure 14). This time, containers two, three, and four are deformed compared to previous simulations. Then a second analysis was done with similar boundary conditions, but with the new redesigned final structure. Figure 15 shows results of forces acting on both sides. In both scenarios, no visible deformation occurred. Nonetheless, cuts on the outer shell for screws have a slight deformation. However, the force acting from the bottom still deforms the structure as previously, but in a slightly different manner. The heads are still under the pressure, as can be seen in Figure 16. But the concentration of deformation from the inner platform has now shifted to the outer shell. The results can be interpreted as the sudden impact occurs to the redesigned structure it will be bearded by the outer shell without severe destruction of inner mechanism.
The structural analyses were conducted assuming an underwater operational environment at a depth of 1 m. This depth was selected as a representative shallow-water scenario commonly encountered during water sampling missions. Under these conditions, the capsule is subjected to hydrostatic pressure in addition to the externally applied impact forces. The hydrostatic pressure was calculated using standard fluid mechanics principles and applied uniformly to the external surfaces of the capsule to replicate the surrounding water environment.
In addition to the static hydrostatic loading, external forces were applied independently to the front, rear, and bottom surfaces of the capsule to simulate sudden impact events. Side impacts represent collisions with obstacles while the capsule is attached to the UAV, whereas bottom-applied forces emulate the dynamic interaction occurring during water entry. Boundary conditions were defined to constrain the capsule at the attachment points to the drone, ensuring realistic force transmission paths between the capsule, internal platform, and container assemblies.
Although dynamic fluid–structure interaction effects were not explicitly modeled, this simplified approach enables the identification of stress concentrations, deformation patterns, and structural weaknesses under combined hydrostatic and impact loading, providing valuable insight for early-stage design validation.
Of course, these results cannot be directly interpreted as the most accurate representation of real-world scenarios, but such examinations allow us to indicate weak spots and areas for future improvement before actually building a prototype. As the results indicate, there are areas of concern; hence, these evaluations must be taken into consideration when designing the real structure.

3.2. Flow Simulations

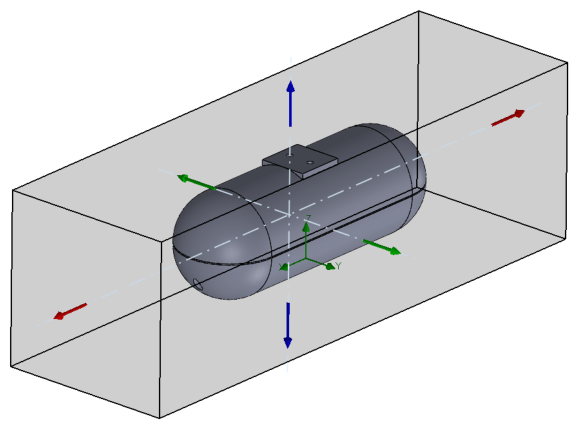
The final design model was analyzed using flow simulation. The methodology for this study consisted of conducting a series of computational fluid dynamics (CFD) simulations using SolidWorks Flow Simulation to characterize the hydrodynamic behavior of an underwater capsule during linear motion. An external flow analysis was selected to model the fluid–structure interaction between the capsule and the surrounding water, with gravity enabled and aligned with the global Z-axis g = ( 0 , 0 , 9.81 ) m / s 2 . The computational domain was generated automatically based on SolidWorks recommendations to ensure adequate space for wake formation and pressure stabilization. As a result, a rectangular computational domain with dimensions of 0.46 × 0.15 × 0.14 m was obtained (Figure 17) which was then meshed into a 3D global mesh of the domain to calculate each point of interest.
All simulations were performed using the predefined Liquid Water material from the engineering database, assuming incompressible, newtonian, and isothermal fluid conditions, with a density of ρ = 998 kg / m 3 and a dynamic viscosity of μ = 1.002 × 10 3 Pa · s . Since the capsule is intended for outdoor operation in natural water bodies such as rivers and lakes, the present study focuses on the external flow analysis, neglecting the internal volume and establishing complete external boundaries around the capsule. Both laminar and turbulent flow regimes were considered to adequately represent the range of hydrodynamic conditions encountered in these environments. Turbulence parameters were calculated as I = 0.16 R e 1 / 8 , k = 1.5 ( U · I ) 2 , and ϵ = C μ 0.75 · k 1.5 / L (Table 3).
Linear motions along the X, Y, and Z axes were imposed under multiple velocity conditions to obtain pressure fields, velocity distributions, and reaction forces, which serve as inputs for subsequent hydrodynamic modeling.
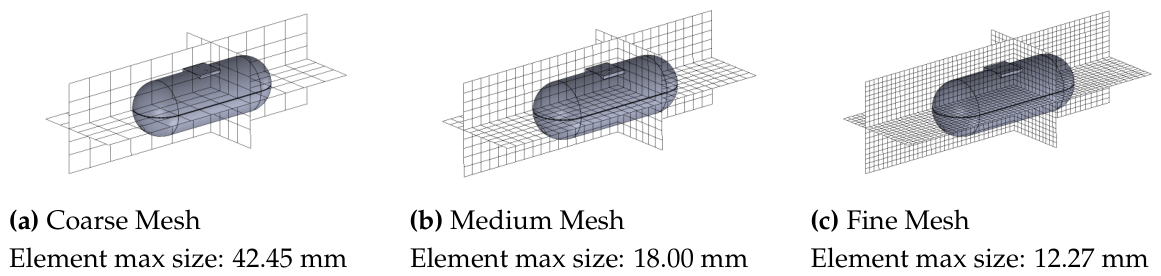
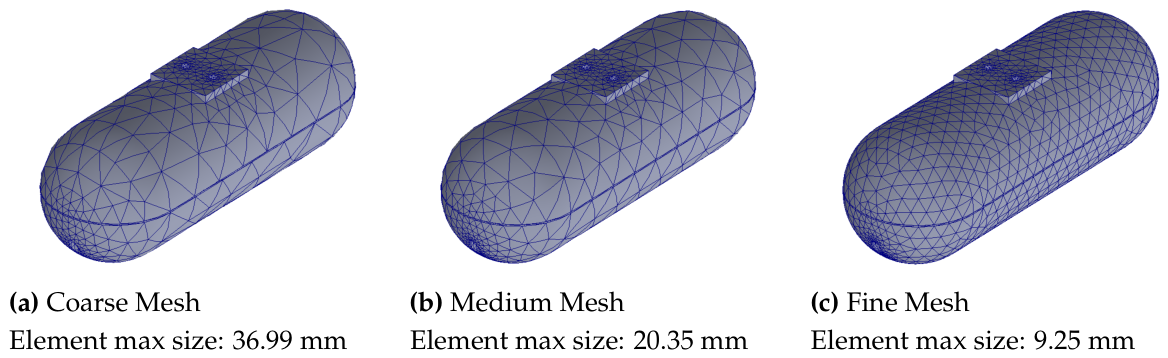
In order to assess mesh independence in the flow simulation of the capsule, three mesh configurations of varying refinement were generated and analyzed (Figure 18). The corresponding forces plots were compared to evaluate the influence of mesh density on the numerical results (Table 4). This comparison enabled the identification of a mesh-independent criterion, which was then applied consistently across all subsequent flow simulations.
The mesh independence study for the flow simulation yielded drag force values of 0.244 N, 0.184 N, and 0.141 N for the coarse, medium, and fine mesh configurations, respectively. The results exhibit a monotonically decreasing trend with increasing mesh refinement, indicating convergence of the solution. The relative change between the coarse and medium meshes was approximately 24.6%, while the change between the medium and fine meshes was approximately 23.4%. Although this reduction suggests that full mesh independence had not been entirely achieved, the fine mesh configuration was selected for all subsequent flow simulations as it provided the closest approximation to a converged solution. It is acknowledged that computational cost constraints limited the feasibility of further mesh refinement; therefore, the fine mesh represents a compromise between numerical accuracy and available computational resources.
Table 5 shows parameters extracted from the CAD model used as inputs for the hydrodynamic simulations. This table summarizes the geometric, mass, and inertial properties of the capsule used in the flow simulations analysis. Where m is the total mass of the capsule, B and W represent buoyancy and weight forces, respectively, v is the displaced volume, and l x , l y , l z and related terms represent the moments and products of inertia about the principal axes.
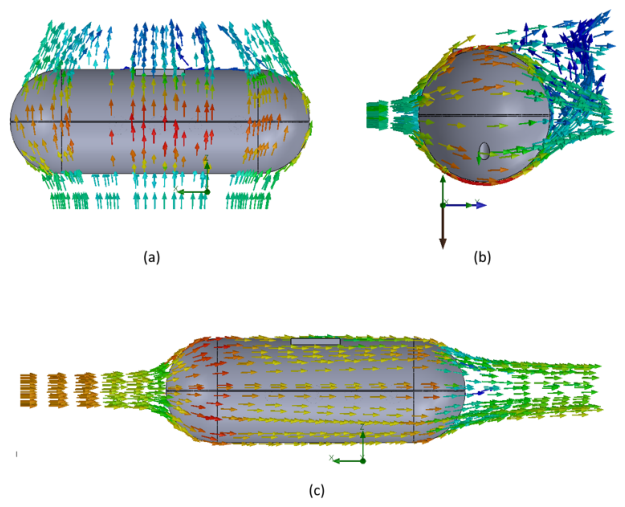
To characterize the hydrodynamic behavior of the capsule, translational velocities were applied independently along each principal axis, testing five velocity magnitudes for every direction v = { 0.5 , 1.0 , 1.5 , 2.0 , 2.5 } m / s . Accordingly, three simulation sets were performed: motion along the + X direction, motion along the + Y direction, and motion along the + Z direction, with each case used to capture pressure distributions, velocity trajectories, and the corresponding hydro-dynamic forces acting on the capsule as shown in Figure 19. A global mesh with an initial level of refinement set to level 3 was employed, and convergence was verified through force stabilization and reduction of solver residuals. For every velocity and axis configuration, the simulations produced pressure contour maps on selected cut-planes, flow trajectory velocity plots, resultant hydrodynamic force components obtained via Global Goals, and overall velocity magnitude fields; these outputs were subsequently used to derive the force–velocity relationships required for the hydrodynamic analysis.
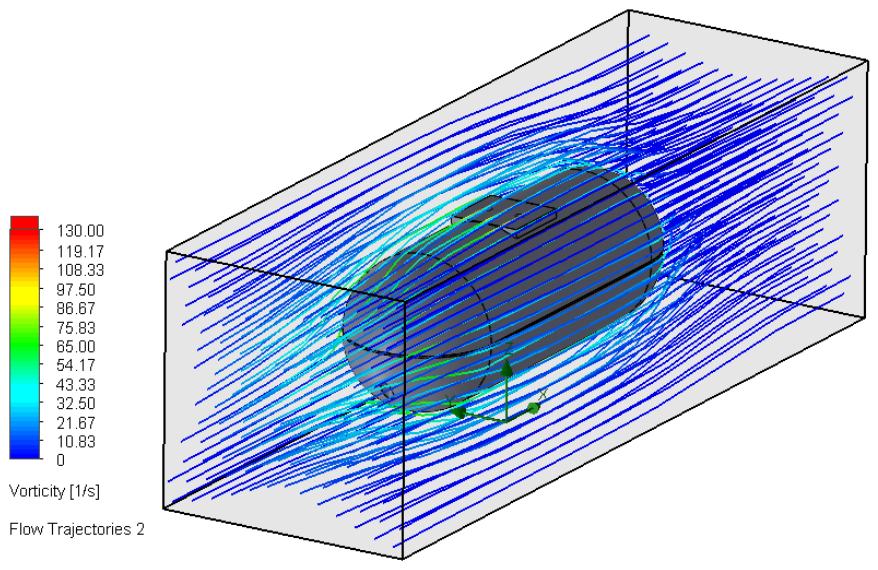
The Figure 19 shows the velocity vector fields around the underwater capsule for motion along the (a) X-axis, (b) Y-axis, and (c) Z-axis. In each case, the flow accelerates over the capsule’s surface and forms a wake region downstream, with color gradients indicating changes in velocity magnitude. The patterns reveal how the capsule’s geometry interacts with the surrounding fluid, highlighting zones of flow attachment, separation, and wake development for each motion direction. Figure 20 also indicates the wake region forming on the capsule surface in the form of vorticity lines across the computational domain.
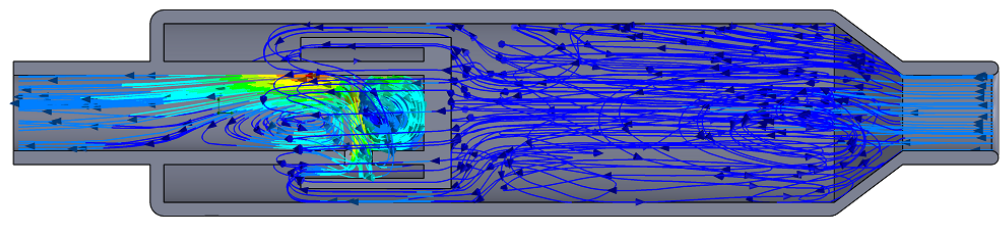
In addition to the external CFD analysis conducted on the capsule, flow simulations were also performed to characterize the internal flow behavior of the sample container (Figure 21). These simulations characterize the fluid dynamics that develop when the ribbon mechanism is actuated, allowing water to enter the container. The resulting simulations provide insight into the internal velocity fields and pressure distribution within the container during the filling process. This analysis identifies potential regions of flow stagnation or recirculation, and serves to verify that the internal flow conditions do not compromise sample integrity.

3.3. Hierarchical Dynamic Model

Computational domain fluid studies were performed in the capsule analysis of the capsule interactions under different velocities and directions of movements as shown in Table 6.
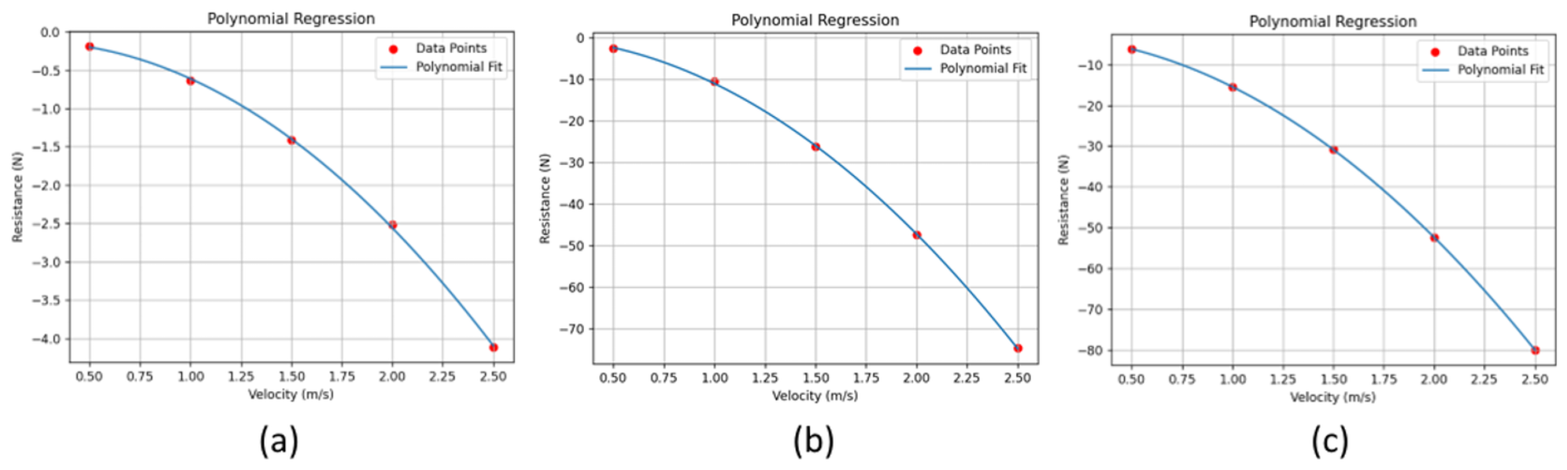
Figure 22 presents the polynomial regression curves describing the relationship between translational velocity and hydrodynamic resistance for motion along the (a) X-axis, (b) Y-axis, and (c) Z-axis. In all cases, the resistance increases in magnitude as velocity rises, following a nonlinear trend characteristic of drag-dominated regimes. The red markers represent the resistance values obtained from CFD simulations, while the blue curves show the polynomial fits that capture the underlying force–velocity behavior. Each plot demonstrates a smooth, monotonic decrease in resistance (more negative force) as velocity increases, indicating that higher translational speeds generate stronger hydrodynamic opposition on the capsule.
Equations (2)–(4) represent the polynomial models describing the hydrodynamic resistance in the X, Y, and Z directions as a function of translational velocity. In all cases, the dominant quadratic term is negative, indicating that resistance increases nonlinearly in magnitude as velocity rises, which is consistent with drag behavior in fluid dynamics. The differences in coefficients reflect how the capsule’s orientation relative to the flow affects the resulting hydrodynamic forces.
f r x ( v ) = 0.51857 v 2 0.13969 v + 0.07920
f r y ( v ) = 12.89771 v 2 + 5.83114 v 2.63760
f r z ( v ) = 11.59857 v 2 0.64569 v 2.33660
In the above equations v denotes the translational velocity of the capsule in the corresponding axis direction, while f r x ( v ) , f r y ( v ) , and f r z ( v ) represent the resulting hydrodynamic resistance forces obtained from simulations. The polynomial coefficients were determined through least-squares regression of the simulated force–velocity data, capturing the nonlinear drag behavior observed in the flow simulations.
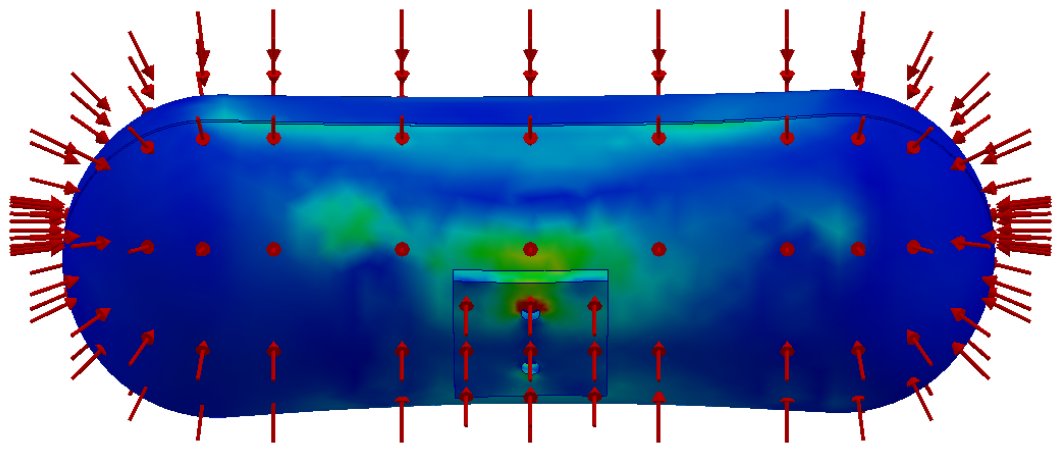
Following the CFD simulations, the resulting loading conditions were incorporated into the structural stress analyses to evaluate how the capsule would deform under realistic operating scenarios. The forces derived from the CFD study were applied as external loads in the mechanical simulations, allowing the assessment of stress distribution and structural integrity under combined hydrodynamic and impact effects. The results indicate that, despite localized deformations as shown in Figure 23, all evaluated parameters remained within acceptable limits, confirming that the capsule design satisfies the structural requirements identified in the CFD analysis.
The matrix M R B (5) represents the contribution of the capsule’s rigid-body mass and inertial properties to the 6-DOF dynamic model. The small numerical values indicate that the rigid-body effects are relatively minor compared to fluid-induced forces—consistent with a lightweight structure moving in a dense medium such as water. The off-diagonal terms reflect coupling between translational and rotational motions, which arise from the capsule’s nonspherical geometry. These couplings indicate that motion in one axis can induce secondary dynamic effects in another, a behavior typical of elongated or asymmetric underwater vehicles.
M R B = 1.6478 0 0 0 0 0 0 1.6478 0 0 0 0 0 0 1.6478 0 0 0 0 0 0 0.002047 0.0000767 0.0000137 0 0 0 0.0000767 0.0083715 0.0000336 0 0 0 0.0000137 0.0000336 0.00855332
The matrix C R B ( v ) (6) contains the Coriolis and centrifugal forces generated by the rigid body when the vehicle is in motion. Its entries depend directly on the linear and angular velocity components ( u , v , w , p , q , r ) . The presence of positive and negative cross terms shows how rotations generate lateral forces and how combined translational–rotational motions influence dynamic stability. This matrix preserves the skew-symmetry property expected in marine vehicle models, ensuring correct energy behavior during motion. Matrices presented below M R B and C R B represent the rigid-body inertia and Coriolis–centrifugal effects which are commonly used in six-degree-of-freedom underwater vehicle dynamics. Their structure reflects coupling between translational and rotational motions caused by the capsule’s asymmetric geometry.
C R B ( v ) = 0 0 0 0 1.64776928 w 0 0 0 0 1.64776928 w 0 0 0 0 0 1.64776928 v 1.64776928 u 0 0 1.64776928 w 1.64776928 v 0 0.00855332 r 0.0083715 q 1.64776928 w 0 1.64776928 u 0.00855332 r 0 0.00204735 p 1.64776928 v 1.64776928 u 0 0.0083715 q 0.00204735 p 0
The mass coefficient parameters in Table 7, damping coefficient parameters in Table 8, and restitution forces matrix (7) together define the dynamic response of the underwater capsule under realistic operating conditions. The mass coefficient parameters characterize the effective inertial behavior of the capsule, including added-mass effects induced by the surrounding fluid, which influence acceleration, maneuverability, and coupling between translational and rotational motions. The damping coefficient parameters quantify the hydrodynamic energy dissipation associated with viscous drag and flow separation, governing how the capsule stabilizes its motion and attenuates oscillations during steady translation or after disturbances.
The restitution forces matrix (7) represents the capsule’s reactive forces during contact or sudden loading events, such as impacts with submerged obstacles or transient interactions during deployment and retrieval. When integrated into the six-degree-of-freedom dynamic model, these elements enable accurate prediction of the capsule’s motion, stability, and structural loading in water, providing a consistent framework to assess performance, safety margins, and design robustness under combined hydrodynamic and mechanical effects.
g ( η ) = 4.2945 sin θ 4.2945 cos θ sin ϕ 4.2945 cos θ cos ϕ 0 0 0

3.4. Results of Experiment

The internal mechanism has been redesigned and built to operate in conditions close to real life. The structure was rethought to eliminate the impact on containers, as illustrated in numerical analysis. A more robust structure was modeled and enhanced with mechanical capabilities. The experimental setup was ready to be tested. In this study, the inner mechanism was examined. The experiment was performed resulting in 16 data sets. The data can be seen in Table 9. This table summarizes the experimental results obtained by varying the pump activation time for each container. The first indication from this table is that there is no water intake with the duration of 1 sec. At 1.5 s, partial filling occurred, while 2 s generally enabled adequate filling but introduced leakage issues due to insufficient sealing between the ribbon and the container heads. Table 10 represents values gathered by modifying the heads of containers to avoid linkage.
The proposed mechanism was capable of multisampling, as intended in this study; however, significant leakage issues were identified and resolved. The initial objective was to design a multisampling device that could collect uncontaminated water samples. This objective was achieved, as experimental results demonstrated. The mechanism successfully collected water in four separate containers without contamination.
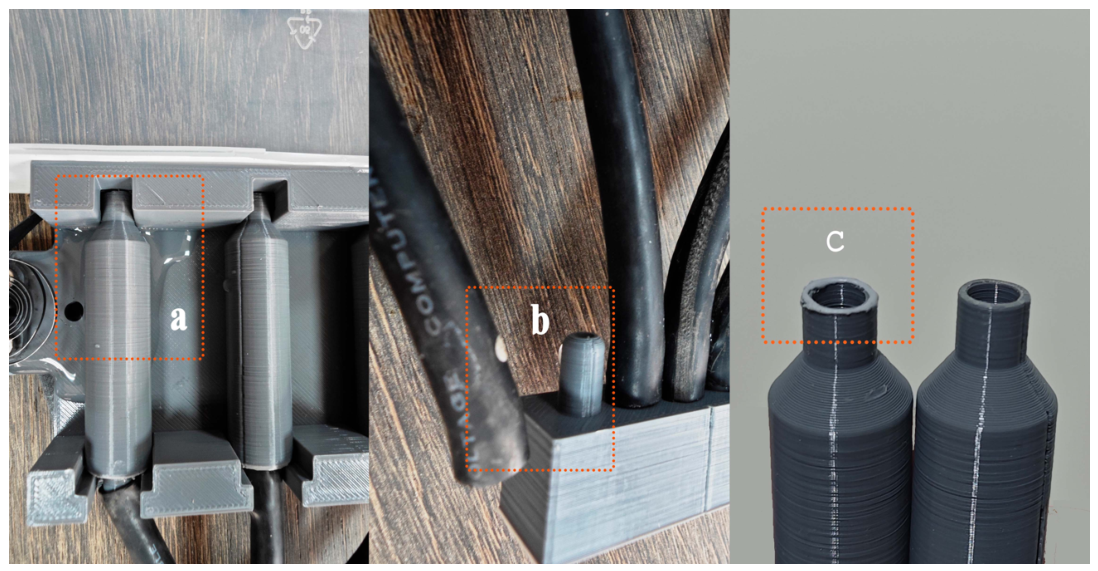
Leakage and misalignment were primarily caused by inadequate sealing and improper contact between different materials, leading to water escape at several structural junctions. Poor sealing at component interfaces was identified as the main issue to be addressed before developing a fully functional prototype. Initial experiments showed that increasing the pump operating time resulted in leakage due to the breakdown of surface tension, allowing water to flow uncontrollably under gravity and pressure differences (Figure 24a). Similar behavior was observed in subsequent containers, with additional cross-contamination occurring through the dispenser system (Figure 24b). In some cases, leakage prevented proper filling of the containers, while in others incomplete filling was attributed to air leakage at the interface between the container heads and the ribbon.
To mitigate these issues, a silicone adhesive was applied to the container heads, which significantly improved sealing performance (Figure 24c). This modification effectively reduced leakage and enabled reliable sample collection. Minor leakage observed in the fourth container was traced to a defective component and eliminated by replacing it.
Table 11 summarizes the experimental performance metrics obtained before and after the sealing improvements applied to the sampling containers. In the initial prototype configuration, the intake success rate reached 43.75%, while leakage was observed in 25% of the trials After applying silicone sealing to the container heads, leakage incidence was reduced to 5%. In addition, the intake success rate increased to 75%, indicating improved operational robustness. In both configurations, pump activation times below 1.5 s consistently resulted in no water intake, confirming a minimum effective operating threshold. Overall, the post-fix results demonstrate that improved sealing significantly enhances reliability and reduces contamination-related risks without increasing system complexity.

4. Discussion

From an operational perspective, the proposed ribbon-based mechanism extends UAV-assisted water sampling beyond single-point collection by enabling sequential sampling at multiple spatial locations within the same flight. While most existing UAV sampling solutions remain limited to one sample per mission, Wu et al. [8] reported a multisampling concept based on repositioning a single tube to fill multiple containers. However, using the same tube across sampling sites may compromise analytical integrity due to residual droplets and carry-over between samples. In contrast, the proposed approach implements a mechanically simple positioning principle in which a single orifice embedded in a tensioned ribbon is aligned with each container inlet for a controlled interval and then displaced to close it, supported by hydrostatic pressure and silicone sealing to reduce leakage and cross-contamination.
This design, protected as a utility model patent (RU 2024138296), provides a practical and lightweight solution for multi-point water sampling by reducing the reuse of wet internal paths across sampling sites. The patented ribbon-based mechanism enables repeatable sequential sampling with minimal control complexity, facilitating straightforward integration into low-cost UAV platforms for field deployment. This study presents a proof-of-concept prototype in which PLA was selected for rapid prototyping; however, its limitations in humid environments restrict its suitability for real-world applications, and future implementations will consider more durable materials such as PETG or engineering polymers.
The fluid dynamics and stress simulations were performed to understand the hydrodynamic response of the capsule, which currently lacks active control while submerged. These analyses provide the basis for future work focused on the design of a lifting and stabilization mechanism to be integrated with the UAV, with the aim of reducing turbulence-induced disturbances and improving operational stability during water sampling. The CFD analysis was conducted using SolidWorks Flow Simulation as an exploratory design-support tool; therefore, no mesh-independence study or advanced turbulence modeling was performed, and the results should be interpreted as indicative trends rather than fully converged hydrodynamic predictions. A key limitation of this work is that the analysis was conducted using a decoupled CFD–structural approach, which does not capture fully coupled fluid–structure interaction (FSI) effects. While this approach is appropriate for preliminary design stages, future work will incorporate advanced multiphysics simulations to account for two-way coupling and improve model accuracy.

5. Conclusions

This study looks into the design and evaluation of a multisampling device accompanied by an unmanned aerial vehicle. Two sets of results were collected in this study which are related to the structure and inner mechanism ability to bear external forces and experimental results on how well the proposed mechanism works. For the fluids study results illustrated the need for control strategies that account for nonlinear drag and multi-axis coupling. The experiment was set up as it was described in methodology. The mechanism worked as it was proposed and was capable not just to sample water but do it four times with each separate container being used. To achieve this result several issues were addressed such as, structural issues and most importantly improper sealing that lead to leakage of water and improper container filling.
Experimental validation demonstrated that the proposed multisampling mechanism is technically viable and capable of sequential water collection using a single UAV deployment. Quantitative performance analysis showed that improvements in container sealing significantly reduced leakage events while increasing the sampling success rate. The results also confirmed a minimum effective pump activation time required for reliable intake, providing a clear operational guideline for future implementations. Although the experimental campaign focused on functional validation rather than chemical contamination analysis, the observed reduction in leakage and flow misrouting supports the effectiveness of the proposed mechanical isolation strategy. Overall, the findings confirm that the ribbon-based multisampling approach offers a practical and scalable solution for multi-point water sampling, with clear pathways for further optimization and system-level integration.
Future improvements.
To withstand harsh impact, more robust materials can be used. In this research, PLA was utilised due to the ease of making prototypes, enhancing it in a rapid manner, and accessibility of the apparatus. At the beginning, models were, as it was mentioned earlier, built with different variations, and each new concept was rearranged for the best performance. Also, without drastic rearrangement of inner parts, the external forces can be managed more modestly. The proposed new design of containers is good at keeping the inflow in a controlled environment without leakage. However, it can be improved further for convinient use.
It is anticipated that the container will be modified in the future for immediate analysis using built-in sensors. Each container will be equipped with a built-in sensor. Different sensors can be built into one or arranged for each container differently. The other forecast is that the complex mechanism can be simplified by the use of valves.
Nonetheless, the proposed device is capable of multisampling of water in a single flight in hard-to-reach or dangerous environments. Its compact and lightweight design makes it suitable for integration with various UAVs to enhance its capabilities and thus expand its usability. A potential application includes water quality assessment in lakes, rivers, and reservoirs, pollution monitoring, disaster response, etc. For instance, this device will be used at the Kadyrov Chechen State University in the mountains for the assessment of local basins.

6. Patents

For this project, a utility model patent (RU 2024138296) and a certificate of state registration of a computer program (RU 2025687656) have been obtained.

Author Contributions

Conceptualization, I.M.; methodology, I.M., S.V., D.Z., P.H.N. and A.B.; investigation, I.M., D.Z. and J.L.O.A.; resources, E.M., A.B.; data curation, A.B.; writing—original draft preparation, I.M.; visualization, I.M. and J.L.O.A.; project administration and funding acquisition, I.M. All authors have read and agreed to the published version of the manuscript.

Funding

The work was carried out within the framework of the development program of the Federal State Budgetary Educational Institution of Higher Education “Kadyrov Chechen State University” for 2025–2036.

Data Availability Statement

All materials and datasets related to this publication are accessible to the readers.

Conflicts of Interest

The authors declare no conflicts of interest.

Abbreviations

The following abbreviations are used in this manuscript:
PLAPolylactic Acid
RTVRoom-Temperature-Vulcanizing

References

  1. McDonald, W. Drones in urban stormwater management: A review and future perspectives. Urban Water J. 2019, 16, 505–518. [Google Scholar] [CrossRef]
  2. Cavalhieri, C.P. Water sampling with drones. In Proceedings of the XXIII Brazilian Symposium on Water Resources, Foz do Iguaçu, PR, Brazil, 24–28 November 2019; pp. 1–10. [Google Scholar]
  3. Zhang, R.; Wang, Z.; Li, X.; She, Z.; Wang, B. Water Quality Sampling and Multi-Parameter Monitoring System Based on Multi-Rotor UAV Implementation. Water 2023, 15, 2129. [Google Scholar] [CrossRef]
  4. Koparan, C.; Koc, A.B.; Privette, C.V.; Sawyer, C.B.; Sharp, J.L. Evaluation of a UAV-Assisted Autonomous Water Sampling. Water 2018, 10, 655. [Google Scholar] [CrossRef]
  5. Koparan, C.; Koc, A.B. Unmanned Aerial Vehicle (UAV) assisted water sampling. In Proceedings of the ASABE Annual International Meeting; American Society of Agricultural and Biological Engineers (ASABE): St. Joseph, MI, USA, 2016. [Google Scholar] [CrossRef]
  6. Ding, L.; Zhu, G.; Li, Y.; Wang, Y. Cable-Driven Unmanned Aerial Manipulator Systems for Water Sampling: Design, Modeling, and Control. Drones 2023, 7, 450. [Google Scholar] [CrossRef]
  7. Yang, P.; Wang, H.; Liu, Z.; Dong, Z.; Zhang, L. Development of an Anthropomorphic and Dexterous Dual-Arm System for Aerial Cooperative Bimanual Manipulation. Machines 2022, 10, 273. [Google Scholar] [CrossRef]
  8. Wu, J.; Deng, W.; Huang, F.; Song, X.; Li, L.; Zhai, Z. Development of a UAV-assisted autonomous water sampling device. Discov. Appl. Sci. 2025, 7, 182. [Google Scholar] [CrossRef]
  9. Farinha, A.T.; di Tria, J.; Reyes, M.; Rosas, C.; Pang, O.; Zufferey, R.; Pomati, F.; Kovac, M. Off-shore and underwater sampling of aquatic environments with the aerial-aquatic drone MEDUSA. Front. Environ. Sci. 2022, 10, 1023269. [Google Scholar] [CrossRef]
  10. Singh, D.; Singh, R.; Ajmeria, R.; Gupta, M.; Ponnalagu, R.N. DAWSSM: A plug-and-play Drone Assisted Water Sampling and Sensing Module. In Proceedings of the IECON 2021—47th Annual Conference of the IEEE Industrial Electronics Society, Toronto, ON, Canada, 13–16 October 2021; pp. 1–6. [Google Scholar] [CrossRef]
  11. Karimanzira, D.; Jacobi, M.; Pfuetzenreuter, T.; Rauschenbach, T.; Eichhorn, M.; Taubert, R.; Ament, C. First testing of an AUV mission planning and guidance system for water quality monitoring and fish behavior observation in net cage fish farming. Inf. Process. Agric. 2014, 1, 131–140. [Google Scholar] [CrossRef]
  12. Connolly, R.M.; Jinks, K.I.; Herrera, C.; Lopez-Marcano, S. Fish surveys on the move: Adapting automated fish detection and classification frameworks for videos on a remotely operated vehicle in shallow marine waters. Front. Mar. Sci. 2022, 9, 918504. [Google Scholar] [CrossRef]
  13. Azis, F.A.; Aras, M.S.M.; Rashid, M.Z.A.; Othman, M.N.; Abdullah, S.S. Problem identification for Underwater Remotely Operated Vehicle (ROV): A case study. Procedia Eng. 2012, 41, 554–560. [Google Scholar] [CrossRef]
  14. Kaizu, Y.; Iio, M.; Yamada, H.; Noguchi, N. Development of unmanned airboat for water-quality mapping. Biosyst. Eng. 2011, 109, 338–347. [Google Scholar] [CrossRef]
  15. Zhang, M.; Li, D.; He, Y.; Xiong, J.; Li, Z.; Xiong, M. Autonomous water sampling system and experiment based on the unmanned surface vehicle. In Proceedings of the 2021 IEEE International Conference on Unmanned Systems (ICUS); IEEE: New York, NY, USA, 2021; pp. 608–661. [Google Scholar]
  16. Zhang, M.; Li, D.; Xiong, J.; He, Y.Q. Multi-dimensional water sampling unmanned surface vehicle development and application. Int. J. Dyn. Control 2023, 11, 3188–3208. [Google Scholar] [CrossRef]
  17. Salhaoui, M.; Molina-Molina, J.C.; Guerrero-González, A.; Arioua, M.; Ortiz, F.J. Autonomous underwater monitoring system for detecting life on the seabed by means of computer vision cloud services. Remote Sens. 2020, 12, 1981. [Google Scholar] [CrossRef]
  18. Samsudin, S.I.; Salim, S.I.M.; Osman, K.; Sulaiman, S.F.; Sabri, M.I.A. A smart monitoring of a water quality detector system. Indones. J. Electr. Eng. Comput. Sci. 2018, 10, 951–958. [Google Scholar] [CrossRef]
  19. Rao, A.S.; Marshall, S.; Gubbi, J.; Palaniswami, M.; Sinnott, R.; Pettigrove, V. Design of low-cost autonomous water quality monitoring system. In Proceedings of the 2013 International Conference on Advances in Computing, Communications and Informatics (ICACCI), Mysore, India, 22–25 August 2013; pp. 14–19. [Google Scholar] [CrossRef]
  20. Magomedov, I.; Kashirokov, N.A.; Magomedov, E. New Mobile Device for Water Collection Accompanied by an Un-manned Aerial Vehicle. In Proceedings of the 2025 International Ural Conference on Electrical Power Engineering (UralCon), Magnitogorsk, Russia, 25–28 September 2025; pp. 195–199. [Google Scholar] [CrossRef]
Figure 1. Prototype 1 is a sampler device attached to the drone that sends an ultrasonic signal during the flight (a) and, when it is 30 cm far from the water surface (b), this signal is reflected (c) and sampling starts (d).
Designs 10 00058 g001
Figure 2. Structural model illustrating the main components: (1) lower capsule body, (2) sealing interface, (3) upper body, (4) ribbon guider, (5) sampling containers, (6) pump, (7) rib-bon, (8) ribbon-driving motor, (9) screw sealing, (10) lifting mechanism, (11) attach-ment lid for UAV mounting, and (12) internal support platform.
Designs 10 00058 g002
Figure 3. Detailed view of container design with illustration of inner structure for flow control.
Designs 10 00058 g003
Figure 4. Detailed view of of inner mechanism.
Designs 10 00058 g004
Figure 5. Flow diagram of automated sequential water sampling system.
Designs 10 00058 g005
Figure 6. Boundary conditions applied during finite element analysis of the capsule structure with indication of forces.
Designs 10 00058 g006
Figure 7. Redesigned inner structure of the capsule with key dimensions. Changes were made to increase the structure’s resistance to various external forces.
Designs 10 00058 g007
Figure 8. Fabrication stages of the physical prototype: (a) individual components of the structure; (b) partially assembled structure with the inner view; (c) fully assembled device.
Designs 10 00058 g008
Figure 9. Experimental setup of the main inner structure: (1) pump, (2) ribbon-driving motor, (3) internal support platform, (4) water reservoir, (5) dispenser.
Designs 10 00058 g009
Figure 10. Electronic components and control circuit of the multisampling device. The system includes an Arduino-based controller, motor drivers, water detection sensor, pump control unit, and Bluetooth communication module, enabling the work of the whole device.
Designs 10 00058 g010
Figure 11. Block diagram of the Arduino-based automated water control system illustrating the sensing, decision logic, communication, and actuation stages, including the water sensor, Bluetooth interface, stepper motor, pump, and status LED.
Designs 10 00058 g011
Figure 12. Mesh quality plots for capsule stress analysis.
Designs 10 00058 g012
Figure 13. Deformation distribution of the initial capsule design under lateral impact forces applied to both sides. Figures show stress concentration at container heads and internal support interfaces.
Designs 10 00058 g013
Figure 14. Deformation distribution of the initial capsule design under external forces applied to bottom of the structure. Figures show stress concentration at container heads and internal support interfaces.
Designs 10 00058 g014
Figure 15. Deformation distribution of the redesigned capsule design under lateral impact forces applied to both sides. Figures show less stress concentration at container heads and internal support interfaces.
Designs 10 00058 g015
Figure 16. Deformation distribution of the redesigned capsule design under external forces applied to bottom of the structure. Figures show stress concentration at container heads and capsule sides.
Designs 10 00058 g016
Figure 17. Computational domain for the flow simulations.
Designs 10 00058 g017
Figure 18. Mesh quality plots for flow simulation.
Designs 10 00058 g018
Figure 19. Flow simulation results indicating velocity trajectories around the capsules. Also, this figure shows the velocity vector fields around the underwater capsule for motion along the (a) X-axis, (b) Y-axis, and (c) Z-axis.
Designs 10 00058 g019
Figure 20. Vorticity test.
Designs 10 00058 g020
Figure 21. Flow simulation on sample container showing velocity lines.
Designs 10 00058 g021
Figure 22. (a) Flow velocity variation along the X-axis, (b) Flow velocity variation along the Y-axis, and (c) Flow velocity variation along the Z-axis. Red points show the value obtained in the simulation.
Designs 10 00058 g022
Figure 23. Stress test considering CFD-derived forces.
Designs 10 00058 g023
Figure 24. Illustration of issues observed during experimental testing: (a) water leakage between the ribbon and the capsule structure after container filling; (b) unintended water flow toward the dispenser, leading to potential contamination of adjacent containers; (c) with silicone adhesive coating.
Designs 10 00058 g024
Table 1. Comparative evaluation of existing UAV-assisted water sampling methods.
Ref.Sampling MethodCross-PlatformSamples
[2]Pump + tubeYes1
[3]Retractable tube with solenoid valvesYes5
[4]Tube with sealing mechanismNo1
[6]Mechanical manipulator-based samplingNo1
[8]Multi-container (shared tube)Yes5
[9]Capsule releaseYes2
Table 2. Maximum von Mises stress values obtained from the mesh study.
Mesh QualityMax StressUnit
Coarse 19.71 MPa
Medium 20.41 MPa
Fine 19.91 MPa
Table 3. Turbulence Parameters.
VelocityIntensity (I %)k (J/kg) ϵ (W/kg)
0.54.220.00070.0039
13.870.00230.0183
1.53.680.00460.0086
23.550.00760.0182
2.53.450.01120.0327
Table 4. Forces obtained from the mesh study at 0.5 m/s.
Mesh QualityForceUnit
Coarse 0.244 N
Medium 0.184 N
Fine 0.141 N
Table 5. CAD parameters for simulation.
ParameterSymbolValueUnit
Massm1.64776928kg
Buoyancy ForceB11.8701N
WeightW16.16461664N
l x 0.00204735kg·m2
l y 0.0083715kg·m2
l z 0.00855332kg·m2
l x x 0.00204828kg·m2
l y x 0.00007673kg·m2
Inertia l z x 0.00001368kg·m2
l x y 0.00007673kg·m2
l y y 0.00854593kg·m2
l z y −0.00003356kg·m2
l x z 0.00001368kg·m2
l y z −0.00003356kg·m2
l z z 0.00837796kg·m2
Volumev0.00030113m3
LengthL244mm
Widtha84mm
Heighth85mm
Table 6. Forces obtained from each simulation.
AxisVelocityForce of Resistance
X0.5 m/s−0.141 N
1.0 m/s−0.532 N
1.5 m/s−1.314 N
2.0 m/s−2.299 N
2.5 m/s−3.496 N
Y0.5 m/s−2.639 N
1.0 m/s−10.830 N
1.5 m/s−21.378 N
2.0 m/s−43.484 N
2.5 m/s−68.467 N
Z0.5 m/s−5.708 N
1.0 m/s−14.245 N
1.5 m/s−29.516 N
2.0 m/s−50.206 N
2.5 m/s−76.331 N
Table 7. Mass Coefficient Parameters.
AxisSymbolValueDimension
Added mass coefficients
Surge X u ˙ −0.605kg
Sway Y v ˙ −0.605kg
Heave Z w ˙ −0.605kg
Roll K p ˙ 0 k g · m 2 / r a d
Pitch M q ˙ 0 k g · m 2 / r a d
Yaw N r ˙ 0 k g · m 2 / r a d
Table 8. Damping Coefficient Parameters.
AxisSymbolValueDimension
Linear damping coefficients
Surge X u −0.13969Ns/m
Sway Y v 5.83114Ns/m
Heave Z w −0.64569Ns/m
Roll K p 0Ns/m
Pitch M q 0Ns/m
Yaw N r 0Ns/m
Quadratic damping coefficients
Surge X u | u | −0.51857 N s 2 / m 2
Sway Y v | v | −12.89771 N s 2 / m 2
Heave Z w | w | −11.59857 N s 2 / m 2
Roll K p | p | 0 N s 2 / m 2
Pitch M q | q | 0 N s 2 / m 2
Yaw N r | r | 0 N s 2 / m 2
Table 9. Results of experiment by changing the pump’s working time.
ContainerPump Time (s)ProgressIssues
110.5No water in container
21.0No water in container
31.5Container slightly filled
42.0Filled containerLeakage of water between ribbon and main structure
520.5No water in container
61.0No water in container
71.5Container slightly filled
82.0Over Filled1. Leakage of water between ribbon and main structure; 2. Water went to dispenser
930.5No water in container
101.0No water in container
111.5Container slightly filled1. Leakage of water between ribbon and main structure
122.0Container slightly filled1. Leakage of water between ribbon and main structure
1340.5No water in container
141.0No water in container
151.5No water in container
162.0Container slightly filled
Table 10. Results of experiment by changing the pump’s working time with modified containers.
ContainerPump Time (s)ProgressIssues
1710.5No water in container
181.5Container slightly filled
192Filled container
202Filled container
212.5Filled container
2220.5No water in container
231.5Container slightly filled
242Filled container
252Filled container
262.5Filled container
2730.5No water in container
281.5Container slightly filled
292Filled container
302Filled container
312.5Filled container
3240.5No water in container
331.5Container slightly filledLeakage of water
342Filled container
352Filled container
362.5Filled container
Table 11. Experimental performance metrics before and after sealing improvement.
MetricPre-Fix PrototypePost-Fix Prototype
Number of sequences1620
Intake Success Rate (ISR)43.75% (7/16)75.00% (5/20)
No-intake rate56.25% (9/16)20% (4/20)
Leakage Incidence (LI)25.0% (4/16)5.0% (1/20)
Effective pump time window≥1.5 s≥1.5 s
Disclaimer/Publisher’s Note: The statements, opinions and data contained in all publications are solely those of the individual author(s) and contributor(s) and not of MDPI and/or the editor(s). MDPI and/or the editor(s) disclaim responsibility for any injury to people or property resulting from any ideas, methods, instructions or products referred to in the content.