
Article

Dynamic Simulation and Characteristic Analysis of a Two-Stage Hydrogen Pressure-Reducing Valve

1
Manufacturing Company of China National Logging Corporation, Xi’an 710201, China
2
Machinery Industry Pump Special Valve Engineering Research Center, Lanzhou 730050, China
3
School of Petrochemical Engineering, Lanzhou University of Technology, Lanzhou 730050, China
*
Author to whom correspondence should be addressed.
Designs 2026, 10(2), 27; https://doi.org/10.3390/designs10020027
Submission received: 24 December 2025 / Revised: 14 February 2026 / Accepted: 22 February 2026 / Published: 1 March 2026

Abstract

As a critical component of the hydrogen supply system for fuel cells in hydrogen-powered unmanned aerial vehicles (UAVs), the dynamic performance of the two-stage hydrogen pressure-reducing valve (PRV) directly influences the stability and safety of the fuel cell system. To address the insufficient output pressure control accuracy of existing hydrogen PRVs under a 70 MPa inlet pressure, this study designs a compact, fast-response, and high-precision two-stage hydrogen PRV. The flow coefficients of the valve orifices at each stage are obtained through Computational Fluid Dynamics (CFD) simulations, based on which a multi-physics coupled system dynamics model of the two-stage hydrogen PRV is derived. Using this multi-physics coupled dynamics model, a dynamic characteristic simulation model is established in MATLAB/Simulink. Numerical simulations performed with this model reveal the influence of different structural parameters on the dynamic characteristics of the first-stage and second-stage PRVs. The results provide theoretical and methodological references for the structural design and efficient optimization of two-stage hydrogen PRVs under high-pressure differential conditions, offering important guidance for improving the safety and stability of fuel cell hydrogen supply systems.

1. Introduction

Against the backdrop of continuously growing global energy demand, the overconsumption of traditional fossil fuels has led to severe energy crises and environmental challenges. In this context, hydrogen energy has emerged as a core strategic direction for the global energy transition, owing to its prominent advantages such as zero carbon emissions, high energy density, efficient conversion rate, and renewability [1,2,3]. As a key application of hydrogen energy, hydrogen fuel cells, characterized by their high energy density and rapid dynamic response, have become the preferred power source for mobile platforms like hydrogen-powered unmanned aerial vehicles (UAVs) [4]. Within such systems, the hydrogen pressure-reducing valve (PRV) serves as a critical pressure-regulating component. Its primary function is to progressively reduce the high pressure of hydrogen from the storage tank to the working pressure required by the fuel cell stack, thereby supplying downstream circuits with gas at a stable flow rate and pressure. Currently, multi-stage pressure reduction structures are commonly employed to achieve precise pressure regulation [5]. In a typical two-stage configuration, the first-stage PRV undertakes the bulk pressure drop, while the second-stage PRV performs fine-tuning of the output pressure. However, when the inlet pressure is as high as 70 MPa, the pressure reduction performance of the first-stage valve often proves inadequate. This inadequacy leads to significant pressure fluctuations at the inlet of the second-stage valve, consequently compromising the control accuracy and stability of the final outlet pressure. Such issues ultimately jeopardize the safety and reliability of the entire hydrogen fuel cell system, highlighting a critical challenge that necessitates in-depth investigation.
Extensive research has been conducted worldwide on the design of hydrogen pressure-reducing valves. For instance, Chen et al. [6] proposed a Multi-Stage High-Pressure-Reducing Valve (MSHPRV) for use in Fuel Cell Electric Vehicles (FCEVs) and investigated the effects of various structural parameters on its internal flow dynamics. Their findings indicated that, compared to a single orifice plate, the multi-stage sleeve and valve core assembly plays a dominant role in the hydrogen throttling process. Zhang et al. [7] introduced a pressure reduction system for hydrogen fuel cell vehicles, featuring a novel multi-stage valve (termed the T-M valve) that combines a sleeve-type pressure-regulating structure with a Tesla-type orifice. They developed a Computational Fluid Dynamics (CFD) model to analyze how operational parameters influence pressure and velocity distributions. Jin et al. [8] developed a novel High Multi-Stage Pressure-Reducing Valve (HMSPRV) designed for stable pressure reduction of hydrogen in refueling stations. In a separate study, Chen et al. [9] proposed a novel L-shaped high-pressure-reducing valve for an onboard hydrogen supply system. Furthermore, Liu et al. [10] designed a two-stage, high-pressure, high-precision reducing valve suitable for compact hydrogen FCEVs and proposed an equivalent matching method for determining the effective stiffness of its metal diaphragm. In summary, existing research on hydrogen PRV design has predominantly focused on industrial applications such as FCEVs. However, hydrogen-powered unmanned aerial vehicles (UAVs) impose stringent requirements for compact size and low weight on ancillary systems. Conventional valve architectures often fail to meet these specific flight design constraints. Consequently, dedicated research and design efforts targeting hydrogen PRVs optimized for UAV applications remain notably scarce, representing a significant gap in the current body of knowledge.
The dynamic performance of the hydrogen pressure-reducing valve (PRV) is critical to the stability and safety of the pneumatic system. Currently, research on the dynamic characteristics of gas pressure-reducing valves by scholars primarily involves establishing coupled multi-physics mathematical models based on the valve structure and working principle, and subsequently investigating the valve’s dynamic performance through transient numerical simulations [11,12,13,14,15,16]. Qian et al. [17] utilized the Fluent dynamic mesh technique to analyze the dynamic characteristics of the second-stage regulator in a two-stage hydrogen PRV and performed structural optimization. Wang et al. [18] established an AMESim simulation model for a gas pressure regulator, studied the influence of structural parameters on the first-stage output pressure, and obtained an optimal set of structural design parameters through optimization. Bing et al. [19] investigated the impact of structural parameters of a tapered valve core on the flow characteristics of a hydrogen PRV and proposed optimization measures to alter the flow pattern. Wang et al. [20] employed the dynamic mesh method to study the dynamic characteristics of a spring-type hydrogen PRV, and verified the computational reliability through experiments and theoretical models. Liu et al. [21] used dynamic simulation methods to study the dynamic characteristics of a gas proportional pressure-reducing valve, analyzing the displacement, pressure, and velocity characteristics of the valve core during the opening process, and obtained the system outlet flow rate at maximum opening. In summary, extensive research on the dynamic characteristics of gas pressure-reducing valves has been conducted by scholars domestically and internationally, providing specific guidance for the structural design of these valves. However, the predominant existing research method involves building one-dimensional dynamic simulation models for numerical analysis. Given the structural complexity of the two-stage hydrogen PRV, its high machining precision requirements, and the fact that the valve core moving assembly is perpetually in a state of dynamic equilibrium, the current dynamic characteristic research methodologies lack adequate description of the flow equations, leading to deviations in the results. In addition to the above studies, the authors have previously conducted related research on valve dynamic modeling and performance analysis, focusing on the establishment of coupled mathematical models and the influence of structural parameters on system stability and response characteristics. These prior investigations provide methodological foundations and modeling experience for the present study on the dynamic performance and structural optimization of a two-stage hydrogen pressure-reducing valve.
Aiming at the existing problems of narrow pressure regulation range and insufficient output pressure control accuracy in current gas pressure-reducing valves, and in response to the operational requirements of hydrogen-powered UAVs, this study conducts structural improvement and optimization on an existing two-stage hydrogen pressure-reducing valve (PRV). A compact, fast-response, high-precision two-stage hydrogen PRV for high-pressure differential applications is designed. Furthermore, based on the gas state equation and the throttling orifice flow equation, the differential equations of motion for the valve cores, the flow continuity equations between chambers, and the thermodynamic differential equations for the chambers of the two-stage hydrogen PRV are derived. This leads to the establishment of a multi-physics coupled system dynamics model for the valve. Comprehensively considering the structure and working principle of the two-stage hydrogen PRV, and integrating the multi-physics coupled system dynamics model, a system ddydynamic simulationodel is built using MATLAB/Simulink software (Version 25.1) [22]. The dynamic characteristics of the two-stage hydrogen PRV are investigated through numerical simulation, and the accuracy of the MATLAB/Simulink dynamics simulation model is verified against data from the literature. Utilizing this dynamic simulation model, the influence of various valve structural parameters on the dynamic characteristics of both the first-stage and second-stage regulators is studied separately. The dynamic performance and pressure control accuracy of the preliminarily designed two-stage hydrogen PRV are analyzed. This research provides significant guidance for improving the stability and safety of the hydrogen supply system in hydrogen-powered UAVs.

2. Study of the System Dynamic Model of the Two-Stage Hydrogen Pressure-Reducing Valve

2.1. Structural Design and Working Principle of the Two-Stage Hydrogen Pressure-Reducing Valve

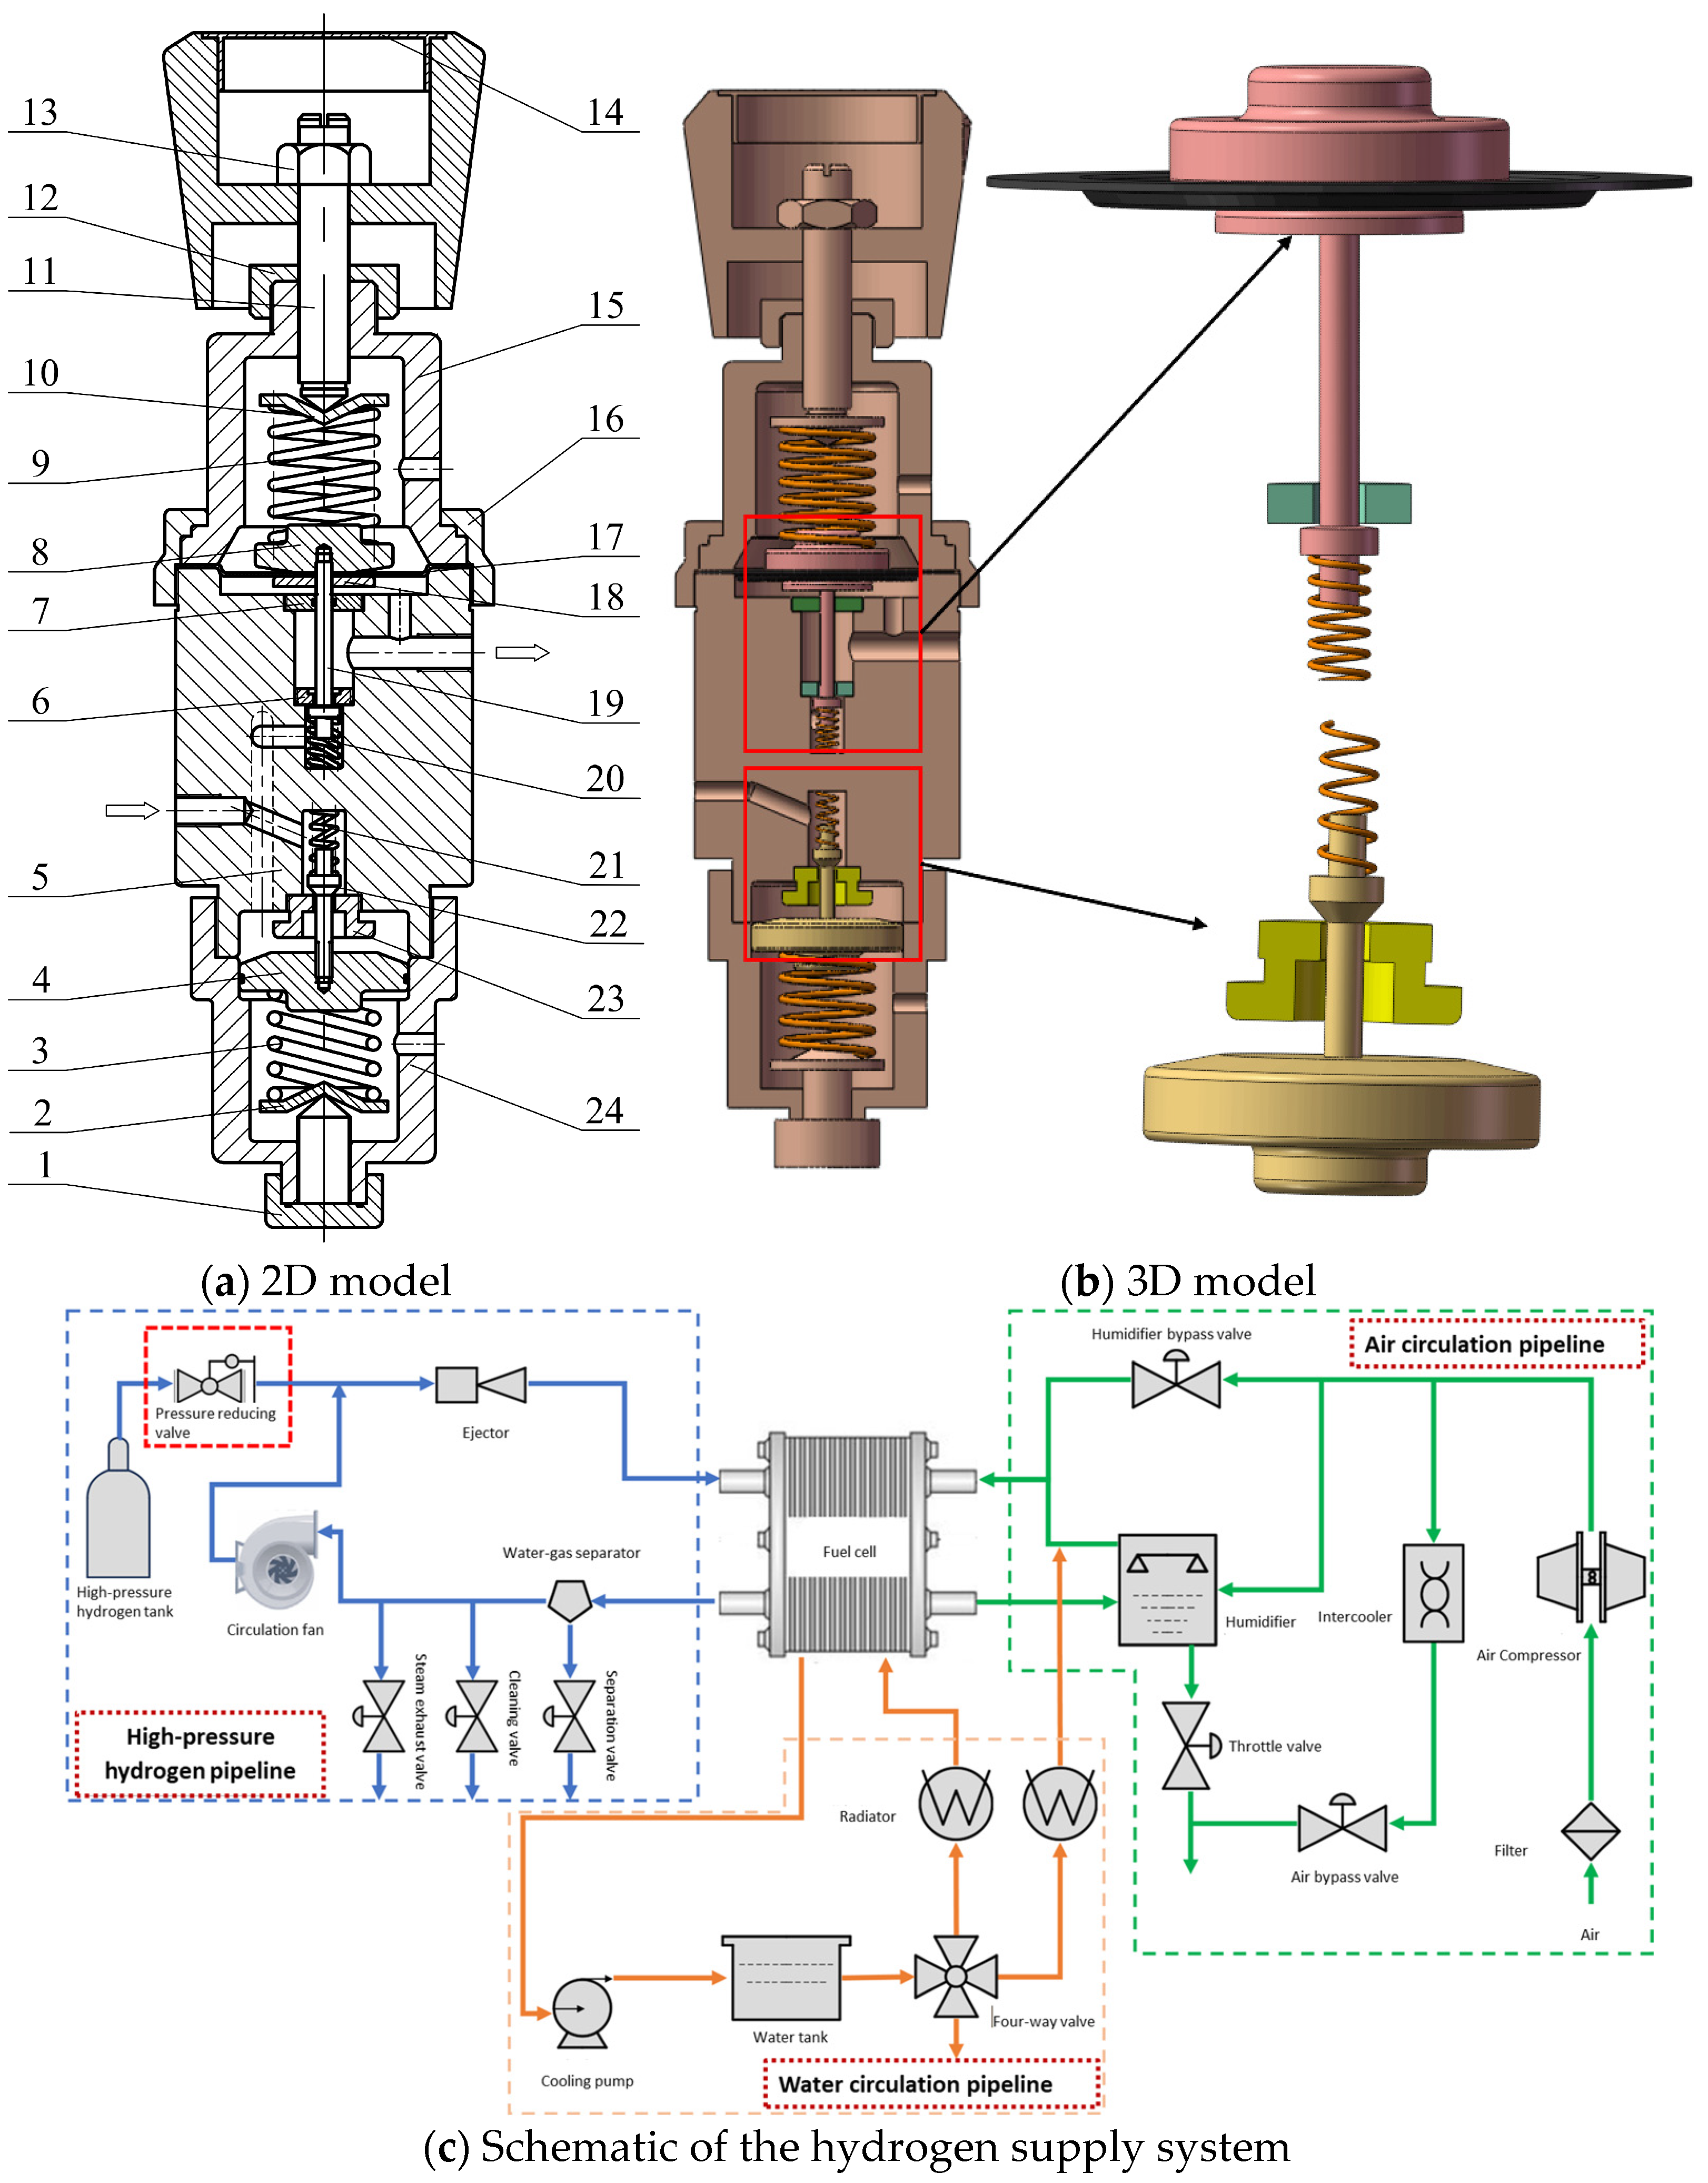
The two-stage hydrogen pressure-reducing valve comprises two direct-acting pressure-reducing valves connected in series, designated as the first-stage and the second-stage valves. The first-stage valve undertakes the primary pressure reduction, while the second-stage valve is responsible for precise output pressure control. As shown in Figure 1, the first-stage valve primarily consists of a main spring, a piston, an auxiliary spring, a valve core, and a valve seat. Figure 1a and Figure 1b show the 2D and 3D views of the two-stage hydrogen pressure-reducing valve, respectively. The valve is composed of multiple mechanical components, labeled as follows: 1. Lower adjustment bolt, 2. lower regulating shim, 3. main spring of first-stage valve, 4. piston, 5. valve body, 6. valve seat of second-stage valve, 7. sealing gasket of second-stage valve, 8. sealing disk, 9. main spring of second-stage valve, 10. upper regulating shim, 11. upper adjustment bolt, 12. knob handle, 13. valve stem nut, 14. knob handle cover, 15. upper valve cap, 16. fastening clamp ring, 17. diaphragm, 18. spring washer, 19. valve core of second-stage valve, 20. auxiliary spring of second-stage valve, 21. auxiliary spring of first-stage valve, 22. valve core of first-stage valve, 23. valve seat of first-stage valve, 24. lower valve cap. The first-stage valve core is designed with a conical surface structure, which provides substantial flow resistance and can withstand a high-pressure drop, thereby ensuring a smooth pressure reduction process. A dual-spring design is employed, where the main spring adjusts the position of the valve core—and consequently the valve opening—based on the fluid force acting upon it, to achieve pressure reduction. The auxiliary (reset) spring plays a supportive role, working in conjunction with the main spring to control the valve core position. The second-stage valve mainly includes a main spring, a diaphragm, an auxiliary spring, a valve core, and a valve seat. The second-stage valve core utilizes a flat design, which offers minimal flow resistance and effectively reduces manufacturing complexity. Furthermore, an outlet pressure feedback mechanism is incorporated. The reduced-pressure hydrogen flows through a feedback orifice to the pressure feedback chamber. When the system outlet pressure exceeds the design specification of 0.3 MPa, the hydrogen within the feedback chamber acts upon the diaphragm to adjust the valve core position, restoring the outlet pressure to the equilibrium setpoint and thus realizing an over-pressure protection function. A more detailed schematic illustrating the two-stage hydrogen pressure-reducing valve and its application within a hydrogen supply system is shown in Figure 1c. Figure 1c presents the hydrogen supply system for the UAV fuel cell, illustrating the high-pressure hydrogen storage, two-stage pressure-reducing valve, and connection to the fuel cell, ensuring stable hydrogen supply and pressure regulation.
The hydrogen from the high-pressure storage tank is highly compressed, with an outlet pressure reaching up to 70 MPa. This high-pressure gas enters the first-stage pressure-reducing valve through the inlet. The fluid then passes through the annular throttling gap between the first-stage valve core and the valve seat, causing the pressure of the high-pressure hydrogen to drop from 70 MPa to the designed level of 7 MPa. If the outlet pressure of the first-stage valve exceeds the design setpoint, the moving components of the valve core experience a greater downward force, driving the valve core to move downward. This movement reduces the effective actuation area, thereby decreasing the output pressure until it returns to the design setpoint. The fluid, after being reduced by the first-stage valve, flows into the second-stage valve through its orifice, enabling the system outlet pressure to achieve the design target of 0.3 MPa. Should the first-stage valve fail or the second-stage valve not be adjusted to an appropriate opening, leading to a system outlet pressure exceeding 0.3 MPa, the pressure in the feedback chamber increases and acts upon the lower side of the diaphragm. This causes the second-stage valve core assembly to move upward, reducing the valve opening. Consequently, the outlet pressure is lowered back to the design specification of 0.3 MPa, thereby fulfilling the over-pressure protection function.

2.2. Numerical Simulation of the Flow Coefficient for the Two-Stage Hydrogen PRV Orifice

2.2.1. Flow Channel Model Development for the First-Stage and Second-Stage PRVs

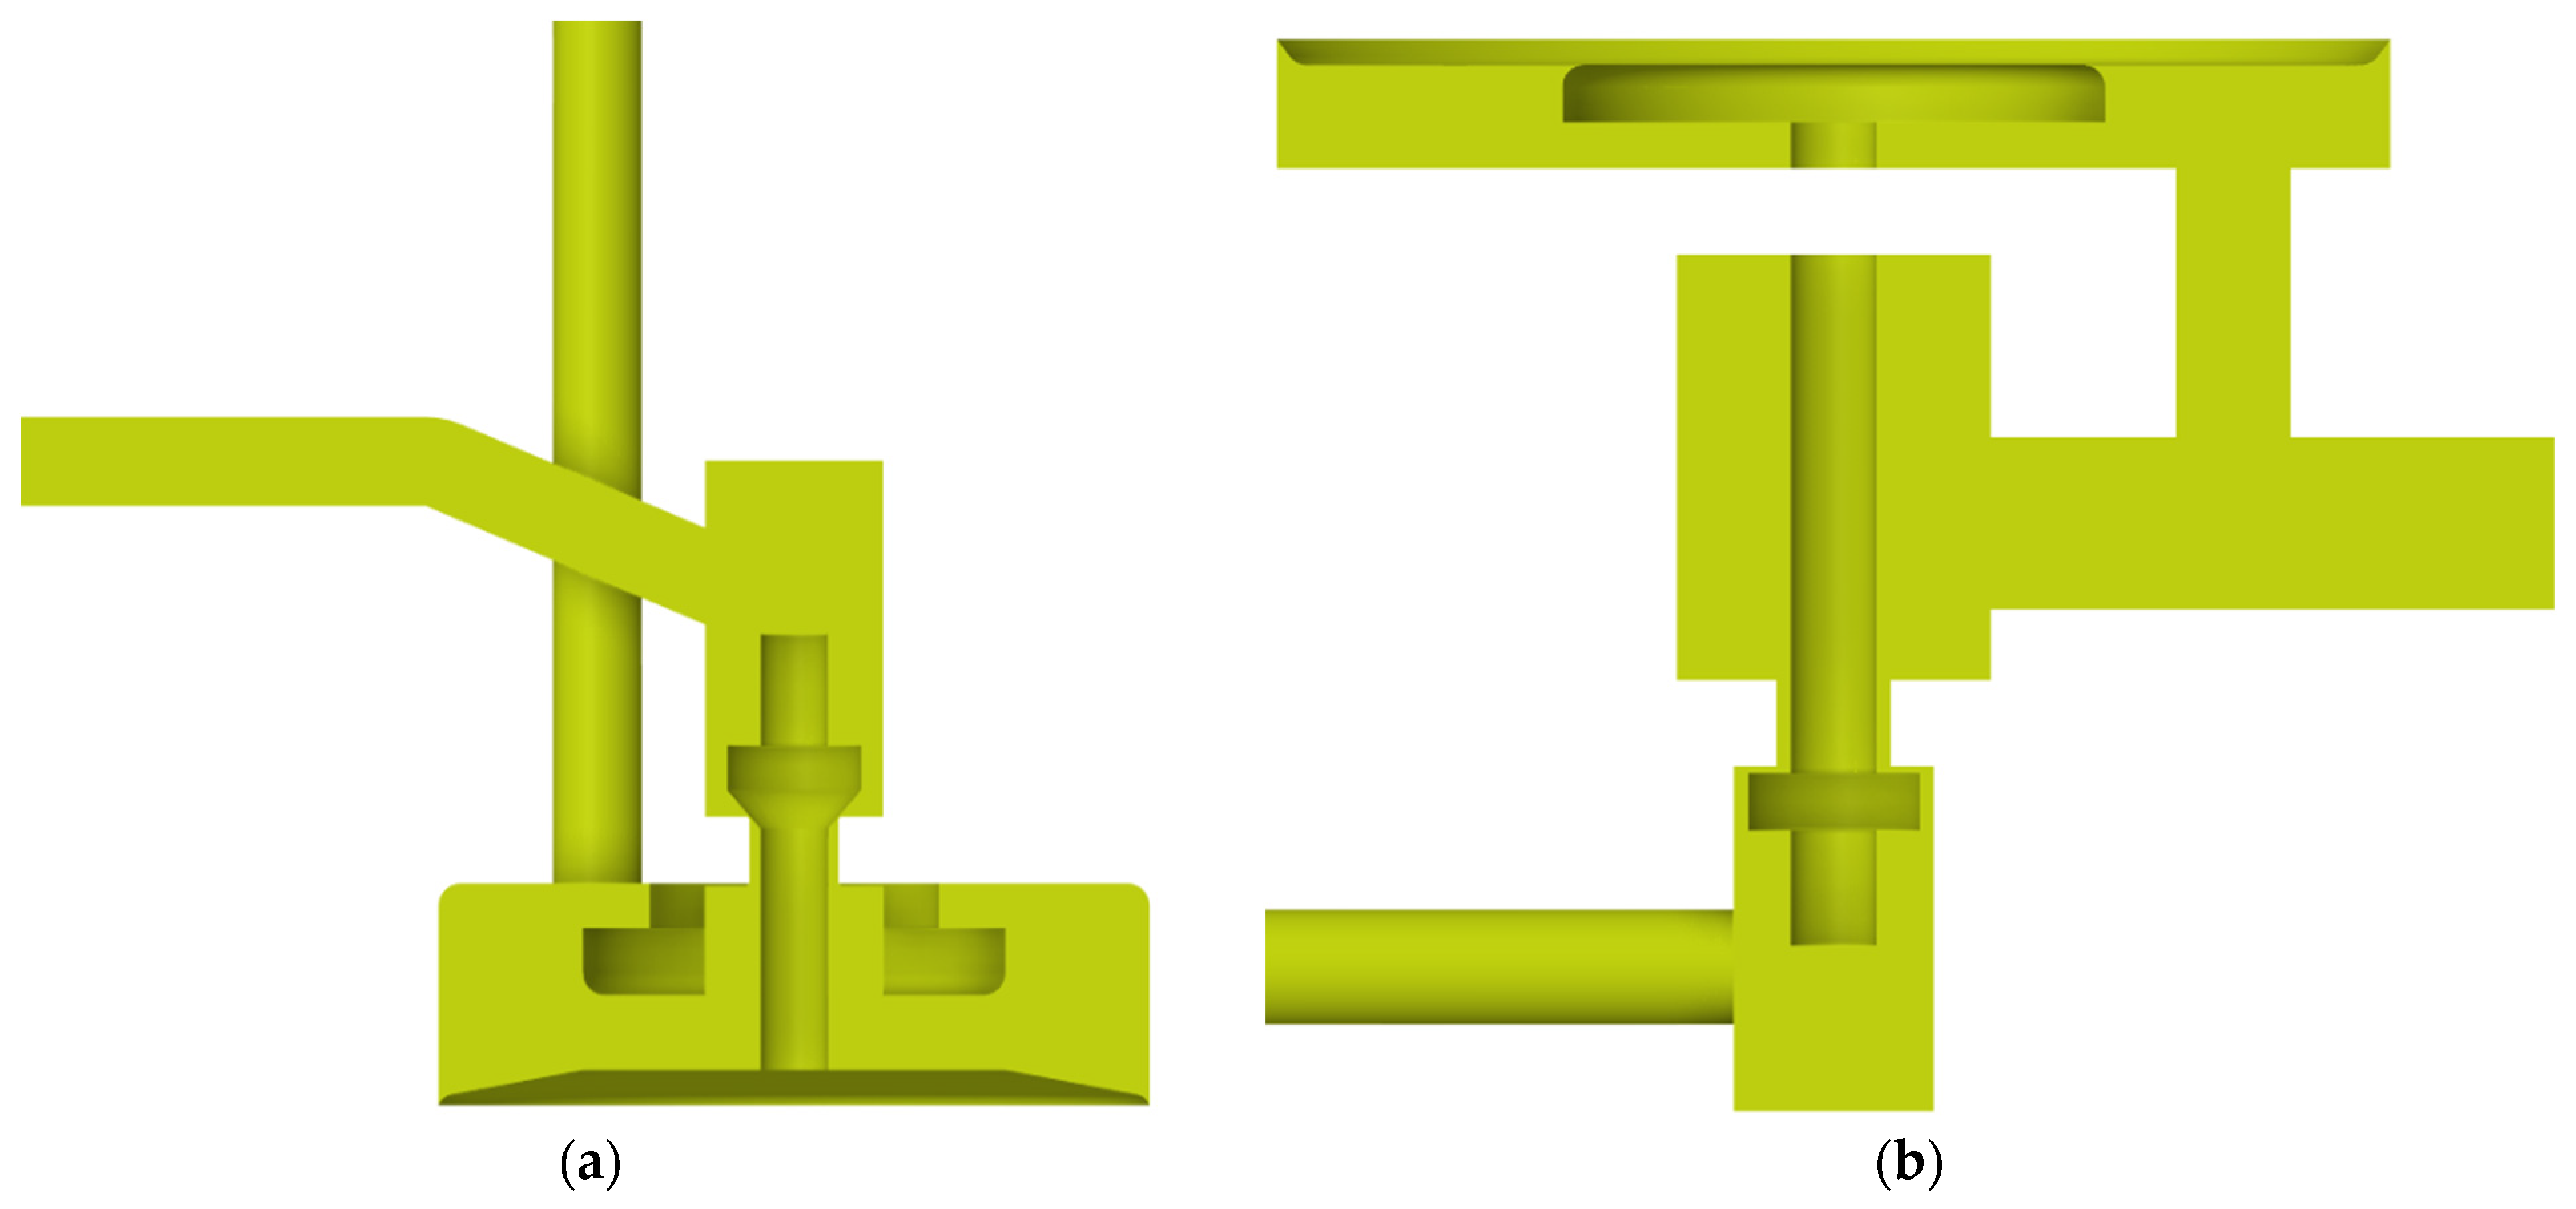
Based on the structural characteristics and working principles of the first-stage and second-stage pressure-reducing valves (PRVs), a three-dimensional model was constructed using the CAD software SolidWorks (2020). To reduce simulation time, ensure calculation convergence, and lower computational complexity while maintaining acceptable accuracy, certain simplifications were applied to the model. These simplifications included omitting small geometric features such as fillets, chamfers, and gradual cross-sectional changes, as well as geometrically complex internal features that have a negligible impact on the flow analysis. The flow channel model was then generated via reverse modeling from the simplified 3D geometry, as shown in Figure 2.

2.2.2. Flow Channel Meshing and Grid Independence Verification

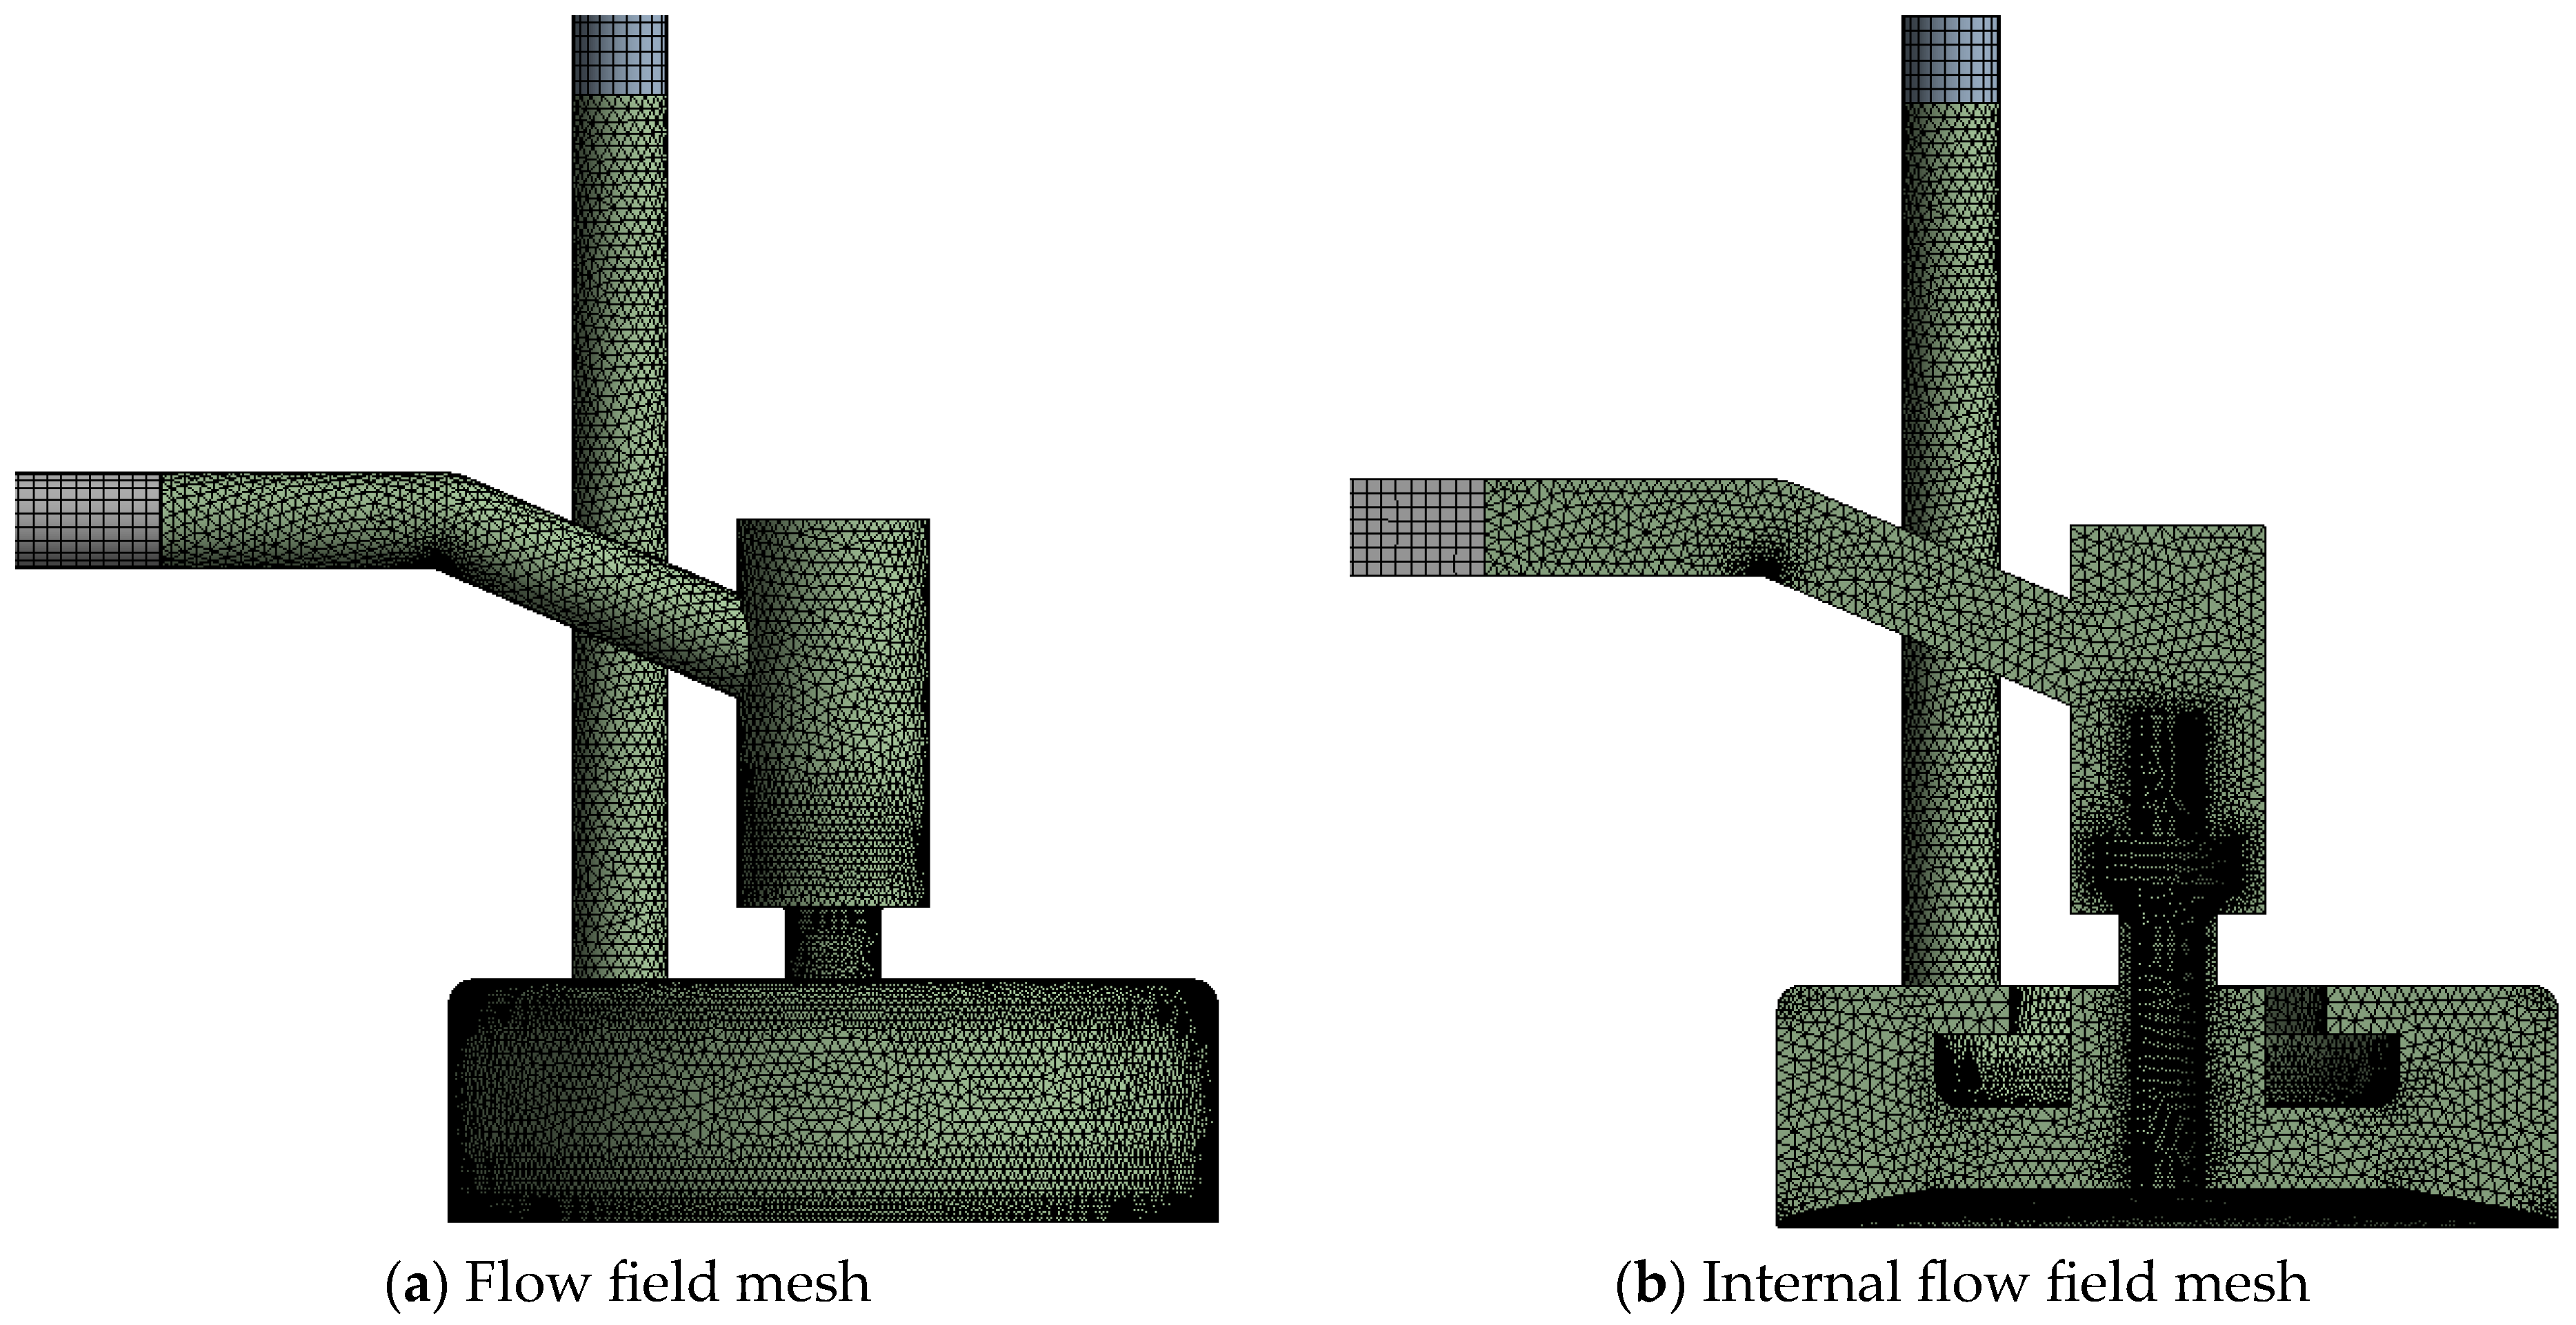
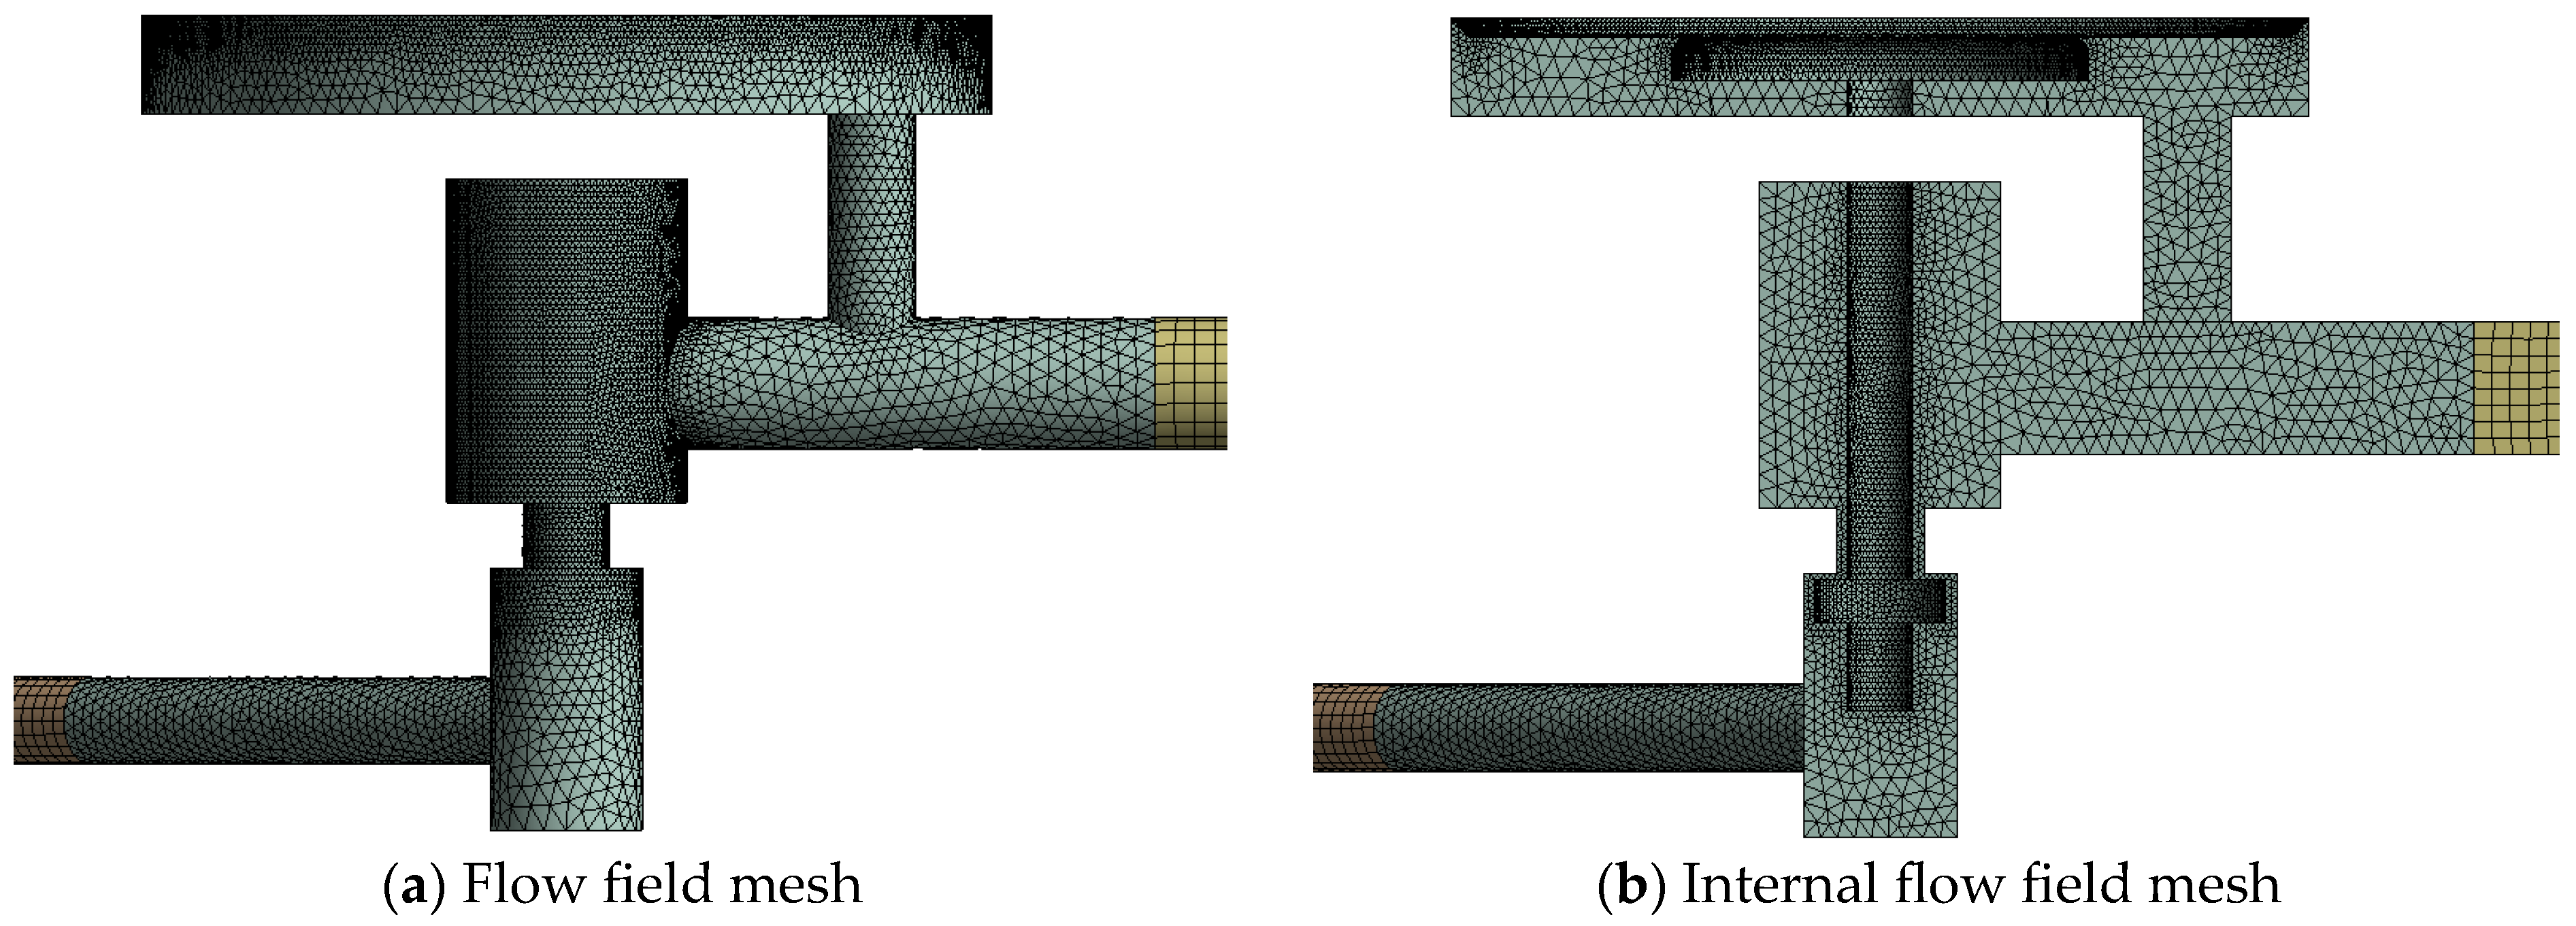
CFD software employs the finite volume method to simulate fluid flow, within which mesh generation is a crucial step for setting boundary conditions and obtaining solutions. For complex flow problems, tetrahedral meshes offer better adaptability and flexibility, demonstrating distinct advantages over hexahedral meshes. Conversely, for simple geometric pressure-reducing valvemodels, hexahedral meshes are more computationally efficient as they allow for larger aspect ratios, enabling mesh density adjustments in different regions according to specific needs. Based on the respective characteristics of tetrahedral and hexahedral meshes, a hybrid tetrahedral/hexahedral meshing scheme was adopted for the flow channel model of the two-stage hydrogen PRV. Hexahedral elements were used in the inlet and outlet piping sections of the valve, while the more complex internal valve flow passages were meshed with tetrahedral elements. Local refinement was applied in regions where the valve core interacts directly with the fluid to enhance calculation accuracy. The mesh for the entire flow field of the first-stage and second-stage PRVs is shown in Figure 3 and Figure 4, respectively.
During the simulation and analysis of the internal flow field in the two-stage hydrogen pressure-reducing valve (PRV), a highly nonlinear relationship exists between the mesh size and the accuracy of the numerical simulation results. Excessively small mesh sizes can lead to a significant increase in simulation computation time. Therefore, to reduce the simulation time while ensuring accuracy, a grid independence verification was conducted. The fluid domain model with an inlet pressure of 70 MPa for the two-stage hydrogen PRV was selected, and the valve outlet flow rate was used as the metric for the grid independence verification.
As can be seen from Table 1, for the first-stage pressure-reducing valve, the flow rate increases from 4.936 (Mesh 1) to 4.948 (Mesh 2), representing an increase of 0.243%. From Mesh 2 to Mesh 3, the flow rate increases from 4.948 to 4.954, an increase of 0.121%. Both changes in flow rate are very small. Considering the need for simulation results to be as accurate as possible while minimizing time cost and computational load, it can be concluded that Mesh 2 already satisfies the requirement for grid independence. Therefore, the mesh configuration with 343,381 nodes and 1,659,474 elements was selected for conducting the numerical simulation of the internal flow field in the first-stage pressure-reducing valve.
As shown in Table 2, for the second-stage pressure-reducing valve, the flow rate increases from 5.247 (Mesh 1) to 5.261 (Mesh 2), representing an increase of 0.267%. From Mesh 2 to Mesh 3, the flow rate increases from 5.261 to 5.268, an increase of 0.133%. Both variations in flow rate are minimal. Considering the comprehensive requirements for simulation accuracy, time cost, and computational effort, it can be concluded that Mesh 2 meets the criteria for grid independence. Therefore, the mesh configuration with 345,352 nodes and 1,752,721 elements was selected for conducting the numerical simulation of the internal flow field in the second-stage pressure-reducing valve.

2.2.3. Solution Model and Boundary Condition Setup

The hydrogen inside the two-stage pressure-reducing valve (PRV) was treated as an isentropic, compressible fluid. It was modeled as an ideal gas, and a pressure-based solver was selected for steady-state simulation. Given the high flow velocity and complex flow state within the flow field, the standard k-ε turbulence model, known for its good adaptability, was employed to ensure the reliability and accuracy of the calculation results. Based on the actual operating conditions of the two-stage gas PRV, the boundary conditions for the numerical simulation were set as follows: a pressure inlet and a pressure outlet. The inlet pressure was set to 70 MPa, the outlet pressure to 0.3 MPa, and the operating pressure to 0 MPa. Symmetry boundaries were applied to the symmetry planes, while all other walls were set as no-slip boundaries.

2.2.4. Analysis of Numerical Simulation Results for the Two-Stage Hydrogen PRV

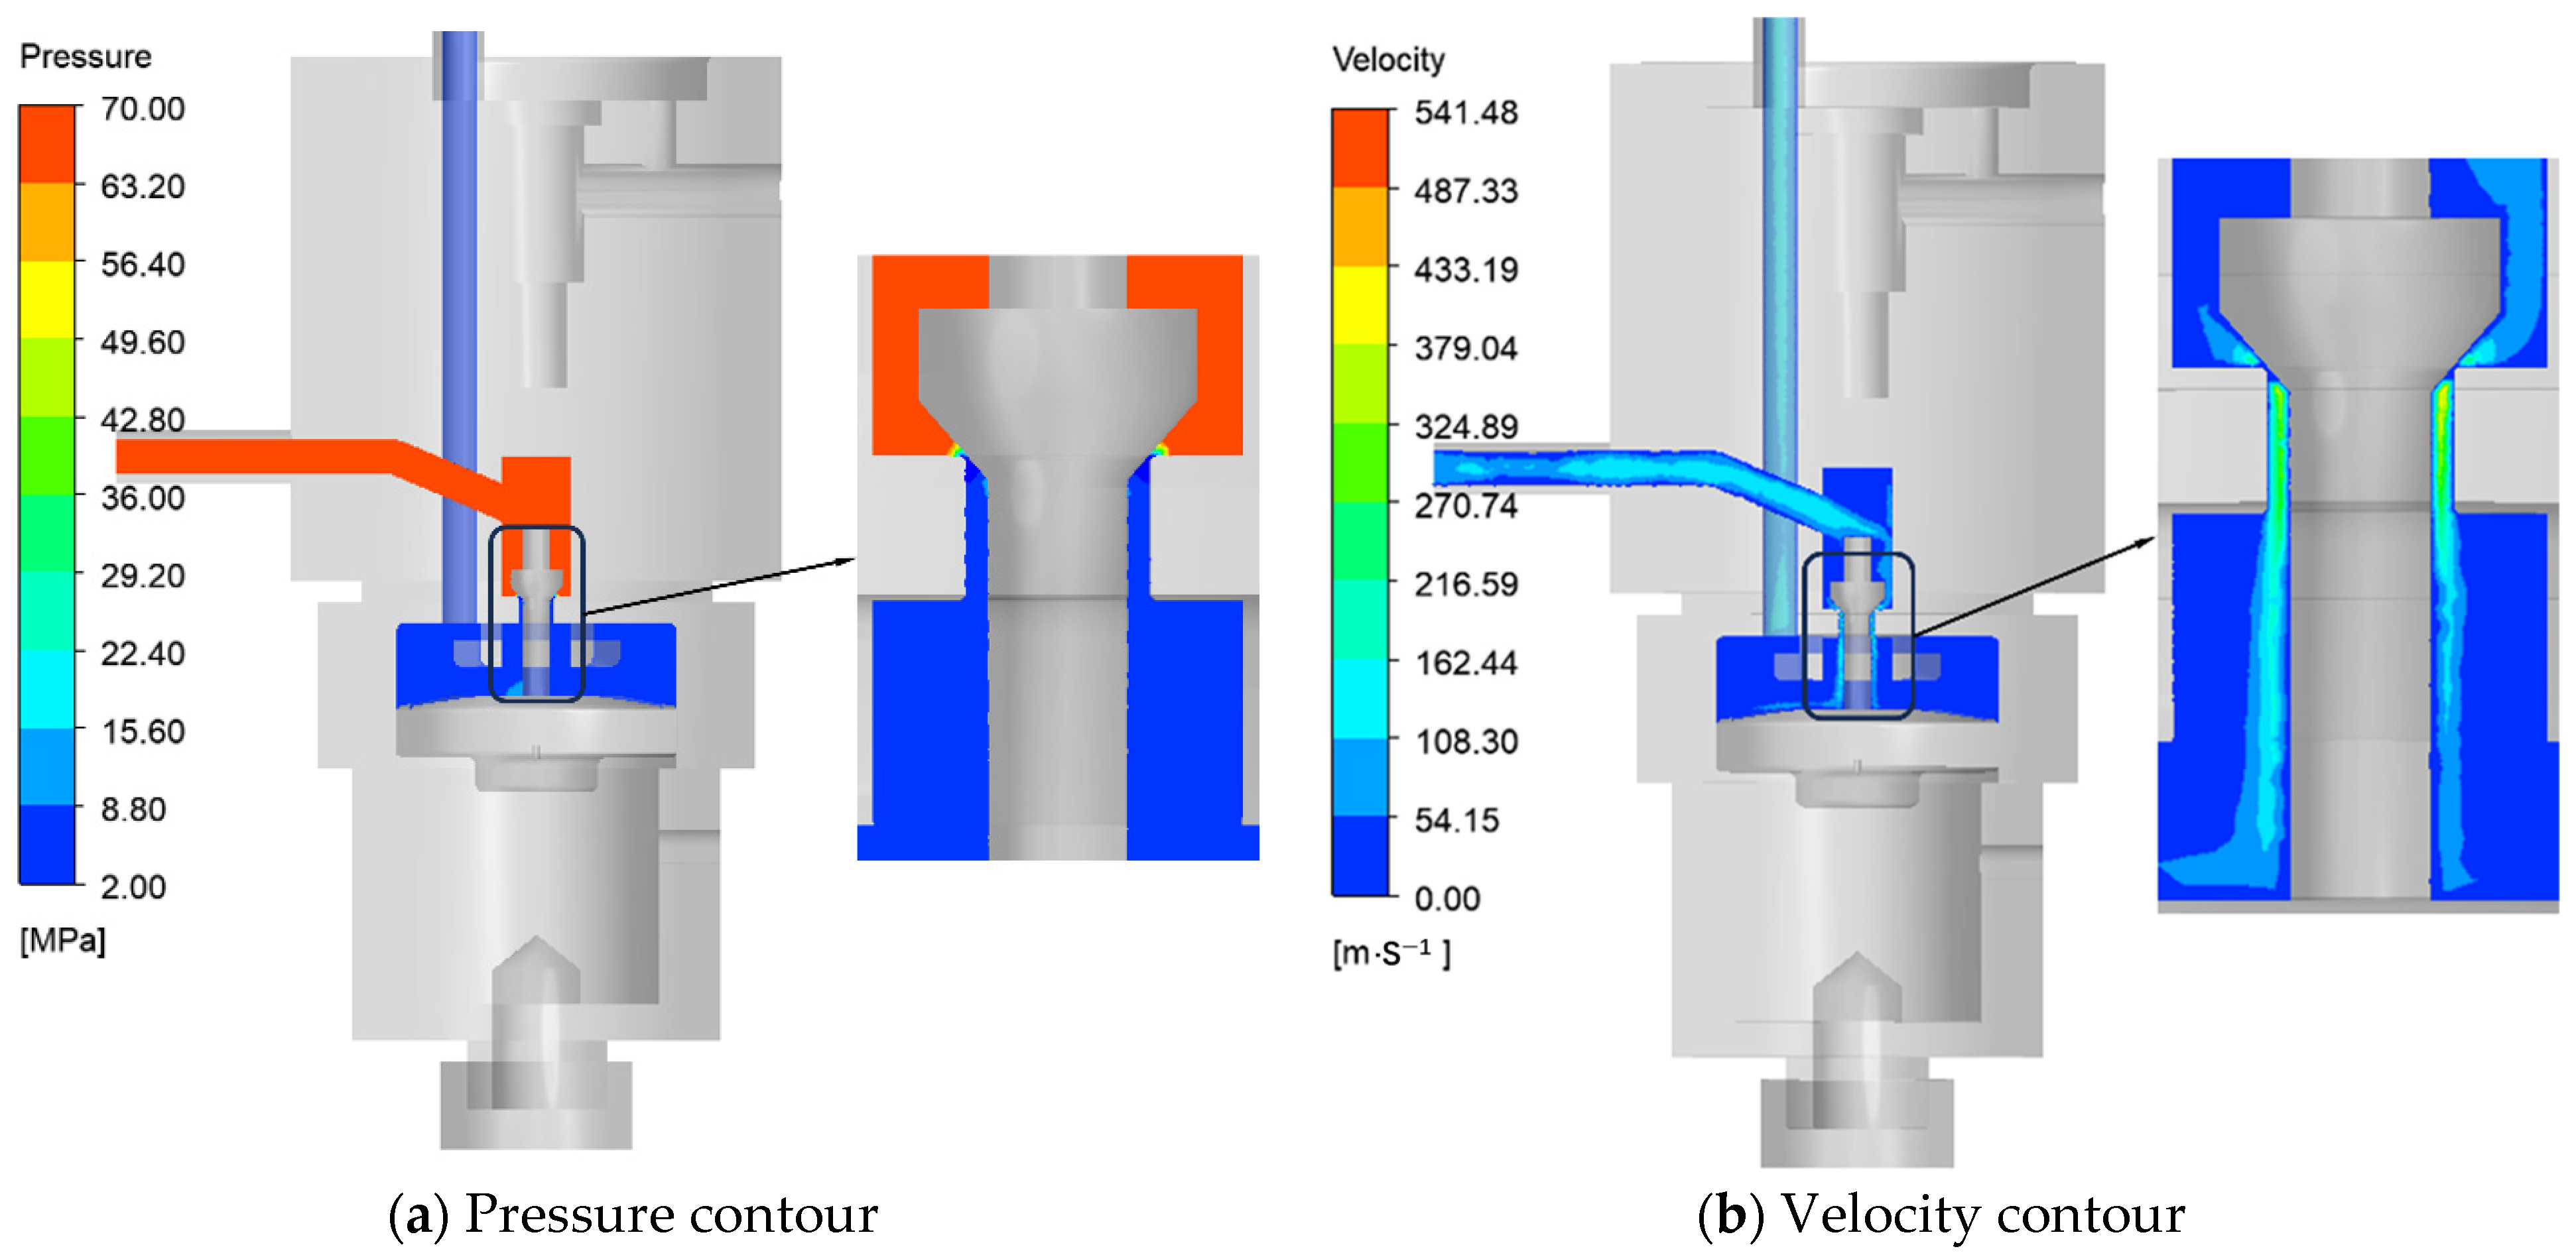
Figure 5 shows the pressure contour and velocity contour of the first-stage pressure-reducing valve when the system inlet pressure is 70 MPa. As shown in Figure 5a, during the operation of the pressure-reducing valve, the pressure loss is primarily concentrated in the valve orifice region. After the fluid passes through the throttling section, the outlet pressure stabilizes at approximately 7 MPa. From Figure 5b, it can be observed that as the fluid flows through the throttling section, the effective flow area decreases. The fluid undergoes an adiabatic compression process, resulting in a pressure drop. The pressure energy is converted into kinetic energy, leading to an increase in flow velocity. At the outlet of the throttling section, the flow passage expands, forming a high-speed jet. The dissipation of kinetic energy increases, causing the flow velocity to subsequently decrease. The fluid velocity at the inlet is 94.5 m/s, reaching a maximum of 483.6 m/s at the throttling valve orifice.
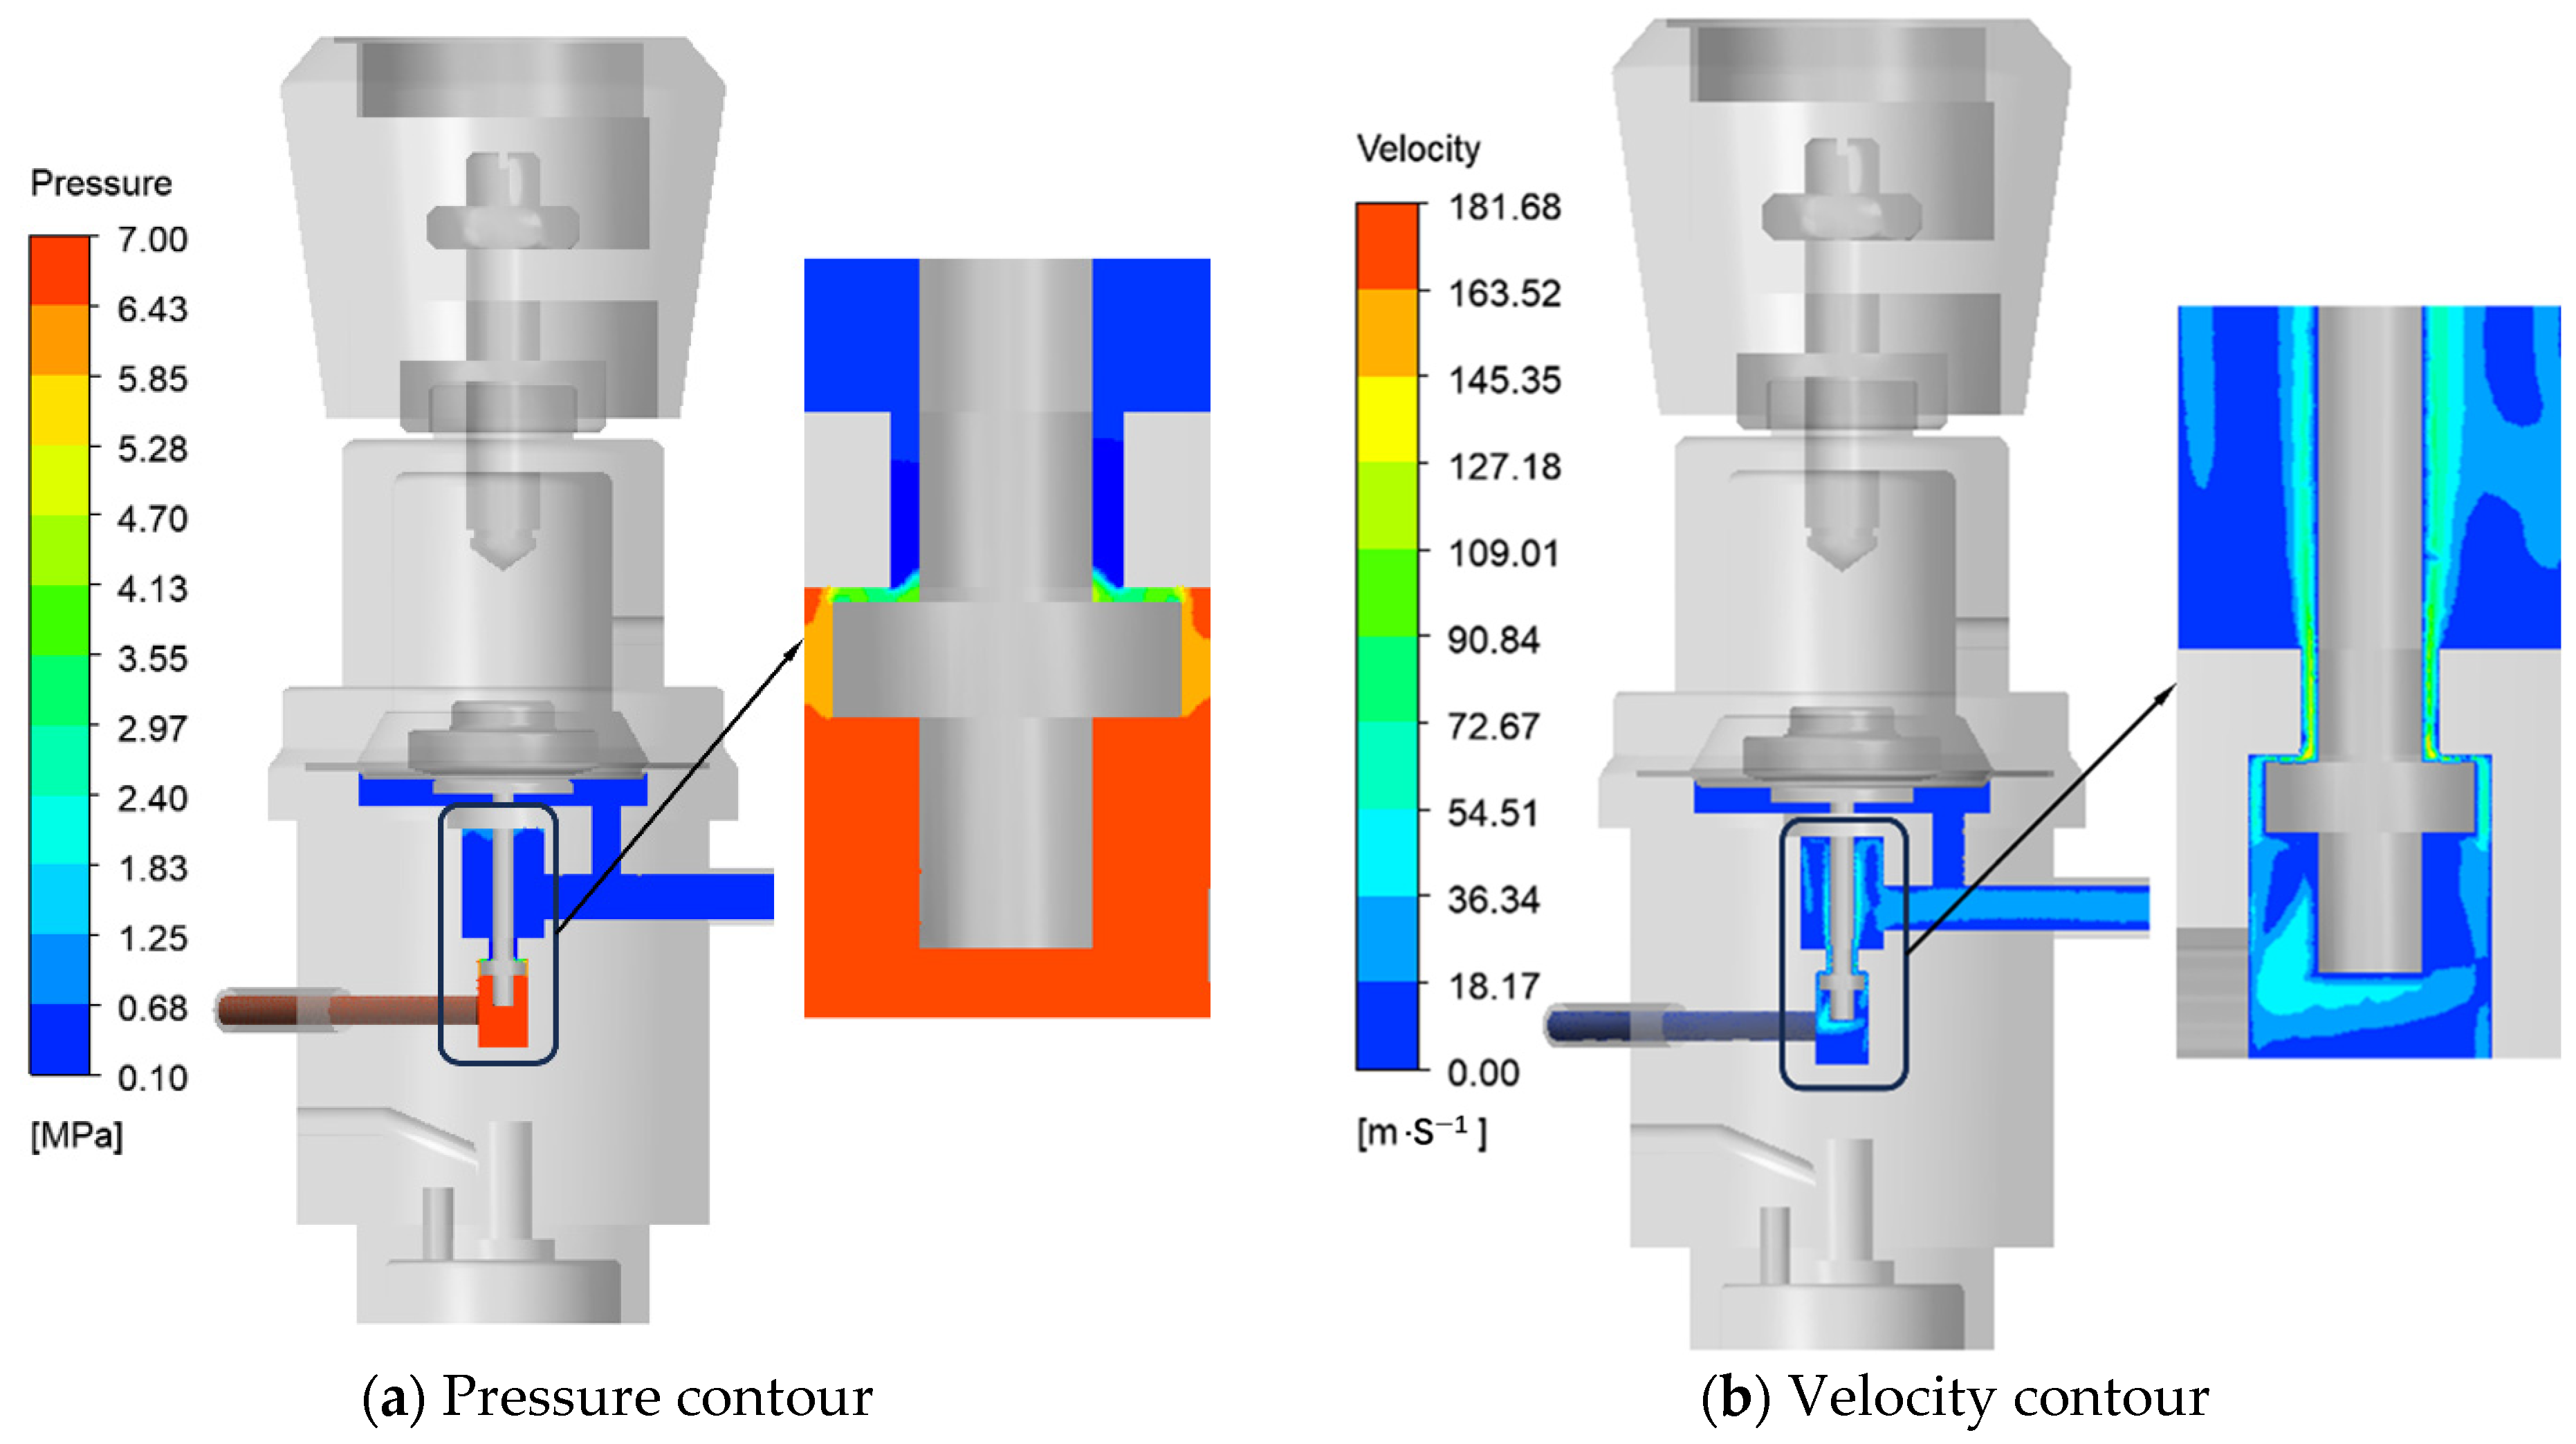
Figure 6 presents the pressure and velocity contours of the second-stage pressure-reducing valve under a system inlet pressure of 70 MPa. As illustrated in Figure 6a, the pressure loss during the valve’s operation is predominantly concentrated at the valve orifice. After the throttling process, the fluid pressure at the outlet stabilizes at approximately 0.3 MPa. Figure 6b reveals that as the fluid passes through the throttling section, the reduction in effective flow area leads to an adiabatic compression process. This results in a pressure drop, during which pressure energy is converted into kinetic energy, causing an increase in flow velocity. At the outlet of the throttling section, the expansion of the flow passage forms a high-speed jet. The increased dissipation of kinetic energy subsequently reduces the flow velocity. The fluid velocity at the inlet is 28.4 m/s, reaching a maximum value of 157.9 m/s at the throttling valve orifice.

2.2.5. Numerical Simulation of the Orifice Flow Coefficient for the Two-Stage Hydrogen PRV

Using CFD simulation software, numerical simulations of the flow field were conducted for the following operating conditions: the first-stage PRV with an inlet pressure of 70 MPa and an outlet pressure of 7 MPa, and the second-stage PRV with an inlet pressure of 7 MPa and an outlet pressure of 0.3 MPa. The corresponding outlet flow rates were calculated. Considering the compressibility of hydrogen, vortices and energy changes occur as the fluid medium flows through the various chambers of the two-stage hydrogen PRV. Therefore, the flow between chambers is equivalently modeled as flow through a throttling orifice, and calculations are performed using the equivalent model of a converging nozzle or throttling orifice [23].
The flow equation for the throttling orifice is
Q = C d A P i R T 2 k k 1 P j P i 2 k P j P i k + 1 k P j P i > 2 k + 1 k k 1 C d A P i R T k 2 k + 1 k + 1 k 1 P j P i 2 k + 1 k k 1
where C d is the effective discharge coefficient of the orifice; P i is the absolute pressure at the orifice inlet (Pa); P j is the absolute pressure at the orifice outlet (Pa); A is the effective flow area of the valve orifice (m2); Q is the mass flow rate (kg/s); T is the gas temperature at the orifice inlet (K). The definitions of symbols used in the mathematical model are summarized in Appendix A (Table A1).
The effective discharge coefficients for the orifices of the first-stage and second-stage pressure-reducing valves were calculated by substituting the outlet flow values obtained from the simulation into the throttling orifice flow equation, as presented in Table 3.
Although only steady-state CFD simulations were performed to determine the effective discharge coefficients, a qualitative sensitivity assessment indicates that the relative trends of the flow coefficients with respect to orifice geometry and operating conditions are reliable. Therefore, the established coefficients can be used to analyze the dynamic performance of the two-stage hydrogen PRV under varying structural parameters.

2.3. Establishment of the System Dynamic Model for the Two-Stage Hydrogen Pressure-Reducing Valve

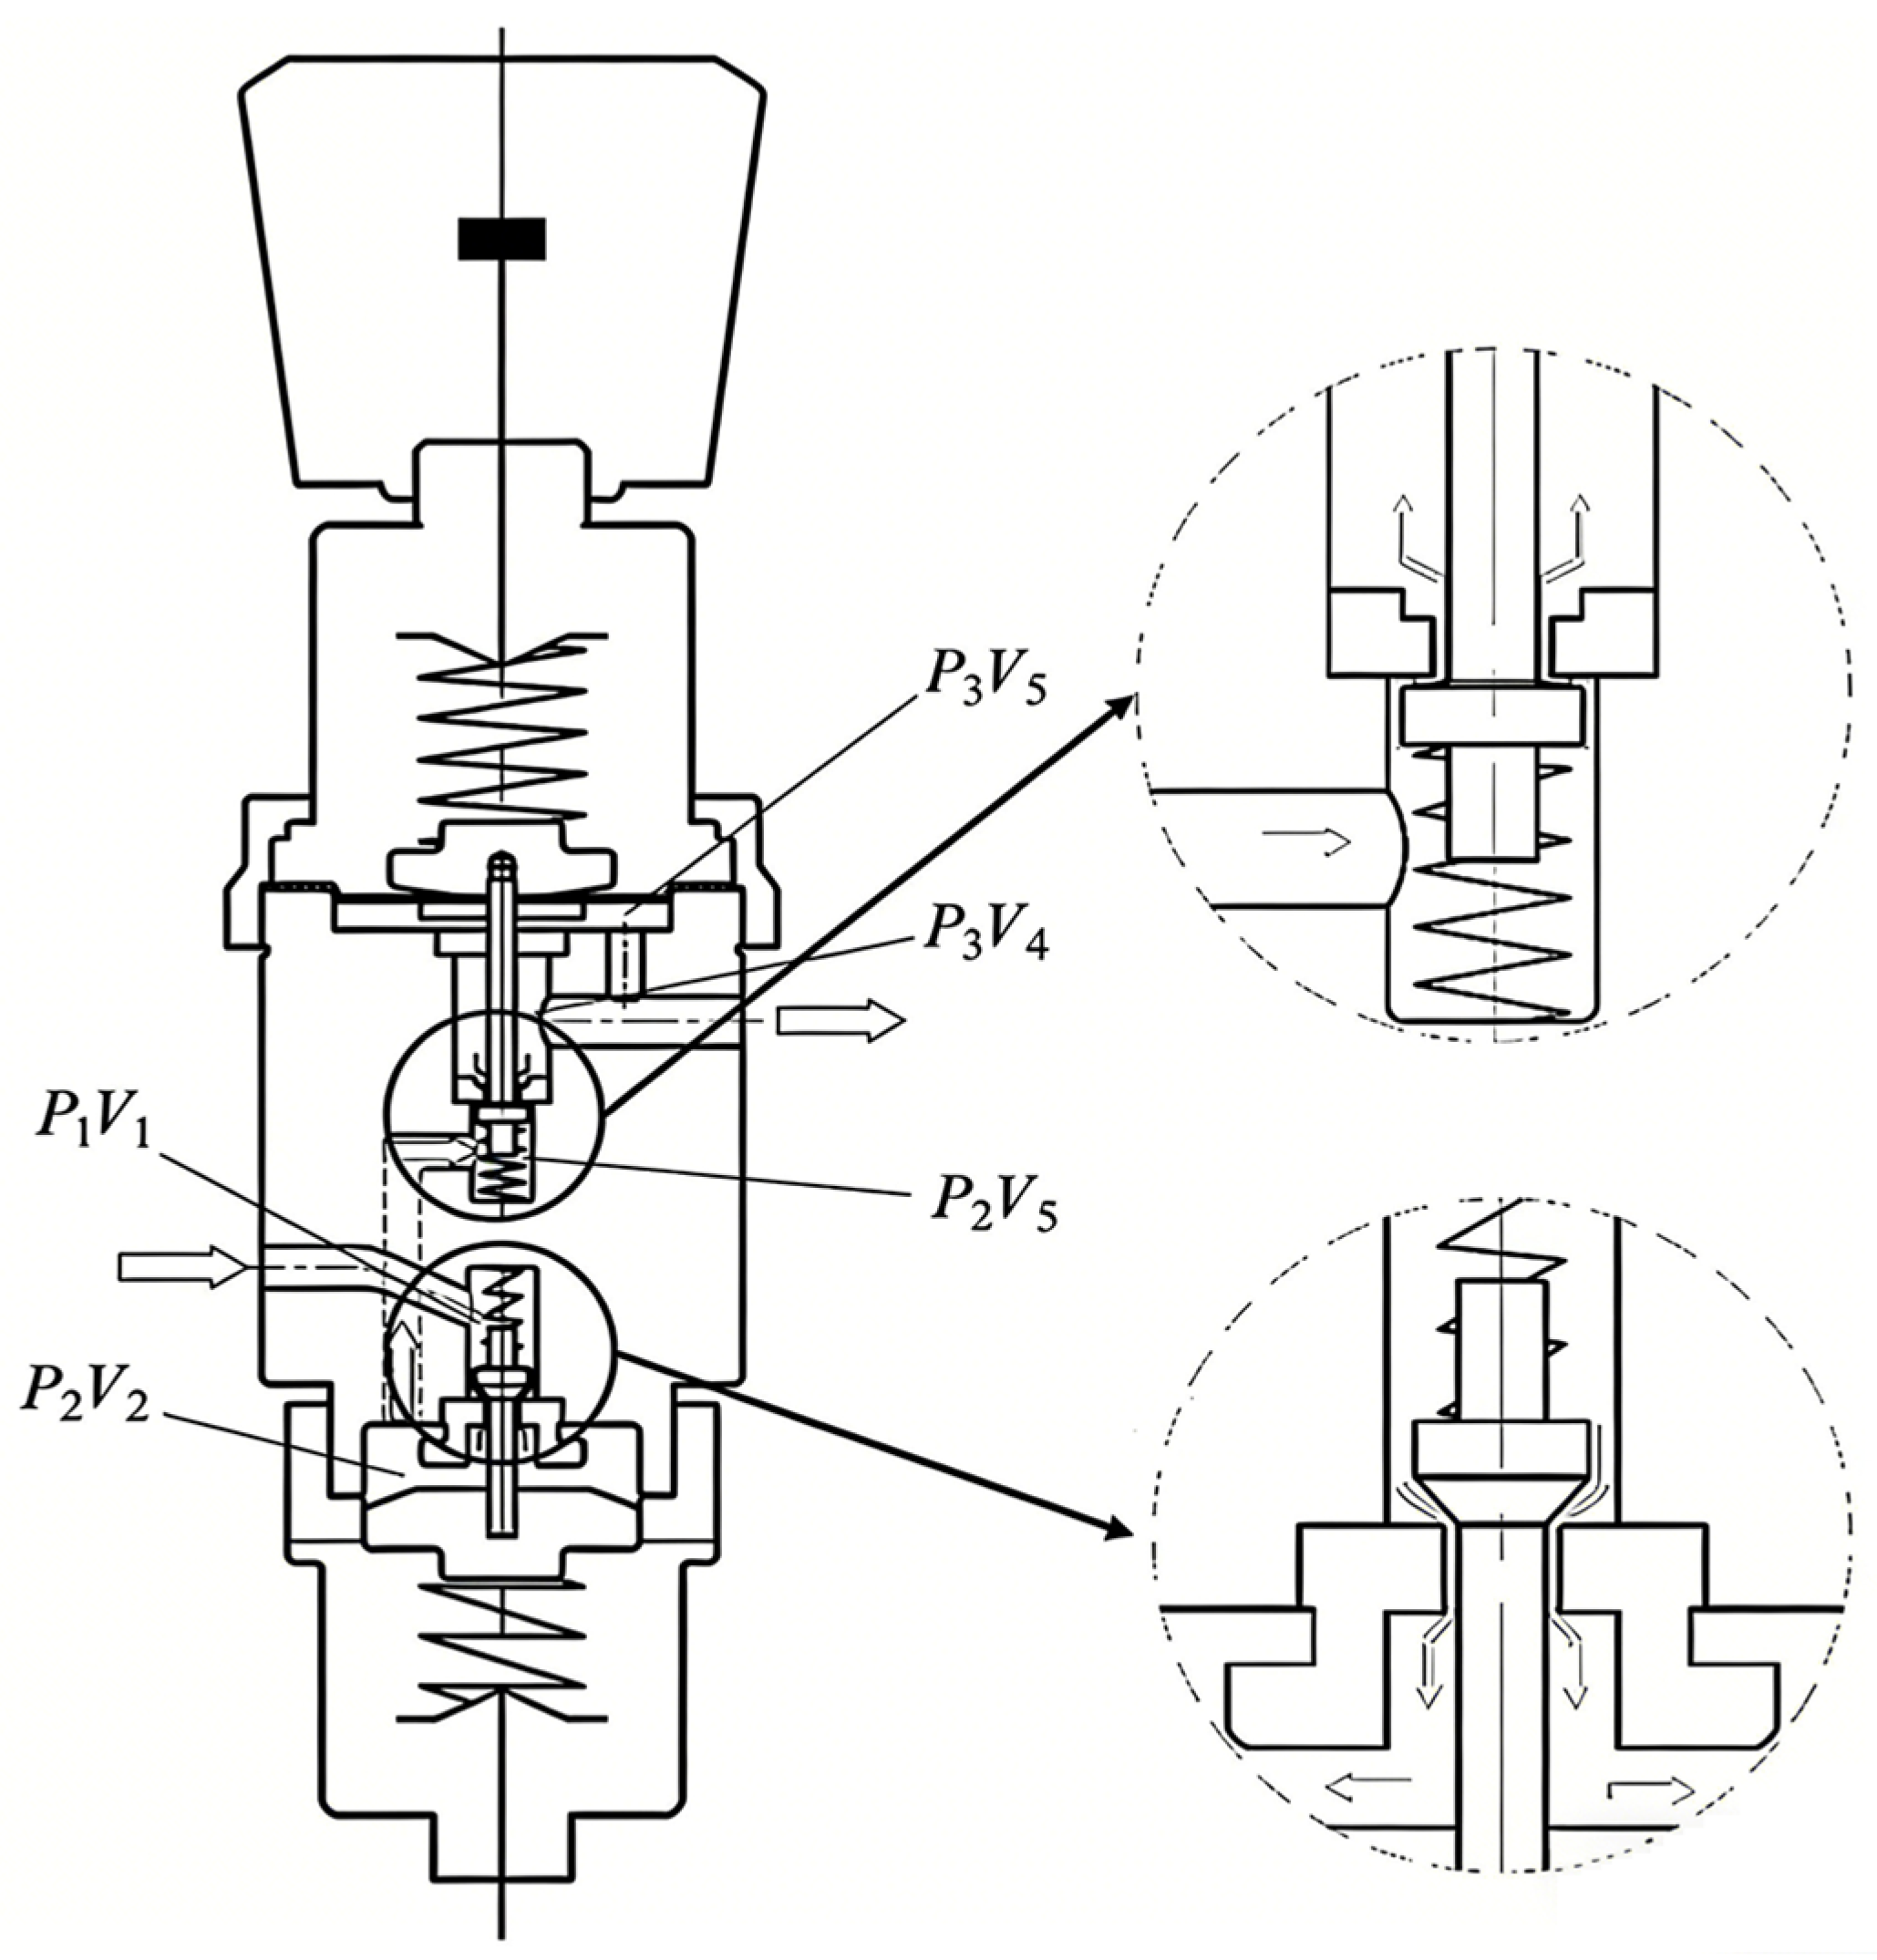
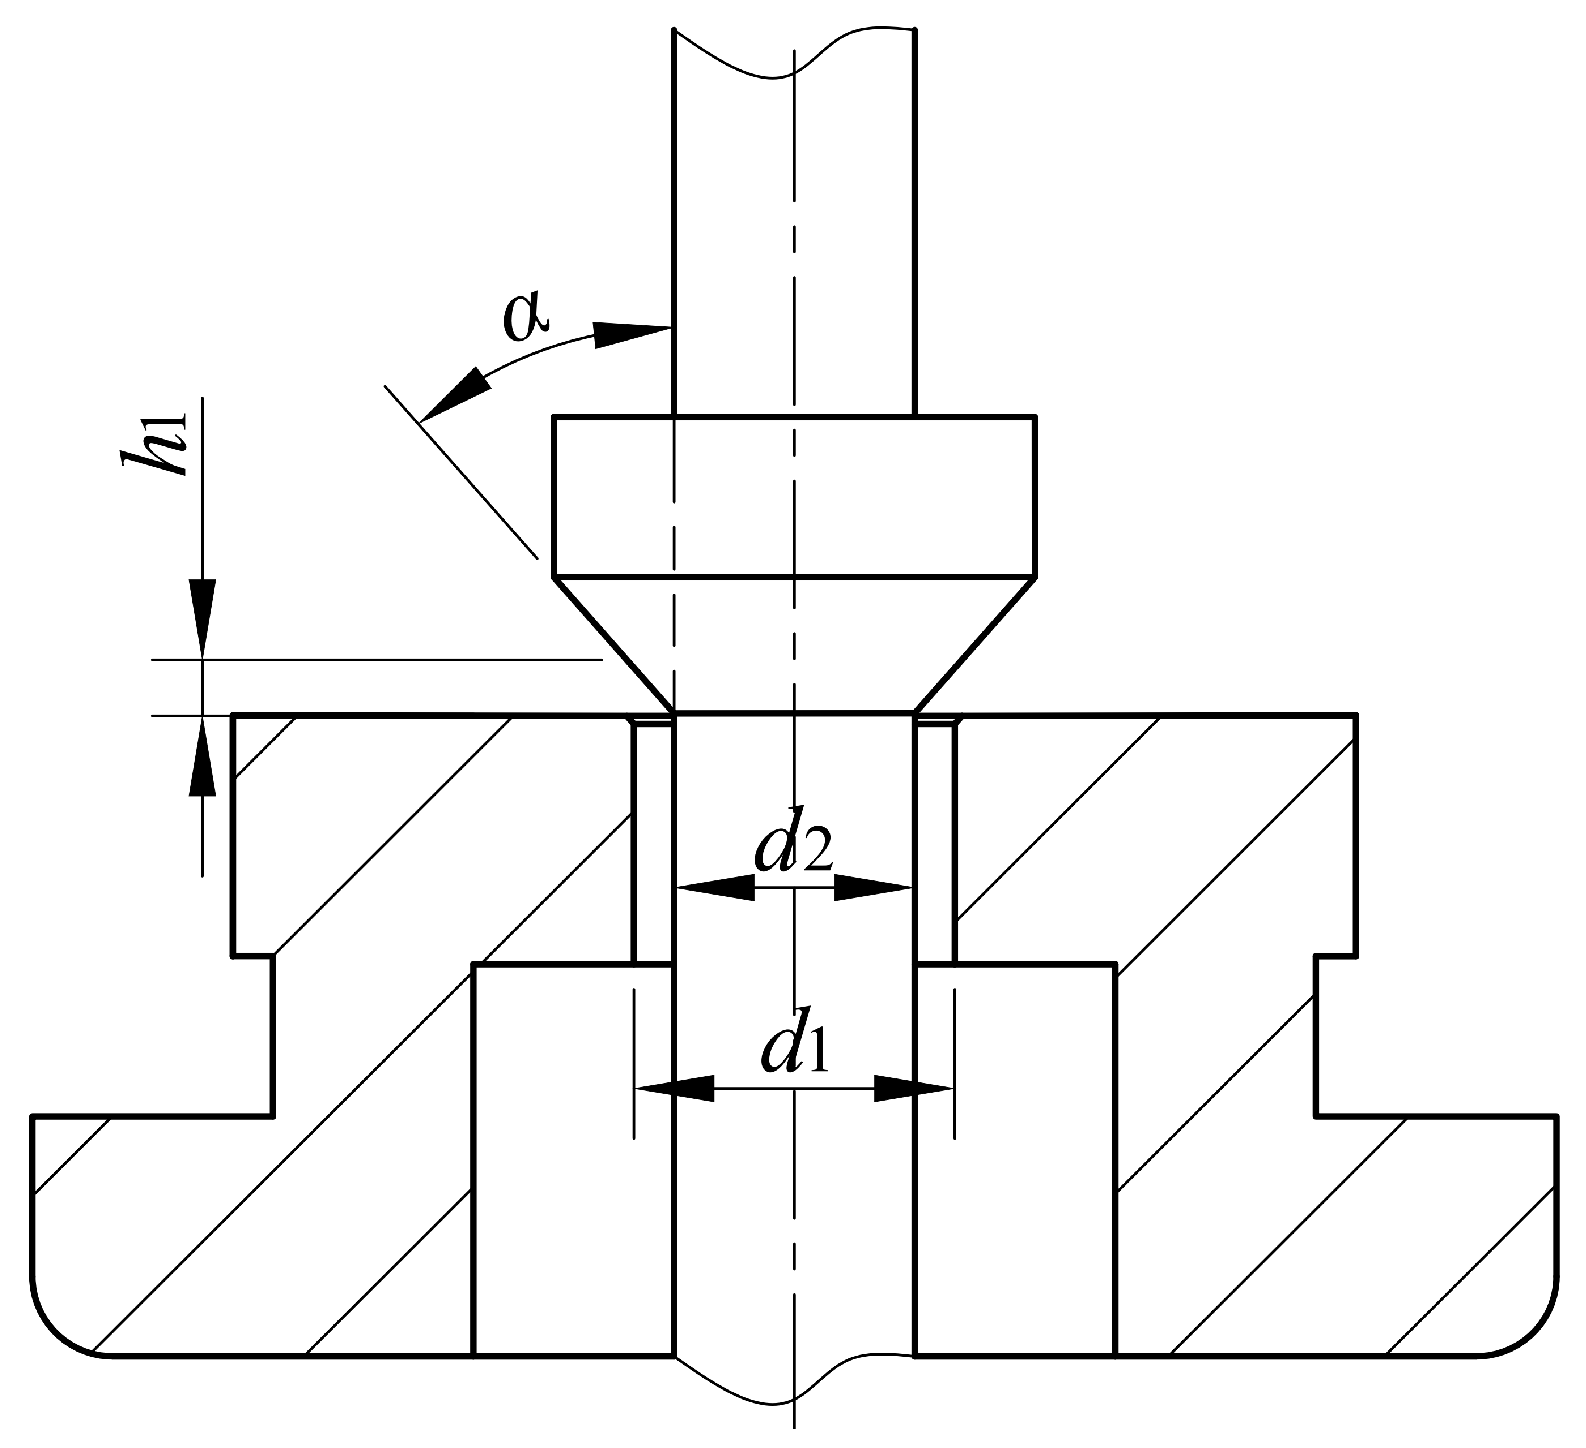
The structural parameters of the two-stage hydrogen pressure-reducing valve are shown in Figure 7. To develop a dynamic mathematical model that accurately describes the process while remaining solvable, it is necessary to formulate reasonable assumptions for the two-stage hydrogen pressure-reducing valve system prior to modeling [23,24]. Based on the valve’s structure and working principle, the following assumptions are made to simplify the analysis:
(1)
The fluid medium is an ideal gas and obeys the ideal gas law.
(2)
The gas flow through the valve orifices is adiabatic, and the gas undergoes an isentropic process within each chamber.
(3)
The gas flow through the orifices of the two-stage hydrogen pressure-reducing valve can be treated as flow through a throttling orifice.
(4)
The gas temperature, pressure, and density are uniformly distributed within each chamber.
(5)
The friction caused by high-order velocity terms is neglected, considering only the viscous damping effect proportional to velocity.
(6)
The effects due to sealing imperfections are neglected.
It should be noted that under high-pressure conditions such as 70 MPa, hydrogen may deviate from ideal gas behavior due to real-gas effects. In the present study, the ideal gas assumption is adopted to maintain model simplicity and computational efficiency, with an emphasis on dynamic trend prediction rather than absolute thermodynamic accuracy. The potential deviations introduced by this assumption are acknowledged as a limitation of the current model, and the incorporation of real-gas properties or compressibility correction factors will be considered in future work.

2.3.1. Establishment of the Mathematical Model for the First-Stage Valve Core Moving Assembly

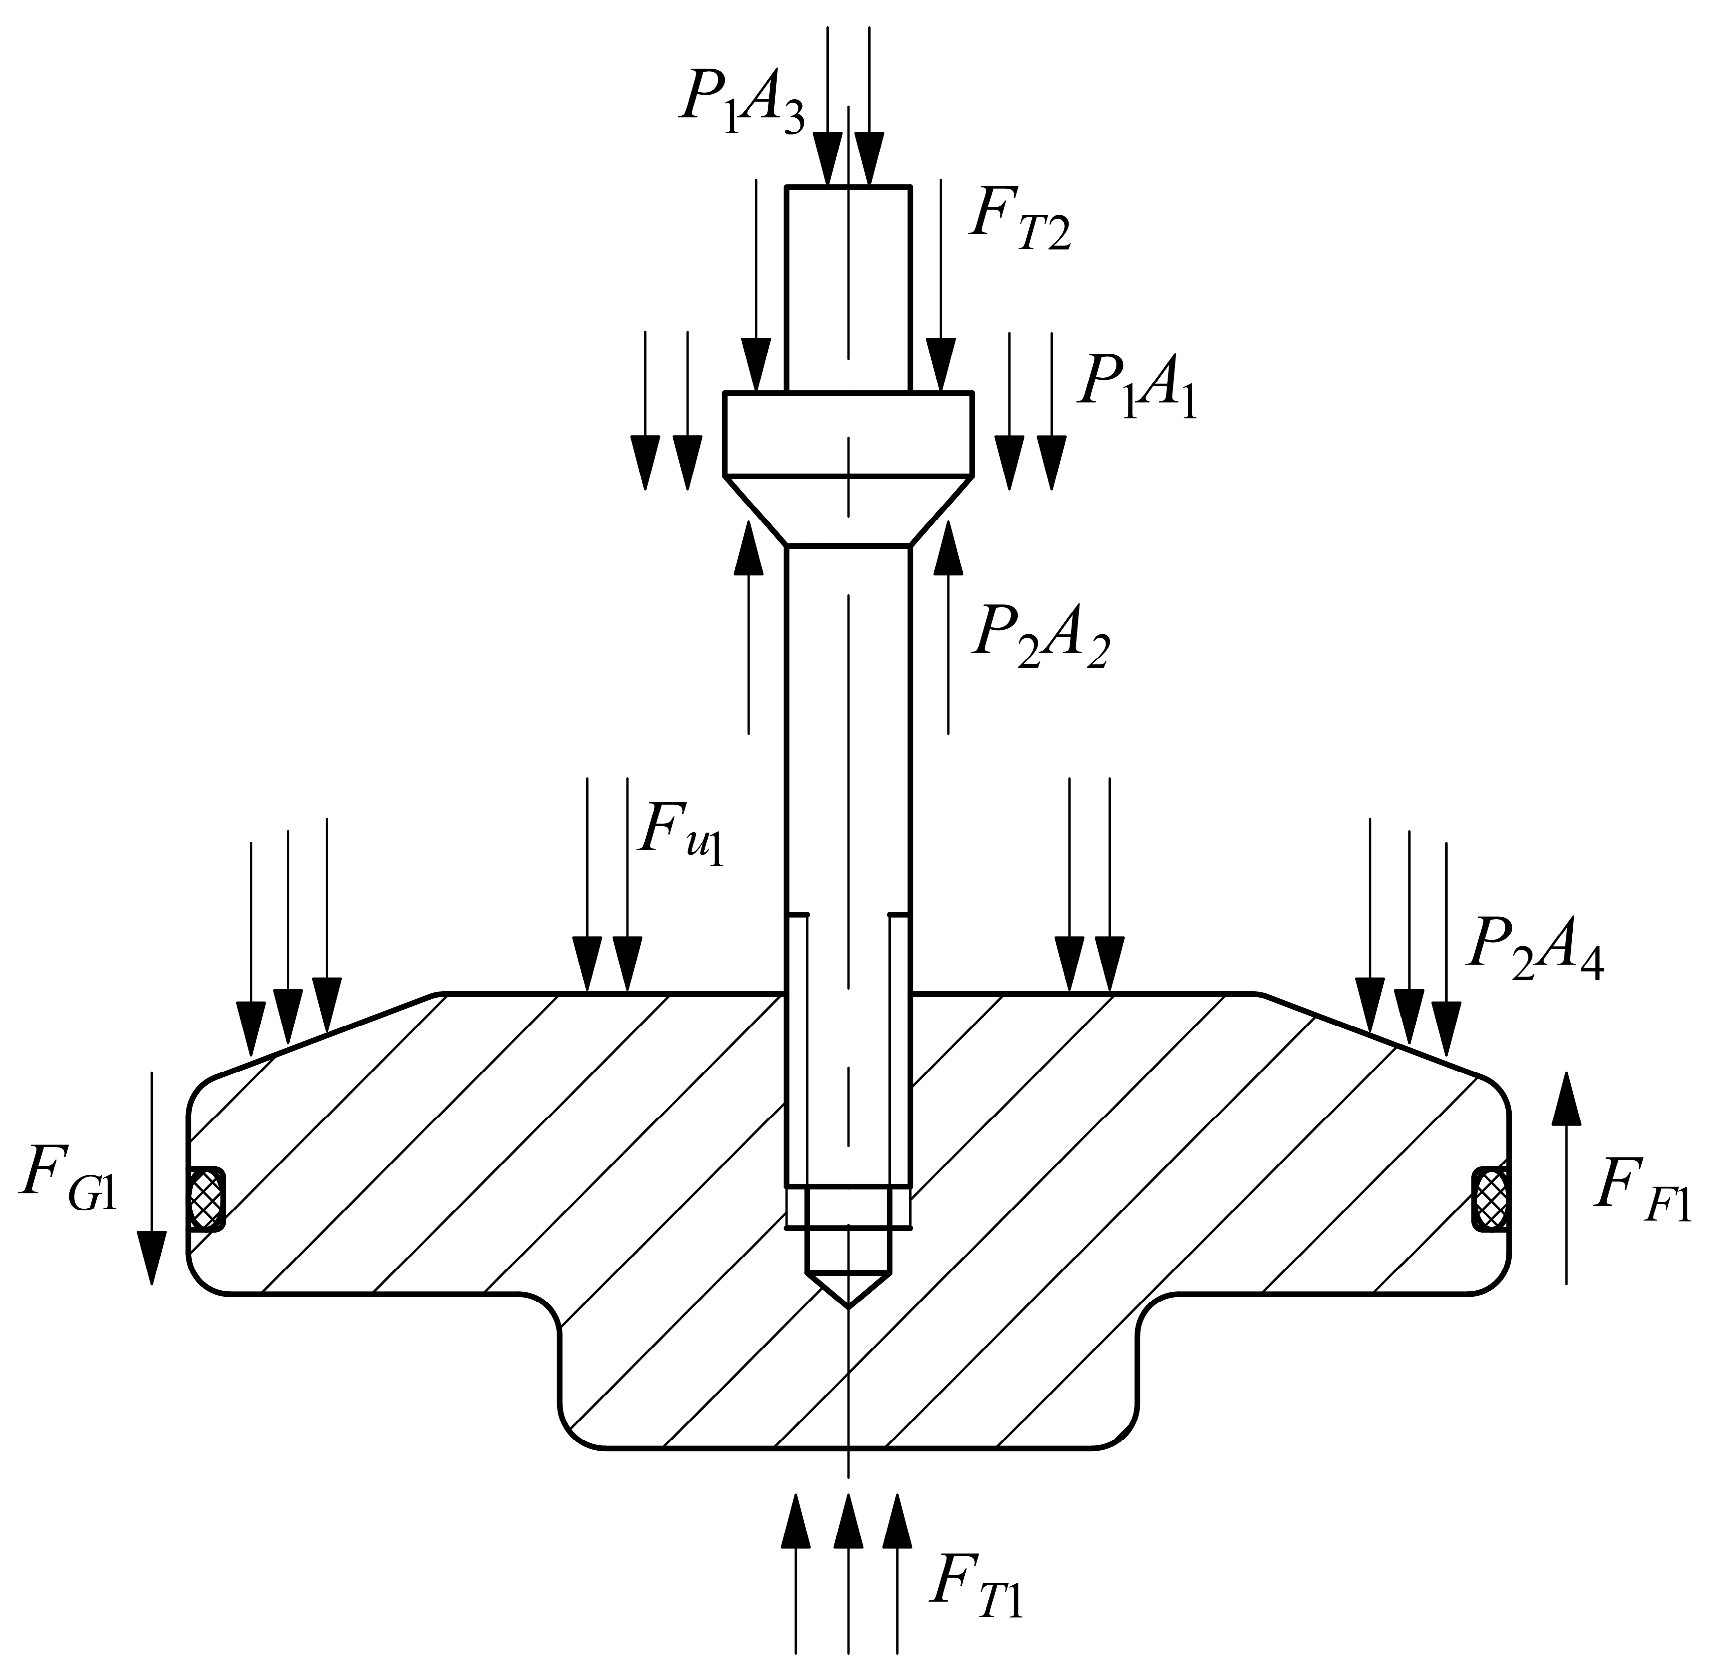
The first-stage pressure-reducing valve primarily consists of a main spring, an auxiliary spring, a valve core, and a piston, among other components. The force analysis of the valve core moving assembly is illustrated in Figure 8. It is subjected to various forces, including the gas pressure difference force across the piston, the unbalanced force on both ends of the valve core, friction force, gas steady-state flow force, and gas transient flow force. A schematic diagram of the first-stage orifice in the two-stage hydrogen pressure-reducing valve is shown in Figure 9.
Thus, the motion differential equation of the first-stage valve can be derived as follows:
m 1 x ¨ = P 1 A 1 + A 3 P 2 A 2 + F D 1 + F S 1 + F u 1 + F T 2 + F G 1 k 1 x 1 + h 1 x F F 1 L 1 x ˙
where P1 is the valve inlet pressure (Pa); P2 is the outlet pressure of the first-stage valve (Pa); A1 is the effective action area of the high-pressure chamber on the valve core in the first-stage valve (m2); A2 is the effective action area of the low-pressure chamber on the valve core in the first-stage valve (m2); A3 is the action area of the inlet pressure on the large end of the valve core in the first-stage valve (m2); FD1 is the fluid force on the piston in the direction of motion (N); FS1 is the gas steady-state flow force in the first-stage valve (N); Fu1 is the gas transient flow force in the first-stage valve (N); FT2 is the force exerted by the auxiliary spring of the first-stage valve (N); FG1 is the gravity of the moving components of the first-stage valve (N); FF1 is the friction force on the moving components of the first-stage valve (N); k1 is the stiffness coefficient of the main spring in the first-stage valve (N/m); x1 is the pre-compression of the main spring in the first-stage valve (m); h1 is the orifice opening of the first-stage valve core (m); m1 is the mass of the moving components of the first-stage valve core (kg); L1 is the damping coefficient of the first-stage valve motion; x is the displacement of the first-stage valve core (m).

2.3.2. Establishment of the Mathematical Model for the Second-Stage Valve Core Moving Assembly

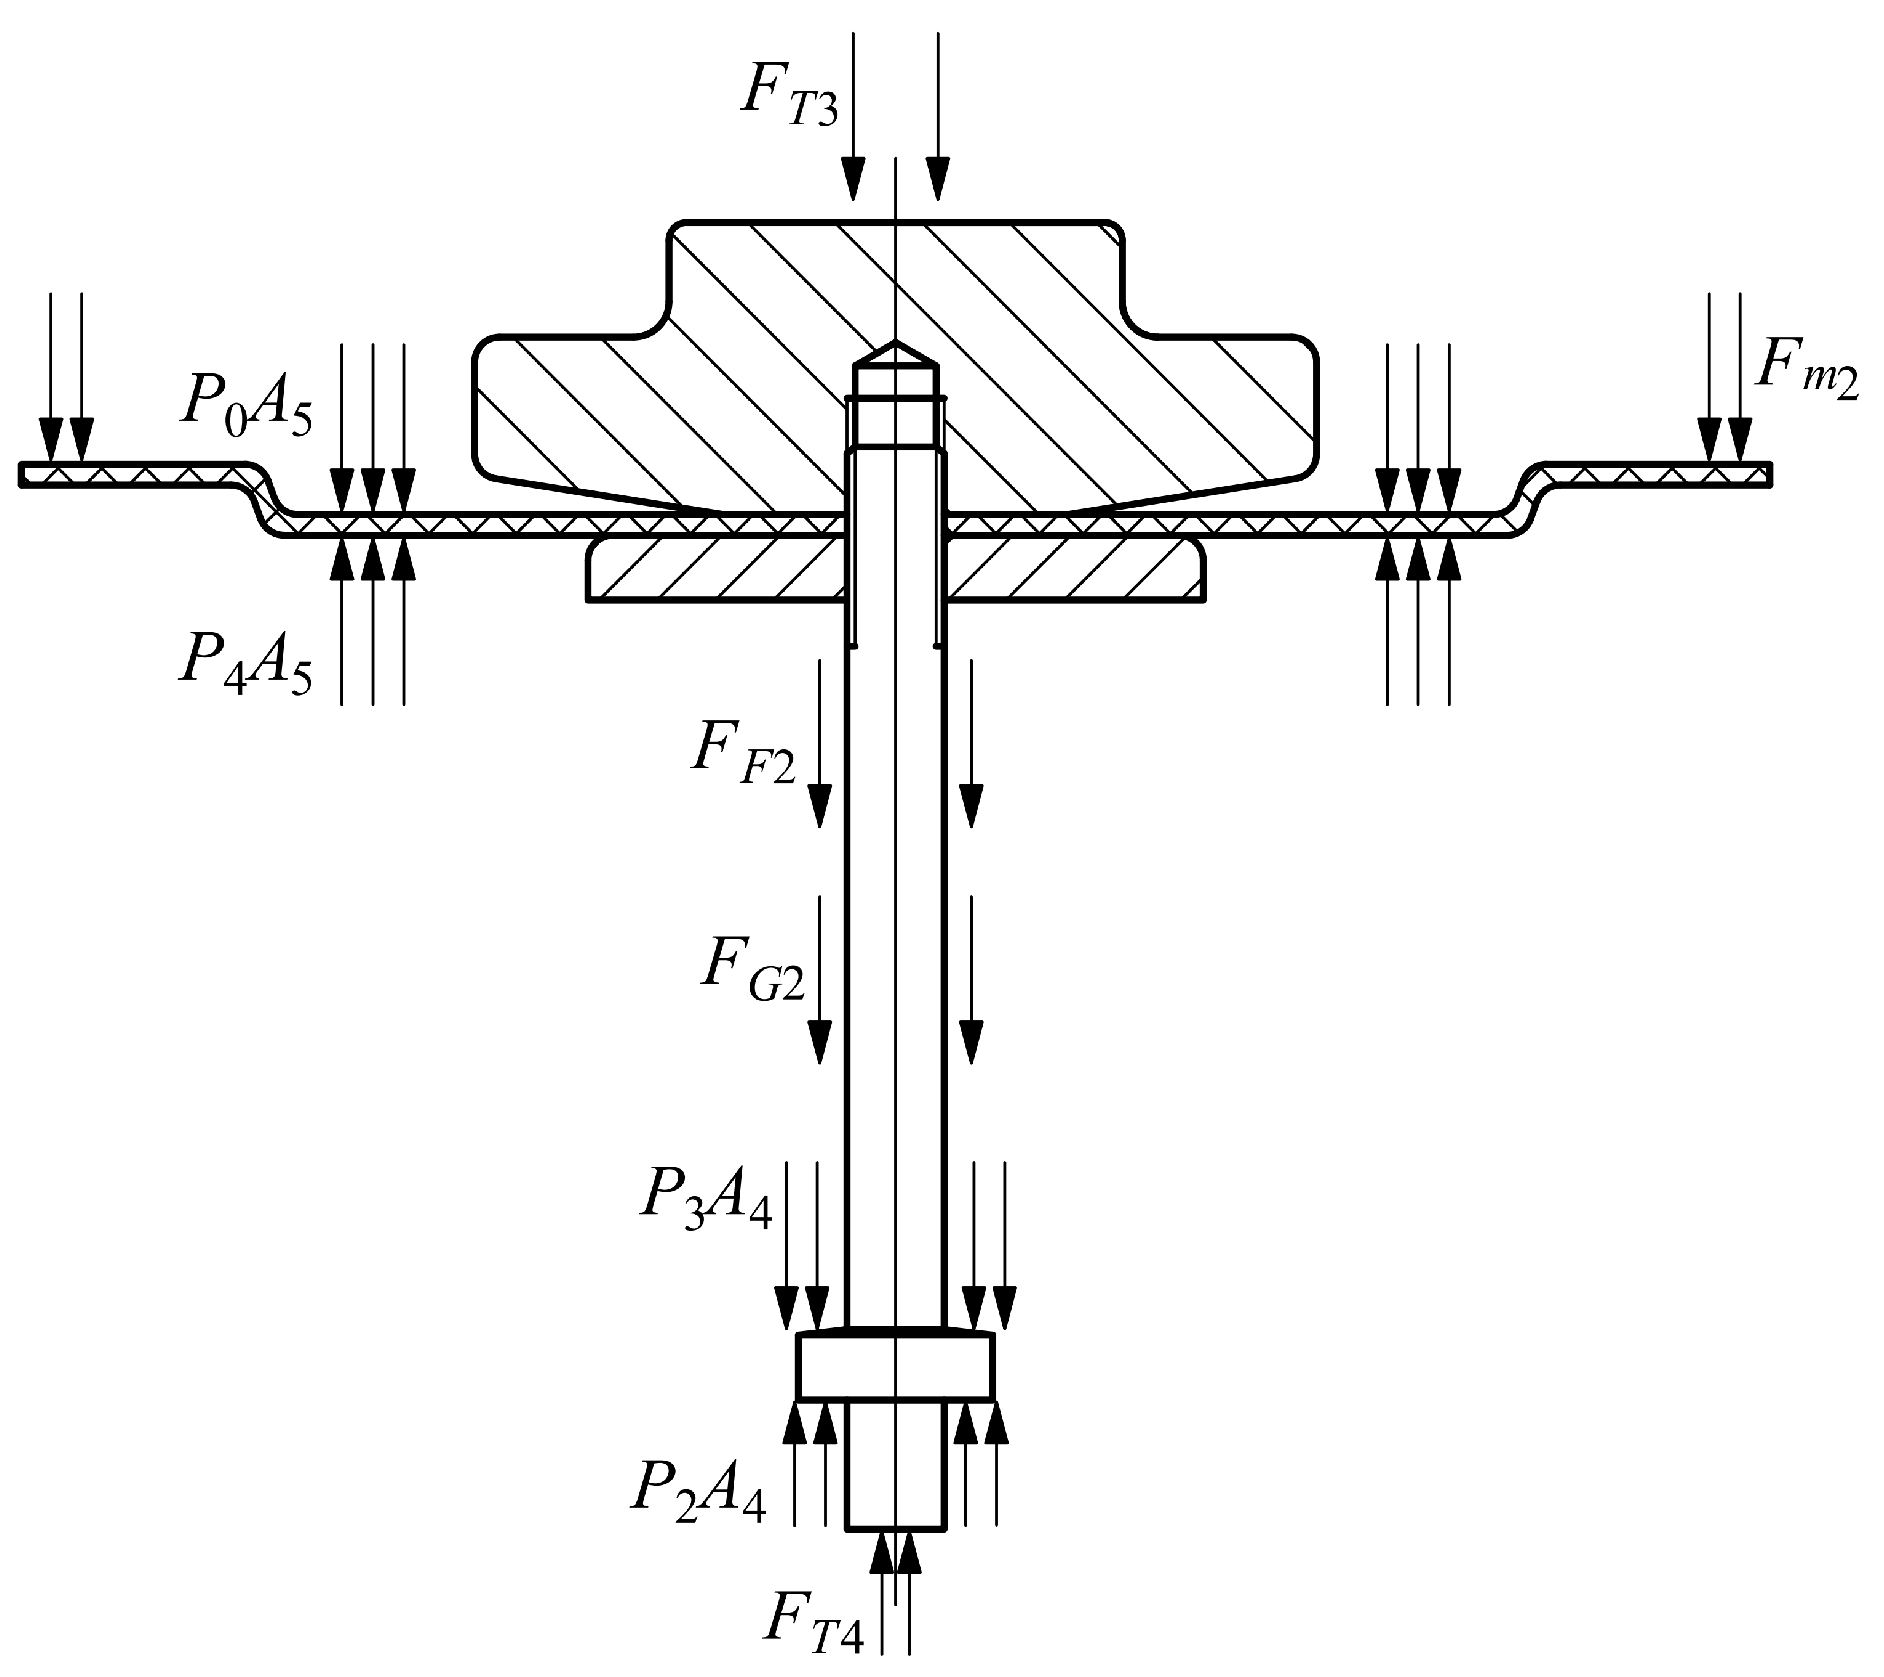
Based on the structure and working principle of the two-stage hydrogen pressure-reducing valve system, the force analysis of the second-stage valve core moving assembly is shown in Figure 10. It is primarily subjected to the combined action of forces including the fluid unbalanced force (FP2) on both ends of the second-stage valve core, the fluid force (FD2) on the diaphragm in the direction of motion, the restoring force (Fm2) of the second-stage valve diaphragm in the direction of motion, and the friction force (FF2) on the moving components. Based on the model simplification assumptions, the mathematical model for the second-stage valve core moving assembly was established.
Based on the structure and working principle of the two-stage pressure reduction system, the motion differential equation for the second-stage valve core moving assembly is established as follows:
m 2 y ¨ = P 2 P 3 A 4 + P 3 P 0 A 5 + F T 4 F T 3 F m 2 F G 2 L 2 y ˙
where P3 is the outlet pressure of the two-stage hydrogen pressure-reducing valve (Pa); P0 is the atmospheric pressure (Pa); A4 is the effective action area of the fluid on the second-stage valve core (m2); A5 is the effective force area of the diaphragm (m2); FT4 is the force exerted by the auxiliary spring of the second-stage valve (N); FT3 is the force exerted by the main spring of the second-stage valve (N); Fm2 is the restoring force of the second-stage valve diaphragm in the direction of motion (N); FG2 is the gravity of the moving components of the second-stage valve (N); m2 is the mass of the moving components of the second-stage valve core (kg); L2 is the damping coefficient of the second-stage valve motion; y is the displacement of the second-stage valve core (m).

2.3.3. Gas State Equation

In the two-stage hydrogen pressure-reducing valve, the fluid flows between chambers as the gas pressure changes. During operation, gas exchange occurs, leading to corresponding changes in the gas mass within each chamber. Based on the ideal gas law, and considering that the pressure P within the control volume is identical to the pressure Pout at the outlet of the control volume, the following equation is derived:
d P o u t d T = k R V m ˙ i n T i n m ˙ o u t T o u t
where Pout is the pressure at the outlet of the control volume (Pa); T is the gas temperature at the orifice inlet (K); Tin is the absolute temperature of the gas flowing into the chambers of the pressure-reducing valve (K); Tout is the absolute temperature of the gas flowing out of the chambers of the pressure-reducing valve (K); min is the mass of gas flowing into the chambers (kg); mout is the mass of gas flowing out of the chambers (kg); k is the specific heat ratio of the gas; R is the gas constant (J/(mol·K)); V is the chamber volume (m3).

2.3.4. Flow Equations Between Chambers

Based on the structure and working principle of the first-stage pressure-reducing valve orifice, the mass flow rate equation for the first-stage valve orifice can be derived from Equation (1) as
Q 1 = C d 1 A 11 P 1 R T 1 2 k k 1 P 2 P 1 2 k P 2 P 1 k + 1 k P 2 P 1 > 2 k + 1 k k 1 C d 1 A 11 P 1 R T 1 k 2 k + 1 k + 1 k 1 P 2 P 1 2 k + 1 k k 1
where C d 1 is the flow coefficient of the first-stage pressure-reducing valve orifice; T 1 is the gas temperature in the low-pressure chamber of the first-stage pressure-reducing valve (K); A 11 is the opening area of the first-stage pressure-reducing valve orifice (m2).
The mass flow rate equation for the second-stage pressure-reducing valve orifice is
Q 2 = C d 2 A 12 P 2 R T 2 2 k k 1 P 3 P 2 2 k P 3 P 2 k + 1 k P 3 P 2 > 2 k + 1 k k 1 C d 2 A 12 P 2 R T 2 k 2 k + 1 k + 1 k 1 P 3 P 2 2 k + 1 k k 1
where C d 2 is the flow coefficient of the second-stage pressure-reducing valve orifice; T 2 is the gas temperature in the low-pressure chamber of the second-stage pressure-reducing valve (K); A 12 is the opening area of the second-stage pressure-reducing valve orifice (m2).
The mass flow rate equation for the feedback chamber of the second-stage pressure-reducing valve is
Q 3 = C d 3 A 13 P 3 R T 3 2 k k 1 P 4 P 3 2 k P 4 P 3 k + 1 k P 4 P 3 > 2 k + 1 k k 1 C d 3 A 13 P 3 R T 3 k 2 k + 1 k + 1 k 1 P 4 P 3 2 k + 1 k k 1
where C d 3 is the flow coefficient of the throttling orifice in the feedback chamber of the second-stage pressure-reducing valve; T 3 is the gas temperature in the feedback chamber of the second-stage pressure-reducing valve (K); A 13 is the cross-sectional area of the feedback orifice in the second-stage pressure-reducing valve (m2).

2.3.5. Thermodynamic Equations for the Chambers

The pressure differential equation for the low-pressure chamber of the first-stage valve is
d P 2 d t = k R T 1 V 1 Q 1 Q m 1 k P 2 A 4 A 2 V 1 d x d t
where V1 is the volume of the low-pressure chamber in the first-stage valve (m3); Q1 is the mass flow rate through the first-stage valve orifice (kg/s); Qm1 is the mass flow rate entering the second-stage valve (kg/s); T1 is the gas temperature in the low-pressure chamber of the first-stage valve (K).
The temperature differential equation for the low-pressure chamber of the first-stage valve is
d T 1 d t = R T 1 2 P 2 V 1 k T 0 T 1 1 Q 1 k 1 Q m 1 k 1 V 1 W ˙ 1 S 1
where T0 is the gas temperature in the high-pressure chamber of the first-stage valve (K); W · 1 is the heat flux (W/mm2); S1 is the deformation area of the chamber inner wall (mm2).
The pressure differential equation for the low-pressure chamber of the second-stage valve is
d P 3 d t = k R T 2 V 2 Q m 1 Q 2 Q 3 k P 3 A 5 V 2 d y d t
where V2 is the volume of the low-pressure chamber in the second-stage valve (m3); T2 is the gas temperature in the low-pressure chamber of the second-stage valve (K); Q2 is the mass flow rate through the second-stage valve orifice (kg/s); Q3 is the mass flow rate into the feedback chamber of the first-stage valve (kg/s).
The temperature differential equation for the low-pressure chamber of the second-stage valve is
d T 2 d t = R T 2 2 P 3 V 2 k T 1 T 2 1 Q m 1 k 1 Q 2 Q 3 k 1 V 2 W ˙ 2 S 2
where W · 2 is the heat flux (W/mm2); S2 is the deformation area of the chamber inner wall (mm2).
The pressure differential equation for the feedback chamber of the second-stage valve is
d P 4 d t = k P 4 V 3 A 13 y Q 2 Q 3 A 13 d y d t
where V3 is the volume of the feedback chamber (m3); A13 is the cross-sectional area of the feedback orifice (m2); P4 is the pressure in the feedback chamber (Pa).
The temperature differential equation for the feedback chamber of the second-stage valve is
d T 3 d t = R T 3 2 P 4 V 3 k T 2 T 3 1 Q 2 k 1 Q 3 k 1 V 3 W ˙ 3 S 3
where W · 3 is the heat flux (W/mm2); S3 is the deformation area of the chamber inner wall (mm2); T3 is the gas temperature in the feedback chamber of the second-stage valve (K).
For clarity, the definitions of the main variables are summarized in Appendix A.

3. Simulation Study on the Dynamic Characteristics of the Two-Stage Hydrogen Pressure-Reducing Valve

3.1. Establishment of the Dynamic Characteristic Simulation Model for the Two-Stage Hydrogen Pressure-Reducing Valve

Based on the structure, pressure reduction principle, and internal flow direction of the two-stage hydrogen pressure-reducing valve, and integrating the multi-physics coupled system dynamic model established in Section 2, a system dynamic characteristic simulation model was developed using MATLAB/Simulink software to conduct a dynamic characteristic simulation study. Maintaining the system inlet pressure at 70 MPa and the outlet pressure at 0.3 MPa, the dynamic performance and pressure control accuracy of the valve under different structural parameters were investigated.
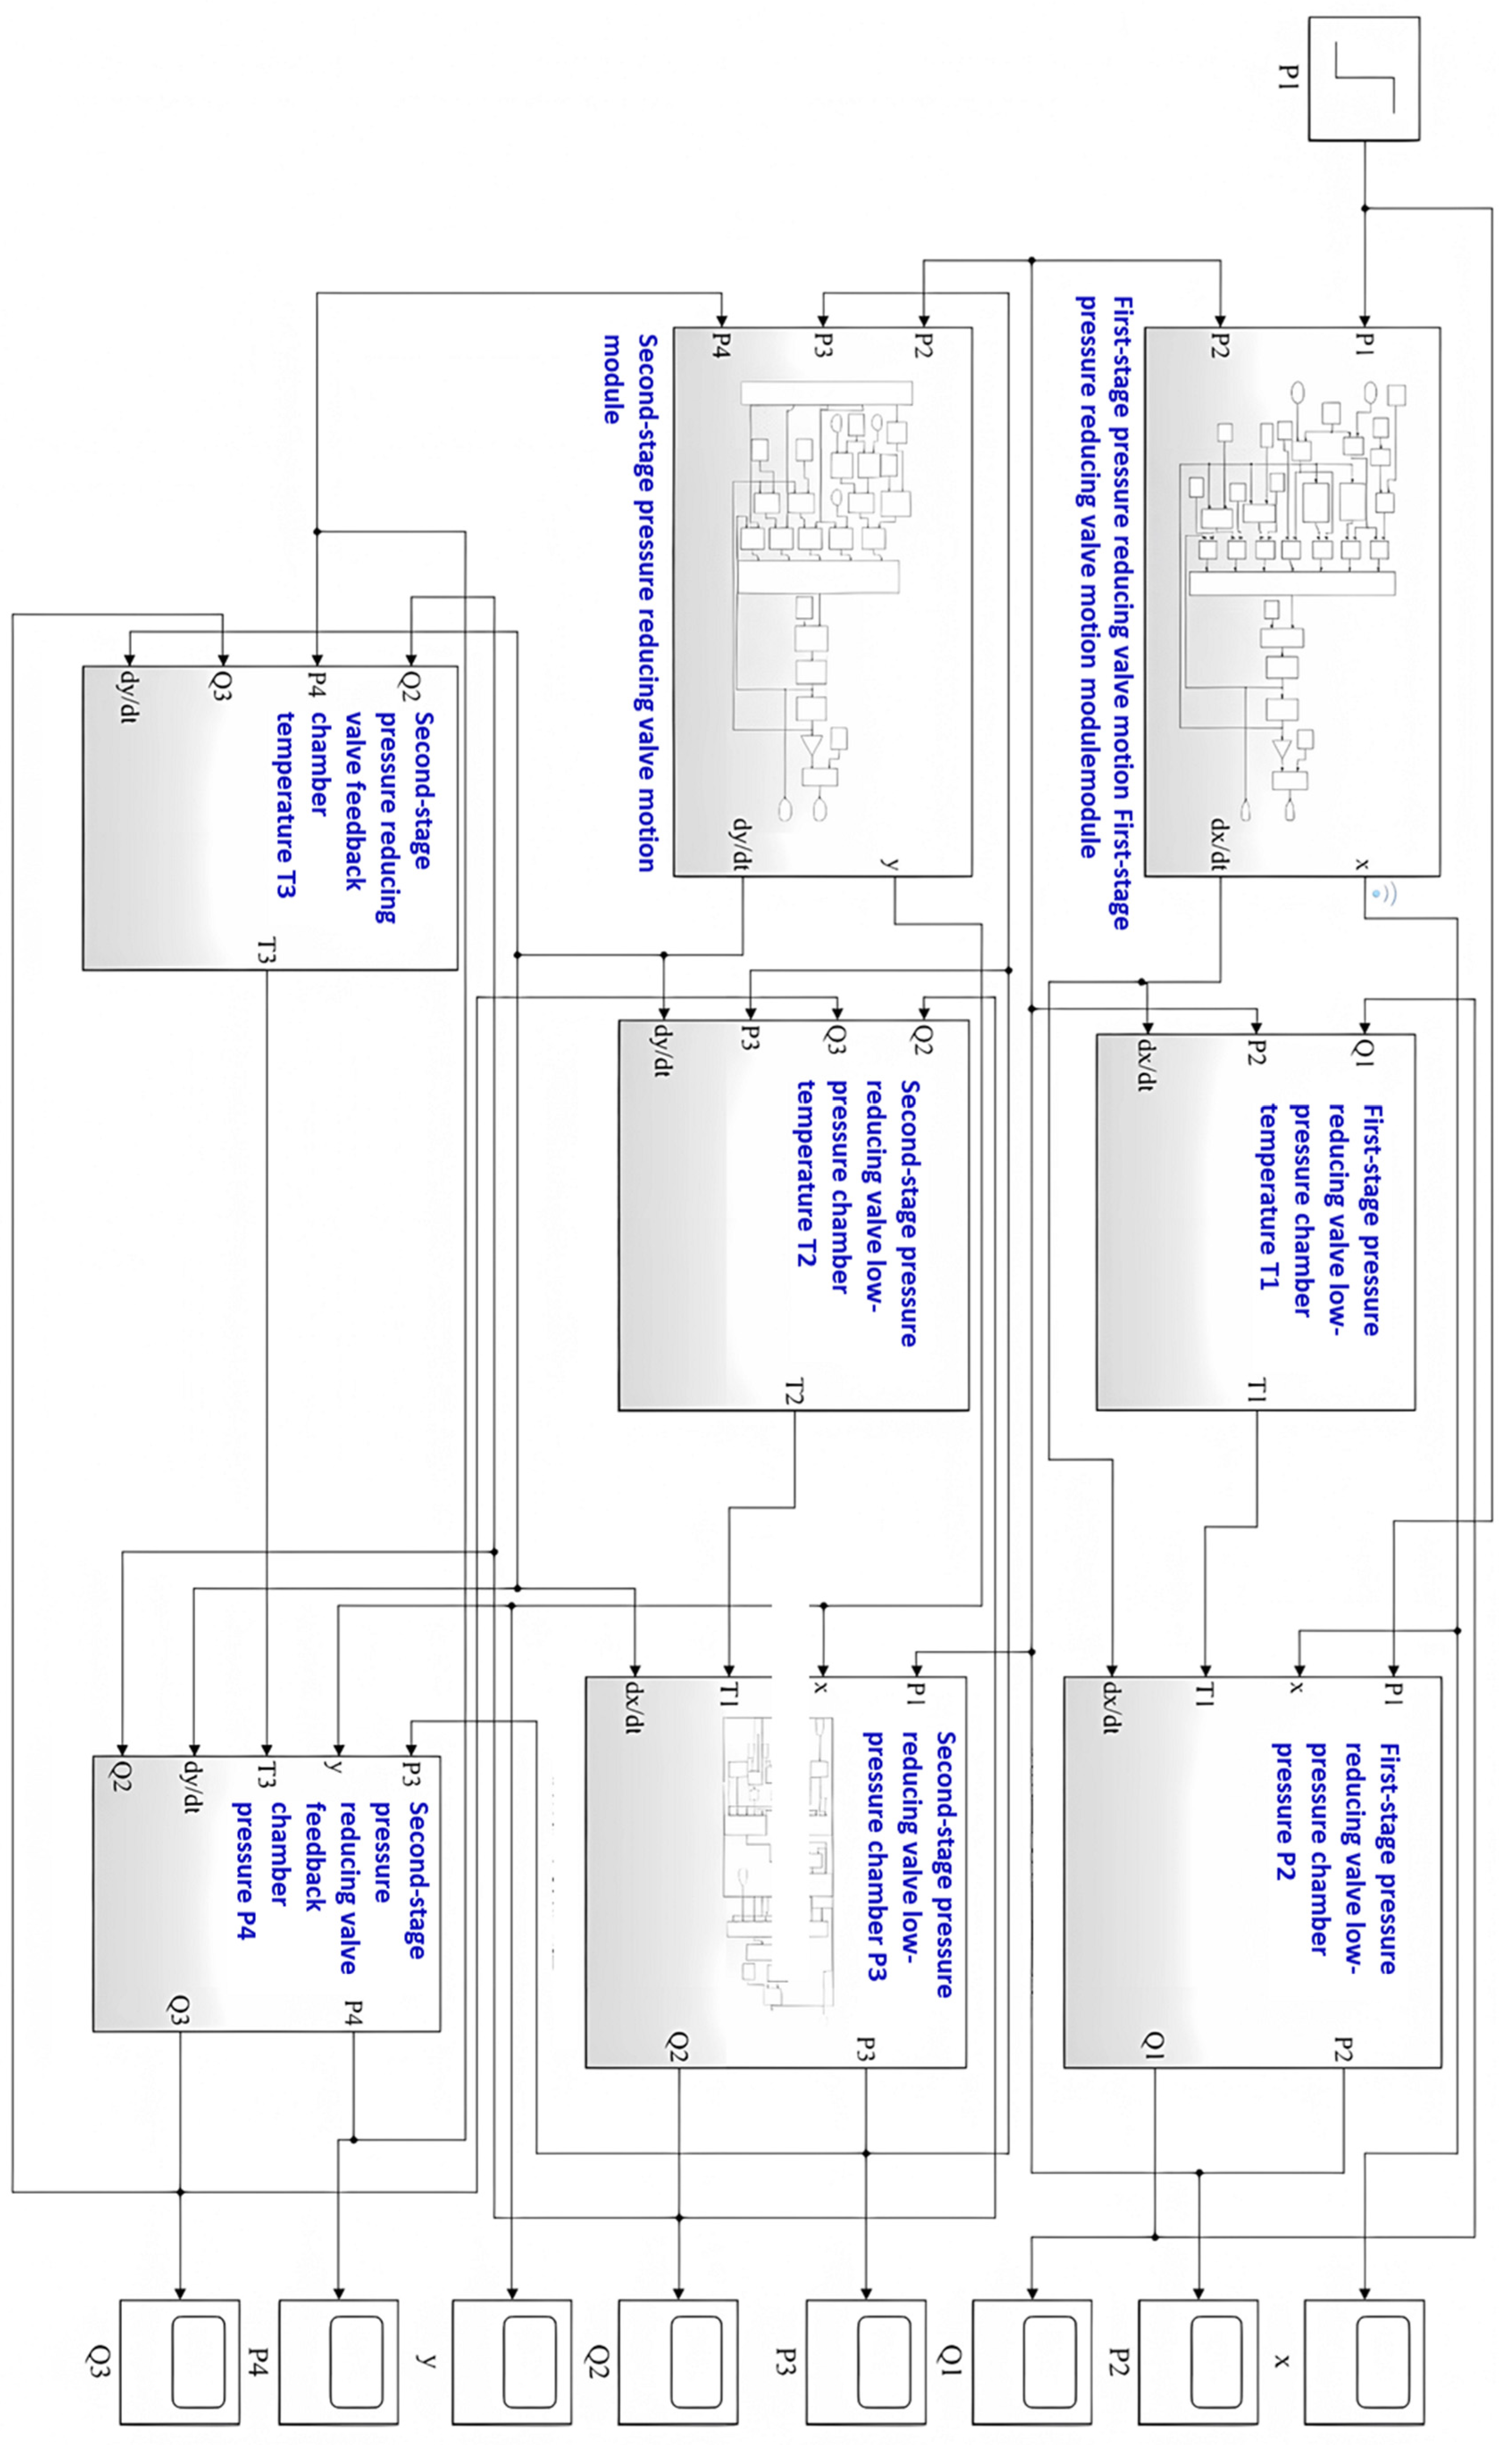
By utilizing the Subsystem and S-Function blocks in MATLAB/Simulink, submodules were encapsulated and interconnected via signal lines to establish a dynamic characteristic simulation model of the two-stage hydrogen pressure-reducing valve system. The overall simulation model is illustrated in Figure 11. Through modular design, the complex system dynamics equations were decomposed into multiple functionally independent submodules, thereby enhancing simulation flexibility and scalability. The simulation module primarily consists of three submodules: the valve core moving assembly submodule, the chamber pressure differential equations submodule, and the chamber thermodynamic equations submodule.
The valve core moving assembly submodule is divided into the first-stage and second-stage valve core moving assembly models. The first-stage model takes the system inlet pressure P1 and the first-stage outlet pressure P2 as inputs, and outputs the displacement x, velocity v1, and acceleration a1 of the first-stage moving assembly. The second-stage model takes the second-stage inlet pressure P2, the system outlet pressure P3, and the feedback chamber pressure P4 as inputs, and outputs the displacement y, velocity v2, and acceleration a2 of the second-stage moving assembly.
The chamber pressure differential equations submodule comprises the first-stage low-pressure chamber module, the second-stage low-pressure chamber module, and the second-stage feedback chamber module. The first-stage and second-stage low-pressure chamber modules primarily take the chamber inlet pressure, valve core displacement, valve core velocity, and chamber temperature as inputs, and output the chamber outlet pressure and the mass flow rates through the respective valve orifices.
The chamber thermodynamic equations submodule includes the first-stage low-pressure chamber temperature module, the second-stage low-pressure chamber temperature module, and the second-stage feedback chamber temperature module. The first-stage and second-stage low-pressure chamber temperature modules primarily take the chamber outlet pressure, the mass flow rates through the valve orifices, and the valve core velocity as inputs, and output the chamber temperature.
The compressibility of high-pressure hydrogen renders the system highly nonlinear. Complex interactions exist among the movement of the mechanical components, the internal gas flow, and the gas state change processes within the two-stage hydrogen pressure-reducing valve, introducing significant nonlinear factors. The ode23s solver in Simulink is effective at handling such nonlinear problems and helps avoid numerical instability during simulation. Therefore, to improve simulation accuracy, the nonlinear solver ode23s in Simulink was employed to solve the system of nonlinear differential equations for the two-stage hydrogen pressure-reducing valve, facilitating the study of its dynamic characteristics. Furthermore, as the simulation involves processes with vastly different time scales, an automatic variable-step simulation method was adopted to accurately capture the system’s dynamic response.
Based on the structural dimensions of the designed two-stage hydrogen pressure-reducing valve, the design parameters for each module in the simulation model were assigned. The parameter settings are listed in Table 4.

3.2. Validation of the MATLAB/Simulink Dynamic Simulation Model Accuracy Against the Literature

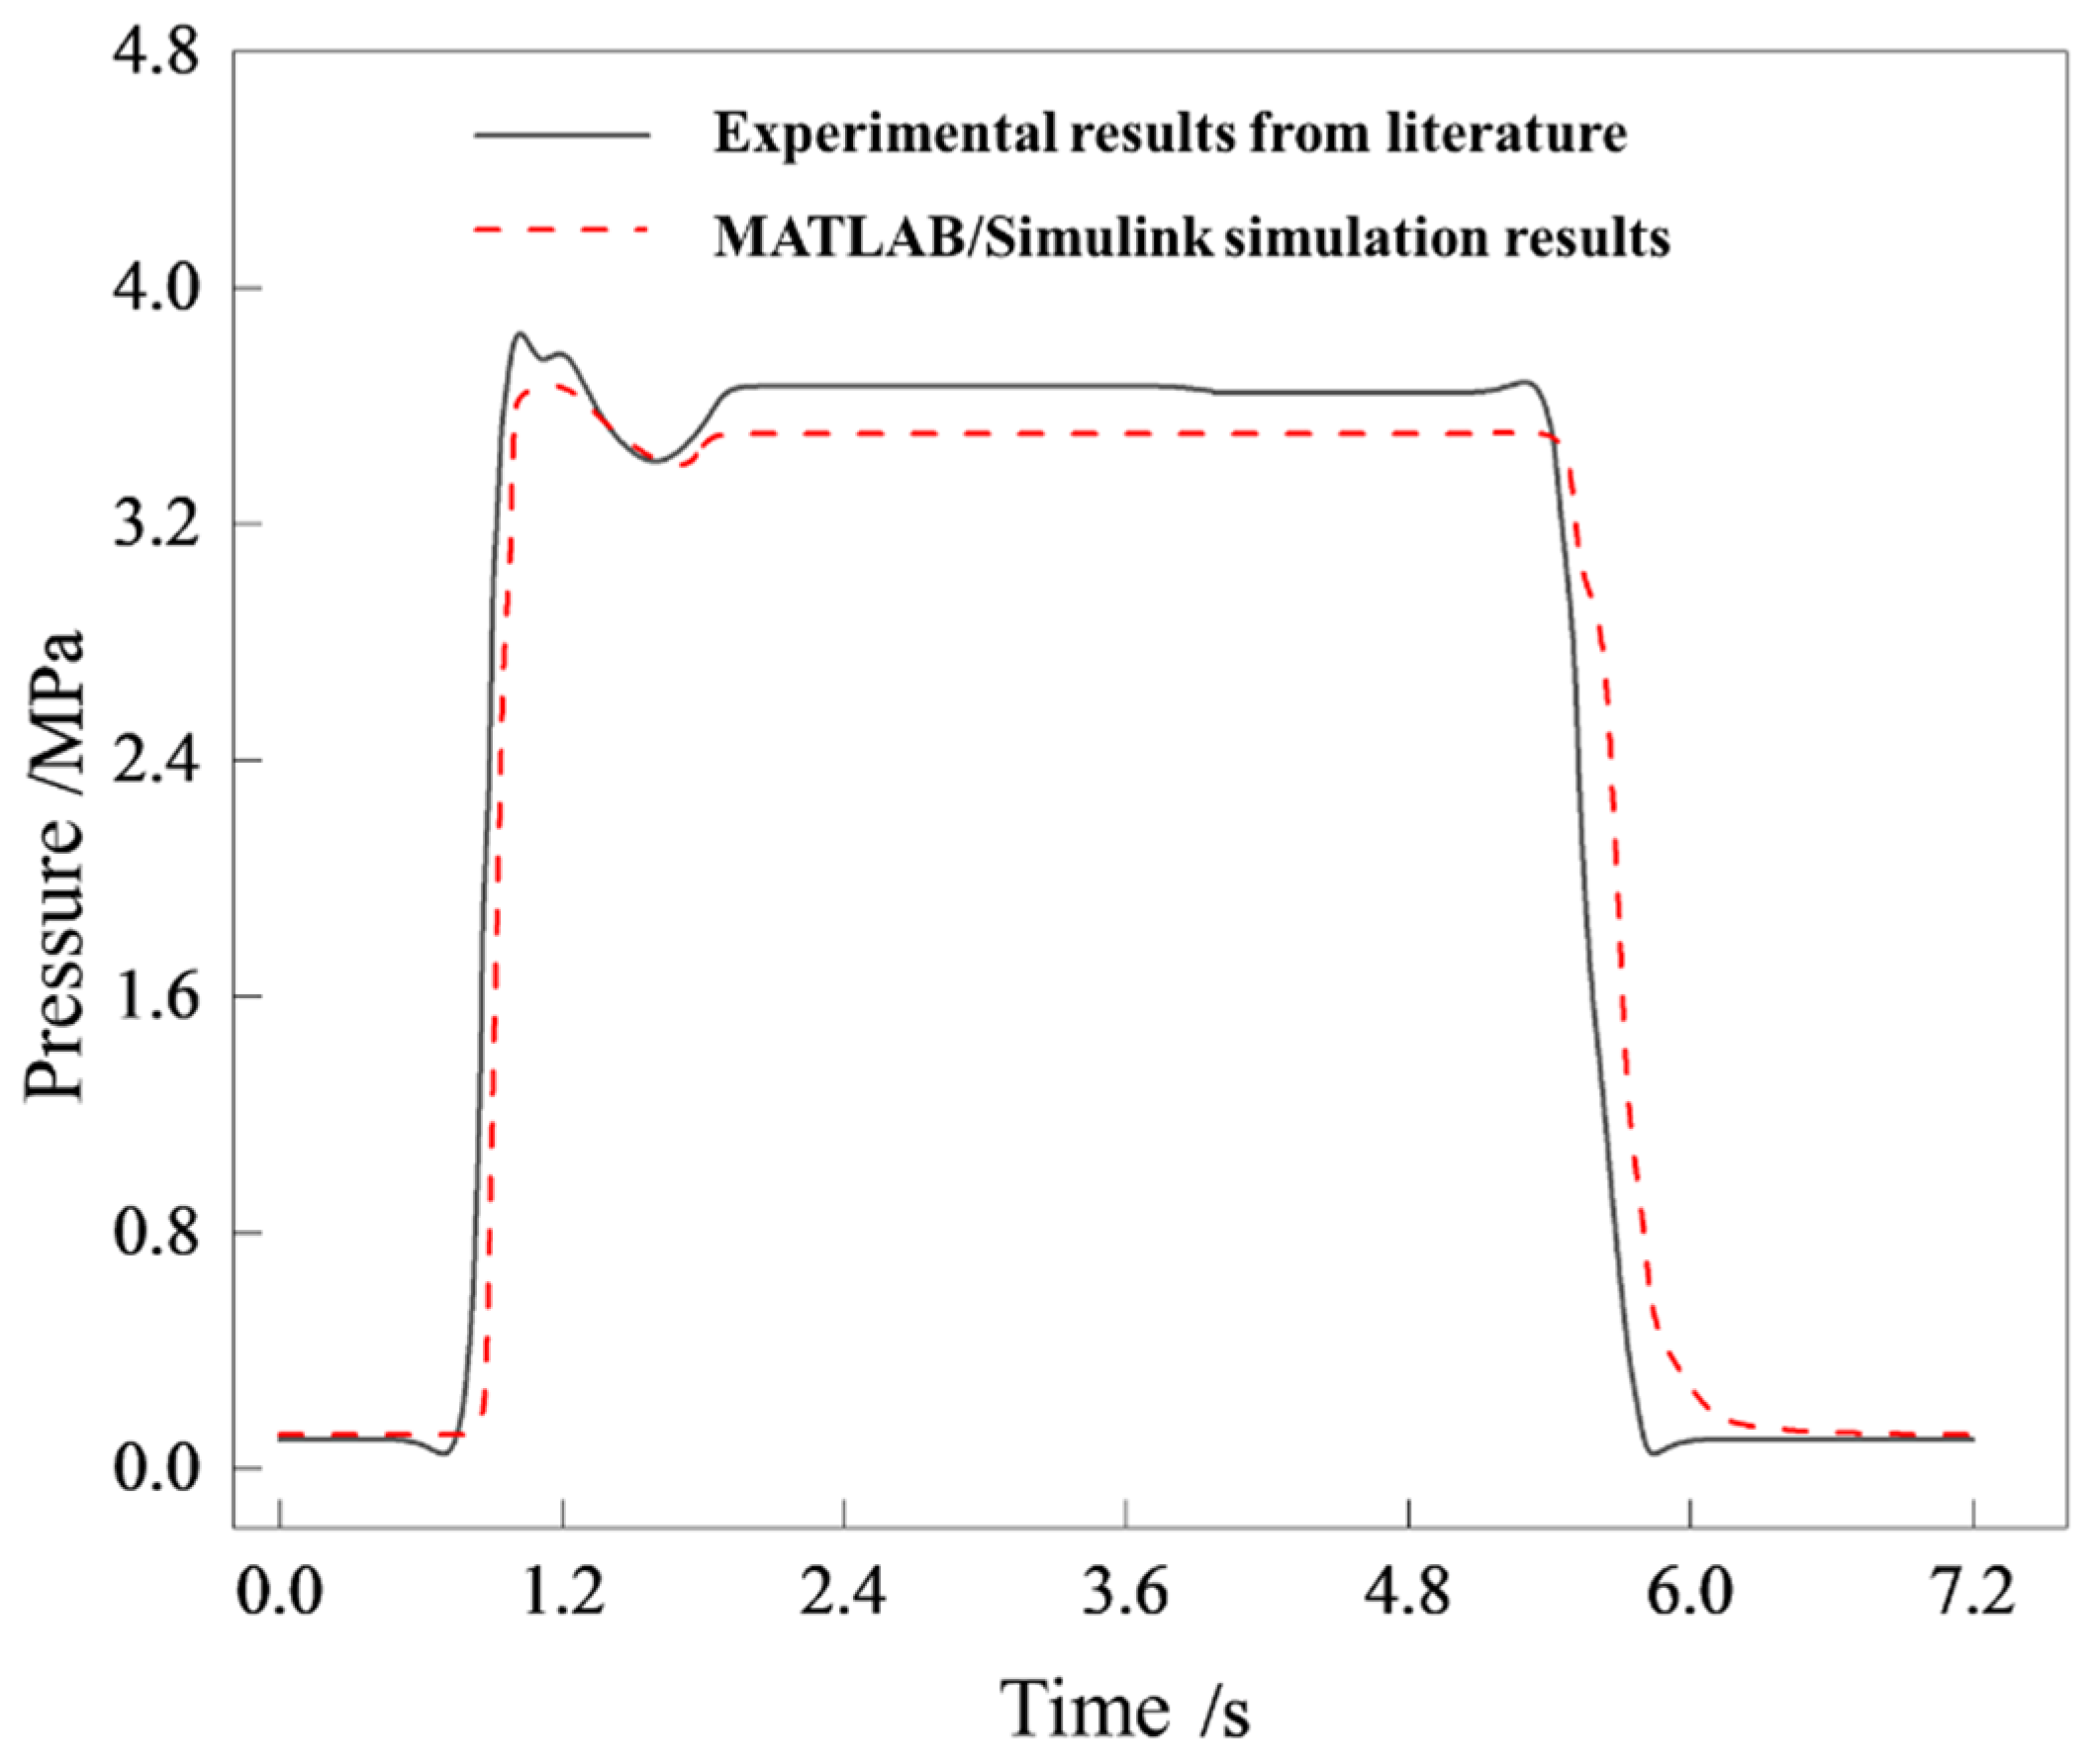
Zhang et al. [25] designed a high-pressure pneumatic pilot switching valve. Using AMESim simulation software and based on the bond graph modeling methodology, they established a multi-physics simulation model considering mechanical dynamics, gas flow, and pipeline heat exchange, and validated the model’s accuracy through experiments. To verify the applicability of the modeling approach adopted in this study, the dynamic simulation model from reference [25] was recreated using the MATLAB/Simulink software environment described in Section 3.1, and numerical simulations were performed to validate the precision of the present MATLAB/Simulink dynamic model. As shown in Figure 12, during the valve core actuation, the simulation results for the pressure change within the valve opening chamber (CFOV) show a consistent trend with the experimental data from the literature, with a maximum error of 4.7%. The comparison between the MATLAB/Simulink dynamic simulation results and the experimental results from the literature demonstrates that the dynamic simulation model established using MATLAB/Simulink possesses high accuracy, can reliably reflect the system’s dynamic characteristics, and is therefore suitable for investigating the dynamic behavior of the two-stage hydrogen pressure-reducing valve.
It should be noted that the validation data adopted in this study are obtained from high-pressure pneumatic pilot valves reported in the literature. The observed deviations mainly originate from differences in valve structure, flow path geometry, and modeling assumptions between the referenced valves and the studied two-stage hydrogen pressure-reducing valve. Nevertheless, the validation is intended to verify the consistency of dynamic response trends rather than exact numerical agreement. Therefore, these differences do not affect the comparative trend analysis or the subsequent optimization results.

4. Analysis of Dynamic Characteristics of the Two-Stage Hydrogen Pressure-Reducing Valve

Under ideal conditions, the two-stage hydrogen pressure-reducing valve should consistently and stably supply low pressure to the downstream system, even amidst fluctuations in the inlet and outlet pressures. However, in practical applications, such pressure-reducing valves may fail to maintain the output pressure steadily at the preset value, often exhibiting instability or inaccuracy, particularly under high-pressure variations. Therefore, the rational design of their structural parameters becomes critically important. Due to the valve’s structural characteristics, when studying its dynamic behavior, focusing solely on the outlet pressure of the first-stage valve may lead to inaccuracies, as it can be interfered with by the second-stage structure. Therefore, when investigating the influence of the first-stage valve’s design parameters on the dynamic characteristics, it is necessary to consider the outlet pressures of both the first and second stages to ensure comprehensive and accurate analysis results. Relevant studies indicate that key design parameters affecting the dynamic performance of the two-stage hydrogen pressure-reducing valve include the main spring stiffness, valve core mass, low-pressure chamber volume, and piston area of the first-stage valve, as well as the main spring stiffness, valve core mass, diaphragm outer diameter, and feedback orifice area of the second-stage valve [18]. Under the condition of a system inlet pressure of 70 MPa and an outlet pressure of 0.3 MPa, the dynamic response of the valve under different structural parameters was analyzed by varying one structural parameter at a time. This process aimed to identify the structural parameters that have the most significant impact on the steady-state outlet pressure, overshoot, and dynamic response time.
Although a univariate control strategy is adopted in this study, the coupling effects among key structural parameters are inherently reflected in the system-level dynamic responses of the two-stage hydrogen pressure-reducing valve, particularly through the interaction between the first-stage and second-stage dynamics.

4.1. Influence of First-Stage Valve Main Spring Stiffness on System Dynamic Characteristics

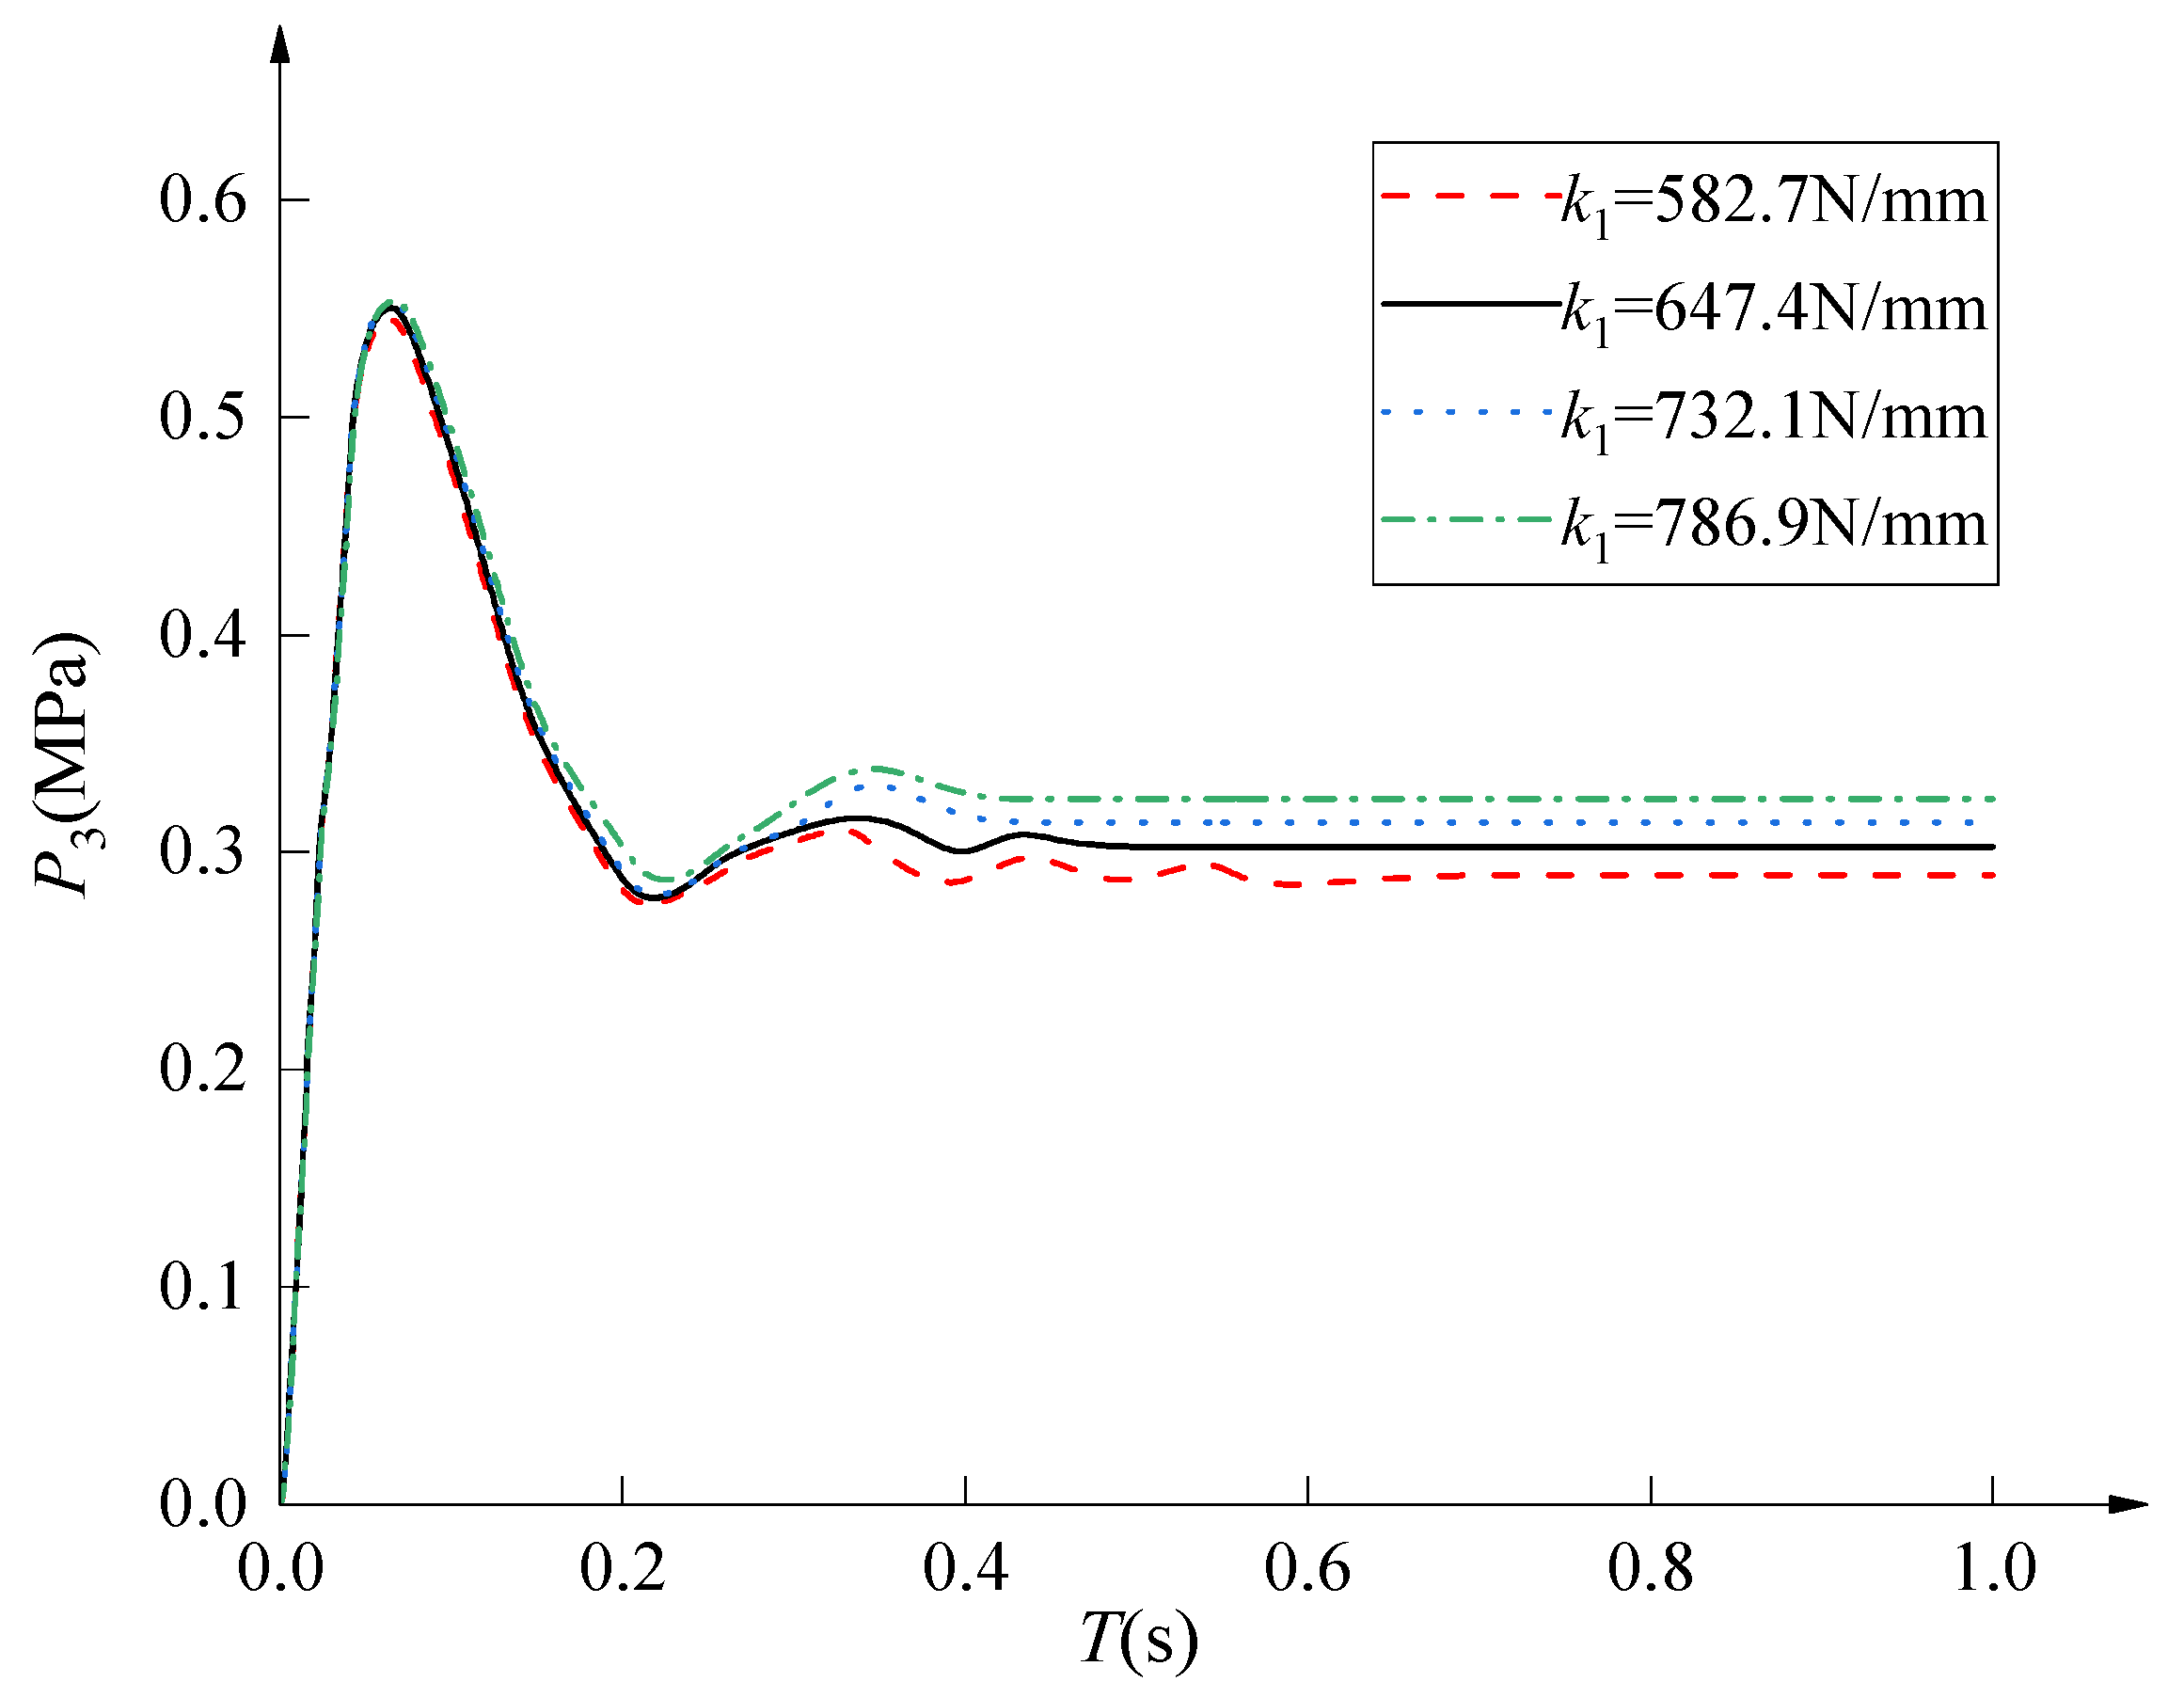
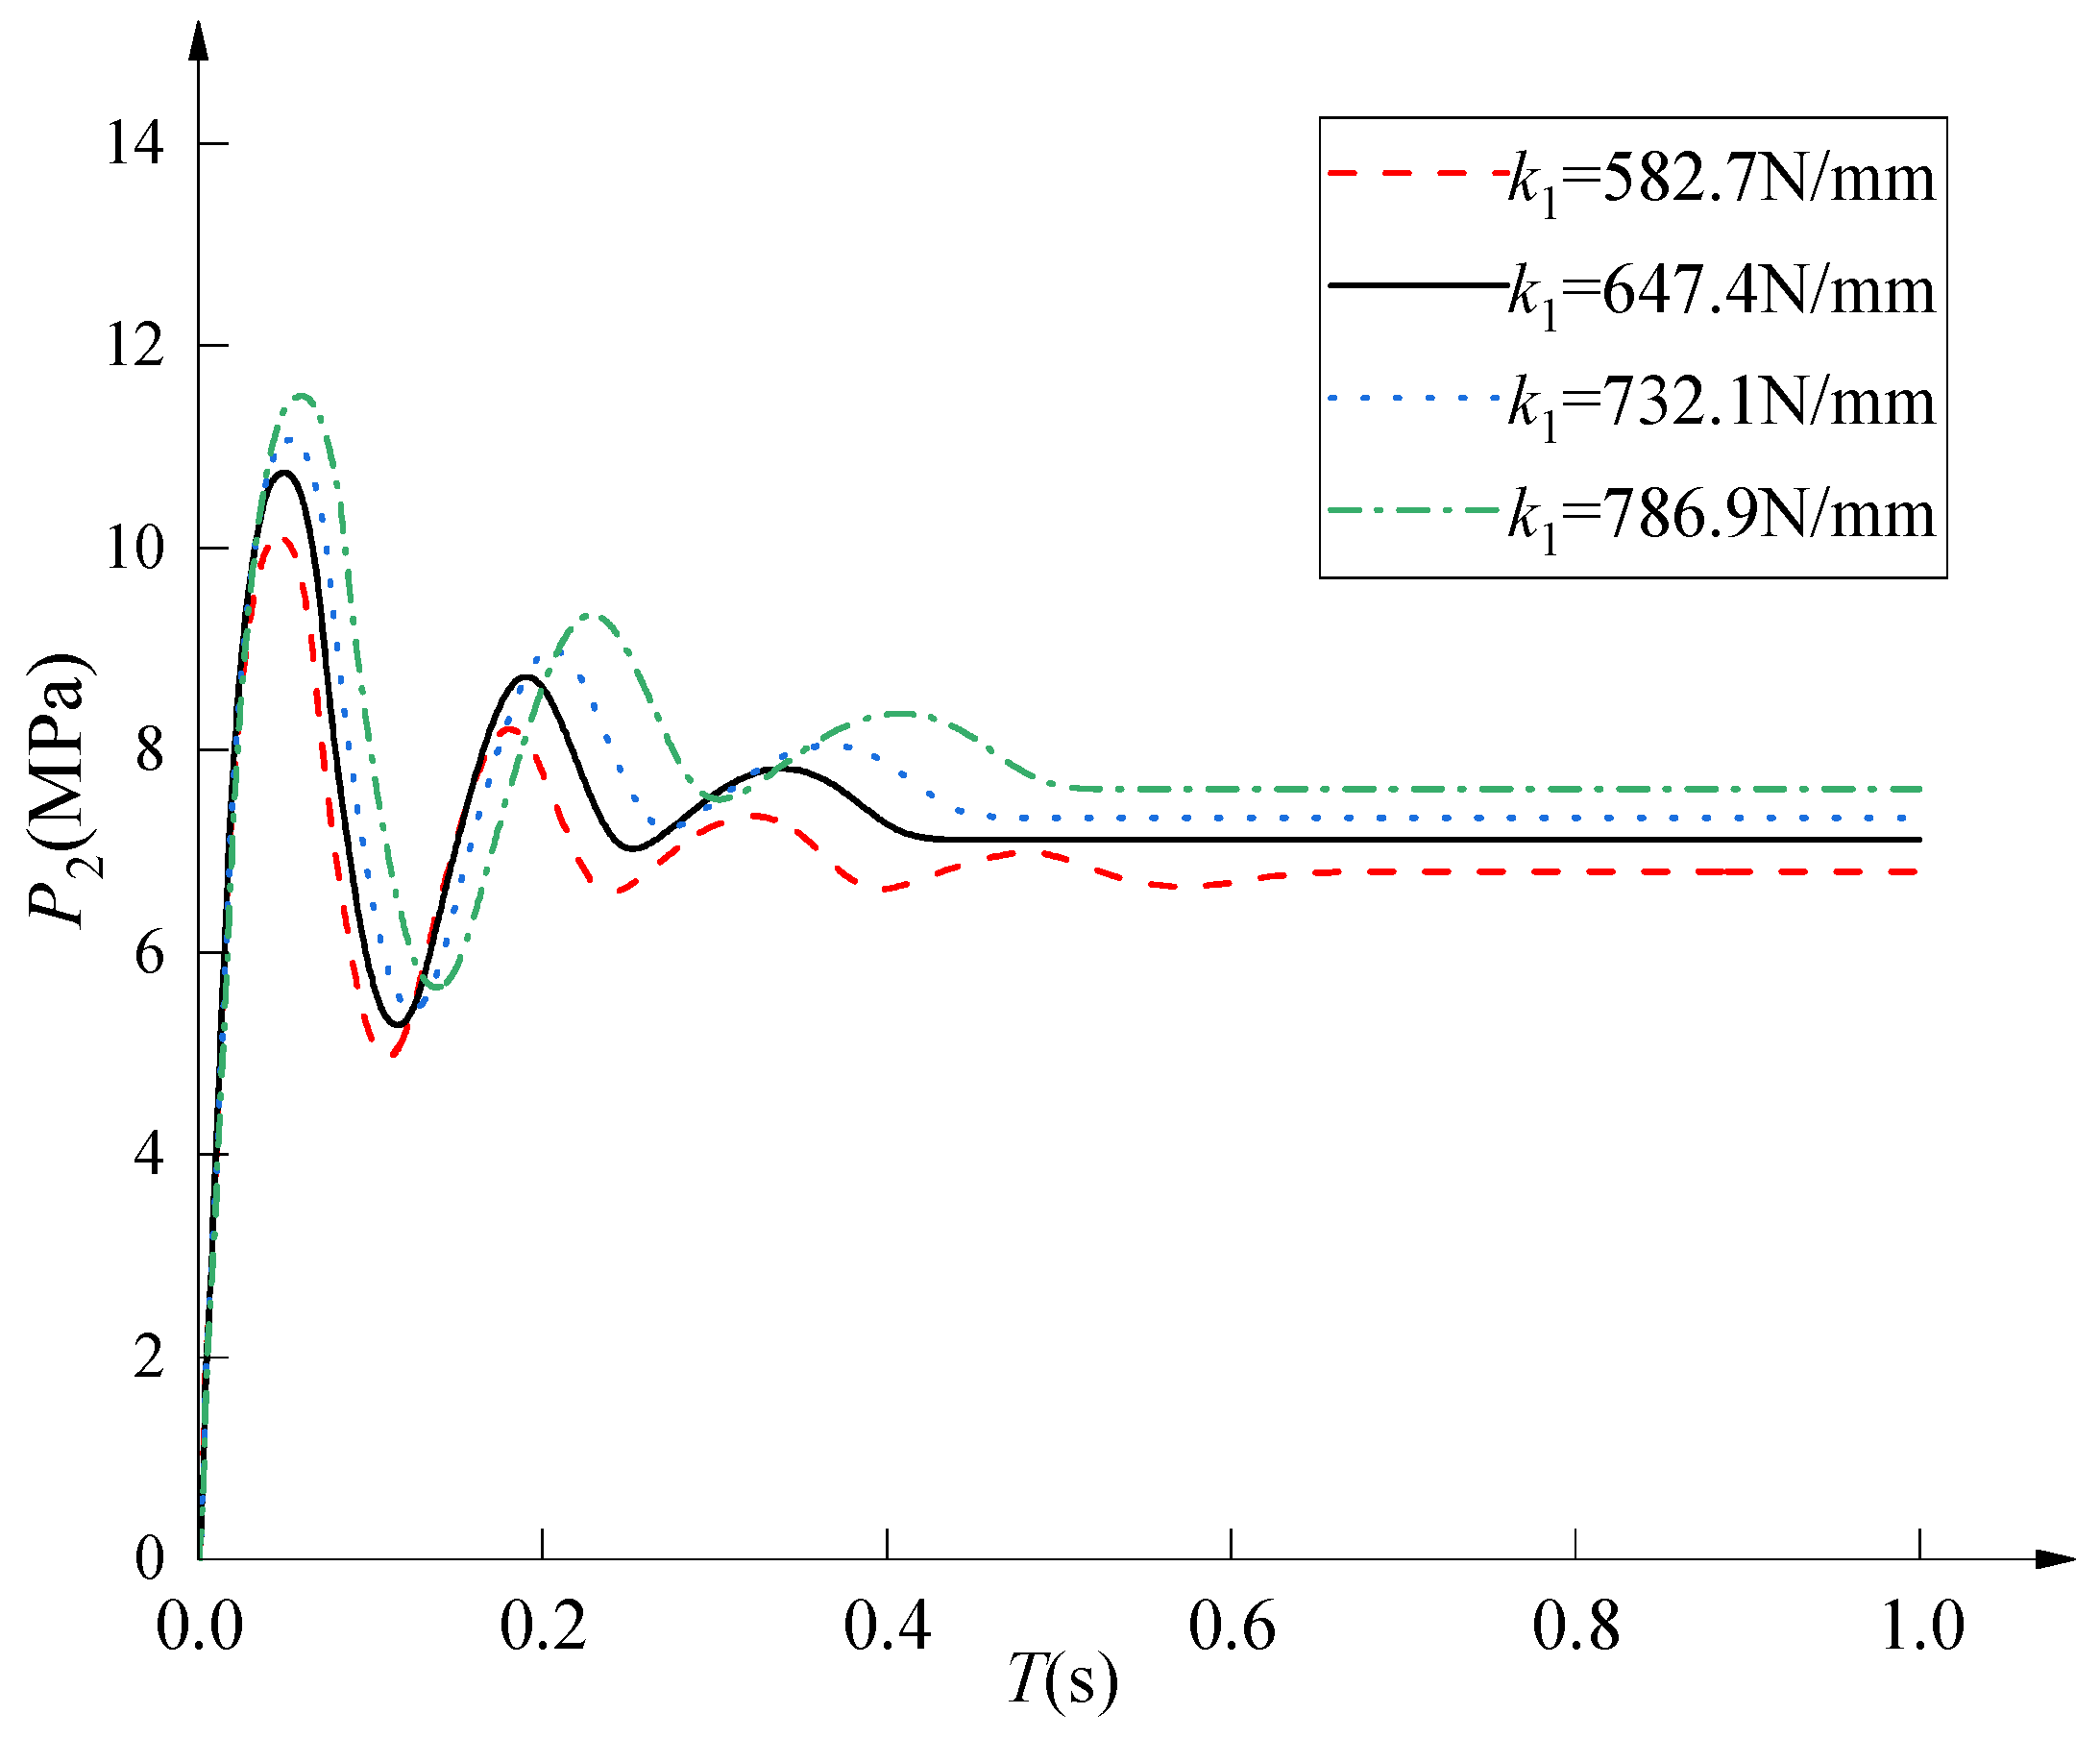
Based on the established simulation model of the two-stage hydrogen pressure-reducing valve, a simulation analysis of the dynamic characteristics was conducted for different values of the first-stage valve main spring stiffness. In the dynamic characteristic simulation model, all other structural parameters remained unchanged. The simulation results for first-stage valve main spring stiffness values of 582.7 N/mm, 647.4 N/mm, 732.1 N/mm, and 786.9 N/mm are shown in Figure 13 and Figure 14. The figures indicate that as the first-stage valve main spring stiffness increases from 582.7 N/mm to 786.9 N/mm, the steady-state value of the second-stage valve outlet pressure continuously increases by 10.74%. The overshoot, pressure peak value, and time to reach the pressure peak show a slight increasing trend but remain largely unchanged. In contrast, the dynamic response time becomes longer, increasing by 7.41%. When the first-stage valve main spring stiffness is relatively small, the outlet pressure of the two-stage hydrogen pressure-reducing valve is susceptible to disturbances, leading to severe pressure fluctuations and poor system stability. As the spring stiffness increases, the system outlet pressure tends to stabilize, and the steady-state pressure value increases; however, the system dynamic response time lengthens. Therefore, within the adjustment range, appropriately increasing the main spring stiffness of the first-stage valve can enhance the stability of the system outlet pressure.

4.2. Influence of First-Stage Valve Core Mass on System Dynamic Characteristics

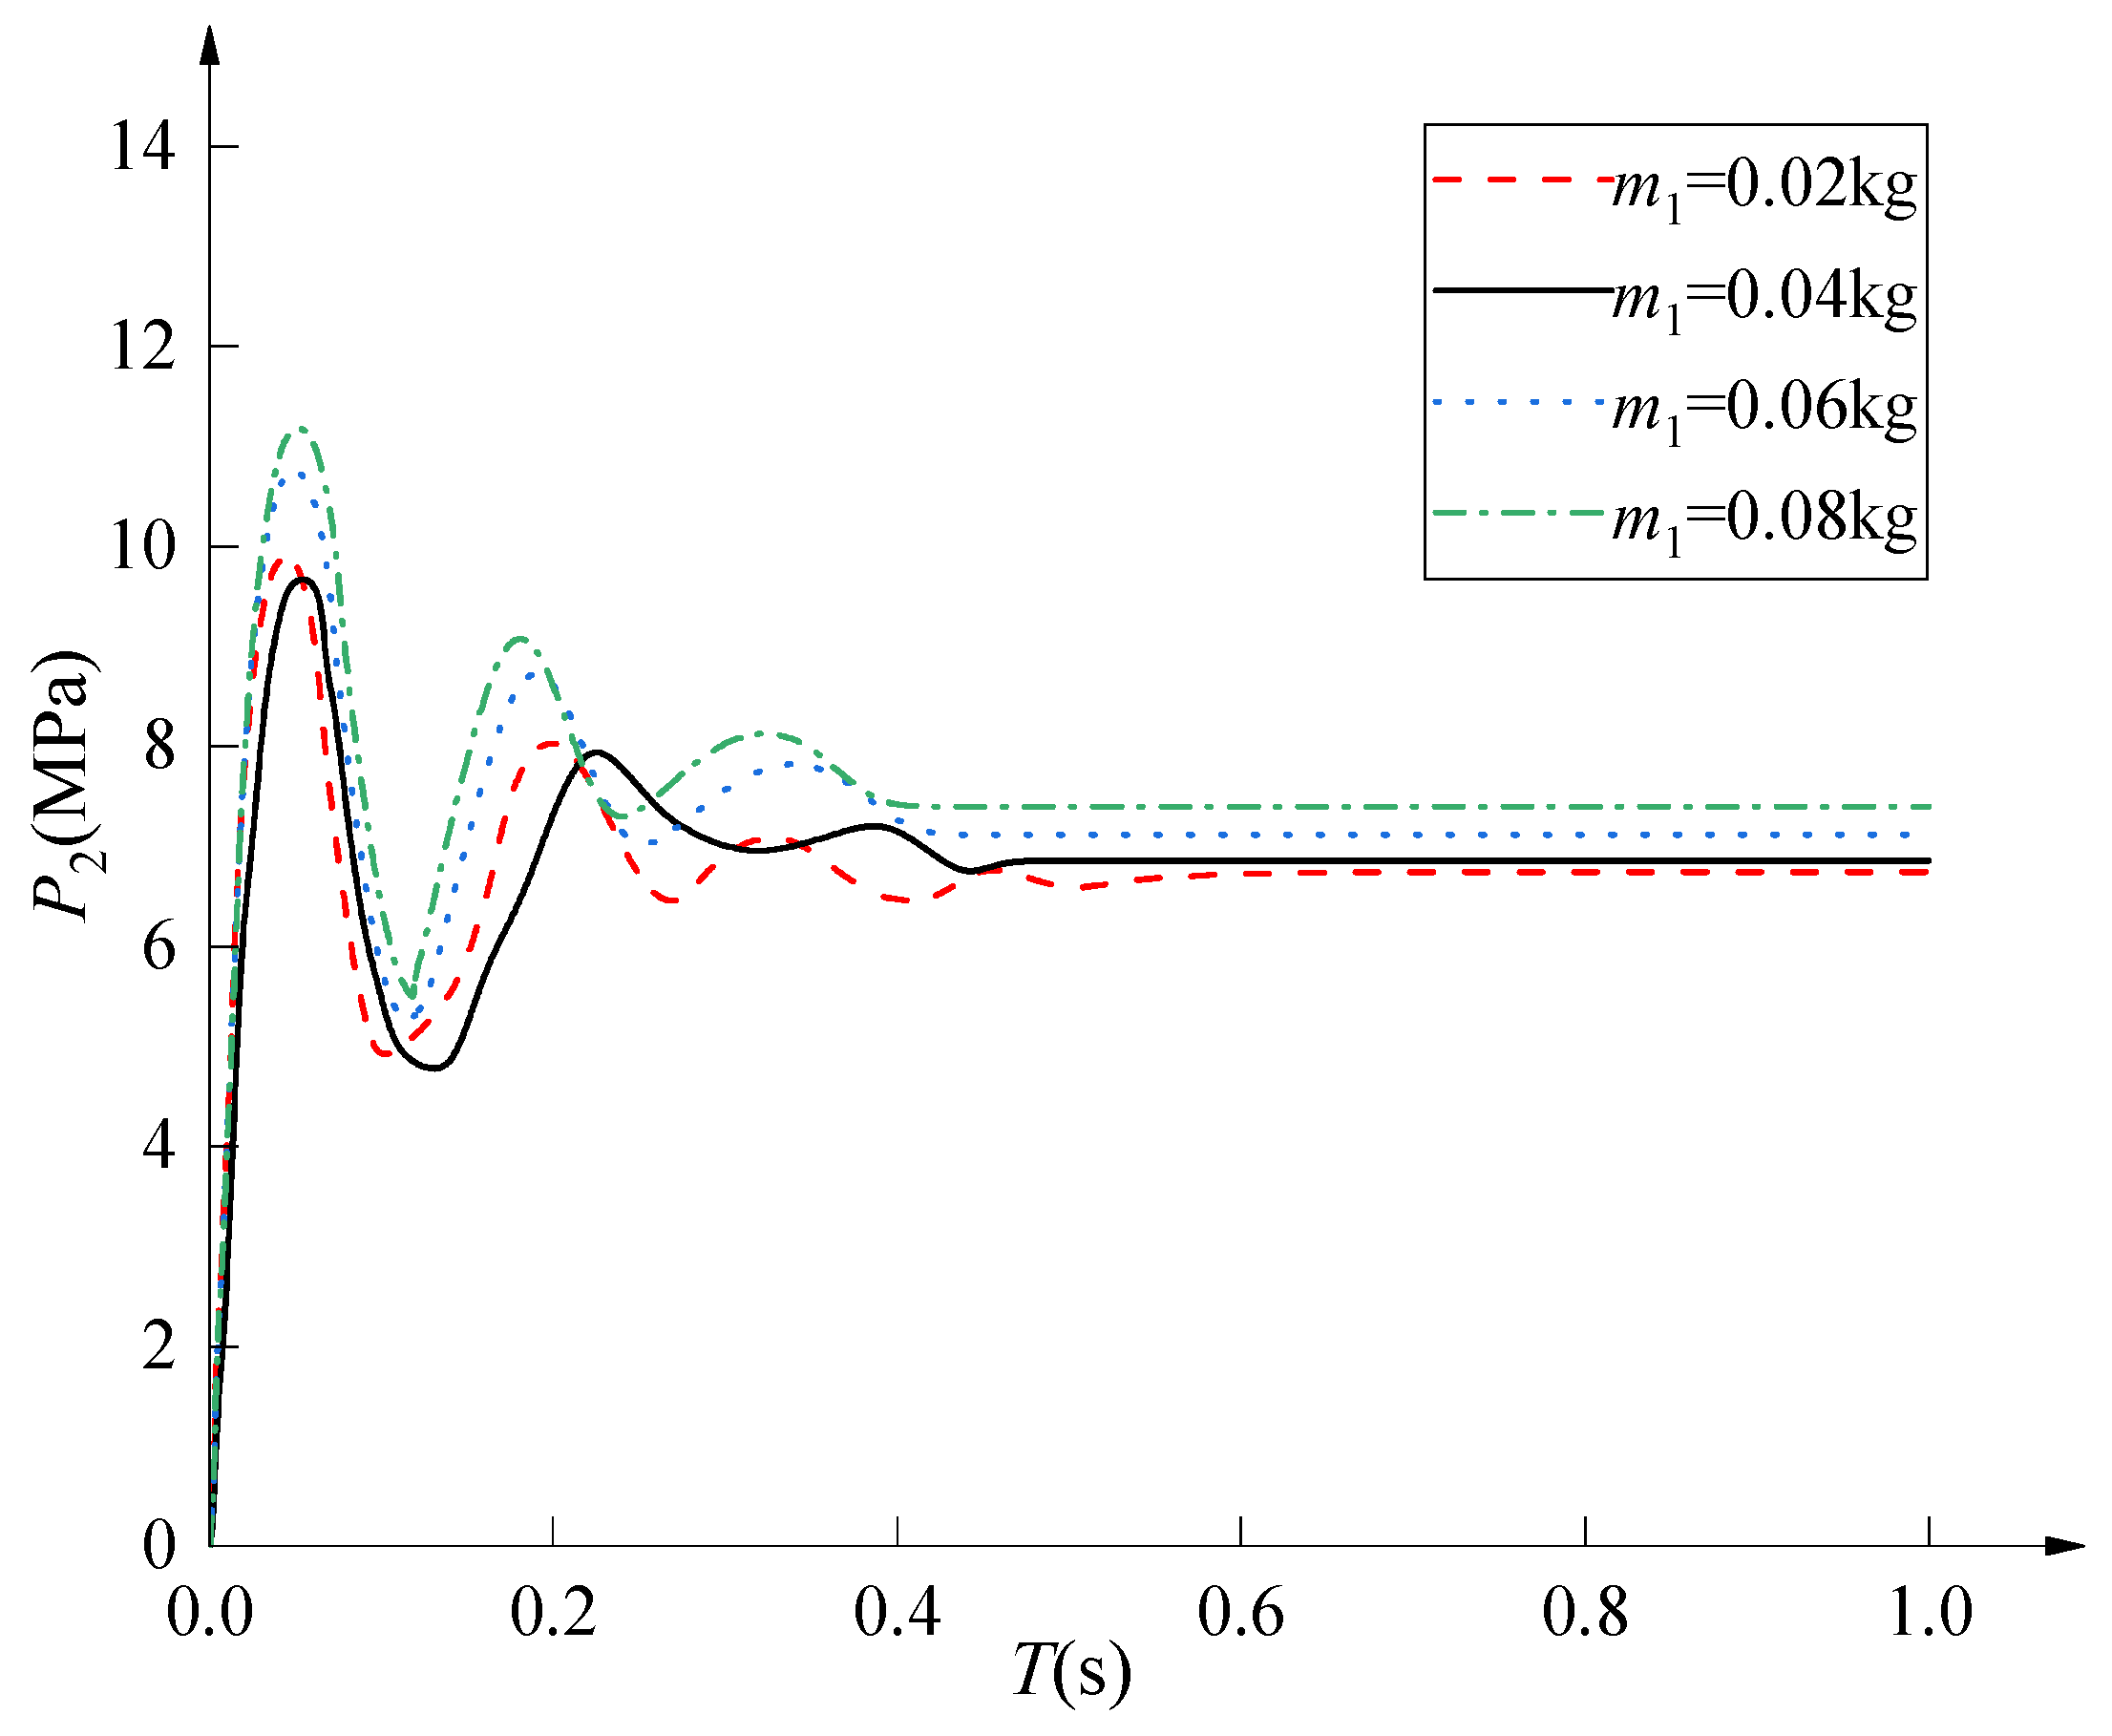
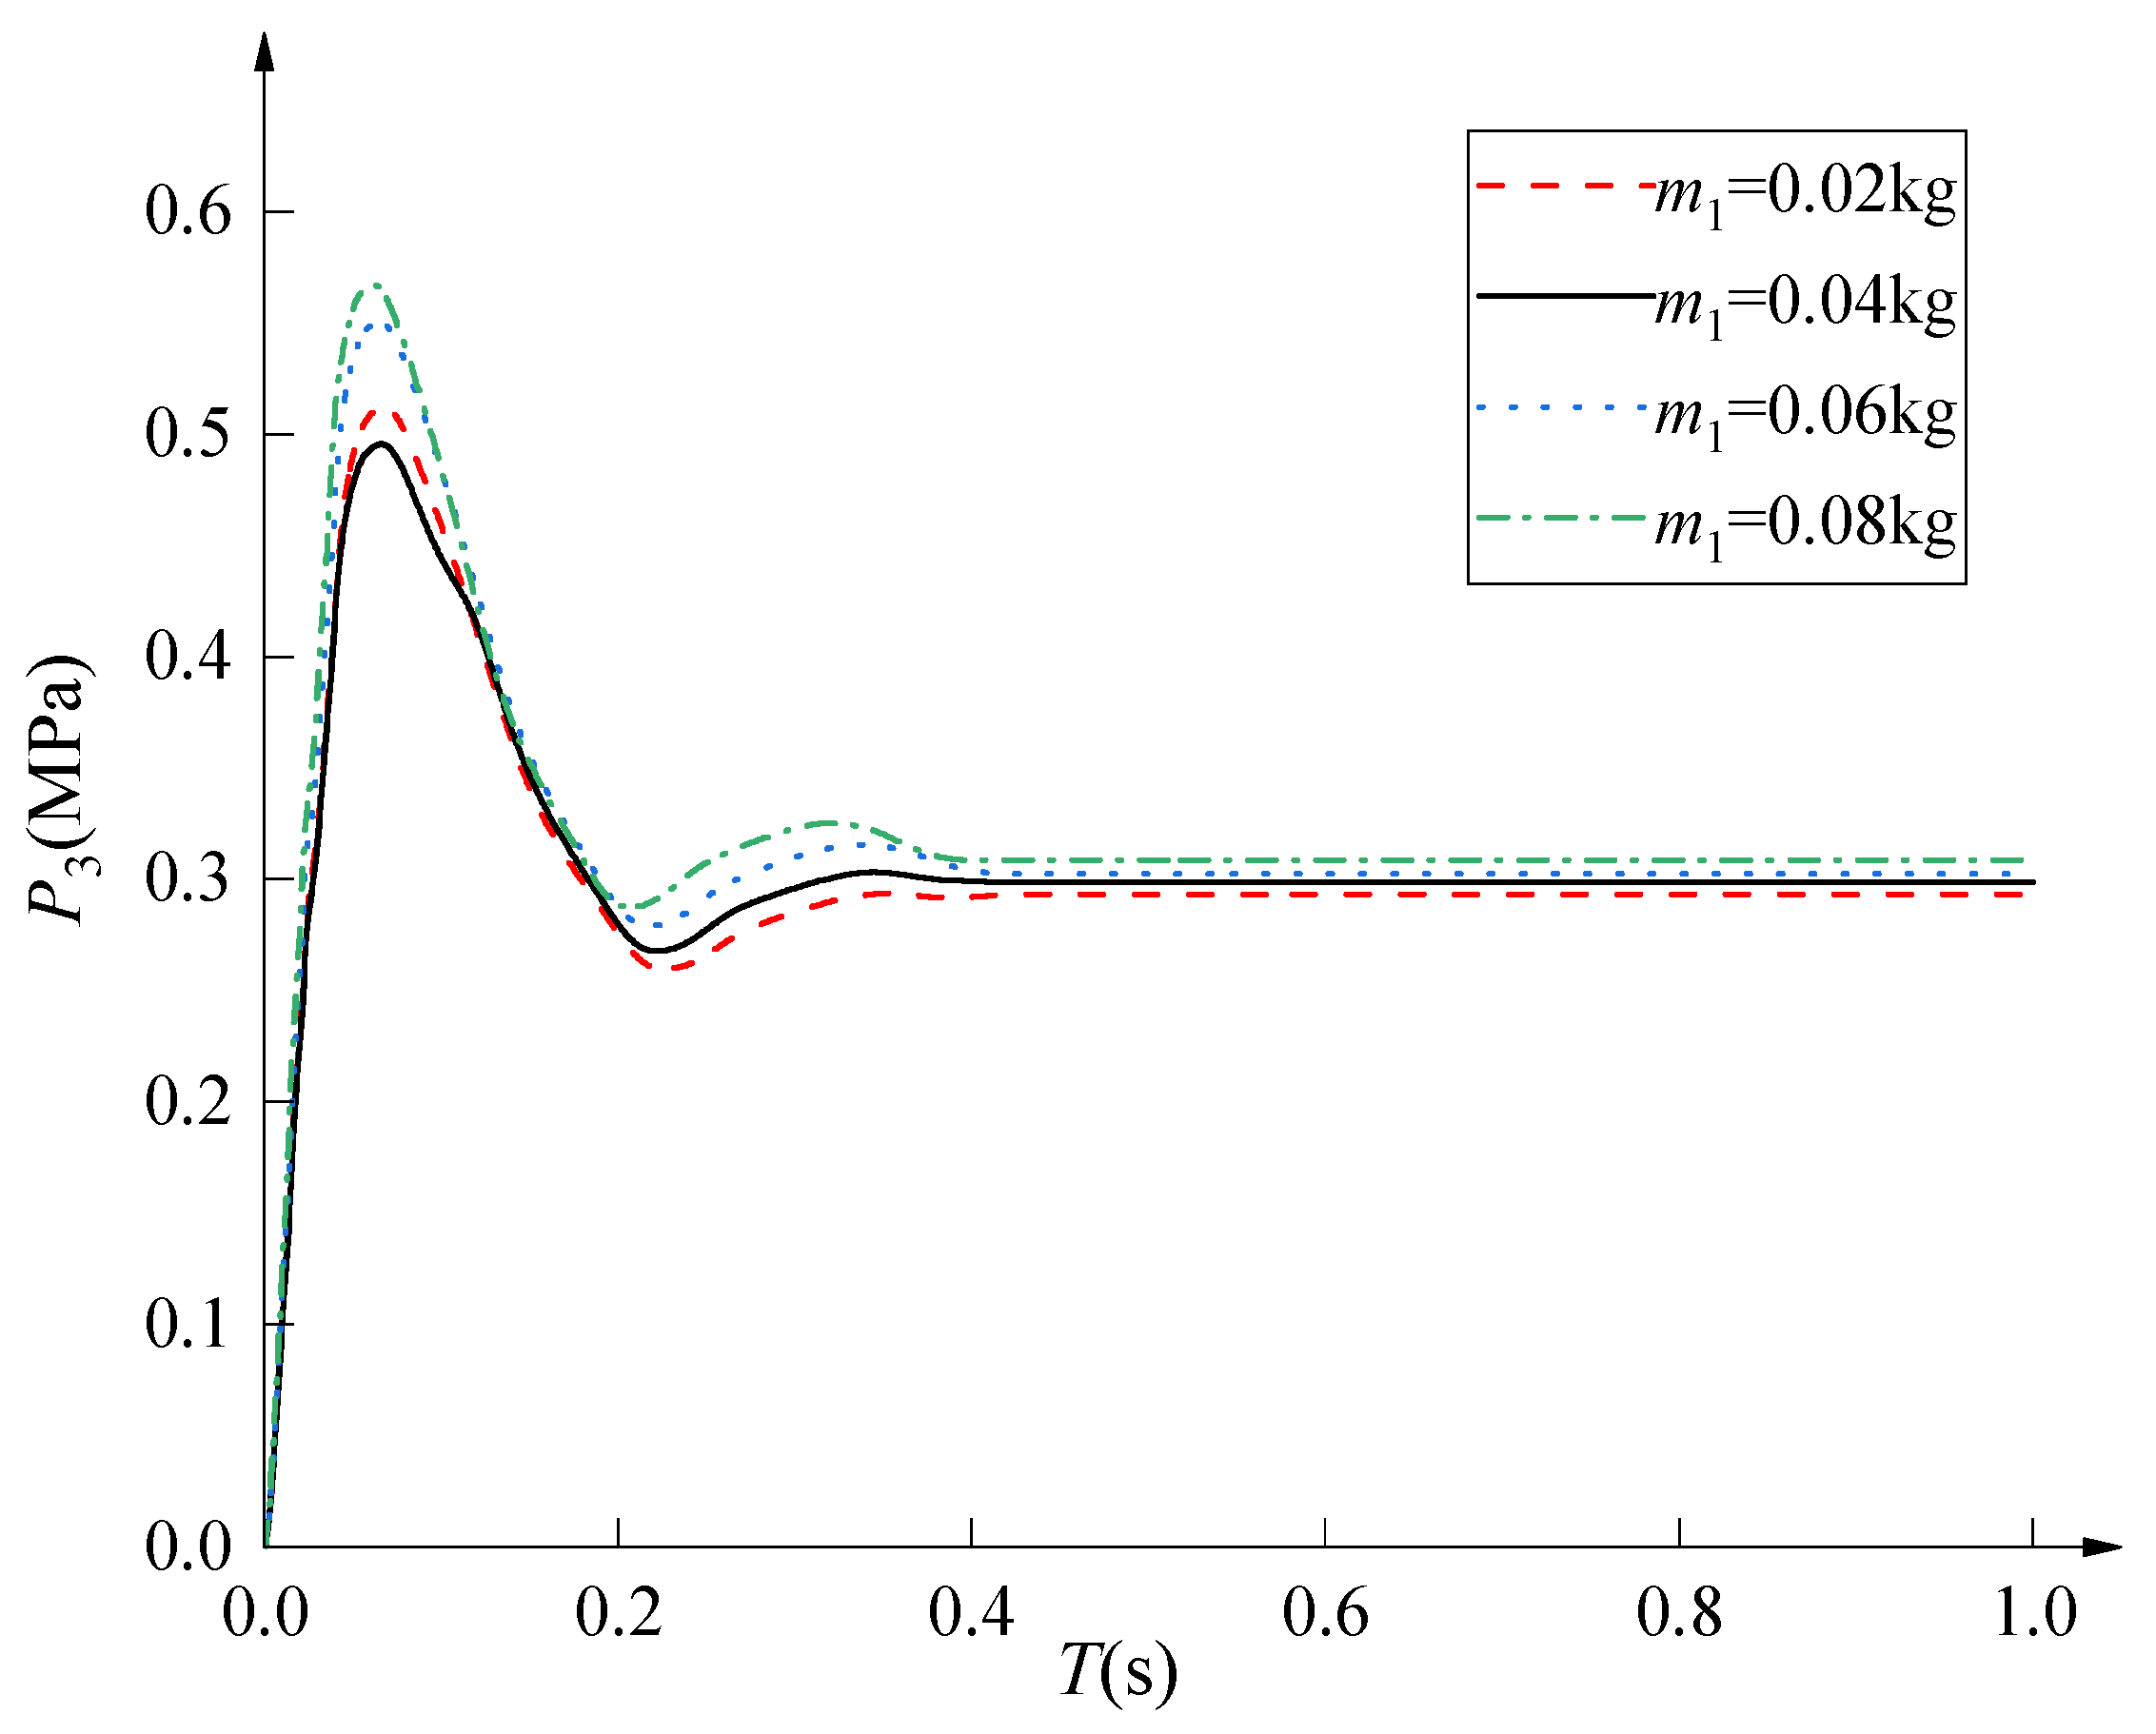
Based on the established simulation model of the two-stage hydrogen pressure-reducing valve, a simulation analysis of the dynamic characteristics was conducted for different values of the first-stage valve core mass. The simulations were performed with first-stage valve core mass values of 0.02 kg, 0.04 kg, 0.06 kg, and 0.08 kg, while keeping all other structural parameters constant. The simulation results are shown in Figure 15 and Figure 16. The figures indicate that as the first-stage valve core mass increases from 0.02 kg to 0.08 kg, the steady-state value of the second-stage valve outlet pressure continuously increases by 4.06%. Concurrently, the pressure peak value increases by 10.24%, the overshoot increases by 8.75%, and the dynamic response time decreases by 9.29%. When the first-stage valve core mass is relatively small, the system exhibits a longer dynamic response time and poorer dynamic response performance. As the first-stage valve core mass increases, the system response time shortens; however, the overshoot first decreases and then increases. Therefore, the first-stage valve core mass should be carefully determined. A mass that is too small leads to longer dynamic response times and inferior dynamic performance, while a mass that is too large results in increased overshoot, adversely affecting system stability.

4.3. Influence of First-Stage Valve Low-Pressure Chamber Volume on System Dynamic Characteristics

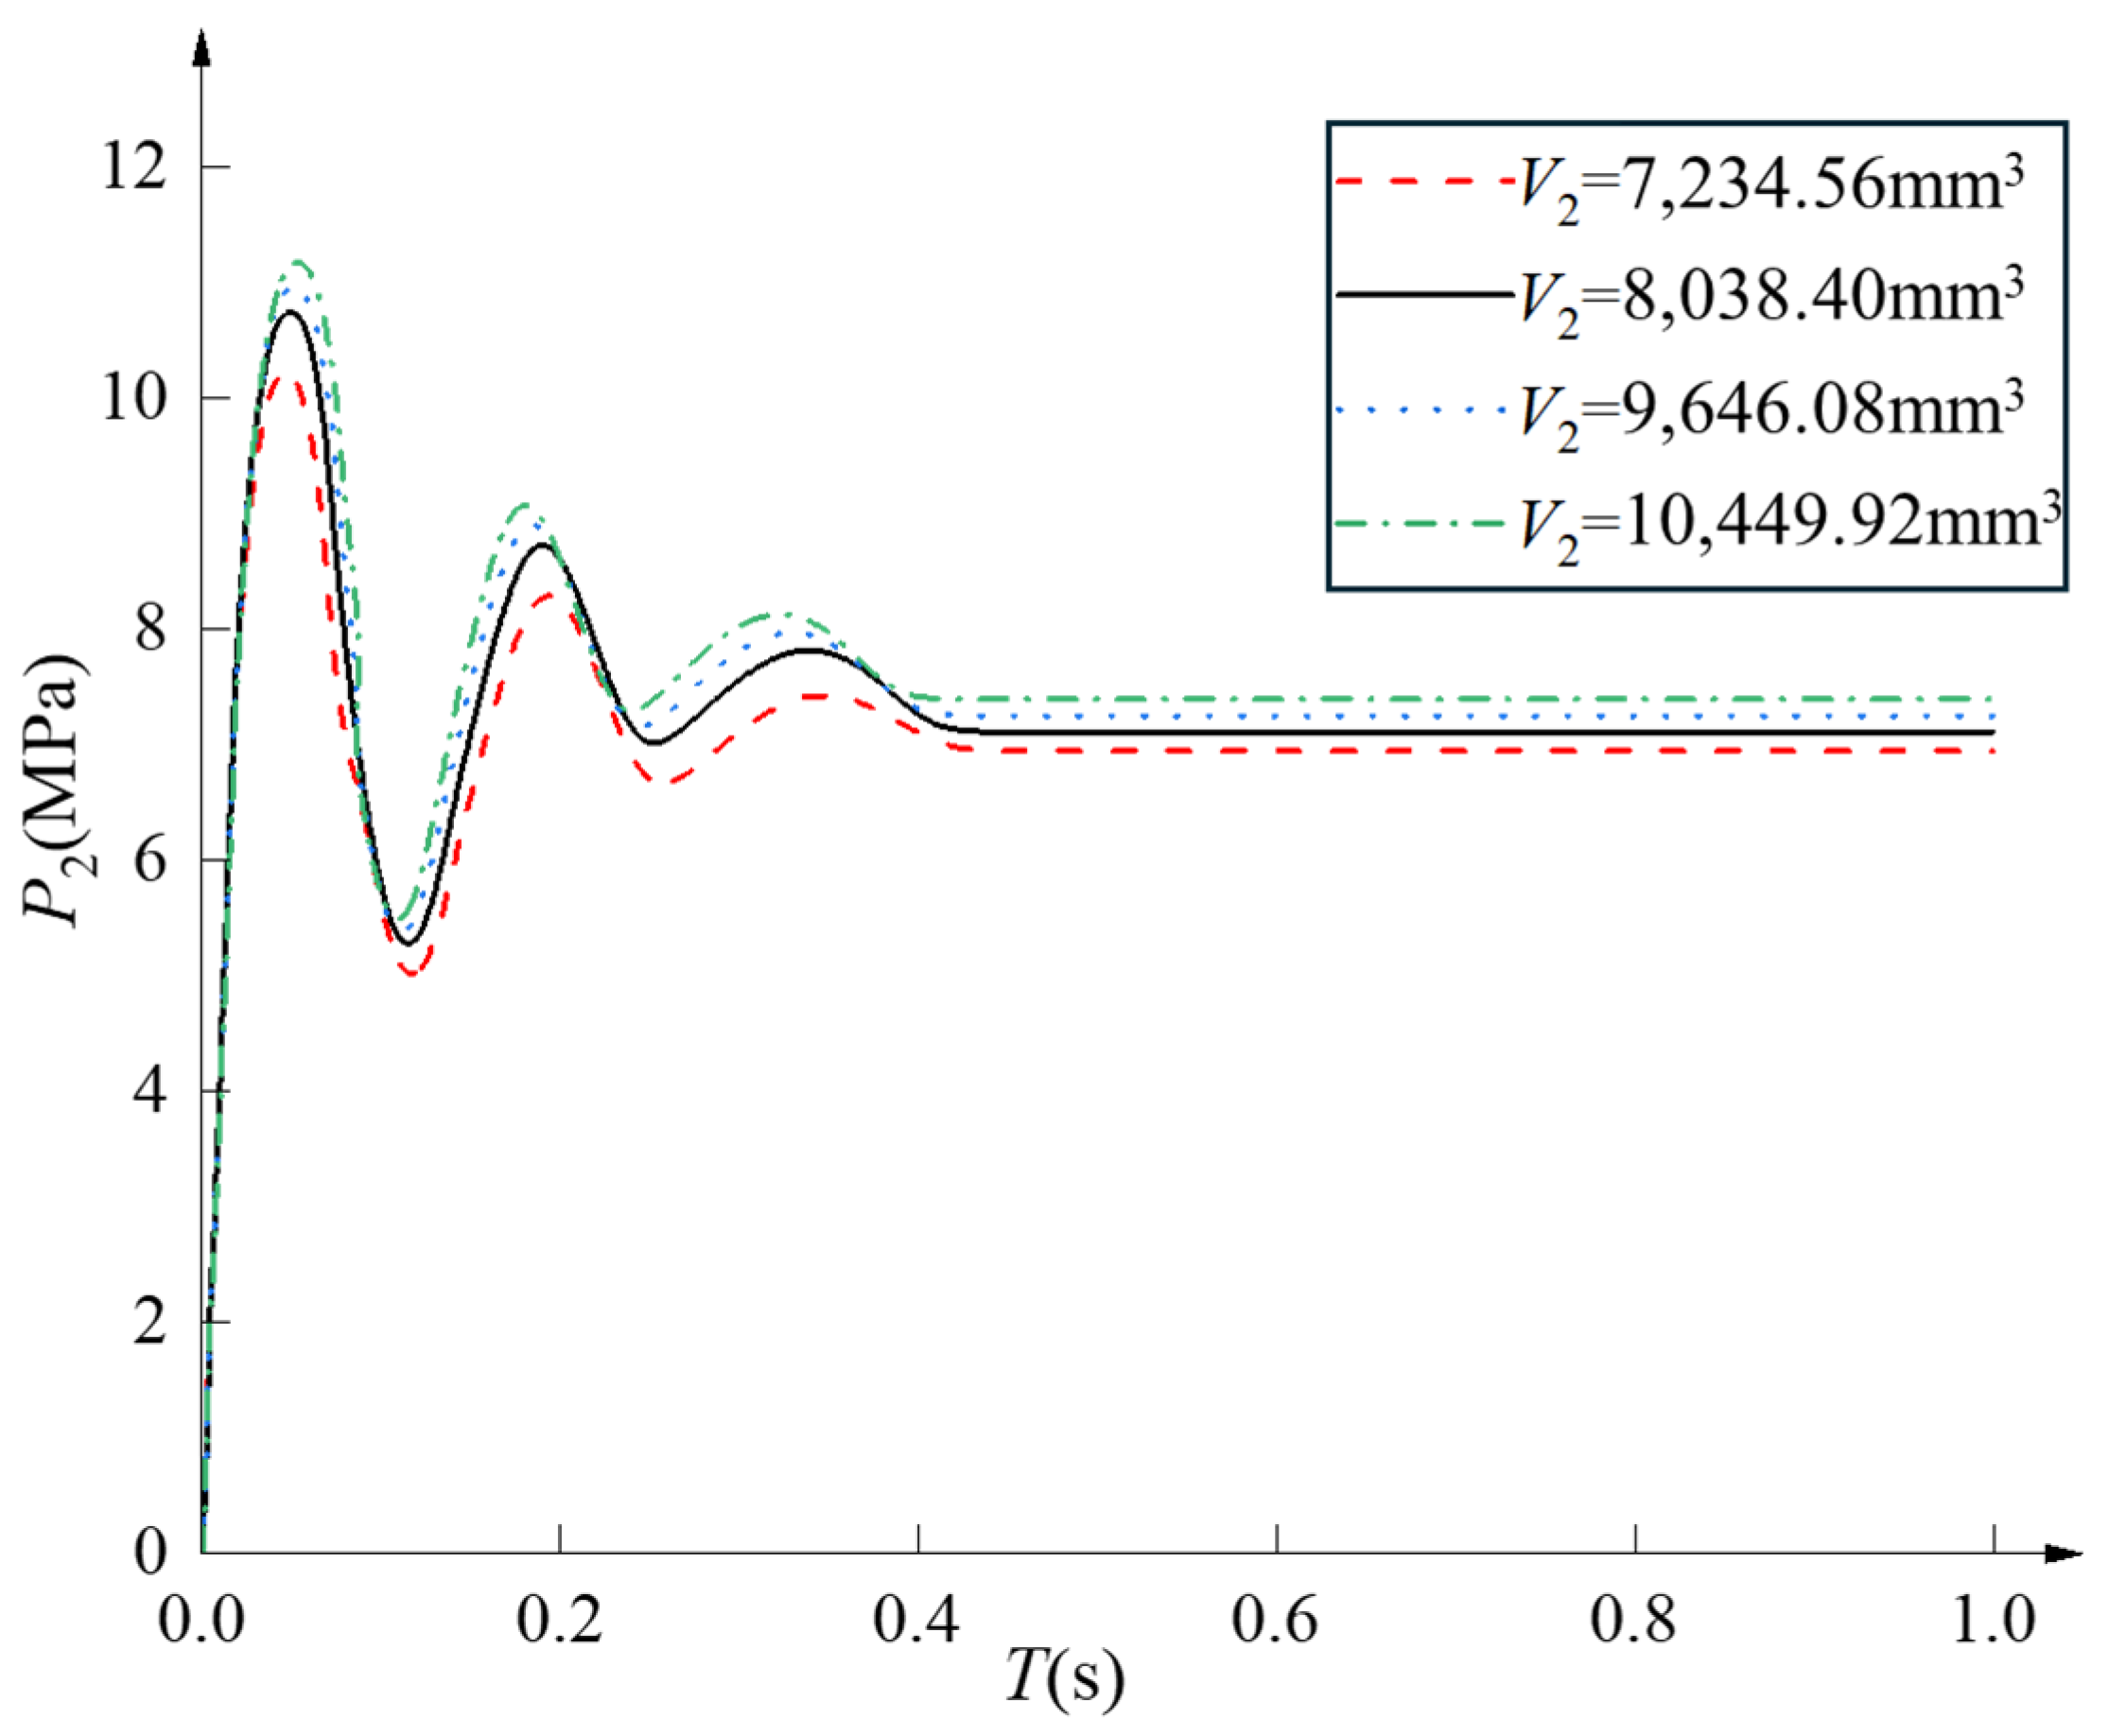
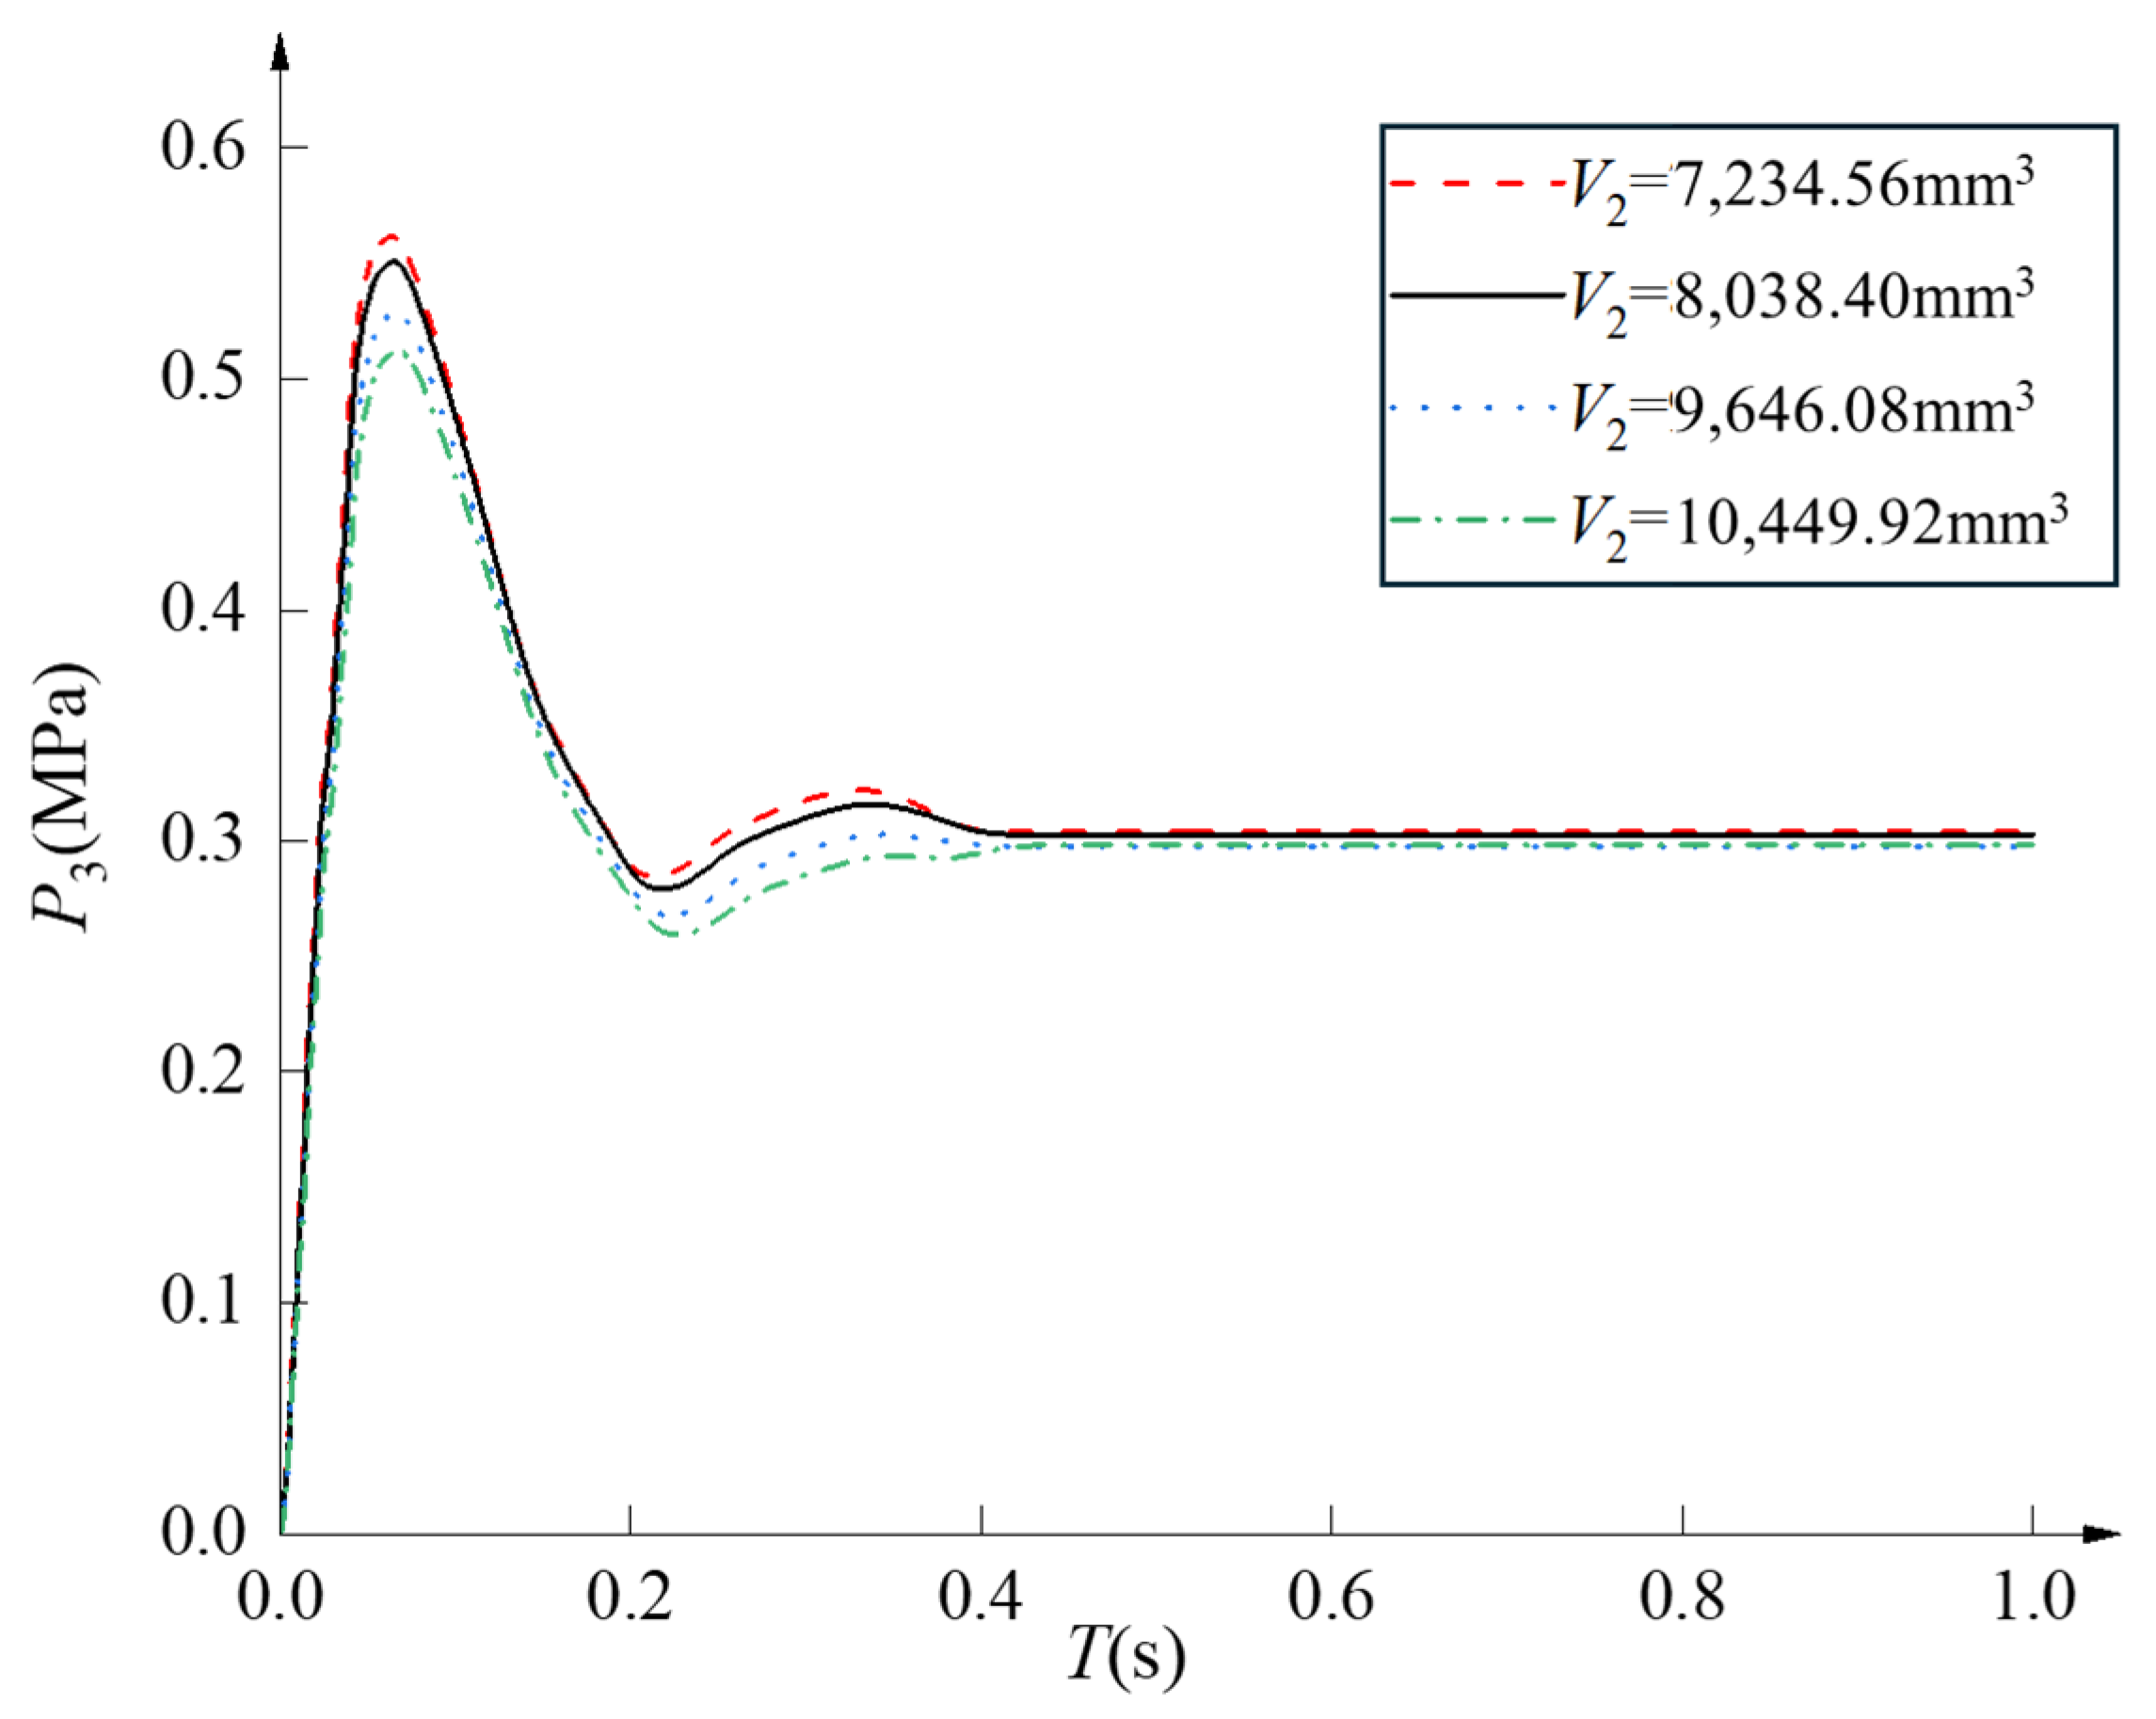
Based on the established simulation model of the two-stage hydrogen pressure-reducing valve, a simulation analysis of the dynamic characteristics was conducted for different volumes of the first-stage valve low-pressure chamber. Keeping other design parameters constant, simulations were performed for first-stage valve low-pressure chamber volumes of 7234.56 mm3, 8038.40 mm3, 9646.08 mm3, and 10,449.92 mm3. The simulation results are shown in Figure 17 and Figure 18. The figures indicate that as the first-stage valve low-pressure chamber volume increases from 7234.56 mm3 to 10,449.92 mm3, the steady-state value of the system outlet pressure remains largely unchanged. However, the pressure peak value decreases by 7.92%, the overshoot decreases by 8.84%, and the dynamic response time increases by 5.77%. Furthermore, with an increase in the first-stage valve low-pressure chamber volume, the steady-state value of the first-stage valve outlet pressure increases, accompanied by a larger overshoot, a longer time to reach the pressure peak, and a shorter dynamic response time. In contrast, for the system (second-stage) outlet pressure, the steady-state value remains essentially constant, the overshoot decreases, the time to reach the pressure peak increases, and the dynamic response time lengthens. Therefore, appropriately reducing the volume of the first-stage valve low-pressure chamber can improve the dynamic stability performance of the two-stage hydrogen pressure-reducing valve.

4.4. Influence of Second-Stage Valve Main Spring Stiffness on System Dynamic Characteristics

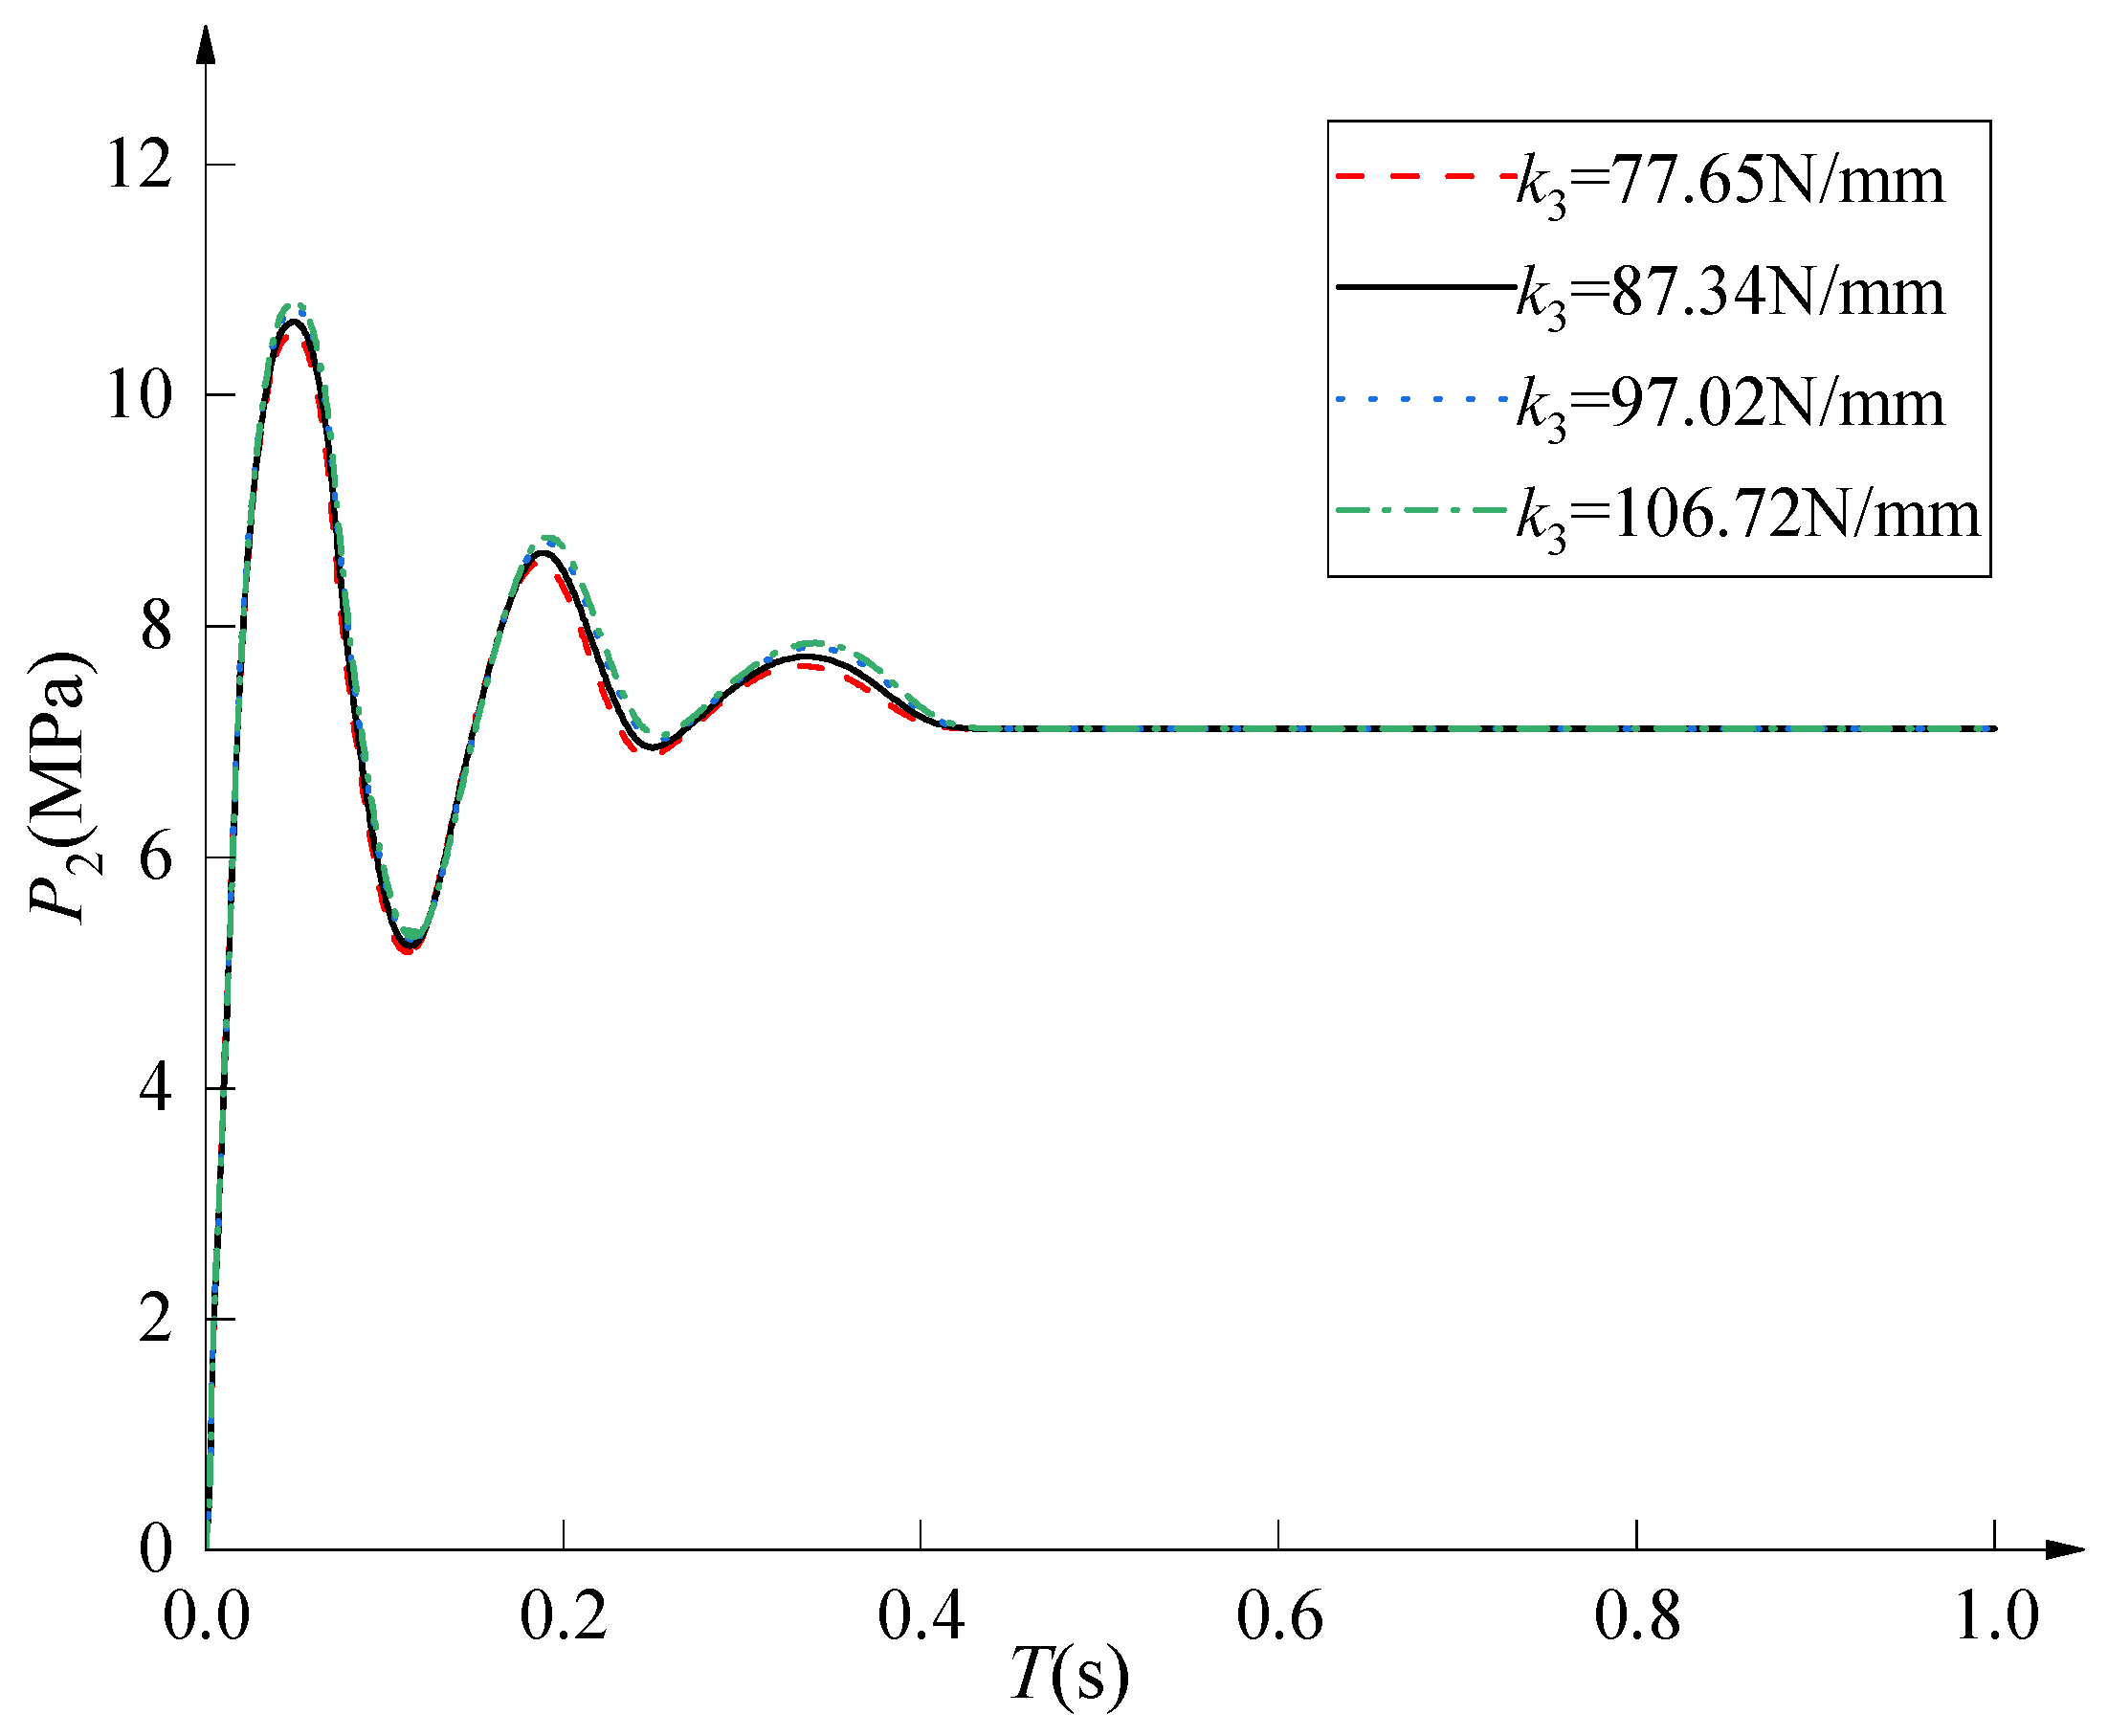
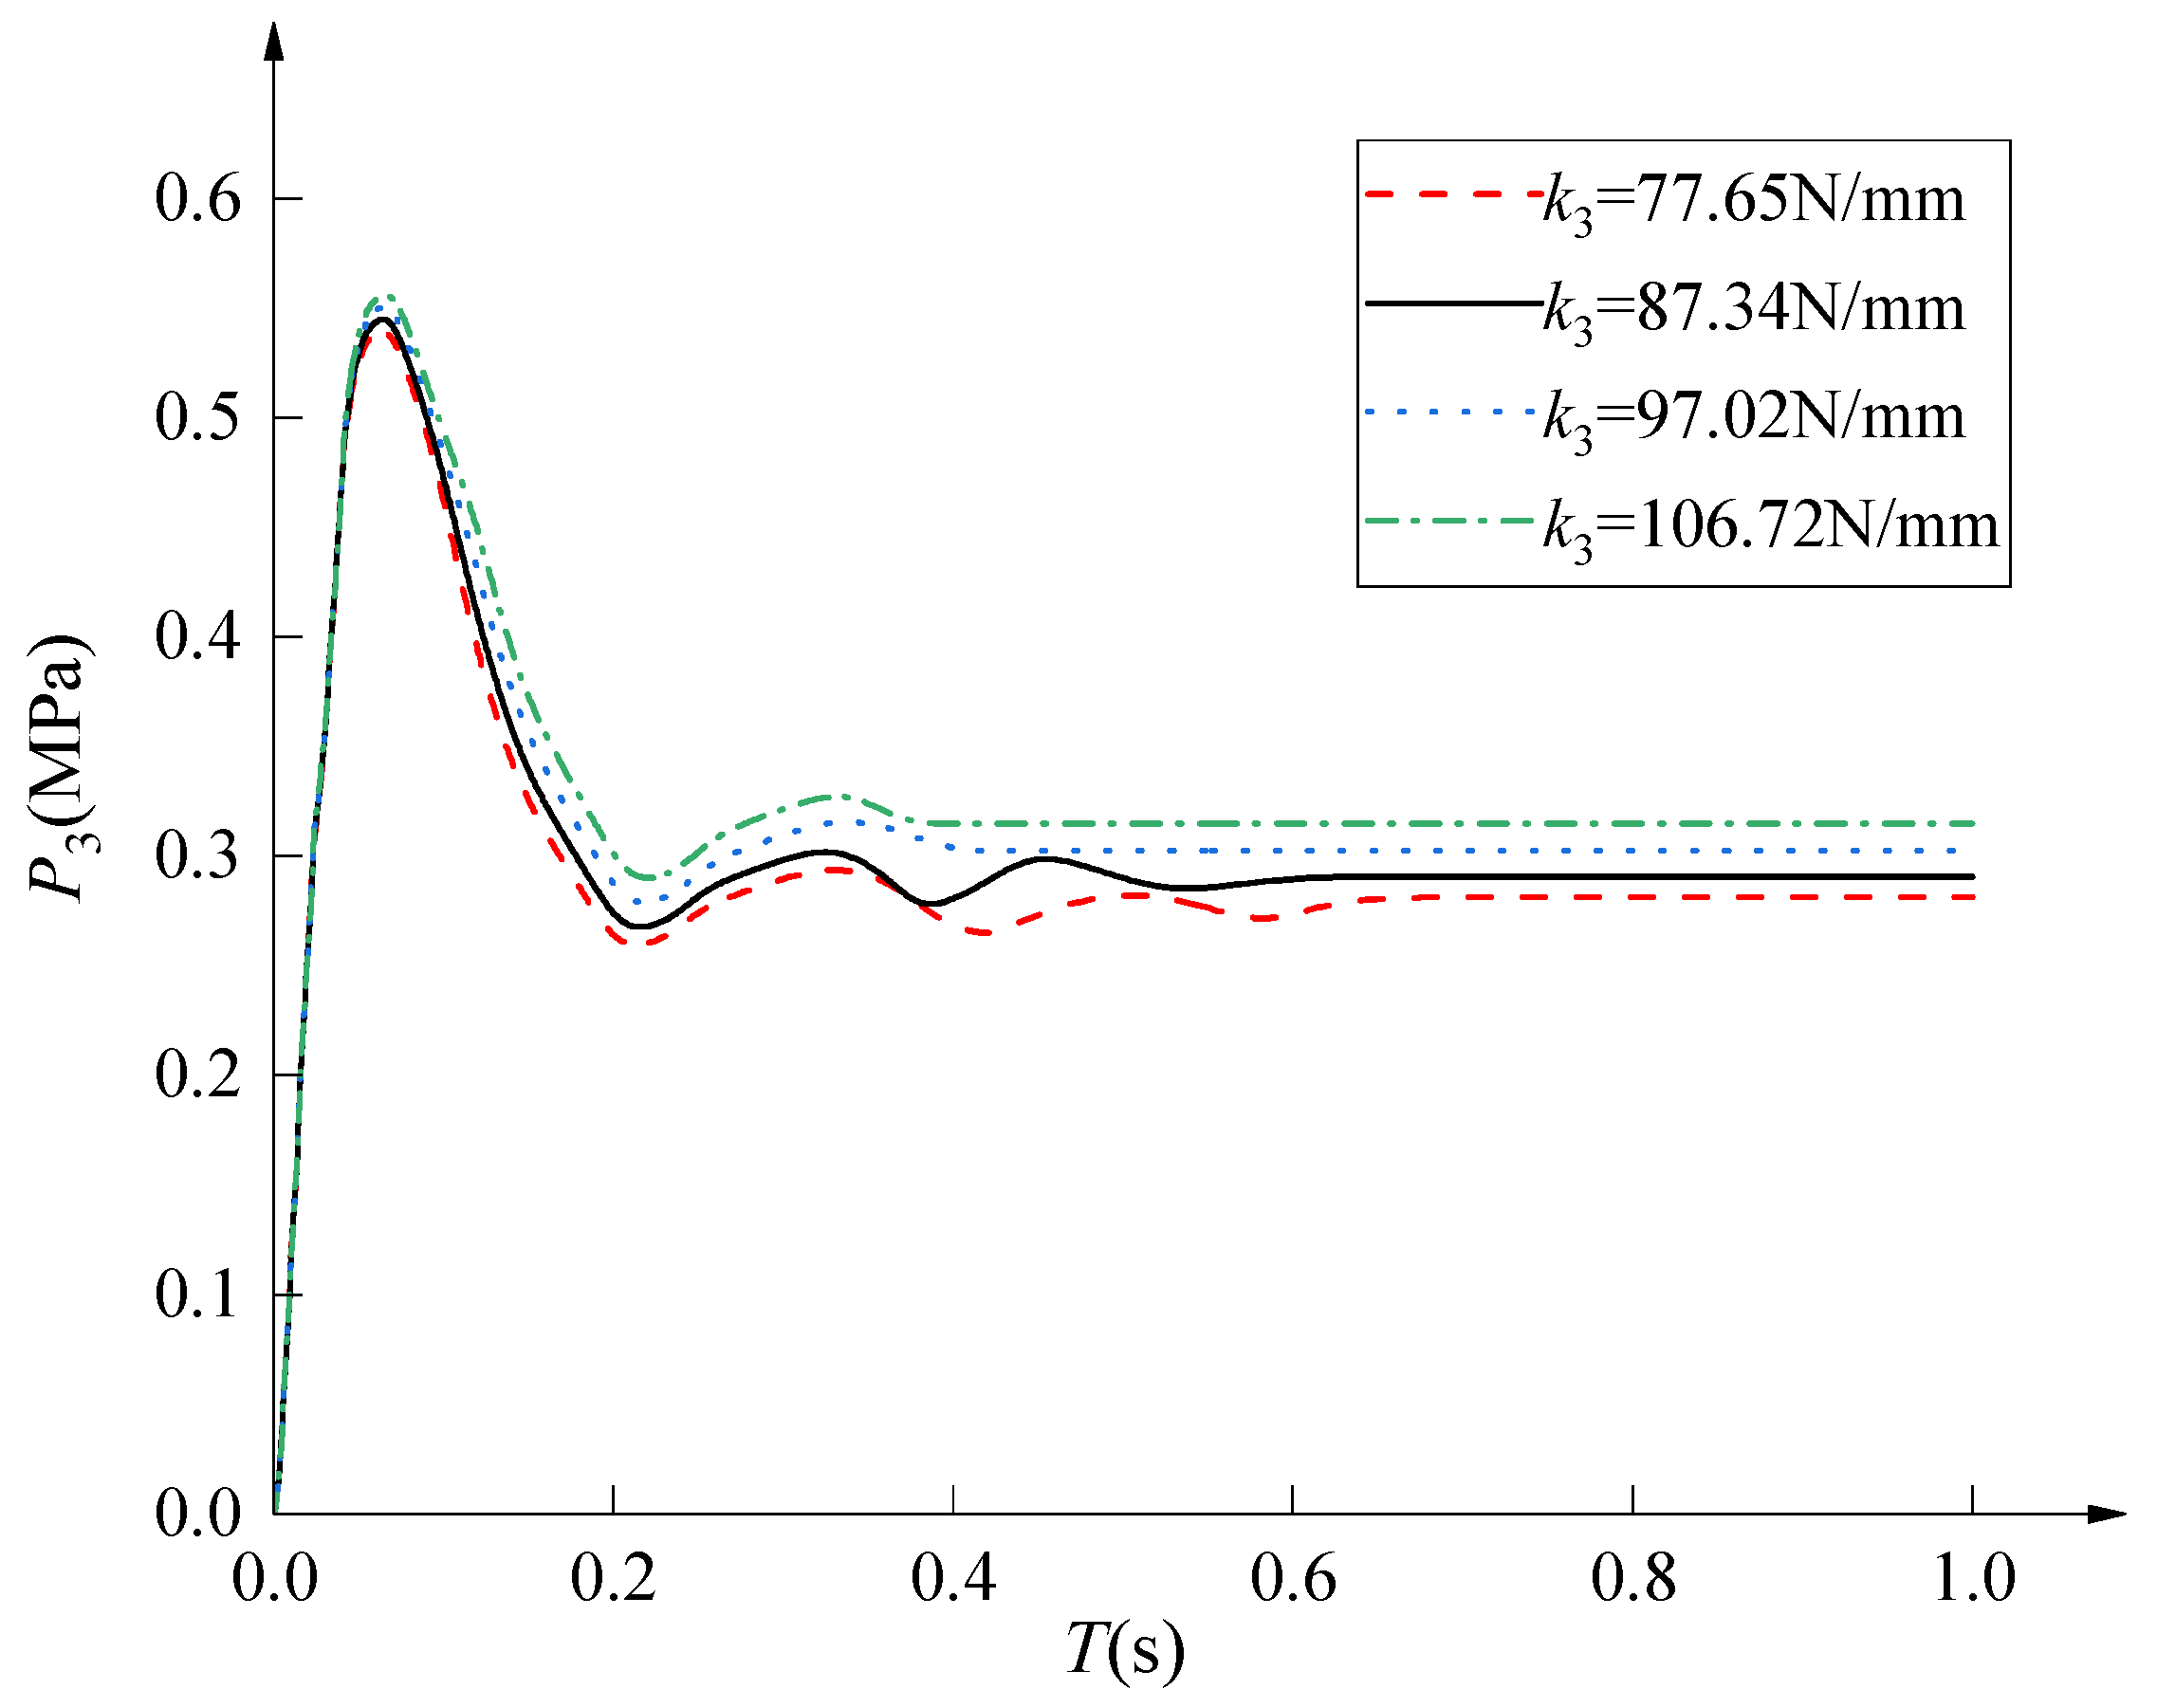
Based on the established simulation model of the two-stage hydrogen pressure-reducing valve, a simulation analysis of the dynamic characteristics was conducted for different values of the second-stage valve main spring stiffness. Keeping all other structural parameters constant, simulations were performed for second-stage valve main spring stiffness values of 77.65 N/mm, 87.34 N/mm, 97.02 N/mm, and 106.72 N/mm. The simulation results are shown in Figure 19 and Figure 20. These figures reveal that variations in the second-stage valve main spring stiffness have a minor influence on the outlet pressure of the first-stage valve, but exert a significant impact on the dynamic characteristics of the system (second-stage) outlet pressure. As the second-stage valve spring stiffness increases, the steady-state value of the system outlet pressure gradually increases, while the outlet pressure overshoot decreases and the dynamic response time shortens, leading to a notable improvement in system stability. Therefore, the main spring stiffness of the second-stage valve should be carefully selected during the design phase to ensure that the outlet pressure closely approximates the design specification, thereby guaranteeing both system stability and dynamic response performance.

4.5. Influence of Second-Stage Valve Core Mass on System Dynamic Characteristics

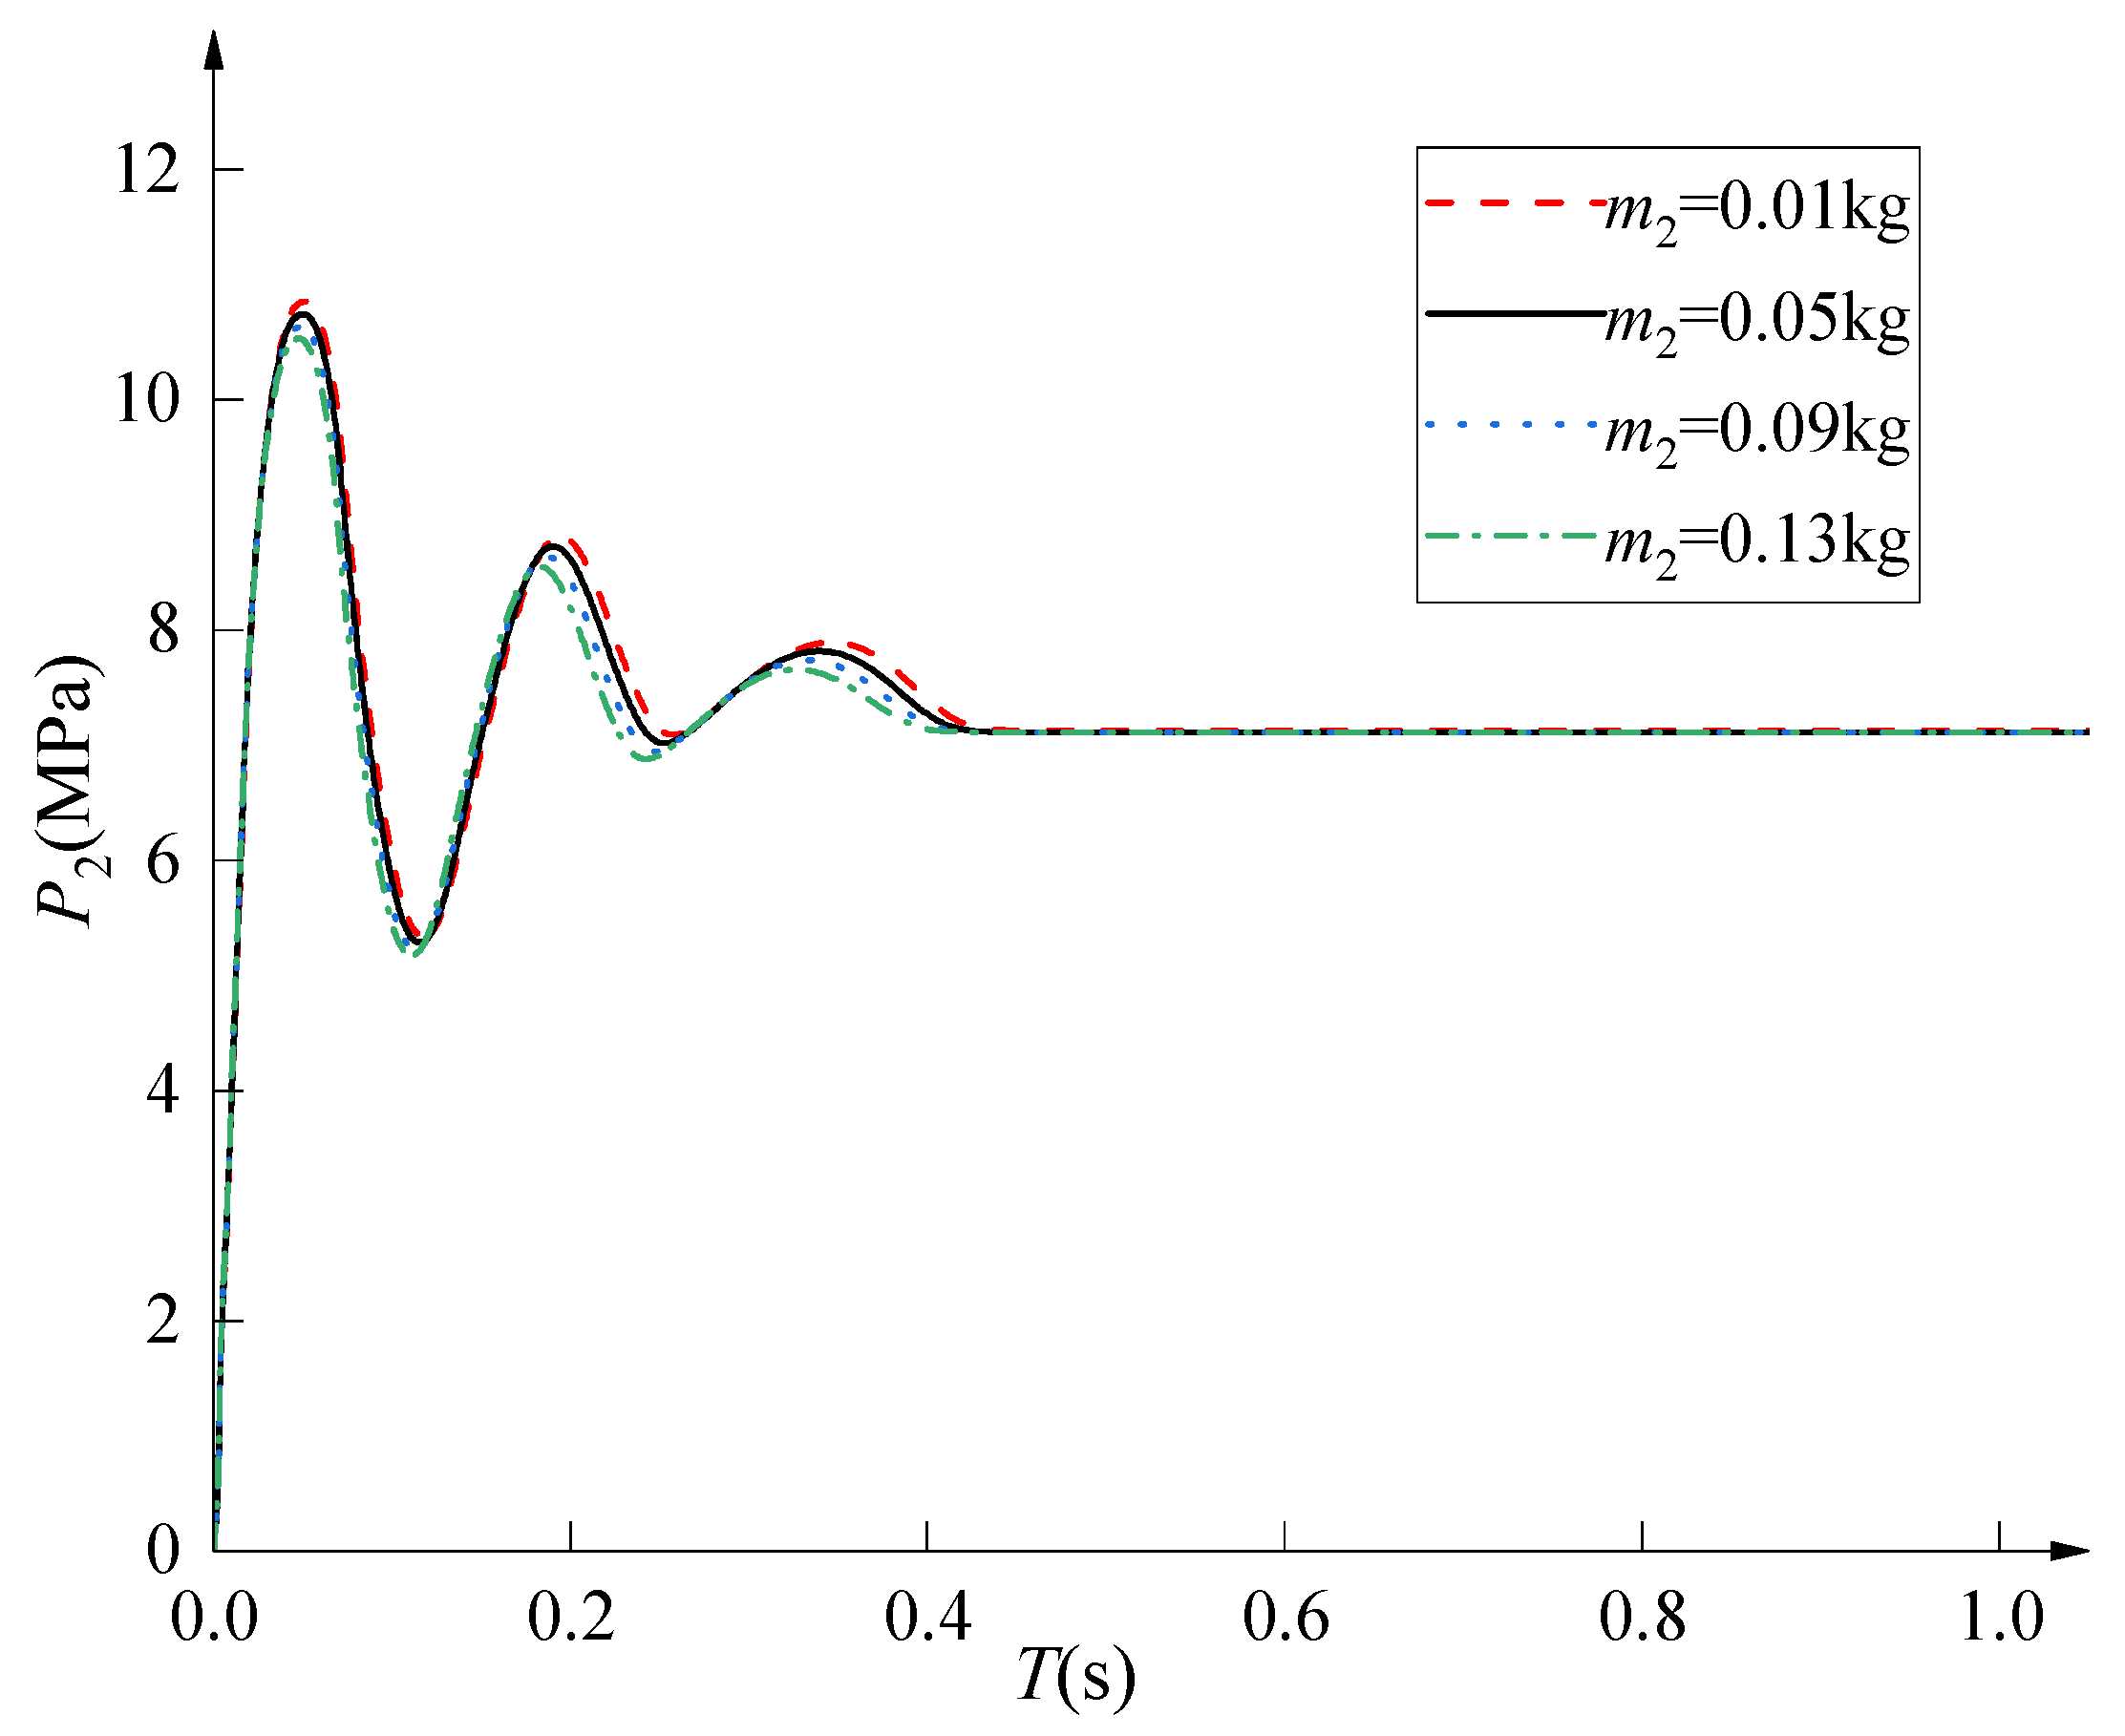
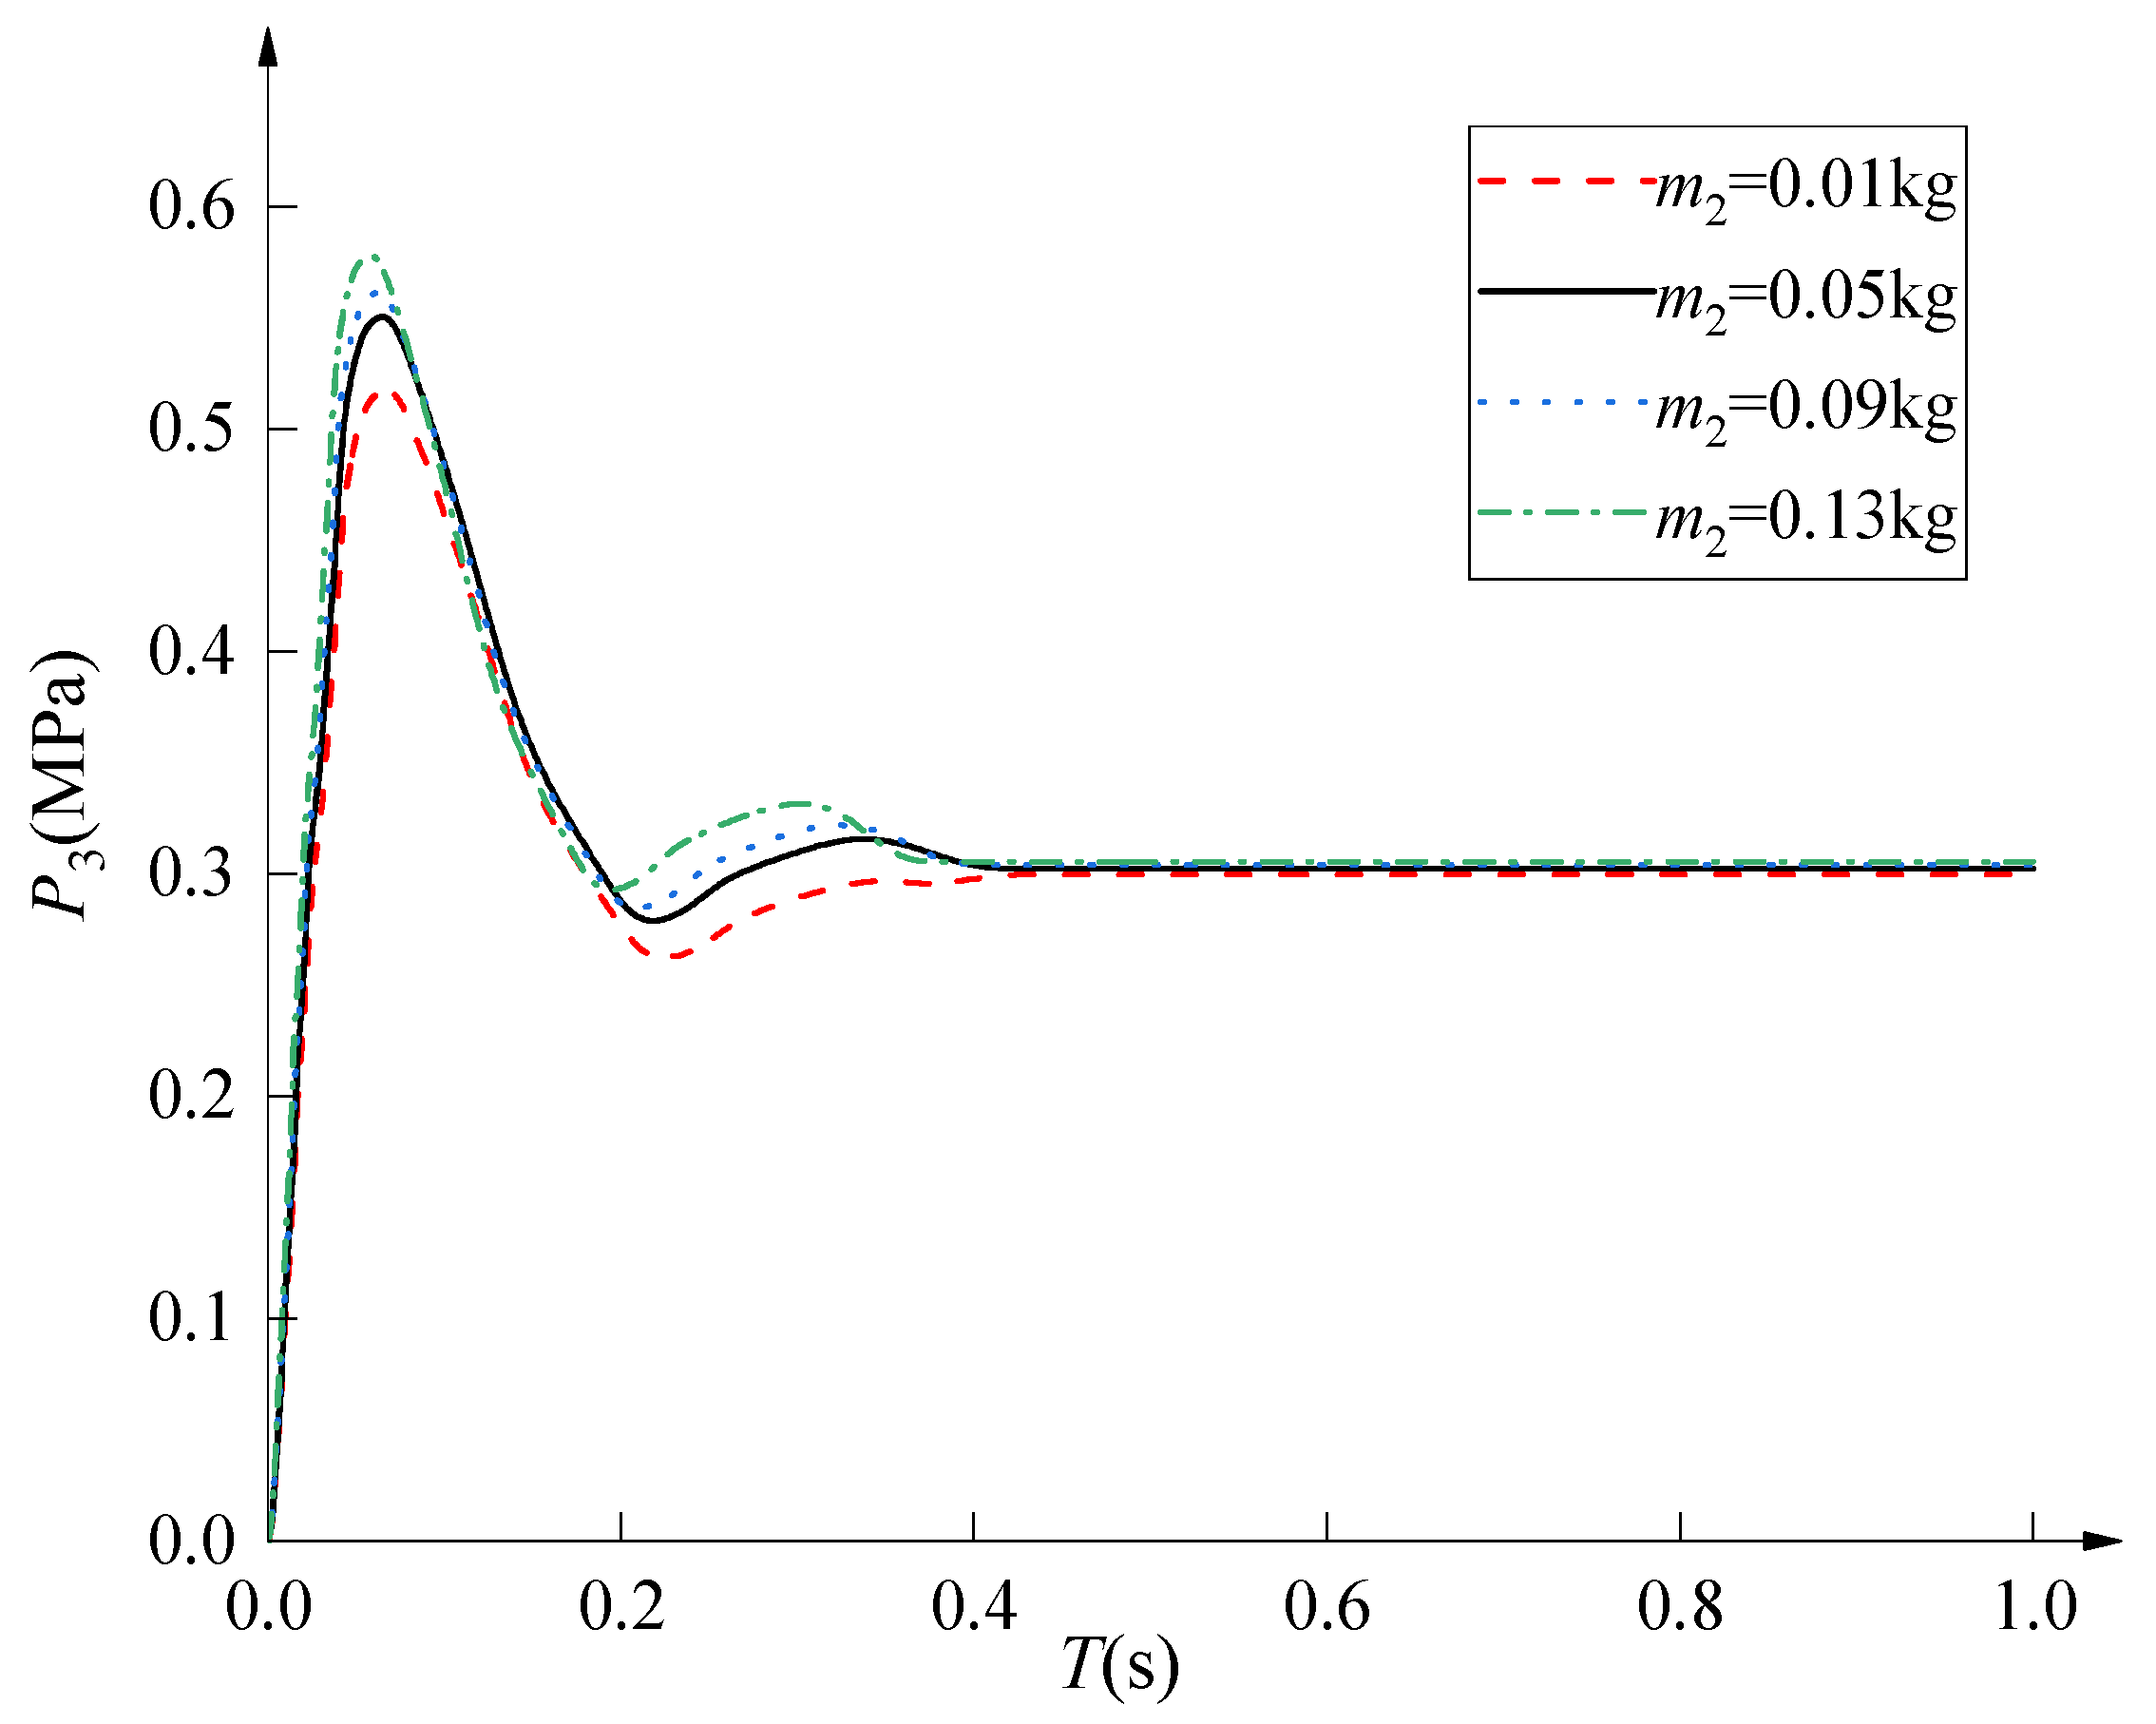
Based on the established simulation model of the two-stage hydrogen pressure-reducing valve, a simulation analysis of the dynamic characteristics was conducted for different values of the second-stage valve core mass. Keeping all other structural parameters constant, simulations were performed for second-stage valve core mass values of 0.01 kg, 0.05 kg, 0.09 kg, and 0.13 kg. The simulation results are shown in Figure 21 and Figure 22. These figures reveal that variations in the second-stage valve core mass have a minor influence on the outlet pressure of the first-stage valve, while exerting a considerable impact on the dynamic characteristics of the system outlet pressure. As the second-stage valve core mass increases, the steady-state value of the system outlet pressure remains largely unchanged. However, the dynamic response time shortens, whereas the pressure peak value and the overshoot increase. Therefore, the mass of the second-stage valve core should be carefully determined. A mass that is too small leads to a longer dynamic response time and inferior dynamic performance, while a mass that is too large results in increased overshoot, adversely affecting system stability.

4.6. Influence of Second-Stage Valve Feedback Orifice Area on System Dynamic Characteristics

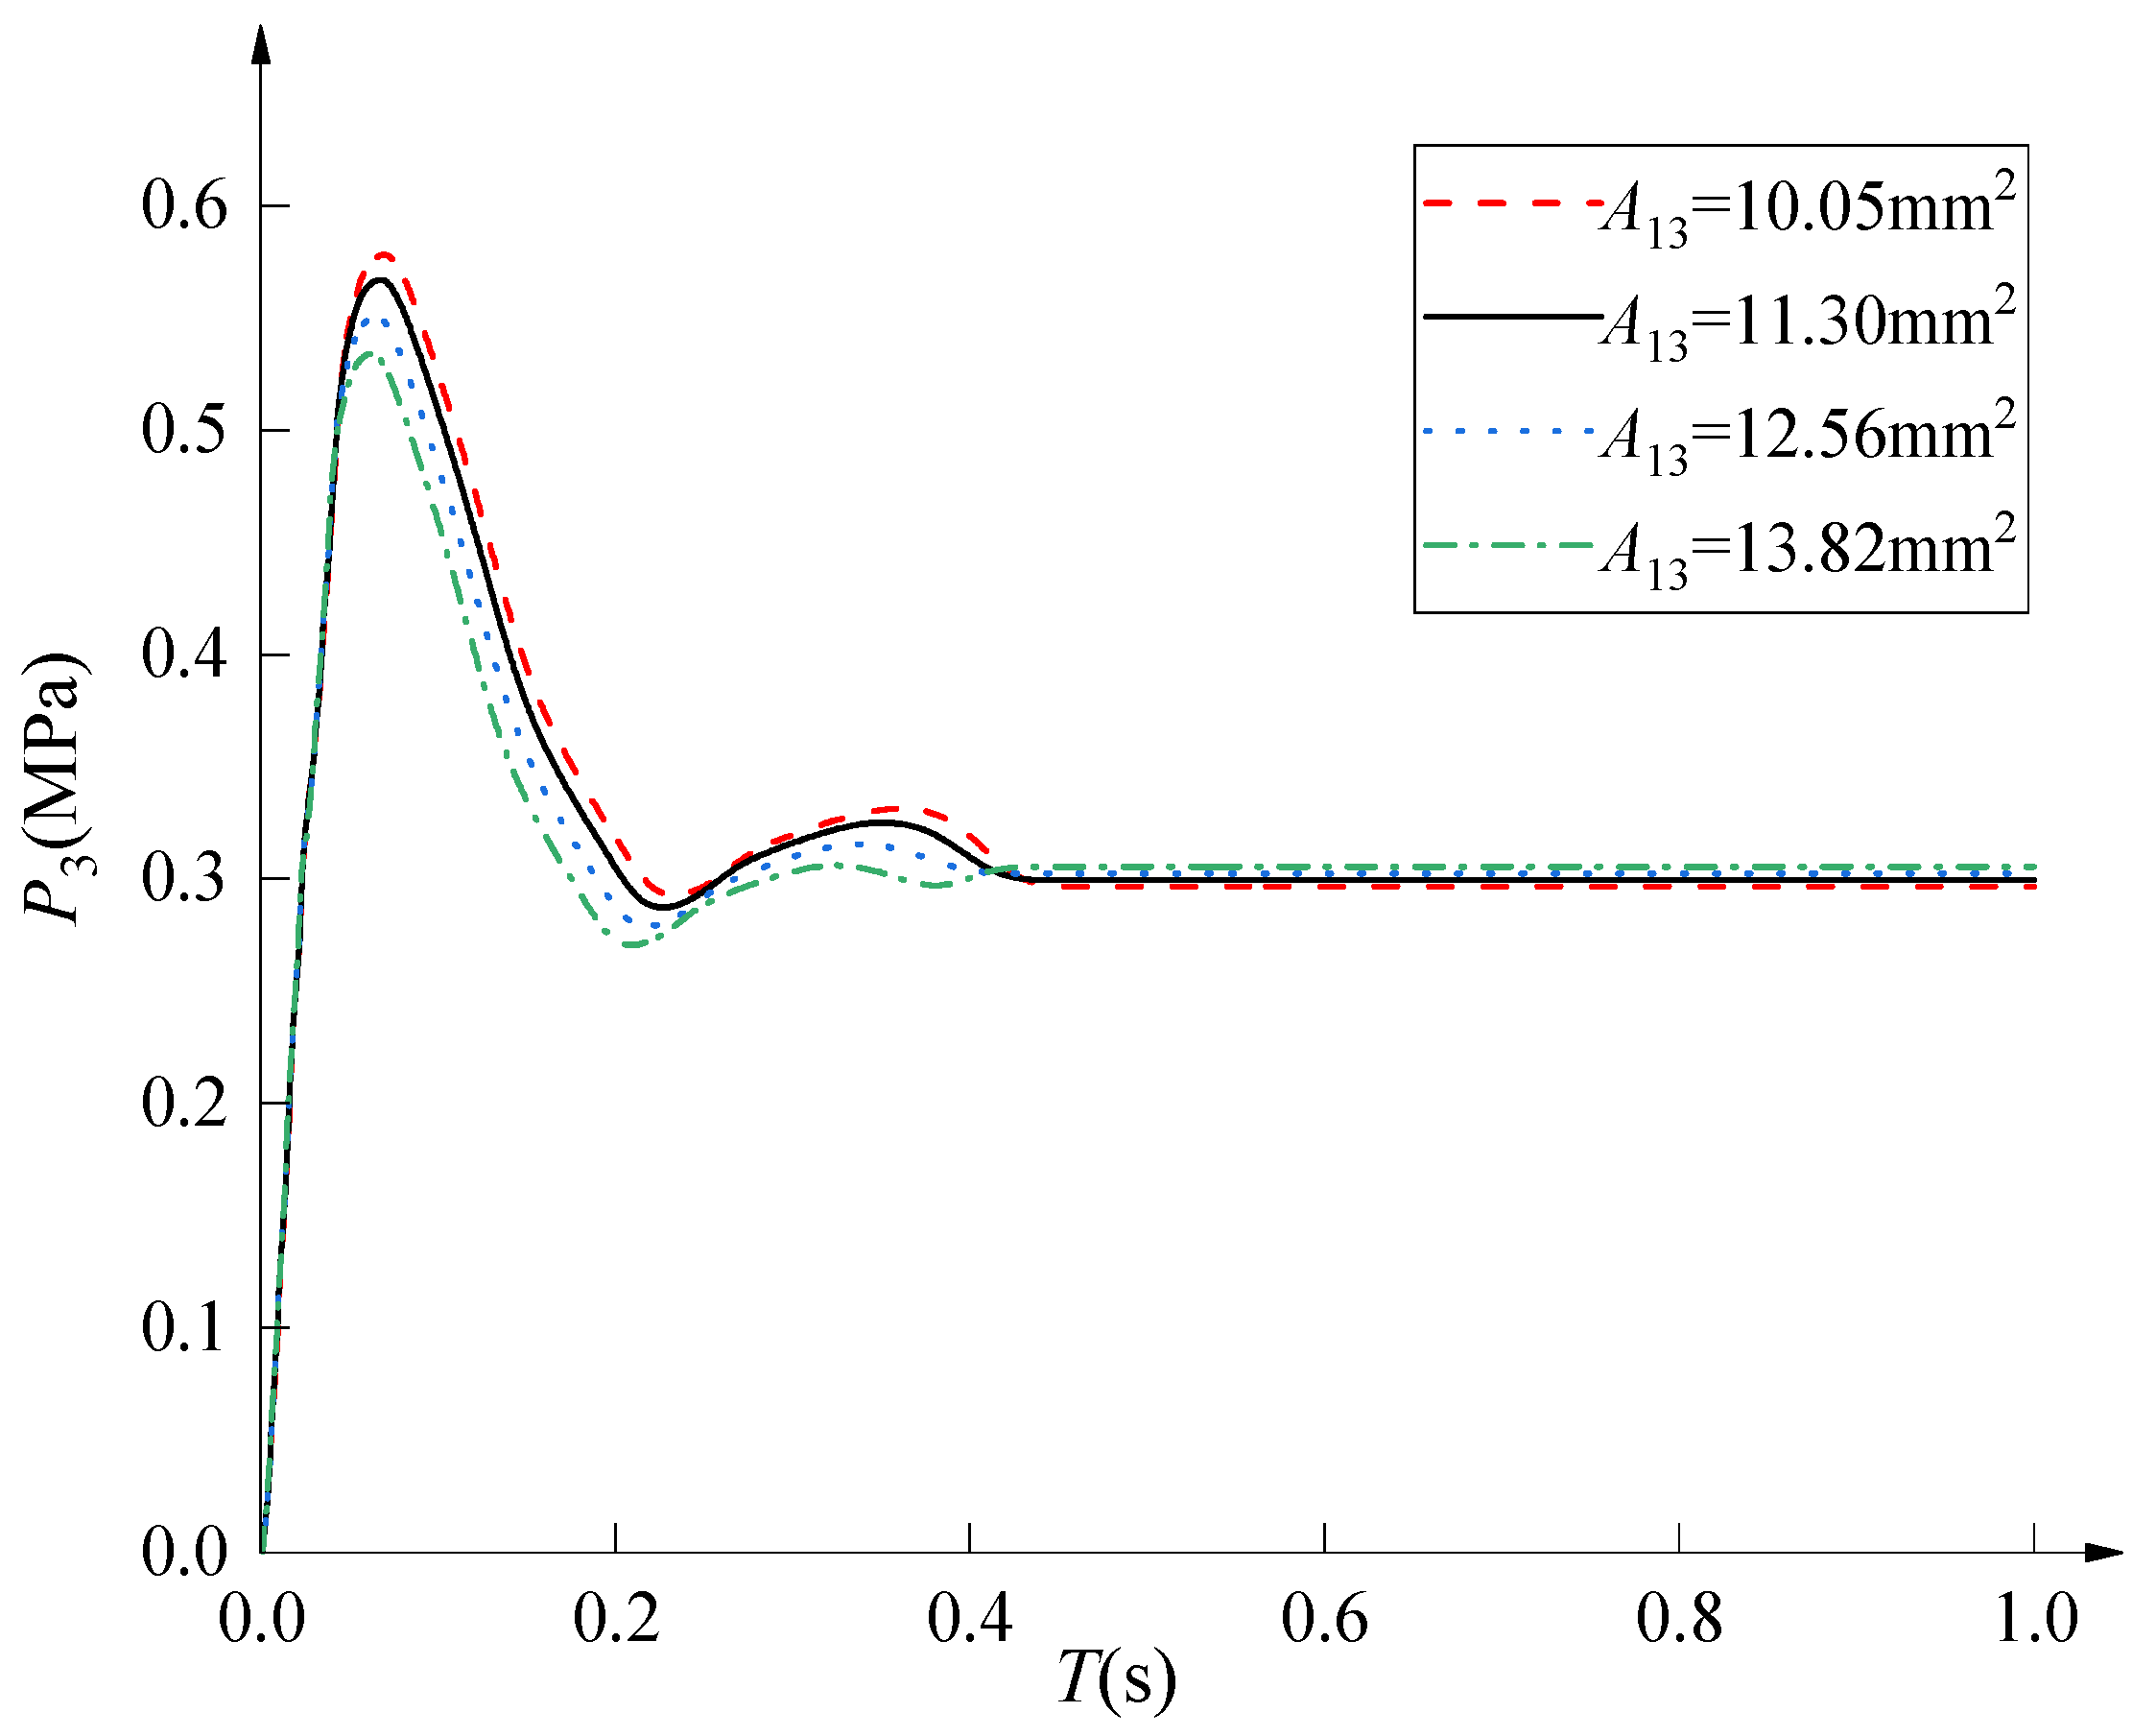
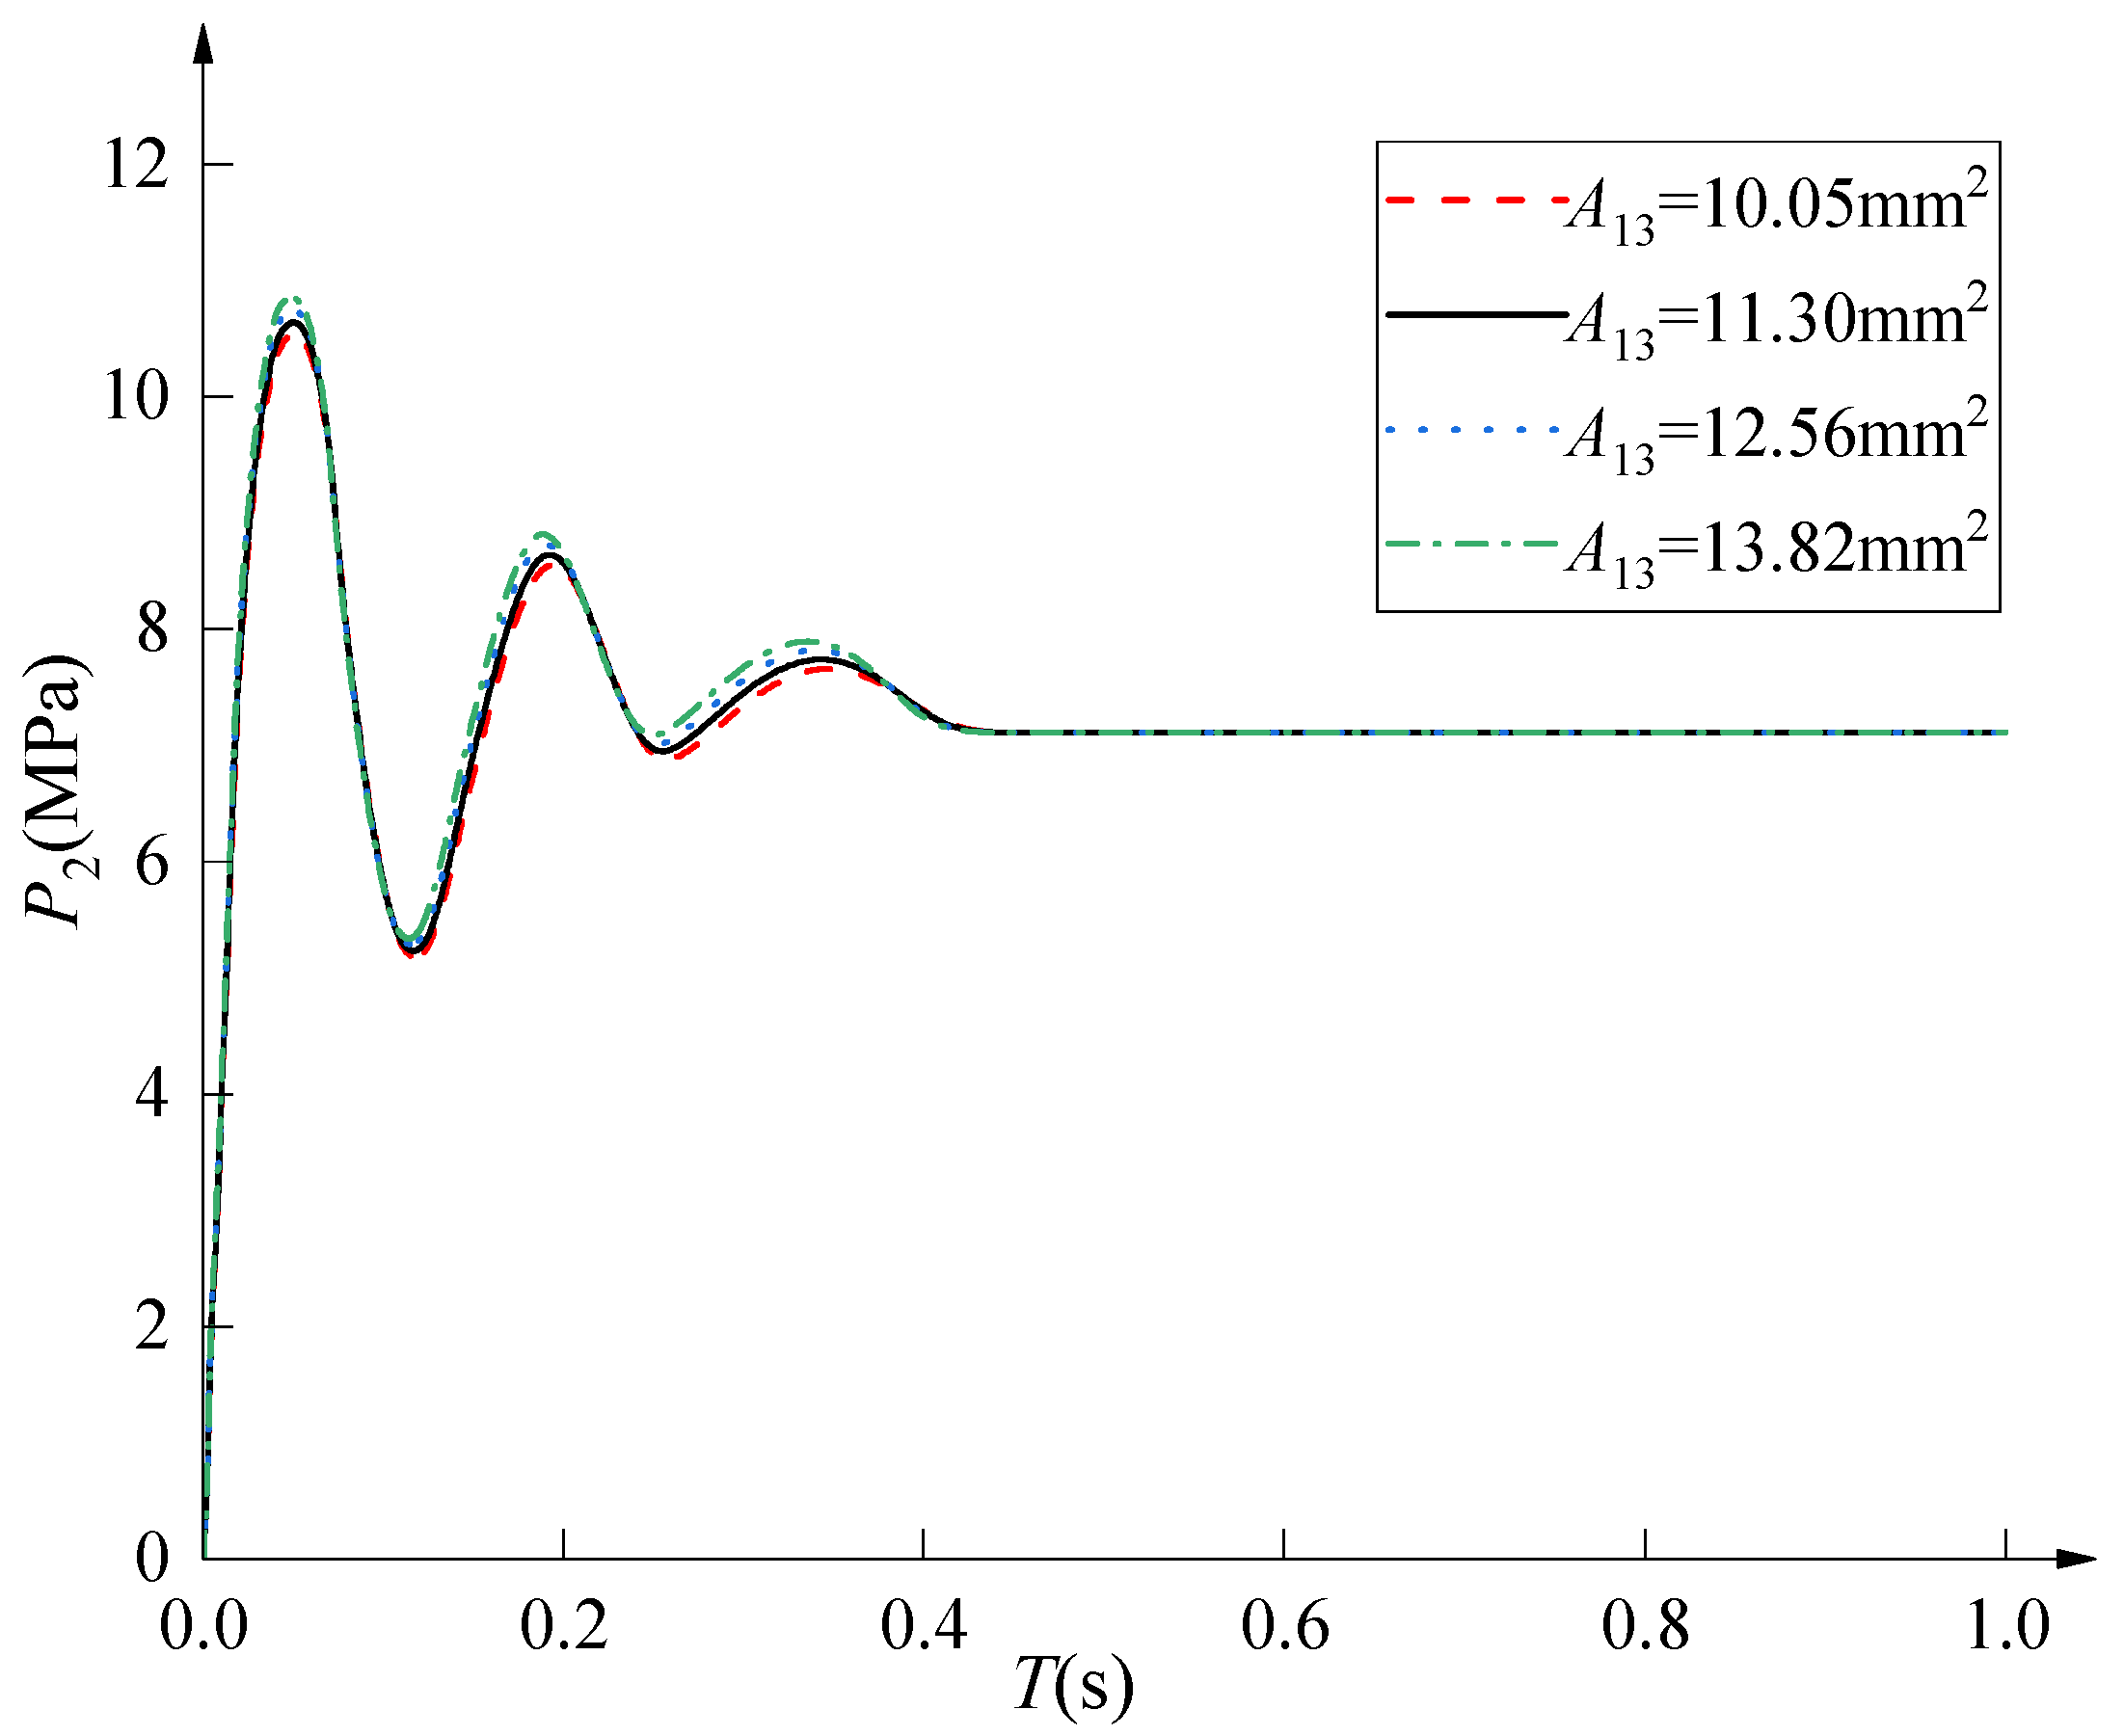
Based on the established simulation model of the two-stage hydrogen pressure-reducing valve, a simulation analysis of the dynamic characteristics was conducted for different areas of the second-stage valve feedback orifice. Keeping all other structural parameters constant, simulations were performed for second-stage valve feedback orifice areas of 10.05 mm2, 11.30 mm2, 12.56 mm2, and 13.82 mm2. The simulation results are shown in Figure 23 and Figure 24. These figures reveal that variations in the feedback orifice area have a minor influence on the outlet pressure of the first-stage valve, while exerting a considerable impact on the dynamic characteristics of the system outlet pressure. As the feedback orifice area increases, the steady-state value of the system outlet pressure remains largely unchanged. However, the dynamic response time shortens, while both the pressure peak value and the overshoot decrease. Therefore, within the allowable design range, the feedback orifice area of the second-stage valve should be maximized to shorten the system response time, reduce the overshoot, and enhance the stability of the outlet pressure.

4.7. Influence of Second-Stage Valve Diaphragm Outer Diameter on System Dynamic Characteristics

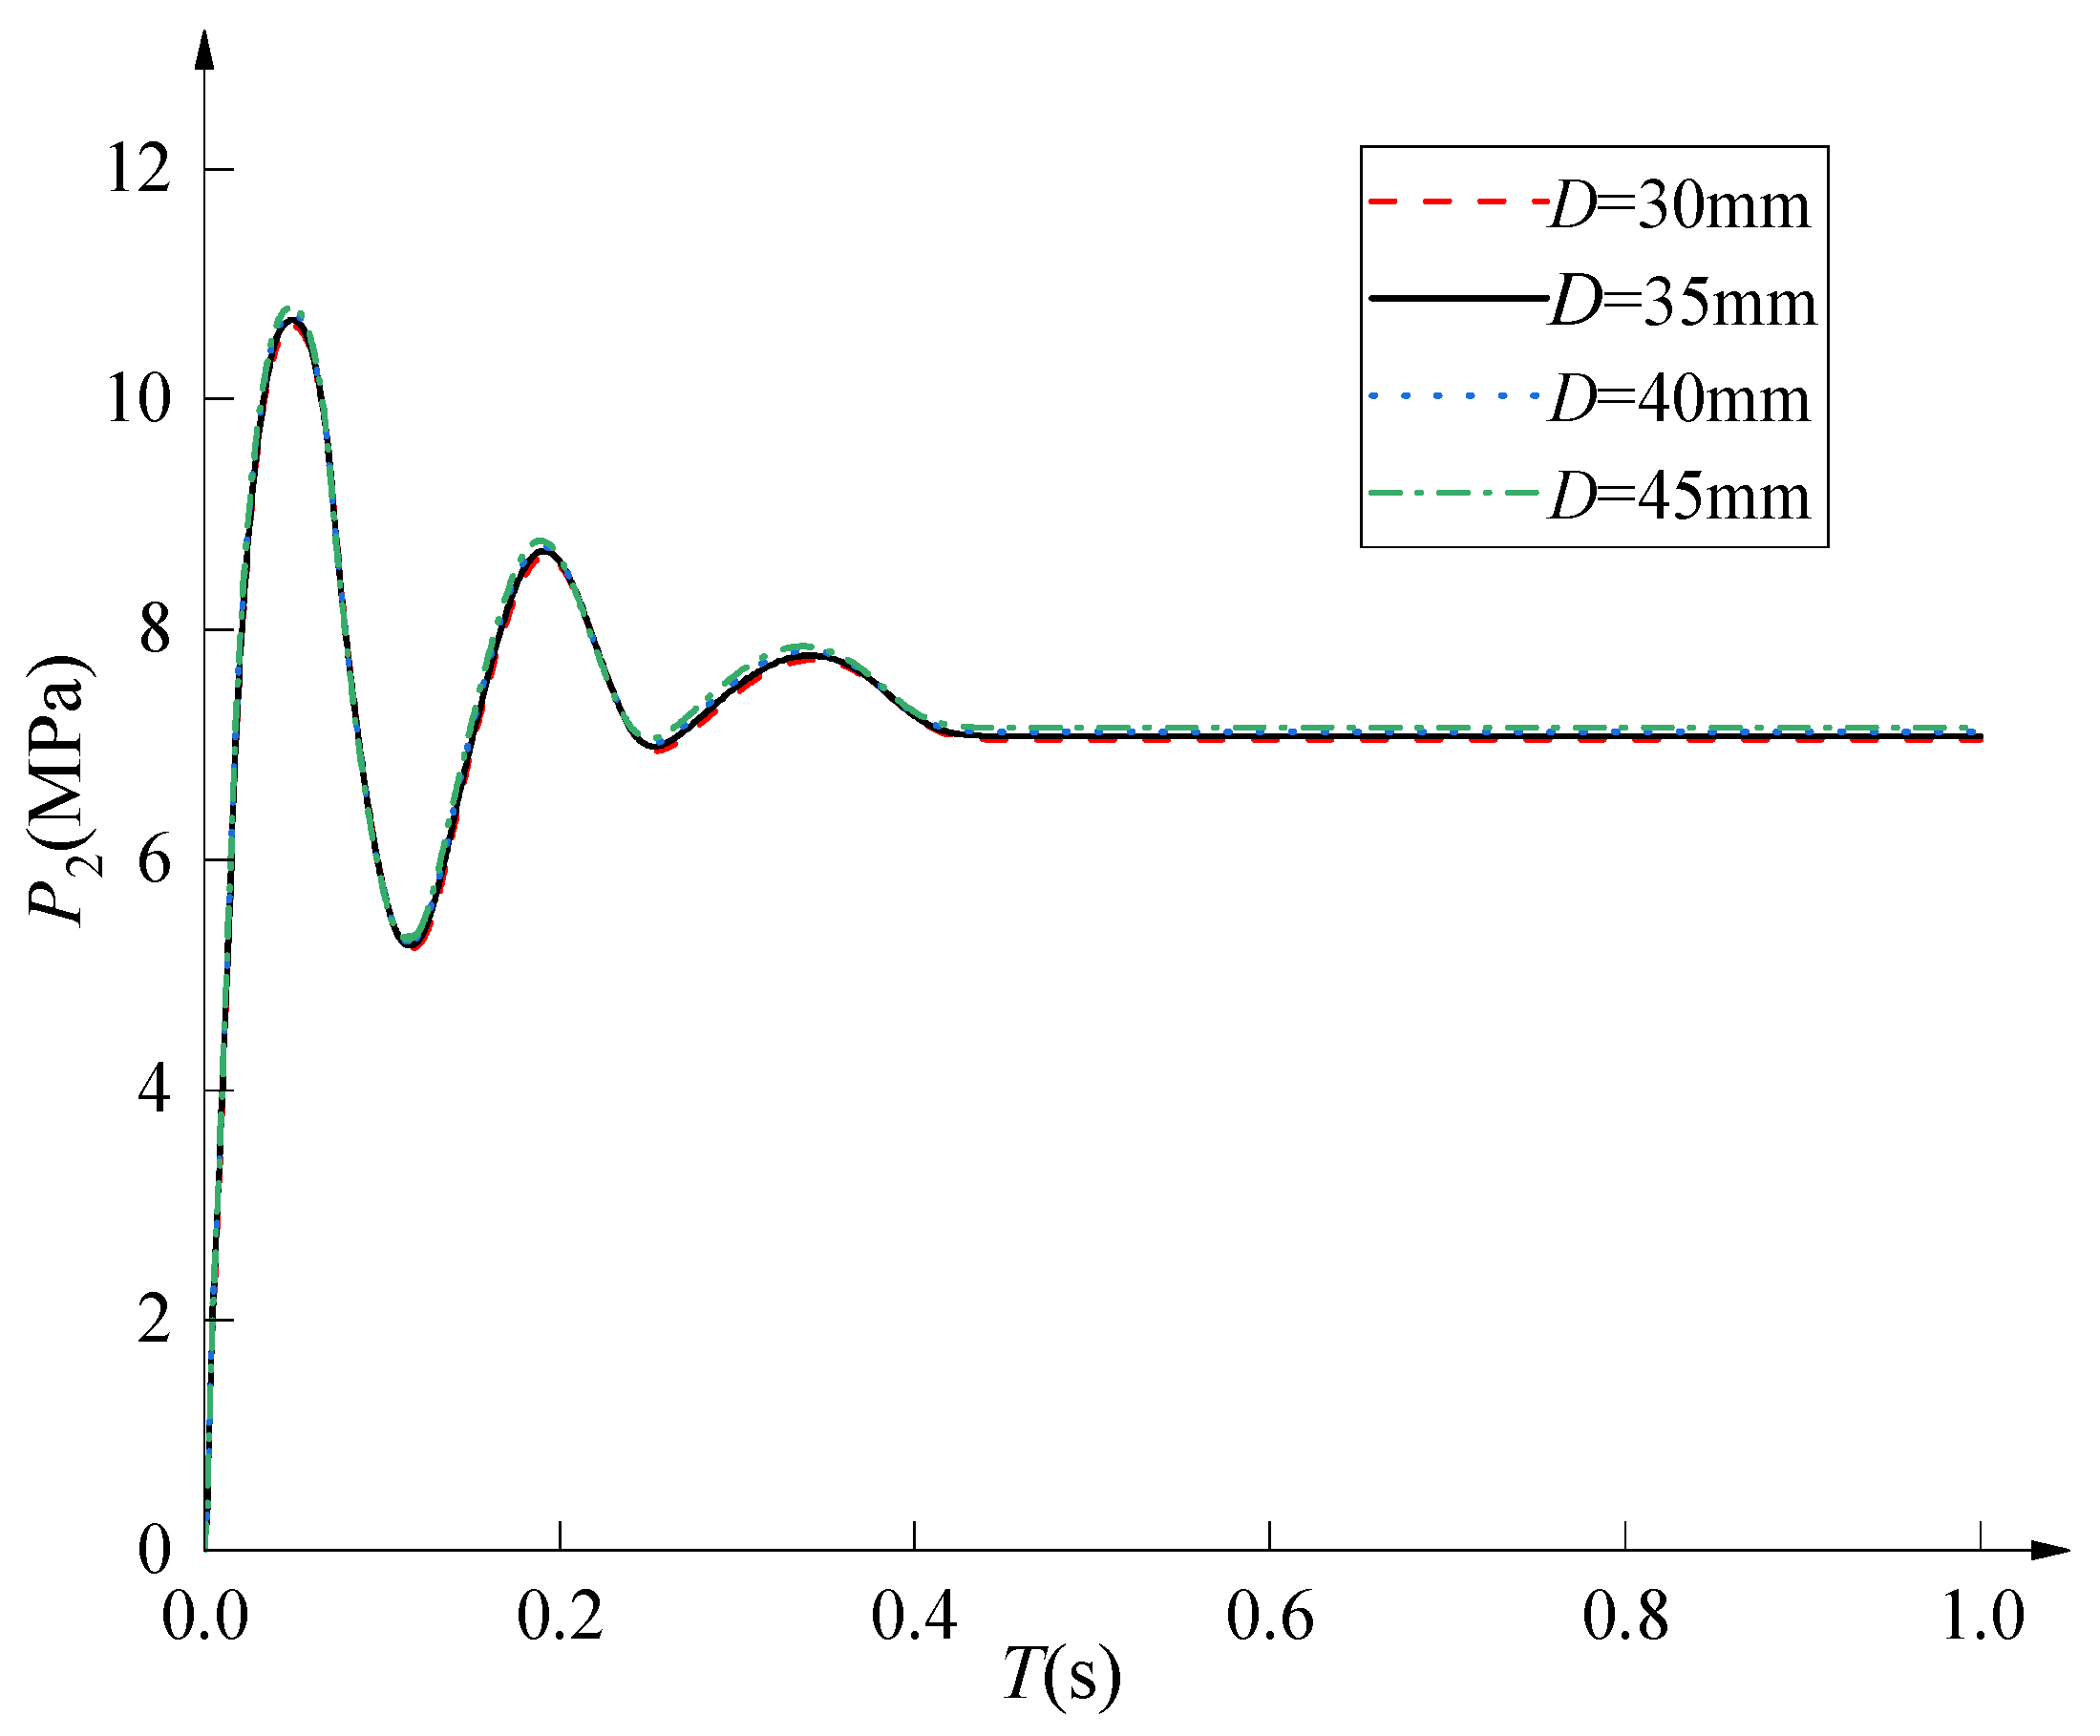
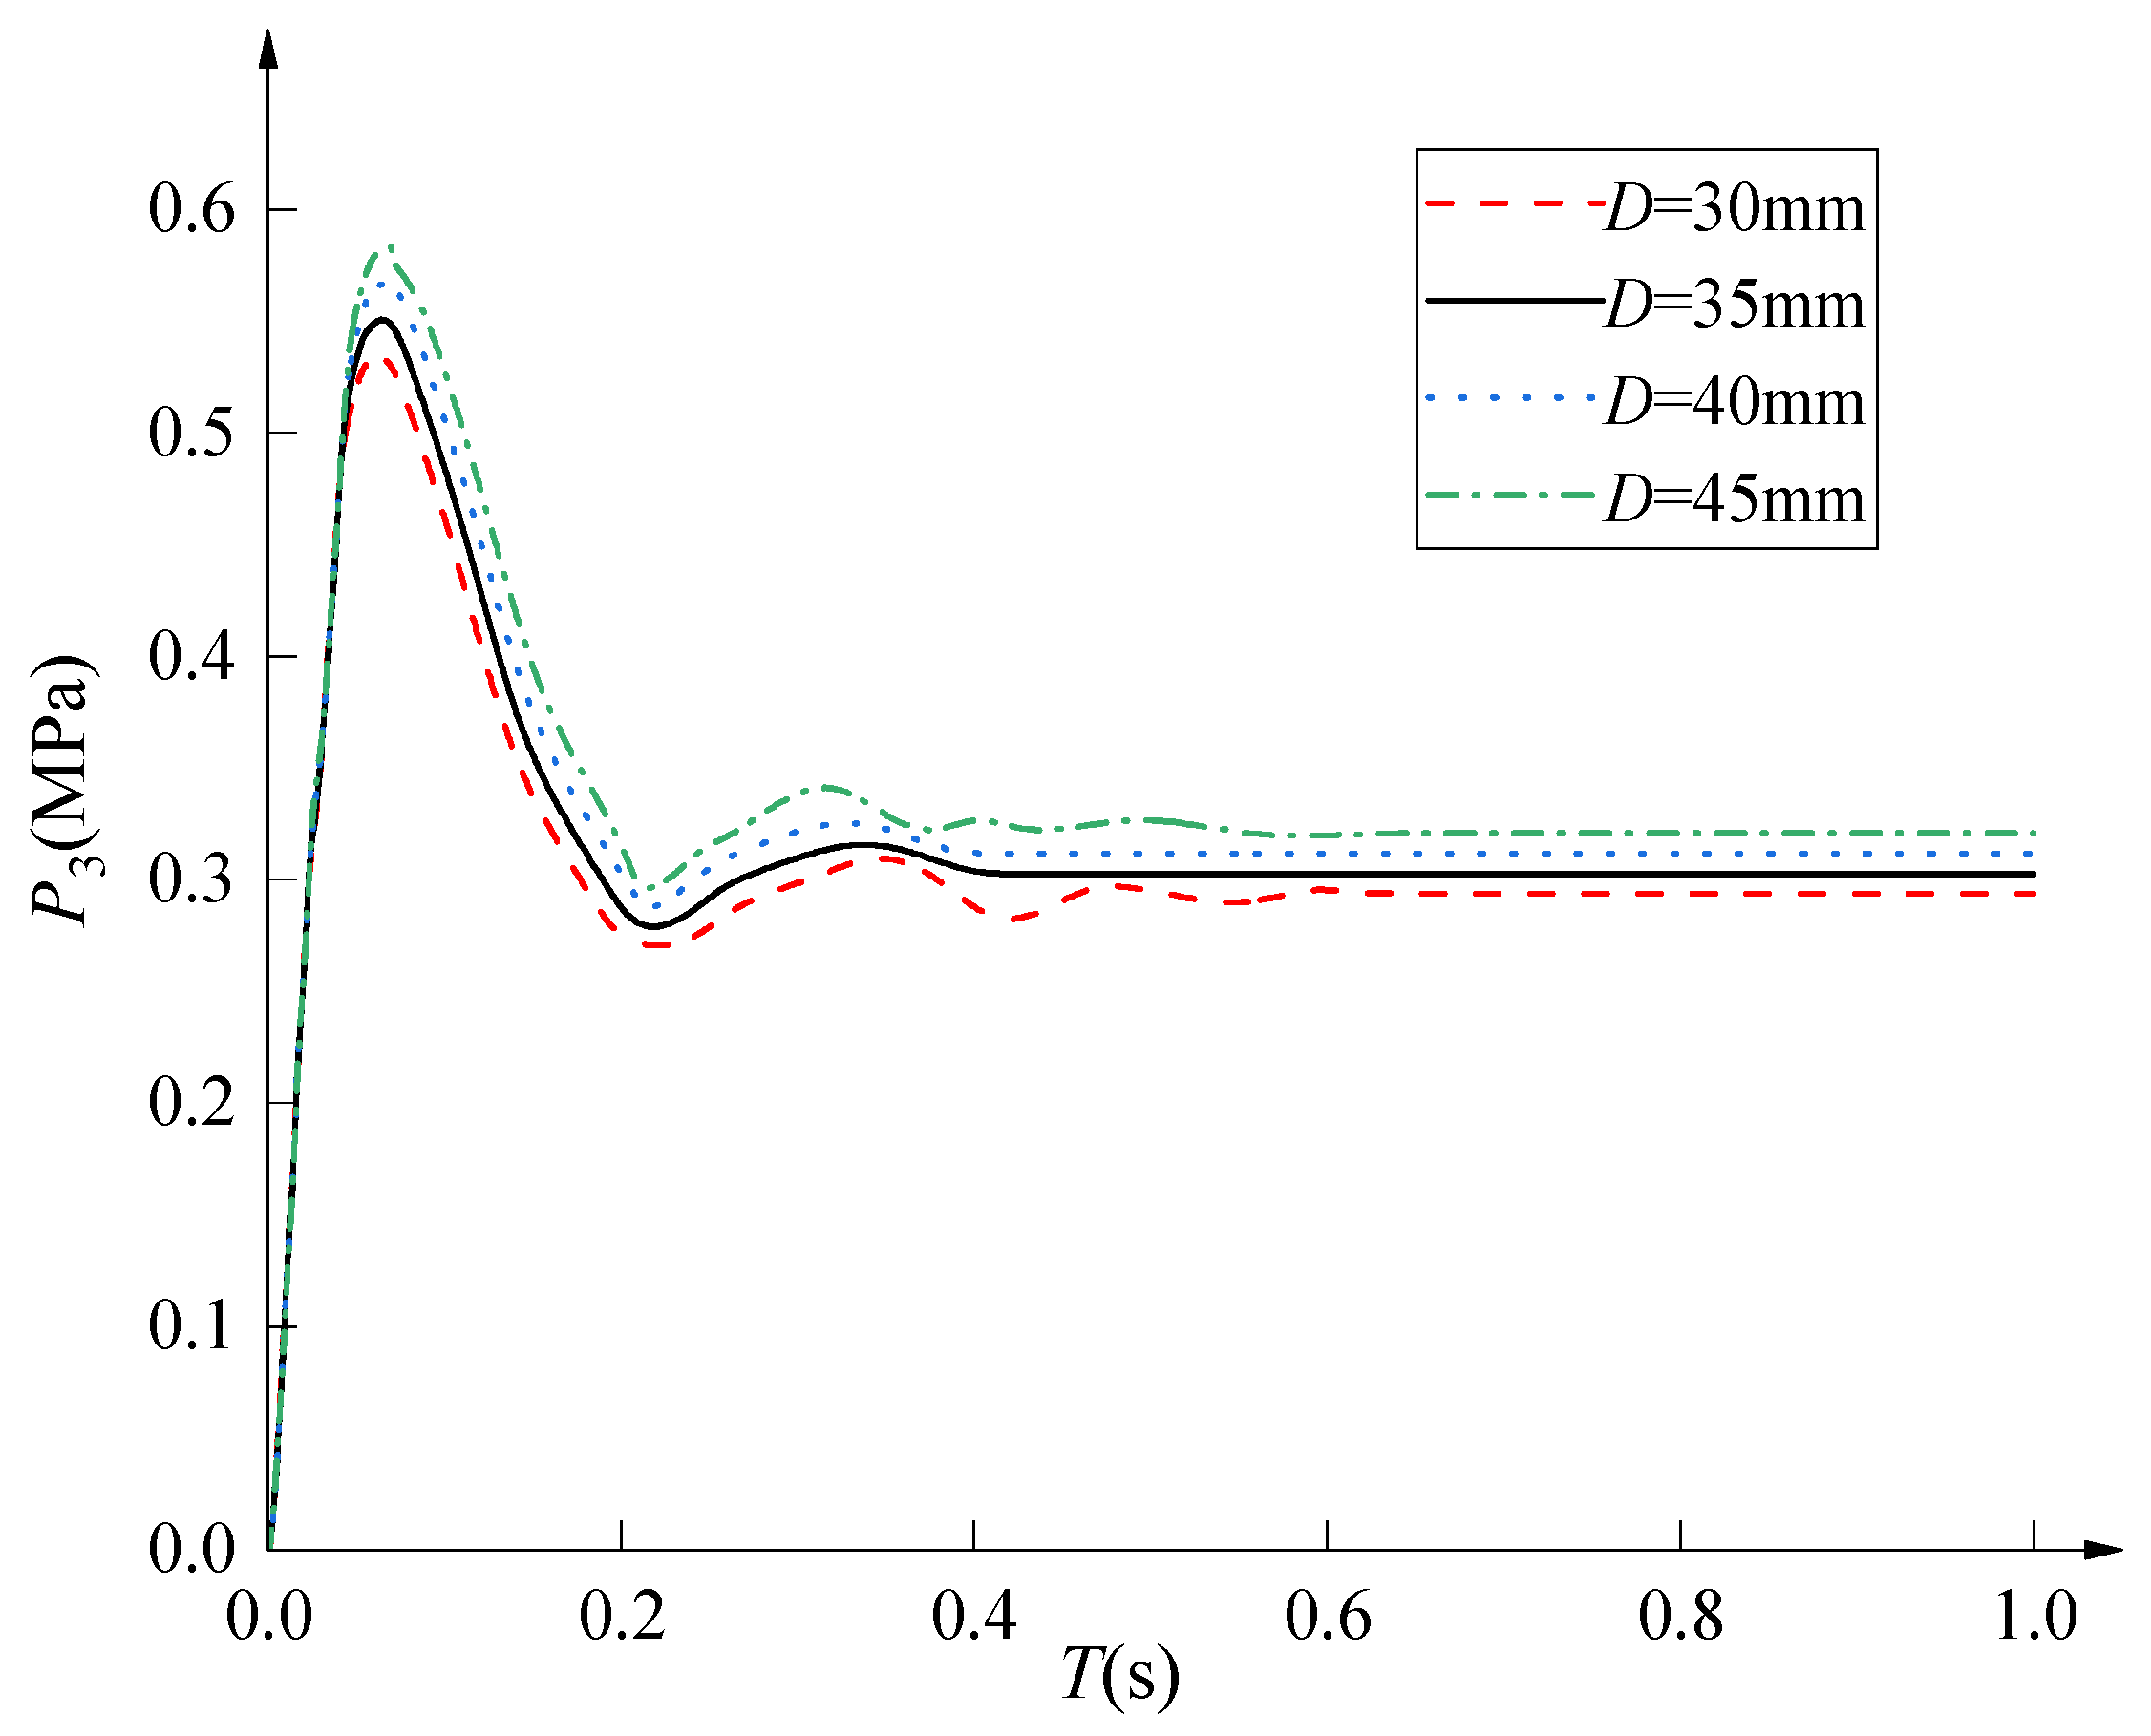
Based on the established simulation model of the two-stage hydrogen pressure-reducing valve, a simulation analysis of the dynamic characteristics was conducted for different outer diameters of the second-stage valve diaphragm. Keeping all other structural parameters constant, simulations were performed for second-stage valve diaphragm outer diameters of 30 mm, 35 mm, 40 mm, and 45 mm. The simulation results are shown in Figure 25 and Figure 26. These figures reveal that variations in the diaphragm outer diameter have a minor influence on the outlet pressure of the first-stage valve, while exerting a considerable impact on the dynamic characteristics of the system outlet pressure. Within the allowable range, increasing the diaphragm outer diameter improves the steady-state pressure control accuracy; however, the pressure overshoot increases accordingly. Conversely, an excessively large diaphragm diameter induces system oscillation, prolongs the settling time, and adversely affects the dynamic response performance. Therefore, the influence of the diaphragm outer diameter on both pressure control accuracy and dynamic response must be considered comprehensively during the design process. The diaphragm size should be selected judiciously to ensure control accuracy while avoiding system oscillation and excessive settling time.

5. Conclusions

(1)
To address the shortcomings of existing hydrogen pressure-reducing valves, such as their narrow pressure regulation range and insufficient output pressure control accuracy, a high-pressure-difference, two-stage hydrogen pressure-reducing valve was designed, featuring a compact structure, fast response, and high control precision. Its structural composition and working principle were elaborated in detail, along with its role within the hydrogen supply system for hydrogen-powered UAV fuel cell systems.
(2)
Based on assumptions including the convergent nozzle model, ideal gas behavior, and viscous damping, reasonable simplifications were applied to the dynamic model. Utilizing the gas state equation and the throttling orifice flow equation, in conjunction with the structure and working principle of the two-stage valve, the motion differential equations of the valve cores, the flow continuity equations between chambers, and the chamber thermodynamic differential equations were derived, thus establishing a multi-physics coupled system dynamic model for the two-stage hydrogen pressure-reducing valve.
(3)
A dynamic characteristic simulation model of the two-stage hydrogen pressure-reducing valve was established using MATLAB/Simulink. The accuracy of the MATLAB/Simulink dynamic simulation model was validated against experimental and simulation results of dynamic characteristics from the literature on a high-pressure pneumatic pilot switching valve. The results demonstrate that the simulation model developed in MATLAB/Simulink achieves a high accuracy in representing the dynamic characteristics of the two-stage hydrogen pressure-reducing valve system. This model enables the analysis of how various structural parameters influence the valve’s dynamic behavior, thereby providing theoretical support and design guidance for improving its dynamic response performance.
(4)
A dynamic characteristic simulation study was conducted on the preliminarily designed two-stage hydrogen pressure-reducing valve, systematically investigating the influence of different structural parameters on the dynamic behavior of both the first and second stages. Under an inlet pressure of 70 MPa, analysis through variations in individual parameters revealed the following: The first-stage valve exhibited a significant pressure reduction effect, with its main spring stiffness and valve core mass identified as key parameters affecting the steady-state value of its outlet pressure. All structural parameters of the first-stage valve demonstrated a pronounced impact on both the system overshoot and dynamic response time. In contrast, the structural parameters of the second-stage valve had minimal influence on the first-stage outlet pressure, while the second-stage valve itself provided excellent pressure stabilization. The spring stiffness of the first-stage valve, the main spring stiffness of the second-stage valve, and the outer diameter of the second-stage valve diaphragm were identified as crucial parameters determining the steady-state value of the system outlet pressure. Furthermore, the spring stiffness of the first-stage valve, the valve core mass of the first-stage valve, the low-pressure chamber volume of the first-stage valve, the main spring stiffness of the second-stage valve, the valve core mass of the second-stage valve, the feedback orifice diameter of the second-stage valve, and the outer diameter of the second-stage valve diaphragm were all key parameters influencing both the overshoot and dynamic response time of the system outlet pressure.

6. Future Work

In future research, the influence of flight environment factors such as vibration, attitude variations, and ambient temperature fluctuations on the dynamic characteristics of hydrogen pressure-reducing valves will be further investigated. These effects were not explicitly modeled in the present study in order to maintain model simplicity and focus on intrinsic dynamic behavior. Incorporating such factors into the dynamic model may improve the fidelity of the simulation and enhance its applicability to practical UAV operating conditions.
Future work will focus on the engineering implementation and system-level integration of the proposed two-stage hydrogen pressure-reducing valve. This includes a quantitative evaluation of valve dimensions, mass, and structural layout to ensure compatibility with the payload and space constraints of unmanned aerial vehicle (UAV) platforms. Lightweight design strategies and comparisons with existing compact hydrogen pressure-reducing valves will also be investigated to further validate the applicability of the proposed valve in UAV fuel cell systems.
Although partial validation of the proposed dynamic model has been conducted through comparative analysis with published experimental data from similar high-pressure pneumatic valves, further verification is required. Due to the limited availability of large-sample experimental data, statistical analysis of the model outputs is not performed in the present study. Future work will focus on experimental testing under multiple operating conditions, including different inlet pressures and structural parameter combinations, to enable statistical evaluation of model accuracy, robustness, and uncertainty. In addition, the integration of experimental data with the proposed dynamic model will further improve its applicability to practical hydrogen-powered UAV systems.

Author Contributions

Conceptualization, S.L. and Y.Z.; methodology, Y.Z.; software, Y.Z.; validation, Y.Z. and W.L.; formal analysis, Y.Z.; investigation, H.Z.; resources, S.L.; data curation, Y.Z.; writing—original draft preparation, H.Z.; writing—review and editing, W.L. and L.Y.; visualization, H.Z.; supervision, S.L. and L.Y.; project administration, S.L.; funding acquisition, S.L. All authors have read and agreed to the published version of the manuscript.

Funding

This research was funded by the National Natural Science Foundation of China (Research Project: 51569012), the Double First-Class Key Program of Gansu Provincial Department of Education; Gansu Province Science and Technology Program (Grant No. 22CX8GA125) and Gansu Provincial Department of Education (Industrial Support Plan Project: 2025CYZC-048).

Data Availability Statement

The original contributions presented in the study are included in the article; further inquiries can be directed to the corresponding author.

Conflicts of Interest

The authors declare no conflicts of interest. The affiliation with Manufacturing Company of China National Logging Corporation does not constitute a financial or commercial conflict related to this work.

Appendix A. Nomenclature

Table A1. Definition of symbols used in the mathematical model.
SymbolUnitDescription
Pressures
P 1 , P 2 , P 3 , P 4 PaPressure at inlet, 1st-stage outlet, 2nd-stage outlet, and feedback chamber.
P 0 PaAtmospheric pressure.
Geometry & Areas
A 1 , A 2 , A 3 , A 4 , A 5 m2Effective acting areas of valve cores and diaphragm.
A 11 , A 12 , A 13 m2Flow areas of 1st-stage, 2nd-stage, and feedback orifices.
d 1 , d 2 , d 5 , D , α m, m, m, m, °Structural dimensions: seat orifice dia., stem dia., diaphragm OD, cone half-angle.
Mechanical Parameters
m 1 , m 2 kgMass of the moving assembly for the 1st- and 2nd-stage valves.
k 1 , k 2 , k 3 , k 4 N/mStiffness of main/auxiliary springs for the 1st- and 2nd-stage valves.
x 1 , x 2 , x 3 , x 4 mPre-compression of the corresponding springs.
L 1 , L 2 N·s/mDamping coefficient of the valve motion.
Motion Variables
x , y mDisplacement of the 1st- and 2nd-stage valve cores.
v 1 , v 2 m/sVelocity of the valve cores.
a 1 , a 2 m/s2Acceleration of the valve cores.
Forces
F S 1 , F u 1 NSteady-state and transient flow force in the 1st-stage valve.
F D 1 , F D 2 , F m 2 NFluid force on piston, diaphragm, and diaphragm restoring force.
F G 1 , F G 2 NGravity of the moving assemblies.
F F 1 , F F 2 NFriction force on the moving assemblies.
Flow & Coefficients
Q 1 , Q 2 , Q 3 , Q m 1 kg/sMass flow rates through orifices and between chambers.
C d 1 , C d 2 , C d 3 Flow coefficient of the 1st-stage, 2nd-stage, and feedback orifices.
Thermodynamics
T 0 , T 1 , T 2 , T 3 KGas temperature in the high-pressure, 1st-stage, 2nd-stage, and feedback chambers.
V 1 , V 2 , V 3 m3Volume of the 1st-stage, 2nd-stage, and feedback chambers.
R J/(mol·K)Gas constant.
k Specific heat ratio (isentropic exponent).
q ˙ 1 , q ˙ 2 , q ˙ 3 W/m2Heat flux into the chambers.
S 1 , S 2 , S 3 m2Inner wall surface area of the chambers.

Appendix B. Supplementary Parameter Values

Table A2. Structural parameter values used in Figure 17 and Figure 23.
Parameter Description Values Unit Corresponding Figure
V1Low-pressure chamber volume of the first-stage valve7234.56, 8038.40, 9646.08, 10,449.92mm3Figure 17
A13Feedback orifice area of the second-stage valve10.05, 11.30, 12.56, 13.82mm2Figure 23

References

  1. France, R.M.; Geisz, J.F.; Song, T.; Olavarria, W.; Young, M.; Kibbler, A.; Steiner, M.A. Triple-junction solar cells with 39.5% terrestrial and 34.2% space efficiency enabled by thick quantum well superlattices. Joule 2022, 6, 1121–1135. [Google Scholar] [CrossRef]
  2. Fernandes, M.D.; Bistritzki, V.; Domingues, R.Z.; Matencio, T.; Rapini, M.; Sinisterra, R.D. Solid oxide fuel cell technology paths: National innovation system contributions from Japan and the United States. Renew. Sustain. Energy Rev. 2020, 127, 109879. [Google Scholar] [CrossRef]
  3. Yusaf, T.; Mahamude, A.S.F.; Kadirgama, K.; Ramasamy, D.; Farhana, K.; Dhahad, H.A.; Talib, A.R.A. Sustainable hydrogen energy in aviation—A narrative review. Int. J. Hydrogen Energy 2024, 52, 1026–1045. [Google Scholar] [CrossRef]
  4. Milojevic, S. Optimization of the Hydrogen System for City Busses with Respect to the Traffic Safety. In Proceedings of the 20th World Hydrogen Energy Conference (WHEC 2014), Gwangju, Republic of Korea, 15–20 June 2014; pp. 853–860. [Google Scholar]
  5. Yu, L.-J.; Yang, X.-H.; Zhang, Z.-X.; Lin, Z.-H.; Jin, Z.-J.; Qian, J.-Y. Parametric analysis on throttling elements of conical throttling valve for hydrogen decompression in hydrogen fuel cell vehicles. J. Energy Storage 2023, 65, 107342. [Google Scholar] [CrossRef]
  6. Chen, F.-Q.; Ren, X.-D.; Hu, B.; Li, X.-S.; Gu, C.-W.; Jin, Z.-J. Parametric analysis on multi-stage high pressure reducing valve for hydrogen decompression. Int. J. Hydrogen Energy 2019, 44, 31263–31274. [Google Scholar] [CrossRef]
  7. Zhang, Y.; Liu, B.; She, X.; Luo, Y.; Sun, Q.; Teng, L. Numerical study on the behavior and design of a novel multistage hydrogen pressure-reducing valve. Int. J. Hydrogen Energy 2022, 47, 14646–14657. [Google Scholar] [CrossRef]
  8. Jin, Z.-J.; Chen, F.-Q.; Qian, J.-Y.; Zhang, M.; Chen, L.-L.; Wang, F.; Fei, Y. Numerical analysis of flow and temperature characteristics in a high multi-stage pressure reducing valve for hydrogen refueling station. Int. J. Hydrogen Energy 2016, 41, 5559–5570. [Google Scholar] [CrossRef]
  9. Chen, F.-Q.; Jin, Z.-J. Effects of perforated plate on hydrogen flow in L-shaped high pressure reducing valve. Int. J. Hydrogen Energy 2023, 48, 1956–1967. [Google Scholar] [CrossRef]
  10. Liu, J.; He, X.; Lv, Z.; Huang, H. Research on Dynamic Characteristics of a High-Pressure and High-Precision Hydrogen Pressure Reducing Valve for Small Mobile Vehicles. J. Press. Vessel Technol. 2025, 147, 061703. [Google Scholar] [CrossRef]
  11. Cai, H.; Lu, Y.; Xu, C.; You, Y.; Zhu, C. A constant pressure differential valve and its controlling characteristics for aero engine. Flow Meas. Instrum. 2024, 95, 102507. [Google Scholar] [CrossRef]
  12. Lisowski, E.; Filo, G. CFD analysis of the characteristics of a proportional flow control valve with an innovative opening shape. Energy Convers. Manag. 2016, 123, 15–28. [Google Scholar] [CrossRef]
  13. Zang, J.-L.; Yao, H.-Y.; Zhang, F.-H.; Liu, Z.-Y.; Meng, J.; Zhu, J.-M.; Wang, Z.-M.; Qian, J.-Y. Dynamic characteristics analysis of pilot valves with different inlet diameters installed on the main steam valve set. Case Stud. Therm. Eng. 2022, 34, 102004. [Google Scholar] [CrossRef]
  14. Chen, F.-Q.; Qian, J.-Y.; Chen, M.-R.; Zhang, M.; Chen, L.-L.; Jin, Z.-J. Turbulent compressible flow analysis on multi-stage high pressure reducing valve. Flow Meas. Instrum. 2018, 61, 26–37. [Google Scholar] [CrossRef]
  15. Nabi, A.; Wacholder, E.; Dayan, J. Dynamic Model for a Dome-Loaded Pressure Regulator. J. Dyn. Syst. Meas. Control 1997, 122, 290–297. [Google Scholar] [CrossRef]
  16. Li, B.; Liu, Y.; Li, J.; Liu, B.; Wang, X.; Deng, G. Investigation of a Novel Hydrogen Depressurization Structure Constituted by an Orifice Plate with Tesla-Type Channels. Materials 2022, 15, 4918. [Google Scholar] [CrossRef] [PubMed]
  17. Qian, J.-Y.; Yu, L.-J.; Yang, X.-H.; Jin, Z.-J.; Li, W.-Q. Dynamic characteristics analysis and valve core optimization for second stage hydrogen pressure reducer of hydrogen decompression valve. J. Energy Storage 2024, 79, 110113. [Google Scholar] [CrossRef]
  18. Wang, H.; Zhang, C.; Zhao, G.; Song, Y.; Fu, P.; Zhou, G. Parametric analysis of the I-stage structure for a dual-stage gas pressure reducing regulator. IEEE Access 2020, 8, 168773–168783. [Google Scholar] [CrossRef]
  19. Bing, S.; Qi, X.; Yang, C. Dynamic modeling and simulation of a pressurized system used in flight vehicle. Chin. J. Aeronaut. 2018, 31, 1232–1248. [Google Scholar] [CrossRef]
  20. Wang, F.; Zeng, Y.; Wang, W.; Chen, F.; Gao, W.; Yan, H.; Li, J. Transient flow characteristics for fluid-structure interaction on hydrogen decompression valve in high-pressure hydrogen storage systems. Int. J. Hydrogen Energy 2024, 79, 1250–1266. [Google Scholar] [CrossRef]
  21. Liu, F.; Cao, S.; Zhou, W.; Zhao, D.; Zheng, L.; Shao, M. Transient flow analysis on opening process of pneumatic gas proportional valve with two-solenoid valve. Flow Meas. Instrum. 2023, 89, 102291. [Google Scholar] [CrossRef]
  22. MATLAB, Version 25.1.0.2943329 (R2025a); The MathWorks Inc.: Natick, MA, USA, 2025.
  23. Gad, O. Modeling and simulation of the steady-state and transient performance of a three-way pressure reducing valve. J. Dyn. Syst. Meas. Control 2016, 138, 031001. [Google Scholar] [CrossRef]
  24. Filo, G.; Lisowski, E.; Rajda, J. Flow analysis of a switching valve with innovative poppet head geometry by means of CFD method. Flow Meas. Instrum. 2019, 70, 101643. [Google Scholar] [CrossRef]
  25. Peng, Z.; Xu, Q.; Yang, C.; Ma, W.; Zhang, Z. Simulation and experimental investigation of high-pressure pneumatic pilot-driven on/off valve with high transient performances for compressed air ejection. Flow Meas. Instrum. 2023, 94, 102466. [Google Scholar] [CrossRef]
Figure 1. Structural model of the two-stage hydrogen pressure-reducing valve: (a) 2D model; (b) 3D model; (c) Schematic of the hydrogen supply system. Blue lines indicate the high-pressure hydrogen pipeline, green lines represent the air circulation pipeline, and orange lines denote the water circulation pipeline.
Designs 10 00027 g001
Figure 2. Flow channel models of the first-stage and second-stage pressure-reducing valves: (a) Flow channel model of the first-stage pressure-reducing valve; (b) Flow channel model of the second-stage pressure-reducing valve.
Designs 10 00027 g002
Figure 3. Flow field mesh of the first-stage pressure-reducing valve: (a) Flow field mesh; (b) Internal flow field mesh. The gray-white regions represent hexahedral elements, while the green regions indicate tetrahedral elements.
Designs 10 00027 g003
Figure 4. Flow field mesh of the second-stage pressure-reducing valve: (a) Flow field mesh; (b) Internal flow field mesh. The yellow regions represent hexahedral elements, while the green regions indicate tetrahedral elements.
Designs 10 00027 g004
Figure 5. Pressure and velocity contours of the first-stage pressure-reducing valve under a system inlet pressure of 70 MPa: (a) Pressure contour; (b) Velocity contour.
Designs 10 00027 g005
Figure 6. Pressure and velocity contours of the second-stage pressure-reducing valve under a system inlet pressure of 70 MPa: (a) Pressure contour; (b) Velocity contour.
Designs 10 00027 g006
Figure 7. Schematic diagram of the structural parameters for the two-stage hydrogen pressure-reducing valve.
Designs 10 00027 g007
Figure 8. Schematic of the force analysis on the moving assembly of the first-stage valve core.
Designs 10 00027 g008
Figure 9. Schematic of the first-stage orifice in the two-stage hydrogen pressure-reducing valve.
Designs 10 00027 g009
Figure 10. Schematic of the force analysis on the moving assembly of the second-stage valve core.
Designs 10 00027 g010
Figure 11. System dynamic characteristics simulation model.
Designs 10 00027 g011
Figure 12. Validation of the MATLAB/Simulink dynamic model simulation results at a supply pressure of 4.5 MPa.
Designs 10 00027 g012
Figure 13. Outlet pressure response of the first-stage valve under different main spring stiffness values.
Designs 10 00027 g013
Figure 14. System outlet pressure response under different main spring stiffness values of the first-stage valve.
Designs 10 00027 g014
Figure 15. Outlet pressure response of the first-stage valve under different valve core masses.
Designs 10 00027 g015
Figure 16. System outlet pressure response under different valve core masses of the first-stage valve.
Designs 10 00027 g016
Figure 17. Outlet pressure response of the first-stage valve under different low-pressure chamber volumes (Structural parameter values are shown in Table A2.).
Designs 10 00027 g017
Figure 18. System outlet pressure response under different low-pressure chamber volumes of the first-stage valve.
Designs 10 00027 g018
Figure 19. Outlet pressure response of the first-stage valve under different main spring stiffness values of the second-stage valve.
Designs 10 00027 g019
Figure 20. System outlet pressure response under different main spring stiffness values of the second-stage valve.
Designs 10 00027 g020
Figure 21. Outlet pressure response of the first-stage valve under different valve core masses of the second-stage valve.
Designs 10 00027 g021
Figure 22. System outlet pressure response under different valve core masses of the second-stage valve.
Designs 10 00027 g022
Figure 23. Outlet pressure response of the first-stage valve under different feedback orifice areas of the second-stage valve (Structural parameter values are shown in Table A2.).
Designs 10 00027 g023
Figure 24. System outlet pressure response under different feedback orifice areas of the second-stage valve.
Designs 10 00027 g024
Figure 25. Outlet pressure response of the first-stage valve under different diaphragm outer diameters of the second-stage valve.
Designs 10 00027 g025
Figure 26. System outlet pressure response under different diaphragm outer diameters of the second-stage valve.
Designs 10 00027 g026
Table 1. Grid independence verification for the first-stage pressure-reducing valve.
Mesh TypeNumber of NodesNumber of ElementsCalculated Flow Rate (g/s)
Mesh 1212,4921,297,3314.936
Mesh 2343,3811,659,4744.948
Mesh 3594,2701,935,6584.954
Table 2. Grid independence verification for the second-stage pressure-reducing valve.
Mesh TypeNumber of NodesNumber of ElementsCalculated Flow Rate (g/s)
Mesh 1206,9171,306,5895.247
Mesh 2345,3521,752,7215.261
Mesh 3627,4832,048,0455.268
Table 3. Calculated results of effective orifice flow coefficients.
ComponentEffective Flow Area A (m2)Simulated Flow Rate Q (g/s)Effective Flow Coefficient Cd
First-stage PRV1.41 × 10−64.9480.033
Second-stage PRV2.89 × 10−65.2610.172
Table 4. Parameter settings for the two-stage hydrogen pressure-reducing valve.
Parameter DescriptionSymbol/UnitValue
First-Stage Valve
Moving assembly massm1/kg0.06
Main spring stiffnessk1/N · mm−1647.4
Main spring pre-compressionx1/mm9.4
Auxiliary spring stiffnessk2/N · mm−150
Auxiliary spring pre-compressionx2/mm1.2
Valve seat orifice diameterd1/mm4
Valve stem diameterd2/mm3
Valve core cone half-angleα50
Low-pressure chamber volumeV2/mm38038.4
Second-Stage Valve
Moving assembly massm2/kg0.05
Main spring stiffnessk3/N · mm−192.5
Main spring pre-compressionx3/mm5.8
Auxiliary spring stiffnessk4/N · mm−18.77
Auxiliary spring pre-compressionx4/mm0.8
Valve stem diameterd5/mm3
Diaphragm outer diameterD/mm40
Feedback orifice areaA13/mm212.56
Disclaimer/Publisher’s Note: The statements, opinions and data contained in all publications are solely those of the individual author(s) and contributor(s) and not of MDPI and/or the editor(s). MDPI and/or the editor(s) disclaim responsibility for any injury to people or property resulting from any ideas, methods, instructions or products referred to in the content.