Less Is More: Higher-Skilled Sim Racers Allocate Significantly Less Attention to the Track Relative to the Display Features than Lower-Skilled Sim Racers


Abstract
1. Introduction
2. Materials and Methods
2.1. Participants
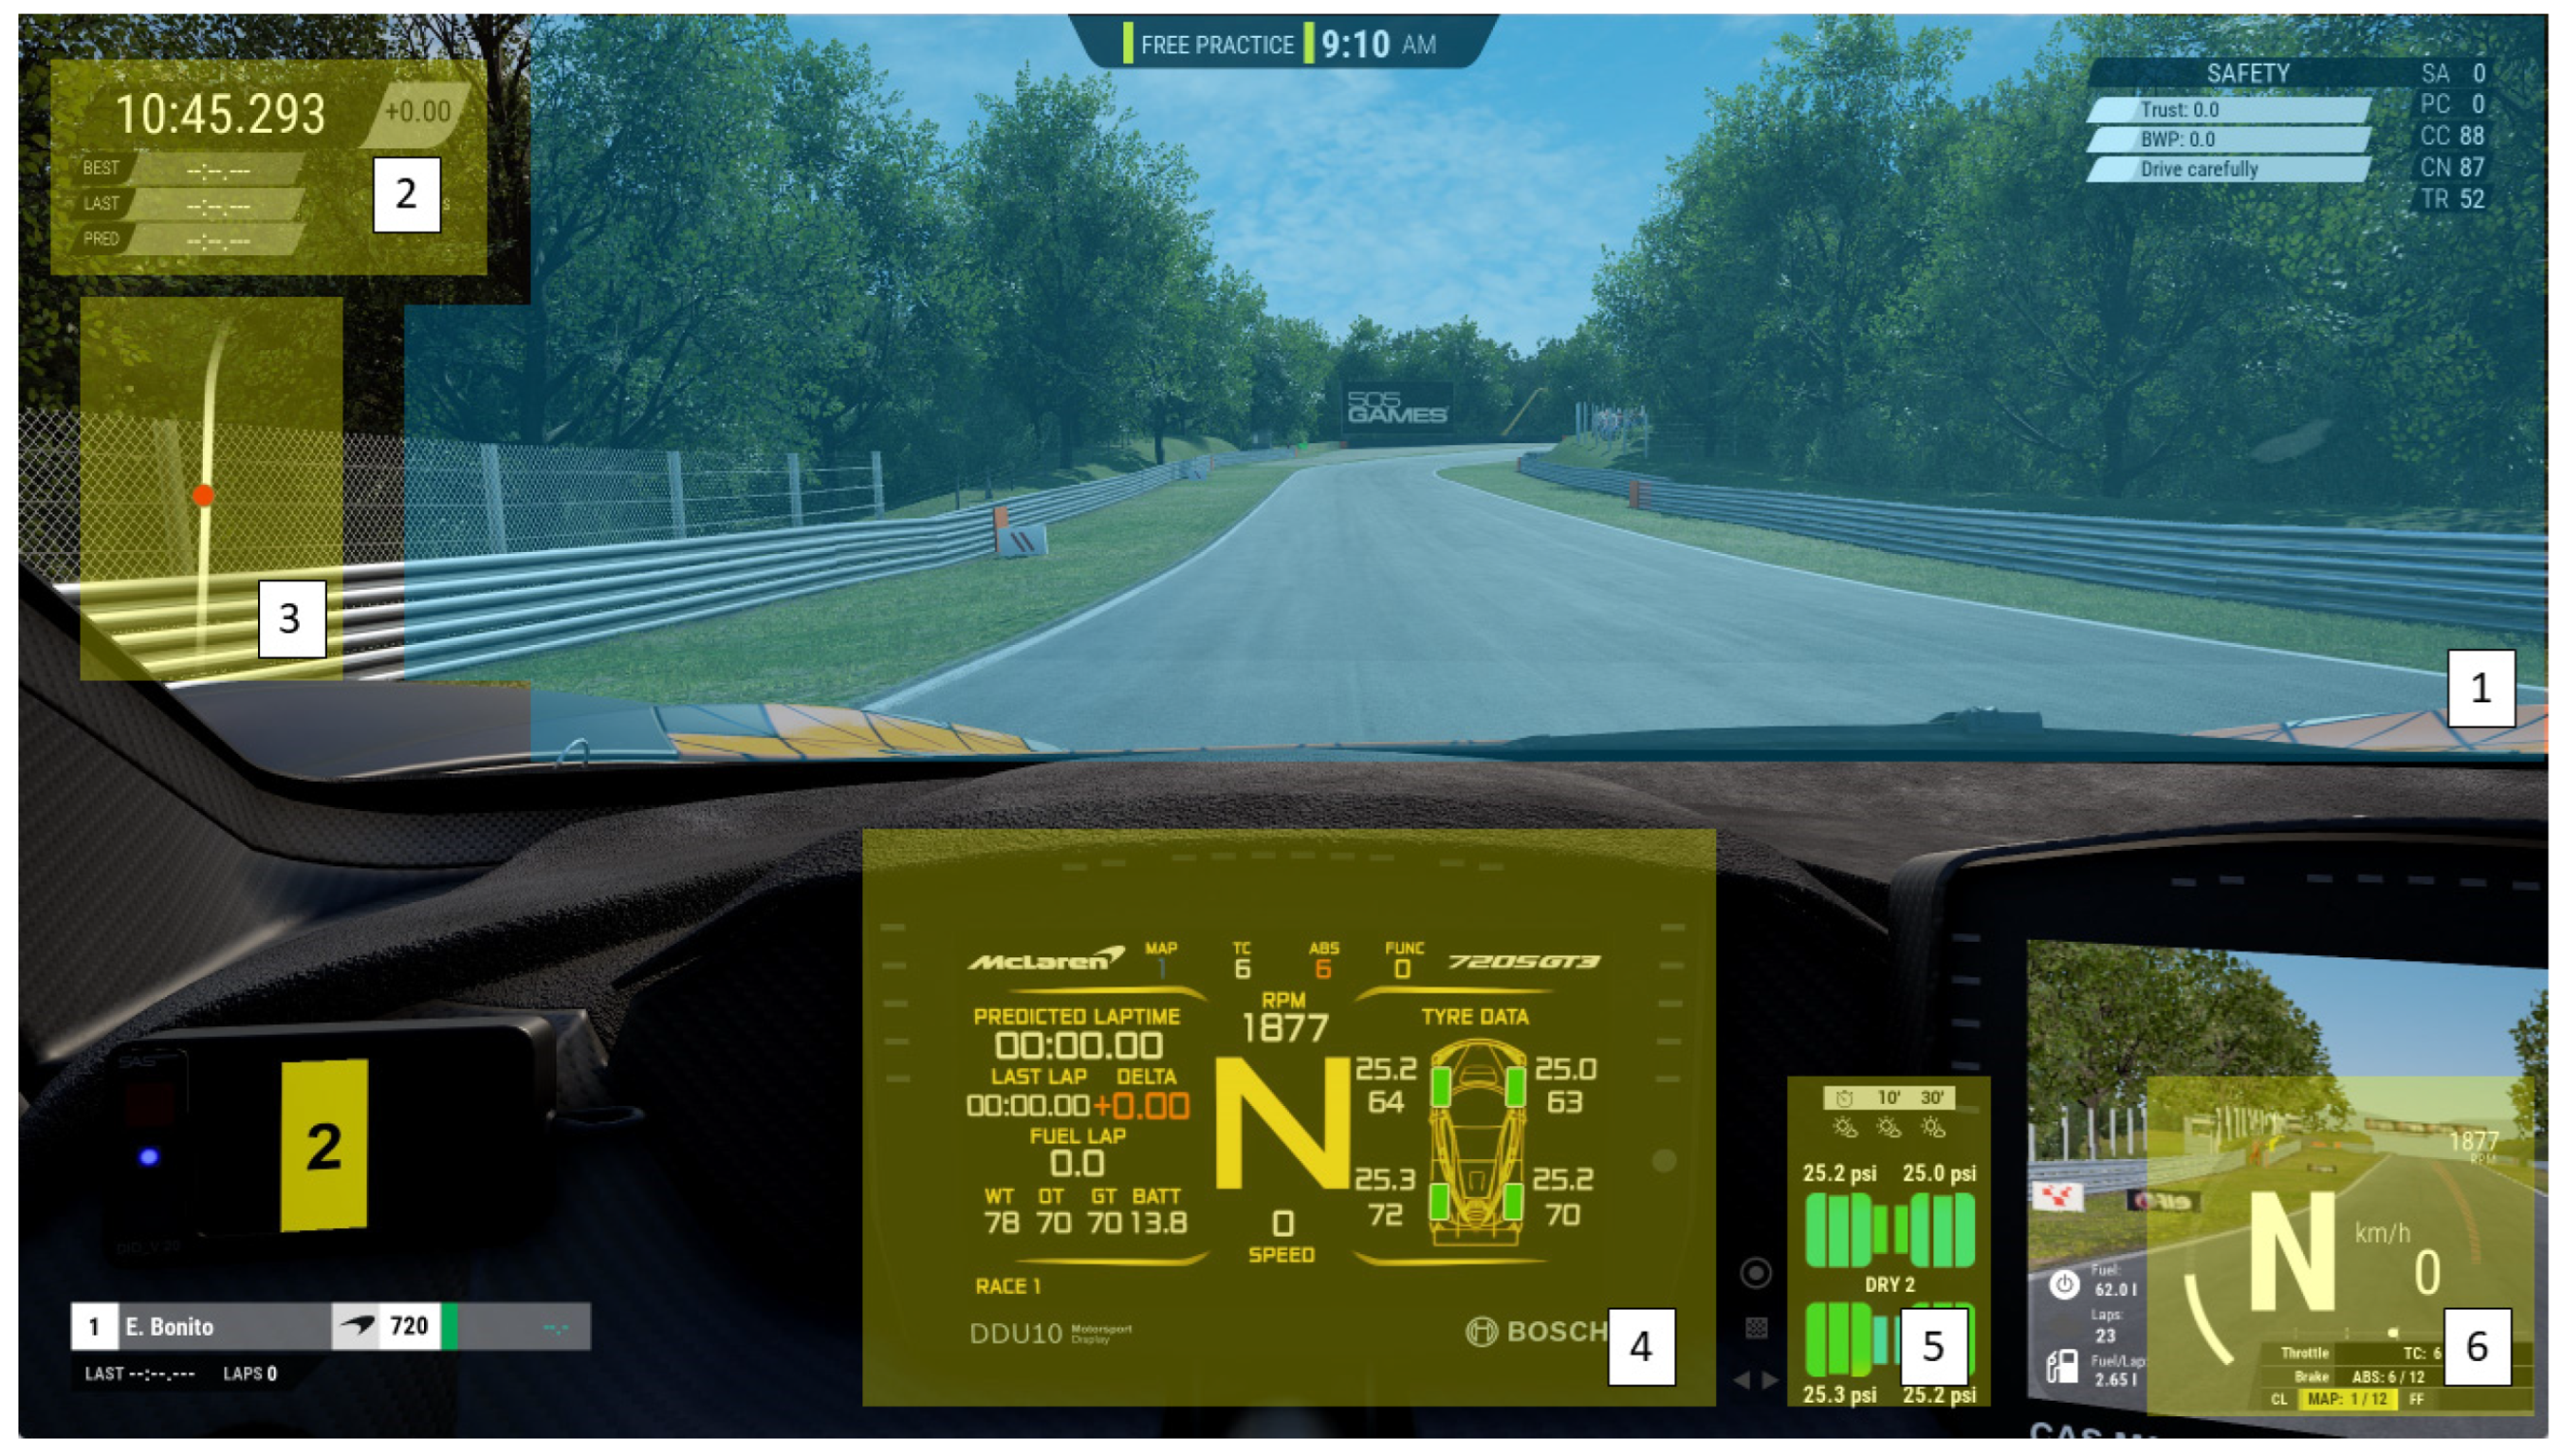
2.2. Materials
2.3. Protocol
2.4. Data Processing
- Normalised Total Fixation Duration (TFDn)
- Normalised Average Fixation Duration (AFDn)
- Fixations Per Second (FCn)
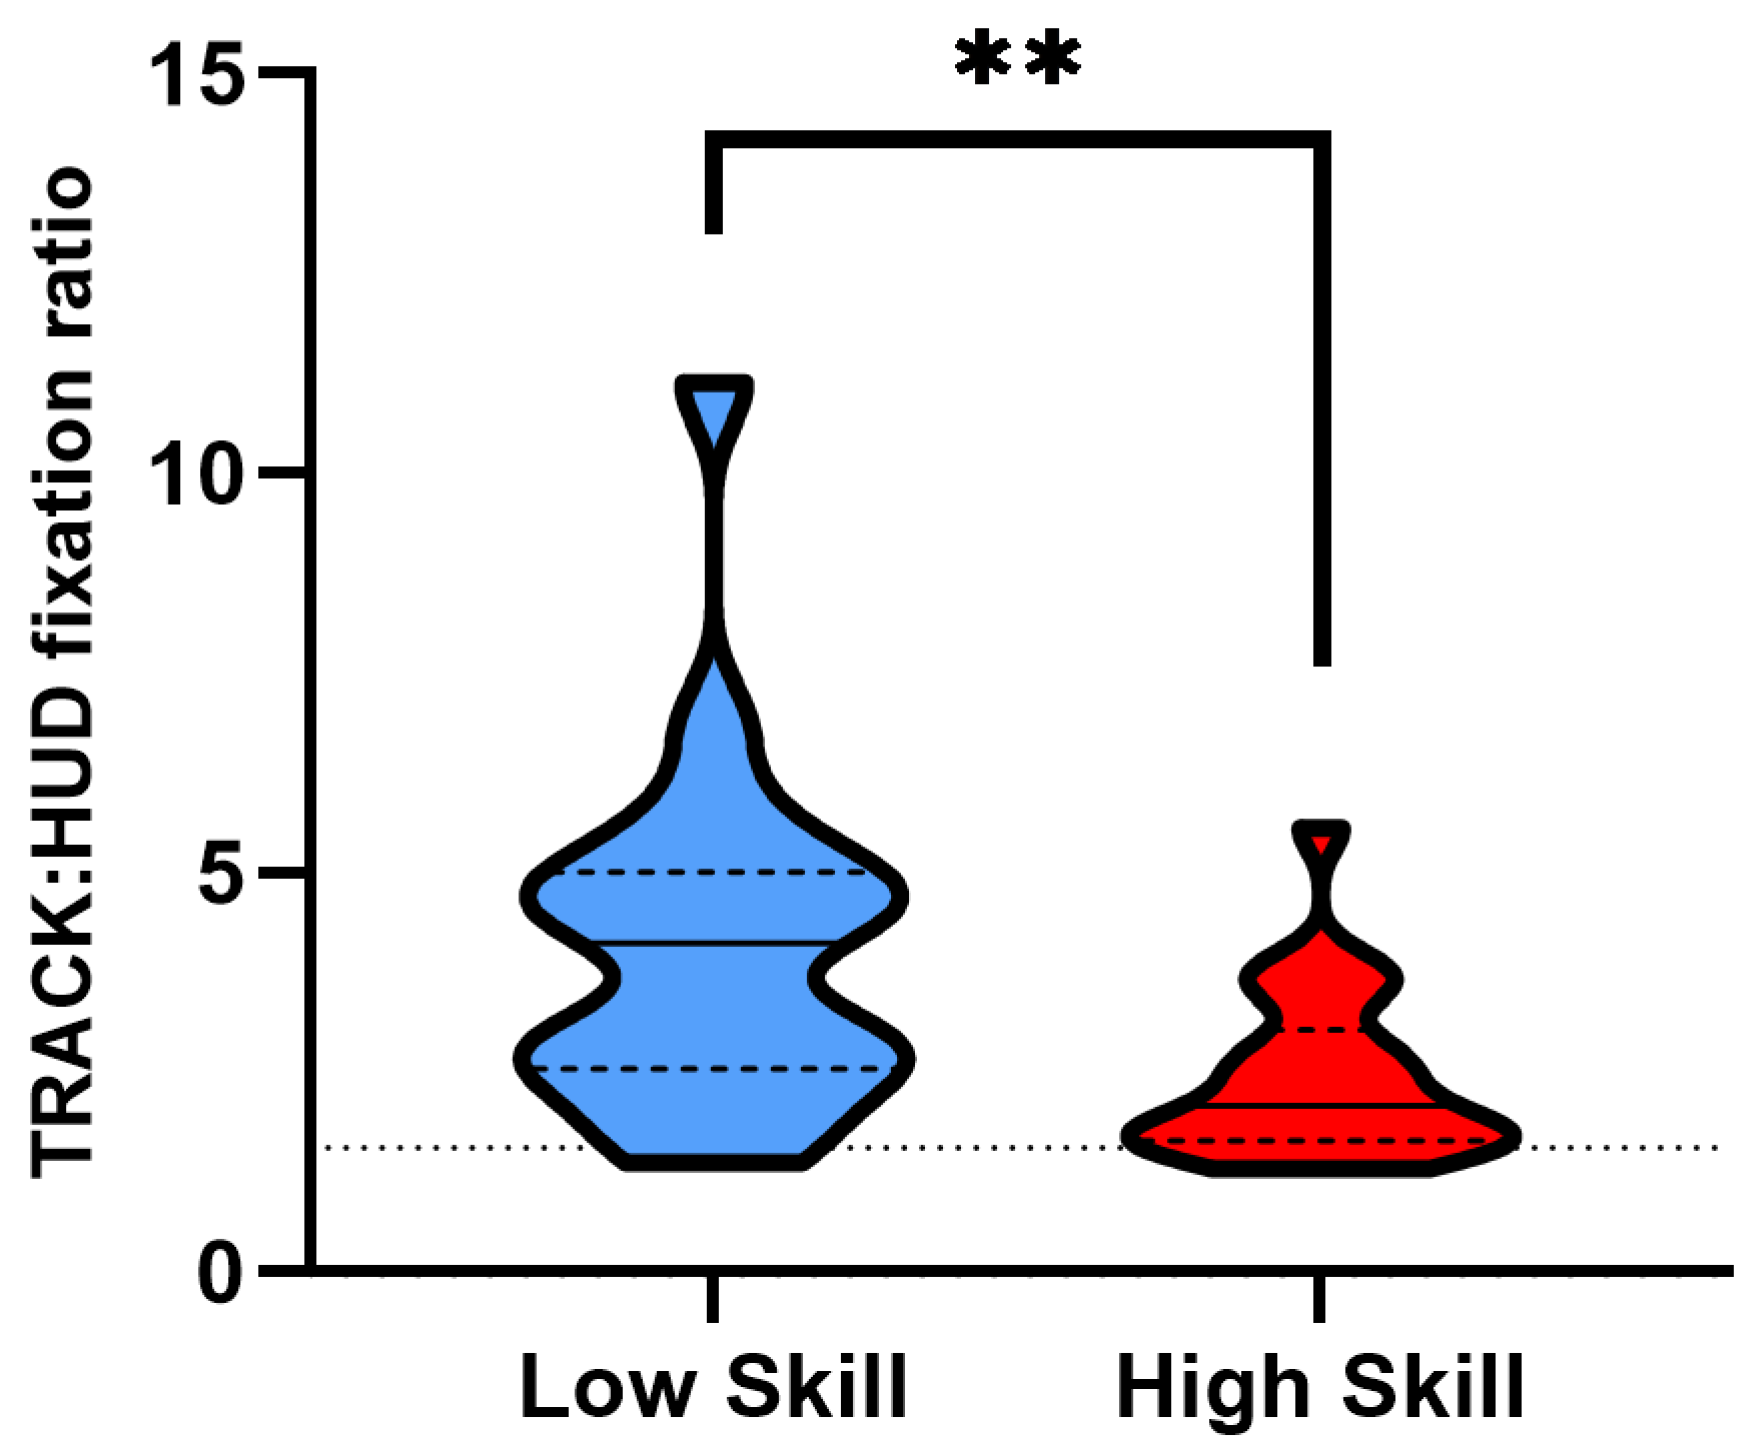
- TRACK:HUD Fixation Ratio
- Average Fixations Per Second (FPS) across Corners (Corner FCn)where CFPS refers to the number of fixations in a corner divided by the total time spent in that corner sector. Average CFPS value calculated across all 9 corner sectors (Corner FCn).
- Normalised Average Fixation Duration across Corners (Corner AFDn)where CAFDn refers to the average fixation duration in a corner sector divided by the total time spent in that corner sector, multiplied by 100. Average CAFDn value calculated across all 9 corner sectrors (Corner AFDn).
- Normalised Total Fixation Duration across Corners (Corner TFDn)where CTFDn refers to the total fixation duration in a corner sector divided by the total time spent in that corner sector, multiplied by 100. Average CTFDn value calculated across all 9 corner sectors (Corner TFDn).
2.5. Data Analysis
3. Results
3.1. Skill Level Comparisons
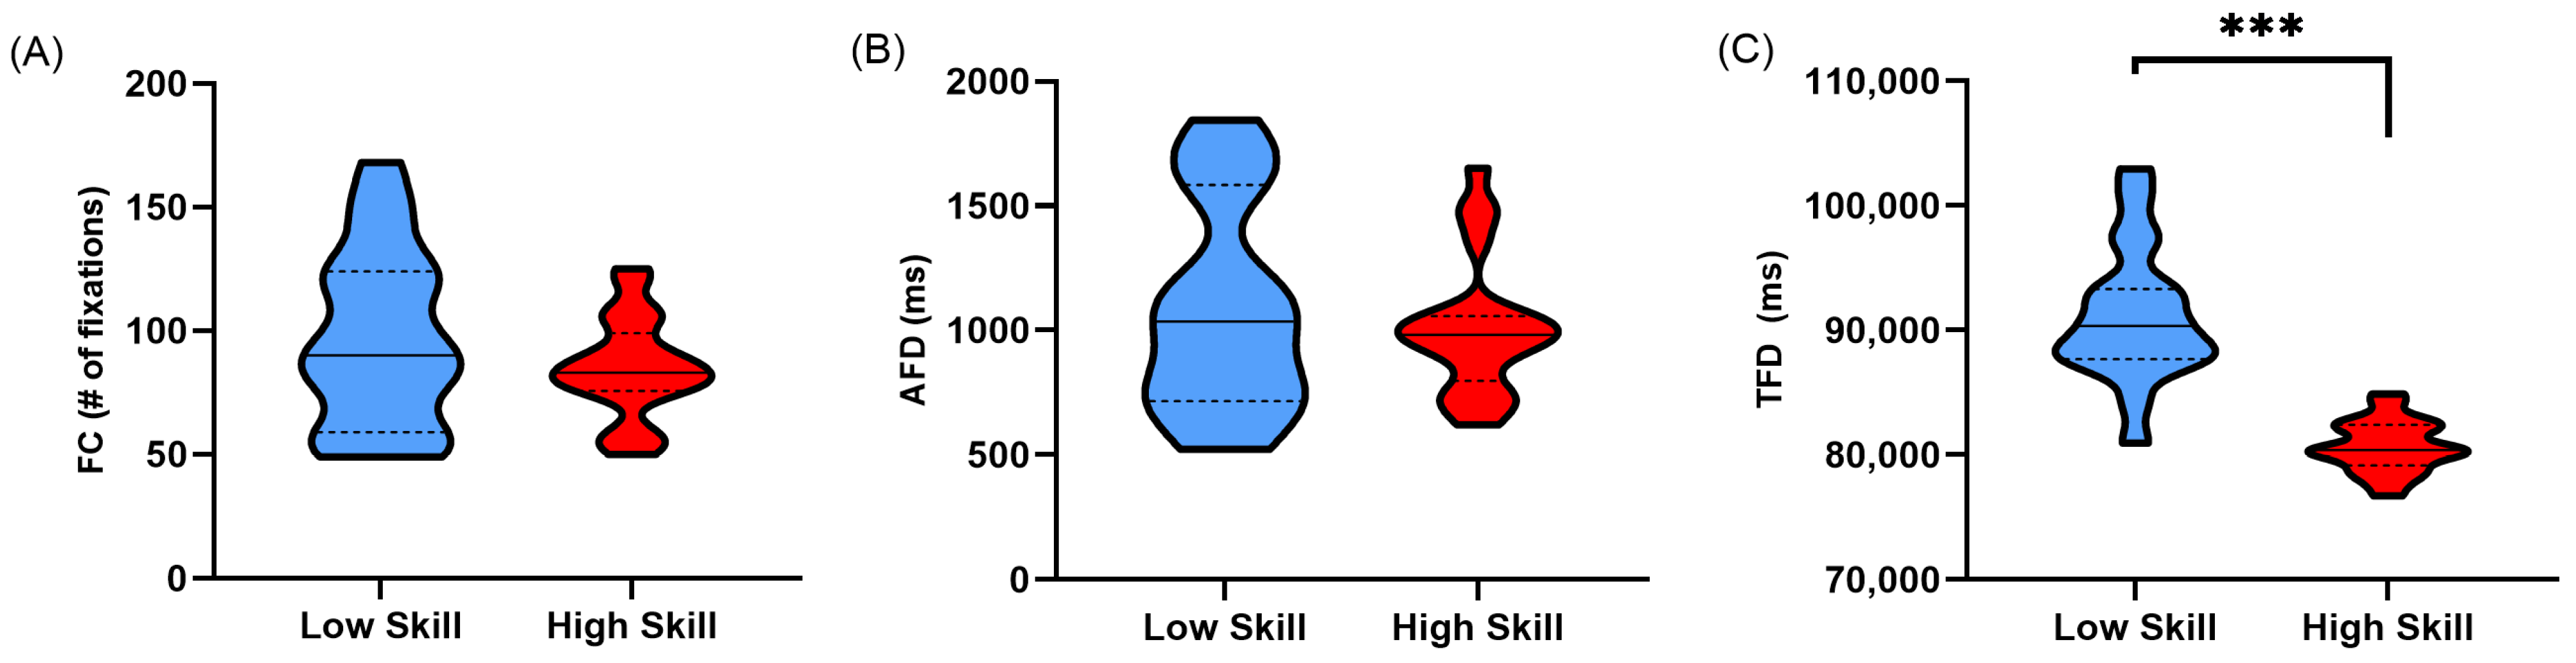
3.2. Raw Whole-Lap Fixation Metrics (Non-Normalised)
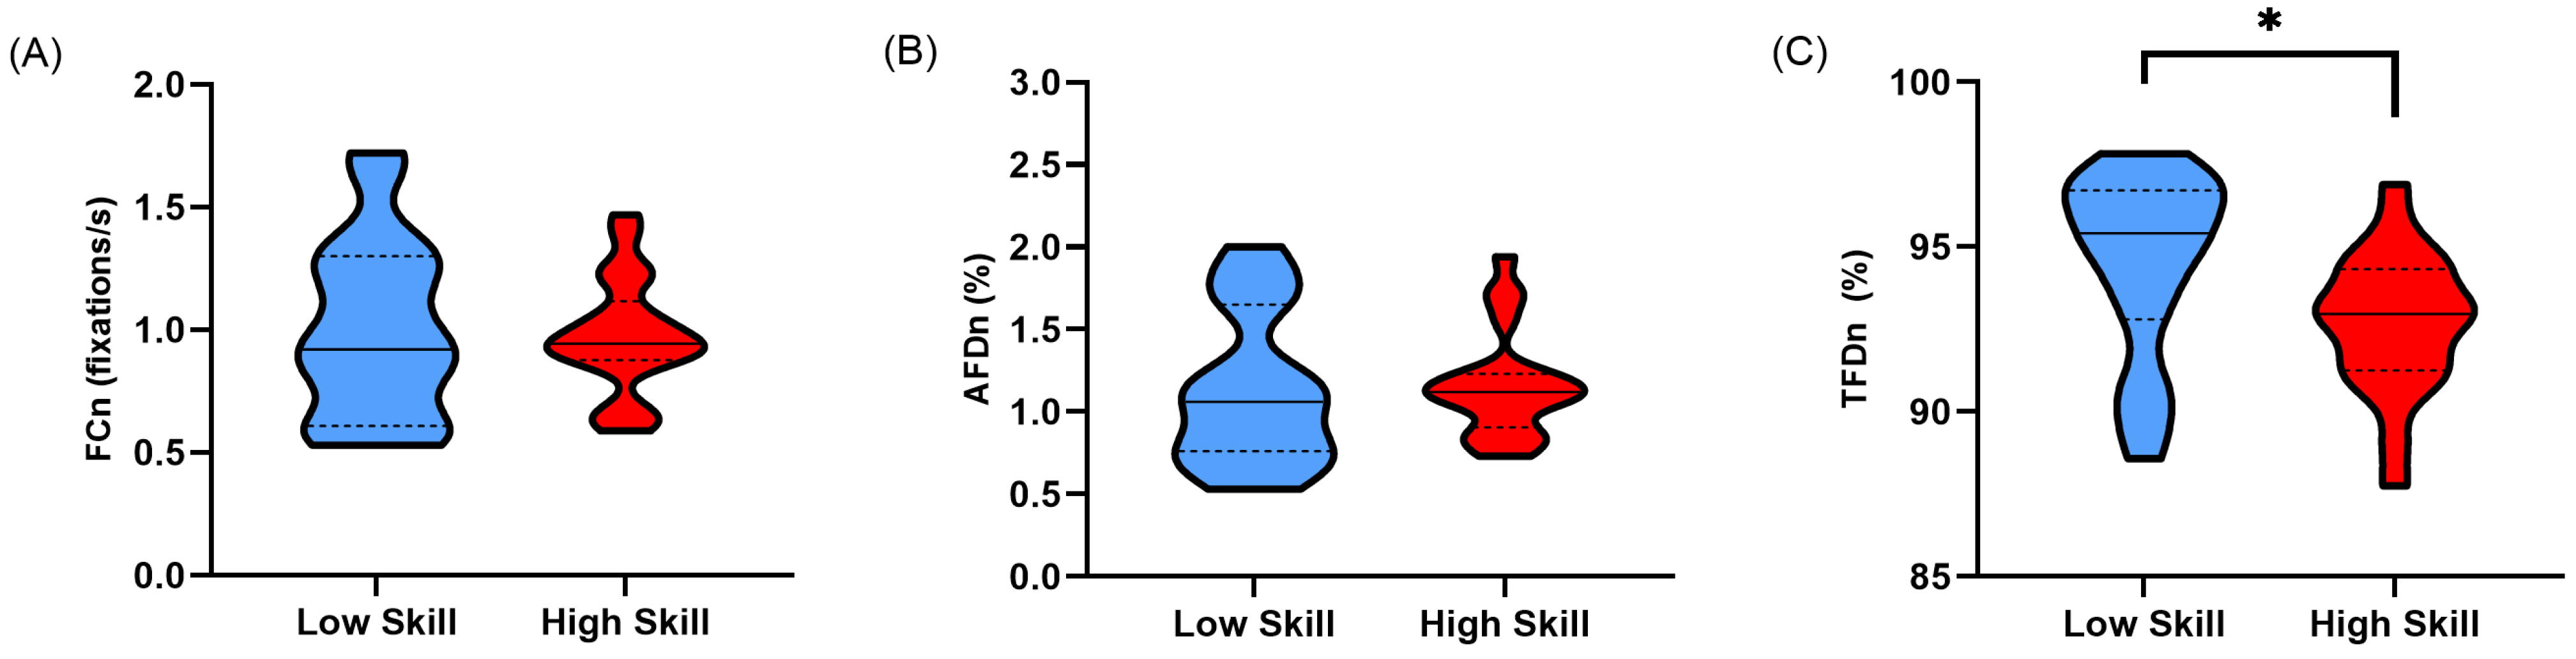
3.3. Normalised Whole-Lap Fixation Metrics
3.4. Fixation Allocation Ratio
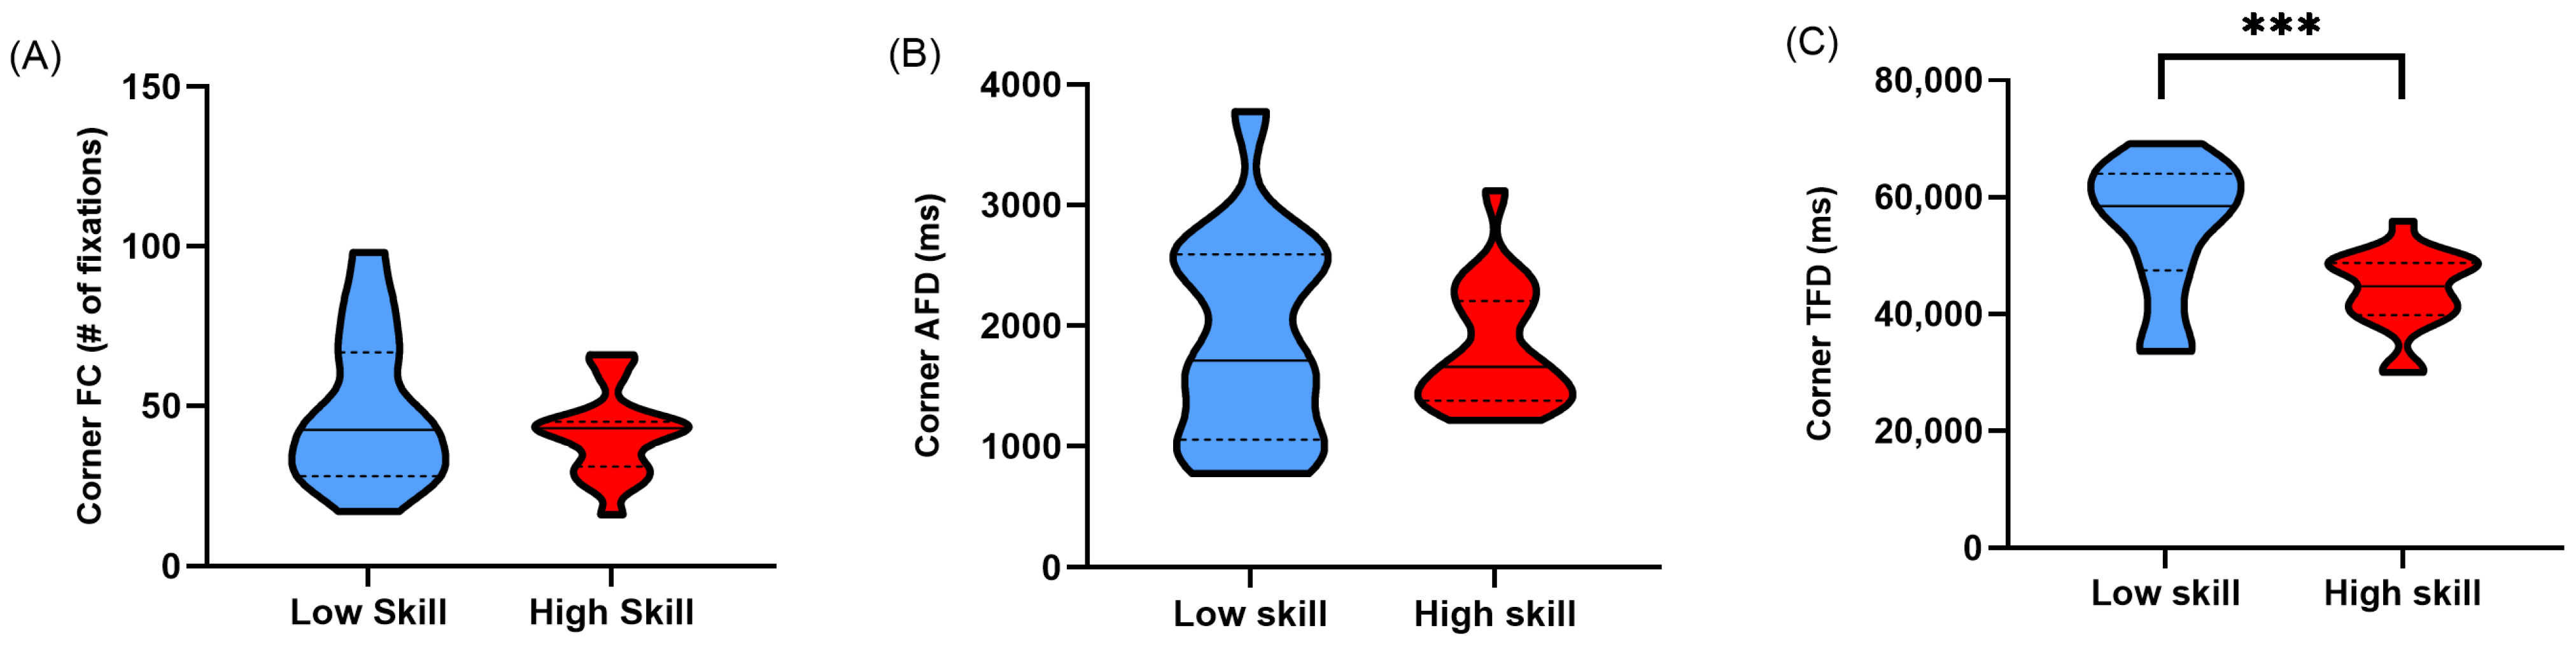
3.5. Raw Fixation Metrics in Corner Sectors (Non-Normalised)
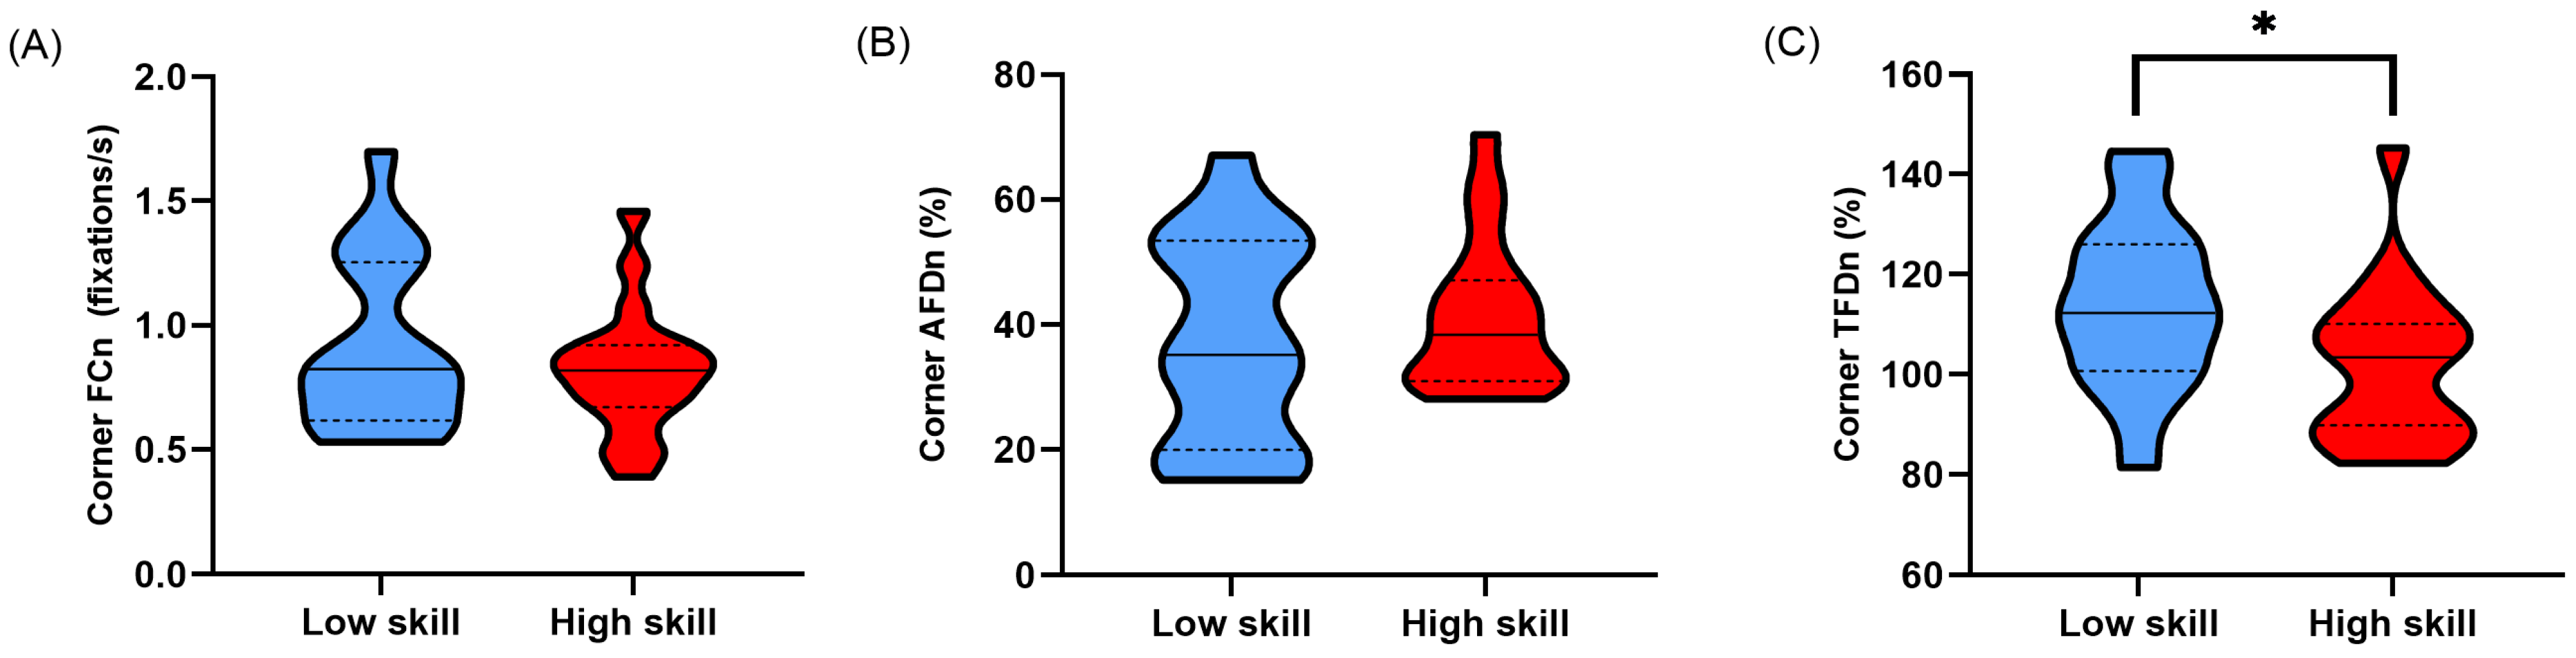
3.6. Normalised Fixation Metrics in Corner Sectors
4. Discussion
5. Conclusions
Author Contributions
Funding
Institutional Review Board Statement
Informed Consent Statement
Data Availability Statement
Conflicts of Interest
Appendix A
- Gain—80%
- Minimum Force—0%
- Damper—0%
- Dynamic Damping—100%
- Road Effects—40%
- Frequency—400Hz
- Steer Lock—1080°
- Steer Linearity—1.00
- Brake Gamma—1.00
- Gearshift Debouncing—50 ms
- Manufacturer Extras—Enabled
- Trueforce Audio—50%
- Dynamic Weather—Disabled
- Variability—0%
- Cloud Cover—25%
- Temperature—27 °C
- Random Weather—Disabled
- Grip Level—Fast
- Wetness—0%
- Standing Water—0%
- Safe Preset
- Traction Control—6/12
- ABS—6/12
- Engine Map—1/12
- Sensitivity—50
- Operating Range (angle)—1080
- Dampener—10
- Strength—8 Nm
- Force Feedback Filter—11
- Brake Sensitivity—50
- Throttle Sensitivity—50
- Brake Force—30 kg
Appendix B
- Noise reduction—Moving median
- Window size (samples)—3
- Velocity calculator window length—20 ms
- I-VT classifier—100 °/s
- Merge adjacent fixations—On
- Max. time between fixations—75 ms
- Max. angle between fixations—0.5°
- Discard short fixations—On
- Minimum fixation duration—60 ms
- Reclassify as saccade—Off
References
- Paiva, D. Experiencing Virtual Places: Insights on the Geographies of Sim Racing. J. Cult. Geogr. 2014, 32, 145–168. [Google Scholar] [CrossRef]
- Lefebvre, F.; Malinen, V.; Karhulahti, V. Sociohistorical Development of Sim Racing in European and Asia-Pacific Esports: A Cross-Cultural Qualitative Study. Convergence 2024, 0, 1–18. [Google Scholar] [CrossRef]
- Tudor, E.S. The Emergence of eSport during COVID-19: How Sim Racing Replaced Live Motorsport in 2020. J. Motorsport Cult. Hist. 2020, 1, 8. [Google Scholar]
- Lappi, O. The Racer’s Brain—How Domain Expertise Is Reflected in the Neural Substrates of Driving. Front. Hum. Neurosci. 2015, 9, 635. [Google Scholar] [CrossRef]
- Williams, A.M.; Ericsson, K.A. Perceptual-Cognitive Expertise in Sport: Some Considerations When Applying the Expert Performance Approach. Hum. Mov. Sci. 2005, 24, 283–307. [Google Scholar] [CrossRef]
- Law, B.K.H.; Atkins, M.S.; Kirkpatrick, A.E.; Lomax, A.J. Eye Gaze Patterns Differentiate Novice and Experts in a Virtual Laparoscopic Surgery Training Environment. In Proceedings of the 2004 Symposium on Eye Tracking Research & Applications, San Antonio, TX, USA, 22–24 March 2004. [Google Scholar] [CrossRef]
- Wilson, M.R.; McGrath, J.; Vine, S.J.; Brewer, J.; Defriend, D.; Masters, R.S.W. Psychomotor Control in a Virtual Laparoscopic Surgery Training Environment: Gaze Control Parameters Differentiate Novices from Experts. Surg. Endosc. Other Interv. Tech. 2010, 24, 2458–2464. [Google Scholar] [CrossRef]
- Dreiseitl, S.; Pivec, M.; Binder, M. Differences in Examination Characteristics of Pigmented Skin Lesions: Results of an Eye Tracking Study. Artif. Intell. Med. 2012, 54, 201–205. [Google Scholar] [CrossRef]
- Bertram, R.; Helle, L.; Kaakinen, J.K.; Svedström, E. The Effect of Expertise on Eye Movement Behaviour in Medical Image Perception. PLoS ONE 2013, 8, e66169. [Google Scholar] [CrossRef] [PubMed]
- Spitz, J.; Put, K.; Wagemans, J.; Williams, A.M.; Helsen, W. Visual Search Behaviors of Association Football Referees during Assessment of Foul Play Situations. Cogn. Res. Princ. Implic. 2016, 1, 12. [Google Scholar] [CrossRef]
- North, J.S.; Williams, A.M.; Hodges, N.J.; Ward, P.; Ericsson, K.A. Perceiving Patterns in Dynamic Action Sequences: Investigating the Processes Underpinning Stimulus Recognition and Anticipation Skill. Appl. Cogn. Psychol. 2009, 23, 878–894. [Google Scholar] [CrossRef]
- Marteniuk, R.G. Cognitive Information Processes in Motor Short-Term Memory and Movement Production. In Motor Control Issues and Trends; Academic Press: Cambridge, MA, USA, 1976; pp. 175–186. [Google Scholar] [CrossRef]
- Brams, S.; Ziv, G.; Levin, O.; Spitz, J.; Wagemans, J.; Williams, A.M.; Helsen, W. The Relationship between Gaze Behavior, Expertise, and Performance: A Systematic Review. Psychol. Bull. 2019, 145, 980–1027. [Google Scholar] [CrossRef] [PubMed]
- Vickers, J.N. Gaze Control in Putting. Perception 1992, 21, 117–132. [Google Scholar] [CrossRef] [PubMed]
- Vickers, J.N. Control of Visual Attention during the Basketball Free Throw. Am. J. Sports Med. 1996, 24 (Suppl. S6), S93–S97. [Google Scholar] [CrossRef]
- Underwood, G.; Chapman, P.; Brocklehurst, N.; Underwood, J.; Crundall, D. Visual attention while driving: Sequences of eye fixations made by experienced and novice drivers. Ergonomics 2003, 46, 629–646. [Google Scholar] [CrossRef]
- Robbins, C.J.; Allen, H.A.; Chapman, P. Comparing Drivers’ Visual Attention at Junctions in Real and Simulated Environments. Appl. Ergon. 2019, 80, 89–101. [Google Scholar] [CrossRef]
- Tuhkanen, S.; Pekkanen, J.; Mole, C.; Wilkie, R.M.; Lappi, O. Can Gaze Control Steering? J. Vis. 2023, 23, 12. [Google Scholar] [CrossRef]
- Alyan, E.; Arnau, S.; Reiser, J.E.; Getzmann, S.; Karthaus, M.; Wascher, E. Blink-related EEG activity measures cognitive load during proactive and reactive driving. Sci. Rep. 2023, 13, 19379. [Google Scholar] [CrossRef] [PubMed]
- Kunos Simulazioni. Assetto Corsa Competizione. 2018. Available online: https://assettocorsa.gg/assetto-corsa-competizione/ (accessed on 25 January 2024).
- MoTeC PTY Ltd. MoTeC I2 Pro. 2022. Available online: https://www.motec.com.au/products/I2?catId=4 (accessed on 25 January 2024).
- Tobii, A.B. Tobii Pro Glasses 3. User Manual. 2022. Available online: https://go.tobii.com/tobii-pro-glasses-3-user-manual (accessed on 25 January 2024).
- Onkhar, V.; Dodou, D.; De Winter, J. Evaluating the Tobii Pro Glasses 2 and 3 in Static and Dynamic Conditions. Behav. Res. Methods 2023, 1–18. [Google Scholar] [CrossRef]
- Hojaji, F.; Toth, A.J.; Joyce, J.M.; Campbell, M.J. Ai-Enabled Prediction of Sim Racing Performance Using Telemetry Data. Comput. Hum. Behav. 2024. submitted. [Google Scholar] [CrossRef]
- Tobii, A.B. Tobii Pro Lab. User Manual. 2022. Available online: https://go.tobii.com/tobii_pro_lab_user_manual (accessed on 25 January 2024).
- Singer, R.N. Performance and human factors: Considerations about cognition and attention for self-paced and externally-paced events. Ergonomics 2000, 43, 1661–1680. [Google Scholar] [CrossRef]
- Lappi, O. The Racer’s Mind—How core Perceptual-Cognitive expertise is reflected in deliberate practice procedures in professional motorsport. Front. Psychol. 2018, 9, 1294. [Google Scholar] [CrossRef] [PubMed]
- Furukado, R.; Hagiwara, G. Gaze and Electroencephalography (EEG) Parameters in Esports: Examinations Considering Genres and Skill Levels. IEICE Proceeding Ser. 2023, 77, 107–112. [Google Scholar]
- Lappi, O. Gaze Strategies in Driving–An Ecological Approach. Front. Psychol. 2022, 13, 821440. [Google Scholar] [CrossRef] [PubMed]
- Holmqvist, K.; Andersson, R. Eye Tracking: A Comprehensive Guide to Methods, Paradigms, and Measures; Createspace Independent Publishing Platform: Scotts Valley, CA, USA, 2017. [Google Scholar]
- Land, M.F.; Tatler, B.W. Steering with the Head. Curr. Biol. 2001, 11, 1215–1220. [Google Scholar] [CrossRef] [PubMed]
- Van Leeuwen, P.M.; De Groot, S.; Happee, R.; De Winter, J.C.F. Differences between Racing and Non-Racing Drivers: A Simulator Study Using Eye-Tracking. PLoS ONE 2017, 12, e0186871. [Google Scholar] [CrossRef] [PubMed]
- Wilson, M.R.; Vine, S.J.; Bright, E.; Masters, R.; Defriend, D.; McGrath, J. Gaze Training Enhances Laparoscopic Technical Skill Acquisition and Multi-Tasking Performance: A Randomized, Controlled Study. Surg. Endosc. Other Interv. Tech. 2011, 25, 3731–3739. [Google Scholar] [CrossRef] [PubMed]
- Vine, S.J.; Wilson, M.R. Quiet Eye Training: Effects on Learning and Performance under Pressure. J. Appl. Sport Psychol. 2010, 22, 361–376. [Google Scholar] [CrossRef]
- Vine, S.J.; Moore, L.J.; Wilson, M.R. Quiet Eye Training Facilitates Competitive Putting Performance in Elite Golfers. Front. Psychol. 2011, 2, 8. [Google Scholar] [CrossRef]
- Jeong, I.; Kudo, K.; Kaneko, N.; Nakazawa, K. Esports Experts Have a Wide Gaze Distribution and Short Gaze Fixation Duration: A Focus on League of Legends Players. PLoS ONE 2024, 19, e0288770. [Google Scholar] [CrossRef]


| Variable | Low-Skilled (Mean ± SD) | High-Skilled (Mean ± SD) | p-Value |
|---|---|---|---|
| Hours sim racing/week | 4.42 ± 5.18 | 18.45 ± 10.43 | <0.001 |
| Lap time (ms) | 96,479.74 ± 4854.94 | 87,029.36 ± 1237.78 | <0.001 |
| Fixation count (FC) | 96.58 ± 35.78 | 85 ± 20.85 | 0.111 |
| Average fixation duration (AFD; ms) | 1084.84 ± 423.88 | 1008.41 ± 272.35 | 0.252 |
| Total fixation duration (TFD; ms) | 91,183.47 ± 5482.65 | 80,681.41 ± 2069.5 | <0.001 |
| Fixations per second (FCn) | 1.00 ± 0.36 | 0.98 ± 0.23 | 0.410 |
| Normalised average fixation duration (AFDn; %) | 1.13 ± 0.47 | 1.16 ± 0.32 | 0.411 |
| Normalised total fixation duration (TFDn; %) | 94.50 ± 2.8 | 92.71 ± 2.11 | 0.013 |
| TRACK:HUD fixation ratio | 4.11 ± 2.27 | 2.44 ± 1.06 | 0.003 |
| Variable | Low-Skilled (Mean ± SD) | High-Skilled (Mean ± SD) | p-Value |
|---|---|---|---|
| Fixation count corners (Corners FC) | 48.44 ± 23.45 | 41.00 ± 13.12 | 0.135 |
| Average fixation duration corners (Corners AFD; ms) | 1884.82 ± 854.70 | 1807.53 ± 511.96 | 0.372 |
| Total fixation duration corners (Corners TFD; ms) | 55,147.00 ± 11,210.09 | 44,170.42 ± 6614.49 | 0.001 |
| Fixations per second corners (Corners FCn) | 0.92 ± 0.35 | 0.82 ± 0.26 | 0.171 |
| Normalised average fixation duration corners (Corners AFDn; %) | 37.34 ± 16.62 | 41.30 ± 12.08 | 0.211 |
| Normalised total fixation duration corners (Corners TFDn; %) | 113.79 ± 16.95 | 101.70 ± 15.82 | 0.018 |
Disclaimer/Publisher’s Note: The statements, opinions and data contained in all publications are solely those of the individual author(s) and contributor(s) and not of MDPI and/or the editor(s). MDPI and/or the editor(s) disclaim responsibility for any injury to people or property resulting from any ideas, methods, instructions or products referred to in the content. |
© 2024 by the authors. Licensee MDPI, Basel, Switzerland. This article is an open access article distributed under the terms and conditions of the Creative Commons Attribution (CC BY) license (https://creativecommons.org/licenses/by/4.0/).
Share and Cite
Joyce, J.M.; Campbell, M.J.; Hojaji, F.; Toth, A.J. Less Is More: Higher-Skilled Sim Racers Allocate Significantly Less Attention to the Track Relative to the Display Features than Lower-Skilled Sim Racers. Vision 2024, 8, 27. https://doi.org/10.3390/vision8020027
Joyce JM, Campbell MJ, Hojaji F, Toth AJ. Less Is More: Higher-Skilled Sim Racers Allocate Significantly Less Attention to the Track Relative to the Display Features than Lower-Skilled Sim Racers. Vision. 2024; 8(2):27. https://doi.org/10.3390/vision8020027
Chicago/Turabian StyleJoyce, John M., Mark J. Campbell, Fazilat Hojaji, and Adam J. Toth. 2024. "Less Is More: Higher-Skilled Sim Racers Allocate Significantly Less Attention to the Track Relative to the Display Features than Lower-Skilled Sim Racers" Vision 8, no. 2: 27. https://doi.org/10.3390/vision8020027
APA StyleJoyce, J. M., Campbell, M. J., Hojaji, F., & Toth, A. J. (2024). Less Is More: Higher-Skilled Sim Racers Allocate Significantly Less Attention to the Track Relative to the Display Features than Lower-Skilled Sim Racers. Vision, 8(2), 27. https://doi.org/10.3390/vision8020027