The Effects of Vision-Deprived Progressive Resistance Training on One-Repetition Maximum Bench Press Performance: An Exploratory Study

 , , ,
, , ,  , , ,
, , ,
Abstract
:1. Introduction
2. Methods
2.1. Design
2.2. Participants
2.3. Protocol
2.4. Statistical Analysis
2.4.1. Preliminary Analysis
2.4.2. Primary Analysis
2.4.3. Post Hoc Analyses
3. Results
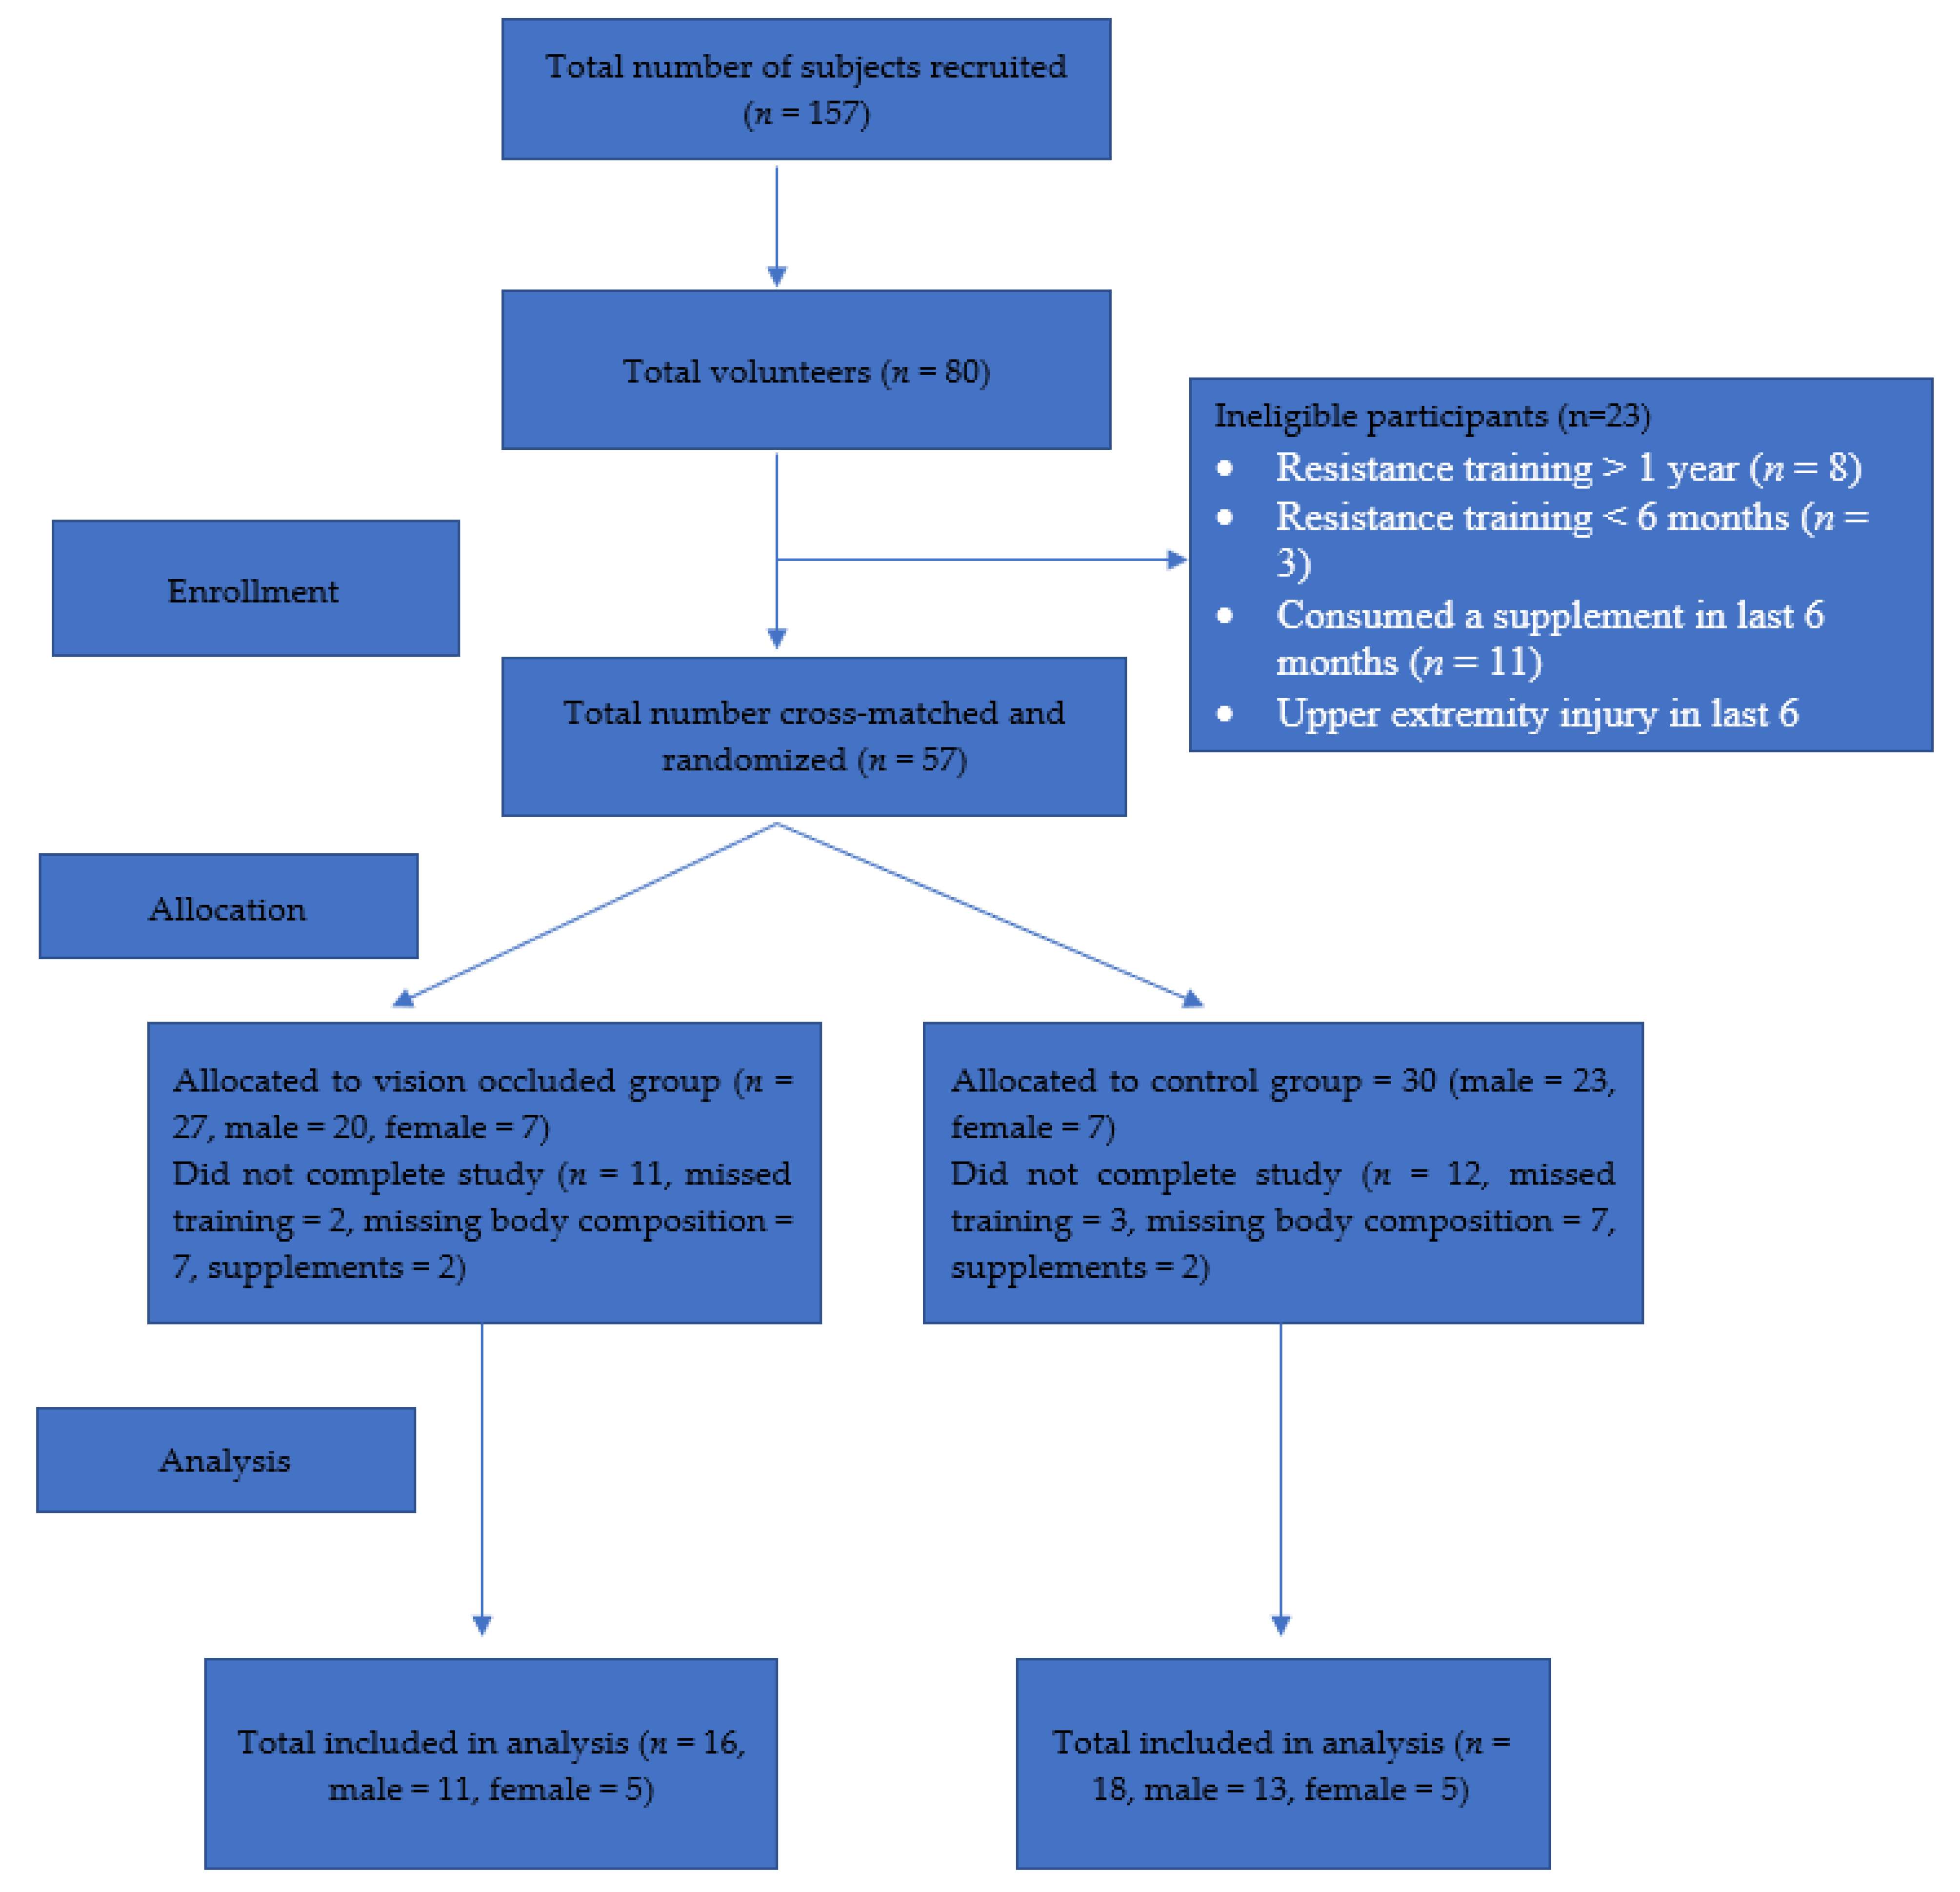
3.1. Participants
3.2. Pre–Post Differences between Groups
3.3. Pre–Post Differences for Both Groups
3.4. Pre–Post Differences for Experimental Group Only
3.5. Pre–Post Differences for Control Group Only
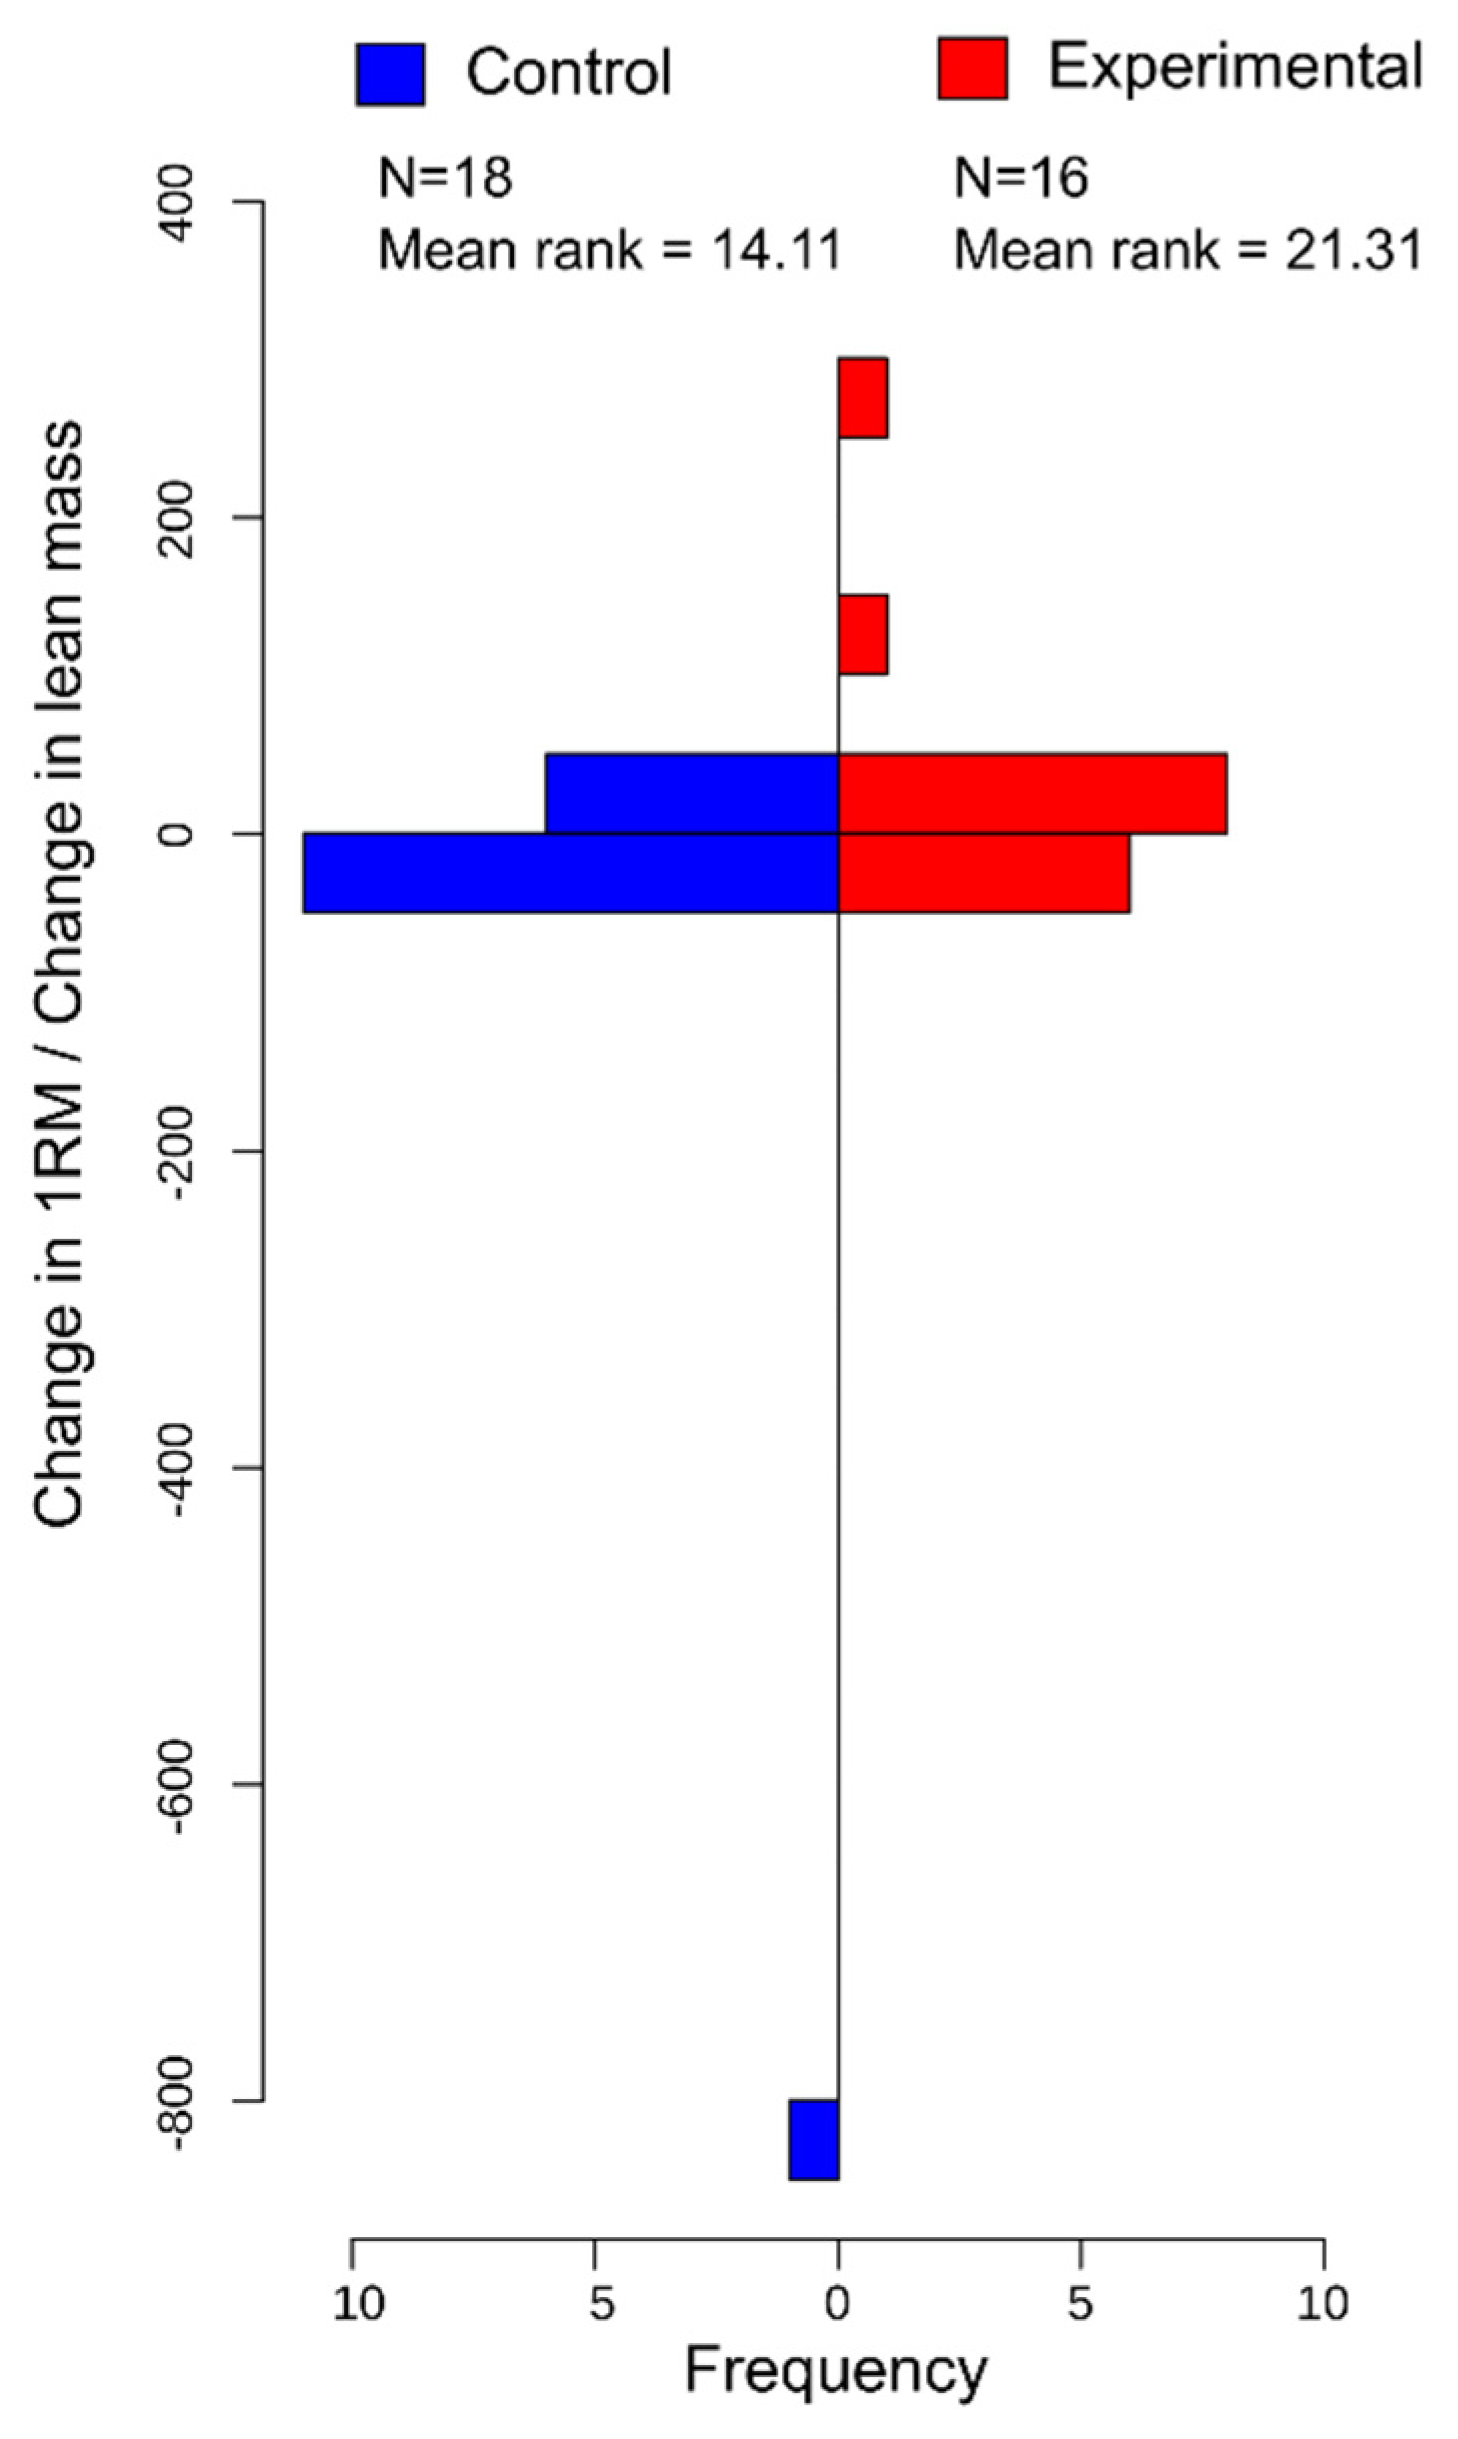
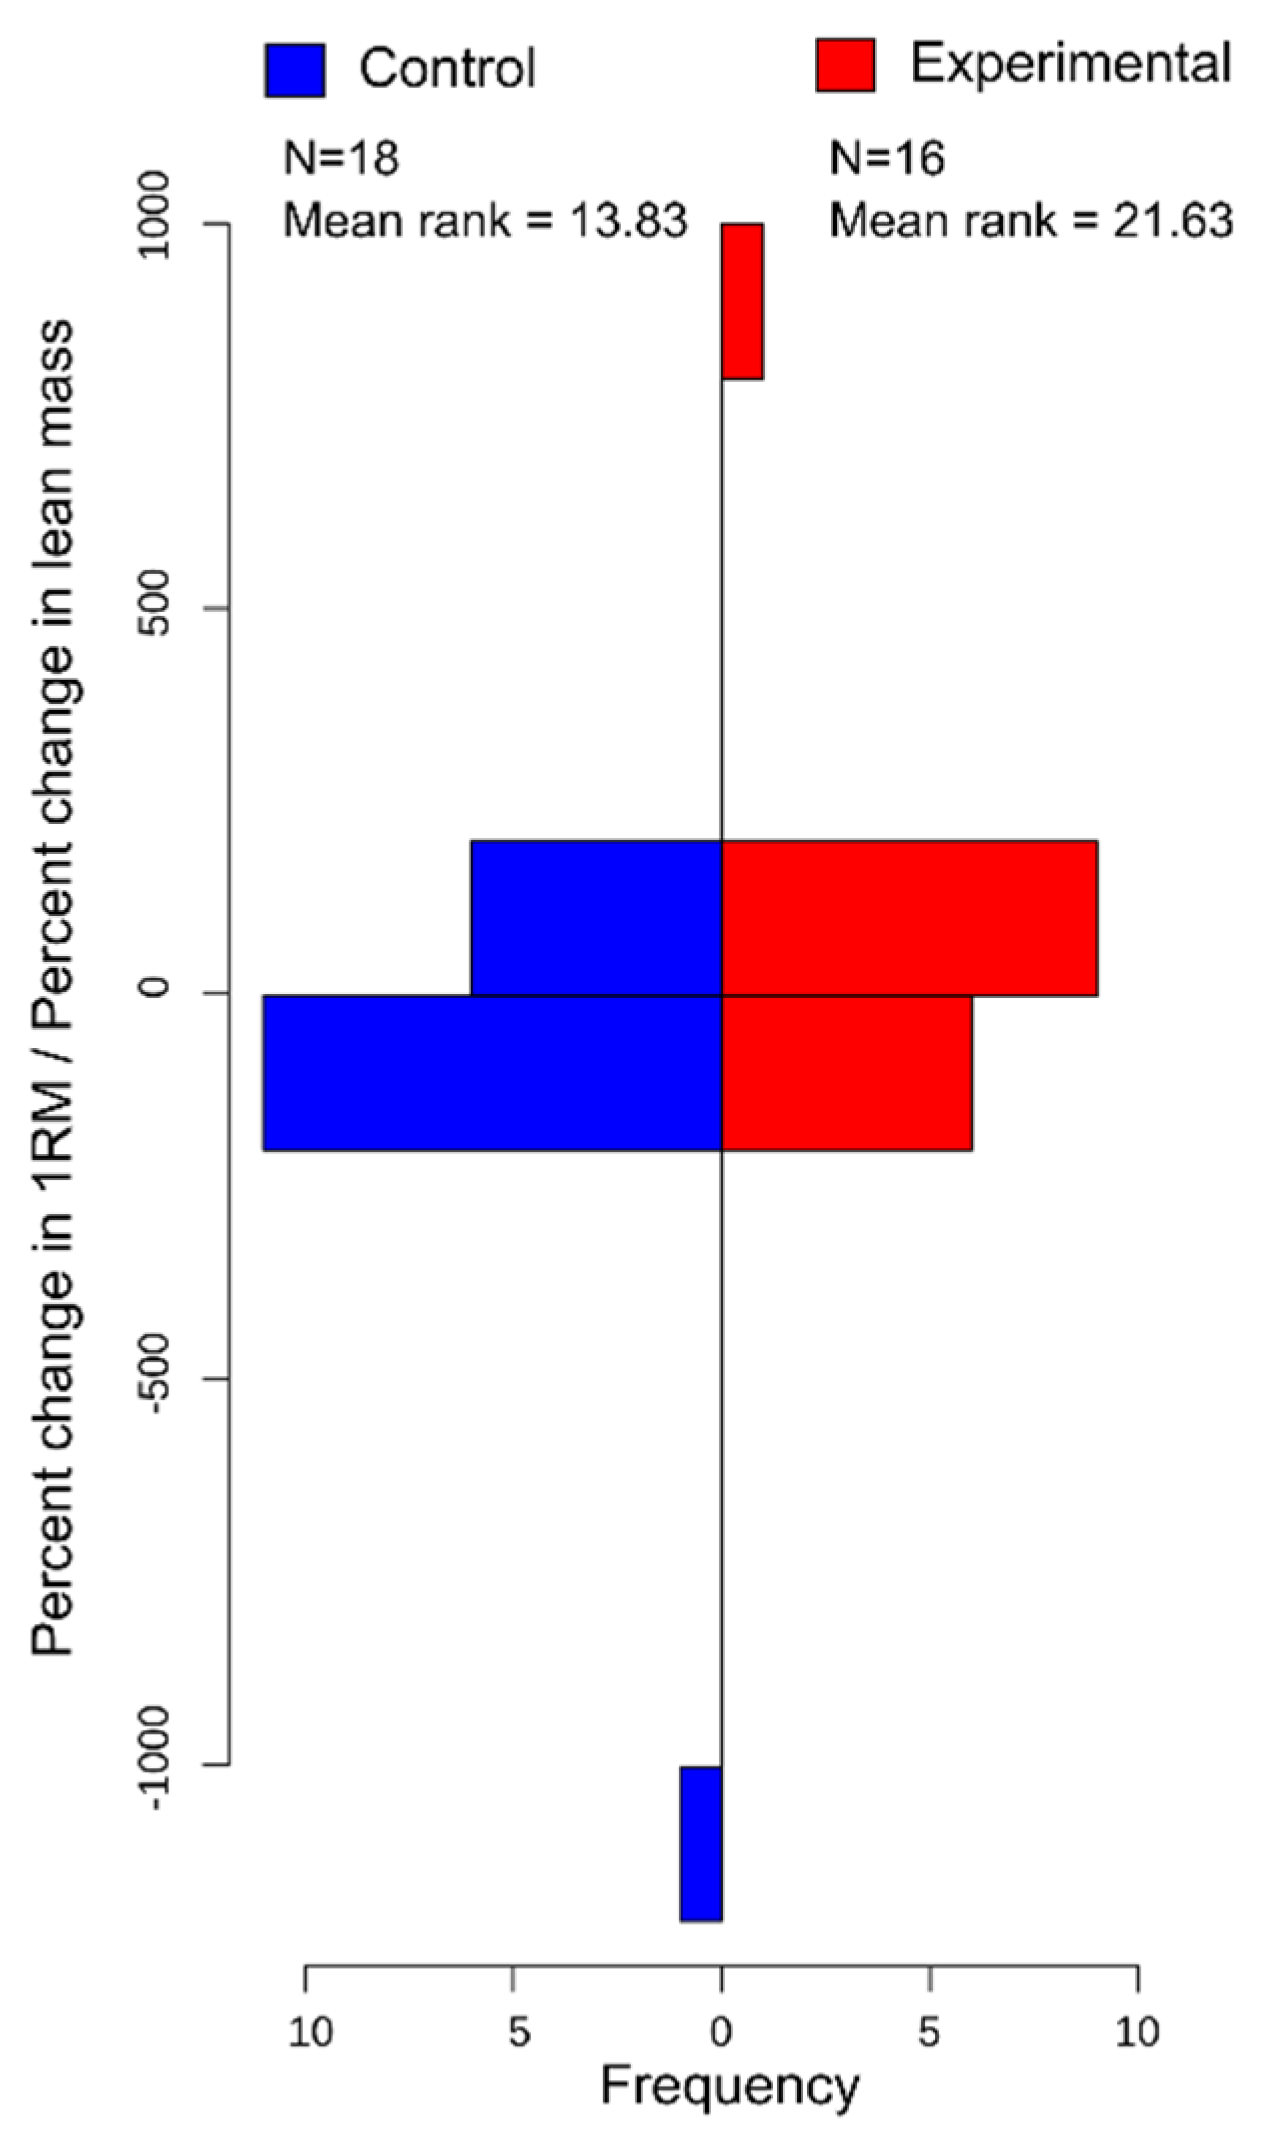
3.6. Post Hoc
4. Discussion
4.1. Practical Applications
4.2. Limitations
5. Conclusions
Author Contributions
Funding
Institutional Review Board Statement
Informed Consent Statement
Data Availability Statement
Acknowledgments
Conflicts of Interest
References
- Westcott, W.L. Resistance training is medicine: Effects of strength training on health. Curr. Sports Med. Rep. 2012, 11, 209–216. [Google Scholar] [CrossRef] [PubMed]
- Tortora, G.J.; Derrickson, B.H. Principles of Anatomy and Physiology; John Wiley & Sons: Hoboken, NJ, USA, 2018; ISBN 1-119-44445-4. [Google Scholar]
- Perrin, P.; Deviterne, D.; Hugel, F.; Perrot, C. Judo, better than dance, develops sensorimotor adaptabilities involved in balance control. Gait Posture 2002, 15, 187–194. [Google Scholar] [CrossRef]
- Hugel, F.; Cadopi, M.; Kohler, F.; Perrin, P.H. Postural control of ballet dancers: A specific use of visual input for artistic purposes. Int. J. Sports Med. 1999, 20, 86–92. [Google Scholar] [CrossRef] [PubMed]
- Schmit, J.M.; Regis, D.I.; Riley, M.A. Dynamic patterns of postural sway in ballet dancers and track athletes. Exp. Brain Res. 2005, 163, 370–378. [Google Scholar] [CrossRef]
- Barfiel, B.; Fischman, M.G. Control of a ground level ball as a function of skill level and sight of the foot. J. Hum. Mov. Stud. 1990, 12, 181–188. [Google Scholar]
- Williams, A.M.; Weigelt, C.; Harris, M.; Scott, M.A. Age-related differences in vision and proprioception in a lower limb interceptive task: The effects of skill level and practice. Res. Q. Exerc. Sport 2002, 73, 386–395. [Google Scholar] [CrossRef] [PubMed]
- Chapman, D.W.; Needham, K.J.; Allison, G.T.; Lay, B.; Edwards, D.J. Effects of experience in a dynamic environment on postural control. Br. J. Sports Med. 2008, 42, 16–21. [Google Scholar] [CrossRef]
- Nagy, E.; Toth, K.; Janositz, G.; Kovacs, G.; Feher-Kiss, A.; Angyan, L.; Horvath, G. Postural control in athletes participating in an ironman triathlon. Eur. J. Appl. Physiol. 2004, 92, 407–413. [Google Scholar] [CrossRef]
- Killebrew, S.S.; Petrella, J.K.; Jung, A.P.; Hensarling, R.W. The Effect of Loss of Visual Input on Muscle Power in Resistance Trained and Untrained Young Men and Women. J. Strength Cond. Res. 2013, 27, 495–500. Available online: https://journals.lww.com/nsca-jscr/Fulltext/2013/02000/The_Effect_of_Loss_of_Visual_Input_on_Muscle_Power.28.aspx (accessed on 10 December 2021). [CrossRef] [PubMed]
- Heidari, M.; Saberi Kakhki, A.; Taheri, H. The effect of visual occlusion training on the performance of Forehand Drive in unskilled Table Tennis players. Mot. Behav. 2021. [Google Scholar] [CrossRef]
- Touzalin-Chretien, P.; Ehrler, S.; Dufour, A. Dominance of Vision over Proprioception on Motor Programming: Evidence from ERP. Cereb. Cortex 2010, 20, 2007–2016. [Google Scholar] [CrossRef] [PubMed] [Green Version]
- Ahtiainen, J.P.; Pakarinen, A.; Alen, M.; Kraemer, W.J.; Häkkinen, K. Muscle hypertrophy, hormonal adaptations and strength development during strength training in strength-trained and untrained men. Eur. J. Appl. Physiol. 2003, 89, 555–563. [Google Scholar] [CrossRef] [PubMed]
- Liu-Ambrose, T.; Taunton, J.E.; MacIntyre, D.; McConkey, P.; Khan, K.M. The effects of proprioceptive or strength training on the neuromuscular function of the ACL reconstructed knee: A randomized clinical trial. Scand. J. Med. Sci. Sports 2003, 13, 115–123. [Google Scholar] [CrossRef]
- Brown, L.E.; Rosenbaum, D.A.; Sainburg, R.L. Limb position drift: Implications for control of posture and movement. J. Neurophysiol. 2003, 90, 3105–3118. [Google Scholar] [CrossRef]
- El-Kahky, A.M. Balance control near the limit of stability in various sensory conditions in healthy subjects and patients suffering from vertigo or balance disorders: Impact of sensory input on balance control. Acta Otolaryngol. 2000, 120, 508–516. [Google Scholar] [CrossRef] [PubMed]
- Pratt, J.; Abrams, R.A. Practice and component submovements: The roles of programming and feedback in rapid aimed limb movements. J. Mot. Behav. 1996, 28, 149–156. [Google Scholar] [CrossRef] [PubMed]
- Wong, D.P.; Ngo, K.-L.; Michael, A.T.; Smith, A.W. Using bench press load to predict upper body exercise loads in physically active individuals. J. Sports Sci. Med. 2013, 12, 38. [Google Scholar]
- Haff, G.G.; Triplett, N.T. Essentials of Strength Training and Conditioning, 4th ed.; Human kinetics: Champaign, IL, USA, 2015; ISBN 1-4925-0162-X. [Google Scholar]
- Candow, D.G.; Burke, D.G. Effect of short-term equal-volume resistance training with different workout frequency on muscle mass and strength in untrained men and women. J. Strength Cond. Res. 2007, 21, 204–207. [Google Scholar] [CrossRef] [PubMed]
- Tomczak, M.; Tomczak, E. The need to report effect size estimates revisited. An overview of some recommended measures of effect size. Trends Sport Sci. 2014, 1, 19–25. [Google Scholar]
- Thissen, D.; Steinberg, L.; Kuang, D. Quick and easy implementation of the Benjamini-Hochberg procedure for controlling the false positive rate in multiple comparisons. J. Educ. Behav. Stat. 2002, 27, 77–83. [Google Scholar] [CrossRef]
- Boolani, A. Assessing Bench Press Strength after Training without the Benefit of Vision; Oklahoma State University: Stillwater, OK, USA, 2009; ISBN 1-267-17249-5. [Google Scholar]
- Häkkinen, K.; Alen, M.; Kraemer, W.J.; Gorostiaga, E.; Izquierdo, M.; Rusko, H.; Mikkola, J.; Häkkinen, A.; Valkeinen, H.; Kaarakainen, E. Neuromuscular adaptations during concurrent strength and endurance training versus strength training. Eur. J. Appl. Physiol. 2003, 89, 42–52. [Google Scholar] [CrossRef]
- Häkkinen, K.; Kallinen, M.; Linnamo, V.; Pastinen, U.-M.; Newton, R.U.; Kraemer, W.J. Neuromuscular adaptations during bilateral versus unilateral strength training in middle-aged and elderly men and women. Acta Physiol. Scand. 1996, 158, 77–88. [Google Scholar] [CrossRef]
- Brandenburg, J.E.; Docherty, D. The effects of accentuated eccentric loading on strength, muscle hypertrophy, and neural adaptations in trained individuals. J. Strength Cond. Res. 2002, 16, 25–32. [Google Scholar]
- Behm, D.G.; Muehlbauer, T.; Kibele, A.; Granacher, U. Effects of strength training using unstable surfaces on strength, power and balance performance across the lifespan: A systematic review and meta-analysis. Sports Med. 2015, 45, 1645–1669. [Google Scholar] [CrossRef] [PubMed] [Green Version]
- Dunton, A.; O’Neill, C.; Coughlan, E.K. The impact of a spatial occlusion training intervention on pass accuracy across a continuum of representative experimental design in football. Sci. Med. Footb. 2020, 4, 269–277. [Google Scholar] [CrossRef]
- Poulter, D.R.; Jackson, R.C.; Wann, J.P.; Berry, D.C. The effect of learning condition on perceptual anticipation, awareness, and visual search. Hum. Mov. Sci. 2005, 24, 345–361. [Google Scholar] [CrossRef] [PubMed]
- Murgia, M.; Sors, F.; Muroni, A.F.; Santoro, I.; Prpic, V.; Galmonte, A.; Agostini, T. Using perceptual home-training to improve anticipation skills of soccer goalkeepers. Psychol. Sport Exerc. 2014, 15, 642–648. [Google Scholar] [CrossRef]
- Horvat, M.; Ray, C.; Croce, R.; Blasch, B. A comparison of isokinetic muscle strength and power in visually impaired and sighted individuals. Isokinet. Exerc. Sci. 2004, 12, 179–183. [Google Scholar] [CrossRef]
- Horvat, M.; Nocera, J.; Ray, C.; Croce, R. Comparison of isokinetic peak force and power in adults with partial and total blindness. Percept. Mot. Skills 2006, 103, 231–237. [Google Scholar] [CrossRef]
- Lamoreux, E.L.; Chong, E.; Wang, J.J.; Saw, S.M.; Aung, T.; Mitchell, P.; Wong, T.Y. Visual impairment, causes of vision loss, and falls: The Singapore Malay Eye Study. Investig. Ophthalmol. Vis. Sci. 2008, 49, 528–533. [Google Scholar] [CrossRef] [Green Version]


| Experimental (n = 16) | Control (n = 18) | Between Groups | Both Groups (n = 34) | ||||||||||||
|---|---|---|---|---|---|---|---|---|---|---|---|---|---|---|---|
| Variable | Descriptive Stats | Pre–Post Differences | Descriptive Stats | Pre–Post Differences | F/Χ2/∪ | p | Pre–Post Differences | ||||||||
| Males:Females | 11:5 | 13:5 | 0.049 | 0.824 | |||||||||||
| RTE (months, mean ± SD) | 8.3 ± 0.7 | 8.1 ± 0.8 | −0.771 | 0.780 | |||||||||||
| Variable | Range | Median | W | p | η2 | Range | Median | W | p | η2 | F/Χ2/∪ | p | W | p | η2 |
| Height (cm) | 154.94, 190.50 | 176.53 | 154.94, 186.69 | 175.26 | 118.50 | 0.384 | |||||||||
| Pre-testing weight (kg) | 61.24, 137.17 | 79.51 | 72.00 | 0.836 | 0.003 | 58.97, 126.10 | 79.61 | 77.50 | 0.728 | 0.007 | 142.00 | 0.959 | 291.00 | 0.912 | <0.001 |
| Post-testing weight (kg) | 19.94, 42.31 | 25.42 | 19.66, 36.68 | 26.34 | 140.00 | 0.905 | |||||||||
| Pre-testing BMI (kg/m2) | 19.94, 42.32 | 25.42 | 70.00 | 0.918 | 0.001 | 19.65, 36.68 | 26.34 | 78.00 | 0.744 | 0.006 | 142.00 | 0.959 | 285.00 | 0.831 | 0.001 |
| Post-testing BMI (kg/m2) | 19.80, 42.29 | 25.37 | 19.23, 37.60 | 26.39 | 144.00 | 0.999 | |||||||||
| Pre-testing body fat percentage (%) | 5.2, 43.5 | 21.5 | 35.50 | 0.286 | 0.074 | 5.6, 37.4 | 19.95 | 36.00 | 0.055 | 0.209 | 139.00 | 0.878 | 142.00 | 0.038 | 0.119 |
| Post-testing body fat percentage (%) | 5.60, 43.40 | 20.65 | 6.30, 36.80 | 18.70 | 137.00 | 0.825 | |||||||||
| Pre-testing lean mass (kg) | 42.13, 94.10 | 66.16 | 97.00 | 0.134 | 0.146 | 46.45, 84.99 | 67.02 | 106.00 | 0.372 | 0.046 | 134.00 | 0.746 | 397.00 | 0.089 | 0.080 |
| Post-testing lean mass (kg) | 45.88, 87.73 | 67.04 | 47.59, 94.50 | 68.38 | 136.00 | 0.798 | |||||||||
| Pre-testing 1-RM (kg) | 24.95, 133.81 | 78.24 | 101.50 | 0.002 | 0.619 | 20.41, 117.93 | 75.98 | 122.00 | 0.005 | 0.448 | 144.00 | 0.999 | 430.00 | <.001 | 0.462 |
| Post-testing 1-RM (kg) | 29.48, 138.35 | 82.78 | 22.68, 124.74 | 82.78 | 146.00 | 0.959 | |||||||||
| Pre-testing 1-RM/weight ratio | 0.24, 1.24 | 0.94 | 128.00 | 0.002 | 0.623 | 0.27, 1.54 | 0.93 | 149.00 | 0.006 | 0.437 | 118.00 | 0.737 | 538.00 | <.001 | 0.469 |
| Post-testing 1-RM/weight ratio | 0.39, 1.27 | 0.98 | 0.31, 1.57 | 1.02 | 123.00 | 0.882 | |||||||||
| Pre-testing 1-RM/lean mass ratio | 0.43, 1.15 | 0.43 | 112.00 | 0.023 | 0.345 | 0.38, 1.83 | 0.39 | 134.00 | 0.035 | 0.254 | 125.00 | 0.941 | 485.00 | 0.001 | 0.286 |
| Post-testing 1-RM/lean mass ratio | 0.64, 1.62 | 1.19 | 0.42, 1.77 | 1.27 | 137.00 | 0.737 | |||||||||
| Variable | Experimental (n = 16) | Control (n = 18) | ∪ | p-Value | η2 | ||
|---|---|---|---|---|---|---|---|
| Range | Median | Range | Median | ||||
| Weight Δ (kg) | −2.00, 2.27 | −0.18 | −2.81, 4.72 | −0.41 | 291.00 | 0.912 | 0.008 |
| Weight Δ (%) | −1.48, 3.03 | −0.18 | −3.55, 5.82 | −0.48 | 121.00 | 0.443 | 0.018 |
| BMI Δ | −0.55, 0.76 | −0.06 | −0.83, 1.54 | −0.13 | 127.00 | 0.574 | 0.010 |
| BMI Δ (%) | −1.45, 3.12 | −0.18 | −0.48, −3.44 | −0.48 | 121.00 | 0.443 | 0.018 |
| Body fat % Δ | −5.90, 5.60 | −0.40 | −5.70, 8.10 | −0.75 | 132.00 | 0.695 | 0.003 |
| Body fat % Δ (%) | −18.91, 17.83 | −1.37 | −24.39, 31.89 | −3.86 | 134.00 | 0.730 | 0.010 |
| Lean Mass Δ (kg) | −8.94, 5.96 | 0.30 | −5.00, 9.51 | 0.38 | 127.00 | 0.574 | 0.003 |
| Lean Mass Δ (%) | −9.50, 8.90 | 0.44 | −8.75, 11.19 | 0.58 | 134.00 | 0.746 | 0.002 |
| 1-RM Δ (kg) | −4.54, 18.14 | 4.54 | −6.80, 15.88 | 4.54 | 151.50 | 0.798 | 0.002 |
| 1-RM Δ (%) | −4.17, 61.54 | 5.81 | −8.70, 38.46 | 6.23 | 150.50 | 0.825 | 0.002 |
| 1-RM/body weight Δ | −0.04, 0.18 | 0.07 | −0.09, 0.20 | 0.06 | 152.00 | 0.798 | 0.004 |
| 1-RM/lean mass Δ | −0.14, 0.26 | 0.07 | −0.17, 0.27 | 0.09 | 149.00 | 0.878 | 0.001 |
| Δ1-RM/ Δ lean mass | −4.49, 254.66 | 1.10 | −806.13, 20.52 | −1.49 | 83.00 | 0.036 | 0.130 |
| 1-RM/weight ratio Δ (%) | −4.74, 61.66 | 6.52 | −10.59, 35.26 | 7.86 | 154.00 | 0.746 | 0.002 |
| 1-RM/lean mass ratio Δ (%) | −10.67, 61.37 | 6.06 | −17.56, 51.74 | 7.29 | 152.00 | 0.798 | 0.004 |
| 1-RM Δ (%)/body weight Δ (%) | −831.31, 28.21 | −3.74 | −38.96, 50.86 | −1.85 | 154.00 | 0.746 | 0.004 |
| 1-RM Δ (%)/lean mass Δ (%) | −6.00, 863.73 | 1.72 | −1184.81, 27.41 | −1.93 | 78.00 | 0.022 | 0.152 |
Publisher’s Note: MDPI stays neutral with regard to jurisdictional claims in published maps and institutional affiliations. |
© 2022 by the authors. Licensee MDPI, Basel, Switzerland. This article is an open access article distributed under the terms and conditions of the Creative Commons Attribution (CC BY) license (https://creativecommons.org/licenses/by/4.0/).
Share and Cite
Boolani, A.; Moghaddam, M.; Fuller, D.; Mondal, S.; Sur, S.; Martin, R.; Kadry, A.; Torad, A.A.; Elwan, M.A.; Kakar, R.S. The Effects of Vision-Deprived Progressive Resistance Training on One-Repetition Maximum Bench Press Performance: An Exploratory Study. Vision 2022, 6, 47. https://doi.org/10.3390/vision6030047
Boolani A, Moghaddam M, Fuller D, Mondal S, Sur S, Martin R, Kadry A, Torad AA, Elwan MA, Kakar RS. The Effects of Vision-Deprived Progressive Resistance Training on One-Repetition Maximum Bench Press Performance: An Exploratory Study. Vision. 2022; 6(3):47. https://doi.org/10.3390/vision6030047
Chicago/Turabian StyleBoolani, Ali, Masoud Moghaddam, Daniel Fuller, Sumona Mondal, Shantanu Sur, Rebecca Martin, Ahmed Kadry, Ahmed Ali Torad, Mostafa Ali Elwan, and Rumit Singh Kakar. 2022. "The Effects of Vision-Deprived Progressive Resistance Training on One-Repetition Maximum Bench Press Performance: An Exploratory Study" Vision 6, no. 3: 47. https://doi.org/10.3390/vision6030047
APA StyleBoolani, A., Moghaddam, M., Fuller, D., Mondal, S., Sur, S., Martin, R., Kadry, A., Torad, A. A., Elwan, M. A., & Kakar, R. S. (2022). The Effects of Vision-Deprived Progressive Resistance Training on One-Repetition Maximum Bench Press Performance: An Exploratory Study. Vision, 6(3), 47. https://doi.org/10.3390/vision6030047