Abstract
The aim of the study was to assess various retinal vessel parameters of diabetes mellitus (DM) patients and their correlations with systemic factors in type 2 DM. A retrospective exploratory study in which 21 pairs of baseline and follow-up images of patients affected by DM were randomly chosen from the Sankara Nethralaya–Diabetic Retinopathy Study (SN DREAMS) I and II datasets. Patients’ fundus was photographed, and the diagnosis was made based on Klein classification. Vessel thickness parameters were generated using a web-based retinal vascular analysis platform called VASP. The thickness changes between the baseline and follow-up images were computed and normalized with the actual thicknesses of baseline images. The majority of parameters showed 10~20% changes over time. Vessel width in zone C for the second vein was significantly reduced from baseline to follow-up, which showed positive correlations with systolic blood pressure and serum high-density lipoproteins. Fractal dimension for all vessels in zones B and C and fractal dimension for vein in zones A, B and C showed a minimal increase from baseline to follow-up, which had a linear relationship with diastolic pressure, mean arterial pressure, serum triglycerides (p < 0.05). Lacunarity for all vessels and veins in zones A, B and C showed a minimal decrease from baseline to follow-up which had a negative correlation with pulse pressure and positive correlation with serum triglycerides (p < 0.05). The vessel widths for the first and second arteries significantly increased from baseline to follow-up and had an association with high-density lipoproteins, glycated haemoglobin A1C, serum low-density lipoproteins and total serum cholesterol. The central reflex intensity ratio for the second artery was significantly decreased from baseline to follow-up, and positive correlations were noted with serum triglyceride, serum low-density lipoproteins and total serum cholesterol. The coefficients for branches in zones B and C artery and the junctional exponent deviation for the artery in zone A decreased from baseline to follow-up showed positive correlations with serum triglycerides, serum low-density lipoproteins and total serum cholesterol. Identifying early microvascular changes in diabetic patients will allow for earlier intervention, improve visual outcomes and prevent vision loss.
1. Introduction
Diabetic retinopathy (DR) is the most recognized complication of diabetes mellitus (DM). Among the working population, it is one of the most common causes of vision loss and blindness [1]. The duration of DM is the largest contributing factor to the development and severity of DR, and hence early identification of microvascular changes is essential in order to minimize visual loss and prevent the worsening of retinal damage [2,3].
In the past decade, the accurate characterization of retinal vascular changes was made possible through advances in the digital retinal photography and imaging techniques [4]. The retinal vascular geometry may represent subclinical measures of microvascular changes. These retinal vasculature changes may be a potential biomarker for future diabetes complications like DR [5,6,7,8,9]. Few epidemiologic studies extensively analysed data to find the association of retinal vessel calibre. This may provide a more global indication of the overall health of the vascular system [10]. Various population-based clinical studies have reported that retinal microvascular structural change is associated with systemic diseases [11,12]. Additionally, the changes in retinal vascular features like tortuosity and branching angle provides micro-vascular understanding of organs like kidney, brain, and heart and may be predictive of clinical vascular events [13].
There are scarce data regarding longitudinal changes in retinal vascular parameters over time and the factors influencing these changes. Among adults with type 1 and type 2 diabetes aged 40+ years from the Wisconsin Epidemiologic Study of Diabetic Retinopathy [6] mean arteriolar calibres narrowed slightly and mean venular calibres widened with increasing age. Liew et al. [14] also demonstrated that retinal vessels dilated and became more tortuous over the follow-up period of 2.6 years in type 1 diabetes. A few studies found that there is no association with the vascular measurements [15,16], while others showed that the fractal dimension of the vessels depends on the severity of the disease [17]. These inconsistent findings stem from differences in type of diabetes, study design and population ethnicity across studies. Identifying early microvascular changes in patients with diabetes will facilitate earlier intervention and treatment, improving visual outcomes and preventing further vision loss in patients with diabetic retinopathy.
This study assesses the retinal vascular parameters in patients with diabetes in order to identify which characteristics, if any, could be used as an early predictor of DR and its correlations with systemic characteristics.
2. Materials and Methods
2.1. Study Population
The 21 patients included in the study were taken from a population based four-year follow-up dataset (Sankara Nethralaya–Diabetic Retinopathy Epidemiology and Molecular Genetic Study (SN DREAMS I and II). The study design and research methodology of SN DREAMS I and SN DREAMS II have been described elsewhere [18,19]. To summarize, the Sankara Nethralaya–Diabetic Retinopathy Epidemiology and Molecular Genetic Study (SN DREAMS) was conducted between 2003 and 2005, and the cohort was followed up after 4 years (SN-DREAMS II), which was between 2007 and 2010. The study was carried out in the city of Chennai, Tamil Nadu, which is divided into 10 corporation zones of 155 divisions. This study was approved by the institutional review board (ethics committee) at Vision Research Foundation, Chennai. Informed consent was waived by the ethics committee, and the study adhered to the tenets of the Declaration of Helsinki.
People with diabetes were identified based on the World Health Organization (WHO) criteria. A detailed history, including demographics, diabetes history and complications and significant ocular history was obtained from all patients prior to comprehensive eye screening. All the subjects underwent a detailed ophthalmic evaluation that included the assessment of visual acuity and refraction, anterior segment examination, the measurement of intraocular pressure, the grading of lens opacities and fundus examination. The details of these tests are mentioned elsewhere [18,19].
2.2. Photographic Methods and Retinopathy Grading
The dilated fundi of all patients were photographed following a standardized protocol using a 45° four-field stereoscopic digital fundus camera (VISUCAMlite; Carl Zeiss, Jena, Germany), and an additional 30° seven-field stereo digital pairs were taken for participants with DR. The diagnosis of DR was based on the Klein classification (modified ETDRS scale). Two independent observers graded in a masked manner; the grading agreement was high (k = 0.82) [20].
Diabetic retinopathy was graded as follows: [21]
- No diabetic retinopathy—No abnormality
- Mild Non-Proliferative diabetic retinopathy (Mild NPDR)—Only microaneurysm
- Moderate Non-Proliferative diabetic retinopathy (Moderate NPDR)—More than mild, but less than severe
- Severe Non-Proliferative diabetic retinopathy (Severe NPDR)—Any of the following: 20 or more intraretinal haemorrhages in 4 quadrants, venous beading in >2 quadrants or intraretinal neovascularization in 1 quadrant
- Proliferative diabetic retinopathy (PDR)—One or more of the following: neovascularization or preretinal or vitreous haemorrhage
Changes (i.e., difference) in thickness parameters between the baseline and follow-up images were computed and finally normalized with the actual thickness of the baseline image. Prior to computing the vascular parameters, baseline and follow-up images were registered based on the vessel centreline [22], which is a process of establishing pixel-to pixel correspondence between two or more retinal images from different times, viewpoints and sources (Figure 1).
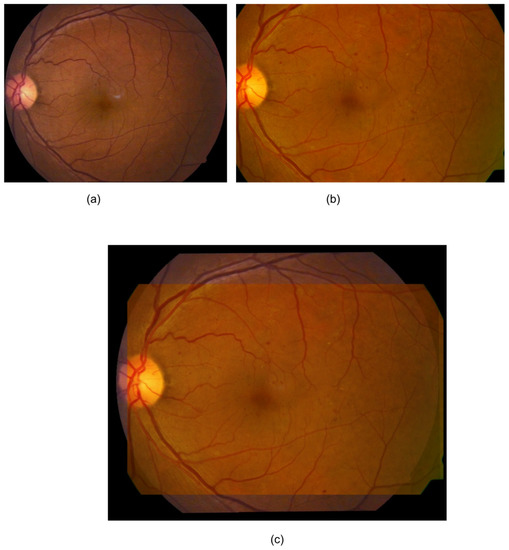
Figure 1.
An example registration by Saha et al.’s method [23]. (a) Baseline image; (b) follow-up image; (c) mosaic image after registration. Only a fundus area that was common to both of the images was used for the analysis (c).
Vessel thickness parameters were generated using a web-based retinal vascular analysis platform called (VASP) [12,24]. VASP allows retinal images from various fundus cameras, pre-processes the image and performs the automated detection of the optic disc and macula. VASP also generates the vessel network from the image and identifies arteries, veins, bifurcation and cross-over points, which are dormant points through which the reference and floating images were matched distinctively. The generation of vascular parameters is a multi-stage process in VASP, and VASP allows users to interact at every single point. In this study, we have used 27 parameters for assessing retinal vascular geometry (Table 1). Statistical analyses were performed to correlate the vascular parameters with systemic parameters.

Table 1.
Vessel parameters generated by VASP that are used in this study.
Figure 2 shows the three zones (i.e., zone A, zone B and zone C) that were used in computing VASP parameters. Each zone represents a circular area defined by the radius with respect to the optic disc centre. Figure 3 shows an example demonstration of the six major vessels (three arteries and three veins) that were used in computing VASP parameters.
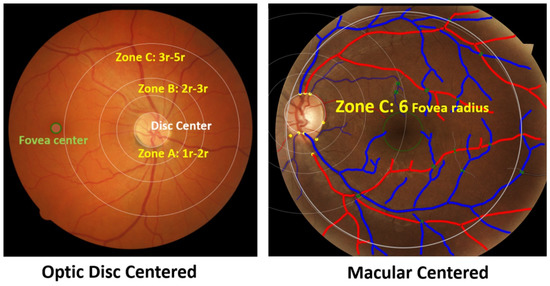
Figure 2.
Zones in the retinal photograph. The left figure shows an example optic disc centred image, and the right figure shows an example macular centred image. The right figure also shows vessels classified into arteries and veins. Arteries are shown in red and veins are shown blue.
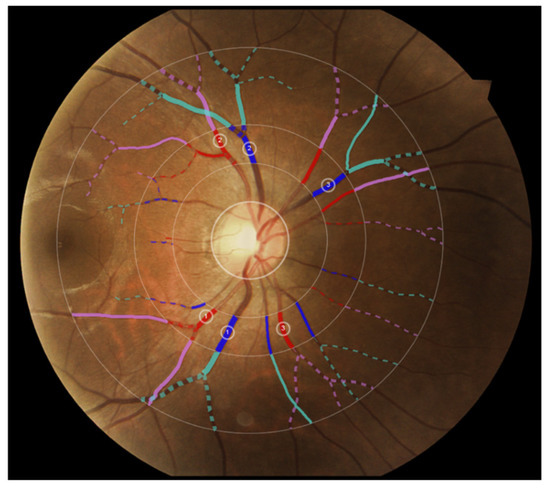
Figure 3.
Example demonstration of the six major vessels (three arteries and three veins) used in computing VASP parameters. Vessels in different zones are represented in different colours for illustration purposes.
2.3. Statistical Analysis
Statistical analyses were performed using SPSS (version 21.0). Mean and standard deviation were presented for continuous variables. Categorical data were represented as a number (percentage). Mean values were compared using Student t-tests, and chi-square test was performed for the categorical data to compare the distribution of the sample at baseline and follow-up and to compare the differences in vessel parameters at baseline and 4-year follow-up. For those parameters which had statistically significant difference in the two time points were further analysed for finding correlation with systemic characteristics using Pearson correlation test. Statistical significance was considered if the p value is less than 0.05.
3. Results
Table 2 shows the patient’s characteristics at baseline and at four-years follow-up. Of the various parameters, diastolic pressure shows a significant change from baseline 88.00 ± 12.65 mmHg to follow-up 77.33 ± 9.61 mmHg, (p value—0.004). Also on 4-year follow-up, 26.6% participants developed neuropathy (p = 0.012).
Table 2.
The basic characteristics of the subjects at baseline and at follow-up.
The majority of vascular parameters measured by VASP showed about 10~20% changes over four years’ time. However, these changes do not show any consistent pattern. Only a few parameters, namely, equiwidth3DV, equiwidth3DV2, Thicktort and ThicktortA showed a reducing trend with few outliers in the four years follow-up.
Table 3 indicates the differences in parameters at baseline and 4-year follow-up. Those parameters which had statistically significant differences at the two time points were further analysed for finding correlations with the systemic characteristics.
Table 3.
The differences in parameters at baseline and 4-year follow-up.
3.1. Width Parameters
The equivalent vessel width in zone C for the second vein was significantly reduced from baseline (130.46 ± 31.94) to follow-up (118.16 ± 30.25) (p = 0.000), which showed positive correlations with systolic blood pressure (r = 0.621, p = 0.014) and serum high-density lipoproteins (r = 0.666, p = 0.007). Other width parameters did not have any correlation with systemic characteristics.
3.2. Fractal Dimension
The fractal dimension for all vessels in zones B and C showed a minimal increase from baseline (1.25 ± 0.07) to follow-up (1.28 ± 0.07) (p = 0.002. Positive correlations were noted with diastolic pressure (r = 0.621, p = 0.013), mean arterial pressure (r = 0.539, p = 0.038), serum triglycerides (r = 0.670, p = 0.006), serum low-density lipoproteins (r = 0.708, p = 0.003) and total serum cholesterol (r = 0.760, p = 0.001).
The fractal dimension for the vein in zones A, B and C also showed a minimal increase from baseline (1.09 ± 0.10) to follow-up (1.12 ± 0.11) (p = 0.014. It showed strong correlation with mean arterial pressure (r = 0.559, p = 0.30). However, other fractal dimension parameters did not have any correlation with the systemic characteristics.
3.3. Lacunarity
Lacunarity for all vessels in zones A, B and C showed a significant decrease from baseline (0.52 ± 0.14) to follow-up (0.51 ± 0.13), p = 0.003. Negative correlation was noted with pulse pressure (r = −0.549, p = 0.042). Lacunarity of the vein in zones A, B and C was slightly changed from baseline (0.58 ± 0.24) to follow-up (0.58 ± 0.15), p = 0.015. A positive correlation was noted with serum triglycerides (r = 0.630, p = 0.028).
3.4. Central Reflex
The vessel width for the first artery significantly increased from baseline (46.05 ± 53.19) to follow-up (75.90 ± 43.71) (p = 0.052). It showed positive correlations with high-density lipoproteins (r = 0.495, p = 0.061) and glycated haemoglobin A1C (r = 0.544, p = 0.036). The central reflex intensity ratio for the second artery decreased significantly from baseline (0.86 ± 0.55) to follow-up (0.19 ± 1.02) (p = 0.038. Positive correlations were noted with serum triglycerides (r = 0.608, p = 0.021), serum low-density lipoproteins (r = 0.587, p = 0.027) and total serum cholesterol (r = 0.639, p = 0.014). The vessel width for the second artery was significantly increased from baseline (9.83 ± 29.14) to follow-up (27.64 ± 36.99) (p = 0.057). It showed positive correlations with serum low-density lipoproteins (r = 0.486, p = 0.066), and total serum cholesterol (r = 0.453, p = 0.090).
3.5. Branch Parameters
The number of all trees with branches in zones B and C increased from baseline (4.60 ± 1.96) to follow-up (5.47 ± 2.75) (p = 0.043). This showed a positive correlation with serum low-density lipoproteins (r = 0.482, p = 0.069).
The branch coefficients in zones B and C slightly decreased from baseline (1.41 ± 0.57) to follow-up (1.20 ± 0.53), p value—0.035. It showed a positive correlations with serum triglycerides (r = 0.668, p = 0.025), serum low-density lipoproteins (r = 0.556, p = 0.076) and total serum cholesterol (r = 0.563, p = 0.071).
The junctional exponent deviation for artery in zone A significantly decreased from baseline (0.31 ± 0.69) to follow-up (0.0005 ± 0.52), p = 0.033. It showed positive correlations with serum triglycerides (r = 0.621, p = 0.041), serum low-density lipoproteins (r = 0.594, p = 0.054), and total serum cholesterol (r = 0.613, p = 0.045).
4. Discussion
This web-based retinal vascular analysis platform allows for visualizing the retinal vasculature and for the accurate assessment of vascular changes in the retina. In this article, we have discussed vascular changes from the baseline to 4-year follow-up. Our study provides information on the quantitative measurement of vascular parameters of the retina and their associations with systemic factors in a cohort of people with diabetes. Vascular parameters like width, lacunarity of the vessels, central reflex intensity ratio, branch coefficients and junctional exponent deviation for the artery decreased from baseline to follow-up, whereas fractal dimension, vessel width of the central reflex and number of branches increased from baseline follow-up. The factors independently correlating with changes in vascular parameters included diastolic and mean blood pressure for an increase in fractal dimension in the vein in zones A, B and C; diastolic blood pressure for an increase in the number of all trees with branches in zones B and C and pulse pressure for a decrease in the junctional exponent deviation for artery in zone A.
In our study, we found that the equivalent vessel width in zone C for the second vein decreased from baseline to follow-up. Similarly, Gerald Liew et al. [25] showed that both arteriolar and venular calibres narrow with age and also reported that increased vessel stiffness is due to hypertension and cardiovascular diseases. Another study [26] which included both type 1 and type 2 diabetic adults showed that the mean arteriolar calibres narrowed slightly, while the mean venular calibres widened with increasing age. Venular diameter is also reported to be narrow in people with increased blood pressure, and smoking was related with wider arteriolar calibre [25].
We found that the junctional exponent deviation for the artery in zones B and C narrowed from baseline to follow-up. Similarly, in a retrospective observational study [27], bifurcation angles narrowed with an increase in blood pressure. Roxanne Crosby-Nwaobi et al. [28] showed in PDR patients a significant change in the junctional exponential factor of the arteries (p = 0·010), whereas veins did not show much of deviation (p = 0.460). Another study by Sasongko et al. [29] found a larger arteriolar branching angle in patients with increased diabetes duration. A few studies reported that prominent blood flow with low consumption of energy will have an optimal branching angle [30,31]. Another study showed that the efficiency of branching angle depends on the size of the parent vessel [29]. Those authors found an impairment of the branching angle and junctional exponent atherosclerosis, blood flow alteration and endothelial dysfunction [32,33]. Another study showed that the oxygen saturation was reduced in case of increased branching angle [34].
We reported the central reflex intensity ratio for the second artery, which decreased from baseline to follow-up. A similar finding was noted by Brinchmann-Hansen el al [35], who noted that the intensity of light incident from the fundus photography is reflected less in the retinal arteries and veins of diabetic eyes than in the control eyes, and even the reflexes in the veins of the diabetic eyes were narrower than the control group.
Lacunarity analysis is used to measure the gaps between binary images with the same fractal dimensions, which will appear as a change in the anatomical structures [36,37,38,39]. Though it will not distinguish the vascular network geometry compared with the fractal dimension, it can be used for vascular assessment in diabetic retinopathy and macular oedema [40,41]. Differences in pixel density of varying box size and orientation of grid were determined as lacunarity (λ) in this study. We found that the lacunarity for all vessels in zones A, B and C decreased from baseline to follow-up and the fractal dimension for all vessels in zones B and C increased. Leontidis et al. [40] found an inverse correlation in which the lacunarity of the retinal vascular network decreased as the fractal dimension increased. Previous studies on diabetes showed a reduction in the fractal dimension [40,41,42].
We found that the fractal dimension for the vein in zones A, B and C correlated independently with changes in diastolic and mean blood pressure. Another study reported that the fractal dimension was associated with systolic, diastolic, mean arterial and pulse pressure [42,43]. Compared with the association between central retinal arteriolar equivalent (CRAE) and systolic blood pressure, the fractal dimension showed a stronger association with blood pressure [44]. For the severity of hypertension, the fractal dimension has better sensitivity than CRAE.
Previous studies with fluorescein angiograms and red-free images have reported that age is associated with decrease in junctional exponents with not much differences normotensive and hypertensive subjects [27,34]. However, in our study, we found that the pulse pressure was strongly correlated with a decrease in the junctional exponent deviation for artery in zone A. Changes in pulse pressure in diabetes reflect the stiffness of the vessels, which results in a reduction of junctional exponent deviation.
The strengths of the study were the prospective design, that a standard protocol was used to evaluate the retinal images and that a web-based program was used to quantitatively examine the retinal vasculature. Our study has a few limitations. Firstly, it uses a limited sample size. Second, the smaller retinal vessels might have been missed due to poor resolution of the fundus photographs. Thirdly, there was less precision in the measurement of a few parameters like the contrast and brightness of images in spite of following the standard protocols. Lastly, refractive errors like high myopia may have some correlation to retinal vessels, and hence, future studies should have control groups without diabetes to see if the 4-year changes were due to diabetes or other effects.
Information processing and contact with the environment, as well as the performance of daily activities, are all aided by vision. Visual impairment has been linked to a reliance on assistance with daily tasks, social isolation and decreased physical activity. In this regard, people with DR’s visual impairment and its major impacts on several aspects of their lives can result in a significant decline in their quality of life [45].
5. Conclusions
In conclusion, there were parameters which changed over time in diabetes. There is clearly a change in the retinal vascular features and pattern which was caused by the effects of diabetes. Changes in retinal vascular calibre reflect a variety of subclinical pathophysiologic responses to hyperglycaemia, hypertension and dyslipidaemia and can predict not just various diabetic microvascular issues but also stroke and coronary heart disease. Longitudinal variations in retinal vascular parameters can be utilised for the early detection of diabetic complications. Positive outcomes will provide the much-desired opportunity to apply cost-effective prevention and intervention techniques. It is important to include people from similar cultural, ethnic, and socioeconomic backgrounds in order to notice any differences and further evaluate the model’s performance. Similar tests on a larger dataset and with other demographics are also required.
Author Contributions
R.R., S.K.S. and Y.K. contributed in conception and design of the study. R.K. helped in acquisition of the data. R.K. and S.K.S. wrote the main manuscript text and prepared all the tables. R.K. assisted with statistical analyses. S.K.S., S.F. assisted with the software analysis. R.R. and Y.K. helped in review and editing. All authors have read and agreed to the published version of the manuscript.
Funding
This research received no external funding.
Institutional Review Board Statement
This study protocol was approved by the Institutional Review Board (Ethics Committee) at Vision Research Foundation, New No 41, Old No 18, College Road, Chennai-600006.
Informed Consent Statement
Informed consent for this study was waived by the Vision Research Foundation Ethics Committee, which is working according to ICH-GCP and adheres to the tenets of the Declaration of Helsinki.
Data Availability Statement
The datasets generated during and/or analysed during the current study are not publicly available, as it is against the organization/hospital (Vision Research Foundation, Chennai) policy. All anonymized data available upon request and are being stored in Vision Research Foundation office.
Conflicts of Interest
The authors declare no conflict of interest.
References
- Wang, W.; Lo, A.C.Y. Diabetic Retinopathy: Pathophysiology and Treatments. Int. J. Mol. Sci. 2018, 19, 1816. [Google Scholar] [CrossRef] [PubMed]
- Raman, R.; Rani, P.K.; Rachepalle, S.R.; Gnanamoorthy, P.; Uthra, S.; Kumaramanickavel, G.; Sharma, T. Prevalence of Diabetic Retinopathy in India: Sankara Nethralaya Diabetic Retinopathy Epidemiology and Molecular Genetics Study Report 2. Ophthalmology 2009, 116, 311–318. [Google Scholar] [CrossRef] [PubMed]
- Nentwich, M.M. Diabetic retinopathy-ocular complications of diabetes mellitus. World J. Diabetes 2015, 6, 489–499. [Google Scholar] [CrossRef]
- Nguyen, T.T.; Wong, T.Y. Retinal vascular changes and diabetic retinopathy. Curr. Diabetes Rep. 2009, 9, 277–283. [Google Scholar] [CrossRef] [PubMed]
- Cheung, C.; Ikram, M.K.; Klein, R.; Wong, T.Y. The clinical implications of recent studies on the structure and function of the retinal microvasculature in diabetes. Diabetologia 2015, 58, 871–885. [Google Scholar] [CrossRef]
- Klein, R.; Klein, B.E.K.; Moss, S.E.; Wong, T.Y.; Hubbard, L.; Cruickshanks, K.J.; Palta, M. The relation of retinal vessel caliber to the incidence and progression of diabetic retinopathy: Xix: The wisconsin epidemiologic study of diabetic retinopathy. Arch. Ophthalmol. 2004, 122, 76–83. [Google Scholar] [CrossRef] [PubMed]
- Lim, L.S.; Chee, M.L.; Cheung, C.; Wong, T.Y. Retinal Vessel Geometry and the Incidence and Progression of Diabetic Retinopathy. Investig. Opthalmol. Vis. Sci. 2017, 58, BIO200–BIO205. [Google Scholar] [CrossRef] [PubMed]
- Kifley, A.; Wang, J.J.; Cugati, S.; Wong, T.Y.; Mitchell, P. Retinal Vascular Caliber, Diabetes, and Retinopathy. Am. J. Ophthalmol. 2007, 143, 1024–1026. [Google Scholar] [CrossRef]
- Ikram, M.K.; Cheung, C.Y.; Lorenzi, M.; Klein, R.; Jones, T.L.; Wong, T.Y. Retinal vascular caliber as a biomarker for diabetes microvascular complications. Diabetes Care 2003, 36, 750–759. [Google Scholar] [CrossRef] [PubMed]
- Chapman, N.; Dell’Omo, G.; Sartini, M.; Witt, N.; Hughes, A.; Thom, S.; Pedrinelli, R. Peripheral vascular disease is associated with abnormal arteriolar diameter relationships at bifurcations in the human retina. Clin. Sci. 2002, 103, 111–116. [Google Scholar] [CrossRef]
- Trinh, M.; Kalloniatis, M.; Nivison-Smith, L. Vascular Changes in Intermediate Age-Related Macular Degeneration Quantified Using Optical Coherence Tomography Angiography. Transl. Vis. Sci. Technol. 2019, 8, 20. [Google Scholar] [CrossRef]
- Yu, S.; Mehdizadeh, M.; Xiao, D.; Frost, S.; Kanagasingam, Y. Fully Automated Identification of Retinal Artery and Vein Graph Structure using a Novel Tree Growing Method. Investig. Ophthalmol. Vis. Sci. 2018, 59, 1693. [Google Scholar]
- Rim, T.H.; Teo, A.W.J.; Yang, H.H.S.; Cheung, C.Y.; Wong, T.Y. Retinal Vascular Signs and Cerebrovascular Diseases. J. Neuro-Ophthalmol. 2020, 40, 44–59. [Google Scholar] [CrossRef]
- Cheung, C.Y.-L.; Ong, S.; Ikram, M.K.; Ong, Y.T.; Chen, C.P.; Venketasubramanian, N.; Wong, T.Y. Retinal Vascular Fractal Dimension Is Associated with Cognitive Dysfunction. J. Stroke Cerebrovasc. Dis. 2014, 23, 43. [Google Scholar] [CrossRef]
- Liew, G.; Benitez-Aguirre, P.; Craig, M.E.; Jenkins, A.; Hodgson, L.A.B.; Kifley, A.; Mitchell, P.; Wong, T.Y.; Donaghue, K. Progressive Retinal Vasodilation in Patients with Type 1 Diabetes: A Longitudinal Study of Retinal Vascular Geometry. Investig. Opthalmol. Vis. Sci. 2017, 58, 2503–2509. [Google Scholar] [CrossRef]
- Cheung, C.Y.-L.; Lamoureux, E.; Ikram, M.K.; Sasongko, M.B.; Ding, J.; Zheng, Y.; Mitchell, P.; Wang, J.J.; Wong, T.Y. Retinal Vascular Geometry in Asian Persons with Diabetes and Retinopathy. J. Diabetes Sci. Technol. 2012, 6, 595–605. [Google Scholar] [CrossRef]
- Kunicki, A.C.B.; Oliveira, A.; Mendonça, M.; Barbosa, C.; Nogueira, R. Can the fractal dimension be applied for the early diagnosis of non-proliferative diabetic retinopathy? Braz. J. Med Biol. Res. 2009, 42, 930–934. [Google Scholar] [CrossRef][Green Version]
- Agarwal, S.; Raman, R.; Paul, P.G.; Rani, P.K.; Uthra, S.; Gayathree, R.; McCarty, C.; Kumaramanickavel, G.; Sharma, T. Sankara Nethralaya—Diabetic Retinopathy Epidemiology and Molecular Genetic Study (SN—DREAMS 1): Study Design and Research Methodology. Ophthalmic Epidemiol. 2005, 12, 143–153. [Google Scholar] [CrossRef]
- Raman, R.; Ganesan, S.; Pal, S.S.; Gella, L.; Kulothungan, V.; Sharma, T. Incidence and Progression of Diabetic Retinopathy in Urban India: Sankara Nethralaya-Diabetic Retinopathy Epidemiology and Molecular Genetics Study (SN-DREAMS II), Report 1. Ophthalmic Epidemiol. 2017, 24, 294–302. [Google Scholar] [CrossRef]
- Raman, R.; Ganesan, S.; Pal, S.S.; Kulothungan, V.; Sharma, T. Prevalence and risk factors for diabetic retinopathy in rural India. Sankara Nethralaya Diabetic Retinopathy Epidemiology and Molecular Genetic Study III (SN-DREAMS III), report no 2. BMJ Open Diabetes Res. Care 2014, 2, e000005. [Google Scholar] [CrossRef]
- Klein, R.; Klein, B.E.; Magli, Y.L.; Brothers, R.J.; Meuer, S.M.; Moss, S.E.; Davis, M.D. An Alternative Method of Grading Diabetic Retinopathy. Ophthalmology 1986, 93, 1183–1187. [Google Scholar] [CrossRef]
- Saha, S.K.; Xiao, D.; Bhuiyan, A.; Wong, T.Y.; Kanagasingam, Y. Color fundus image registration techniques and applications for automated analysis of diabetic retinopathy progression: A review. Biomed. Signal Process. Control 2019, 47, 288–302. [Google Scholar] [CrossRef]
- Saha, S.K.; Xiao, D.; Frost, S.; Kanagasingam, Y. A Two-Step Approach for Longitudinal Registration of Retinal Images. J. Med. Syst. 2016, 40, 277. [Google Scholar] [CrossRef]
- Yu, S.; Mehdizadeh, M.; Frost, S.; Xiao, D.; Kanagasingam, Y. Graph Theory Based Intelligent Retinal Vessel Analysis. Investig. Ophthalmol. Vis. Sci. 2017, 58, 656. [Google Scholar]
- Liew, G.; Sharrett, A.R.; Wang, J.J.; Klein, R. Relative importance of systemic determinants of retinal arteriolar and venular caliber: The atherosclerosis risk in communities study. Arch. Ophthalmol. 2008, 126, 1404–1410. [Google Scholar] [CrossRef]
- Klein, R.; Myers, C.E.; Lee, K.E.; Gangnon, R.; Klein, B.E.K. Changes in Retinal Vessel Diameter and Incidence and Progression of Diabetic Retinopathy. Arch. Ophthalmol. 2012, 130, 749–755. [Google Scholar] [CrossRef]
- Wasan, B.; Cerutti, A.; Ford, S.; Marsh, R. Vascular network changes in the retina with age and hypertension. J. Hypertens. 1995, 13, 1724–1728. [Google Scholar] [CrossRef]
- Crosby-Nwaobi, R.; Heng, L.Z.; Sivaprasad, S. Retinal Vascular Calibre, Geometry and Progression of Diabetic Retinopathy in Type 2 Diabetes Mellitus. Ophthalmologica 2012, 228, 84–92. [Google Scholar] [CrossRef]
- Sasongko, M.B.; Wang, J.J.; Donaghue, K.C.; Cheung, N.; Benitez-Aguirre, P.; Jenkins, A.; Hsu, W.; Lee, M.-L.; Wong, T.Y. Alterations in Retinal Microvascular Geometry in Young Type 1 Diabetes. Diabetes Care 2010, 33, 1331–1336. [Google Scholar] [CrossRef]
- Zamir, M.; Medeiros, J.A.; Cunningham, T.K. Arterial bifurcations in the human retina. J. Gen. Physiol. 1979, 74, 537–548. [Google Scholar] [CrossRef]
- Murray, C.D. The physiological principle of minimum work: I. The vascular system and the cost of blood volume. Proc. Natl. Acad. Sci. USA 1926, 12, 207. [Google Scholar] [CrossRef]
- Djonov, V.; Baum, O.; Burri, P.H. Vascular remodeling by intussusceptive angiogenesis. Cell Tissue Res. 2003, 314, 107–117. [Google Scholar] [CrossRef]
- Griffith, T.M.; Edwards, D.; Davies, R.L.; Harrison, T.J.; Evans, K.T. EDRF coordinates the behaviour of vascular resistance vessels. Nature 1987, 329, 442–445. [Google Scholar] [CrossRef]
- Chapman, N.; Haimes, G.; Stanton, A.V.; Thom, S.A.; Hughes, A. Acute effects of oxygen and carbon dioxide on retinal vascular network geometry in hypertensive and normotensive subjects. Clin. Sci. 2000, 99, 483–488. [Google Scholar] [CrossRef]
- Brinchmann-Hansen, O.; Myhre, K.; Dahl-Jørgensen, K.; Hanssen, K.F.; Sandvik, L. The central light reflex of retinal arteries and veins in insulin-dependent diabetic subjects. Acta Ophthalmol. 1987, 65, 474–480. [Google Scholar] [CrossRef]
- Plotnick, R.E.; Gardner, R.H.; Hargrove, W.W.; Prestegaard, K.; Perlmutter, M. Lacunarity analysis: A general technique for the analysis of spatial patterns. Phys. Rev. E 1996, 53, 5461. [Google Scholar] [CrossRef]
- Ewaliszewski, P. The Quantitative Criteria Based on the Fractal Dimensions, Entropy, and Lacunarity for the Spatial Distribution of Cancer Cell Nuclei Enable Identification of Low or High Aggressive Prostate Carcinomas. Front. Physiol. 2016, 7, 34. [Google Scholar] [CrossRef]
- Gould, D.; Vadakkan, T.J.; Poché, R.A.; Dickinson, M.E. Multifractal and Lacunarity Analysis of Microvascular Morphology and Remodeling. Microcirculation 2016, 18, 136–151. [Google Scholar] [CrossRef]
- Popovic, N.; Radunovic, M.; Badnjar, J.; Popovic, T. Fractal dimension and lacunarity analysis of retinal microvascular morphology in hypertension and diabetes. Microvasc. Res. 2018, 118, 36–43. [Google Scholar] [CrossRef]
- Leontidis, G.; Al-Diri, B.; Wigdahl, J.; Hunter, A. Evaluation of geometric features as biomarkers of diabetic retinopathy for characterizing the retinal vascular changes during the progression of diabetes. In Proceedings of the 2015 37th Annual International Conference of the IEEE Engineering in Medicine and Biology Society (EMBC), Milano, Italy, 25 August 2015; pp. 5255–5259. [Google Scholar] [CrossRef]
- Ţălu, S. Multifractal Geometry in Analysis and Processing of Digital Retinal Photographs for Early Diagnosis of Human Diabetic Macular Edema. Curr. Eye Res. 2013, 38, 781–792. [Google Scholar] [CrossRef]
- Cheung, C.Y.; Thomas, G.N.; Tay, W.; Ikram, M.K.; Hsu, W.; Lee, M.L.; Lau, Q.P.; Wong, T.Y. Retinal Vascular Fractal Dimension and Its Relationship with Cardiovascular and Ocular Risk Factors. Am. J. Ophthalmol. 2012, 154, 663–674. [Google Scholar] [CrossRef]
- Lim, S.W.; Cheung, N.; Wang, J.J.; Donaghue, K.C.; Liew, G.; Islam, F.A.; Jenkins, A.J.; Wong, T.Y. Retinal vascular fractal dimension and risk of early diabetic retinopathy: A prospective study of children and adolescents with type 1 diabetes. Diabetes Care 2009, 32, 2081–2083. [Google Scholar] [CrossRef]
- Zhu, P.; Huang, F.; Lin, F.; Li, Q.; Yuan, Y.; Gao, Z.; Chen, F. The Relationship of Retinal Vessel Diameters and Fractal Dimensions with Blood Pressure and Cardiovascular Risk Factors. PLoS ONE 2014, 9, e106551. [Google Scholar] [CrossRef]
- Aguirre, I.R.-M.; Rodríguez-Fernández, P.; González-Santos, J.; Aguirre-Juaristi, N.; Alonso-Santander, N.; Mielgo-Ayuso, J.; González-Bernal, J.J. Exploring the Quality of Life Related to Health and Vision in a Group of Patients with Diabetic Retinopathy. Healthcare 2022, 10, 142. [Google Scholar] [CrossRef]
Publisher’s Note: MDPI stays neutral with regard to jurisdictional claims in published maps and institutional affiliations. |
© 2022 by the authors. Licensee MDPI, Basel, Switzerland. This article is an open access article distributed under the terms and conditions of the Creative Commons Attribution (CC BY) license (https://creativecommons.org/licenses/by/4.0/).