1. Introduction
Two-alternative forced choice tasks with freely moving animals have been used to study vision and cognition in rodents, from the initial experiments with a jumping stand [
1] to the more recent visual water maze [
2,
3]. Both methods require the animal to make a distinction between two visual stimuli. To provide feedback to the animals, a correct choice is rewarded with food or by removal from the water, respectively. But these methods are labor intensive due to the frequent animal handling and limited number of trials that can be performed per day.
The touchscreen setup is an automated version of the visual water maze [
4], that allows for testing of multiple animals in parallel with limited experimenter interaction. The animals are placed in an operant chamber for up to one hour and consecutive trials are started automatically or initiated by the animal. The touchscreen platform is commonly used to study executive functioning [
5], learning and memory [
6,
7], and more recently vision [
8,
9]. The wide range of possible tasks, e.g., 5-choice serial reaction time task, discrimination and reversal learning [
4], etc. allow for a high degree of flexibility in designing experiments. Further advantages include the limited experimenter interaction and appetitive reinforcement which reduce the animal’s stress levels [
10]. Animals easily reach near 100% correct performance in these setups, and can learn very complicated visual tasks (e.g., [
9]. The possibility of combining the behavioral task with electrophysiology or optogenetics further increases the benefit of the touchscreen platform for more in depth studies of cognitive and visual processes.
Unfortunately, there are also some downsides to studying vision with touchscreen setups. Typically relatively arbitrary and easy to discriminate black and white shapes are used. In visual neuroscience, however, more complex shapes with well-defined parameters are required. Typical stimulus parameters include spatial frequency (SF), orientation, contrast [
11], velocity and direction of motion. Most of these can be easily defined on the screen, but when the animal is freely moving the position of the animals head cannot be controlled, which may distort the parameters at the moment of decision or response. The viewing distance and angle are for example important for determining the exact stimulus size, typically expressed in visual degrees. In vision experiments with freely moving animals there is usually a predefined decision boundary. This is not possible in the touchscreen platform since animals are allowed to freely explore, and only have to make their decision when they are right in front of the screen. It is thus not clear what the viewing distance is at the time the animal makes a decision.
The smallest feature that can be resolved by the visual system differs greatly between species and strains [
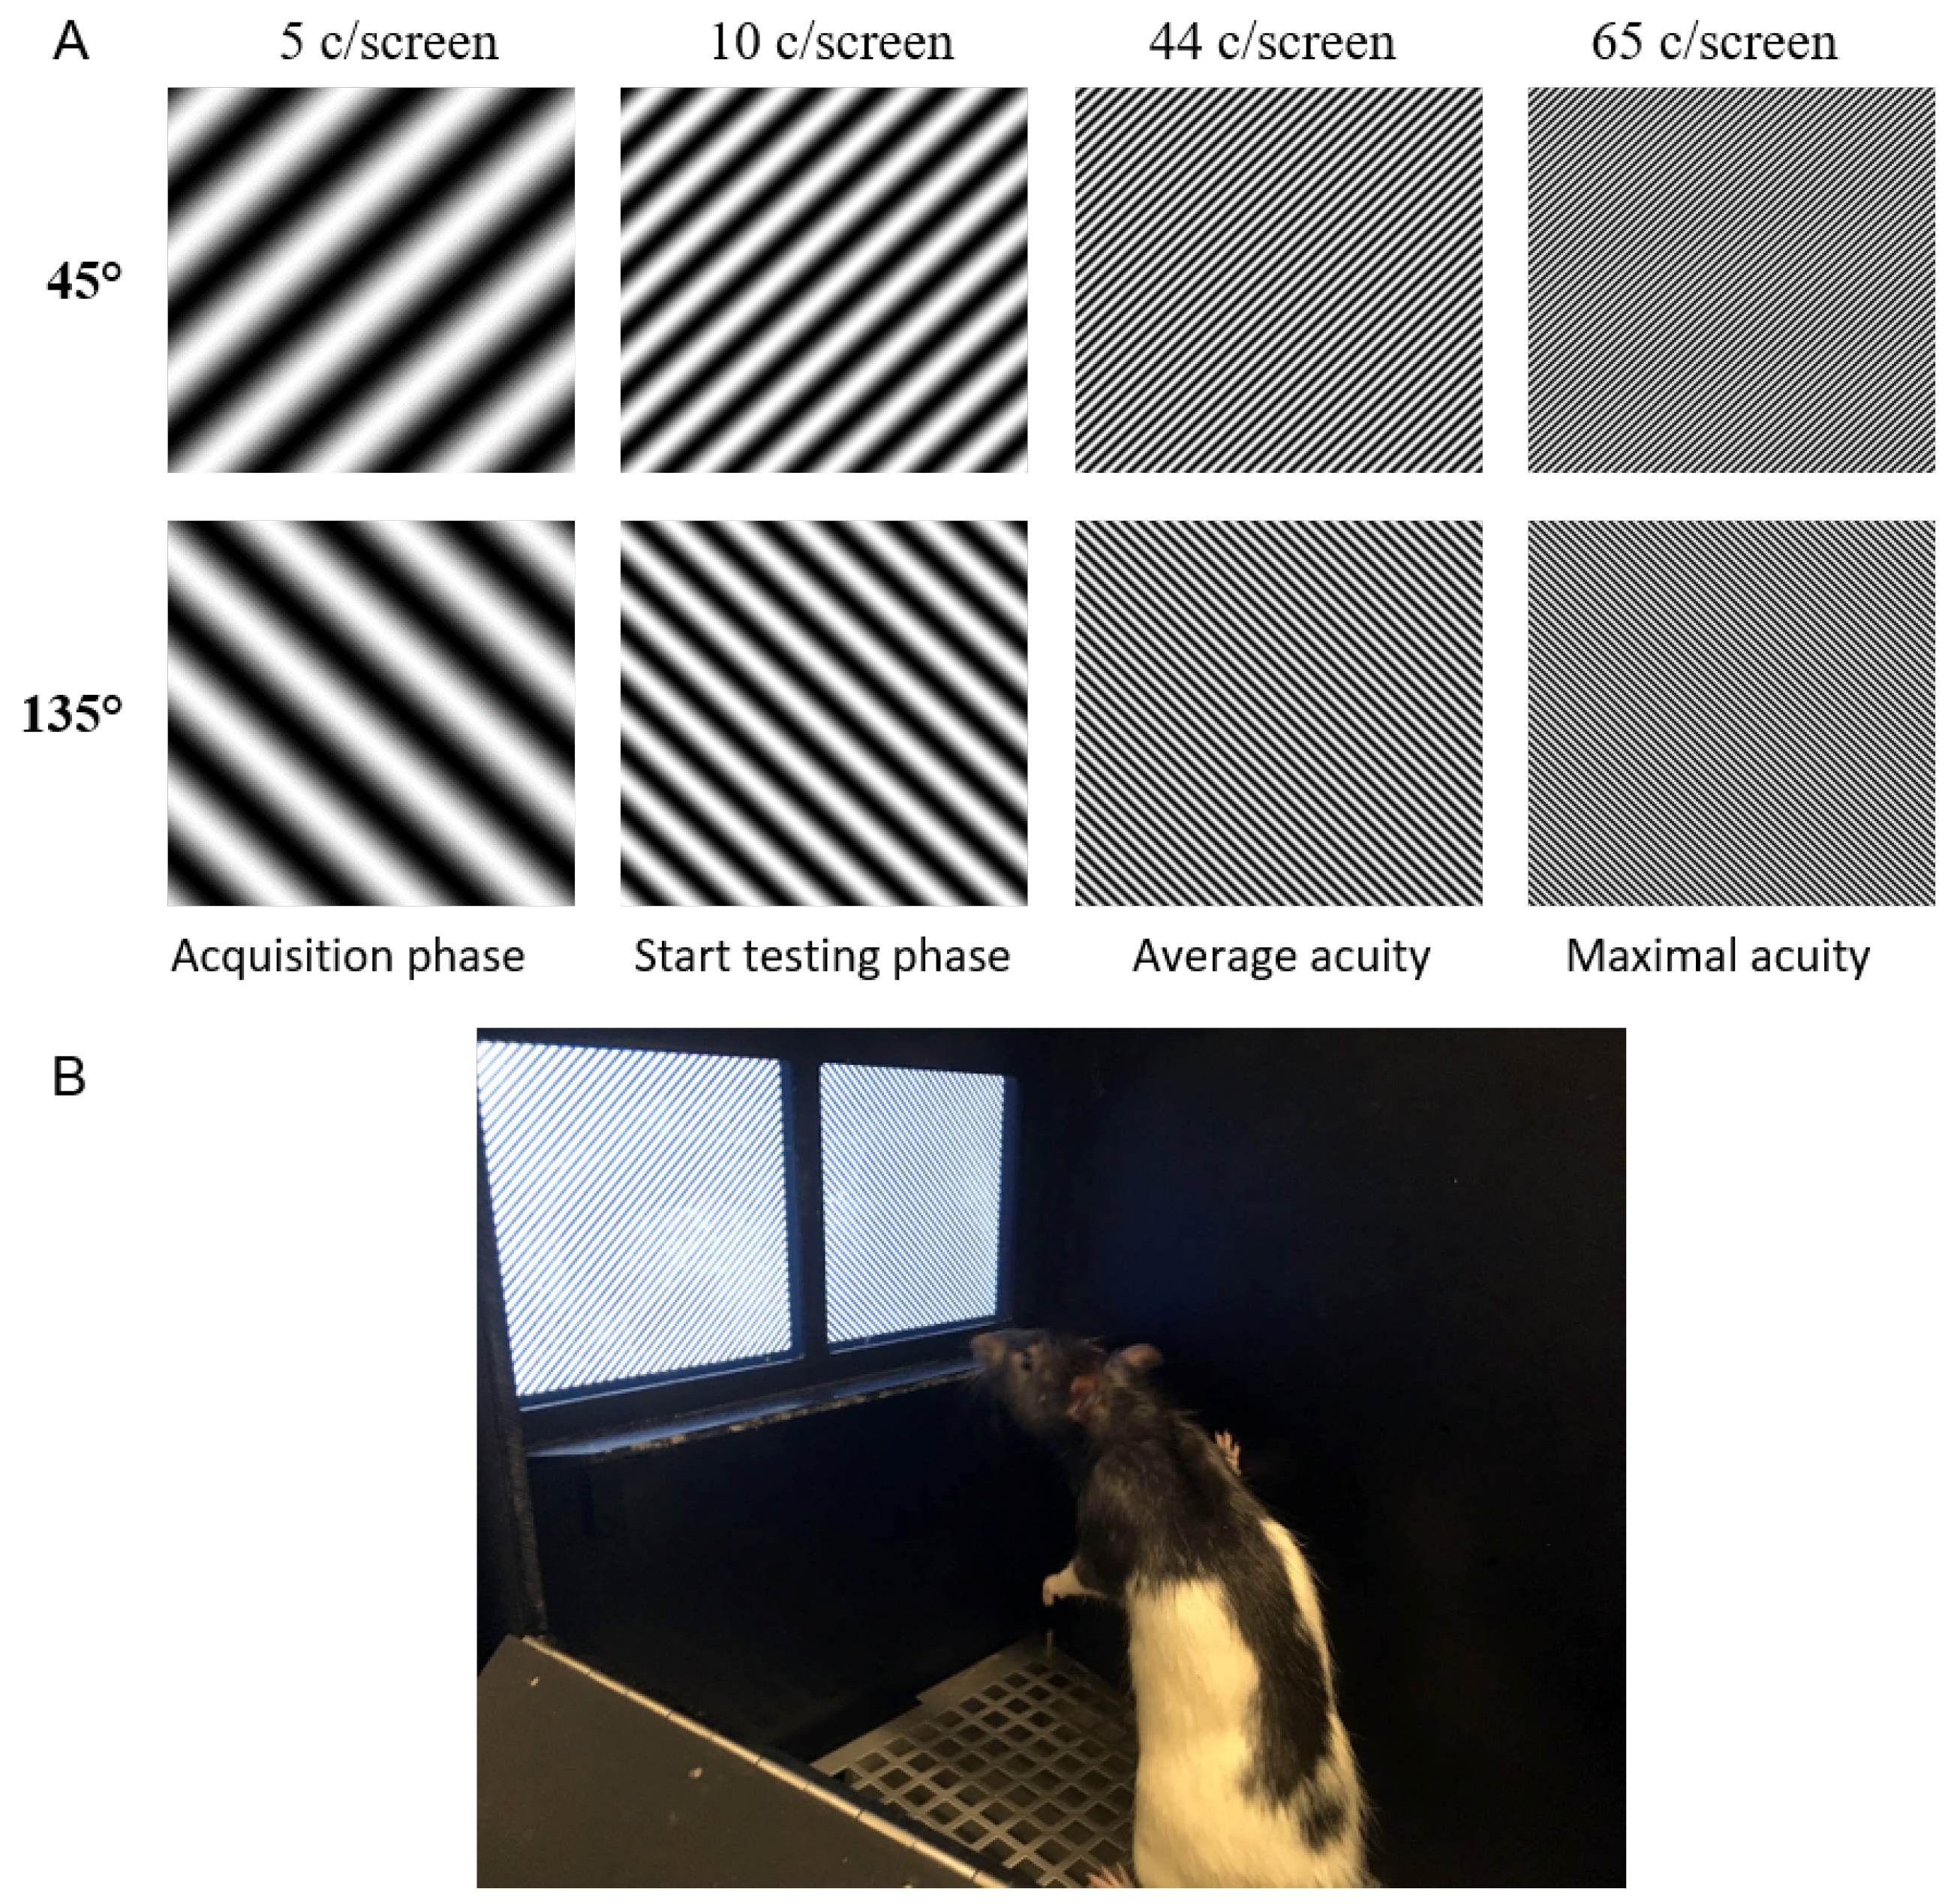
12]. This visual acuity can be determined based on the sinusoidal grating with the highest SF that can still elicit a reliable discrimination, expressed as the number of cycles per degree (c/degree). The acuity for pigmented rats has been determined in different behavioral paradigms to be approximately 1 c/degree at optimal contrast [
2,
13,
14], but is lower in albino rats [
15]. These measurements have all been performed with horizontal or vertical gratings, for oblique gratings the acuity is only 0.7 c/degree [
16], however this discrepancy disappeared after discrimination training with these oblique stimuli. In electrophysiological measurements in rat primary visual cortex the cut-off SF for a response is slightly higher at 1.2 c/degree [
17,
18].
Due to a growing interest in the use of a touchscreen platform in visual neuroscience, it is important to understand the limits of this system and of the tasks the animals can perform. To this end, we defined the visual acuity in rats while performing a pairwise discrimination task with gratings of increasing SF in the touchscreen platform. The SF of the stimuli is determined as it is presented on the screen and not as it is perceived by the animal, to overcome the absence of a clear decision boundary. Based on these measurements we can derive a theoretical decision distance assuming an acuity of 1 c/degree. Knowing the experimental limits of the platform can help in designing future touchscreen experiments focused on unraveling the visual system and its computations.
4. Discussion
Animals were trained in a pairwise discrimination task using the touchscreen setup. This method allows to test many animals at the same time while minimizing their stress-levels. Nonetheless, the platform does not allow to define a viewing distance, which is important in vision research. Typically, image dimensions are expressed in cycles per visual degree, to translate this to image dimensions on the screen one needs to know the exact viewing distance. We aimed at generating a bridge between these two techniques by defining the visual acuity, expressed as cycles per screen, in the touchscreen setup and relating this to previously published behavioral data on visual acuity in cycles per degree. This will allow us to compare the sensitivity of both methods and estimate an assumed viewing distance in the touchscreens.
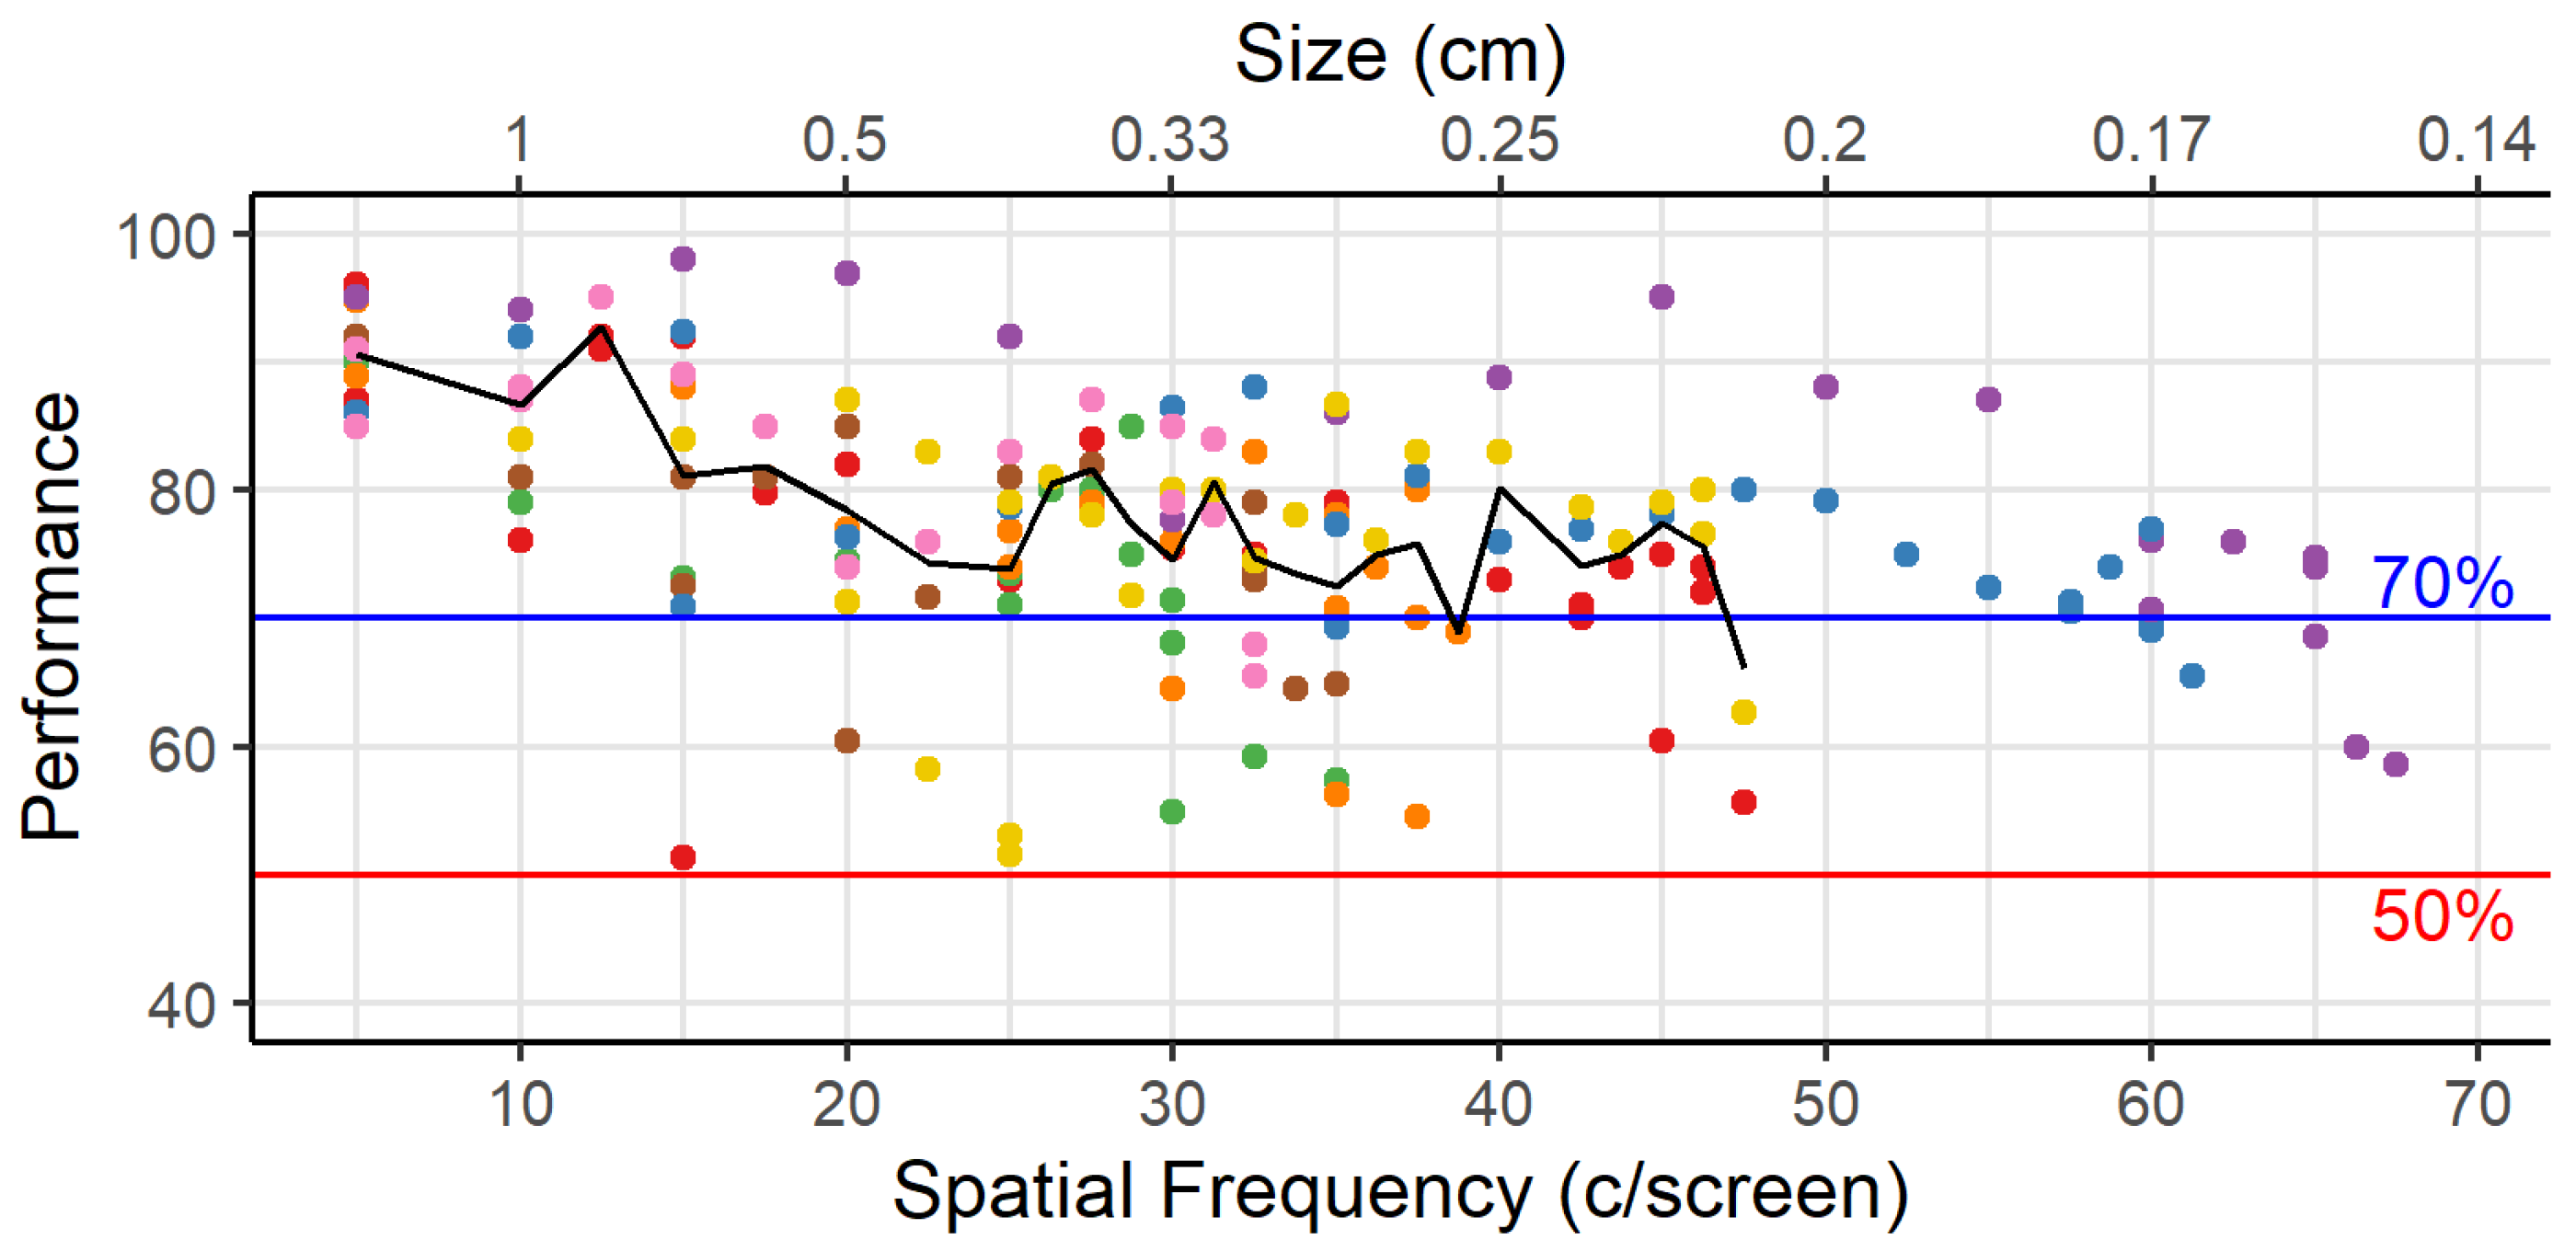
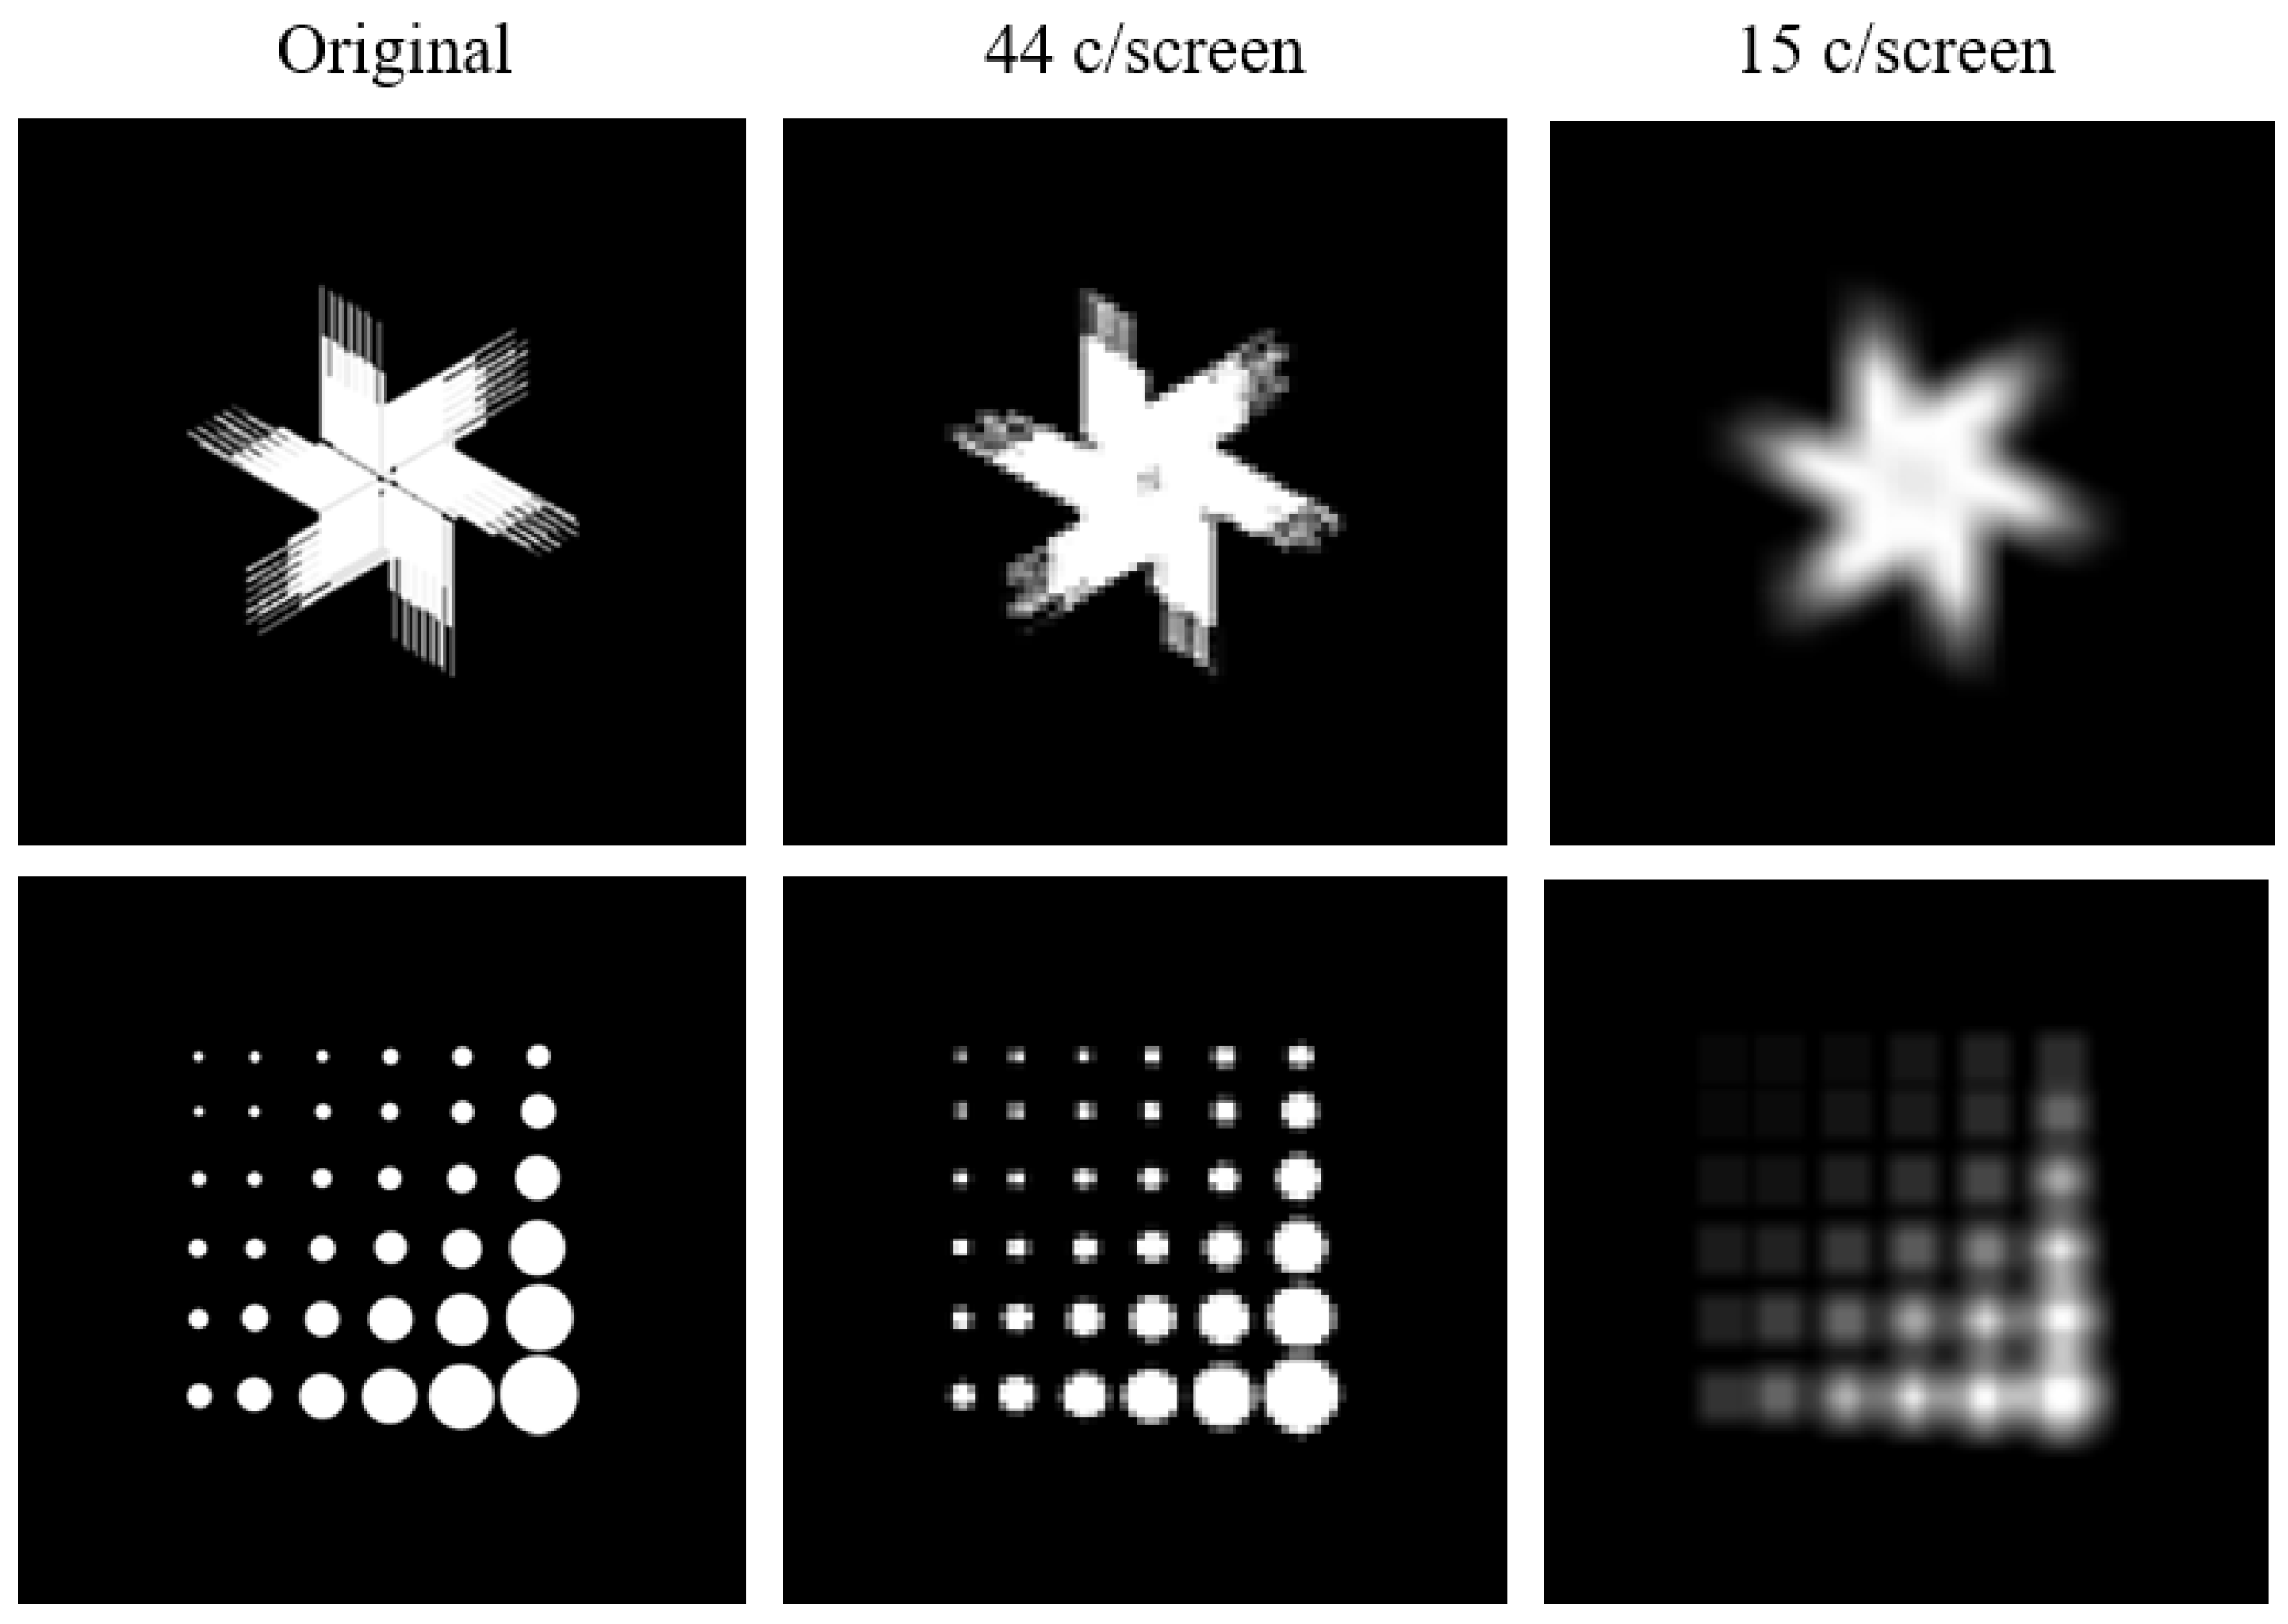
The average visual acuity observed in rats is 44 c/screen. This means they can only resolve features that are larger than 0.1 cm, the associated width of half a cycle. To assess what effect this minimal dimension would have on the training stimuli that are included in the standard protocol of the touchscreen manufacturer, we adjusted the pixel size to 0.1 cm. When applying this assumption to the stimuli of the touchscreen platform, we see that smaller features are filtered out (
Figure 6). Since both stimuli are sufficiently different, reliable discrimination is still possible. However, this does become important when designing new experiments and selecting stimuli for training. Stimuli should not contain any discrimination features that are smaller than the minimum size calculated here, to assure proper discrimination by the animal.
One important caveat to this exercise is that our threshold method determines the maximum spatial frequency that the animals can use to some degree, but it does not give us the spatial frequency that the animals typically use when multiple frequencies are present in images. Furthermore, this threshold is associated with a performance level of 70%, which is substantially lower than the 85% that we use as the criterion to conclude that an animal has mastered the task. Based upon
Figure 3, if we want animals to obtain 85% accuracy on average, then we would rather work with the spatial frequency associated with approximately 15 c/screen.
Since the viewing distance can never be fully defined in the touchscreen platform, it is not advised to use measures based on viewing distance to define stimuli, e.g., cycles per degree. Therefore, we measured the cycles on the screen per stimulus. Based on these performances we could deduce that a decision distance of 12.5 cm for rats can be assumed when designing touchscreen experiments and relating to previously published data. This assumption only holds if there is no effect of experimental design on the visual acuity. It is possible that difference in motivation and task difficulty have influenced these measures of visual acuity. The assumption of viewing distance can thus only be applied to the touchscreen platform and should be reevaluated if used in other platforms. Even then these numbers should be used with caution.
To obtain a more universal estimate of the viewing distance for freely moving animals would require some adaptations to the setup and behavioral paradigm. It is for example possible to track the animal’s movements and to link stimulus presentation to the animal’s exact location. If the stimulus disappears when the animal comes too close to the screen, then it would force the animal to decide from a certain viewing distance. Alternatively, one could place a decision boundary within the setup and prevent the animal from approaching the screen up close. However, as our main interest was in the impact of stimulus features on task performance in the standard touchscreen setup and tasks, we decided to not deviate from the typical protocol and apparatus.
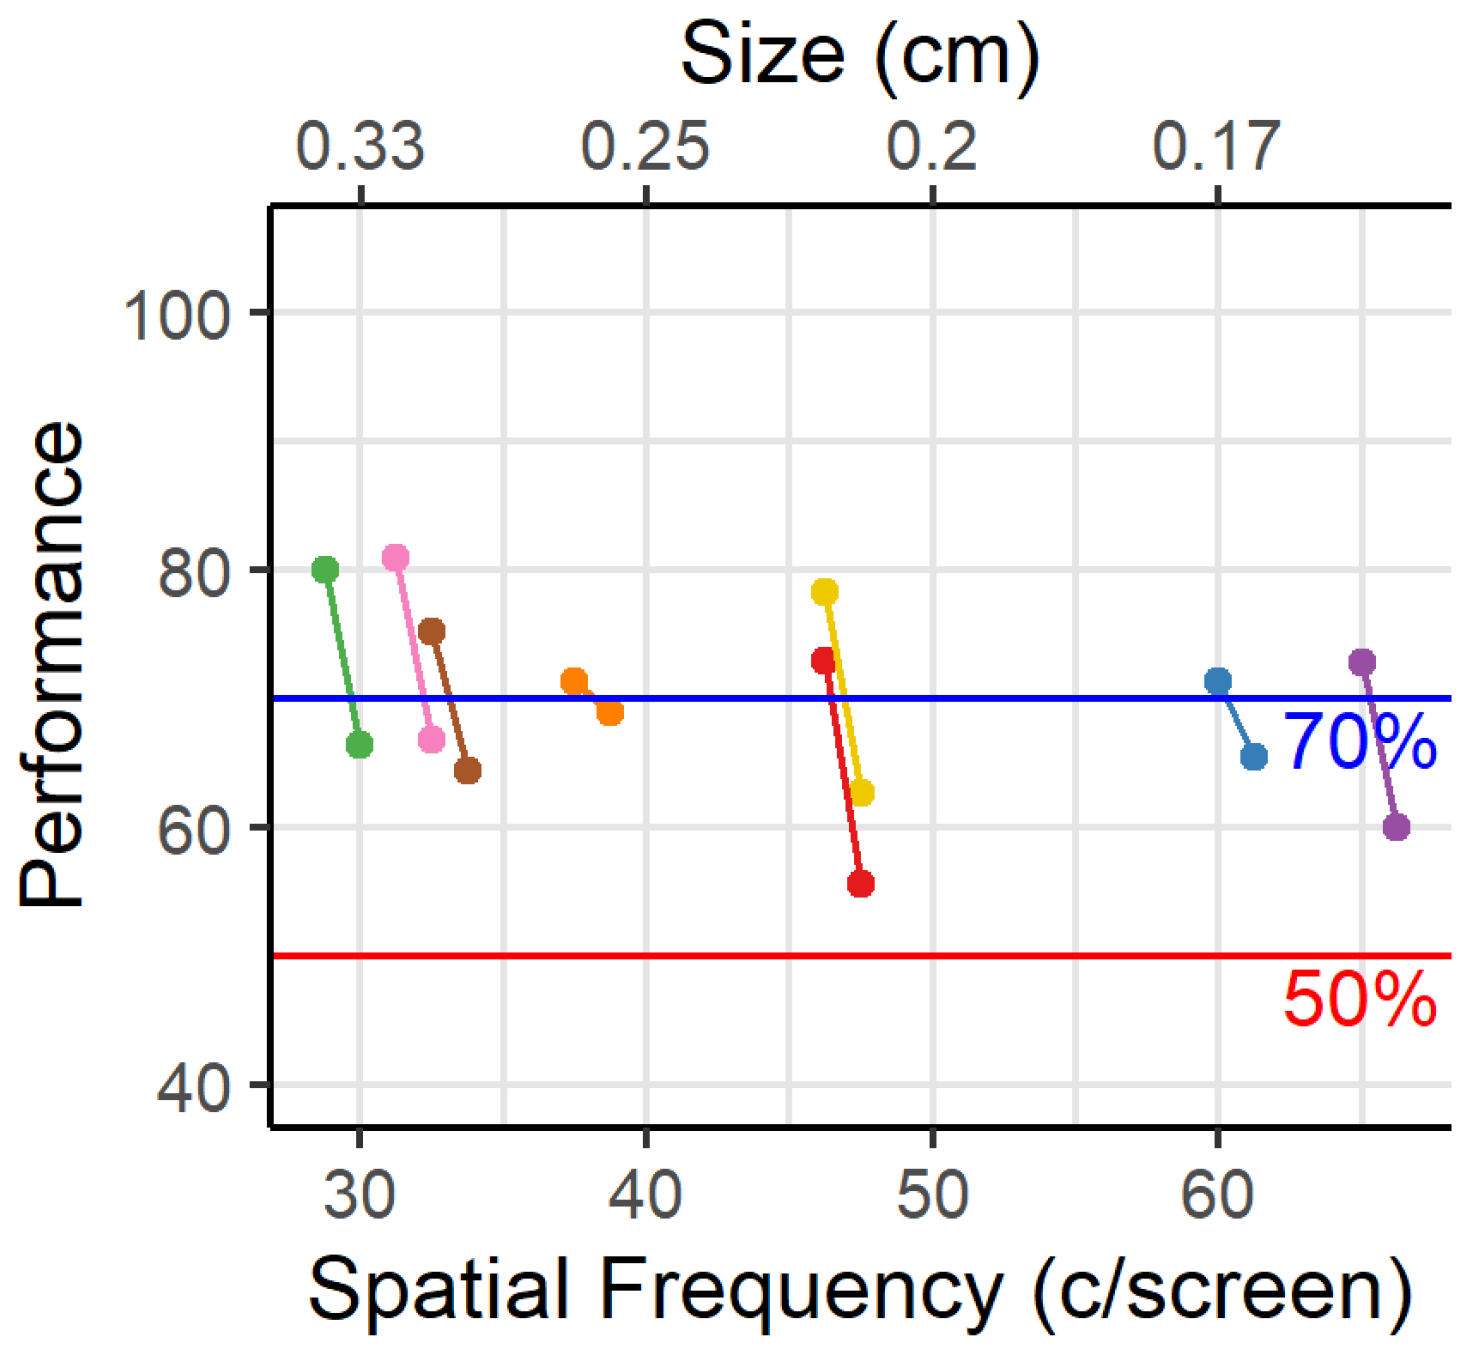
The maximal acuity in this experiment ranged from 32 to 67 c/screen. This range was much larger than expected from the literature. This could be due to the difference in incentive between the studies. Individual animals may respond differently to the food deprivation. Even though all animals undergo the same protocol, the amount of deprivation might still differ, and therefor also their intrinsic motivation to perform the task. Animals that are more severely deprived are expected to respond faster and collect their reward faster. In our data this is the case for the animals with the lowest acuity, indicating that a too strong deprivation might interfere with learning. Animals with a higher acuity took more time to engage in the task, which possibly enhanced learning. On the contrary, in the visual water maze all animals have the same incentive: getting out of the water to survive. Additionally, the experimental protocol for the touchscreens contains many more trials per daily session than in the visual water maze where only one trial is performed at a time. Animals need to perform multiple trials (n = 100) within an hour and we notice, in this and previous experiments, that response times and inter-trial intervals increase by the end of the session as animals become satiated. Finally, in the touchscreen setups the decision distance might differ between animals, while the decision distance is fixed in the water maze.
The estimated viewing distance based on these results is larger than expected when observing the animals’ behavior. Animals are able to approach the screen up to ∼1 cm before making the decision and indicating their response through a nose poke. Rats have been observed to spend several seconds in front of the screen before making a response. It is thus likely that the actual decision distance is only a few centimeters from the screen. The longer viewing distance could be a reflection of limitations of the set-up or the task difficulty.
Regarding task difficulty, typical acuity experiments use a detection task, where a sinusoidal grating needs to be distinguished from a gray screen [
2,
21]. In our task, we were not interested in the animal’s ability to detect a grating, but we were interested in the highest spatial frequency that could be used for a pairwise discrimination task in the touchscreen platform. In other words, we were interested in the smallest feature that could be used by the animals to solve the discrimination task. Animals may not pick up on the orientation differences or perceive the two stimuli at the same fine spatial frequency at which they can detect the presence of the gratings. This was shown in mice by the longer learning time for a discrimination task as compared to the detection task [
21]. This may impede pairwise discrimination learning and testing in the later phases. Additionally, acuity for oblique stimuli is lower (0.7 c/degree) than for horizontal gratings in the visual water maze [
16]. Although this probably reflects a lack of experience rather than a true difference in the animals perceptual abilities. After daily training with the oblique gratings for 14 days, the acuity was as high as for the horizontal gratings (
Figure 2B from [
16]). Orientation discrimination is a relatively difficult discrimination task. The estimated time for acquisition of a discrimination task is around 7 days when using the default stimuli from the training phases [
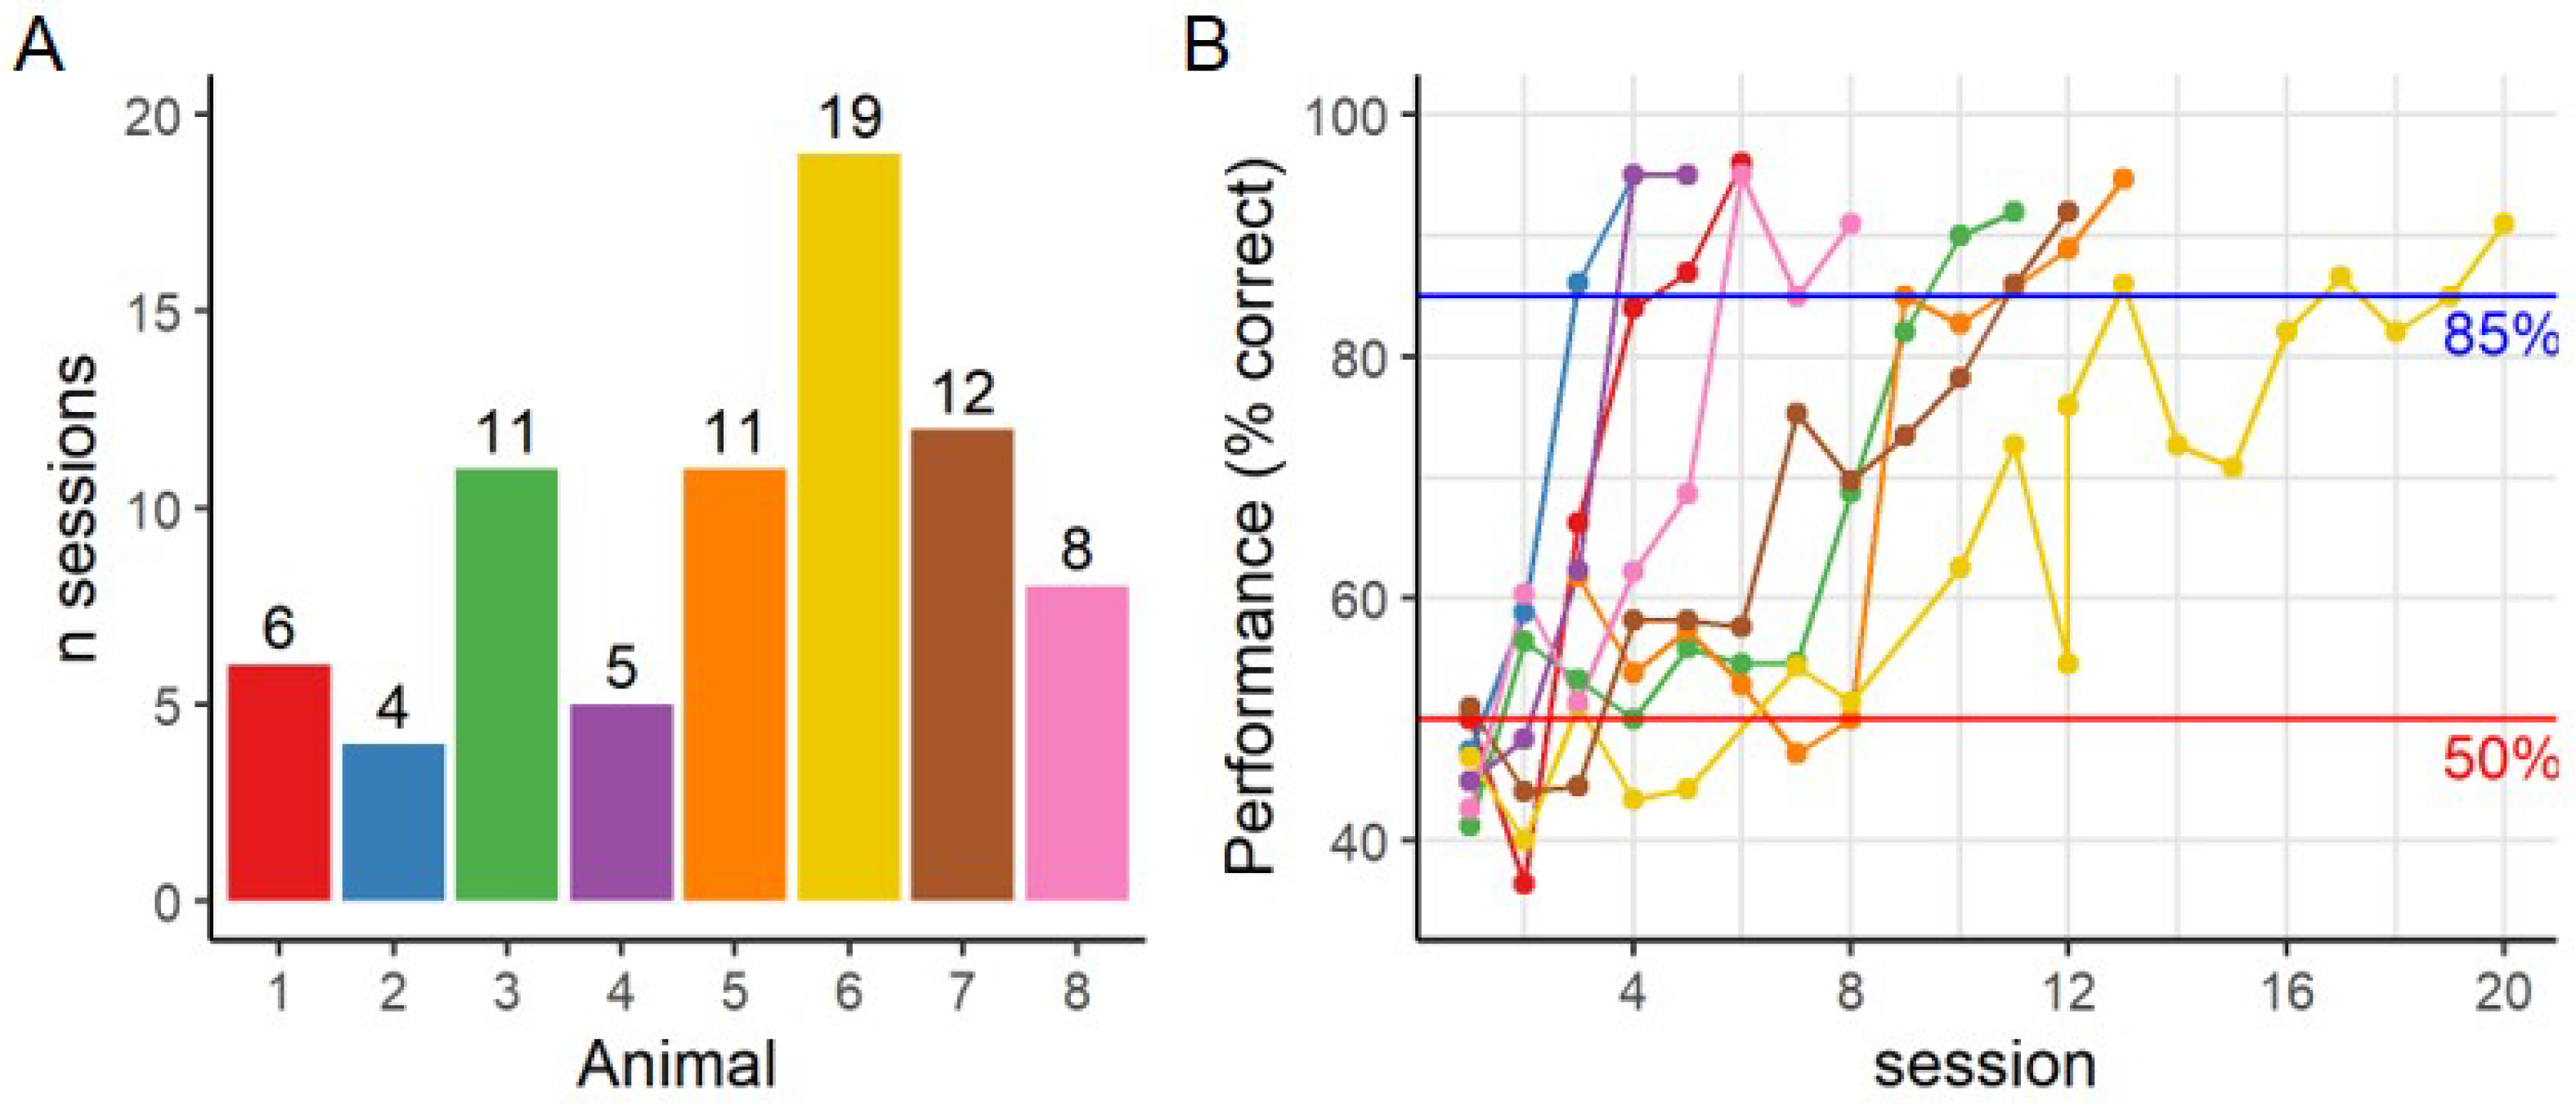
6]. However, for our experiment the required sessions increased to more than 11 sessions for four out of eight animals.
Figure 5 can be used to estimate the viewing distance if solving a discrimination task would make the animals rely upon lower spatial frequencies compared to a detection task. Suppose that this limit would be below or at 0.5 c/degree, then the viewing distance would decrease to less than 5 cm. This is consistent with how the animals approach the screens while solving the task.
In [
2] the grating was presented at the end of one arm of the visual water maze. Making an error is punished by having to swim back to the correct arm and thus increasing the time in the water, which is a negative and stressful experience for the animals. Animals are encouraged to learn quickly and are discouraged from making a wrong decision. Even though only a few trials can be performed per day, this can give a quick read-out of visual acuity. On the contrary, our task is based on positive reinforcement, which improves animal welfare but may reduce their motivation and incentive. This reduced incentive in the touchscreen setup is seen in the slow learning curve of 7 days [
6] as compared to the 2–4 session in the visual water task [
2]. The same is observed in mice where it takes 8 days of 80 trials with a food reward [
22] and only 20–40 trials for the visual water task [
2]. Additionally, it should be noted that a lower performance is linked to a decreased amount of trials within one session (2-sided Pearson’s R = 0.83,
p < 0.001 during the acquisition phase), as each trial with an incorrect response is repeated until a correct response is observed. These correction trials are not included in the trial count, and thus limit the amount of regular trials that can be performed within the hour. This same relationship holds during the testing phase (2-sided Pearson’s R = 0.18,
p = 0.0179). However, with increased spatial frequency there is no change in the amount of trials (2-sided Pearson’s R = −0.08,
p = 0.274) or in the number of correction trials needed to correct for each incorrect answer (2-sided Pearson’s R = 0.03,
p = 0.725).
Both the reduced motivation and increased task difficulty may decrease our estimate of visual acuity threshold as compared to literature with other paradigms. However, this is a limitation inherent to the touchscreen setup, and should therefore not affect our results. As mentioned above, the conclusions about viewing distance and minimal feature size are unique to this setup.
In conclusion, the touchscreen platform can be used to study high-level vision when respecting its limitations. Stimulus presentation is not as well controlled as one may want, although we have shown that a small adjustment in experimental parameters may alleviate this problem. Despite this lack of control, we were able to obtain information about which amount of detail rats can use in touchscreen experiments. The resulting findings can help assess whether stimuli are appropriate for use in touchscreen experiments.


