Judging Relative Onsets and Offsets of Audiovisual Events


Abstract
1. Introduction
1.1. Background
1.2. Impetus for the Present Study
2. Methods
2.1. Participants
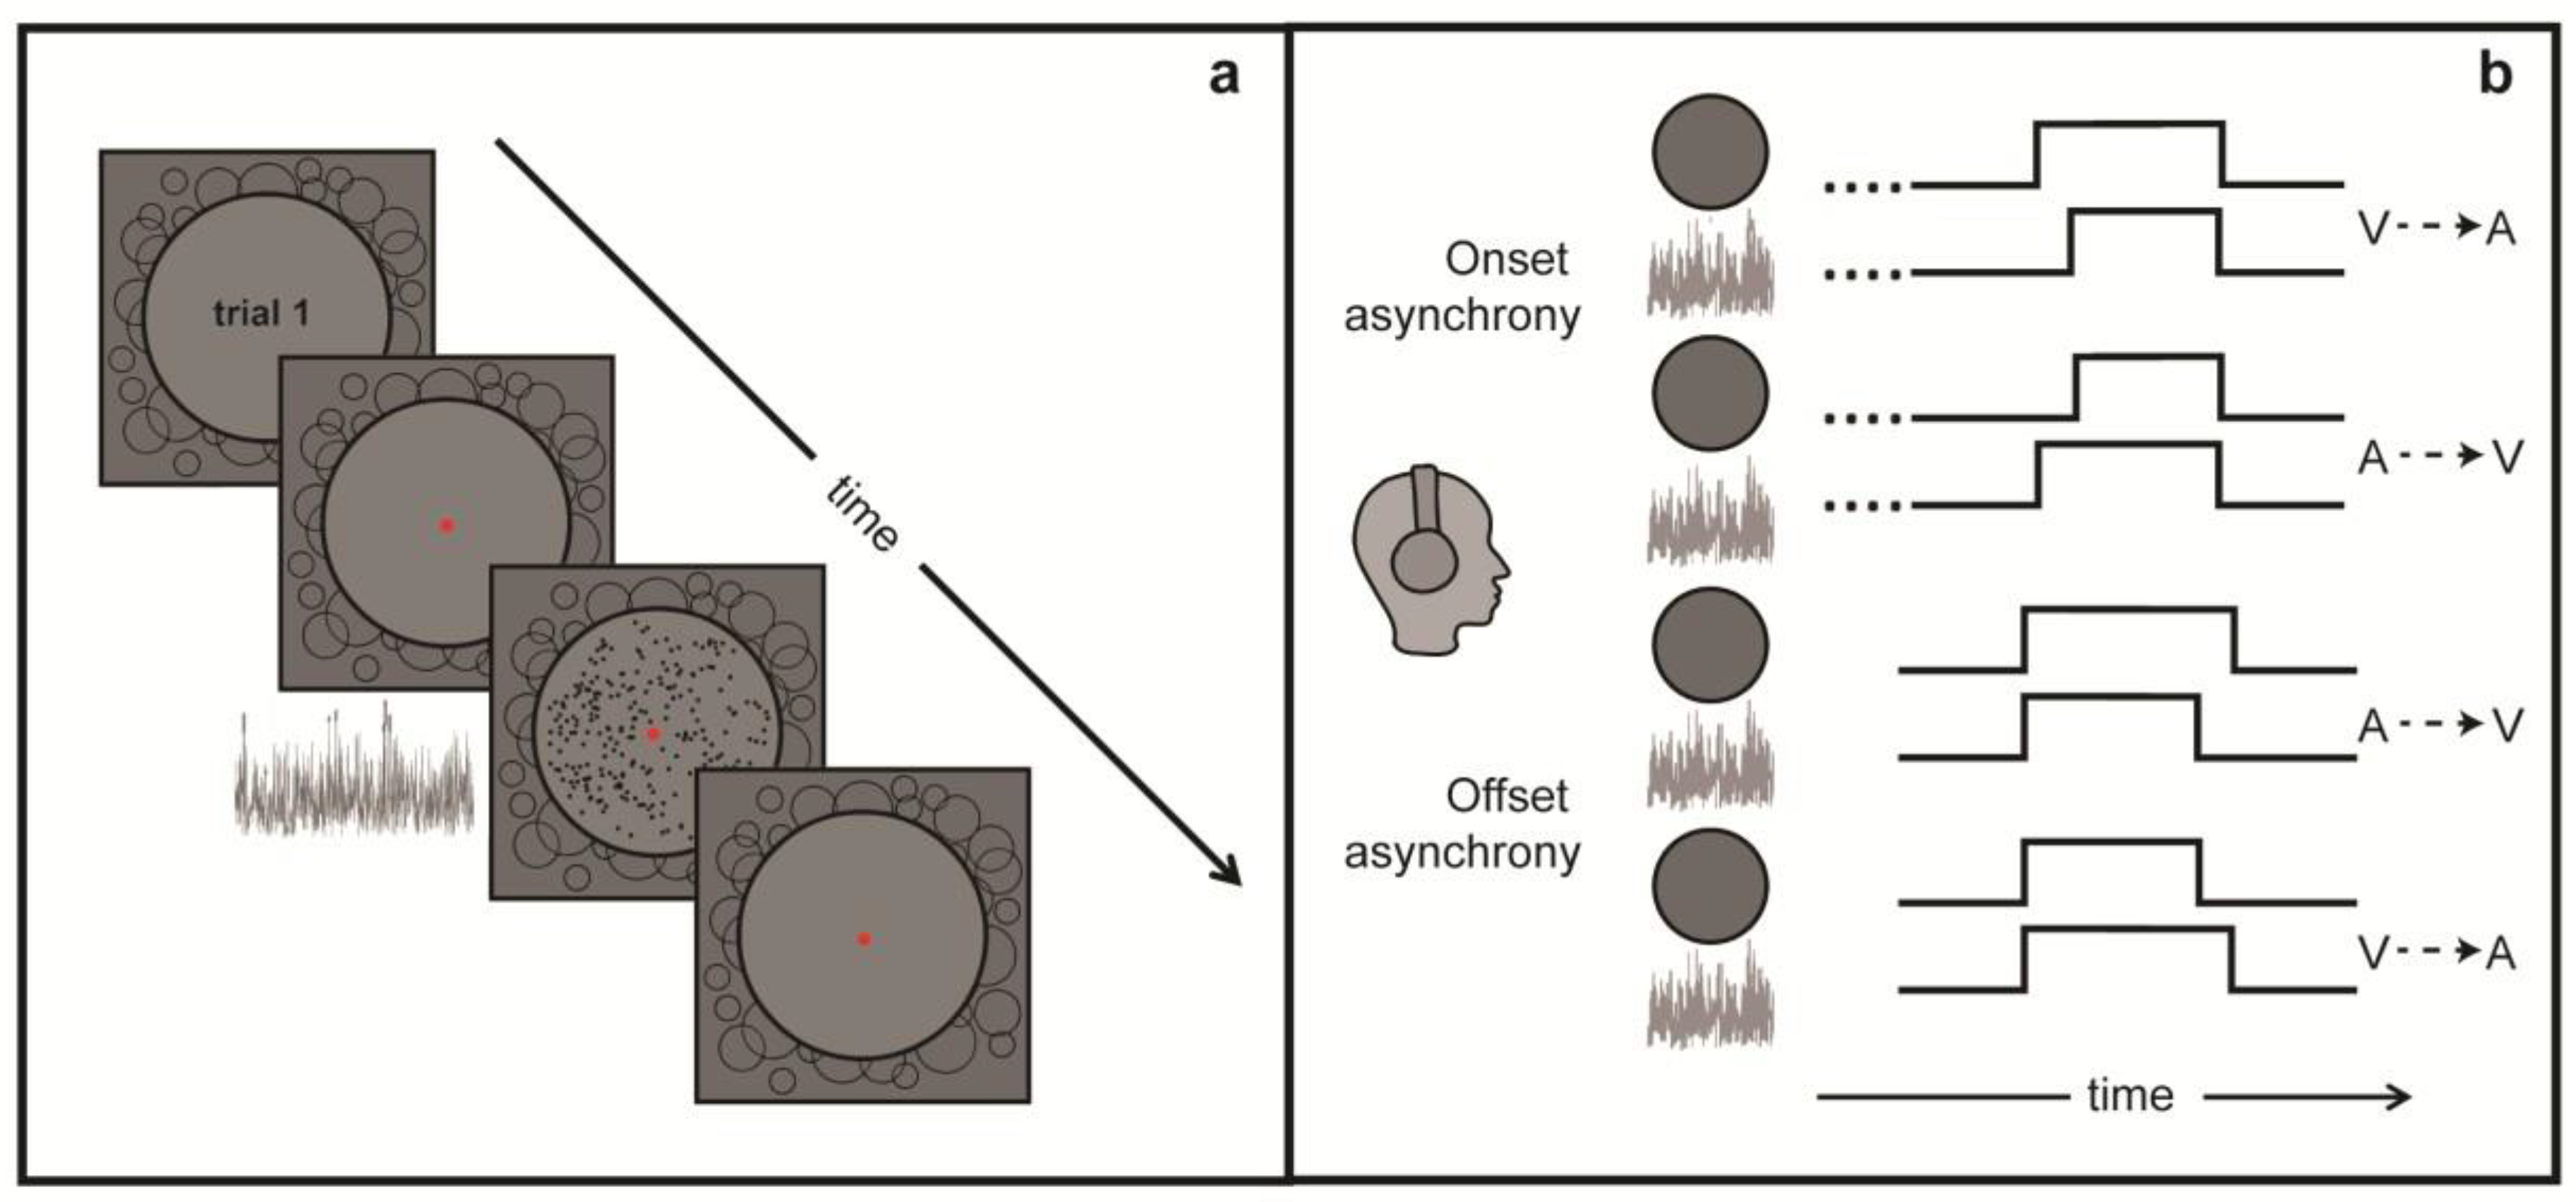
2.2. Stimulus and Equipment
2.3. Procedure
3. Results
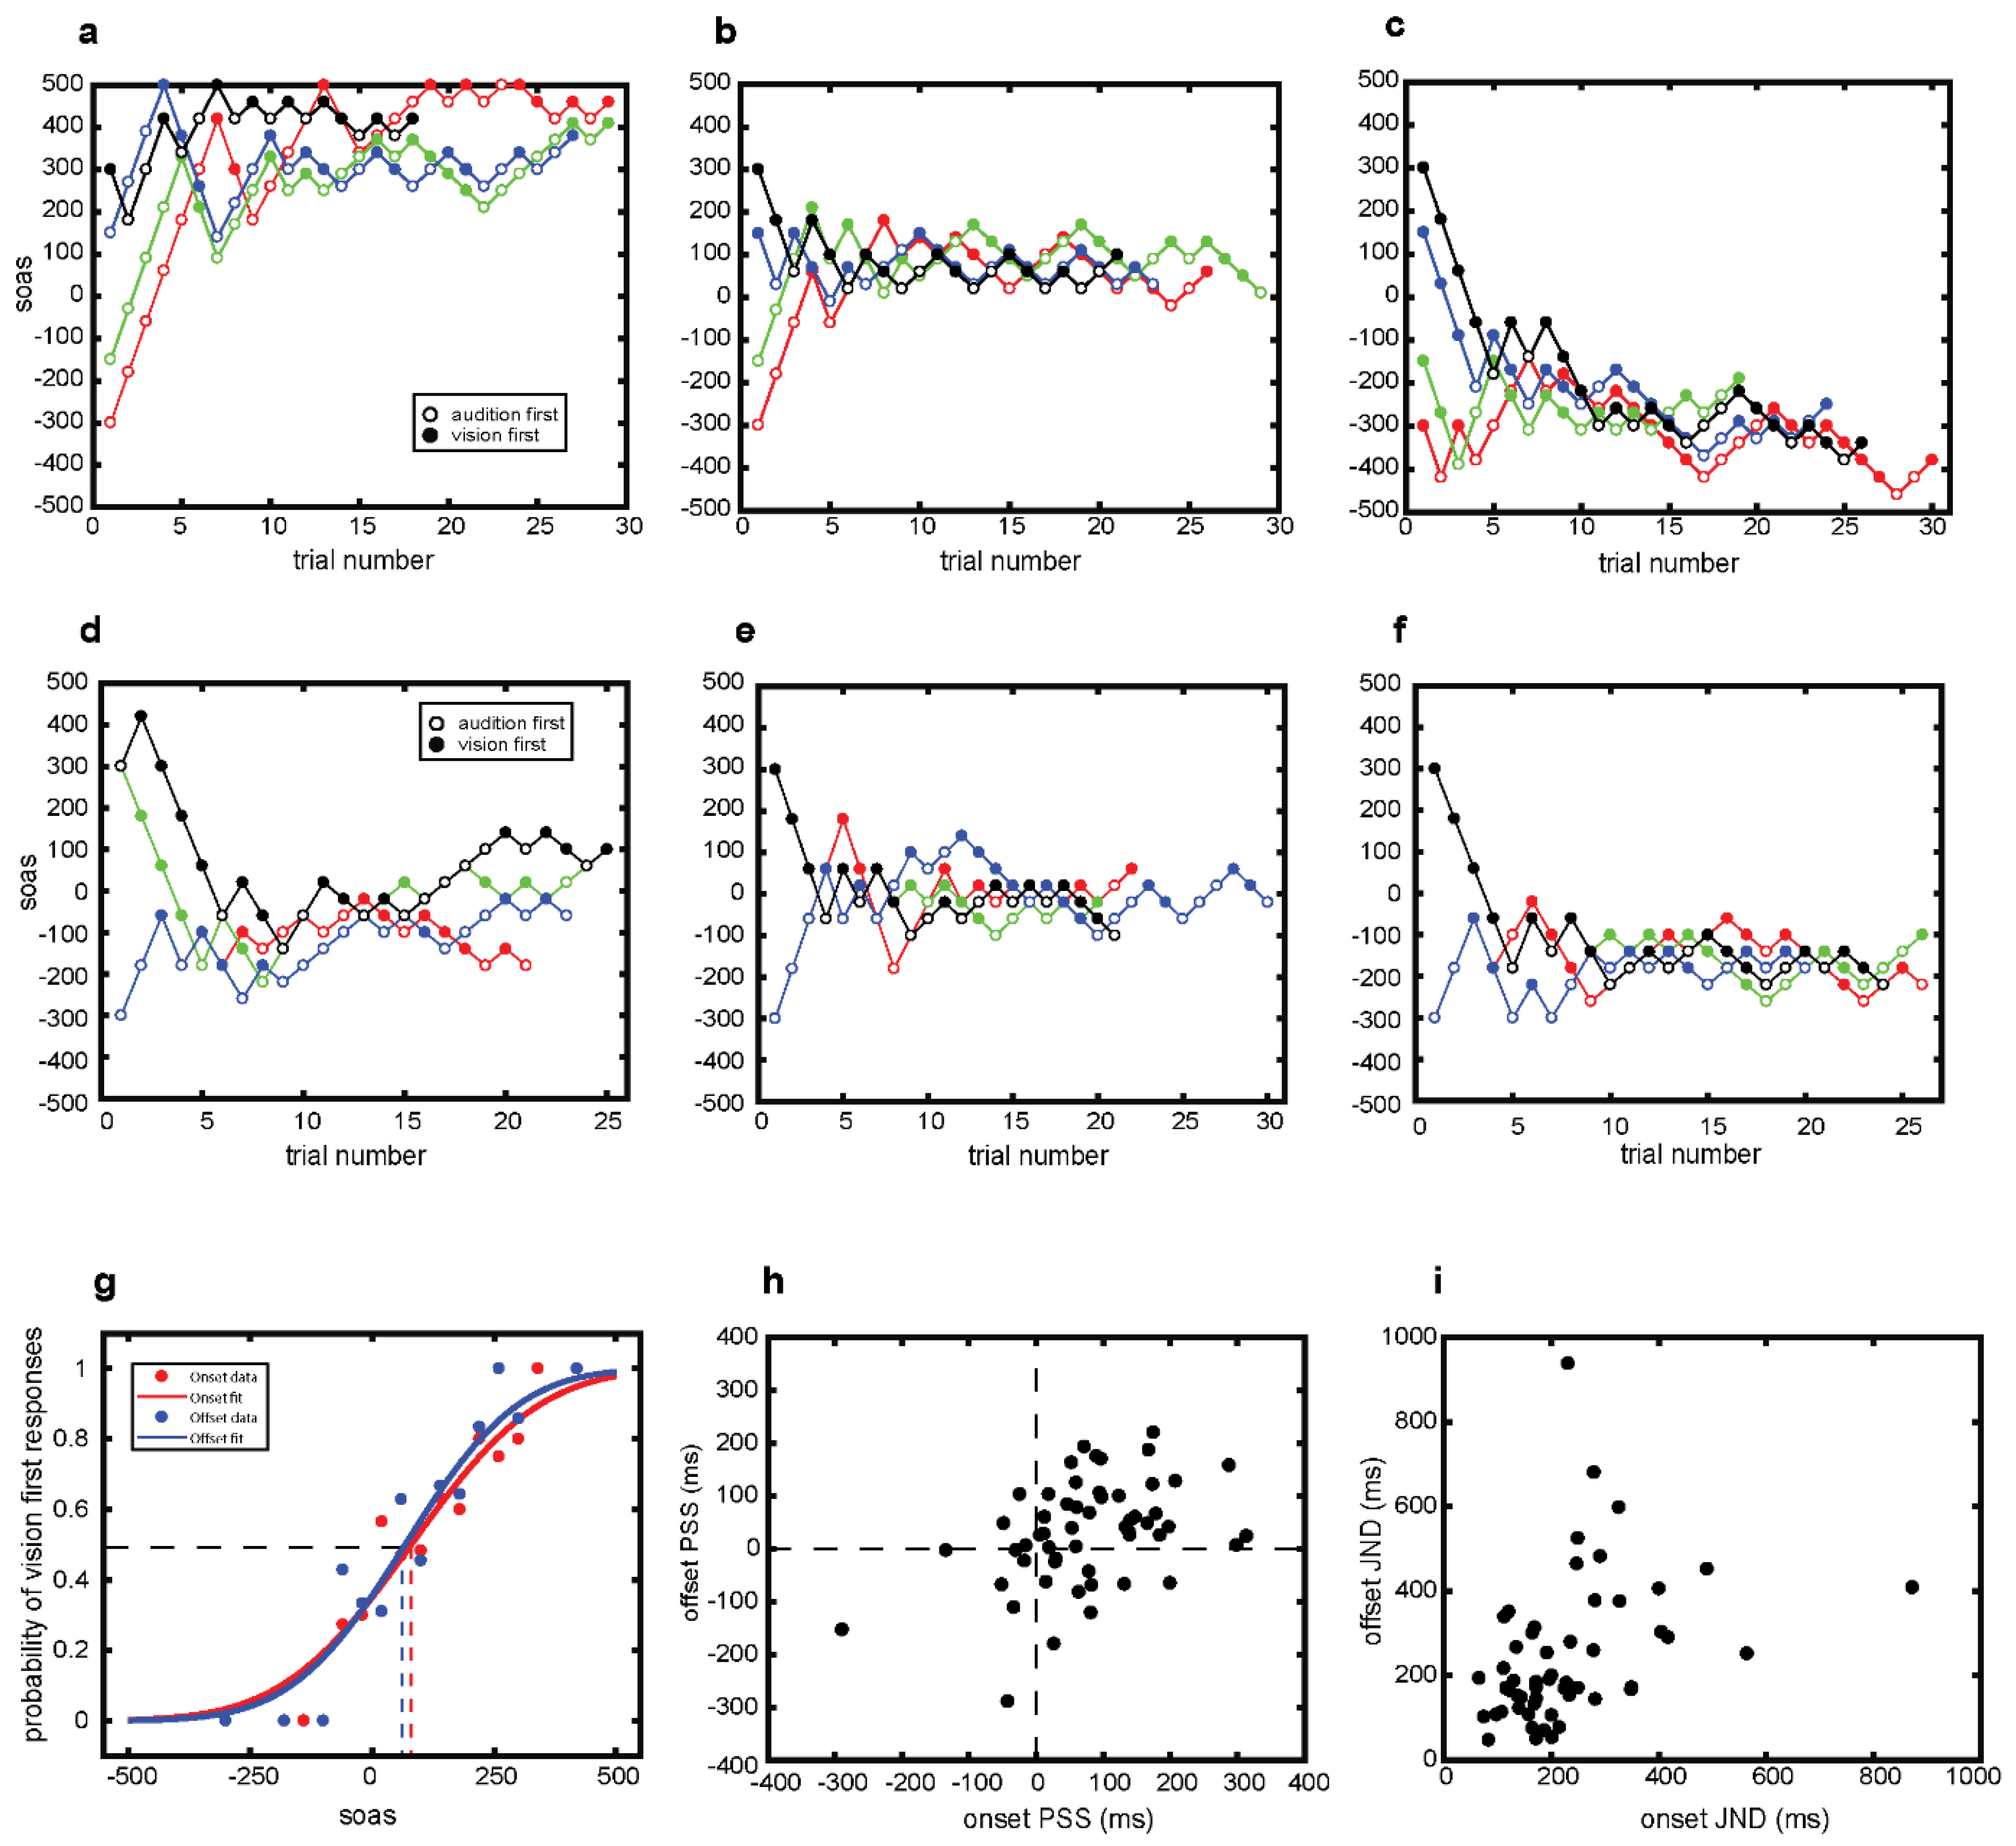
3.1. Staircase Sequences
3.2. Psychometric Curves
3.3. PSS Estimates
3.4. JND Estimates
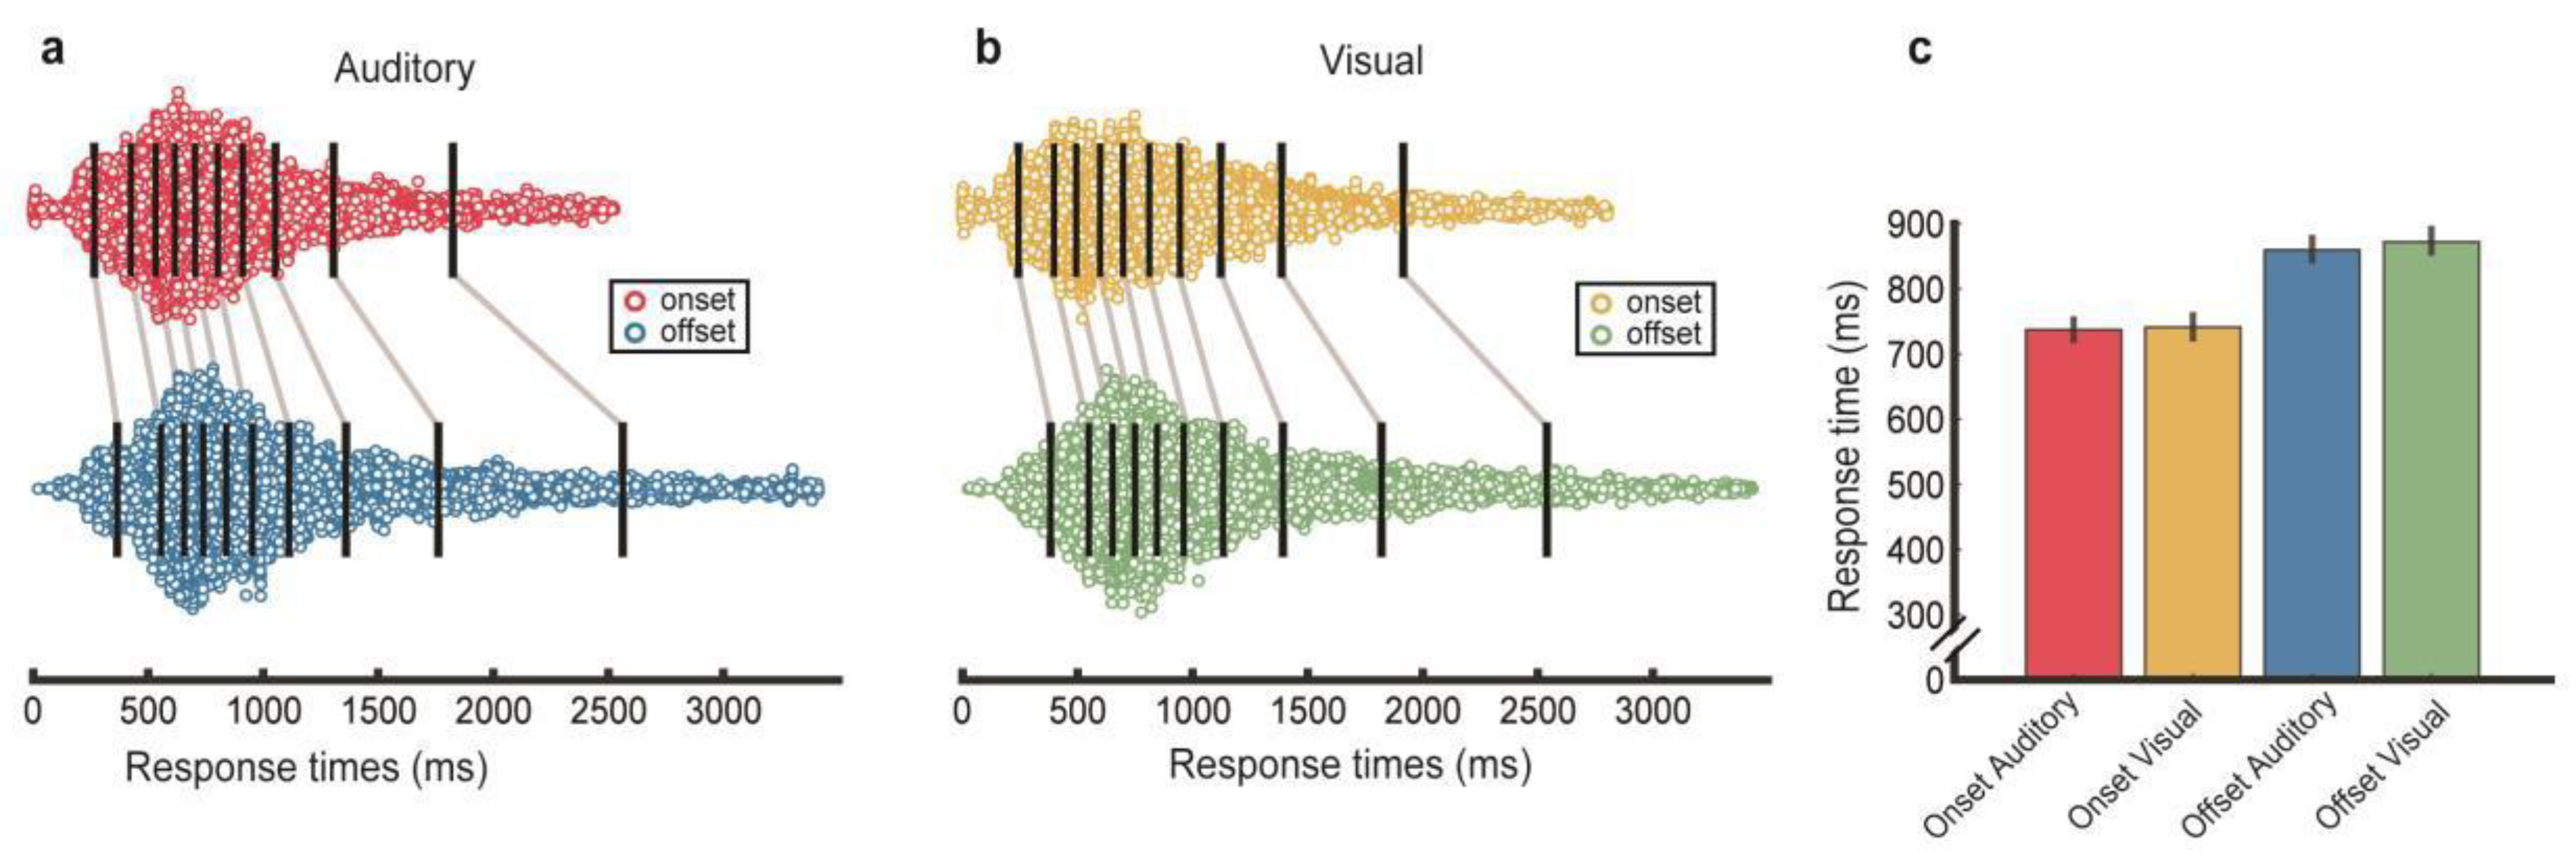
3.5. Response Times
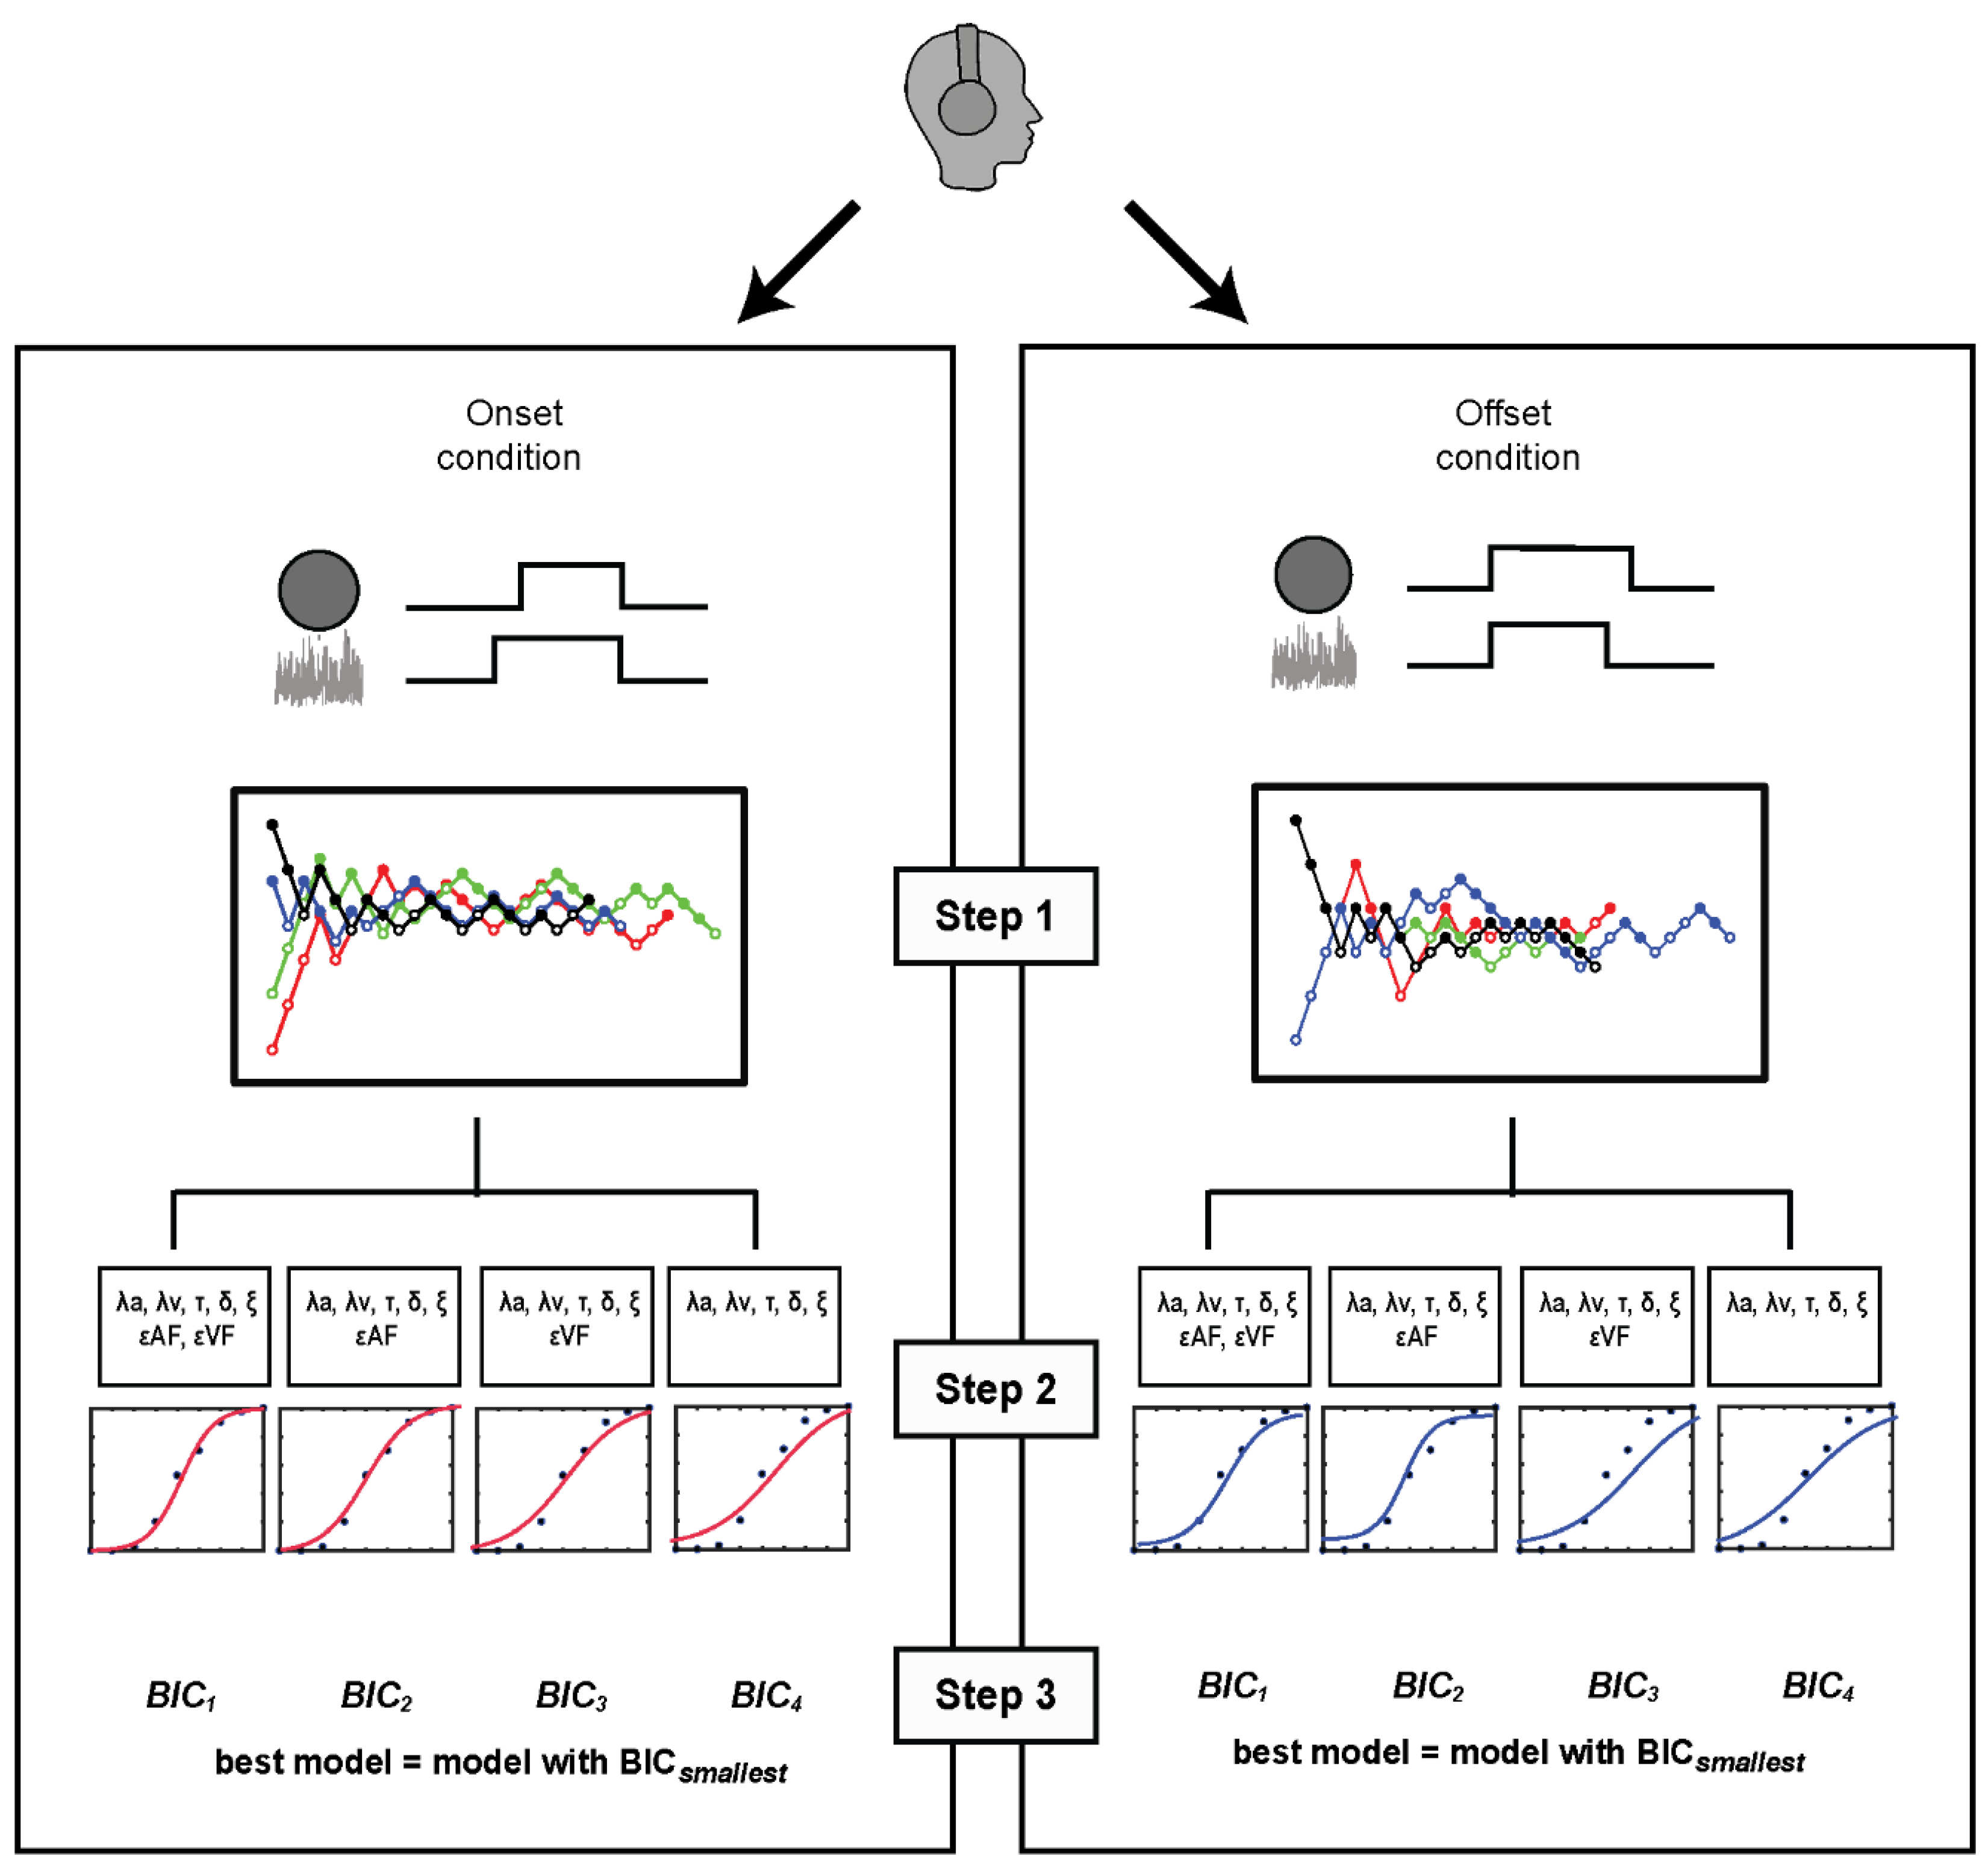
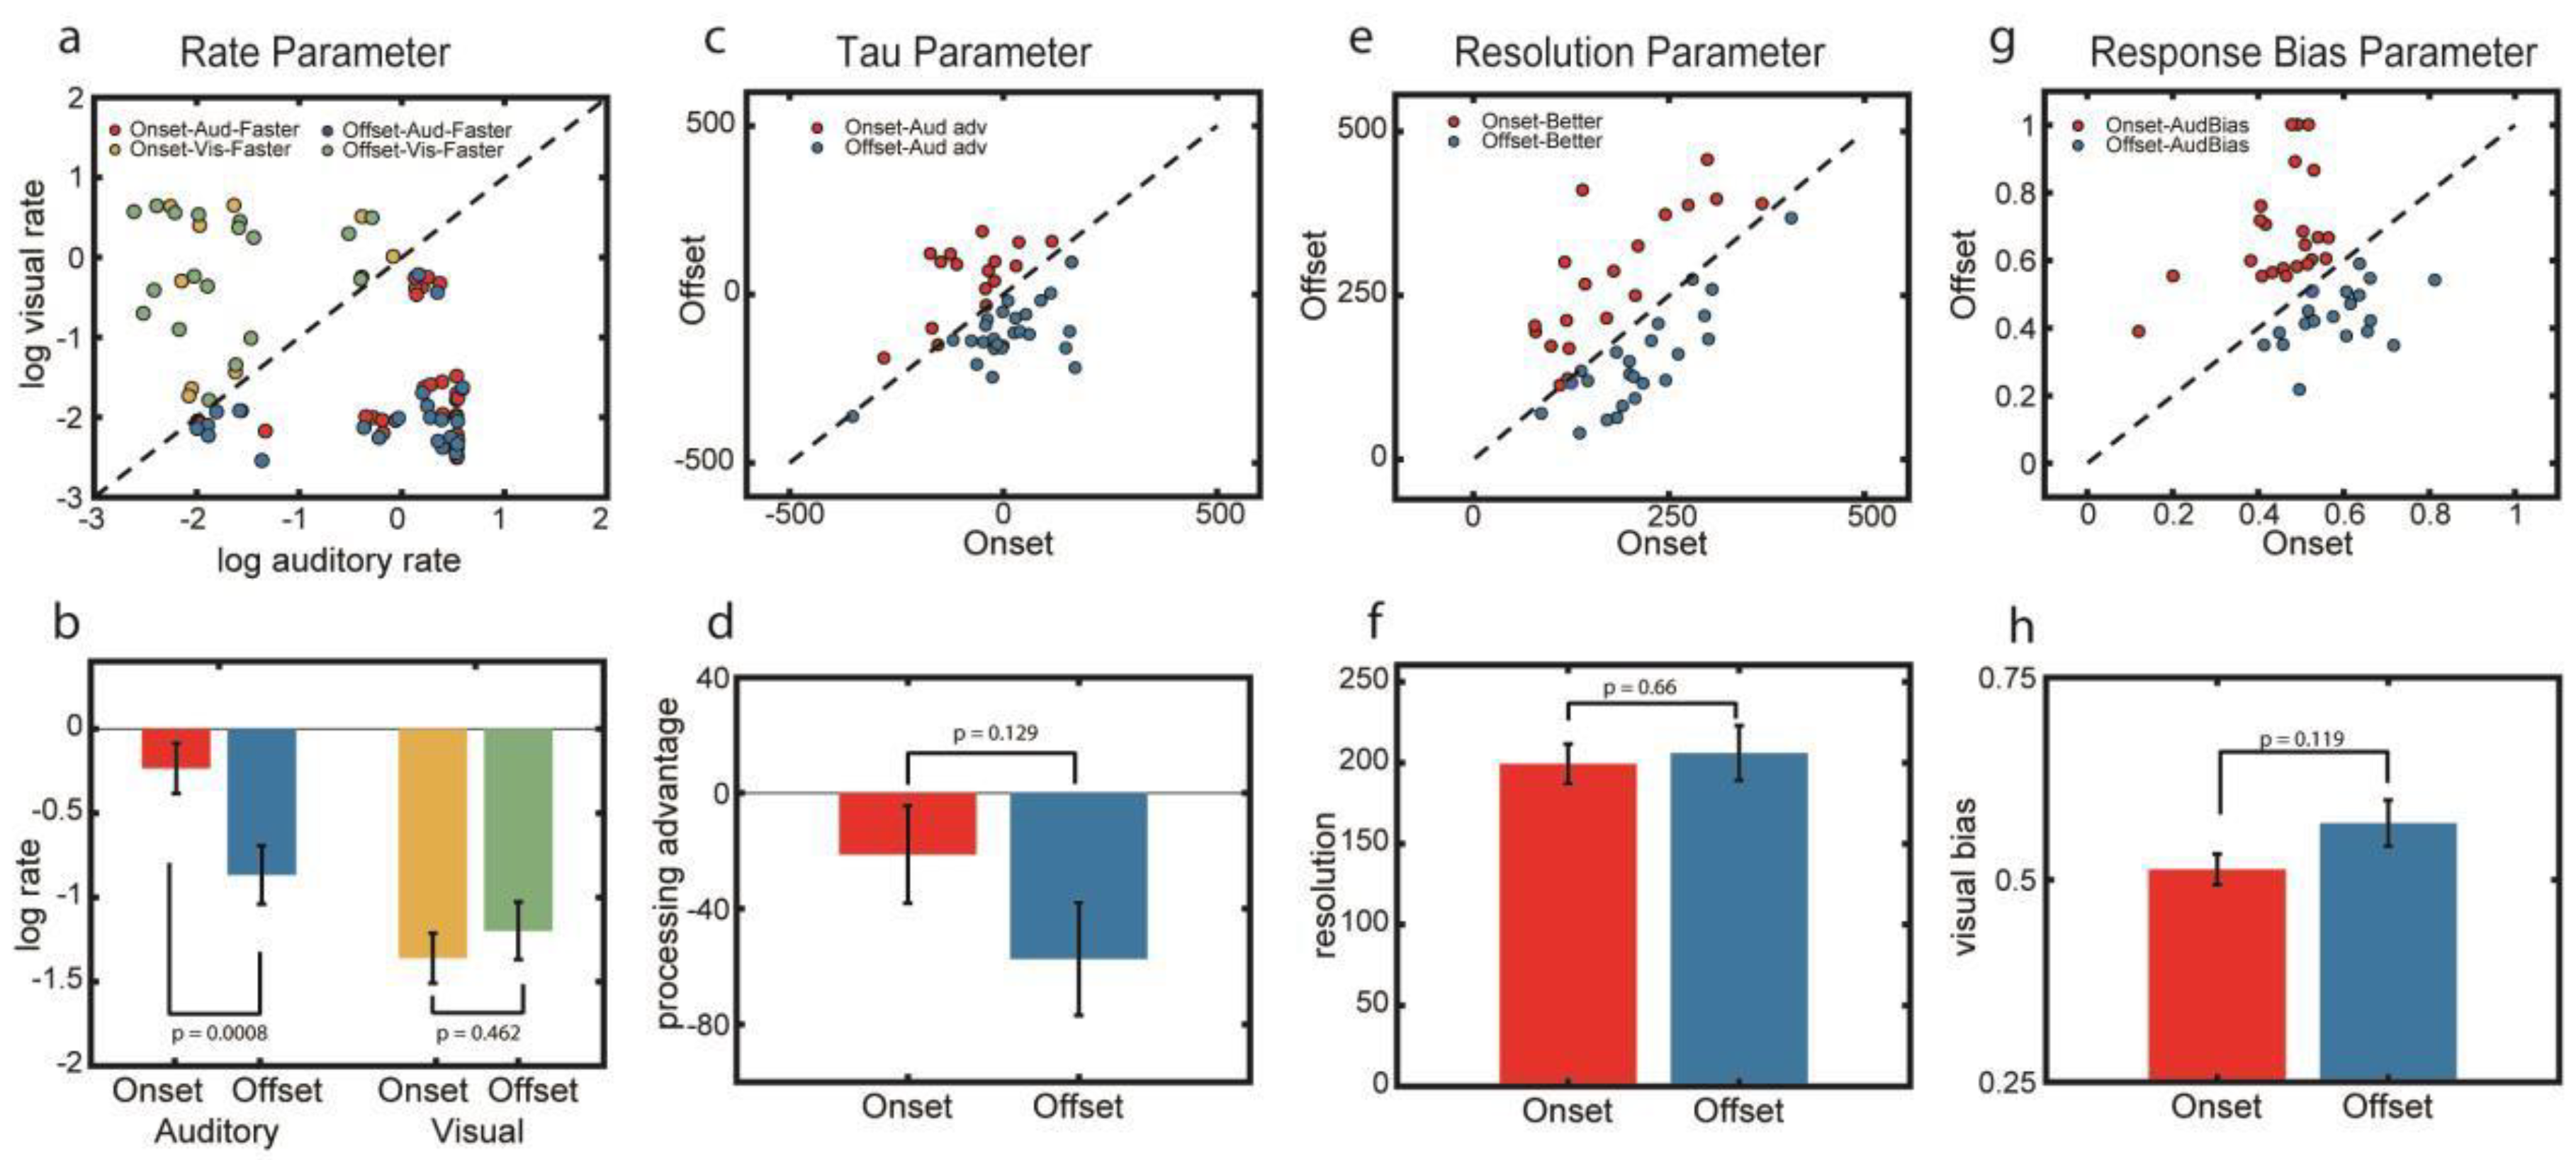
4. Model-Based Estimates of Rate and Bias
5. Discussion and Conclusions
Author Contributions
Funding
Acknowledgments
Conflicts of Interest
Open Practices
References
- Boring, E.G. A History of Experimental Psychology; Appleton-Century-Crofts: New York, NY, USA, 1929. [Google Scholar]
- Hilgard, E.R. Reinforcement and inhibition of eyelid reflexes. J. Gen. Psychol. 1933, 8, 85–113. [Google Scholar] [CrossRef]
- Fraisse, P. Perception and estimation of time. Annu. Rev. Psychol. 1984, 35, 1–37. [Google Scholar] [CrossRef] [PubMed]
- Vroomen, J.; Keetels, M. Perception of intersensory synchrony: A tutorial review. Atten. Percept. Psychophys. 2010, 72, 871–884. [Google Scholar] [CrossRef] [PubMed]
- Chen, L.; Vroomen, J. Intersensory binding across space and time: A tutorial review. Atten. Percept. Psychophys. 2013, 75, 790–811. [Google Scholar] [CrossRef]
- Alais, D.; Burr, D. Cue combination within a Bayesian framework. In Multisensory Processes; Springer: Berlin/Heidelberg, Germany, 2019; pp. 9–31. [Google Scholar]
- Bolognini, N.; Frassinetti, F.; Serino, A.; Làdavas, E. “Acoustical vision” of below threshold stimuli: Interaction among spatially converging audiovisual inputs. Exp. Brain Res. 2005, 160, 273–282. [Google Scholar] [CrossRef]
- Hughes, H.C.; Lorenz, P.A.; Nozawa, G.; Fendrich, R. Visual-auditory interactions in sensorimotor processing: Saccades versus manual responses. J. Expt. Psychol. Hum. Percept. Perform. 1994, 20, 131–153. [Google Scholar] [CrossRef]
- Sumby, W.H.; Pollack, I. Visual contribution to speech intelligibility in noise. J. Acoust. Soc. Am. 1954, 26, 212–215. [Google Scholar] [CrossRef]
- McGurk, H.; MacDonald, J. Hearing lips and seeing voices. Nature 1976, 264, 746. [Google Scholar] [CrossRef]
- Massaro, D.W.; Cohen, M.M.; Smeele, P.M. Percption of asynchronous and conflicting visual and auditory speech. J. Acoust. Soc. Am. 1996, 100, 1777–1786. [Google Scholar] [CrossRef]
- Sekuler, R.; Sekuler, A.B.; Lau, R. Sound changes perception of visual motion. Nature 1997, 384, 308–309. [Google Scholar] [CrossRef]
- Alink, A.; Euler, G.; Galeano, E.; Krugliak, A.; Singer, W.; Kohler, A. Auditory motion capturing ambiguous visual motion. Front. Psychol. 2012, 2, 291. [Google Scholar] [CrossRef] [PubMed]
- Alais, D.; Burr, D. The ventriloquist effect results from near-optimal bimodal integration. Curr. Biol. 2004, 14, 257–262. [Google Scholar] [CrossRef] [PubMed]
- Recanzone, G.H. Auditory influences on visual temporal rate perception. J. Neurophysiol. 2003, 89, 1078–1093. [Google Scholar] [CrossRef] [PubMed]
- Gebhard, J.W.; Mowbray, G.H. On discriminating the rate of visua flicker and auditory flutter. Am. J. Psychol. 1959, 72, 521–529. [Google Scholar] [CrossRef] [PubMed]
- Burr, D.; Alais, D. Combining visual and auditory information. Prog. Brain Res. 2006, 155, 243–258. [Google Scholar]
- Doehrmann, O.; Naumer, M.J. Semantics and the multisensory brain: How meaning modulates processes of audio-visual integration. Brain Res. 2008, 1242, 136–150. [Google Scholar] [CrossRef]
- Shore, D.I.; Spence, C.; Klein, R.M. Visual prior entry. Psychol. Sci. 2001, 12, 205–212. [Google Scholar] [CrossRef]
- Roach, N.W.; Heron, J.; McGraw, P.V. Resolving multisensory conflict: A strategy for balancing the costs and benefits of audio-visual integration. Proc. R. Soc. B Biol. 2006, 273, 2159–2168. [Google Scholar] [CrossRef]
- Navarra, J.; Vatakis, A.; Zampini, M.; Soto-Faraco, S.; Humphreys, W.; Spence, C. Exposure to asynchronous audiovisual speech extends the temporal window for audiovisual integration. Cogn. Brain Res. 2005, 25, 499–507. [Google Scholar] [CrossRef]
- Vroomen, J.; Keetels, M.; de Gelder, B.; Bertelson, P. Recalibration of temporal order perception by exposure to audio-visual asynchrony. Cogn. Brain Res. 2004, 22, 32–35. [Google Scholar] [CrossRef]
- Diederich, A.; Colonius, H. The time window of multisensory integration: Relating reaction times and judgments of temporal order. Psychol. Rev. 2015, 122, 232–241. [Google Scholar] [CrossRef] [PubMed]
- García-Pérez, M.A.; Alcalá-Quintana, R. On the discrepant results in synchrony judgment and temporal-order judgment tasks: A quantitative model. Psychon. B Rev. 2012, 19, 820–846. [Google Scholar] [CrossRef] [PubMed]
- Allan, L.G.; Kristofferson, A.B. Successiveness discrimination: Two models. Percept. Psychophys. 1974, 15, 37–46. [Google Scholar] [CrossRef][Green Version]
- Meredith, M.A. On the neuronal basis for multisensory convergence: A brief review. Cogn. Brain Res. 2002, 14, 31–40. [Google Scholar] [CrossRef]
- Cecere, R.; Gross, J.; Willis, A.; Thut, G. Being first matters: Topographical representational similarity analysis of ERP signals reveals separate networks for audiovisual temporal binding depending on the leading sense. J. Neurosci. 2017, 37, 5274–5287. [Google Scholar] [CrossRef]
- Yau, J.M.; DeAngelis, G.C.; Angelaki, D.E. Dissecting neural circuits for multisensory integration and cross modal processing. Proc. R. Soc. B Biol. 2015, 370, 20140203. [Google Scholar] [CrossRef]
- Lee, A.K.C.; Wallace, M.T.; Coffin, A.; Popper, N.; Fay, R.R. Multisensory Processes: Auditory Perspective; Springer Nature: Cham, Switzerland, 2019. [Google Scholar]
- Gau, R.; Bazin, P.-L.; Trampel, R.; Turner, R.; Noppeney, U. Resolving multisensory and attentional influences across cortical depth in sensory cortices. eLife 2020, 9, e46856. [Google Scholar] [CrossRef]
- Guttman, S.E.; Gilroy, L.A.; Blake, R. Hearing what the eyes see: Auditory endocing of visual temporal structure. Psychol. Sci. 2005, 16, 228–235. [Google Scholar] [CrossRef]
- Kang, M.S.; Blake, R. Perceptual synergy between seeing and hearing revealed during binocular rivalry. J. Psychol. 2005, 32, 7–15. [Google Scholar]
- Lee, M.; Blake, R.; Kim, S.; Kim, C.Y. Melodic sound enhances visual awareness of congruent musical notes, but only if you can read music. Proc. Natl. Acad. Sci. USA 2015, 112, 8493–8498. [Google Scholar] [CrossRef]
- Kim, S.; Lee, M.; Blake, R.; Kim, C.Y. Audio-visual interactions uniquely contribute to resolution of visual conflict in people possessing absolute pitch. PLoS ONE 2017, 12, e0175103. [Google Scholar] [CrossRef] [PubMed]
- Park, M.; Blake, R.; Kim, Y.; Kim, C.Y. Congruent audio-visual stimulation during adapation modulates the subsequently experienced visul motion aftereffect. Sci. Rep.-UK 2019, 9, 19391. [Google Scholar]
- van Eijk, R.L.; Kohlrausch, A.; Juola, J.F.; van de Par, S. Temporal interval discrimination thresholds depend on perceived synchrony for audio-visual stimulus pairs. J. Expt. Psychol. Hum. Percept. Perform. 2009, 35, 1254–1263. [Google Scholar] [CrossRef] [PubMed]
- Zampini, M.; Shore, D.I.; Spence, C. Audiovisual temporal order judgments. Expt. Brain Res. 2003, 152, 198–210. [Google Scholar] [CrossRef] [PubMed]
- Taylor, T.L.; Klein, R.M.; Munoz, D.P. Saccadic performance as a function of the presence and disappearance of auditory and visual fixation stimuli. J. Cogn. Neursci. 1999, 11, 206–213. [Google Scholar] [CrossRef]
- Bizley, J.K.; Maddox, R.K.; Lee, A.K.C. Defining Auditory-Visual Objects: Behavioral Tests and Physiological Mechanisms. Trends Neurosci. 2016, 39, 74–85. [Google Scholar] [CrossRef]
- Hirsh, I.J.; Sherrick, C.E., Jr. Perceived order in different sense modalities. J. Expt. Psychol. 1961, 62, 423. [Google Scholar] [CrossRef]
- Faul, F.; Erdfelder, E.; Buchner, A.; Lang, A.-G. Statistical power analyses using G* Power 3.1: Tests for correlation and regression analyses. Beh. Res. Methods 2009, 41, 1149–1160. [Google Scholar] [CrossRef]
- Brainard, D.H. The psychophysics toolbox. Spat. Vis. 1997, 10, 433–436. [Google Scholar] [CrossRef]
- Pelli, D.G. The VideoToolbox software for visual psychophysics: Transforming numbers into movies. Spat. Vis. 1997, 10, 437–442. [Google Scholar] [CrossRef]
- Griffin, I.C.; Miniussi, C.; Nobre, A.C. Orienting attention in time. Front. Biosci. 2001, 6, D660–D671. [Google Scholar] [CrossRef] [PubMed]
- Ipser, A.; Karlinski, M.; Freeman, E.D. Correlation of individual differences in audiovisual asynchrony across stimuli and tasks: New constraints on temporal renormalization theory. J. Expt. Psychol. Hum. Percept. Perform. 2018. [Google Scholar] [CrossRef] [PubMed]
- Ipser, A.; Agolli, V.; Bajraktari, A.; Al-Alawi, F.; Djaafara, N.; Freeman, E.D. Sight and sound persistently out of synch: Stable individual differences in audiovisual synchronisation revealed by implicit measures of lip-voice integration. Sci. Rep-UK 2017, 7, 46413. [Google Scholar] [CrossRef] [PubMed]
- Olsson-Collentine, A.; Van Assen, M.A.; Hartgerink, C.H. The prevalence of marginally significant results in psychology over time. Psychol. Sci. 2019, 30, 576–586. [Google Scholar] [CrossRef] [PubMed]
- Pritschet, L.; Powell, D.; Horne, Z. Marginally significant effects as evidence for hypotheses: Changing attitudes over four decades. Psychol. Sci 2016, 27, 1036–1042. [Google Scholar] [CrossRef]
- Weidemann, C.T.; Kahana, M.J. Assessing recognition memory using confidence ratings and response times. R. Soc. Open Sci. 2016, 3, 150670. [Google Scholar] [CrossRef] [PubMed]
- Cardoso-Leeite, P.; Gorea, A.; Mamassian, P. Temporal order judgment and simple reaction times: Evidence for a common processing system. J. Vis. 2007, 76, 1–14. [Google Scholar] [CrossRef]
- Heath, R.A. Response time and temporal order judgement in vision. Aust. J. Psychol. 1984, 36, 21–34. [Google Scholar] [CrossRef]
- Rousselet, G.A.; Pernet, C.R.; Wilcox, R.R. Beyond differences in means: Robust graphical methods to compare two groups in neuroscience. Eur. J. Neurosci. 2017, 46, 1738–1748. [Google Scholar] [CrossRef]
- Dutilh, G.; Annis, J.; Brown, S.D.; Cassey, P.; Evans, N.J.; Grasman, R.P.; Hawkins, G.E.; Heathcote, A.; Holmes, W.R.; Krypotos, A.-M. The quality of response time data inference: A blinded, collaborative assessment of the validity of cognitive models. Psychon. B. Rev. 2019, 26, 1051–1069. [Google Scholar] [CrossRef]
- Morgan, M.; Dillenburger, B.; Raphael, S.; Solomon, J.A. Observers can voluntarily shift their psychometric functions without losing sensitivity. Atten. Percept. Psychol. 2012, 74, 185–193. [Google Scholar] [CrossRef] [PubMed]
- Sternberg, S.; Knoll, R.L. The perception of temporal order: Fundamental issues and a general model. In Attention And Performance IV; Kornblum, S., Ed.; Academic Press: New York, NY, USA, 1973; pp. 629–685. [Google Scholar]
- Alcalá-Quintana, R.; García-Pérez, M.A. Fitting model-based psychometric functions to simultaneity and temporal-order judgment data: MATLAB and R routines. Beh. Res. Methods 2013, 45, 972–998. [Google Scholar] [CrossRef] [PubMed]
- Wallace, M.T.; Woynaroski, T.G.; Steenson, R.A. Multisensory integration as a window into orderly and disrupted cognition and communication. Annu. Rev. Psychol. 2020, 71, 193–219. [Google Scholar] [CrossRef] [PubMed]
- Grabot, L.; van Wassenhove, V. Time order as psychological bias. Psychol. Sci. 2017, 28, 670–678. [Google Scholar] [CrossRef] [PubMed]
- Stone, J.; Hunkin, N.; Porrill, J.; Wood, R.; Keeler, V.; Beanland, M.; Port, M.; Porter, N. When is now? Perception of simultaneity. Proc. R. Soc. B Biol. 2001, 268, 31–38. [Google Scholar] [CrossRef] [PubMed]
- Grassi, M.; Casco, C. Audiovisual bounce-inducing effect: Attention alone does not explain why the discs are bouncing. J. Expt. Psychol. Hum. Percept. Perform. 2009, 35, 235. [Google Scholar] [CrossRef]
- Grassi, M.; Darwin, C.J. The subjective duration of ramped and damped sounds. Percept. Psychophys. 2006, 68, 1382–1392. [Google Scholar] [CrossRef]
- Schlauch, R.S.; Ries, D.T.; DiGiovanni, J.J. Duration discrimination and subjective duration for ramped and damped sounds. J. Acoust. Soc. Am. 2001, 109, 2880–2887. [Google Scholar] [CrossRef]
- Vallet, G.T.; Shore, D.I.; Schutz, M. Exploring the role of the amplitude envelope in duration estimation. Perception 2014, 43, 616–630. [Google Scholar] [CrossRef]
- Mikami, A.; Newsome, W.T.; Wurtz, R.H. Motion selectivity in macaque visual cortex. I. Mechanisms of direction and speed selectivity in extrastriate area MT. J. Neurophysiol. 1986, 55, 1308–1327. [Google Scholar] [CrossRef]
- Allan, L.G. The perception of time. Percept. Psychophys. 1979, 26, 340–354. [Google Scholar] [CrossRef]
- Matthews, W.J.; Meck, W.H. Temporal cognition: Connecting subjective time to perception, attention, and memory. Psychol. Bull. 2016, 142, 865. [Google Scholar] [CrossRef] [PubMed]
- Wearden, J.H.; Edwards, H.; Fakhri, M.; Percival, A. Why “sounds are judged longer than lights”: Application of a model of the internal clock in humans. Q. J. Expt. Psychol. A 1998, 51, 97–120. [Google Scholar]
- Purcell, B.A.; Heitz, R.P.; Cohen, J.Y.; Schall, J.D.; Logan, G.D.; Palmeri, T.J. Neurally constrained modeling of perceptual decision making. Psychol. Rev. 2010, 117, 1113. [Google Scholar] [CrossRef] [PubMed]
- Schneider, K.A.; Bavelier, D. Components of visual prior entry. Cogn. Psychol. 2003, 47, 333–366. [Google Scholar] [CrossRef]
- Bufacchi, R.J.; Iannetti, G.D. An action field theory of peripersonal space. Trends Cogn. Sci. 2018, 22, 1076–1090. [Google Scholar] [CrossRef]
- Bald, L.; Berrien, F.K.; Price, J.B.; Sprague, R.O. Errors in perceiving the temporal order of auditoryand visual stimuli. J. Appl. Psychol. 1942, 26, 382–388. [Google Scholar] [CrossRef]
- Schaffer, S. Astronomers mark time: Discipline and the personal equation. Sci. Context 1988, 2, 115–145. [Google Scholar] [CrossRef]
- Dallos, P. The Auditory Periphery; Academic Press Inc.: New York, NY, USA, 1973. [Google Scholar]
- Lamb, T.D.; Pugh, E.N. A quantitative account of the activation steps involved in phototransduction in am- phibian photoreceptors. J. Physiol. 1992, 449, 719–758. [Google Scholar] [CrossRef]
- Lennie, P. The physological basis of variations in visual latency. Vis. Res. 1981, 21, 815–824. [Google Scholar] [CrossRef]
- Recanzone, G.H. Response profiles of auditory cortical neurons to tone and noise in behaving macaque monkeys. Hear. Res. 2000, 150, 104–118. [Google Scholar] [CrossRef]
- Camalier, C.R.; D’Angelo, W.R.; Sterbing-D’Angelo, S.J.; Lisa, A.; Hackett, T.A. Neural latencies across auditory cortex of macaque support a dorsal stream supramodal timing advantage in primates. Proc. Natl. Acad. Sci. USA 2012, 109, 18168–18173. [Google Scholar] [CrossRef] [PubMed]
- Schmolesky, M.T.; Wang, Y.; Hanes, D.P.; Thompson, K.G.; Leutgeb, S.; Schall, J.D.; Leventhal, A.G. Signal timing across the macaque visual system. J. Neurophysiol. 1998, 79, 3272–3278. [Google Scholar] [CrossRef] [PubMed]
- Kohfeld, D.L. Simple reaction time as a function of stimulus intensity in decibels of light and sound. J. Expt. Psychol. 1971, 88, 251–257. [Google Scholar] [CrossRef]
- Bruner, J.S.; Postman, L. On the perception of incongruity: A paradigm. J. Pers. 1949, 18, 206–223. [Google Scholar] [CrossRef]
- Wallace, M.T.; Stevenson, R.A. The construct of the multisensory temporal binding window and its dysregulation in developmental disabilities. Neuropsychologia 2014, 64, 105–123. [Google Scholar] [CrossRef]
- Apthorp, D.; Alais, D.; Boenke, L.T. Flash illusions induced by visual, auditory, and audiovisual stimuli. J. Vis. 2013, 13, 3. [Google Scholar] [CrossRef]
- Conrad, V.; Kleiner, M.; Bartels, A.; O’Brien, J.H.; Bülthoff, H.H.; Noppeney, U. Naturalistic stimulus structure determines the integration of audiovisual looming signals in binocular rivalry. PLoS ONE 2013, 8, e70710. [Google Scholar] [CrossRef]
- Roseboom, W.; Nishida, S.Y.; Arnold, D.H. The sliding window of audio–visual simultaneity. J. Vis. 2009, 9, 4. [Google Scholar] [CrossRef]
- Morein-Zamir, S.; Soto-Faraco, S.; Kingstone, A. Auditory capture of vision: Examining temporal ventriloquism. Cogn. Brain Res. 2003, 17, 154–163. [Google Scholar] [CrossRef]
- Stenzel, H.; Francombe, J.; Jackson, P.J. Limits of perceived audio-visual spatial coherence as defined by reaction time measurements. Front. Neurosci. Switz. 2019, 13, 451. [Google Scholar] [CrossRef]
- Fujisaki, W.; Shimojo, S.; Kashino, M.; Nishida, S.Y. Recalibration of audiovisual simultaneity. Nat. Neurosci. 2004, 7, 773. [Google Scholar] [CrossRef] [PubMed]
- Simon, D.M.; Noel, J.-P.; Wallace, M.T. Event related potentials index rapid recalibration to audiovisual temporal asynchrony. Front. Integr. Neurosci. 2017, 11, 8. [Google Scholar] [CrossRef] [PubMed]
- Scharnowski, F.; Rees, G.; Walsh, V. Time and the brain: Neurorelativity: The chronoarchitecture of the brain from the neuronal rather than the observer’s perspective. Trends Cogn. Sci. 2013, 17, 51–52. [Google Scholar] [CrossRef]
- Gu, J.; Kanai, R. What contributes to individual differences in brain structure? Front. Hum. Neurosci. 2014, 8, 262. [Google Scholar] [CrossRef] [PubMed]
- Hayashi, M.J.; Kantele, M.; Walsh, V.; Carlson, S.; Kanai, R. Dissociable neuroanatomical correlates of subsecond and suprasecond time perception. J. Cogn. Neurosci. 2014, 26, 1685–1693. [Google Scholar] [CrossRef]


© 2020 by the authors. Licensee MDPI, Basel, Switzerland. This article is an open access article distributed under the terms and conditions of the Creative Commons Attribution (CC BY) license (http://creativecommons.org/licenses/by/4.0/).
Share and Cite
Wen, P.; Opoku-Baah, C.; Park, M.; Blake, R. Judging Relative Onsets and Offsets of Audiovisual Events. Vision 2020, 4, 17. https://doi.org/10.3390/vision4010017
Wen P, Opoku-Baah C, Park M, Blake R. Judging Relative Onsets and Offsets of Audiovisual Events. Vision. 2020; 4(1):17. https://doi.org/10.3390/vision4010017
Chicago/Turabian StyleWen, Puti, Collins Opoku-Baah, Minsun Park, and Randolph Blake. 2020. "Judging Relative Onsets and Offsets of Audiovisual Events" Vision 4, no. 1: 17. https://doi.org/10.3390/vision4010017
APA StyleWen, P., Opoku-Baah, C., Park, M., & Blake, R. (2020). Judging Relative Onsets and Offsets of Audiovisual Events. Vision, 4(1), 17. https://doi.org/10.3390/vision4010017