Vision and Hyper-Responsiveness in Migraine


Abstract
:1. Introduction
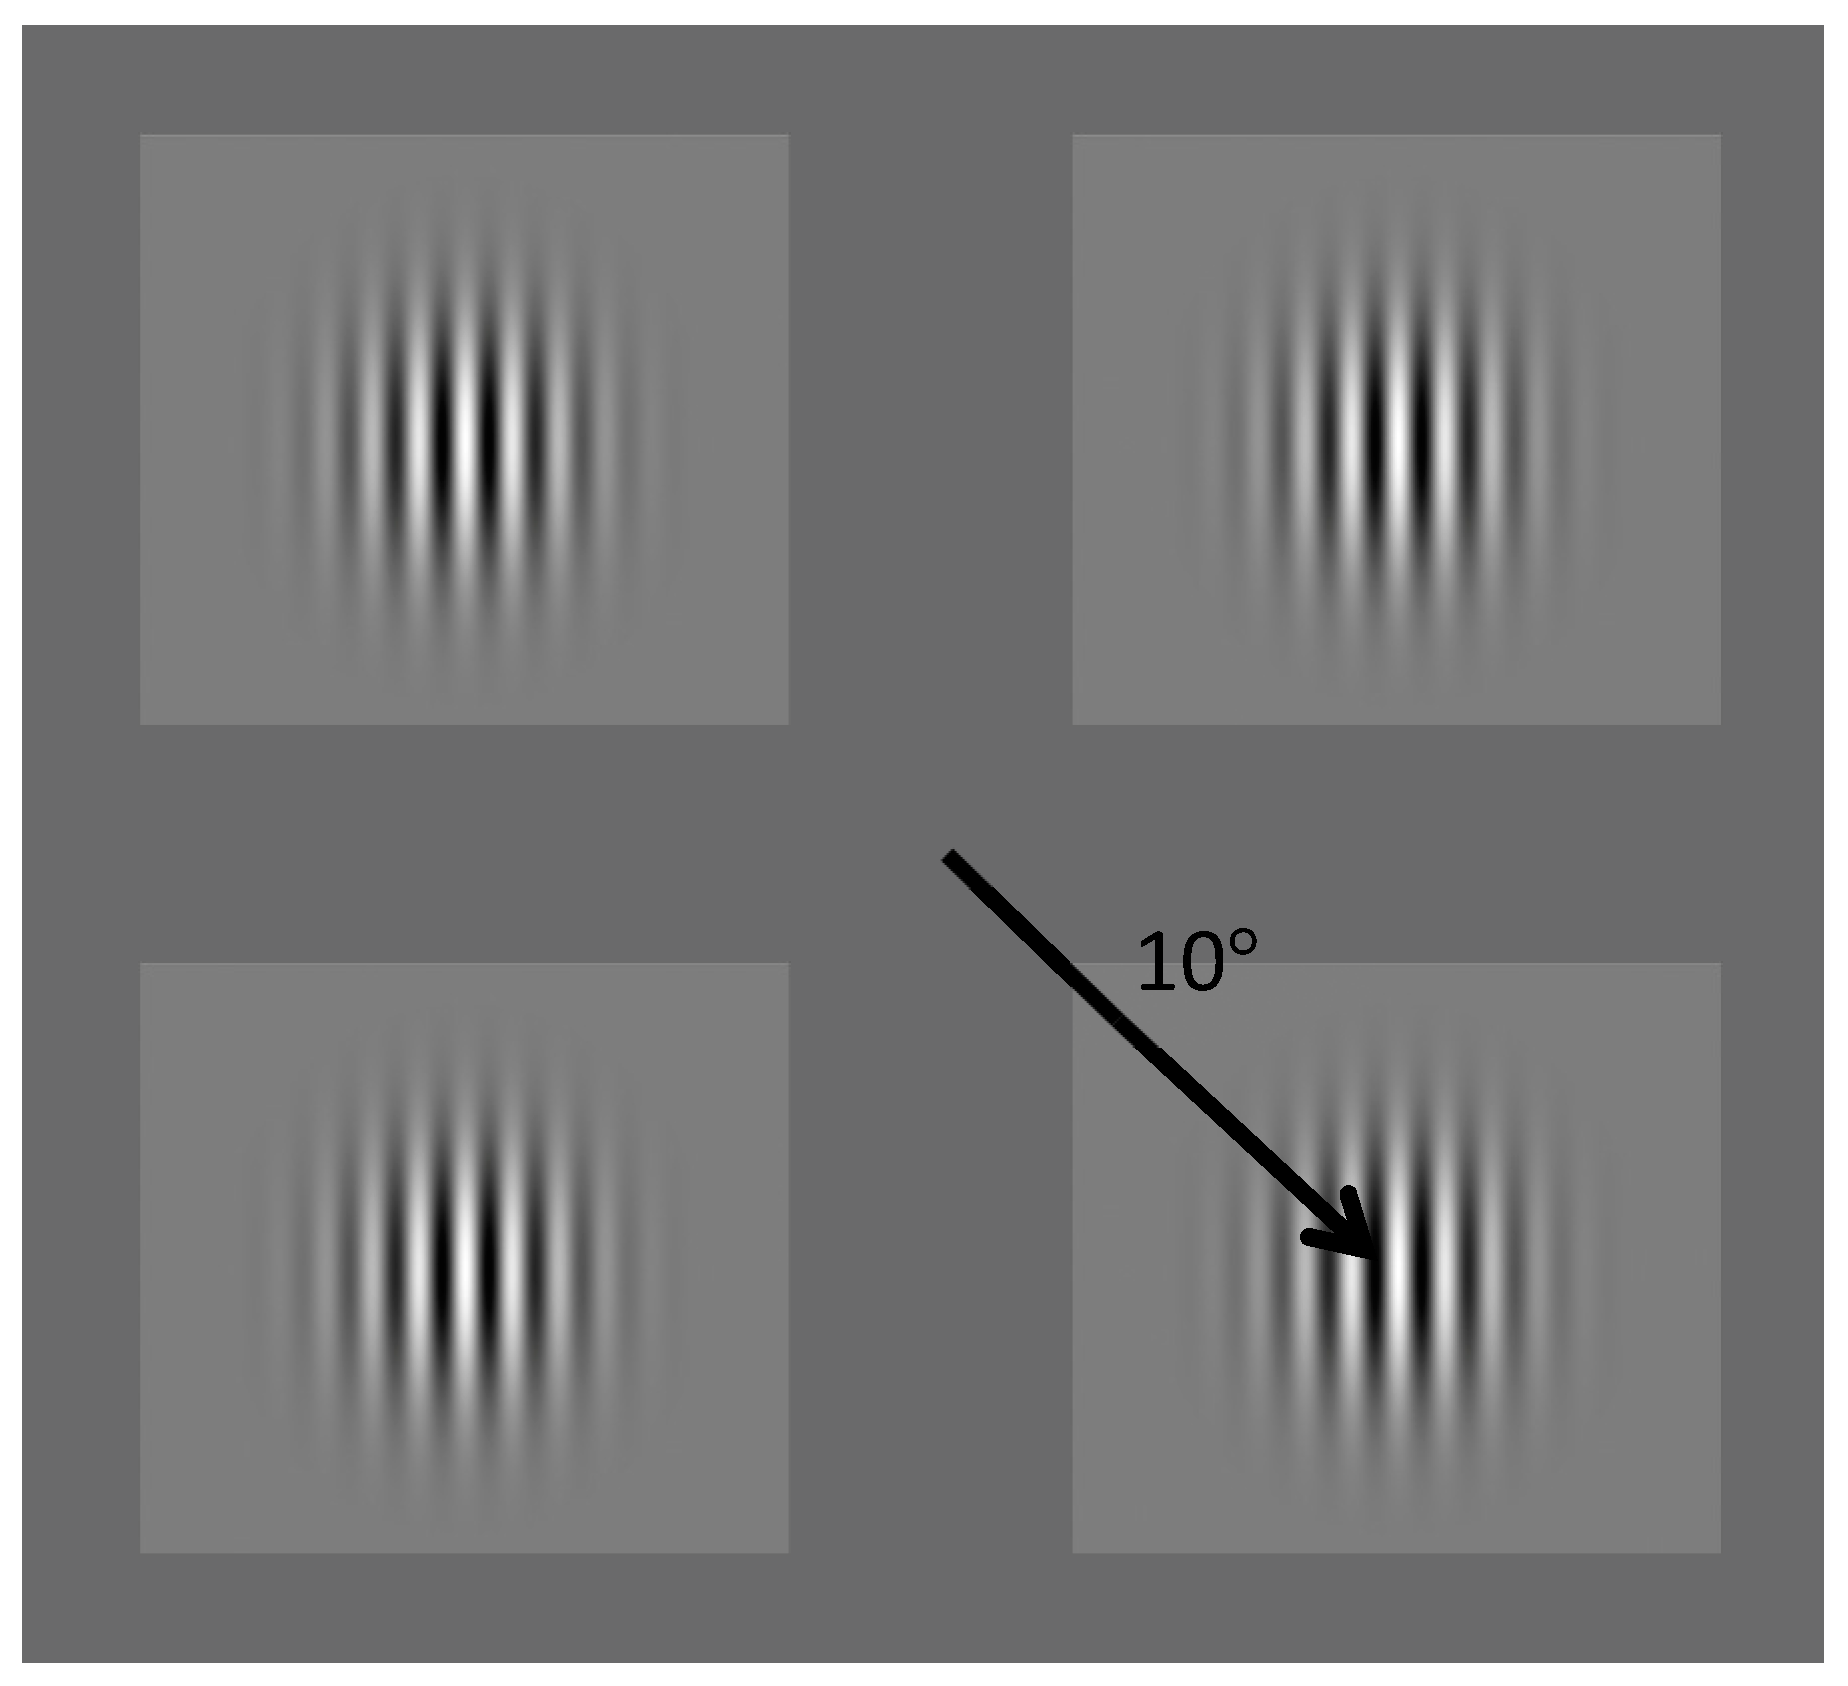
2. Experiment 1: Contrast Discrimination
1.1. Participants
1.2. Procedure
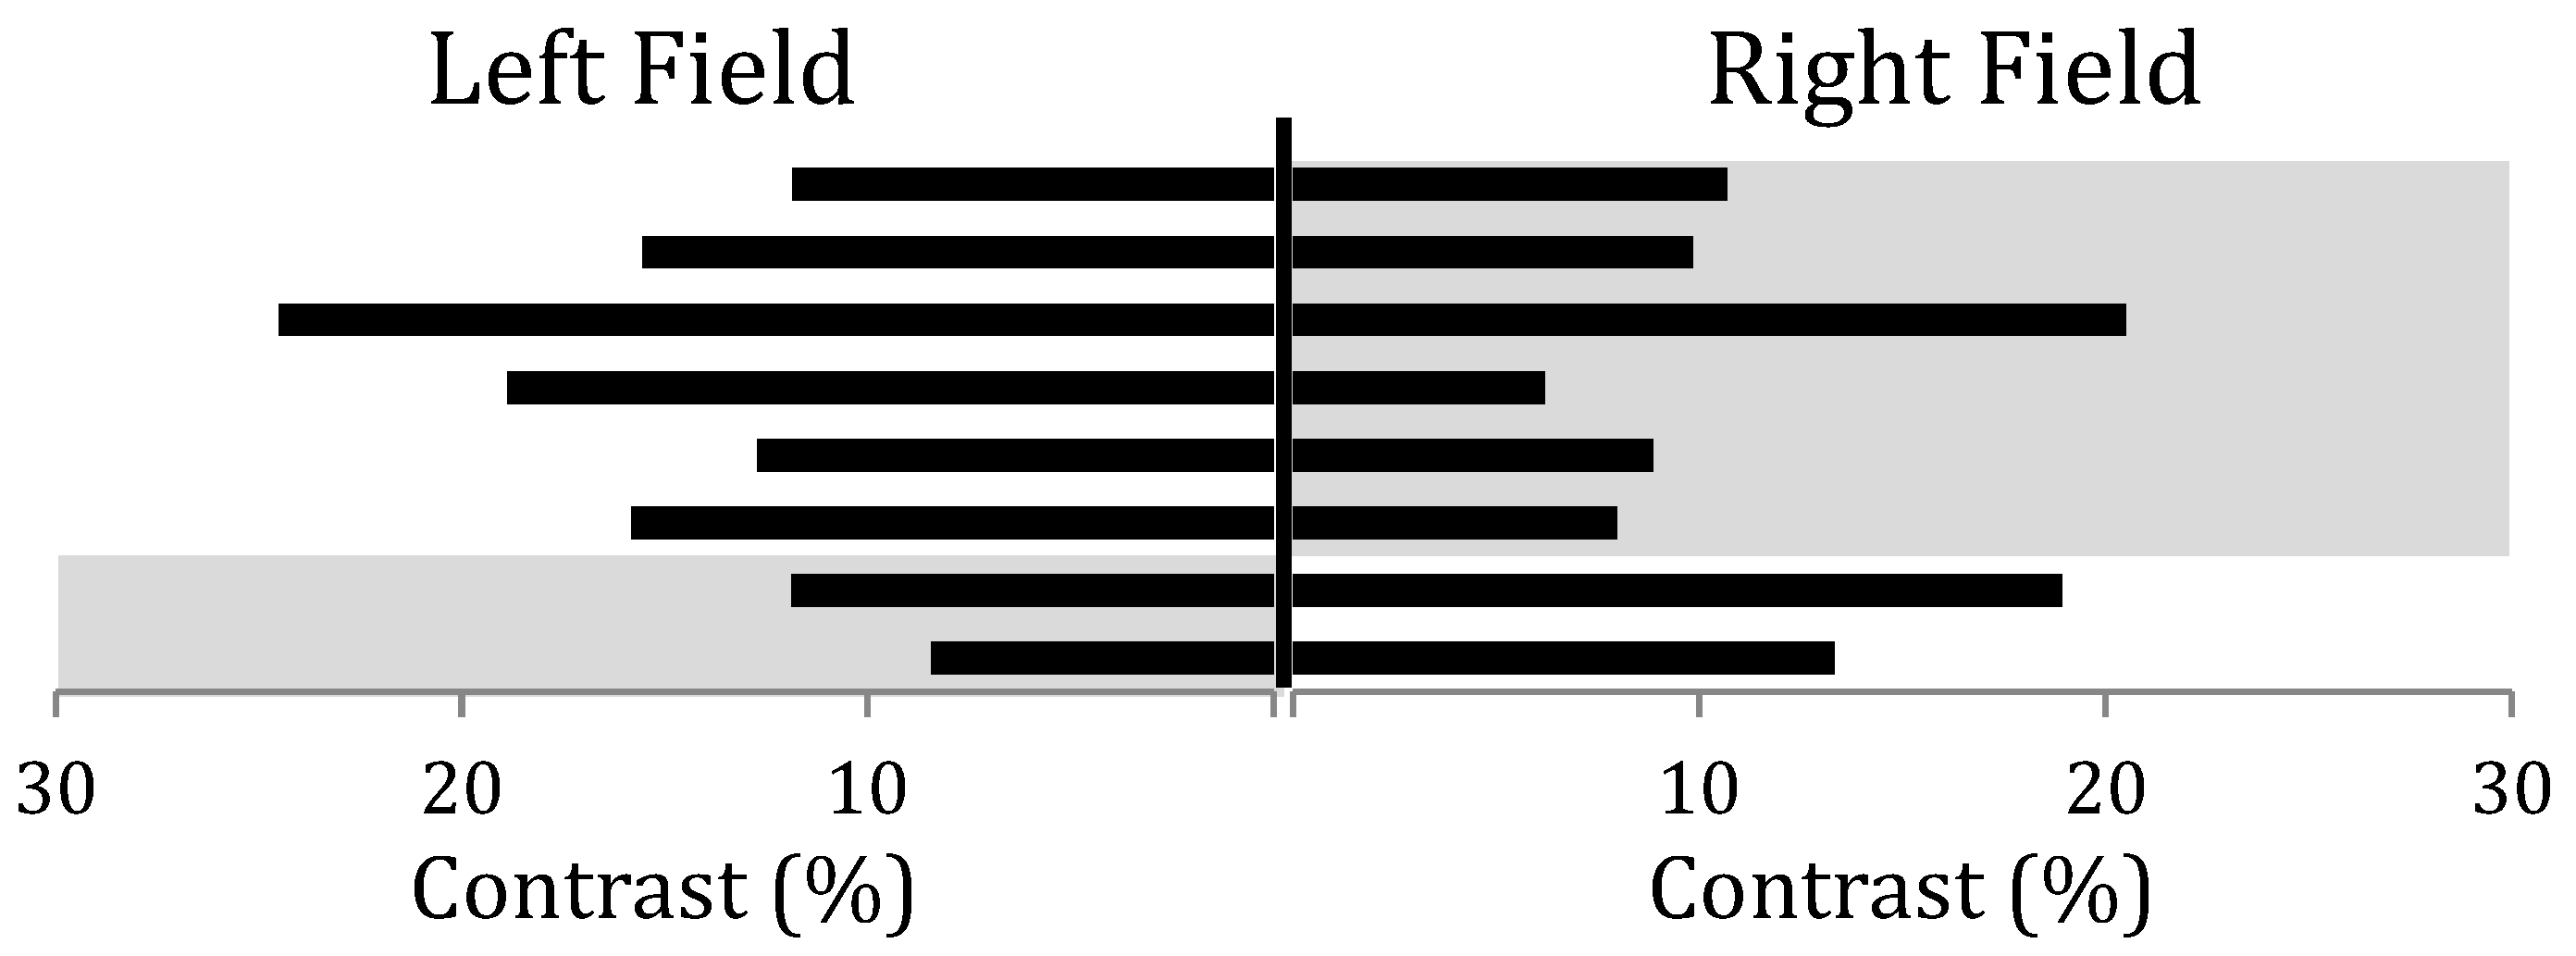
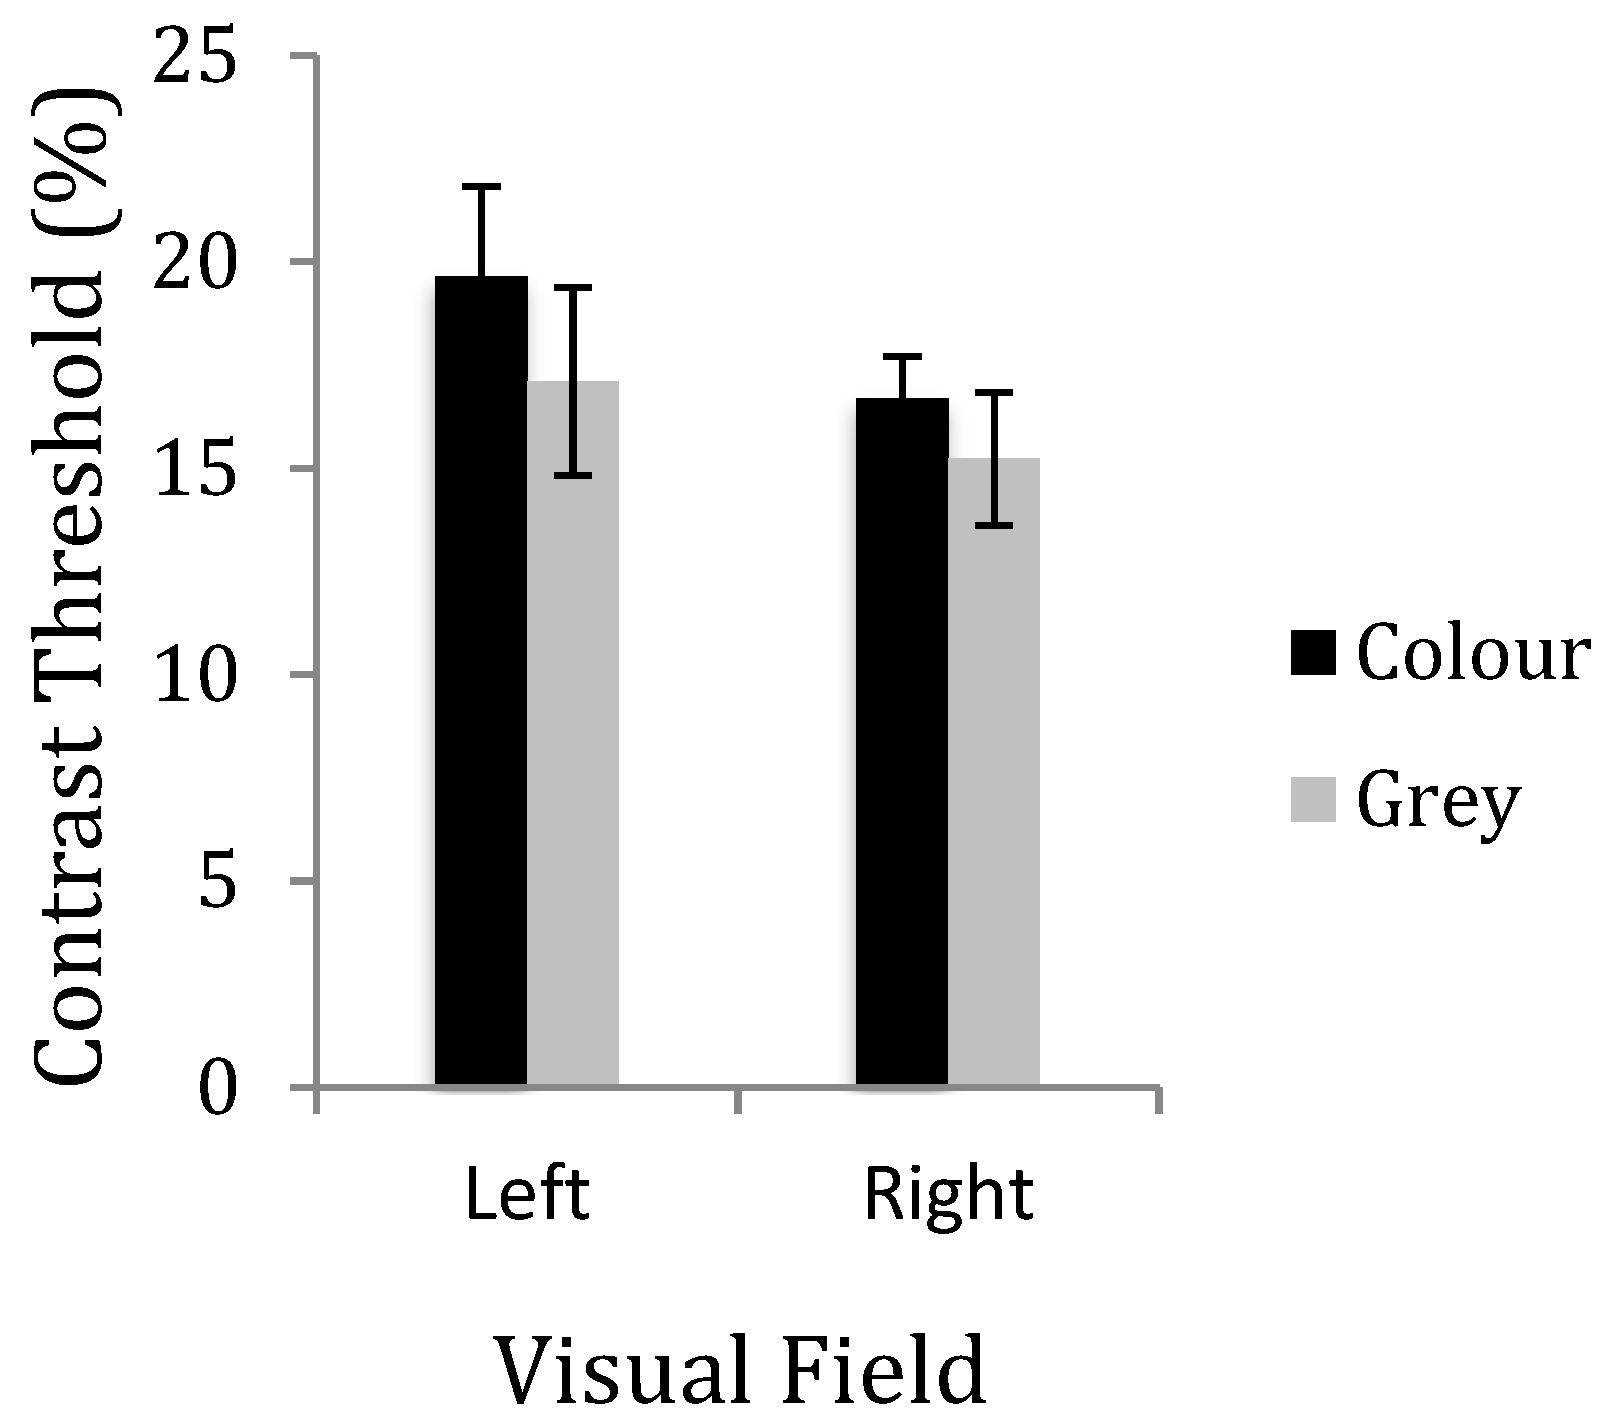
3. Results
4. Experiment 2: Comfortable Chromaticity
4.1. Participants
4.2. Procedure
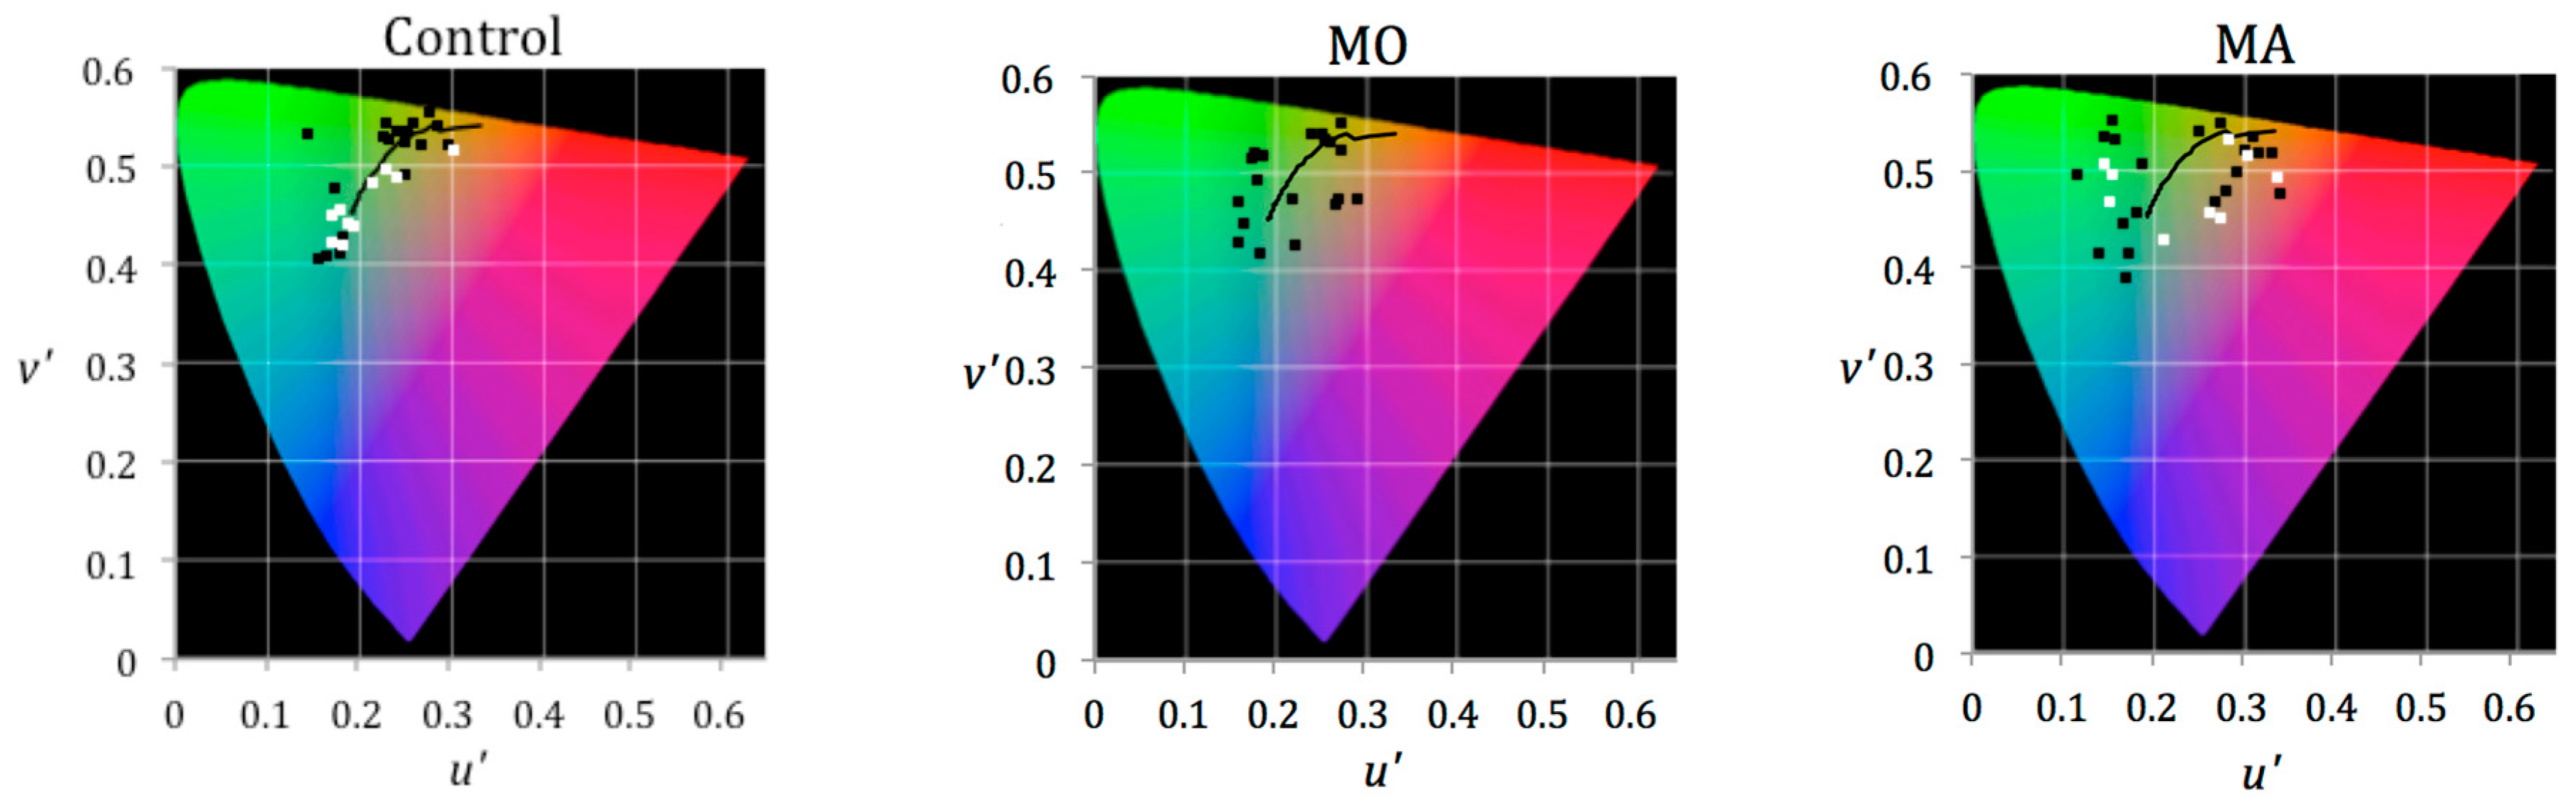
5. Results
6. Experiment 3: Contrast Discrimination and the Effects of Colour
6.1. Participants
6.2. Procedure
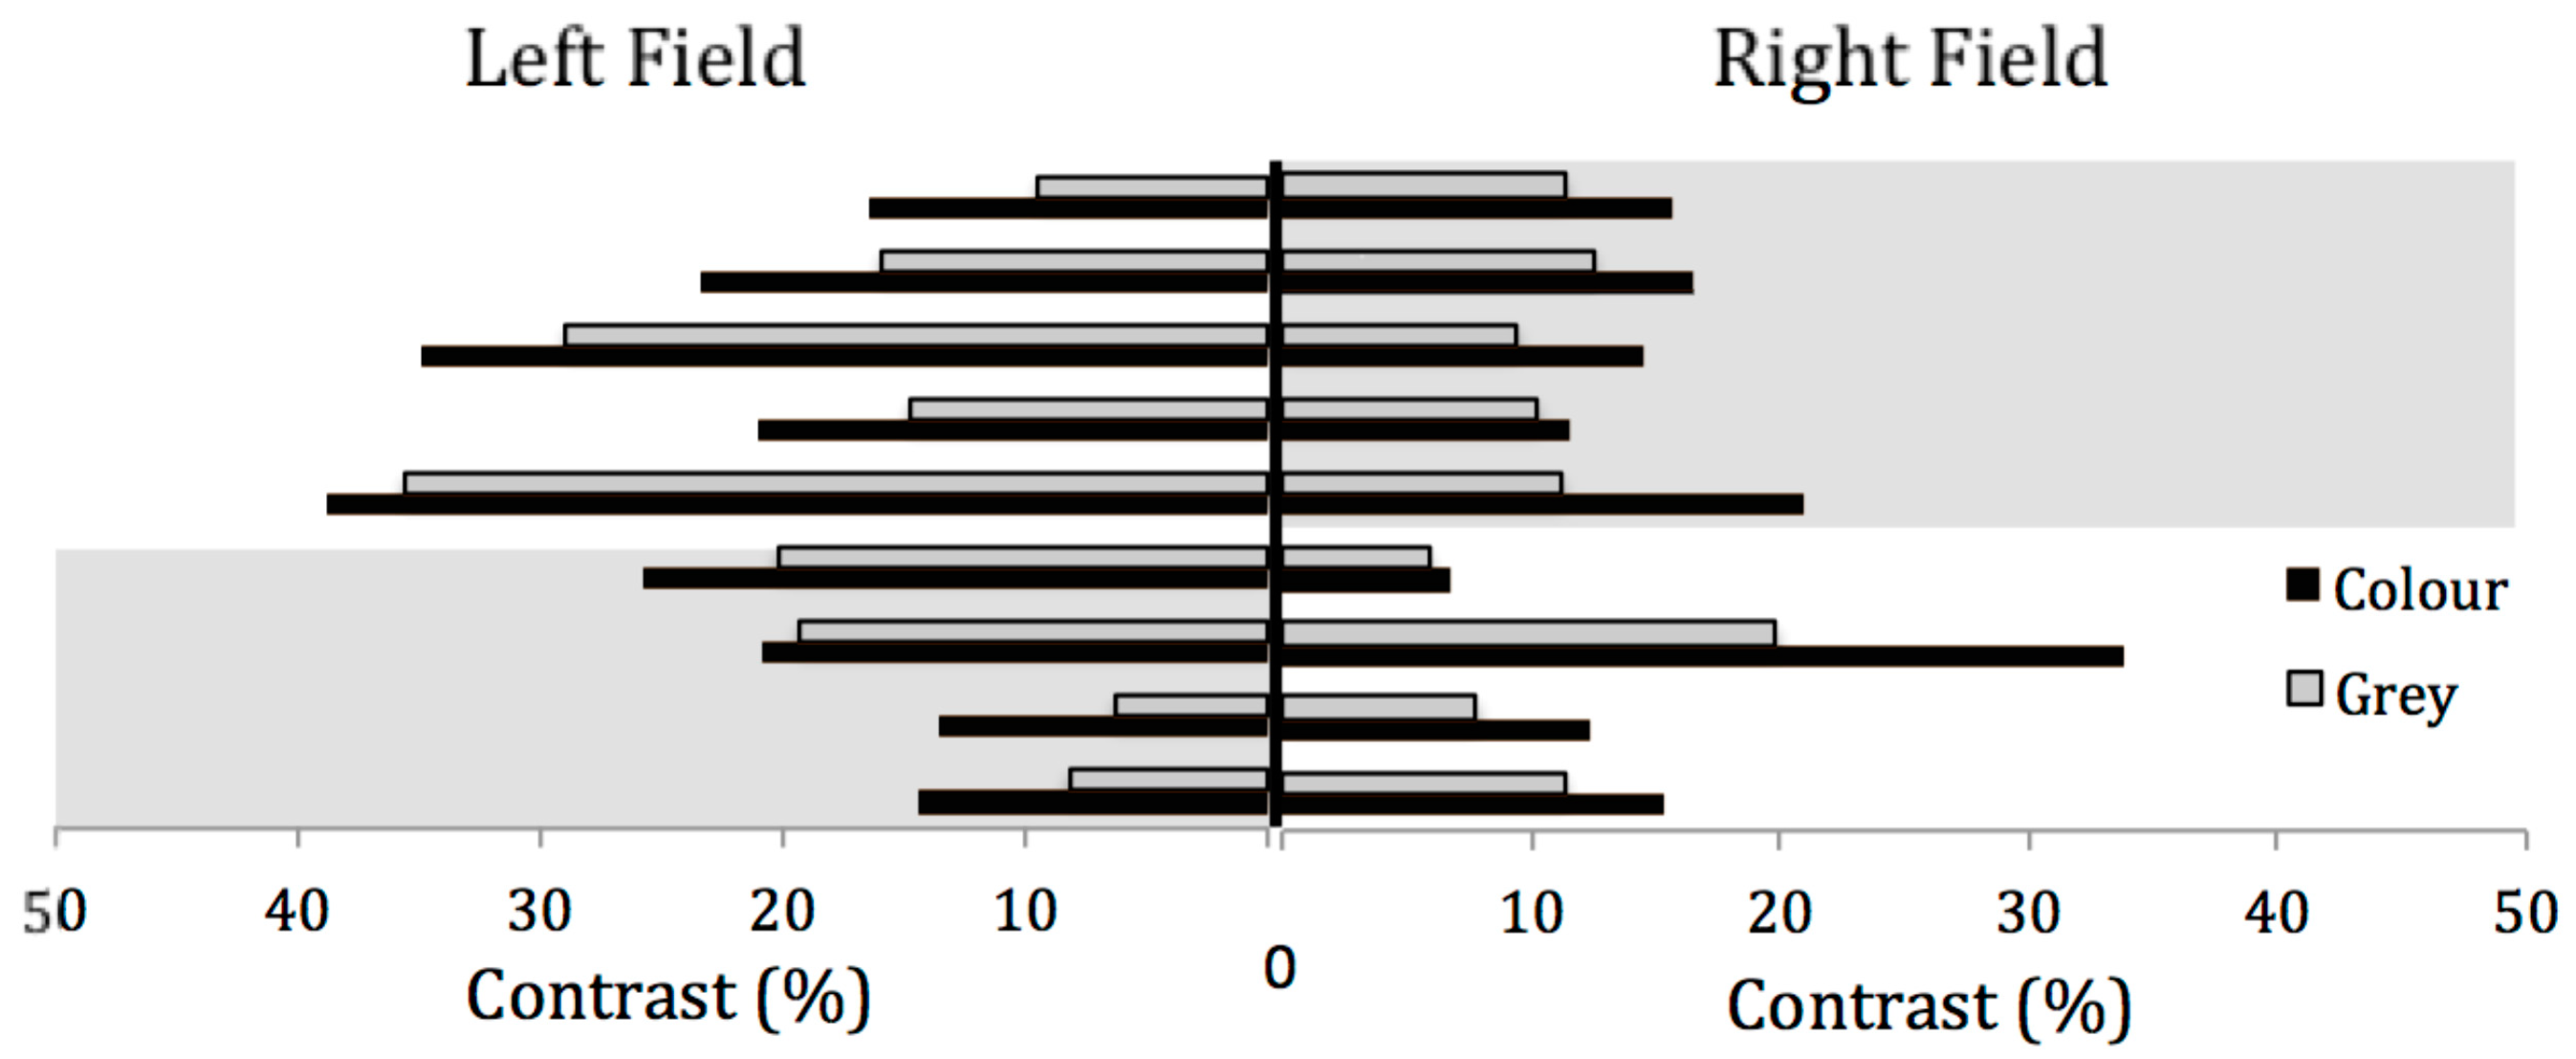
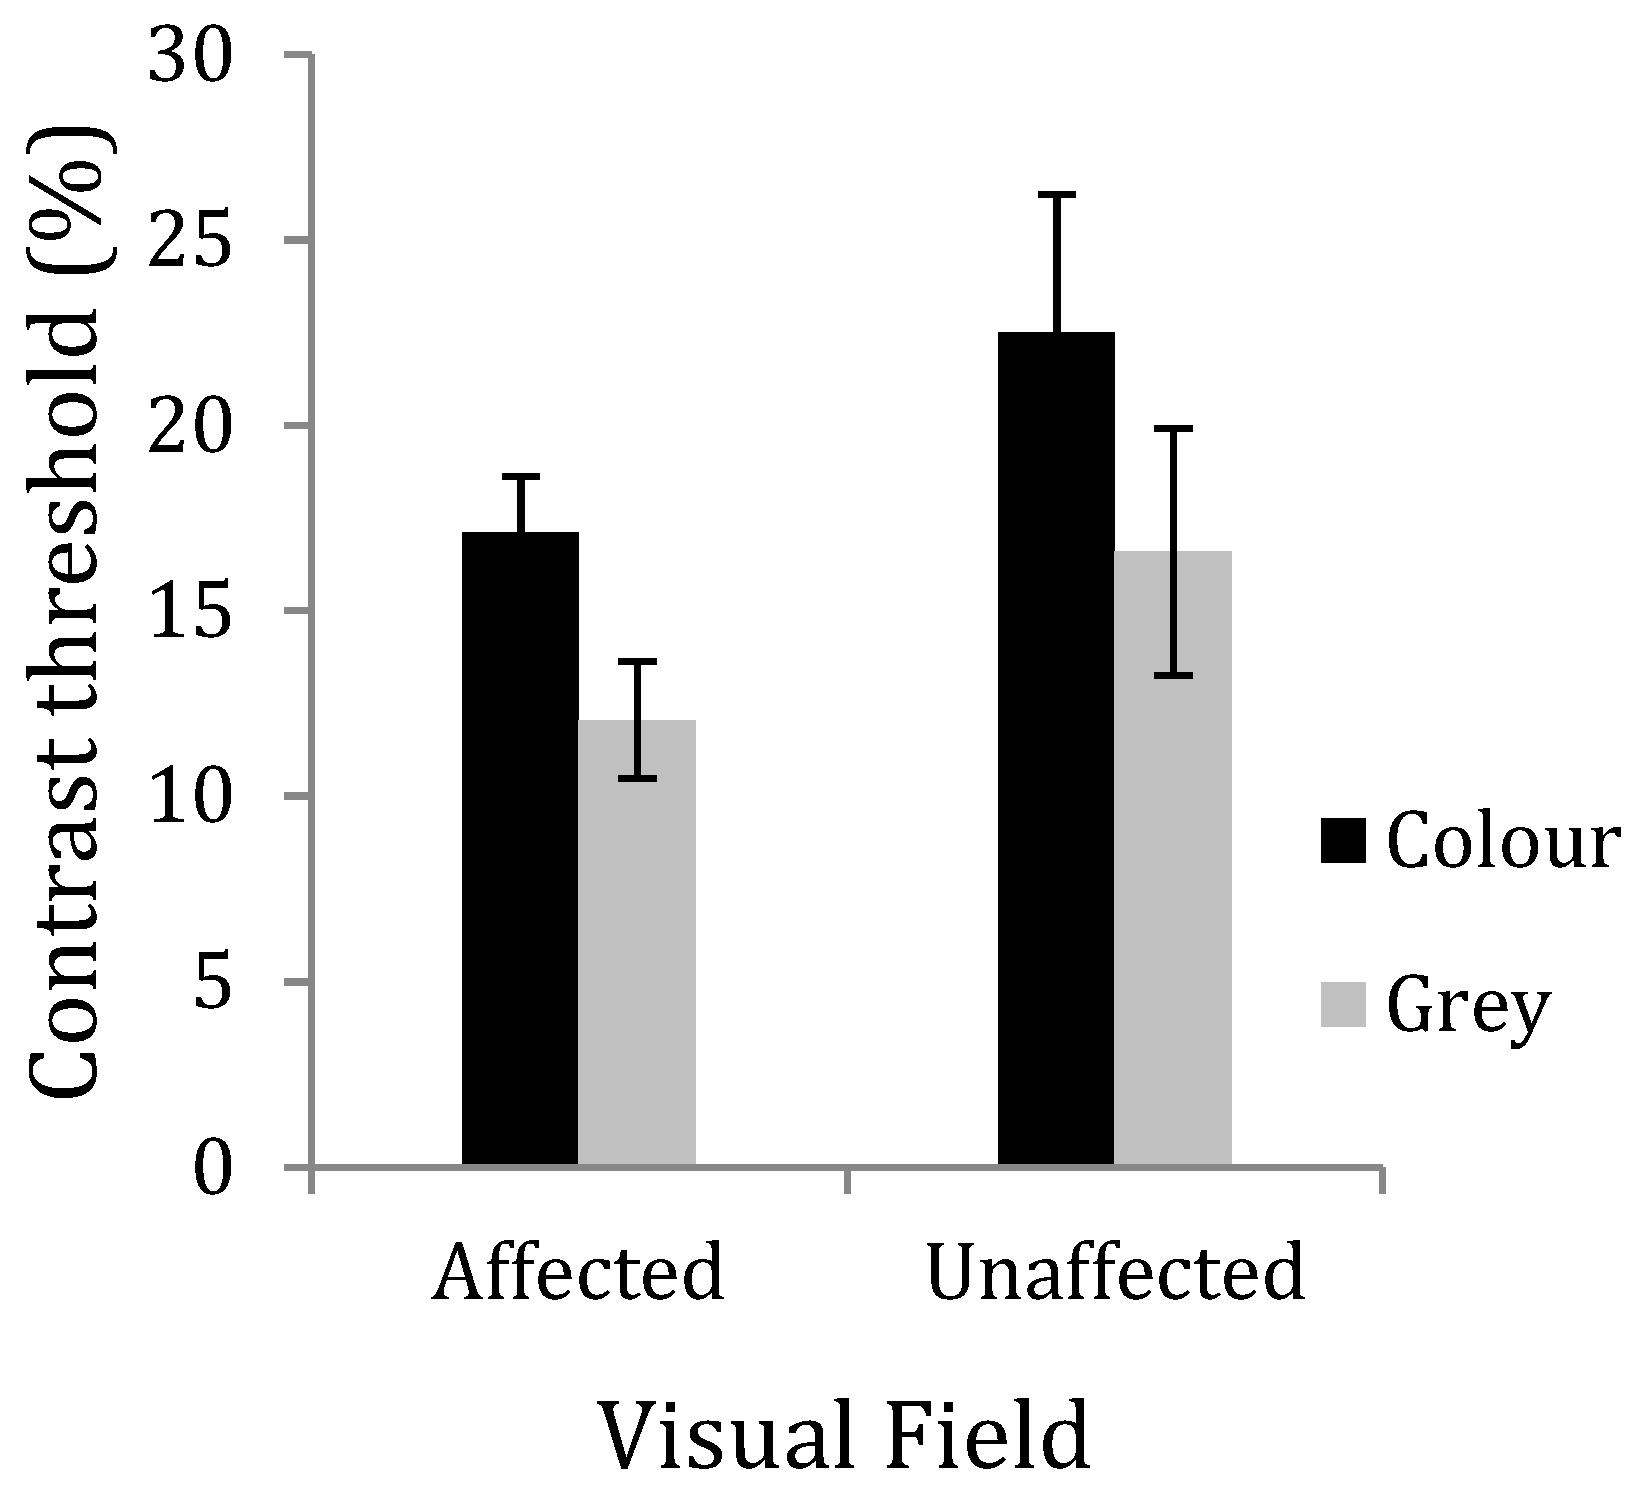
7. Results
8. Discussion
- (1)
- Those for whom colour is of no benefit choose light of familiar colours to which they are habitually exposed. Perhaps those patients who are most likely to benefit from tinted lenses choose colours away from the Planckian locus,
- (2)
- Individuals with migraine are rarely exposed to light of a colour they find comfortable, which may have consequences for photophobia. Noseda et al. [24] have proposed a role for the intrinsically photosensitive retinal ganglion cells (ipRGC) in photophobia. The cells are not themselves sensitive to patterns of the kind used here, but the ipRGC cells may indirectly contribute to contrast sensitivity [25]. The ipRGC are melanopic, with the spectral sensitivity being greatest at short wavelengths. The distribution of selected chromaticities shows no preference for short-wavelength light.
Supplementary Materials
Author Contributions
Funding
Conflicts of Interest
References
- Debney, L.M. Visual stimuli as migraine trigger factors. In Progress in Migraine Research 2; Rose, F., Ed.; Pitman Books: London, UK, 1984. [Google Scholar]
- Hay, K.M.; Mortimer, M.J.; Barker, D.C.; Debney, L.M.; Good, P.A. 1044 women with migraine: The effect of environmental stimuli. Headache 1994, 34, 166–168. [Google Scholar] [CrossRef] [PubMed]
- Khalil, N.M. Investigations of Visual Function in Migraine Using Visual Evoked Potentials and Visual Psychophysical Tests; University of London: London, UK, 1991. [Google Scholar]
- Shepherd, A.J. Visual contrast processing in migraine. Cephalalgia 2000, 20, 865–880. [Google Scholar] [CrossRef] [PubMed]
- McKendrick, A.M.; Badcock, D.R. Contrast-processing dysfunction in both magnocellular and parvocellular pathways in migraineurs with or without aura. Investig. Ophthalmol. Vis. Sci. 2003, 44, 442–448. [Google Scholar] [CrossRef] [PubMed]
- Wilkinson, F.; Crotogino, J. Orientation discrimination thresholds in migraine: A measure of visual cortical inhibition. Cephalalgia 2000, 20, 57–66. [Google Scholar] [CrossRef] [PubMed]
- Wagner, D.; Manahilov, V.; Gordon, G.E.; Storch, P. Long-range inhibitory mechanisms in the visual system are impaired in migraine sufferers. Cephalalgia 2012, 32, 1071–1075. [Google Scholar] [CrossRef] [PubMed]
- Webster, K.E.; Dickinson, J.E.; Battista, J.; McKendrick, A.M.; Badcock, D.R. Evidence for increased internal noise in migraineurs for contrast and shape processing. Cephalalgia 2012, 32, 125–139. [Google Scholar] [CrossRef] [PubMed]
- Asher, J.; O’Hare, L.; Romei, V.; Hibbard, P. Typical Lateral Interactions, but Increased Contrast Sensitivity, in Migraine-With-Aura. Vision 2018, 2, 7. [Google Scholar] [CrossRef]
- Karanovic, O.; Thabet, M.; Wilson, H.R.; Wilkinson, F. Detection and discrimination of flicker contrast in migraine. Cephalalgia 2011, 31, 723–736. [Google Scholar] [CrossRef] [PubMed]
- Wray, S.H.; Mijovic-Prelec, D.; Kosslyn, S.M. Visual processing in migraineurs. Brain 1995, 118, 25–35. [Google Scholar] [CrossRef] [PubMed]
- Welch, K.M.; D’andrea, G.; Tepley, N.; Barkley, G.; Ramadan, N.M. The concept of migraine as a state of central neuronal hyperexcitability. Neurol. Clin. 1990, 8, 817–828. [Google Scholar] [CrossRef]
- Aurora, S.K.; Wilkinson, F. The brain is hyperexcitable in migraine. Cephalalgia 2007, 27, 1442–1453. [Google Scholar] [CrossRef] [PubMed]
- Huang, J.; Cooper, T.G.; Satana, B.; Kaufman, D.I.; Cao, Y. Visual distortion provoked by a stimulus in migraine associated with hyperneuronal activity. Headache 2003, 43, 664–671. [Google Scholar] [CrossRef] [PubMed]
- Huang, J.; Zong, X.; Wilkins, A.; Jenkins, B.; Bozoki, A.; Cao, Y. fMRI evidence that precision ophthalmic tints reduce cortical hyperactivation in migraine. Cephalalgia 2011, 31, 925–936. [Google Scholar] [CrossRef] [PubMed]
- Headache Classification Committee of the International Headache Society (IHS). The international classification of headache disorders, 3rd edition. HIS: Cephalalgia 2018, 38, 1–211. [Google Scholar]
- Brainard, D.H. The Psychophysics Toolbox. Spat. Vis. 1997, 10, 433–436. [Google Scholar] [CrossRef] [PubMed]
- Kleiner, M.; Brainard, D.H.; Pelli, D.G. What’s new in Psychophysics Toolbox. Perception 2007, 36. [Google Scholar]
- Wilkins, A.J. A System for Precision Ophthalmic Tinting Manual for the Intuitive Colorimeter, Mk. 2; Cerium Visual Technologies: Kent, UK, 2002. [Google Scholar]
- Kim, Y.S.; Cho, B.H.; Kang, B.S.; Hong, B. Colour Temperature Conversion System and Method Using the Same; United States Patent and Trademark Office: Washington, DC, USA, 2006.
- Wilkins, A.J.; Milroy, R.; Nimmo-Smith, I.; Wright, A.; Tyrrell, R.; Holland, K.; Martin, J.; Bald, J.; Yale, S.; Miles, T.; et al. Preliminary observations concerning treatment of visual discomfort and associated perceptual distortion. Ophthalmic Physiol. Opt. 1992, 12, 257–263. [Google Scholar] [CrossRef] [PubMed]
- Wilkins, A.J.; Darby, C.E.; Binnie, C.D. Neurophysiological aspects of pattern-sensitive epilepsy. Brain 1979, 102, 1–25. [Google Scholar] [CrossRef] [PubMed]
- Xiao, Y.; Wang, Y.; Felleman, D.J. A spatially organized representation of colour in macaque cortical area V2. Nature 2003, 421, 535–539. [Google Scholar] [CrossRef] [PubMed]
- Noseda, R.; Kainz, V.; Jakubowski, M.; Gooley, J.J.; Saper, C.B.; Digre, K.; Berstein, R. A neural mechanism for exacerbation of headache by light. Nat. Neurosci. 2010, 13, 239–245. [Google Scholar] [CrossRef] [PubMed]
- Zele, A.J.; Adhikari, P.; Cao, D.; Feigl, B. Melanopsin driven enhancement of cone-mediated visual processing. Vis. Res. 2019, 160, 72–81. [Google Scholar] [CrossRef] [PubMed]

| Group | Mean | SD |
|---|---|---|
| Control | 0.00107 | (0.00158) |
| MO | 0.00129 | (0.00114) |
| MA | 0.00265 | (0.00256) |
| Affected Field Coloured Lens | Unaffected Field Grey Lens | |
|---|---|---|
| Unaffected field Coloured lens | p = 0.212 | p = 0.001 |
| Affected field | p = 0.001 | p = 0.267 |
| Grey lens |
© 2019 by the authors. Licensee MDPI, Basel, Switzerland. This article is an open access article distributed under the terms and conditions of the Creative Commons Attribution (CC BY) license (http://creativecommons.org/licenses/by/4.0/).
Share and Cite
Aldrich, A.; Hibbard, P.; Wilkins, A. Vision and Hyper-Responsiveness in Migraine. Vision 2019, 3, 62. https://doi.org/10.3390/vision3040062
Aldrich A, Hibbard P, Wilkins A. Vision and Hyper-Responsiveness in Migraine. Vision. 2019; 3(4):62. https://doi.org/10.3390/vision3040062
Chicago/Turabian StyleAldrich, Amelia, Paul Hibbard, and Arnold Wilkins. 2019. "Vision and Hyper-Responsiveness in Migraine" Vision 3, no. 4: 62. https://doi.org/10.3390/vision3040062
APA StyleAldrich, A., Hibbard, P., & Wilkins, A. (2019). Vision and Hyper-Responsiveness in Migraine. Vision, 3(4), 62. https://doi.org/10.3390/vision3040062