An Unexpected Spontaneous Motion-In-Depth Pulfrich Phenomenon in Amblyopia


Abstract
1. Introduction
2. Methods
2.1. Participants
2.2. Apparatus
2.3. Stimuli
2.4. Procedures
2.5. Data Analysis
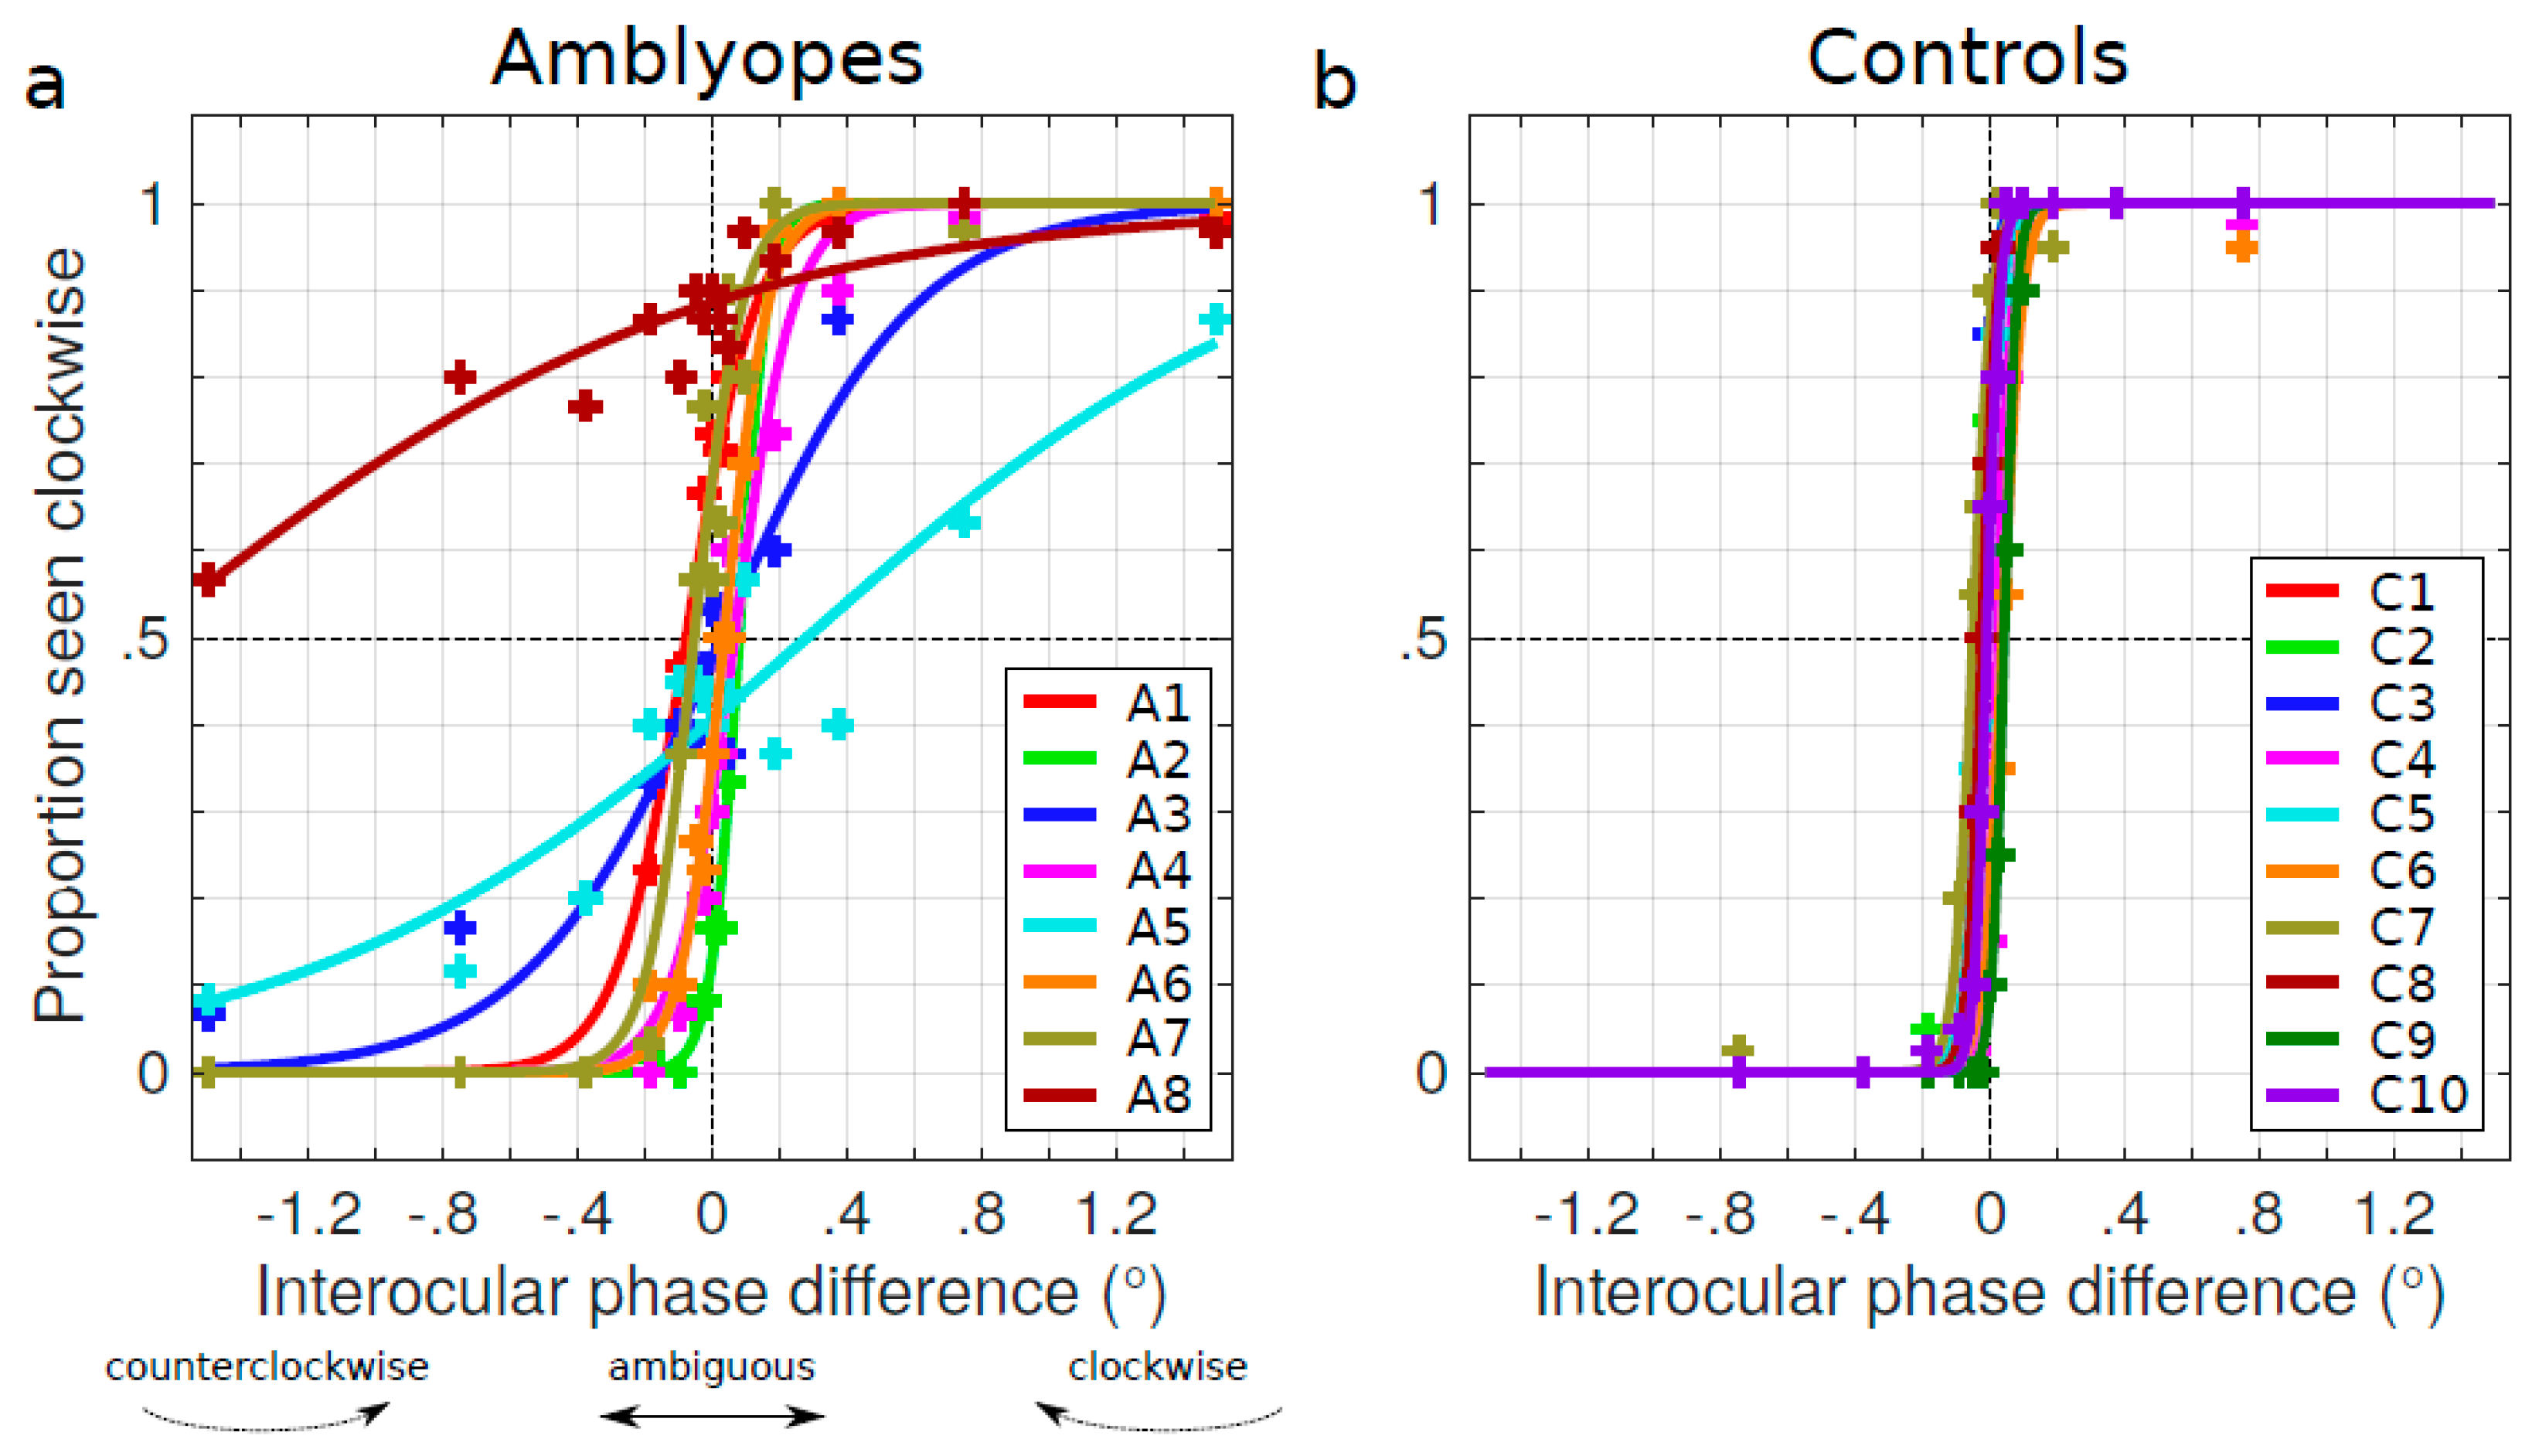
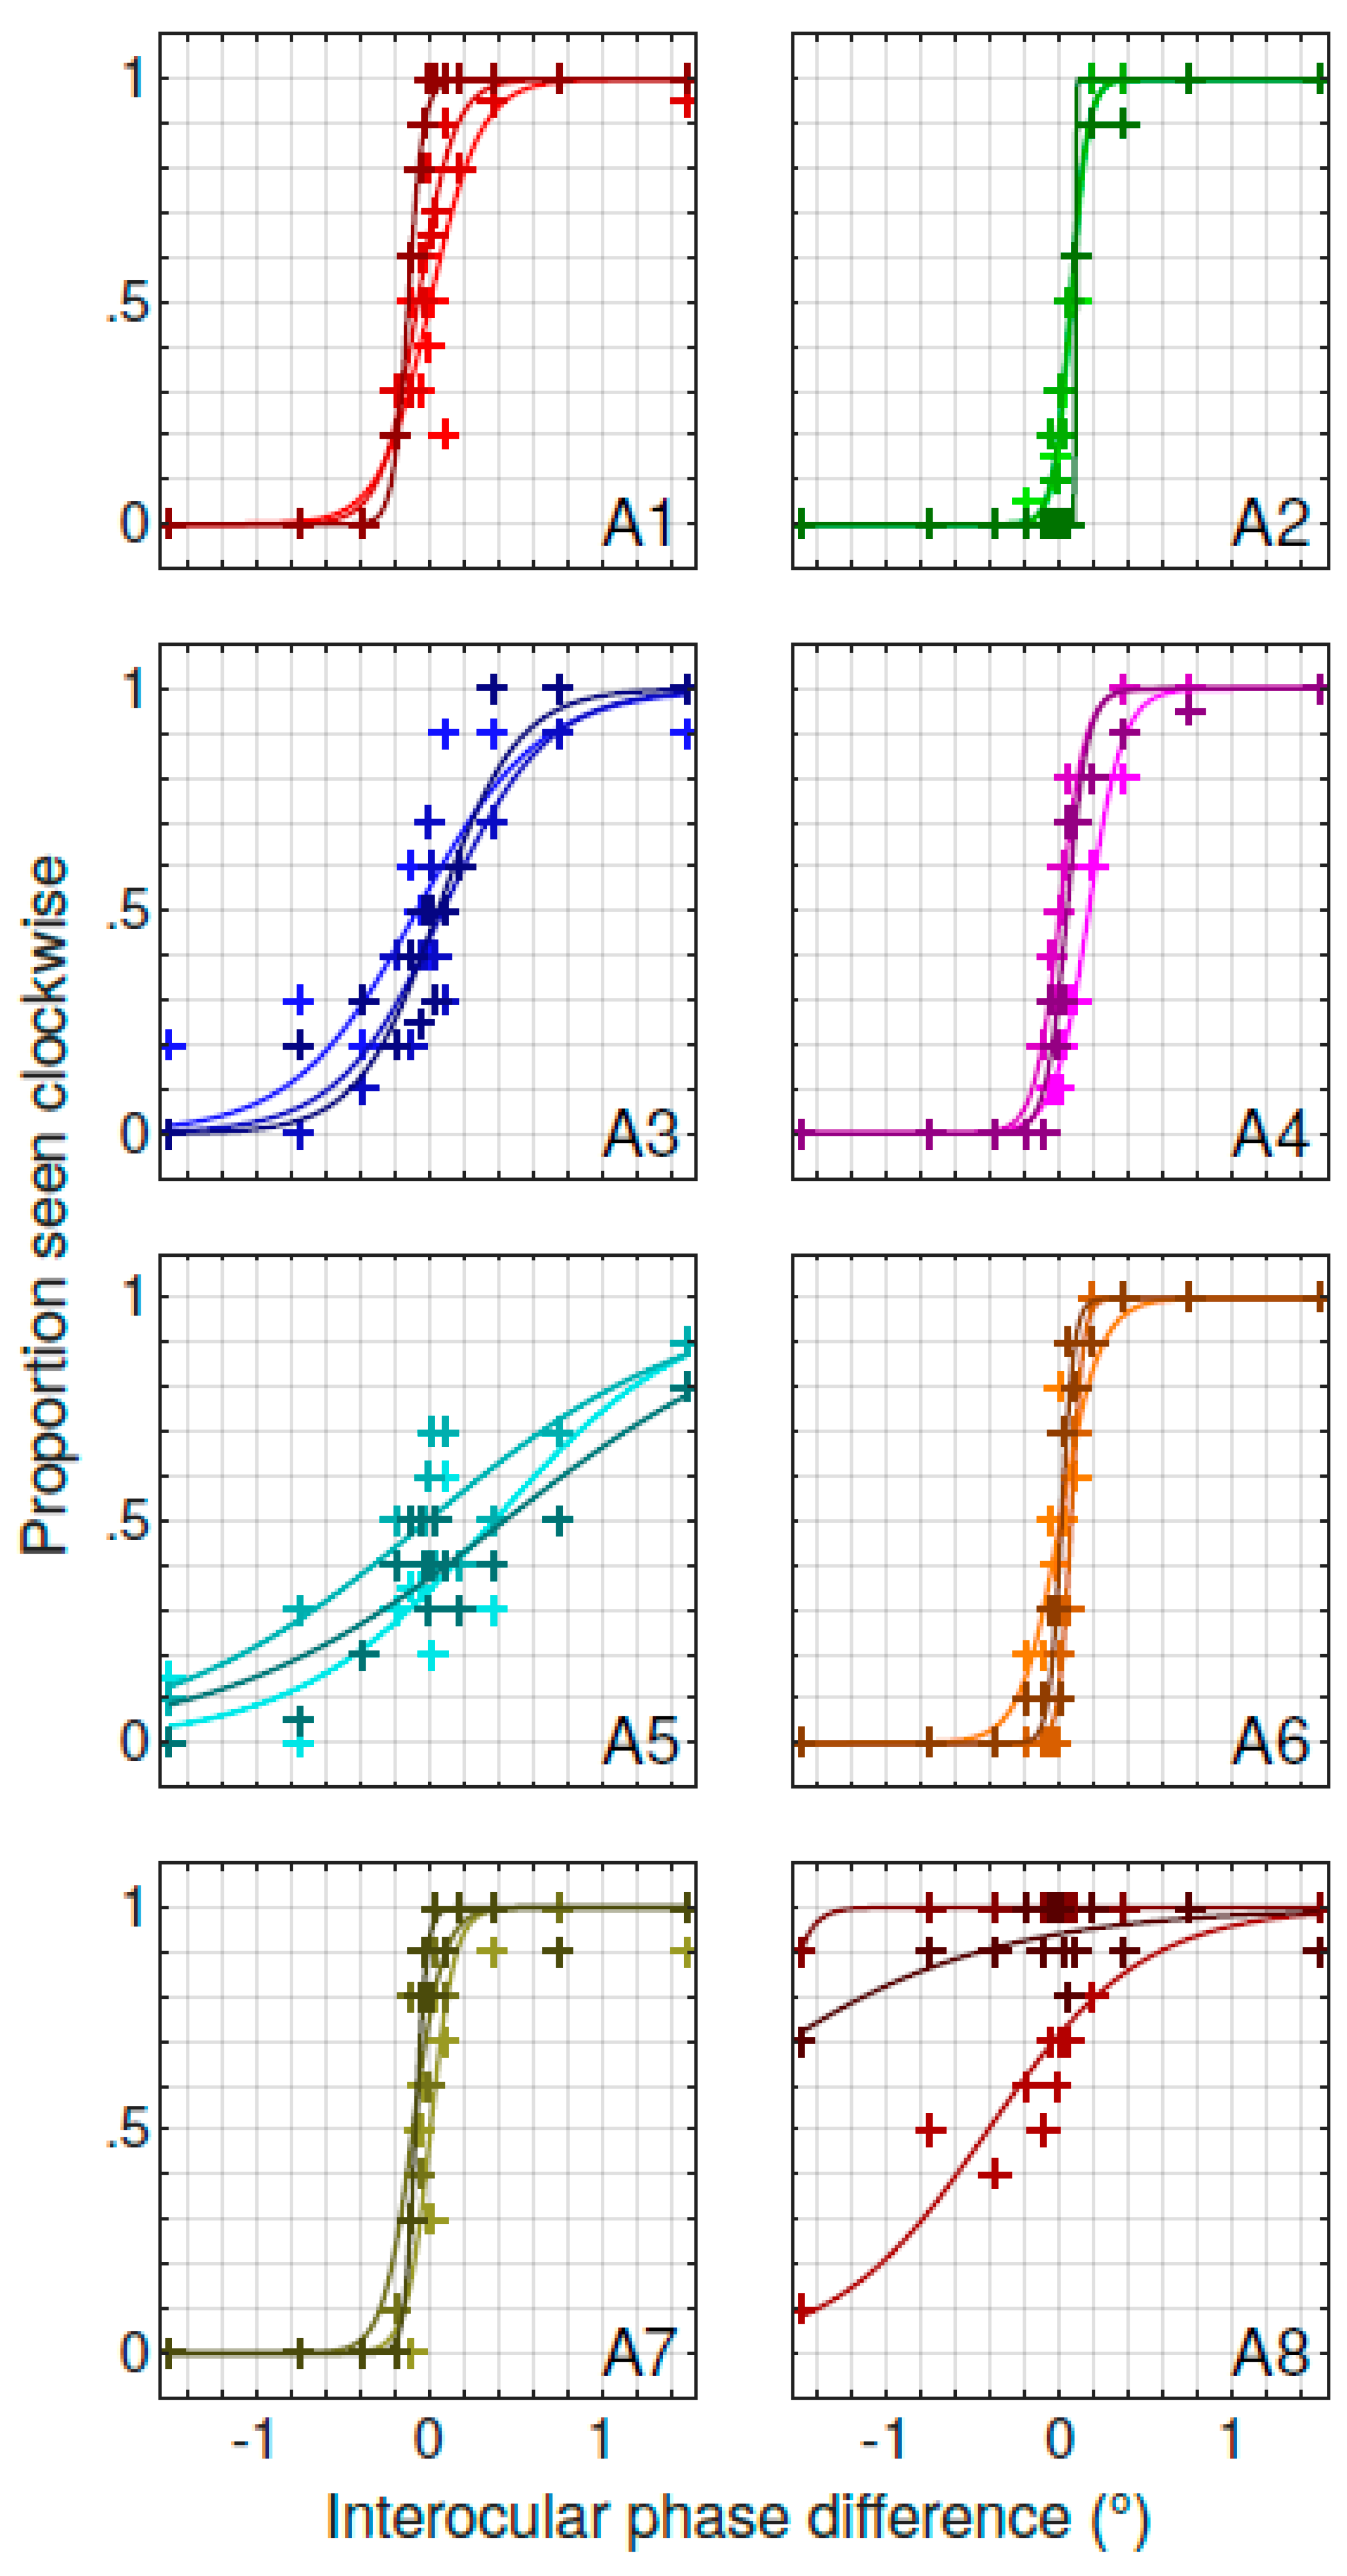
3. Results
3.1. Characterizing the Spontaneous Pulfrich Phenomenon
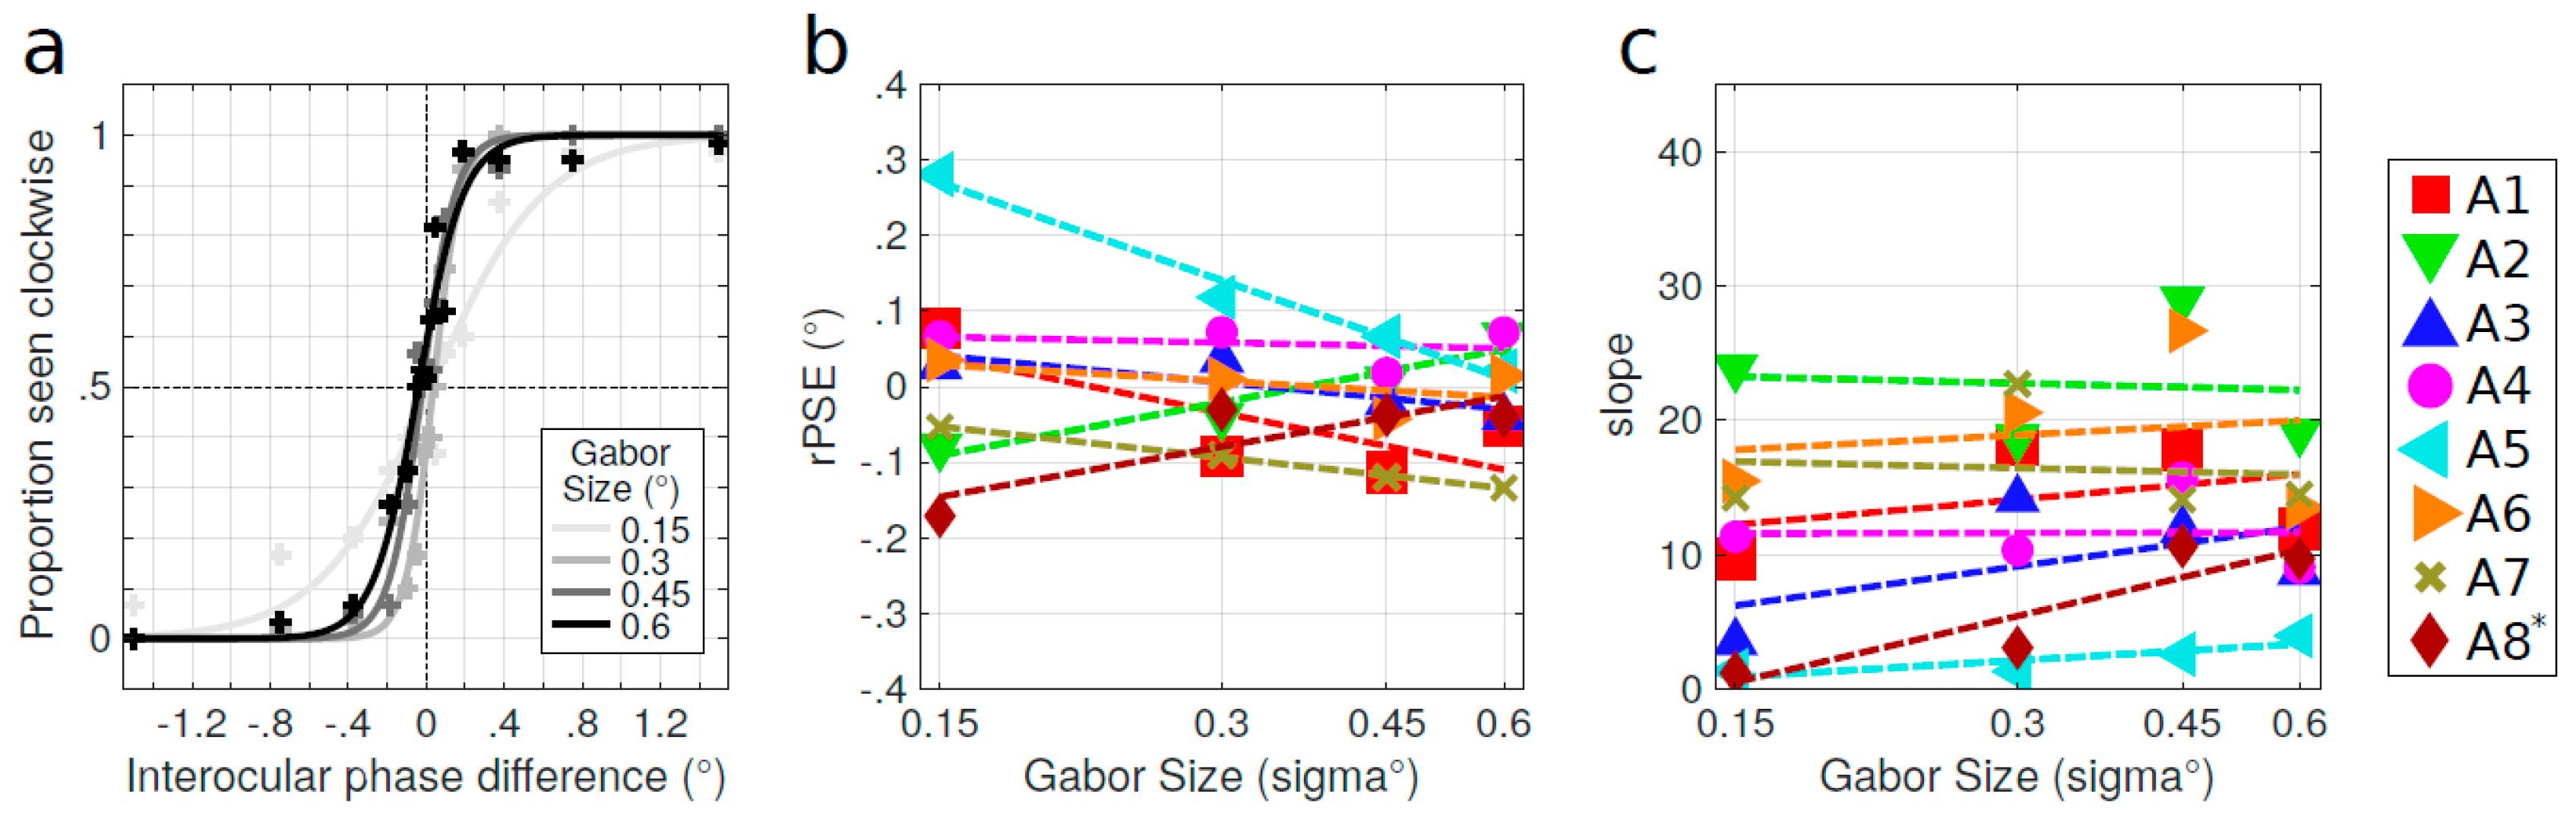
3.2. Influence of the Stimulus Parameters
4. Discussion
Supplementary Materials
Author Contributions
Funding
Conflicts of Interest
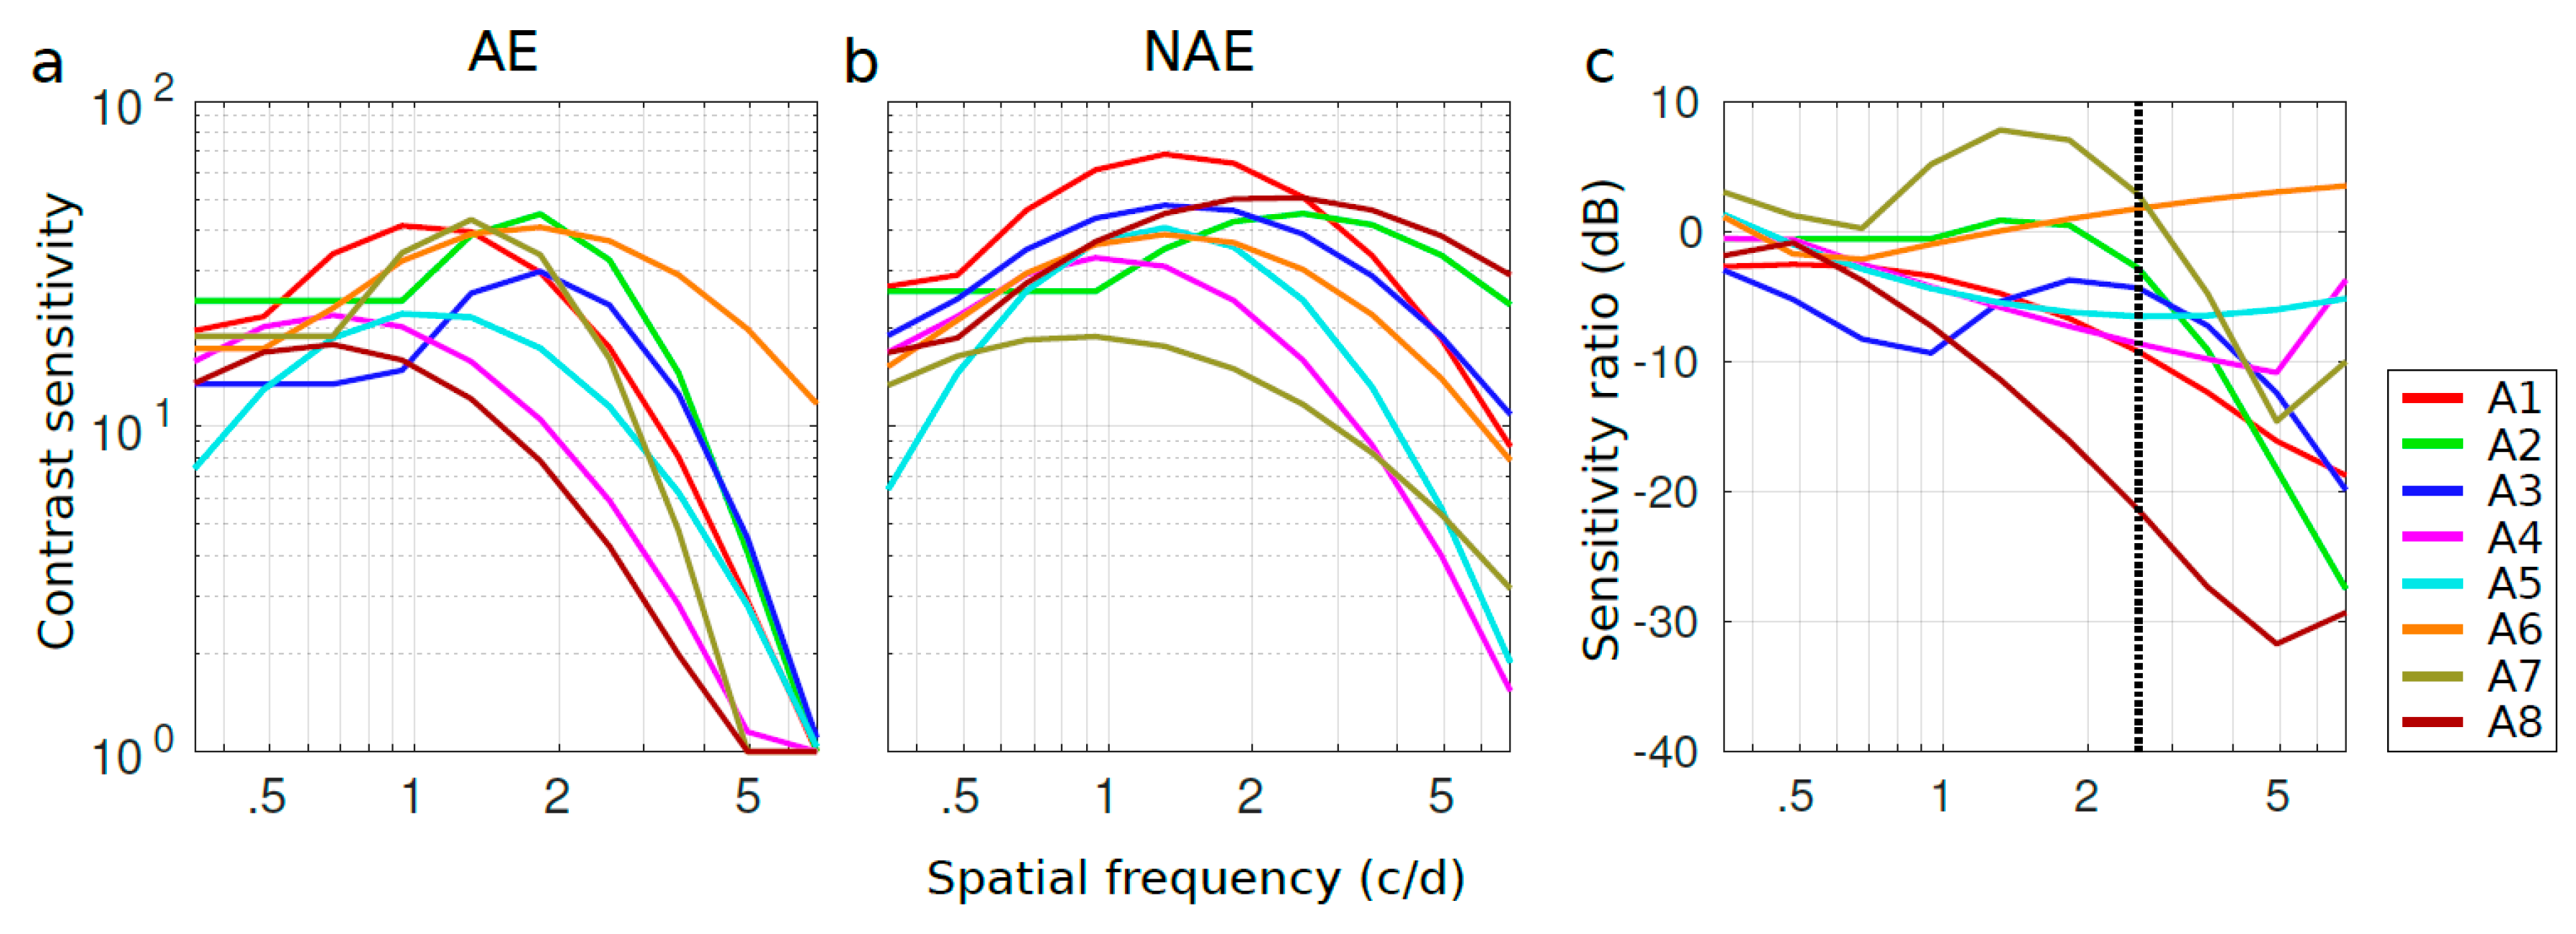
Appendix A. Contrast Sensitivity of Amblyopic Subjects

Appendix B. Contrast-Dependent Pulfrich Phenomenon in Amblyopia


Appendix C. Effect of Density and Spatial Frequency on Control Subjects

References
- Pulfrich, C. Die stereoskopie im dienste der isochromen und hete-rochromen photometrie. Naturwissenschaften 1922, 10, 553–564. [Google Scholar] [CrossRef]
- Carney, T.; Paradiso, M.A.; Freeman, R.D. A physiological correlate of the Pulfrich effect in cortical neurons of the cat. Vis. Res. 1989, 29, 155–165. [Google Scholar] [CrossRef]
- Lit, A. The magnitude of the Pulfrich stereophenomenon as a function of binocular differences of intensity at various levels of illumination. Am. J. Psychol. 1949, 62, 159–181. [Google Scholar] [CrossRef] [PubMed]
- Diehl, R.R. Measurement of interocular delays with dynamic random-dot stereograms. Eur. Arch. Psychiatry Clin. Neurosci. 1991, 241, 115–118. [Google Scholar] [CrossRef] [PubMed]
- Qian, N.; Andersen, R.A. A physiological model for motion-stereo integration and a unified explanation of Pulfrich-like phenomena. Vis. Res. 1997, 37, 1683–1698. [Google Scholar] [CrossRef]
- Julesz, B.; White, B. Short term visual memory and the Pulfrich phenomenon. Nature 1969, 222, 639–641. [Google Scholar] [CrossRef]
- Morgan, M. Stereoillusion based on visual persistence. Nature 1975, 256, 639–640. [Google Scholar] [CrossRef]
- Morgan, M.J.; Castet, E. Stereoscopic depth perception at high velocities. Nature 1995, 378, 380–383. [Google Scholar] [CrossRef]
- Read, J.C.A.; Cumming, B.G. The stroboscopic Pulfrich effect is not evidence for the joint encoding of motion and depth. J. Vis. 2005, 5, 417–434. [Google Scholar] [CrossRef][Green Version]
- Anzai, A.; Ohzawa, I.; Freeman, R.D. Joint-encoding of motion and depth by visual cortical neurons: Neural basis of the Pulfrich effect. Nat. Neurosci. 2001, 4, 513–518. [Google Scholar] [CrossRef]
- Cumming, B.G.; Parker, A.J. Binocular mechanisms for detecting motion-in-depth. Vis. Res. 1994, 34, 483–495. [Google Scholar] [CrossRef]
- Harris, J.M.; Nefs, H.T.; Grafton, C.E. Binocular vision and motion-in-depth. Spat. Vis. 2008, 21, 531–547. [Google Scholar] [CrossRef] [PubMed]
- Regan, D. Binocular correlates of the direction of motion in depth. Vis. Res. 1993, 33, 2359–2360. [Google Scholar] [CrossRef]
- Thompson, P.; Wood, V. The Pulfrich pendulum phenomenon in stereoblind subjects. Perception 1993, 22, 7–14. [Google Scholar] [CrossRef]
- Tredici, T.D.; von Noorden, G.K. The Pulfrich effect in anisometropic amblyopia and strabismus. Am. J. Ophthalmol. 1984, 98, 499–503. [Google Scholar] [CrossRef]
- Hamasaki, D.I.; Flynn, J.T. Amblyopic eyes have longer reaction times. Investig. Ophthalmol. Vis. Sci. 1981, 21, 846–853. [Google Scholar]
- von Noorden, G.K. Reaction time in normal and amblyopic eyes. Arch. Ophthalmol. 1961, 66, 695–701. [Google Scholar] [CrossRef]
- Nuzzi, G.; Riggio, L.; Rossi, S. Visual reaction times in strabismic amblyopia: A case-control study. Acta Bio Med. Atenei Parm. 2007, 78, 182–189. [Google Scholar]
- Perdziak, M.; Witkowska, D.; Gryncewicz, W.; Przekoracka-Krawczyk, A.; Ober, J. The amblyopic eye in subjects with anisometropia show increased saccadic latency in the delayed saccade task. Front. Integr. Neurosci. 2014, 8, 77. [Google Scholar] [CrossRef]
- Ciuffreda, K.J.; Kenyon, R.V.; Stark, L. Increased saccadic latencies in amblyopic eyes. Investig. Ophthalmol. Vis. Sci. 1978, 17, 697–702. [Google Scholar]
- Barbur, J.L.; Hess, R.F.; Pinney, H.D. Pupillary function in human amblyopia. Ophthalmic Physiol. Opt. 1994, 14, 139–149. [Google Scholar] [CrossRef] [PubMed]
- Kase, M.; Nagata, R.; Yoshida, A.; Hanada, I. Pupillary light reflex in amblyopia. Investig. Ophthalmol. Vis. Sci. 1984, 25, 467–471. [Google Scholar]
- Levi, D.M.; Harwerth, R.S.; Manny, R.E. Suprathreshold spatial frequency detection and binocular interaction in strabismic and anisometropic amblyopia. Investig. Ophthalmol. Vis. Sci. 1979, 18, 714–725. [Google Scholar]
- Reynaud, A.; Hess, R.F. Interocular contrast difference drives illusory 3D percept. Sci. Rep. 2017, 7, 5587. [Google Scholar] [CrossRef] [PubMed]
- McKee, S.P.; Levi, D.M.; Schor, C.M.; Movshon, J.A. Saccadic latency in amblyopia. J. Vis. 2016, 16, 3. [Google Scholar] [CrossRef] [PubMed]
- Dodd, J.V.; Krug, K.; Cumming, B.G.; Parker, A.J. Perceptually bistable three-dimensional figures evoke high choice probabilities in cortical area MT. J. Neurosci. 2001, 21, 4809–4821. [Google Scholar] [CrossRef] [PubMed]
- Treue, S.; Husain, M.; Andersen, R.A. Human perception of structure from motion. Vis. Res. 1991, 31, 59–75. [Google Scholar] [CrossRef]
- Brainard, D.H. The psychophysics toolbox. Spat. Vis. 1997, 10, 433–436. [Google Scholar] [CrossRef]
- Kleiner, M.; Brainard, D.; Pelli, D. What’s new in Psychtoolbox-3? In Proceedings of the 30th European Conference on Visual Perception, Arezzo, Italy, 27–31 August 2007. [Google Scholar]
- Pelli, D.G. The VideoToolbox software for visual psychophysics: Transforming numbers into movies. Spat. Vis. 1997, 10, 437–442. [Google Scholar] [CrossRef]
- Spiegel, D.P.; Baldwin, A.S.; Hess, R.F. Ocular dominance plasticity: Inhibitory interactions and contrast equivalence. Sci. Rep. 2017, 7, 39913. [Google Scholar] [CrossRef]
- Albrecht, D.G. Visual cortex neurons in monkey and cat: Effect of contrast on the spatial and temporal phase transfer functions. Vis. Neurosci. 1995, 12, 1191–1210. [Google Scholar] [CrossRef] [PubMed]
- Lui, L.L.; Bourne, J.A.; Rosa, M.G.P. Relationship between size summation properties, contrast sensitivity and response latency in the dorsomedial and middle temporal areas of the primate extrastriate cortex. PLoS ONE 2013, 8, e68276. [Google Scholar] [CrossRef] [PubMed]
- Mante, V.; Frazor, R.A.; Bonin, V.; Geisler, W.S.; Carandini, M. Independence of luminance and contrast in natural scenes and in the early visual system. Nat. Neurosci. 2005, 8, 1690–1697. [Google Scholar] [CrossRef] [PubMed]
- Barthélemy, F.V.; Vanzetta, I.; Masson, G.S. Behavioral receptive field for ocular following in humans: Dynamics of spatial summation and center-surround interactions. J. Neurophysiol. 2006, 95, 3712–3726. [Google Scholar] [CrossRef] [PubMed][Green Version]
- Brooks, K. Stereomotion speed perception is contrast dependent. Perception 2001, 30, 725–731. [Google Scholar] [CrossRef] [PubMed]
- Loshin, D.S.; Levi, D.M. Suprathreshold contrast perception in functional amblyopia. Doc. Ophthalmol. 1983, 55, 213–236. [Google Scholar] [CrossRef]
- Chadnova, E.; Reynaud, A.; Clavagnier, S.; Hess, R.F. Latent binocular function in amblyopia. Vis. Res. 2017, 140, 73–80. [Google Scholar] [CrossRef]
- Levi, M.; Harwerth, R.S. Spatio-temporal interactions in anisometropic and strabismic amblyopia. Investig. Ophthalmol. Vis. Sci. 1977, 16, 90–95. [Google Scholar]
- Hess, R.F.; Howell, E.R. The threshold contrast sensitivity function in strabismic amblyopia: Evidence for a two type classification. Vis. Res. 1977, 17, 1049–1055. [Google Scholar] [CrossRef]
- Burge, J.; Rodriguez-Lopez, V.; Dorronsoro, C. Monovision and the misperception of motion. bioRxiv. 2019. [Google Scholar] [CrossRef]
- Levi, D.M.; Klein, S.A. Equivalent intrinsic blur in amblyopia. Vis. Res. 1990, 30, 1995–2022. [Google Scholar] [CrossRef]
- Simmers, A.J.; Bex, P.J.; Hess, R.F. Perceived blur in amblyopia. Investig. Opthalmol. Vis. Sci. 2003, 44, 1395–1400. [Google Scholar] [CrossRef] [PubMed]
- Reynaud, A.; Hess, R.F. Is suppression just normal dichoptic masking? Suprathreshold considerations. Invest. Ophthalmol. Vis. Sci. 2016, 57, 5107–5115. [Google Scholar] [CrossRef] [PubMed][Green Version]
- Gao, Y.; Reynaud, A.; Tang, Y.; Feng, L.; Zhou, Y.; Hess, R.F. The amblyopic deficit for 2nd order processing: Generality and laterality. Vis. Res. 2015, 114, 111–121. [Google Scholar] [CrossRef] [PubMed]
- Ding, J.; Klein, S.A.; Levi, D.M. Binocular combination in abnormal binocular vision. J. Vis. 2013, 13, 14. [Google Scholar] [CrossRef] [PubMed]
- Kwon, M.; Wiecek, E.; Dakin, S.C.; Bex, P.J. Spatial-frequency dependent binocular imbalance in amblyopia. Sci. Rep. 2015, 5, 17181. [Google Scholar] [CrossRef] [PubMed]
- Lesmes, L.A.; Lu, Z.-L.; Baek, J.; Albright, T.D. Bayesian adaptive estimation of the contrast sensitivity function: The quick CSF method. J. Vis. 2010, 10, 17. [Google Scholar] [CrossRef]
- Carkeet, A.; Wildsoet, C.F.; Wood, J.M. Inter-ocular temporal asynchrony (IOTA): Psychophysical measurement of inter-ocular asymmetry of visual latency. Ophthalmic Physiol. Opt. 1997, 17, 255–262. [Google Scholar] [CrossRef]


| Subject | Age/Sex | Refraction | VA | Squint | Suppression | Randot (Arcsec) | Patching | Surgery | Type | IOD (ms) | |
|---|---|---|---|---|---|---|---|---|---|---|---|
| A1 | 40/F | NAE (OS) | plano | 20/16 | R eso 5° | weak | 60 | no | no | strab. | 4.28 |
| AE (OD) | plano | 20/25 | |||||||||
| A2 | 33/F | NAE (OS) | plano | 20/12.5 | weak central | 100 | no | no | aniso. | −4.41 | |
| AE (OD) | +2.50 | 20/16 | |||||||||
| A3 | 21/M | NAE (OD) | −2.75 | 20/10 | L exo 5° | no | 400 | For 5 years | no | mixed | 1.53 |
| AE (OS) | +1.75/−1.00 × 30° | 20/32 | around 11yo | ||||||||
| A4 | 25/F | NAE (OD) | −1.50 | 20/12.5 | no | 100 | no | no | aniso. | 3.69 | |
| AE (OS) | +1.50 | 20/63 | |||||||||
| A5 | 53/M | NAE (OD) | −1.25/−0.50 × 30° | 20/20 | L exo 6° | no | NA | no | no | mixed | 15.62 |
| AE (OS) | +2.50/−1.50 × 75° | 20/50 | |||||||||
| A6 | 27/M | NAE (OD) | +1.50/−0.75 × 163° | 20/12.5 | L eso 5° | flickering | 60 | 1 year | no | mixed | 1.97 |
| AE (OS) | +3.50/−0.75 × 65° | 20/20 | around 5yo | ||||||||
| A7 | 54/F | NAE (OD) | plano | 20/20 | L eso 9° | weak | 100 | no | strabism surgery | strab. | −2.97 |
| AE (OS) | plano | 20/32 | 6 months ago | ||||||||
| A8 | 32/M | NAE (OD) | −1 | 20/10 | L eso 10° | weak | 400 | no | no | mixed | −94.93 |
| AE (OS) | +1.5 | 20/50 |
© 2019 by the authors. Licensee MDPI, Basel, Switzerland. This article is an open access article distributed under the terms and conditions of the Creative Commons Attribution (CC BY) license (http://creativecommons.org/licenses/by/4.0/).
Share and Cite
Reynaud, A.; Hess, R.F. An Unexpected Spontaneous Motion-In-Depth Pulfrich Phenomenon in Amblyopia. Vision 2019, 3, 54. https://doi.org/10.3390/vision3040054
Reynaud A, Hess RF. An Unexpected Spontaneous Motion-In-Depth Pulfrich Phenomenon in Amblyopia. Vision. 2019; 3(4):54. https://doi.org/10.3390/vision3040054
Chicago/Turabian StyleReynaud, Alexandre, and Robert F. Hess. 2019. "An Unexpected Spontaneous Motion-In-Depth Pulfrich Phenomenon in Amblyopia" Vision 3, no. 4: 54. https://doi.org/10.3390/vision3040054
APA StyleReynaud, A., & Hess, R. F. (2019). An Unexpected Spontaneous Motion-In-Depth Pulfrich Phenomenon in Amblyopia. Vision, 3(4), 54. https://doi.org/10.3390/vision3040054