Long-Range Interocular Suppression in Adults with Strabismic Amblyopia: A Pilot fMRI Study

 ,
, 
Abstract
1. Introduction
2. Methods
2.1. Participants
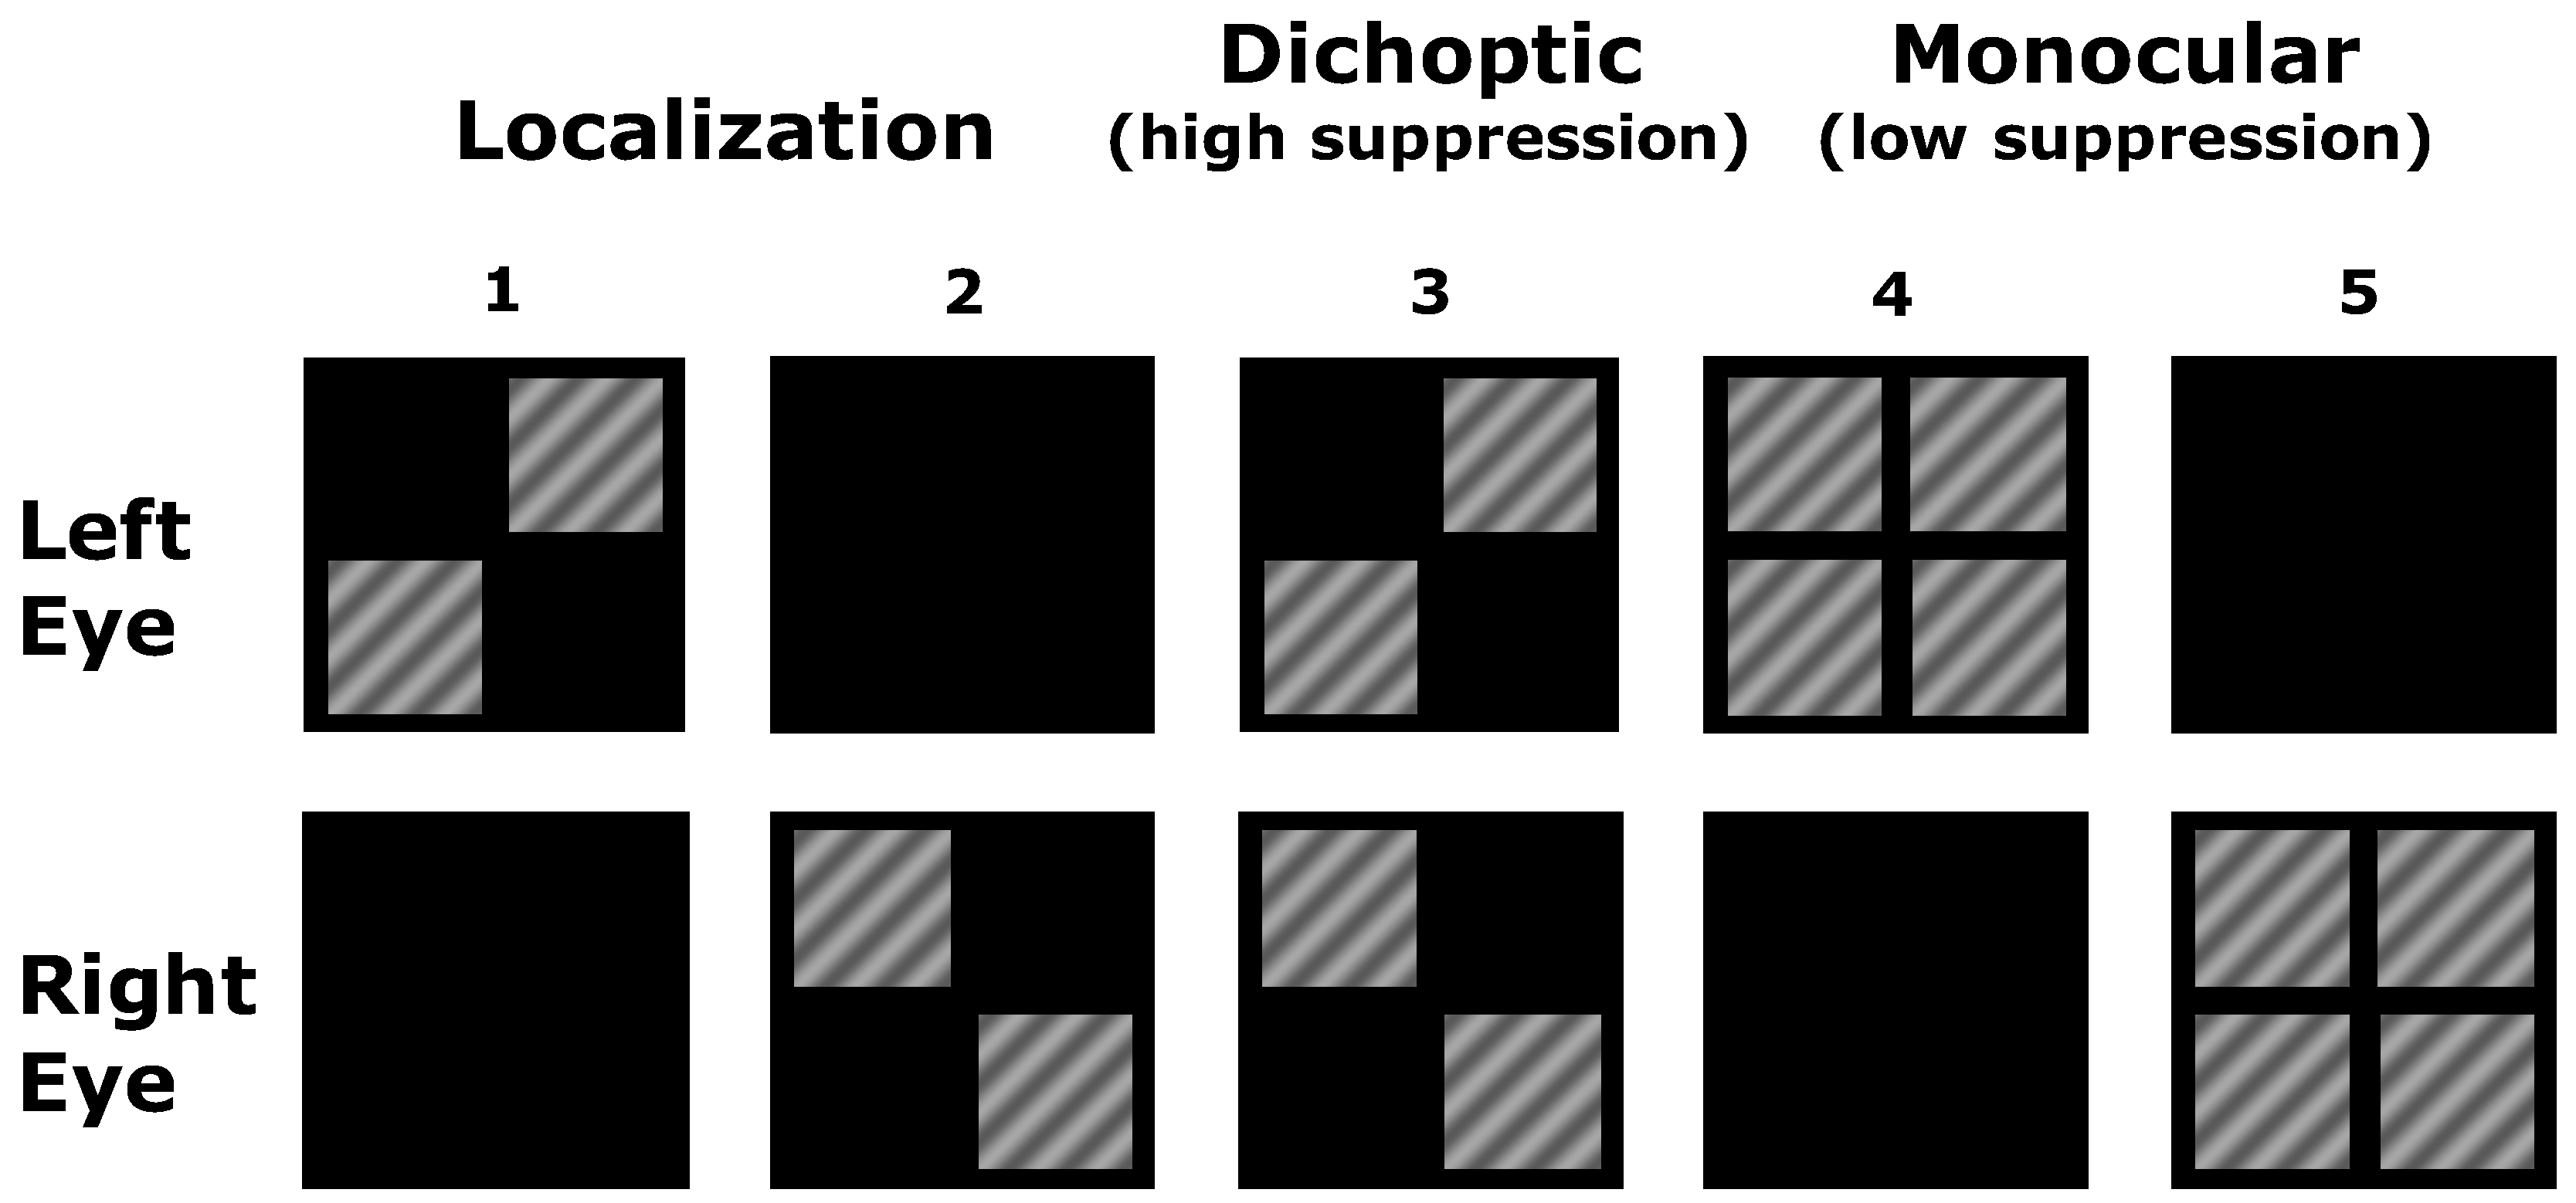
2.2. Stimuli
2.3. Psychophysical Measurements
2.4. MRI
2.5. Analysis
3. Results
3.1. Psychophysical Luminance Matching
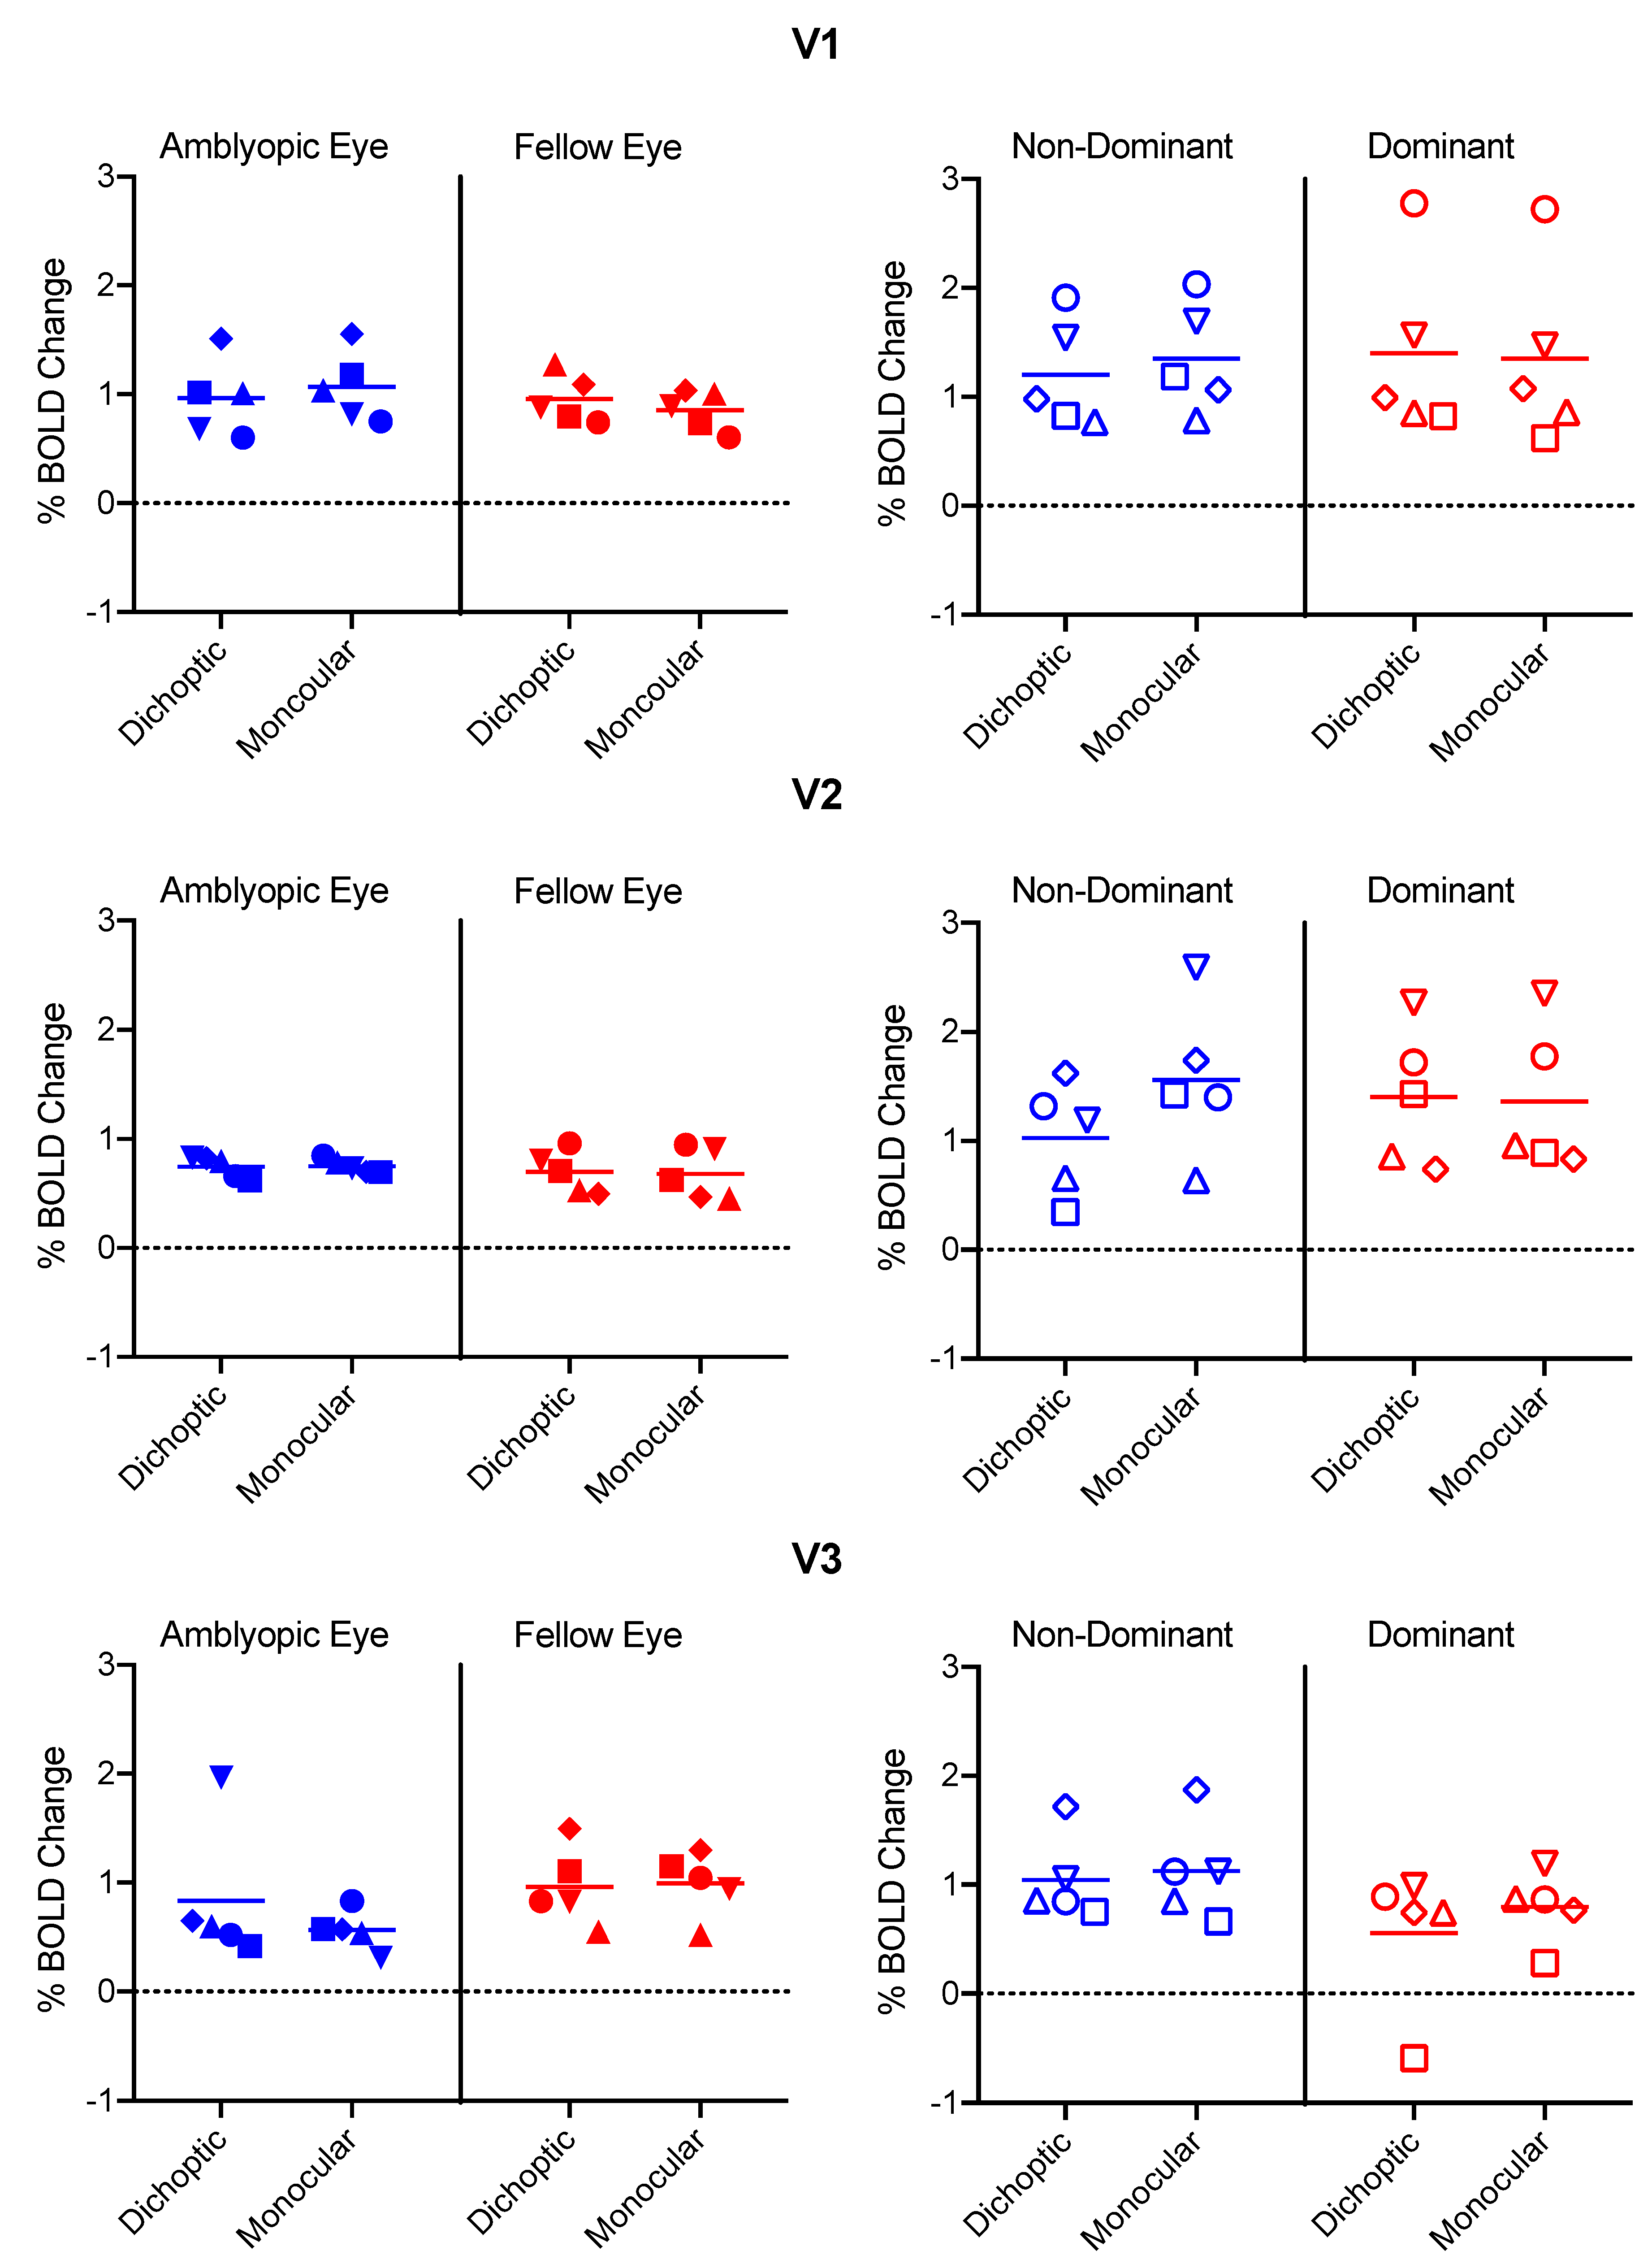
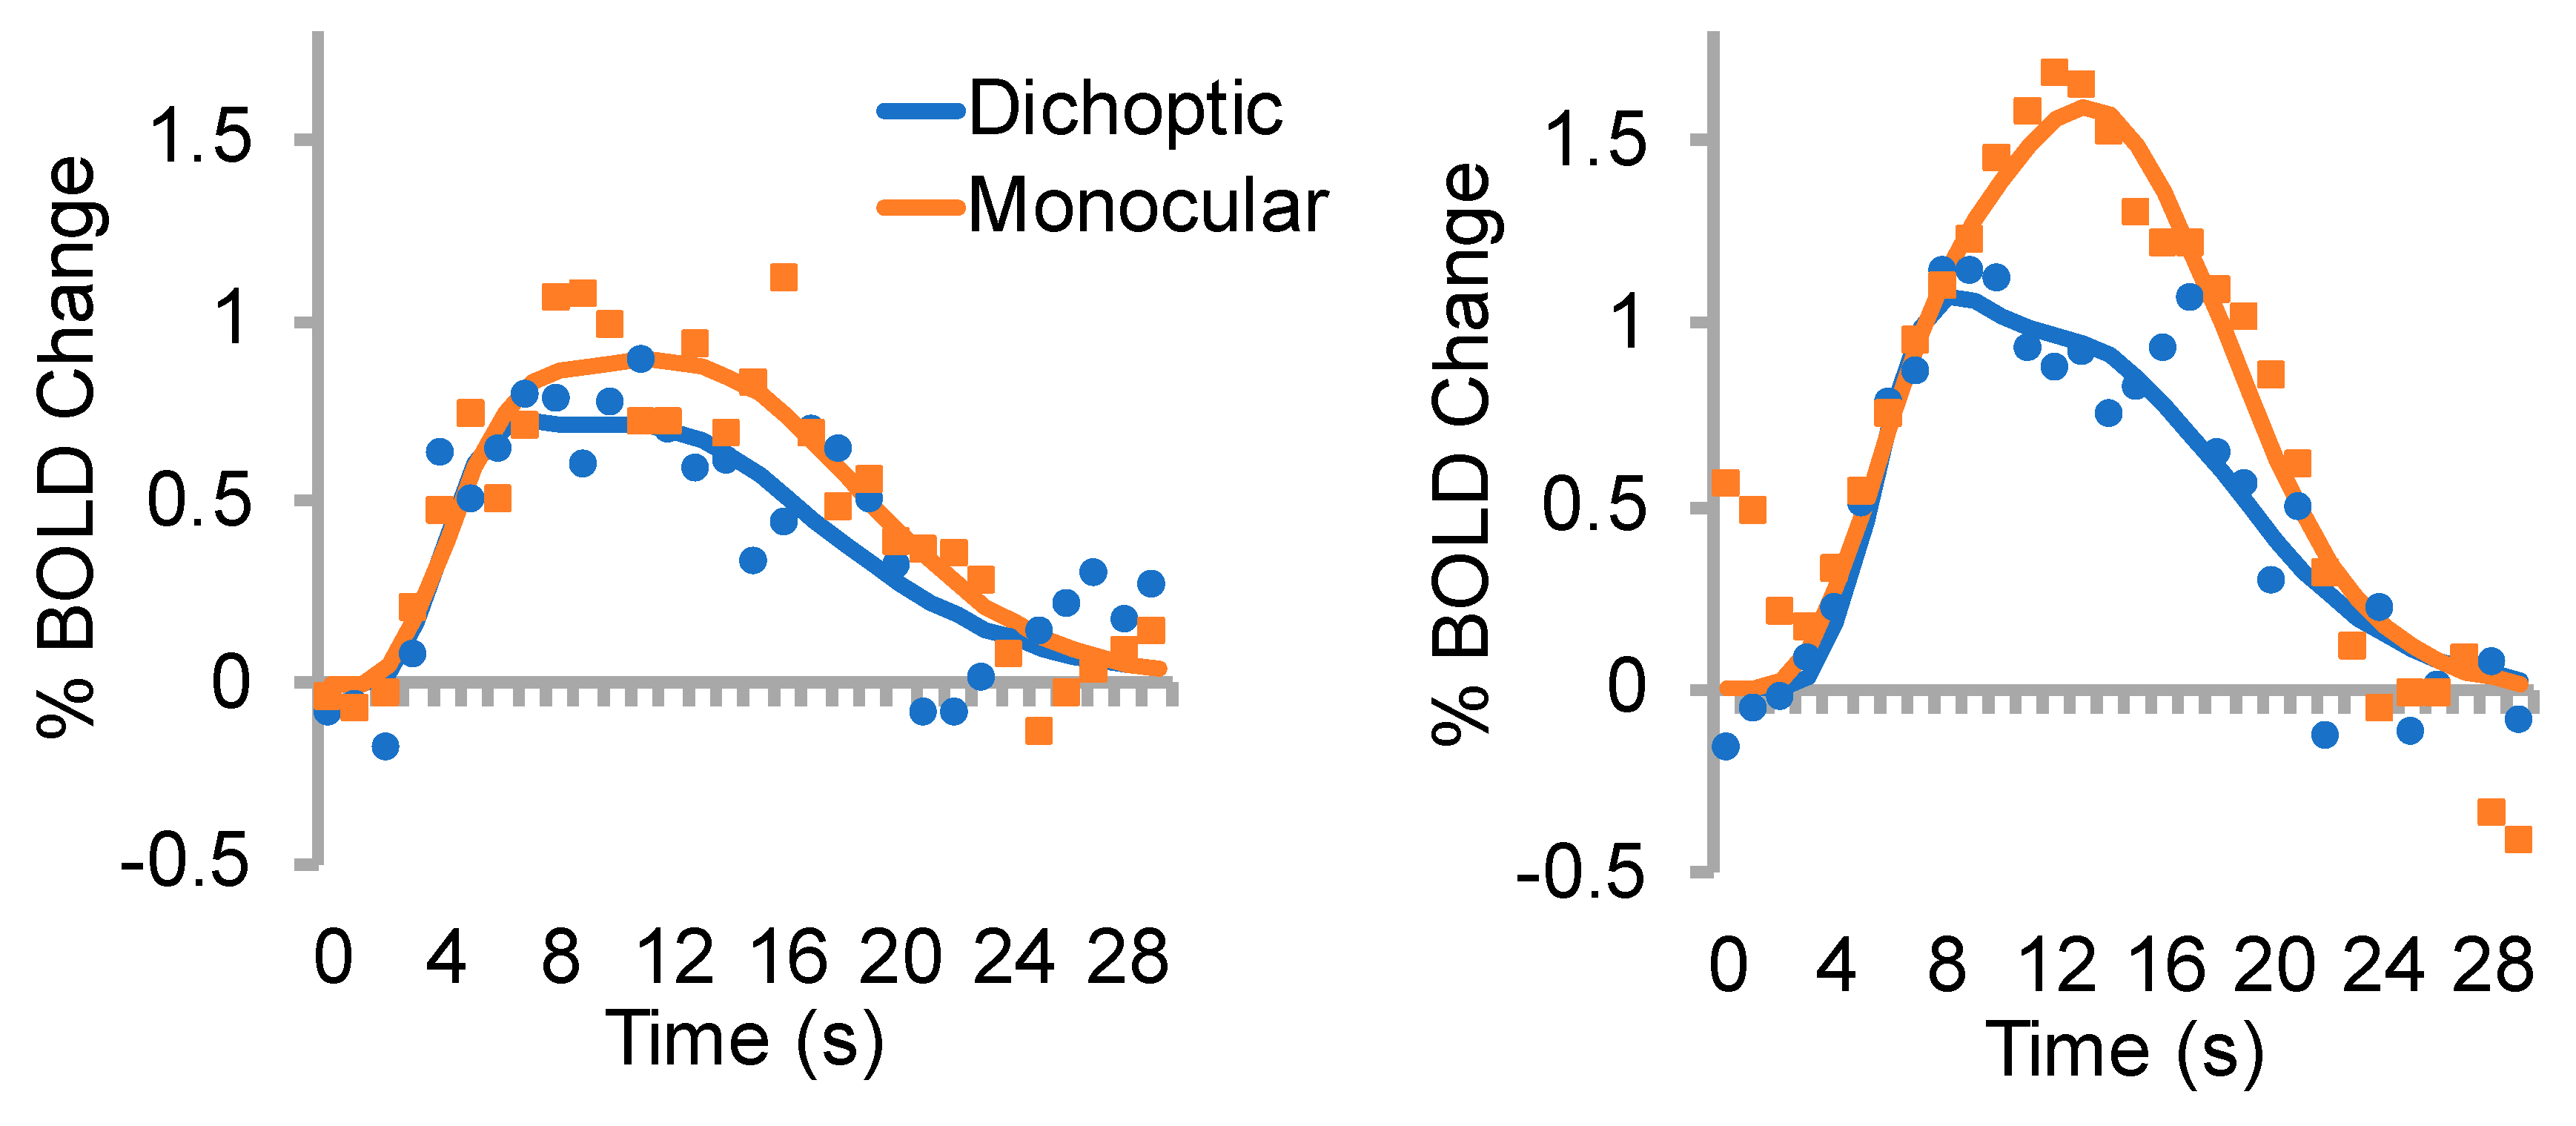
3.2. % BOLD change
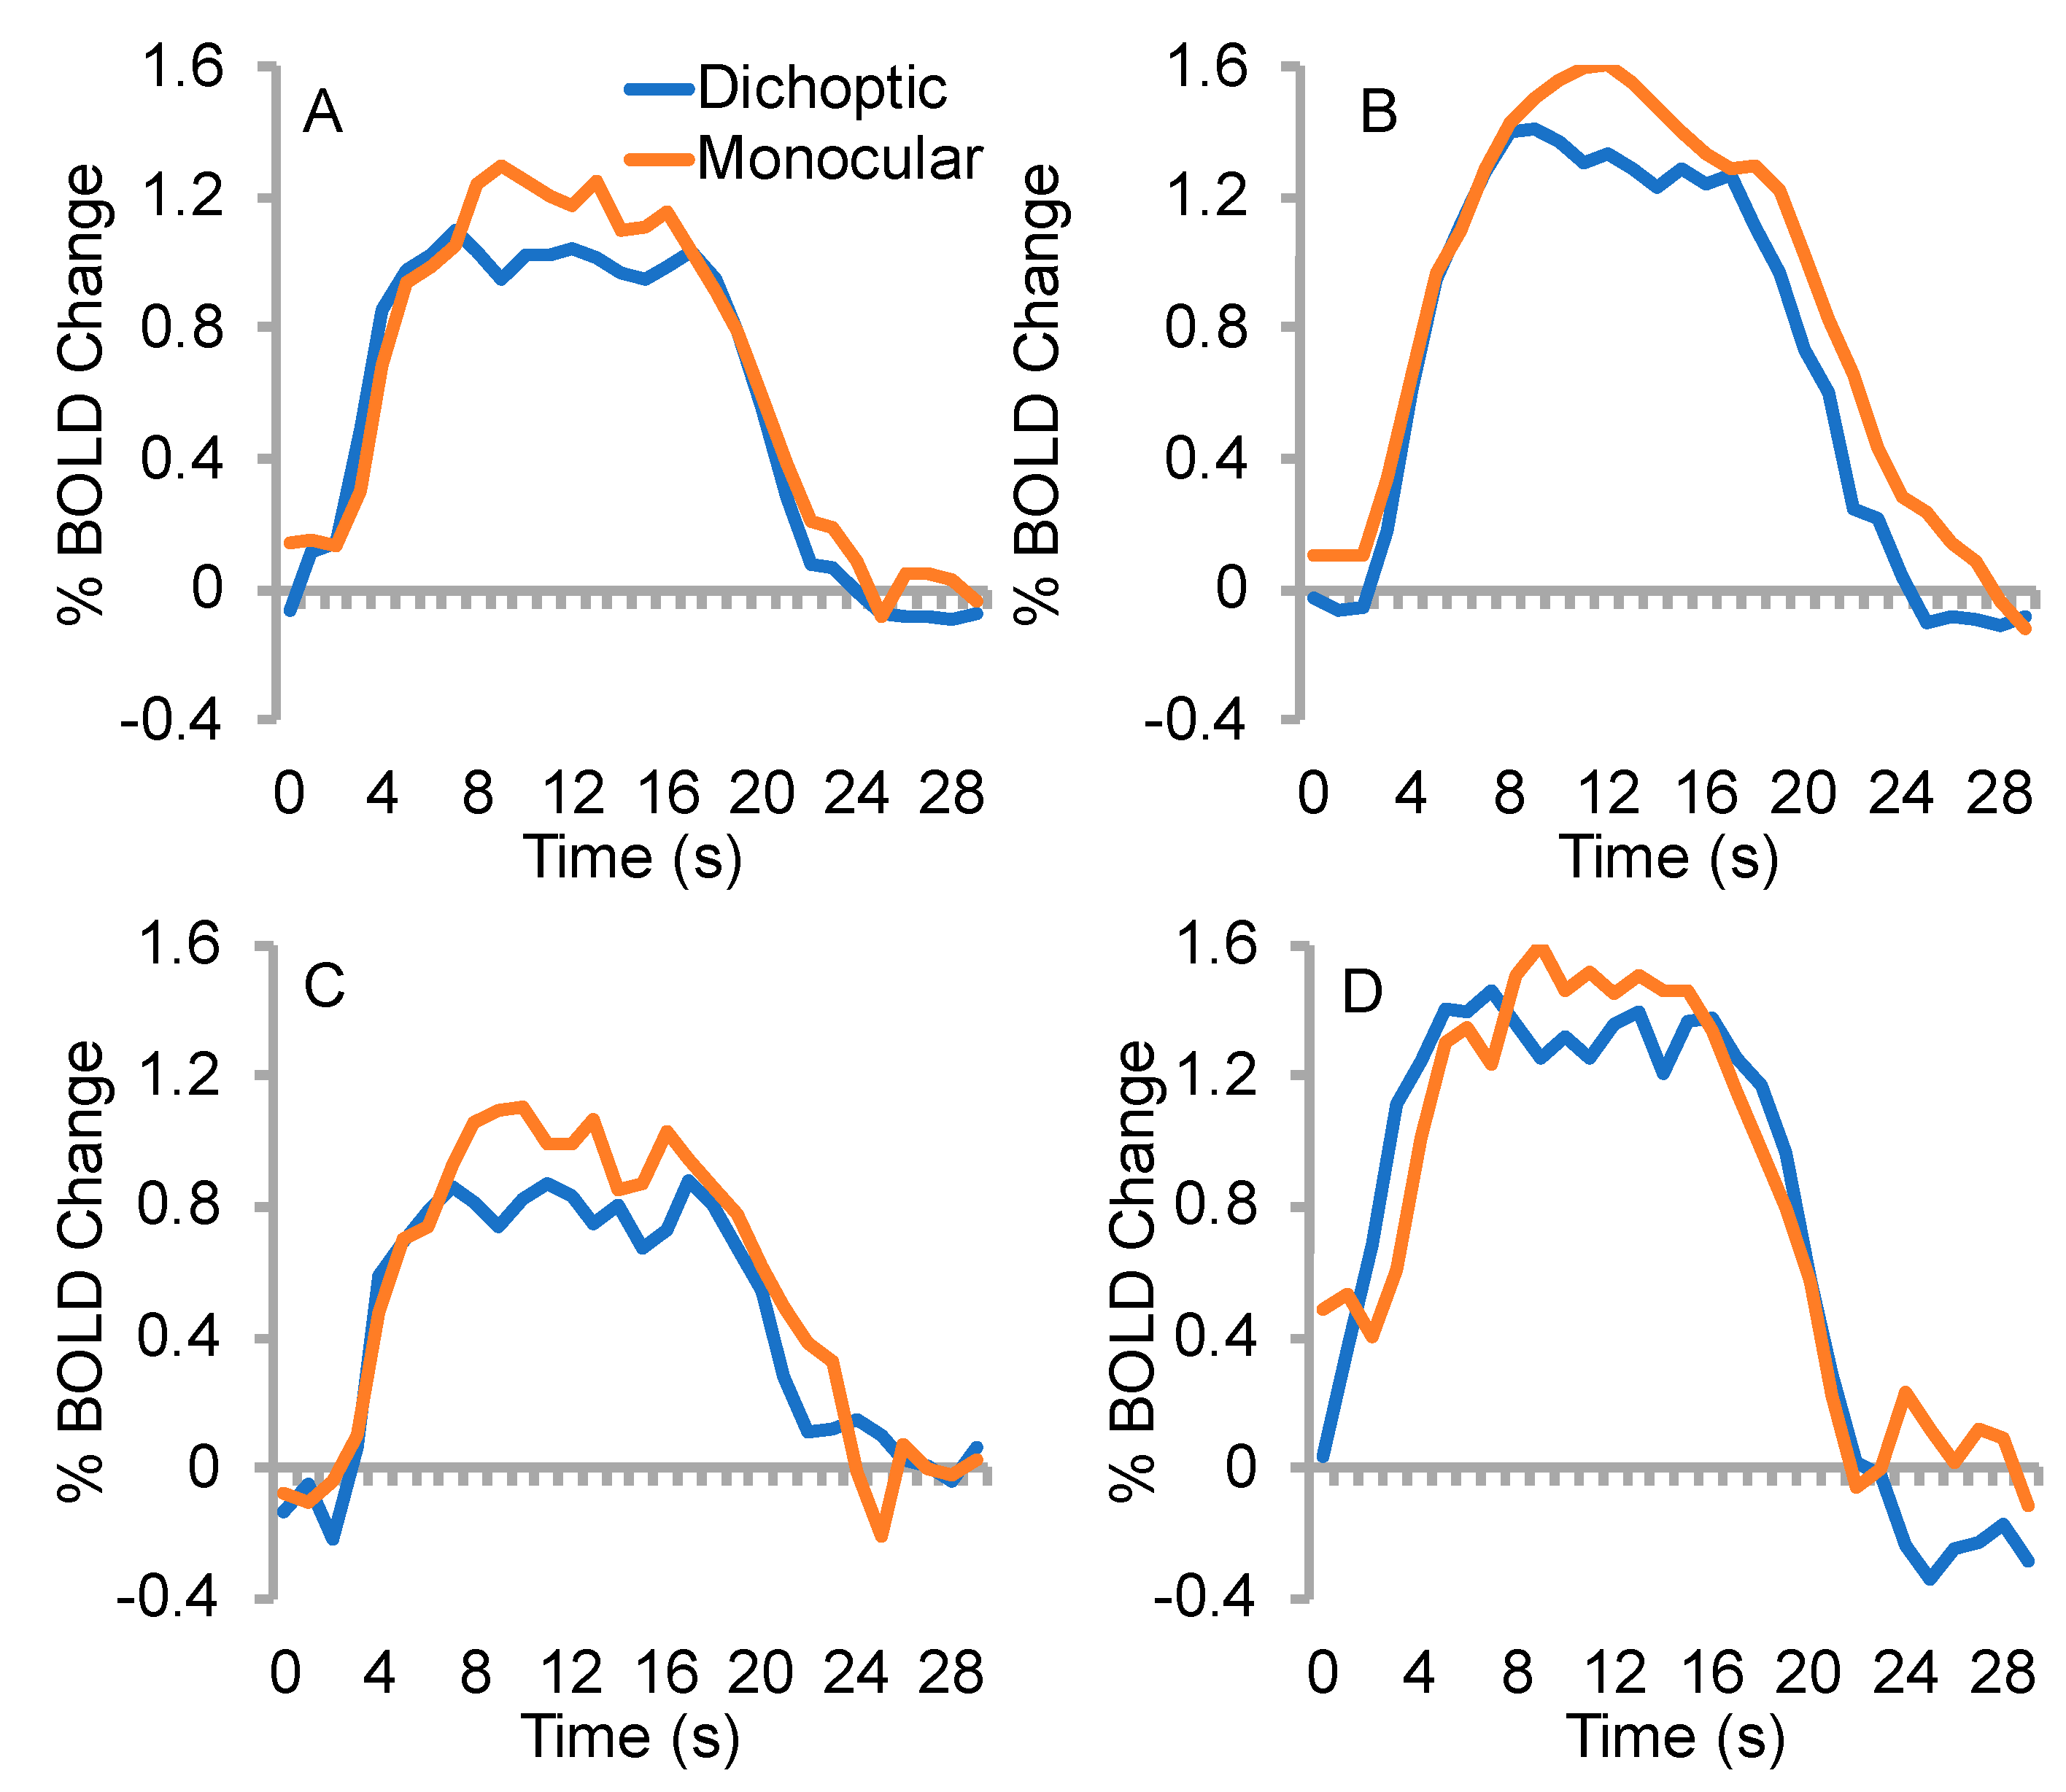
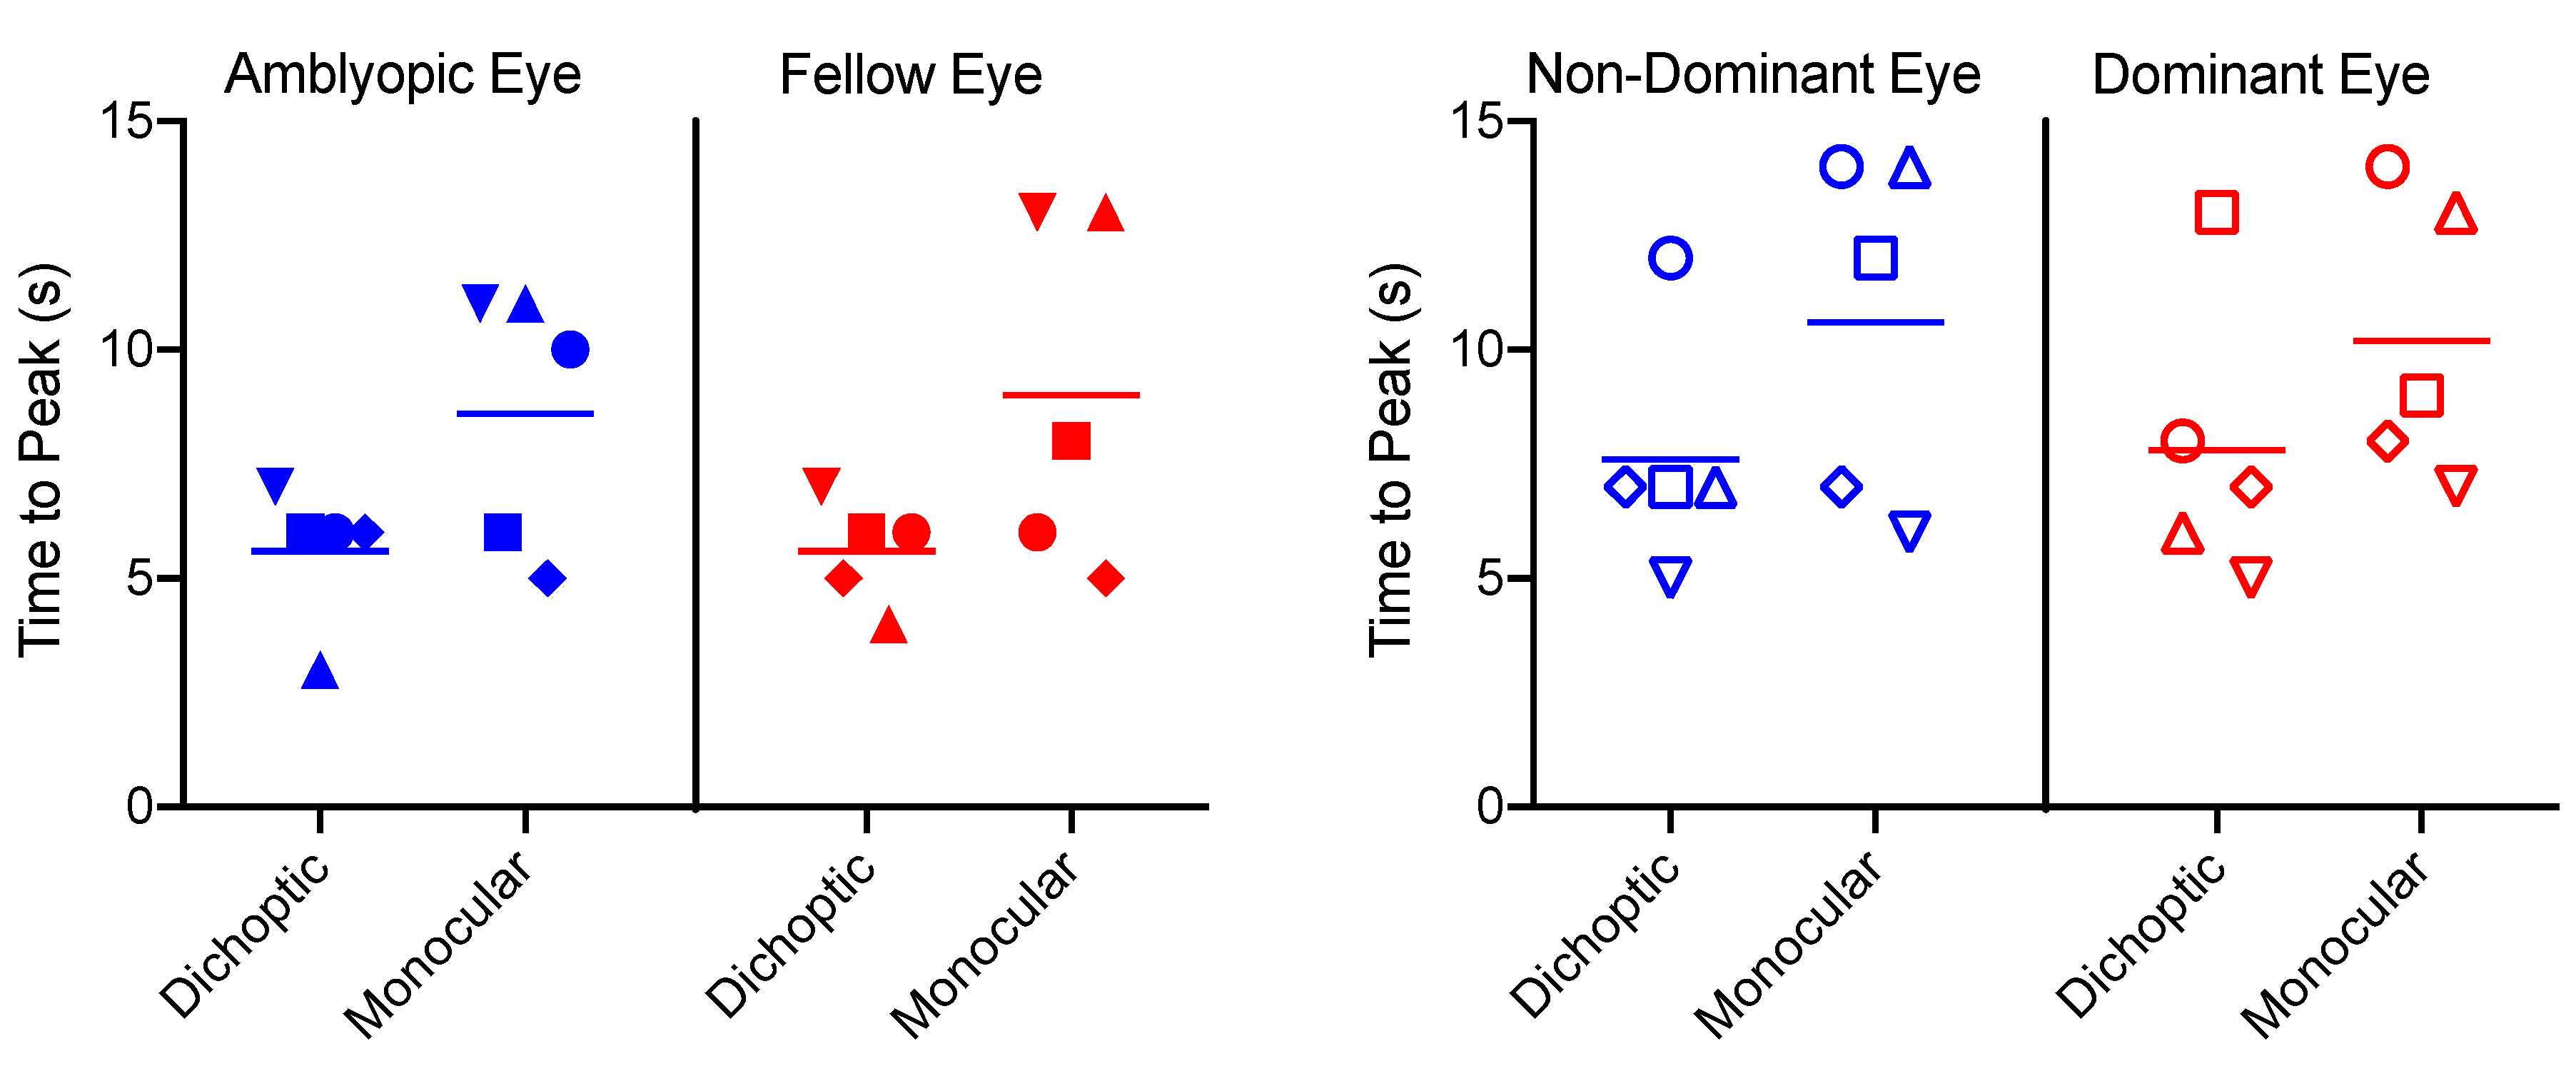
3.3. Time to Peak
3.4. Effective Connectivity
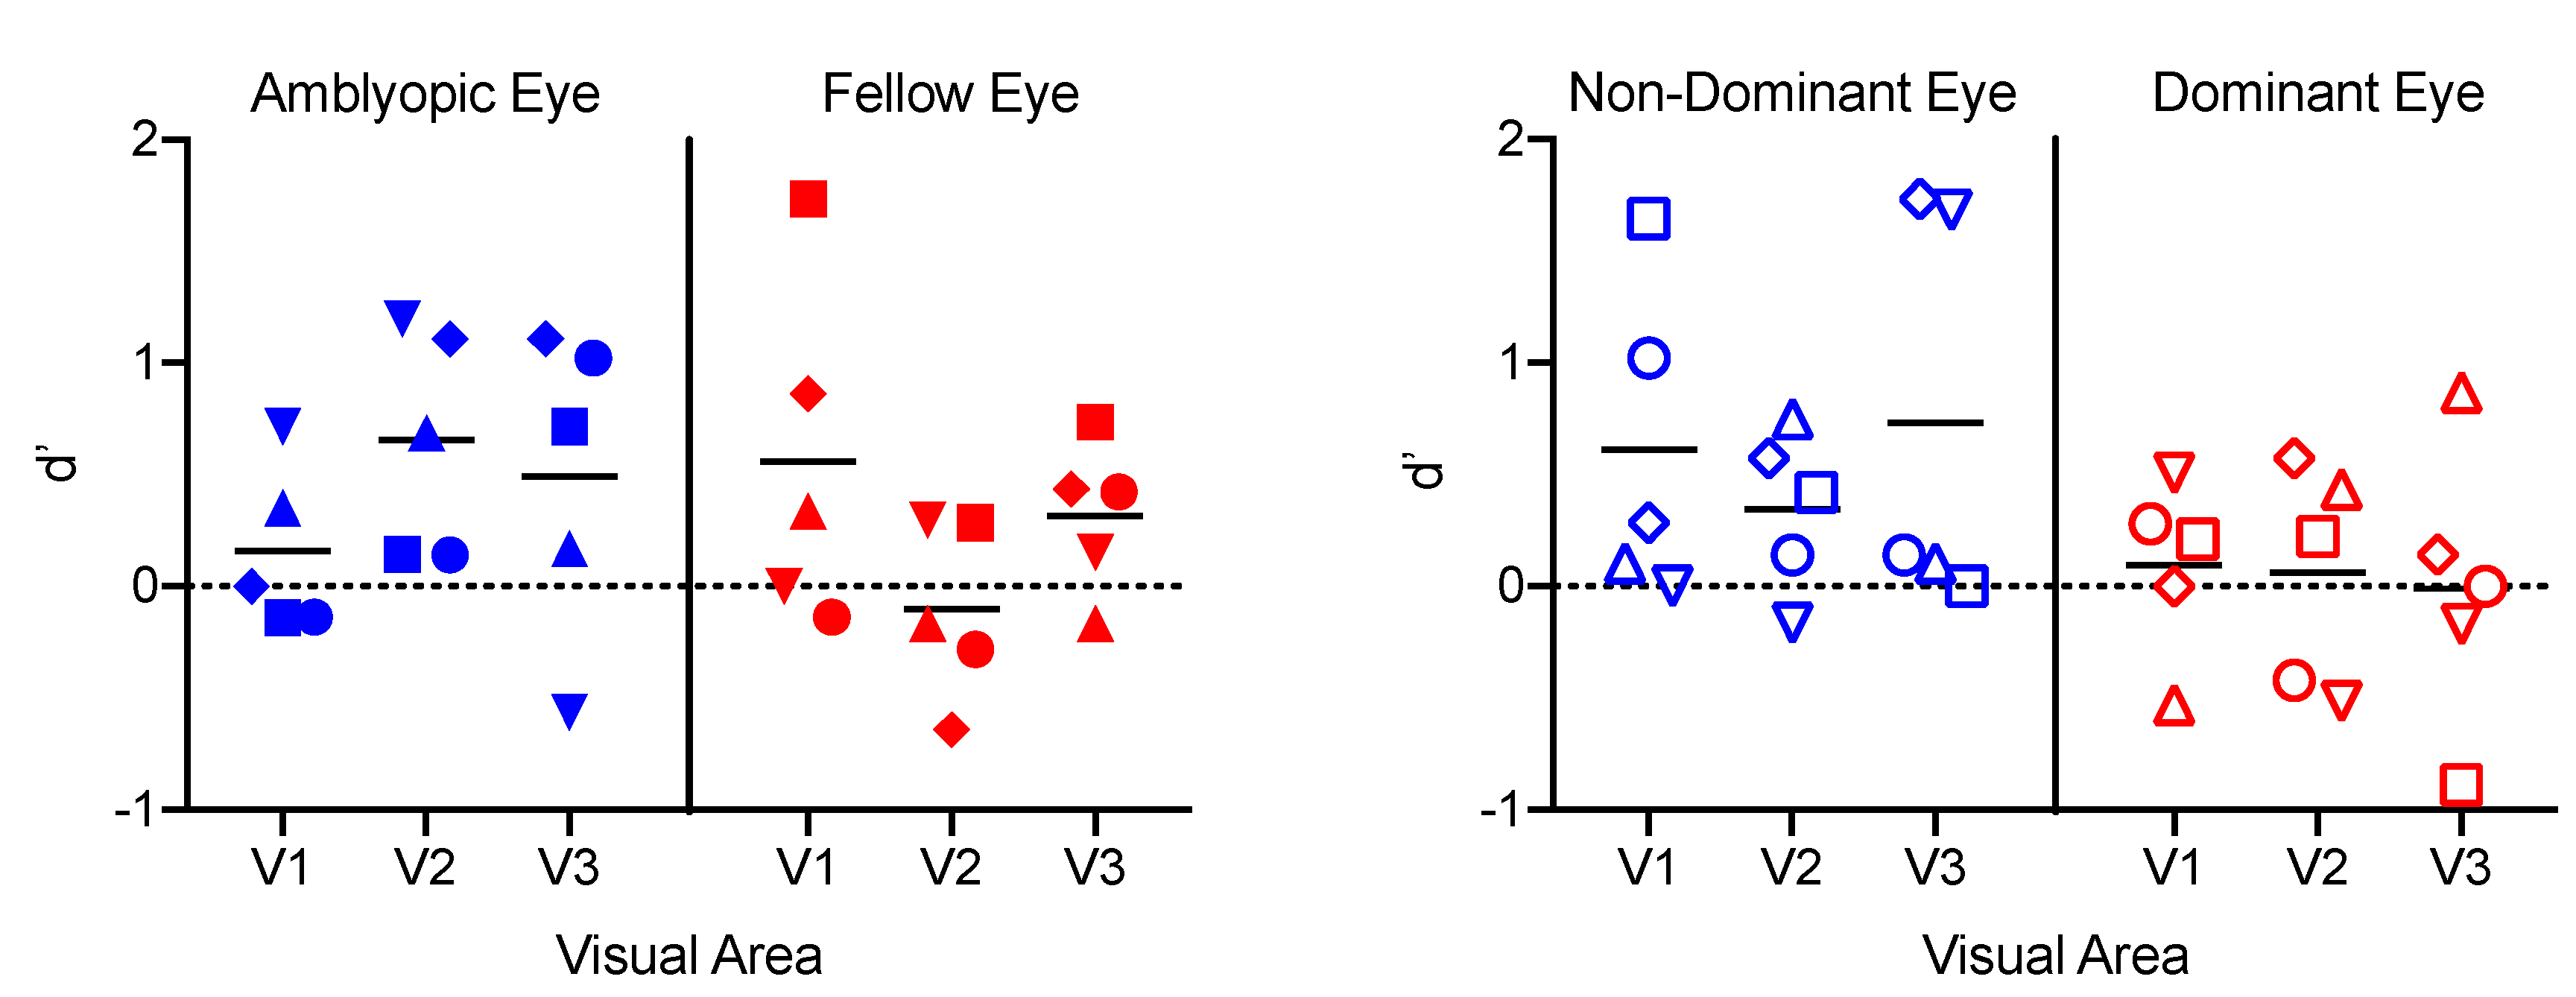
3.5. Classification Analyses
4. Discussion
5. Conclusions
Author Contributions
Acknowledgments
Conflicts of Interest
References
- Asper, L.; Crewther, D.; Crewther, S.G. Strabismic amblyopia. Part 1. Psychophysics. Clin. Exp. Optom. 2000, 83, 49–58. [Google Scholar] [CrossRef] [PubMed]
- Bonneh, Y.S.; Sagi, D.; Polat, U. Spatial and temporal crowding in amblyopia. Vis. Res. 2007, 47, 1950–1962. [Google Scholar] [CrossRef] [PubMed]
- Levi, D.M.; Klein, S.A. Vernier acuity, crowding and amblyopia. Vis. Res. 1985, 25, 979–991. [Google Scholar] [CrossRef]
- Je, S.; Ennis, F.A.; Woodhouse, J.M.; Sengpiel, F.; Redmond, T. Spatial summation across the visual field in strabismic and anisometropic amblyopia. Sci. Rep. 2018, 8, 3858. [Google Scholar] [CrossRef] [PubMed]
- Holmes, J.M.; Clarke, M.P. Amblyopia. Lancet 2006, 367, 1343–1351. [Google Scholar] [CrossRef]
- Hess, R.F.; Howell, E.R. The threshold contrast sensitivity function in strabismic amblyopia: Evidence for a two type classification. Vis. Res. 1977, 17, 1049–1055. [Google Scholar] [CrossRef]
- Simmers, A.J.; Ledgeway, T.; Hess, R.F.; McGraw, P.V. Deficits to global motion processing in human amblyopia. Vis. Res. 2003, 43, 729–738. [Google Scholar] [CrossRef]
- Simmers, A.J.; Ledgeway, T.; Mansouri, B.; Hutchinson, C.V.; Hess, R.F. The extent of the dorsal extra-striate deficit in amblyopia. Vis. Res. 2006, 46, 2571–2580. [Google Scholar] [CrossRef]
- Hamm, L.M.; Black, J.; Dai, S.; Thompson, B. Global processing in amblyopia: A review. Front. Psychol. 2014, 5, 583. [Google Scholar] [CrossRef]
- Hamm, L.; Chen, Z.; Li, J.; Black, J.; Dai, S.; Yuan, J.; Yu, M.; Thompson, B. Interocular suppression in children with deprivation amblyopia. Vis. Res. 2017, 133, 112–120. [Google Scholar] [CrossRef]
- Hess, R.F.; Thompson, B.; Baker, D.H. Binocular vision in amblyopia: Structure, suppression and plasticity. Ophthalmic Physiol. Opt. 2014, 34, 146–162. [Google Scholar] [CrossRef]
- Li, J.; Thompson, B.; Lam, C.S.; Deng, D.; Chan, L.Y.; Maehara, G.; Woo, G.C.; Yu, M.; Hess, R.F. The role of suppression in amblyopia. Investig. Ophthalmol. Vis. Sci. 2011, 52, 4169–4176. [Google Scholar] [CrossRef] [PubMed]
- Narasimhan, S.; Harrison, E.R.; Giaschi, D.E. Quantitative measurement of interocular suppression in children with amblyopia. Vis. Res. 2012, 66, 1–10. [Google Scholar] [CrossRef] [PubMed]
- Zhou, J.; Huang, P.C.; Hess, R.F. Interocular suppression in amblyopia for global orientation processing. J. Vis. 2013, 13, 19. [Google Scholar] [CrossRef] [PubMed]
- Chima, A.S.; Formankiewicz, M.A.; Waugh, S.J. Interocular suppression patterns in binocularly abnormal observers using luminance- and contrast-modulated noise stimuli. J. Vis. 2016, 16, 20. [Google Scholar] [CrossRef] [PubMed]
- Kwon, M.; Lu, Z.L.; Miller, A.; Kazlas, M.; Hunter, D.G.; Bex, P.J. Assessing binocular interaction in amblyopia and its clinical feasibility. PLoS ONE 2014, 9, e100156. [Google Scholar] [CrossRef]
- Babu, R.J.; Clavagnier, S.R.; Bobier, W.; Thompson, B.; Hess, R.F. The regional extent of suppression: Strabismics versus nonstrabismics. Investig. Ophthalmol. Vis. Sci. 2013, 54, 6585–6593. [Google Scholar] [CrossRef]
- Sengpiel, F.; Jirmann, K.U.; Vorobyov, V.; Eysel, U.T. Strabismic suppression is mediated by inhibitory interactions in the primary visual cortex. Cereb. Cortex 2006, 16, 1750–1758. [Google Scholar] [CrossRef]
- Bi, H.; Zhang, B.; Tao, X.; Harwerth, R.S.; Smith, E.L.R.; Chino, Y.M. Neuronal responses in visual area V2 (V2) of macaque monkeys with strabismic amblyopia. Cereb. Cortex 2011, 21, 2033–2045. [Google Scholar] [CrossRef]
- Wang, Y.; Zhang, B.; Tao, X.; Wensveen, J.M.; Smith, E.L.; Chino, Y.M. Noisy Spiking in Visual Area V2 of Amblyopic Monkeys. J. Neurosci. 2017, 37, 922–935. [Google Scholar] [CrossRef]
- Hallum, L.E.; Shooner, C.; Kumbhani, R.D.; Kelly, J.G.; Garcia-Marin, V.; Majaj, N.J.; Movshon, J.A.; Kiorpes, L. Altered balance of receptive field excitation and suppression in visual cortex of amblyopic macaque monkeys. J. Neurosci. 2017. [Google Scholar] [CrossRef] [PubMed]
- Shooner, C.; Hallum, L.E.; Kumbhani, R.D.; Garcia-Marin, V.; Kelly, J.G.; Majaj, N.J.; Movshon, J.A.; Kiorpes, L. Asymmetric dichoptic masking in visual cortex of amblyopic macaque monkeys. J. Neurosci. 2017. [Google Scholar] [CrossRef] [PubMed]
- Baker, D.H.; Meese, T.S.; Hess, R.F. Contrast masking in strabismic amblyopia: Attenuation, noise, interocular suppression and binocular summation. Vis. Res. 2008, 48, 1625–1640. [Google Scholar] [CrossRef] [PubMed]
- Conner, I.P.; Odom, J.V.; Schwartz, T.L.; Mendola, J.D. Monocular activation of V1 and V2 in amblyopic adults measured with functional magnetic resonance imaging. J. AAPOS 2007, 11, 341–350. [Google Scholar] [CrossRef] [PubMed]
- Farivar, R.; Thompson, B.; Mansouri, B.; Hess, R.F. Interocular suppression in strabismic amblyopia results in an attenuated and delayed hemodynamic response function in early visual cortex. J. Vis. 2011, 11. [Google Scholar] [CrossRef] [PubMed]
- Petrov, Y.; McKee, S.P. The effect of spatial configuration on surround suppression of contrast sensitivity. J. Vis. 2006, 6, 224–238. [Google Scholar] [CrossRef] [PubMed]
- Macknik, S.L.; Martinez-Conde, S. Dichoptic visual masking reveals that early binocular neurons exhibit weak interocular suppression: Implications for binocular vision and visual awareness. J. Cogn. Neurosci. 2004, 16, 1049–1059. [Google Scholar] [CrossRef]
- Maehara, G.; Thompson, B.; Mansouri, B.; Farivar, R.; Hess, R.F. The perceptual consequences of interocular suppression in amblyopia. Investig. Ophthalmol. Vis. Sci. 2011, 52, 9011–9017. [Google Scholar] [CrossRef]
- Babu, R.J.; Clavagnier, S.; Bobier, W.R.; Thompson, B.; Hess, R.F. Regional Extent of Peripheral Suppression in Amblyopia. Investig. Ophthalmol. Vis. Sci. 2017, 58, 2329–2340. [Google Scholar] [CrossRef]
- Huang, P.C.; Baker, D.H.; Hess, R.F. Interocular suppression in normal and amblyopic vision: Spatio-temporal properties. J. Vis. 2012, 12. [Google Scholar] [CrossRef]
- Sengpiel, F.; Blakemore, C. Interocular control of neuronal responsiveness in cat visual cortex. Nature 1994, 368, 847–850. [Google Scholar] [CrossRef] [PubMed]
- Ding, K.; Liu, Y.; Yan, X.; Lin, X.; Jiang, T. Altered functional connectivity of the primary visual cortex in subjects with amblyopia. Neural Plast. 2013, 2013, 612086. [Google Scholar] [CrossRef] [PubMed]
- Liang, M.; Xie, B.; Yang, H.; Yin, X.; Wang, H.; Yu, L.; He, S.; Wang, J. Altered interhemispheric functional connectivity in patients with anisometropic and strabismic amblyopia: A resting-state fMRI study. Neuroradiology 2017, 59, 517–524. [Google Scholar] [CrossRef]
- Mendola, J.D.; Lam, J.; Rosenstein, M.; Lewis, L.B.; Shmuel, A. Partial correlation analysis reveals abnormal retinotopically organized functional connectivity of visual areas in amblyopia. Neuroimage Clin. 2018, 18, 192–201. [Google Scholar] [CrossRef] [PubMed]
- Wang, T.; Li, Q.; Guo, M.; Peng, Y.; Qin, W.; Yu, C. Abnormal functional connectivity density in children with anisometropic amblyopia at resting-state. Brain Res. 2014, 1563, 41–51. [Google Scholar] [CrossRef] [PubMed]
- Li, X.; Mullen, K.T.; Thompson, B.; Hess, R.F. Effective connectivity anomalies in human amblyopia. Neuroimage 2011, 54, 505–516. [Google Scholar] [CrossRef] [PubMed]
- Wang, H.; Crewther, S.G.; Liang, M.; Laycock, R.; Yu, T.; Alexander, B.; Crewther, D.P.; Wang, J.; Yin, Z. Impaired Activation of Visual Attention Network for Motion Salience Is Accompanied by Reduced Functional Connectivity between Frontal Eye Fields and Visual Cortex in Strabismic Amblyopia. Front. Hum. Neurosci. 2017, 11, 195. [Google Scholar] [CrossRef]
- Norman, K.A.; Polyn, S.M.; Detre, G.J.; Haxby, J.V. Beyond mind-reading: Multi-voxel pattern analysis of fMRI data. Trends Cogn. Sci. 2006, 10, 424–430. [Google Scholar] [CrossRef]
- Thompson, B.; Farivar, R.; Hansen, B.C.; Hess, R.F. A dichoptic projection system for visual psychophysics in fMRI scanners. J. Neurosci. Methods 2008, 168, 71–75. [Google Scholar] [CrossRef]
- Barnes, G.R.; Li, X.; Thompson, B.; Singh, K.D.; Dumoulin, S.O.; Hess, R.F. Decreased gray matter concentration in the lateral geniculate nuclei in human amblyopes. Investig. Ophthalmol. Vis. Sci. 2010, 51, 1432–1438. [Google Scholar] [CrossRef]
- Li, X.; Dumoulin, S.O.; Mansouri, B.; Hess, R.F. The fidelity of the cortical retinotopic map in human amblyopia. Eur. J. Neurosci. 2007, 25, 1265–1277. [Google Scholar] [CrossRef] [PubMed]
- Shan, Z.Y.; Wright, M.J.; Thompson, P.M.; McMahon, K.L.; Blokland, G.G.; de Zubicaray, G.I.; Martin, N.G.; Vinkhuyzen, A.A.; Reutens, D.C. Modeling of the hemodynamic responses in block design fMRI studies. J. Cereb. Blood Flow Metab. 2014, 34, 316–324. [Google Scholar] [CrossRef]
- Li, X.; Marrelec, G.; Hess, R.F.; Benali, H. A nonlinear identification method to study effective connectivity in functional MRI. Med. Image Anal. 2010, 14, 30–38. [Google Scholar] [CrossRef]
- Huang, P.C.; Li, J.; Deng, D.; Yu, M.; Hess, R.F. Temporal synchrony deficits in amblyopia. Investig. Ophthalmol. Vis. Sci. 2012, 53, 8325–8332. [Google Scholar] [CrossRef] [PubMed]
- Chow, A.; Giaschi, D.; Thompson, B. Dichoptic Attentive Motion Tracking is Biased Toward the Nonamblyopic Eye in Strabismic Amblyopia. Investig. Ophthalmol. Vis. Sci. 2018, 59, 4572–4580. [Google Scholar] [CrossRef] [PubMed]
- Culham, J.C.; Brandt, S.A.; Cavanagh, P.; Kanwisher, N.G.; Dale, A.M.; Tootell, R.B. Cortical fMRI activation produced by attentive tracking of moving targets. J. Neurophysiol. 1998, 80, 2657–2670. [Google Scholar] [CrossRef] [PubMed]
- Chen, V.J.; Tarczy-Hornoch, K. Functional magnetic resonance imaging of binocular interactions in visual cortex in strabismus. J. Pediatr. Ophthalmol. Strab. 2011, 48, 366–374. [Google Scholar] [CrossRef]
- Baker, D.H.; Simard, M.; Saint-Amour, D.; Hess, R.F. Steady-State Contrast Response Functions Provide a Sensitive and Objective Index of Amblyopic Deficits. Investig. Ophthalmol. Vis. Sci. 2015, 56, 1208–1216. [Google Scholar] [CrossRef]
- Hess, R.F.; Bradley, A. Contrast perception above threshold is only minimally impaired in human amblyopia. Nature 1980, 287, 463–464. [Google Scholar] [CrossRef]


| Participant | Age | Type | Refraction | Acuity | Deviation | History, Stereo | Data Point |
|---|---|---|---|---|---|---|---|
| AR | 47/M | RE LE strab | Ø Ø | 20/20 20/50 | XT 1° | Detected age 6 y, no patching, no surgery, no stereopsis |  |
| RD | 49/M | RE LE strab | +3.00 DS +4.00 DS | 20/15 20/125 | ET 1° | Detected age 6 y, glasses 6 y, no other treatment, local stereopsis (200 arcsec) |  |
| GN | 30/M | RE mixed LE | +5.00–0.00 × 120° +3.50–1.00 × 75° | 20/70 20/20 | ET 8° | Detected age 2 y, strabismus surgery ages 2–6 y, no stereopsis |  |
| JG | 21/M | RE LE strab | −2.00–0.50 × 150 −1.00 DS | 20/20 20/100 | ET 3° | Detected age 5 y, patching for 3 y, no surgery, local stereopsis 200 arcsec |  |
| AS | 21/F | RE LE strab | Ø −0.5 DS | 20/160 20/20 | ET 15° | Detected age 4 y, patching at 4 y for 6 m, surgery at 7 y, no stereopsis |  |
© 2019 by the authors. Licensee MDPI, Basel, Switzerland. This article is an open access article distributed under the terms and conditions of the Creative Commons Attribution (CC BY) license (http://creativecommons.org/licenses/by/4.0/).
Share and Cite
Thompson, B.; Maehara, G.; Goddard, E.; Farivar, R.; Mansouri, B.; Hess, R.F. Long-Range Interocular Suppression in Adults with Strabismic Amblyopia: A Pilot fMRI Study. Vision 2019, 3, 2. https://doi.org/10.3390/vision3010002
Thompson B, Maehara G, Goddard E, Farivar R, Mansouri B, Hess RF. Long-Range Interocular Suppression in Adults with Strabismic Amblyopia: A Pilot fMRI Study. Vision. 2019; 3(1):2. https://doi.org/10.3390/vision3010002
Chicago/Turabian StyleThompson, Benjamin, Goro Maehara, Erin Goddard, Reza Farivar, Behzad Mansouri, and Robert F. Hess. 2019. "Long-Range Interocular Suppression in Adults with Strabismic Amblyopia: A Pilot fMRI Study" Vision 3, no. 1: 2. https://doi.org/10.3390/vision3010002
APA StyleThompson, B., Maehara, G., Goddard, E., Farivar, R., Mansouri, B., & Hess, R. F. (2019). Long-Range Interocular Suppression in Adults with Strabismic Amblyopia: A Pilot fMRI Study. Vision, 3(1), 2. https://doi.org/10.3390/vision3010002