Article

The First Lactate Threshold Is a Limit for Heavy Occupational Work

1
Private Clinic Maria Hilf, Radetzkystraße 35, 9020 Klagenfurt, Austria
2
Center for Occupational Medicine AMEZ, Hergottwiesgasse 149, 8055 Graz, Austria
3
Medical University of Graz, Auenbruggerplatz 2, 8036 Graz, Austria
4
Institute of Human Movement Science, Sport and Health, University of Graz, Max-Mell-Allee 11, 8010 Graz, Austria
*
Author to whom correspondence should be addressed.
J. Funct. Morphol. Kinesiol. 2020, 5(3), 66; https://doi.org/10.3390/jfmk5030066
Submission received: 6 July 2020 / Revised: 20 August 2020 / Accepted: 21 August 2020 / Published: 25 August 2020

Abstract

:
Long-term heavy physical work often leads to early retirement and disability pension due to chronic overload, with a need to define upper limits. The aim of this study was to evaluate the value of the first lactate threshold (LTP1) as a physiological marker for heavy occupational work. A total of 188 male and 52 female workers performed an incremental cycle ergometer test to determine maximal exercise performance and the first and second lactate (LTP1; LTP2) and ventilatory thresholds (VT1; VT2). Heart rate (HR) recordings were obtained during one eight-hour shift (HR8h) and oxygen uptake was measured during 20 minutes of a representative work phase. Energy expenditure (EE) was calculated from gas-exchange measures. Maximal power output (Pmax), maximal oxygen consumption (VO2 max) and power output at LTP1 and LTP2 were significantly different between male and female workers. HR8h was not significantly different between male and female workers. A significant relationship was found between Pmax and power output at LTP1. HR8h as a percentage of maximum HR significantly declined with increasing performance (Pmax:r = −0.56; p < 0.01; PLTP1:r = −0.49; p < 0.01). Despite different cardio-respiratory fitness-levels; 95.4% of all workers performed their usual work below LTP1. It is therefore suggested that LTP1 represents the upper limit for sustained heavy occupational work; which supports its use to determine work capability and assessing the limits of heavy occupational work.

1. Introduction

Chronic overload during long-term heavy occupational work was shown to be related to early retirement due to cardiovascular diseases, disability pension and all-cause mortality [1,2,3,4]. It is therefore of great interest to determine the limits for heavy work and the fitness requirements of workers performing such heavy work [5]. Additionally, the individual fitness status of workers has been prescribed to have a significant impact on health. It was shown that with each 10% increase in individual strain during work, the risk of heart attacks in healthy male individuals increases by 18% indicating the importance of individual performance [6] and normal weight [1]. In summary there is strong evidence from the literature, that a permanent high strain level due to heavy work is harmful to health. To prevent workers from overload, physiological limits for heavy work have been set up. These limits define the maximal sustainable workload, which should not be exceeded permanently during the working time and are usually defined as upper limits for physiological performance [7,8,9].
The most frequently applied variables as a limit for heavy work are heart rate (HR), oxygen uptake (VO2) and work-related energy expenditure (WEE). Most limits, however, only prescribe the external workload, but do not give an adequate measure of the individual strain of a person. An accepted limit for heavy work was prescribed to be 110 b·min−1 [10]. Working below this limit should prevent workers from developing cumulative fatigue. However, several studies showed that work can also be sustained above this limit [11,12]. Additional frequently applied limits are prescribed as a percentage of maximal oxygen uptake (% VO2 max) or maximal heart rate (% HRmax) which represent the individual strain of a person. An accepted% VO2 max limit for heavy work was prescribed to be 33% [7]. However, this value does not represent an individual limit which has already been discussed [13]. Additionally, it was shown, that the same % VO2 max [14] or % HRmax [15], do not represent the same strain when related to validated threshold markers [16]. For instance, an exercise intensity of 85% HRmax causes different metabolic and cardio-respiratory responses across individuals [17], indicating that % VO2 max and % HRmax targets are also limited [5].
It is therefore essential to define a marker, which is a valid parameter of individual strain, physiologically justifiable and can be applied to heavy work. A suitable physiological marker for high-volume continuous loads is the first increase in blood lactate concentration (LTP1) in an incremental cycle ergometer test originally prescribed as “anaerobic threshold” [18]. Later on, a three-phase energy supply according to the shuttle theory of Brooks [19], has been prescribed including a second threshold of lactate (LTP2) or ventilation (VT2) [16,17]. Figure 1 shows the time course of blood lactate concentration [20,21] and both thresholds (LTP1, LTP2) dividing three distinct phases of energy supply which have been validated recently [22].
Due to the long duration of occupational work, usually eight hours or even longer, the low intensity range is most relevant. To sustain long-term work low cardio-respiratory and metabolic strain are essential conditions to avoid acute and chronic overload. Intensities below LTP1 represent a balance of lactate production and oxidation with low cardio-respiratory strain. Exceeding LTP1, leads to a significant increase in most if not all physiological variables indicating a stress reaction clearly limiting duration [23]. Below LTP1 there is just a withdrawal of the parasympathetic influence reaching its minimum at the LTP1 [24]. Above LTP1, sympathetic drive increases, indicated by a rise in catecholamines and related variables [17,22]. Moser et al. [22], nicely showed that catecholamine levels did not increase above baseline values if workload was below LTP1 during constant load cycling and just slightly increased with high intensity intervals if the mean load was below LTP1. It is therefore obvious that exceeding LTP1 clearly reduces time to fatigue [23]. Furthermore, workloads above LTP1 rely on a greater carbohydrate consumption, also limiting time to fatigue, as an energy deficit will be reached within a few hours [25]. Working at intensities below LTP1, prolongs performance time substantially which has been shown in ultra-distance athletes cycling 24 h at a workload clearly below LTP1 [26]. Similar has been shown by Tipton et al. [9], prescribing the physical performance limit with no increase in blood lactate corresponding to the LTP1. Additionally, Kunutsor et al. [27], showed that a higher oxygen-uptake capacity at a threshold equivalent to LTP1 was associated with a lower risk of cardiovascular disease and all-cause mortality. However, the absolute limits for specific occupations still need to be analyzed in detail. We therefore suggest, that LTP1 may serve as an individual upper limit for heavy occupational work. We hypothesized that all workers stay below the LTP1 limit during their work shift and that the relative strain is related to individual performance. Therefore, the aim of this study was to evaluate LTP1 as a physiological marker for the upper limit of heavy occupational work in male (m) and female (f) workers.

2. Materials and Methods

The study was approved by the local ethics committee of the Medical University (EK number 26-488 ex 13/14, 10.09.2014). Informed consent was obtained from all subjects who underwent a comprehensive medical examination by the leading physician of the study before the start of the tests. In addition to a detailed medical history and a survey on exclusion criteria such as medication, pre-existing illnesses and movement restrictions, a resting electrocardiogram (ECG) was performed in all participating subjects. A total of 240 male (m: N = 188) and female (f: N = 52) subjects from six different occupations (metalworkers, workers in butchery, garbage collectors, cabinet maker, physiotherapists and masseurs) classified as “heavy work” by law, participated in the study (Table 1).

2.1. Incremental Cycle Ergometer Test

Subjects performance was determined by means of a maximal incremental cycle ergometer exercise test using an electronically braked, computer-controlled ergometer (Monark 839E, Monark Exercise AB, Vansbro, Sweden). Workload started at 40 Watt (W) (m) or 20 W (f) and was increased by 20 W (m) or 15 W (f) every minute. This protocol is the recommended protocol of the local Society of Cardiology to determine maximal power output (Pmax) among young and healthy people [28]. The heart rate (HR) and a 12-lead ECG were measured continuously, and blood pressure was manually measured at each workload for safety reasons (not shown). At rest, after each workload and after 3 minutes of recovery capillary blood (20 μL) was taken to determine blood lactate concentration (BIOSEN S-Line, Lab +, EKF Diagnostic GmbH, Barleben, Germany) for further analyses. Both, LTP1 and LTP2 were assessed by means of computer-aided linear regression breakpoint analysis. LTP1 was defined as the first increase in blood lactate concentration (La) above baseline [29], according to the “anaerobic threshold” [18]. Respiratory gas exchange was measured continuously throughout the complete test (Metalyzer 3B-R2, Cortex Biophysik, Germany) and the first (VT1) and the second (VT2) ventilatory turn points [30], were determined with a standard software (MetaSoft version 3.9.7 SR5, Cortex Biophysik, Leipzig, Germany). VT1 was defined as the first increase in ventilation accompanied by an increase in the equivalent for oxygen uptake (VE/VO2) without an increase in the equivalent for carbon dioxide output (VE/VCO2). VT2 was defined as the second abrupt increase in ventilation accompanied by an increase in both VE/VO2 and VE/VCO2. Pmax and maximal oxygen uptake (VO2 max) were compared to standard values (Pmax-target, VO2 max-target) by age, height, weight and gender [28].

2.2. Measurements during Work

HR was recorded continuously during the eight hours of working time (HR8h) with a commercial heart rate monitor (Polar S610, Polar Electro, Kempele, Finland). Oxygen uptake (VO2) and carbon dioxide output (VCO2) were measured during 20 min of a representative work phase (VO2 20, VCO2 20) with a portable device (Metamax 3B, Cortex Biophysik, Leipzig, Germany). The calibration of the system was carried out before each test according to the specifications of the manufacturer. Pressure calibration for ambient air pressure was carried out with a digital reference barometer and the volume sensor (Triple-VR turbine) was calibrated with a 3-L calibration pump (Hans Rudolph, Inc., Shawnee, Kansas, USA). Gas-sensor calibration was carried out with a mixed test gas (15 vol% O2, 5 vol% CO2, balance N2) and ambient air according to the calibration manual of the manufacturer (Cortex, MetaMaxR 3B and MetalyzerR 3B). Working energy expenditure (WEE) was calculated by means of indirect calorimetry using the 20-min gas-exchange measurement during a representative work phase [31] and adjusted for mean 8 h HR.

2.3. Statistical Analysis

Data were processed with Microsoft Excel 2013 and Winstat Statistics Version 3.1 (Winstat, Kalmia Corp., Cambridge, MA, USA). The graphic representations were edited with GraphPad Prism software (GraphPad version 5.01, San Diego, CA, USA). All data are presented as mean values with standard deviation (±SD) and data were evaluated for normal distribution (Kolmogorov–Smirnov test). Relationships between variables were evaluated by linear regression analyses and Pearson’s correlation coefficient was determined where appropriate. Differences between groups were analyzed by means of variance analysis (ANOVA) and Tukey’s post hoc analysis and Pearson’s product moment correlation were used to calculate the relationship between variables. The effect size was calculated as Hedges’ g [32]. An error probability less than 5% (p < 0.05) was accepted.

3. Results

Male and female workers were not significantly different for age and body mass index (BMI), but for height and weight (Table 1). Male subjects were slightly overweight compared to normal weight female subjects [33].

3.1. Incremental Cycle Ergometer Test

Results of the incremental cycle ergometer tests are presented in Table 2 and Table 3. Male subjects had a significantly higher Pmax and VO2 max but were significantly lower compared to standard target values (Table 2). No significant differences were found for HRmax and the maximal respiratory exchange ratio (RERmax), suggesting a similar strain for both male and female subjects. Maximal blood lactate concentration (Lamax) was slightly, but significantly lower in female subjects. Male subjects reached significantly higher power output and oxygen-uptake values at LTP1 (PLTP1, VO2 LTP1) and VT1 (PVT1 VO2 VT1), but lactate and ventilatory thresholds were not significantly different. PLTP1 as a percentage of Pmax was significantly higher in male, but VO2 LTP1 as a percentage of VO2 max was significantly higher in female subjects. (Table 3). HR values at LTP1 were significantly higher in female subjects. Additionally, % HRmax reached significantly higher values for LTP1 and VT1 in the female group. No significant differences between male and female subjects were found for blood lactate concentration at LTP1 and VT1. Power output and oxygen uptake at LTP2 and VT2 were significantly higher for male compared to female subjects, but the respective percentages of VO2 max were significantly lower in the male group. No significant differences between groups were found for HR and La at LTP2 and VT2.

3.2. Measurements during Work

The HR8h of both female and male subjects were below the LTP1 (Table 4). The time course of HR for a highly fit (LTP1 = 125 W) and a low fit (LTP1 = 81 W) subject, during eight hours of working showed, that the high-fit and the low-fit person achieved a mean HR (109 vs. 123 b·min−1) which corresponded to 100% and 101% of the individual HR at the LTP1, respectively. Despite different fitness, both subjects achieved almost identical relative strain values with significantly different absolute HR values (p < 0.05). VO2 LTP1 was significantly related to VO2 max (r = 0.86, p < 0.01) similar to PLTP1 and Pmax (r = 0.87, p < 0.01) (Figure 2). HR8h as a percentage of HRmax was significantly related to Pmax (r = −0.56, p < 0.01), VO2 max (r = −0.41, p < 0.01) and PLTP1 (r = −0.49, p < 0.01). No statistically significant relationship was found between age and PLTP1 (r = 0.02, p = 0.37) and VO2 20 (r = −0.04, p = 0.27).
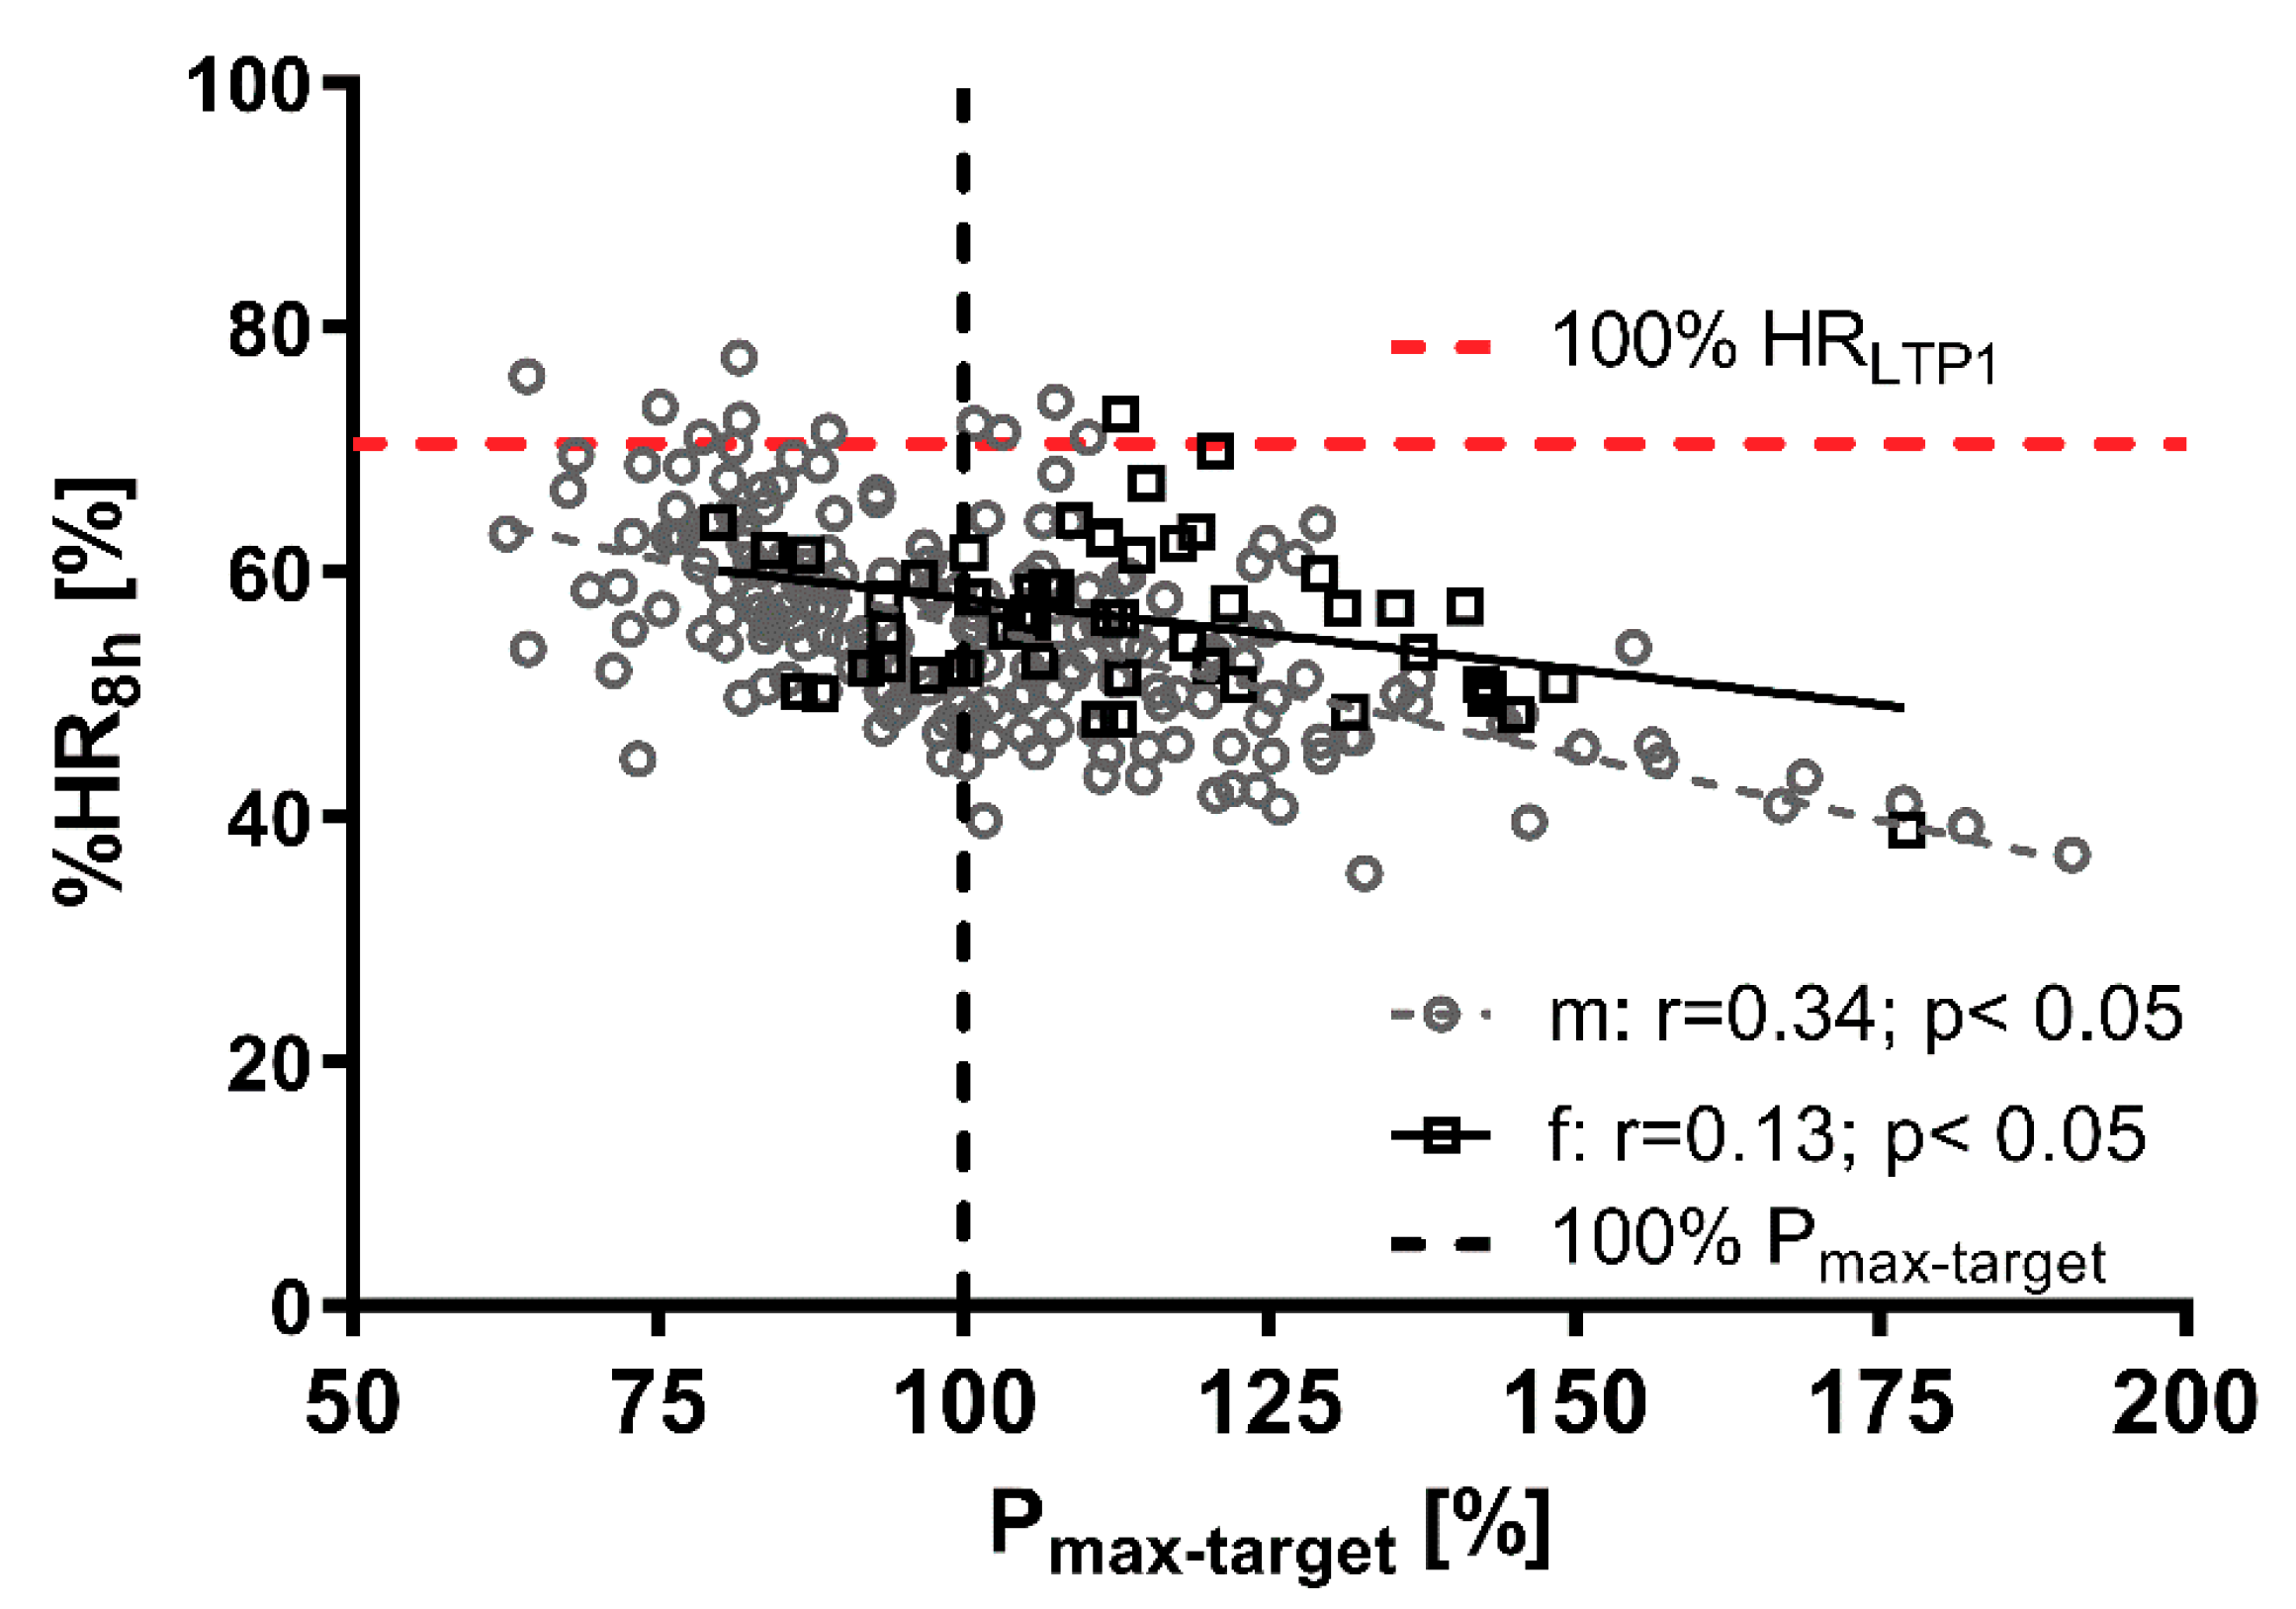
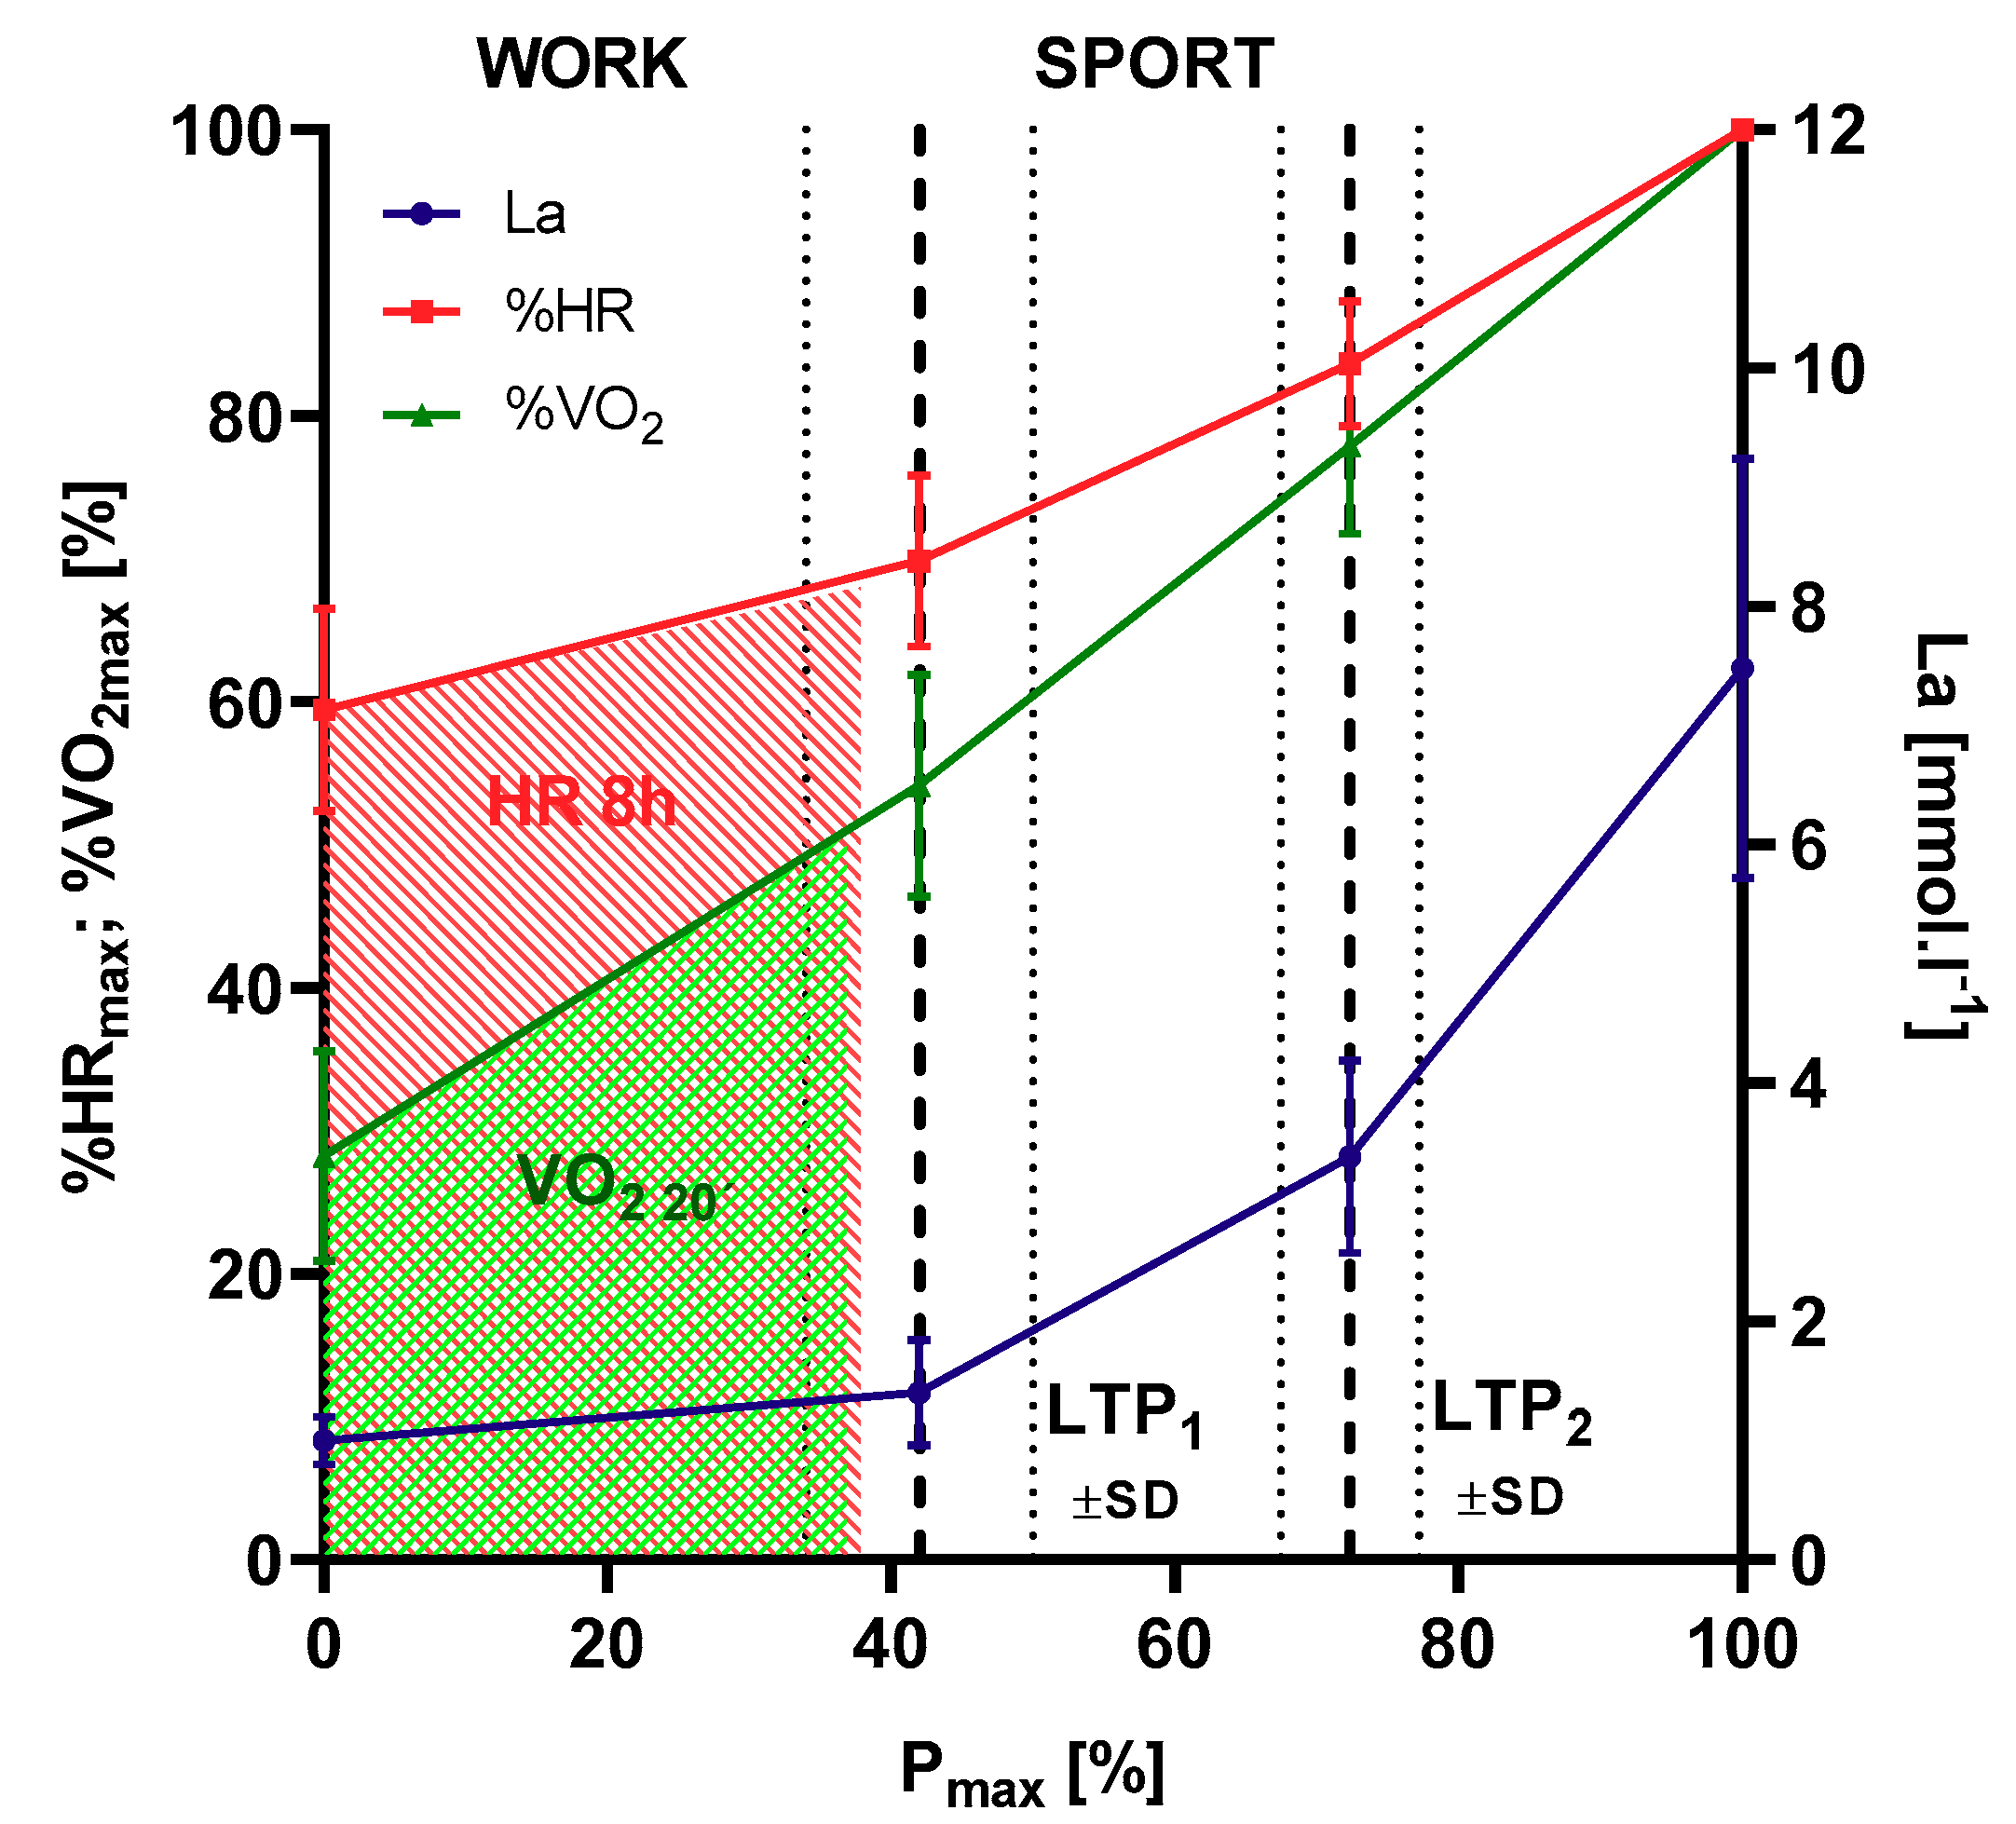
Figure 3 shows the relationship between HR8h as a percentage of HRmax and power output as a percentage of target standard power output (Pmax-target) from the incremental cycle ergometer test as well as the mean individual HR limit at LTP1 (100% HRLTP1) during the working activity. In total, 95.4% of all female and male workers stayed below the individual LTP1 during their working hours and there was a significant relationship between performance at LTP1 and work-related strain. Highly fit individuals (>120% Pmax-target) were less prone to overreach the LTP1 limit compared to less fit individuals, but standard target exercise performance (100% Pmax-target) seems to be sufficient to stay below this limit on average (Figure 4). Contrary to traditional sports and exercise (except ultra-distance events), heavy occupational work intensity is limited by LTP1 performance.
The minimum power output at LTP1 for female and male workers in the incremental cycle ergometer test was found to be 60 W (f) and 100 W (m) to stay below the individual LTP1 during heavy occupational work with a 10% safety tolerance. This power output at LTP1 represents 115 ± 19.6% in the female and 106 ± 23.7% in the male subjects of standard target performance to safely perform heavy occupational work.

4. Discussion

Eighty-one subjects presented a normal standard exercise performance (90–110% Pmax-target), 90 subjects were above (>110% Pmax-target) and 69 subjects were below the target (<90% Pmax-target) at the incremental cycle ergometer exercise test. Female workers reached 113.9 ± 19.4% of the target power output, which was significantly higher compared to the male workers who reached 102.5 ± 23.1%. Female workers presented a lower absolute performance than male (Figure 2) and are suggested to have a higher strain during work (Figure 3). This could impose some training effects due to the higher demands for the female subjects during work [34], although no adaptive processes due to heavy work in male workers were shown [35]. Obviously, female workers need to be more fit in relative terms than their male counterparts. Overall, the results of the incremental cycle ergometer exercise tests are within normal limits and comparable to other studies [5].

4.1. Measurements during Work

Average HR during the investigated work activities were clearly below the accepted limit of 110 b·min−1 for heavy work [10,36]. Studies in steel-workers showed significantly higher HR values with an average HR8h of 108 b·min−1 [37], similar to steel-foundry work with HR-values from 112 to 135 b·min−1 [11]. These higher HR values in the steel industry are suggested to be caused by higher thermal loads, similar to those observed in firefighters [12]. As no occupations with imposed heat have been included in the study, these comparisons have to be taken with care. Comparable to our study, Anjos et al. [38] and Preisser et al. [13], prescribed a mean HR of 104.0 ± 11.7 and 100.2 ± 11.9 b·min−1 for garbage collection work similar to the study by Wakui [39], showing a HR of 98.0 ± 14.0 b·min−1 in nurses at day-work. As it was not possible to obtain 8-h oxygen-uptake measures we measured only 20 min of representative work and compared the mean HR during this phase (HR20) to the overall 8-h HR (HR8h). HR20 was significantly related to HR8h (m:r = 0.76, f:r = 0.55, p < 0.05) and was therefore regarded as representative for the whole shift as shown earlier [5]. For both female (1.1 b·min−1) and male (3.3 b·min−1) workers, mean HR20 was slightly, but not significantly higher compared to HR8h. The slightly higher HR20 values can be explained by the fact that the subjects worked continuously during the 20 min measurement period without any interruptions. During eight-hours of working however, there are work-related interruptions and breaks lowering overall mean HR8h. Similar result have been shown already by Wultsch et al. [5], confirming our approach. Additionally, the impact of the devices needs to be considered. Carrying a respiratory mask for gas-exchange measurements is an unfamiliar task which may lead to a non-economic breathing accompanied by an increased ventilation, carbon dioxide exhalation and HR [8]. Differences in power output at the LTP1 were significantly related to strain levels during the work. As the different strain can also be caused by different workloads chosen freely by the workers, it was an unexpectedly strict relationship indicating that each individual worker was able and allowed to set his workload with respect to their performance capability.

4.2. Oxygen Uptake

In the 20 min of VO2 measurement during a representative phase of work, female subjects reached a significantly lower mean VO2 (0.72 ± 0.25 L·min−1) compared to the male workers (1.0 ± 0.3 L·min−1). These results are commonly accepted and agree to prescribed limits for heavy occupational work from the literature prescribed as 0.7 L·min−1 for female and 1.0 L·min−1 for male workers (10,40). Similar results have been shown for male construction workers with 0.92 ± 0.19 L·min−1 (14) and for workers of different professions with 0.73 ± 0.29 L·min−1 for female and 1.13 ± 0.35 L·min−1 for male workers [5]. Callea et al. [37], investigated workers during the apple harvest and found VO2 values of 1.37 ± 0.46 L·min−1 for male and 1.12 ± 0.46 L·min−1 for female harvesters. The results for the male subjects are similar to the present study, but higher for the female subjects. It may be explained by the fact that this work is temporary, and it is suggested that the female workers were somehow forced to keep up with the male workers. Comparing our results to the usual 33% VO2 max limit for heavy work, measures for female (37.8% VO2 max) and male (35.3% VO2 max) subjects were above the accepted limits [7,40]. As the difference between female and male subjects was not statistically significant, we suggest that workers individually adapt the workload to their individual performance abilities as long as the workload can be chosen freely. This 33% VO2 max limit has been critically discussed and we may suggest this limit to be too low [5], as workers are able to perform their work at higher intensities as shown in our study. Additionally, since this arbitrary value does not represent a physiologically justifiable limit compared to individual thresholds such as the LTP1 and VT1 [13]. This argument is strengthened by studies in fisherman showing comparable relative VO2 max values to our study at 34–39% [41] and 39% [42], as well as from a study in garbage workers showing a range of 35–69% [13]. Despite the significantly better fitness status of male workers compared to the female, females worked at similar relative values of VO2 max. It is therefore obvious that females need a significantly higher fitness level for a similar workload in order to be able to tolerate the same heavy workload [43,44].

4.3. Energy Expenditure

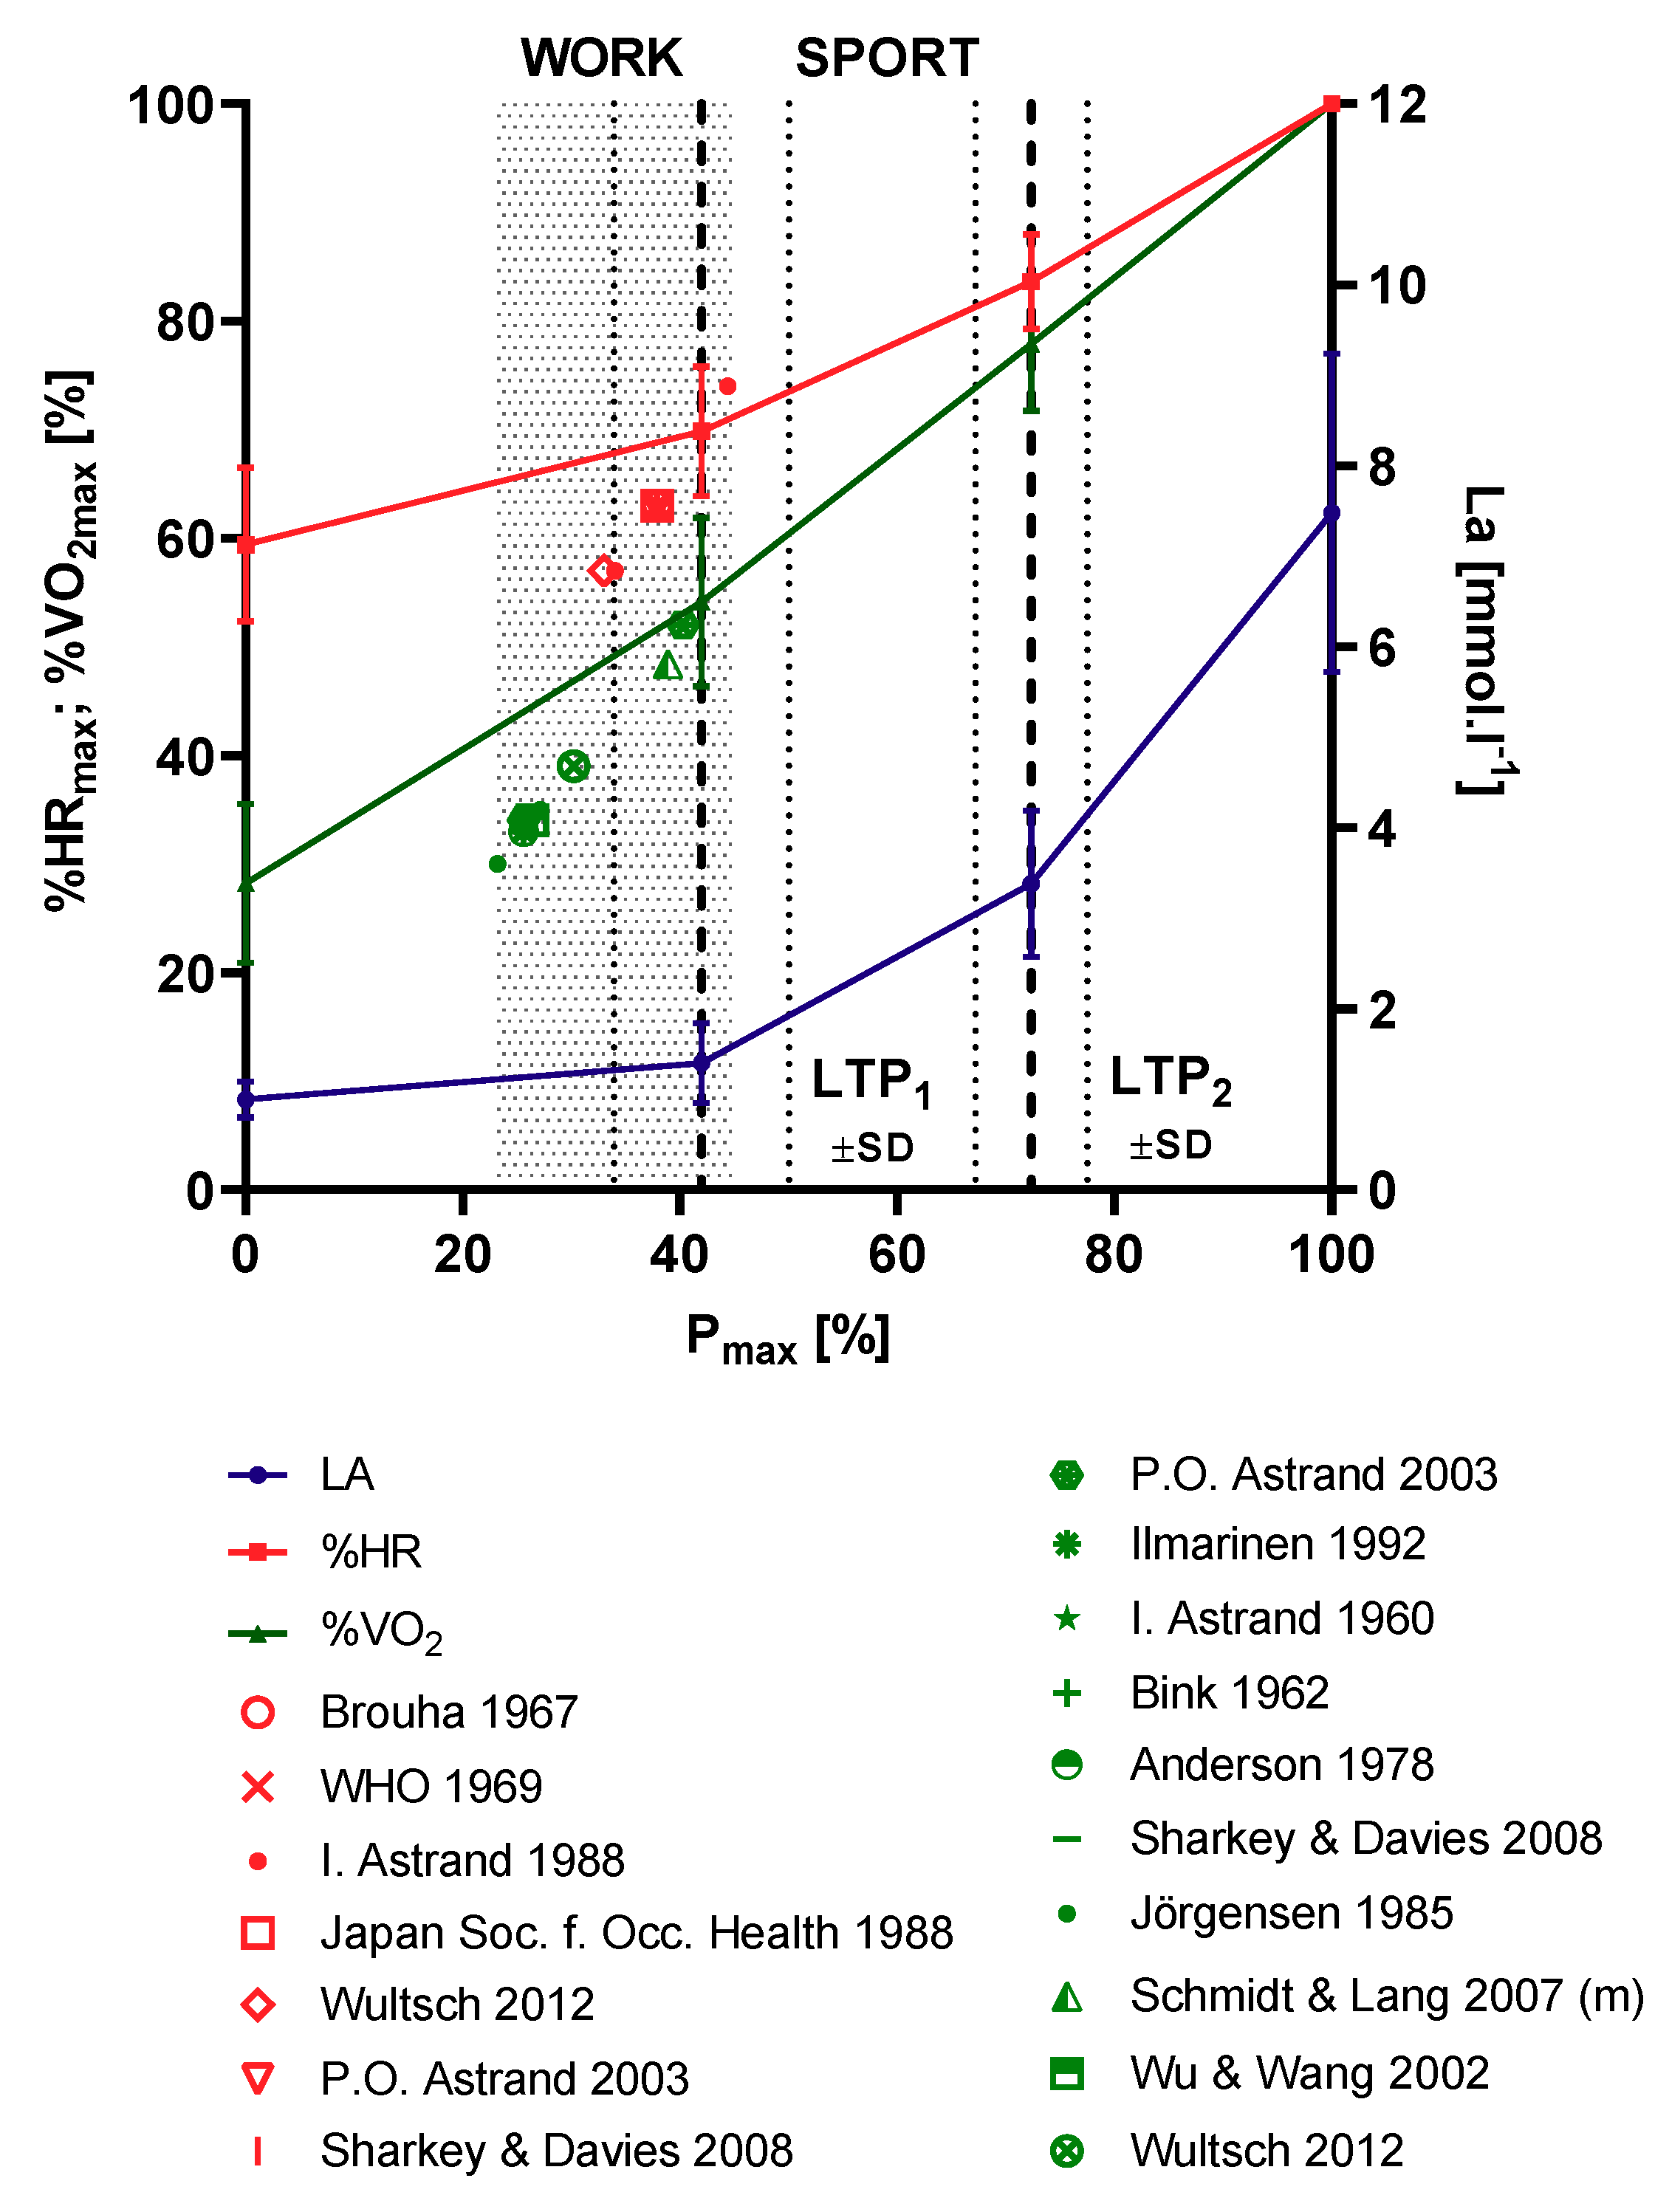
Calculated WEE from the 20 min VO2 measures of a representative working activity gave 1184 ± 518 kcal (18.1 ± 6.9 MET) for the female and 1660 ± 677 kcal (20.5 ± 8.9 MET) for the male workers, which was significantly different. Similar results have been presented earlier by Wultsch et al. [5], showing results of various occupational groups of heavy work. Comparable to our results WEE was calculated between 1060 kcal and 1790 kcal for an eight-hour shift of 60 steel founders. Although highly intense short stress peaks were prescribed by these authors in this group, the workers were not above the limit for heavy work of 2000 kcal for a working time of eight hours [11]. Significantly higher values were obtained for WEE in 83 male garbage workers summing up to 2240.3 ± 1001.5 kcal for a complete work shift [38]. However, analyzing only WEE during the effective working hours reduced WEE to 1608.3 ± 738.5 kcal (for 293 min) comparable to the present study. Critically we need to mention that WEE in garbage disposal has always to be considered in view of the size of the garbage containers, which makes results from small single studies hard to compare [43]. Dependent on the size of the waste containers, WEE values were shown to be between 2304 kcal and 2784 kcal, which is clearly above the results of the present study, but the lower value is comparable to the study by Anjos et al. [38]. Again, this is an indicator that the limits for heavy occupational work may be accepted higher at least for the short term; however, long-term exposure to such heavy loads may increase the risk for early retirement. To conclude the literature Figure 5 sums up the most common limits accepted to prescribe the limits for heavy work. With exception of one limit for young workers all accepted limits for HR and VO2, are clearly below or close to the LTP1. Only one absolute value for the HR for young workers is above the LTP1 [7]. Correcting this limit for age, again yields a limit below LTP1.

4.4. Further Calculations and Connections

As the average strain during work in our study indicated by HR and VO2 measures was clearly below LTP1 and VT1 from the incremental cycle ergometer exercise tests one may suggest that this standard exercise test may serve as a measure for heavy occupational work [17]. This is supported by Preisser et al. [13], where absolute and relative values of HR and oxygen consumption of garbage workers measured during work were found below VT1. Although most subjects was well below this LTP1 limit during their eight-hour working time, additional studies are needed with respect to long-term exposure to such workloads. Interesting to note is the fact that in subjects with the highest fitness levels (>125% Pmax-target), none of the female and male workers were above the LTP1 limit which allows to argue a specific exercise performance to be necessary for heavy occupational work. A strong relationship between the fitness level and the strain during work was detected in our large-scale study, which was not expected, but is comparable to other studies [6,45]. As working people are exposed to different workloads and workers can choose workloads freely most of the time this relationship was high but indicated that workers are able to adapt their workload to their individual limits. Thus, apparently less trained persons work slower to stay below the limit of LTP1, as confirmed by the work of Astrand [7]. Our results allowed defining a minimum LTP1 performance of 100 W (m) and 60 W (f) in an incremental cycle ergometer exercise test. With the help of such a defined minimum power output at the LTP1, the risk of acute overload during work can be reduced. However, the long-term risk for cardiovascular disease, overall mortality and early and disability pension needs to be investigated in much more detail [1,3,6].

5. Conclusions

Our study shows that the individual exercise performance markers LTP1/VT1 are valid to prescribe the limits for heavy occupational work. These markers relate workload to the individual strain which may be the main variable to explain acute and chronic overload in heavy workers. Additionally, this threshold allows to prescribe a minimal performance level enabling workers to sustain long-term heavy occupational work.

Author Contributions

Conceptualization, P.F., G.W. and P.H.; methodology, P.F., G.W. and P.H.; formal analysis, P.F.; investigation, P.F., S.R. and G.W.; resources, G.W. and P.H.; data curation, P.F. and P.B.; writing—original draft preparation, P.F.; writing—review and editing, P.B., P.F., S.R., G.W. and P.H.; supervision, P.H.; All authors have read and agreed to the published version of the manuscript.

Funding

This research received no external funding.

Acknowledgments

We acknowledge the financial support of the University of Graz for publishing.

Conflicts of Interest

The authors declare no conflict of interest.

References

  1. Robroek, S.J.W.; Reeuwijk, K.G.; Hillier, F.C.; Bambra, C.L.; van Rijn, R.M.; Burdorf, A. The Contribution of Overweight, Obesity, and Lack of Physical Activity to Exit from Paid Employment: A Meta-Analysis. Scand. J. Work Environ. Health 2013, 39, 233–240. [Google Scholar] [CrossRef] [PubMed] [Green Version]
  2. Holtermann, A.; Marott, J.L.; Gyntelberg, F.; Søgaard, K.; Suadicani, P.; Mortensen, O.S.; Prescott, E.; Schnohr, P. Occupational and Leisure Time Physical Activity: Risk of All-Cause Mortality and Myocardial Infarction in the Copenhagen City Heart Study. A Prospective Cohort Study. BMJ Open 2012, 2, e000556. [Google Scholar] [CrossRef] [Green Version]
  3. Karpansalo, M.; Lakka, T.; Manninen, P.; Kauhanen, J.; Rauramaa, R.; Salonen, J. Cardiorespiratory Fitness and Risk of Disability Pension: A Prospective Population Based Study in Finnish Men. Occup. Environ. Med. 2003, 60, 765–769. [Google Scholar] [CrossRef] [PubMed] [Green Version]
  4. Strauss, M.; Foshag, P.; Leischik, R. Prospective Evaluation of Cardiovascular, Cardiorespiratory, and Metabolic Risk of German Office Workers in Comparison to International Data. Int. J. Environ. Res. Public Health 2020, 17, 1590. [Google Scholar] [CrossRef] [PubMed] [Green Version]
  5. Wultsch, G.; Rinnerhofer, S.; Tschakert, G.; Hofmann, P. Governmental Regulations for Early Retirement by Means of Energy Expenditure Cut Offs. Scand. J. Work Environ. Health 2012, 38, 370–379. [Google Scholar] [CrossRef] [PubMed]
  6. Krause, N.; Brand, R.J.; Arah, O.A.; Kauhanen, J. Occupational Physical Activity and 20-Year Incidence of Acute Myocardial Infarction: Results from the Kuopio Ischemic Heart Disease Risk Factor Study. Scand. J. Work Environ. Health 2015, 41, 124–139. [Google Scholar] [CrossRef]
  7. Åstrand, I. Physical Demands in Worklife. Scand. J. Work Environ. Health 1988, 14, 10–13. [Google Scholar]
  8. Marées, H.; de Heck, H. Sportphysiologie; Sportverlag Strauß: Köln, Germany, 2003. [Google Scholar]
  9. Tipton, M.J.; Milligan, G.S.; Reilly, T.J. Physiological Employment Standards I. Occupational Fitness Standards: Objectively Subjective? Eur. J. Appl. Physiol. 2013, 113, 2435–2446. [Google Scholar] [CrossRef]
  10. Åstrand, P.-O. Textbook of Work Physiology: Physiological Bases of Exercise, 4th ed.; Human Kinetics: Champaign, IL, USA, 2003. [Google Scholar]
  11. Frauendorf, H.; Köhn-Seyer, G.; Gelbrich, W. Heart Rate and Energy Metabolism Response in Selected Physical Tasks in Steel Foundries. Z. Gesamte Hyg. 1981, 27, 30–34. [Google Scholar]
  12. McEntire, S.J.; Suyama, J.; Hostler, D. Mitigation and Prevention of Exertional Heat Stress in Firefighters: A Review of Cooling Strategies for Structural Firefighting and Hazardous Materials Responders. Prehosp. Emerg. Care 2013, 17, 241–260. [Google Scholar] [CrossRef]
  13. Preisser, A.M.; Zhou, L.; Garrido, M.V.; Harth, V. Measured by the Oxygen Uptake in the Field, the Work of Refuse Collectors Is Particularly Hard Work: Are the Limit Values for Physical Endurance Workload Too Low? Int. Arch. Occup. Environ. Health 2016, 89, 211–220. [Google Scholar] [CrossRef] [PubMed] [Green Version]
  14. Schlagbauer, D.; Heck, D.; Hofmann, P. Interdisciplinary Research Project: Principles of Work Scheduling. In Proceedings of the Sixth International Structural Engineering and Construction Conference, Zürich, Switzerland, 21–26 June 2011; Volume 2008, pp. 117–122. [Google Scholar]
  15. Hofmann, P.; von Duvillard, S.P.; Seibert, F.J.; Pokan, R.; Wonisch, M.; Lemura, L.M.; Schwaberger, G. HRmax Target Heart Rate Is Dependent on Heart Rate Performance Curve Deflection. Med. Sci. Sports Exerc. 2001, 33, 1726–1731. [Google Scholar] [CrossRef] [PubMed]
  16. Binder, R.K.; Wonisch, M.; Corra, U.; Cohen-Solal, A.; Vanhees, L.; Saner, H.; Schmid, J.-P. Methodological Approach to the First and Second Lactate Threshold in Incremental Cardiopulmonary Exercise Testing. Eur. J. Cardiovasc. Prev. Rehabil. 2008, 15, 726–734. [Google Scholar] [CrossRef] [PubMed]
  17. Hofmann, P.; Tschakert, G. Special Needs to Prescribe Exercise Intensity for Scientific Studies. Cardiol. Res. Pract. 2010, 2011, 209302. [Google Scholar] [CrossRef] [PubMed] [Green Version]
  18. Wasserman, K.; McIlroy, M.B. Detecting the Threshold of Anaerobic Metabolism in Cardiac Patients during Exercise. Am. J. Cardiol. 1964, 14, 844–852. [Google Scholar] [CrossRef]
  19. Brooks, G.A. Lactate Shuttles in Nature. Biochem. Soc. Trans. 2002, 30, 258–264. [Google Scholar] [CrossRef]
  20. Tschakert, G.; Hofmann, P. High-Intensity Intermittent Exercise: Methodological and Physiological Aspects. Int. J. Sports Physiol. Perform. 2013, 8, 600–610. [Google Scholar] [CrossRef] [Green Version]
  21. Tschakert, G.; Kroepfl, J.; Mueller, A.; Moser, O.; Groeschl, W.; Hofmann, P. How to regulate the acute physiological response to “Aerobic” high-intensity interval exercise. J. Sports Sci. Med. 2015, 14, 29–36. [Google Scholar]
  22. Moser, O.; Tschakert, G.; Mueller, A.; Groeschl, W.; Hofmann, P.; Pieber, T.; Lawrence, J.; Koehler, G. Short-Acting Insulin Reduction Strategies for Continuous Cycle Ergometer Exercises in Patients with Type 1 Diabetes Mellitus. Asian J. Sports Med. 2017, 8, e42160. [Google Scholar] [CrossRef] [Green Version]
  23. Hofmann, P.; Tschakert, G. Intensity- and Duration-Based Options to Regulate Endurance Training. Front. Physiol. 2017, 8, 337. [Google Scholar] [CrossRef] [Green Version]
  24. Cottin, F.; Leprêtre, P.-M.; Lopes, P.; Papelier, Y.; Médigue, C.; Billat, V. Assessment of Ventilatory Thresholds from Heart Rate Variability in Well-Trained Subjects during Cycling. Int. J. Sports Med. 2006, 27, 959–967. [Google Scholar] [CrossRef] [PubMed]
  25. Barrero, A.; Erola, P.; Bescós, R. Energy Balance of Triathletes during an Ultra-Endurance Event. Nutrients 2014, 7, 209–222. [Google Scholar] [CrossRef] [PubMed] [Green Version]
  26. Pokan, R.; Ocenasek, H.; Hochgatterer, R.; Miehl, M.; Vonbank, K.; Von Duvillard, S.P.; Franklin, B.; Würth, S.; Volf, I.; Wonisch, M.; et al. Myocardial Dimensions and Hemodynamics during 24-h Ultraendurance Ergometry. Med. Sci. Sports Exerc. 2014, 46, 268–275. [Google Scholar] [CrossRef] [PubMed]
  27. Kunutsor, S.K.; Kurl, S.; Khan, H.; Zaccardi, F.; Rauramaa, R.; Laukkanen, J.A. Oxygen Uptake at Aerobic Threshold Is Inversely Associated with Fatal Cardiovascular and All-Cause Mortality Events. Ann. Med. 2017, 49, 698–709. [Google Scholar] [CrossRef]
  28. Wonisch, M.; Berent, R.; Klicpera, M.; Laimer, H.; Marko, C.; Pokan, R.; Schmid, P.; Schwann, H.; Stichwortsuche, A. Praxisleitlinien Ergometrie. Austrian J. Cardiol. 2008, 15, 13. [Google Scholar] [CrossRef]
  29. Hofmann, P.; Pokan, R.; von Duvillard, S.P.; Seibert, F.J.; Zweiker, R.; Schmid, P. Heart Rate Performance Curve during Incremental Cycle Ergometer Exercise in Healthy Young Male Subjects. Med. Sci. Sports Exerc. 1997, 29, 762–768. [Google Scholar] [CrossRef]
  30. Beaver, W.L.; Wasserman, K.; Whipp, B.J. A New Method for Detecting Anaerobic Threshold by Gas Exchange. J. Appl. Physiol. 1986, 60, 2020–2027. [Google Scholar] [CrossRef]
  31. Mifflin, M.D.; St Jeor, S.T.; Hill, L.A.; Scott, B.J.; Daugherty, S.A.; Koh, Y.O. A New Predictive Equation for Resting Energy Expenditure in Healthy Individuals. Am. J. Clin. Nutr. 1990, 51, 241–247. [Google Scholar] [CrossRef]
  32. Hedges, L.V.; Olkin, I. Statistical Methods for Meta-Analysis; Hedges, L.V., Olkin, I., Eds.; Academic Press: New York, NY, USA, 1985. [Google Scholar]
  33. World Health Organization. Obesity: Preventing and Managing the Global Epidemic: Report of a WHO Consultation; World Health Organization: Geneva, Switzerland, 2000. [Google Scholar]
  34. Tammelin, T.; Nayha, S.; Rintamaki, H.; Zitting, P. Occupational Physical Activity Is Related to Physical Fitness in Young Workers. Med. Sci. Sport. Exerc. 2002, 34, 158–165. [Google Scholar] [CrossRef]
  35. Schibye, B.; Hansen, A.; Søgaard, K.; Christensen, H. Aerobic Power and Muscle Strength among Young and Elderly Workers with and without Physically Demanding Work Tasks. Appl. Ergon. 2001, 32, 425–431. [Google Scholar] [CrossRef]
  36. World Health Organization. Health Factors Involved in Working under Conditions of Heat Stress. Report of a WHO Scientific Group; Technical Report 412; World Health Organization: Geneva, Switzerland, 1969; pp. 1–32. [Google Scholar]
  37. Callea, P.; Zimbalatti, G.; Quendler, E.; Nimmerichter, A.; Bachl, N.; Bernardi, B.; Smorto, D.; Benalia, S. Occupational Illnesses Related to Physical Strains in Apple Harvesting. Ann. Agric. Environ. Med. 2014, 21, 407–411. [Google Scholar] [CrossRef] [PubMed]
  38. Anjos, L.A.; Ferreira, J.A.; Damião, J.J. Heart Rate and Energy Expenditure during Garbage Collection in Rio de Janeiro, Brazil. Cad. Saude Publica 2007, 23, 2749–2755. [Google Scholar] [CrossRef] [PubMed] [Green Version]
  39. Wakui, T. Study on Work Load of Matrons under Shift Work in a Special Nursing Home for the Elderly. Ind. Health 2000, 38, 280–288. [Google Scholar] [CrossRef] [PubMed]
  40. Ilmarinen, J.; Tuomi, K. Work Ability of Aging Workers. Scand. J. Work Environ. Health 1992, 18, 8–10. [Google Scholar]
  41. Rodahl, K.; Vokac, Z.; Fugelli, P.; Vaage, O.; Maehlum, S. Circulatory Strain, Estimated Energy Output and Catecholamine Excretion in Norwegian Coastal Fishermen. Ergonomics 1974, 17, 585–602. [Google Scholar] [CrossRef]
  42. Åstrand, I.; Fugelli, P.; Karlsson, C.G.; Rodahl, K.; Vokac, Z. Energy Output and Work Stress in Coastal Fishing. Scand. J. Clin. Lab. Investig. 1973, 31, 105–113. [Google Scholar]
  43. Dennison, K.J.; Mullineaux, D.R.; Yates, J.W.; Abel, M.G. The Effect of Fatigue and Training Status on Firefighter Performance. J. Strength Cond. Res. 2012, 26, 1101–1109. [Google Scholar] [CrossRef]
  44. Smith, D.L. Firefighter Fitness: Improving Performance and Preventing Injuries and Fatalities. Curr. Sports Med. Rep. 2011, 10, 167–172. [Google Scholar] [CrossRef] [Green Version]
  45. Lindberg, A.-S.; Oksa, J.; Gavhed, D.; Malm, C. Field Tests for Evaluating the Aerobic Work Capacity of Firefighters. PLoS ONE 2013, 8, e68047. [Google Scholar] [CrossRef] [Green Version]
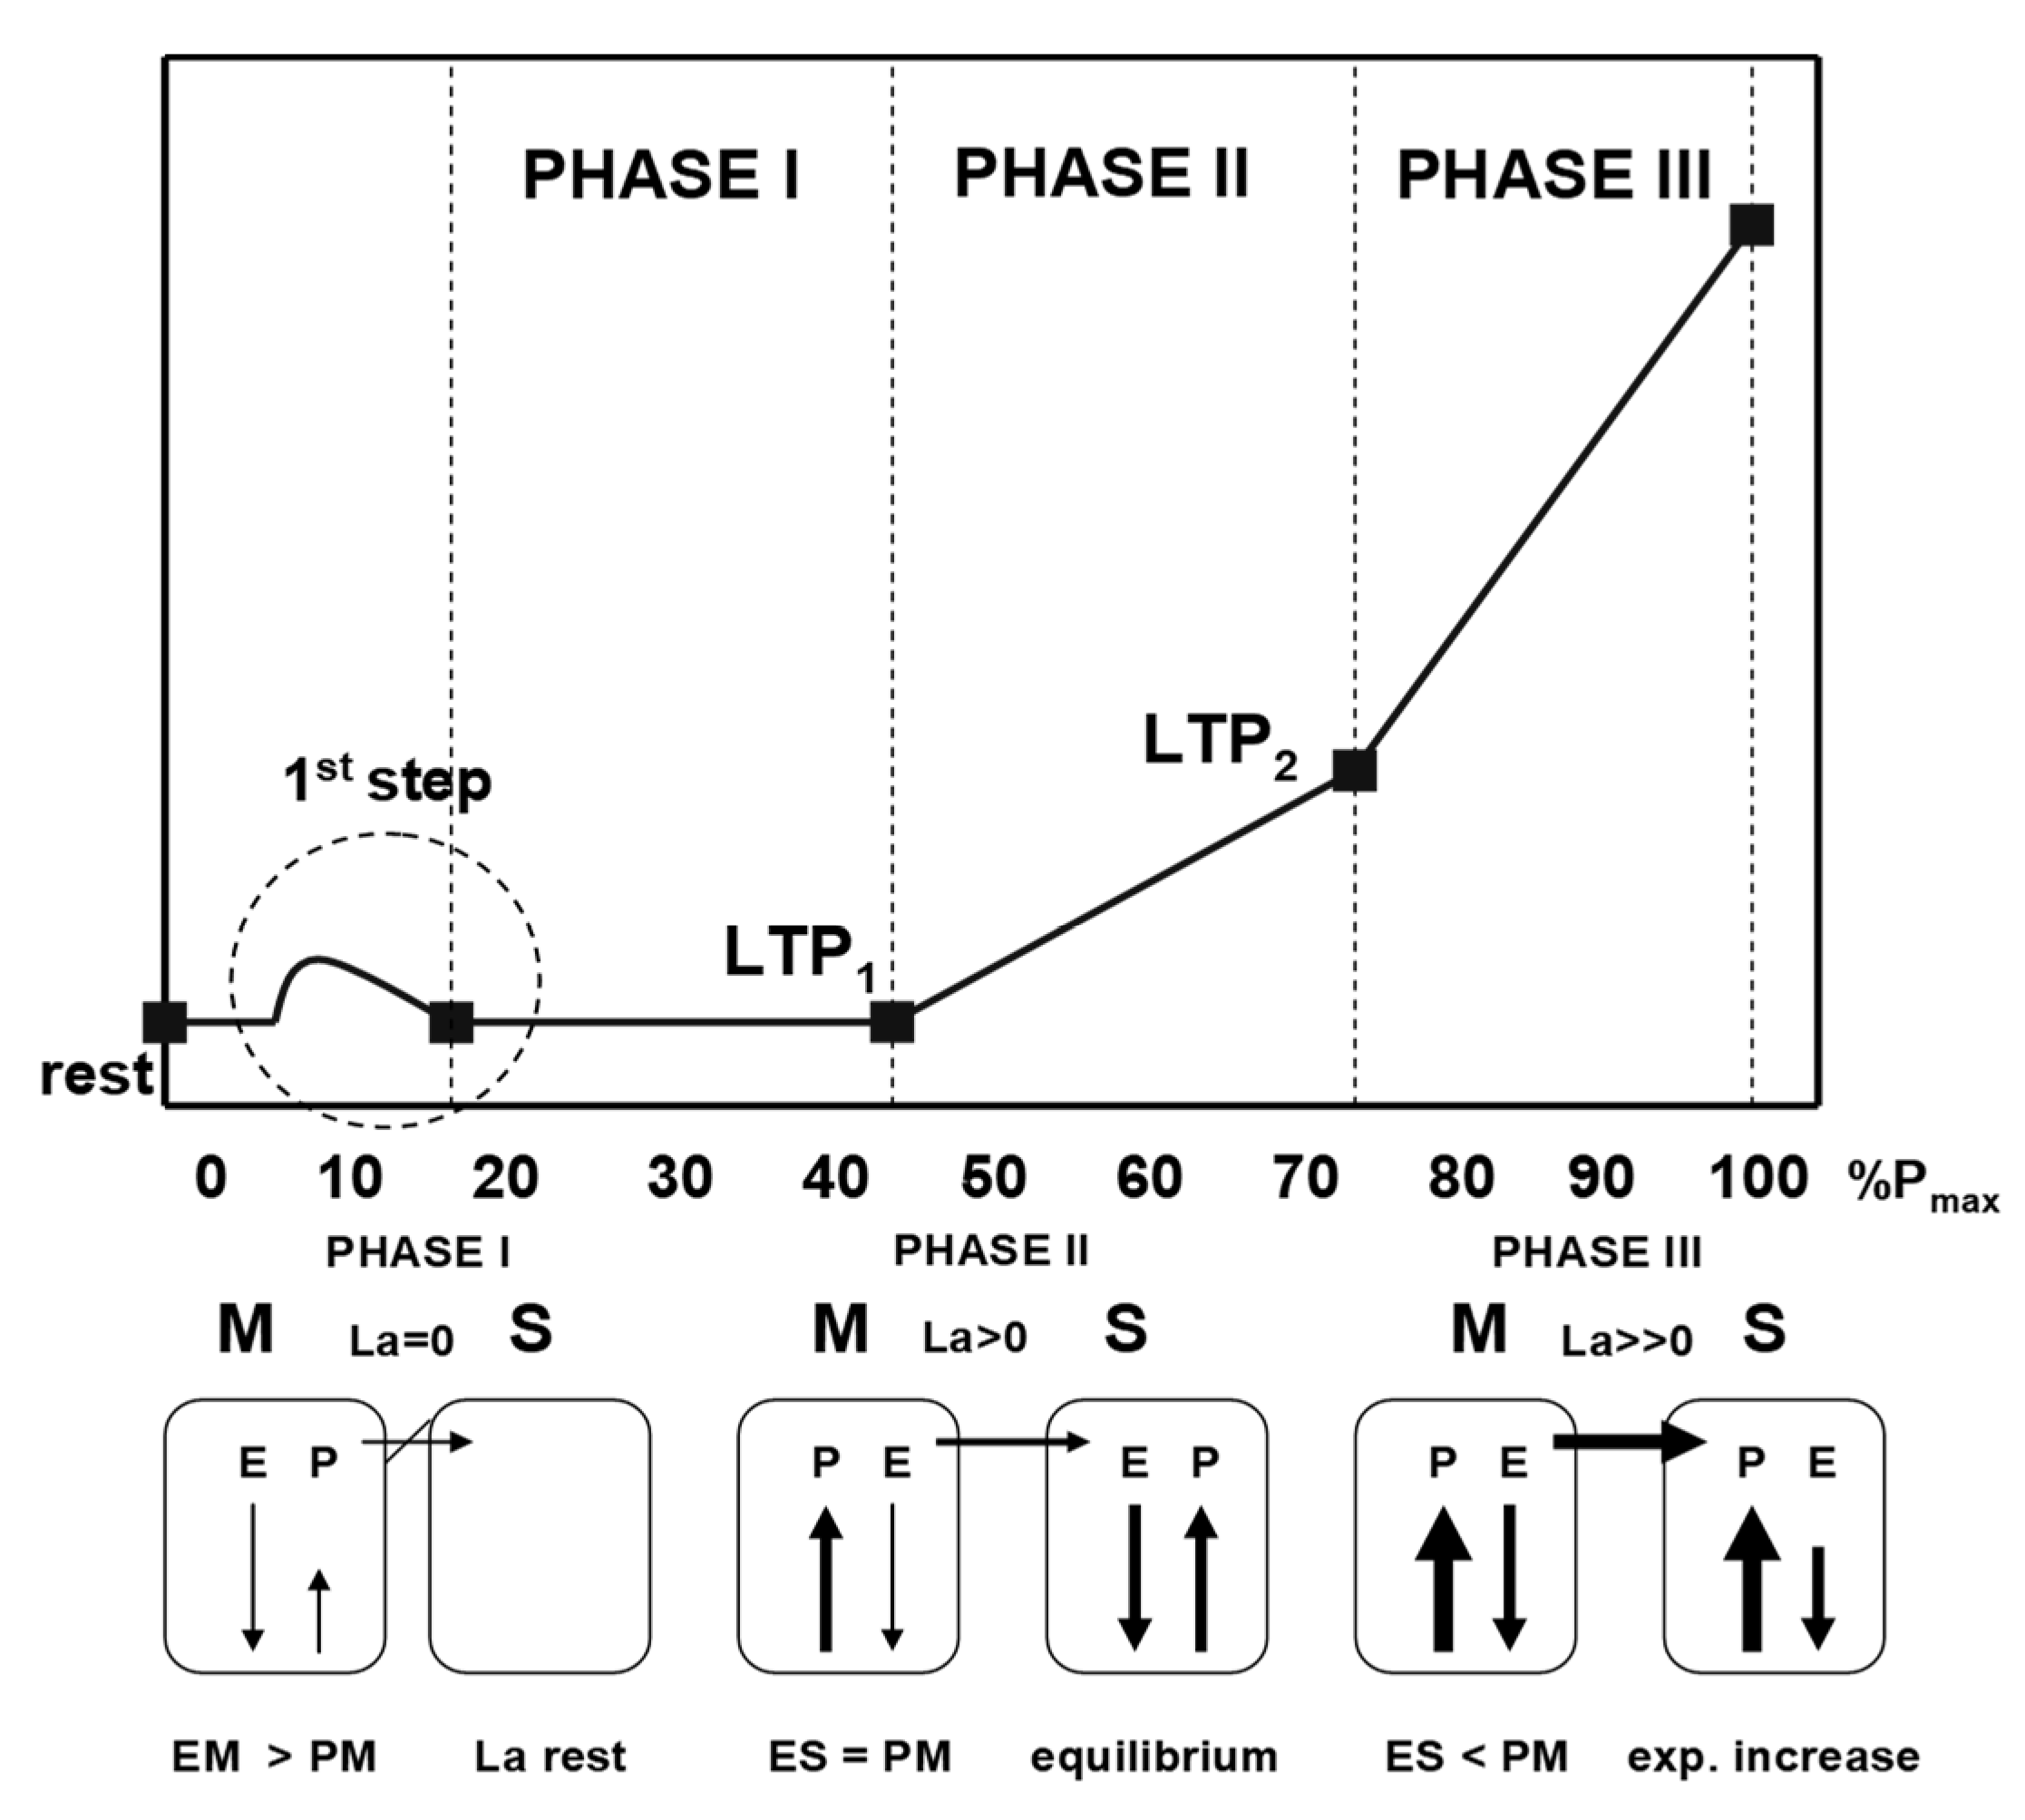
Figure 1. Time course of blood lactate concentration (La) during an incremental cycle ergometer test and the lactate shuttle mechanisms (modified from Tschakert and Hofmann [20]). M—muscle; S—system; P—lactate production; E—lactate elimination; EM—muscular elimination; PM—muscular production; ES—systemic elimination.
Jfmk 05 00066 g001
Figure 2. Relationship between power output at the first lactate threshold (PLTP1) and maximum power output (Pmax) for male (m) and female (f) workers.
Jfmk 05 00066 g002
Figure 3. Correlation between the maximum power output (Pmax) related to the target standard Pmax (Pmax-target) and percentage of maximum heart rate (% HR8h) during 8 h occupational work for male (m) and female (f) workers. Dotted lines represent age-predicted maximum target cycle ergometer power output (black) and heart rate at the first lactate turn point (LTP1, red).
Jfmk 05 00066 g003
Figure 4. Eight-hour average heart rate (HR, shaded red) and 20-min representative oxygen uptake (VO2, shaded green) during 8 h of occupational work related to HR and VO2 from incremental cycle ergometer exercise. Phases of metabolism are divided by lactate turn points (LTP1, LTP2) according to Hofmann et al. [29]. Workloads below LTP1 represent occupational work, intensities above LTP1 represent sport activities (N = 240).
Jfmk 05 00066 g004
Figure 5. Published limits for heart rate (HR) as a percentage of the maximum HR (% HRmax, red) and oxygen uptake as a percentage of the maximum oxygen consumption (% VO2 max, green) for heavy occupational work related to cycle ergometer exercise reference data. Lactate thresholds (LTP1, LTP2) were determined according to Hofmann et al. [29], from original data [5]. Workloads below LTP1 represent occupational work, strain levels above LTP1 are defined as sport activities.
Jfmk 05 00066 g005
Table 1. Anthropometric data of subjects by sex.
VariablesFemale WorkersMale Workersp-ValueMean Diff. (95% CI)g
N52188
Age (yrs)34.5 ± 10.634.9 ± 100.3−2.67 (−7.79 to 2.45)0.04
Height (cm)165 ± 6178.3 ± 6.4<0.00010.12 (0.1 to 0.15)2.11
Weight (kg)65.3 ± 1382.1 ± 10<0.0001−14.09 (−20.18 to −8.01)1.57
BMI (kg/m2)23.9 ± 4.325.8 ± 4.20.121.32 (−0.38 to 3.02)0.45
BMI—body mass index; g—effect size (Hedges’ g); results are shown as M ± SD; significantly different p < 0.05.
Table 2. Maximal and percentages of standard target values of female and male incremental cycle ergometer exercise test results.
VariablesFemale WorkersMale Workersp-ValueMean Diff. (95% CI)g
Pmax (W)150.0 ± 30.8217.6 ± 48.2<0.000167.65 (56.69 to 78.60)1.50
% Pmax-target (%)113.9 ± 19.4102.5 ± 23.10.0006−11.33 (−17.63 to −5.02)−0.51
VO2 max (L·min−1)1.94 ± 0.442.90 ± 0.60<0.00010.96 (0.82 to 1.11)1.69
VO2 max rel. (mL·kg−1)30.3 ± 736.0 ± 8.2<0.00015.72 (3.46 to 7.97)0.72
% VO2 max-target (%)121.4 ± 17.5114.2 ± 11.70.01−7.18 (−12.33 to −2.04)−0.55
HRmax (b·min−1)177.6 ± 16.1176.4 ± 14.20.63−1.18 (−9.09 to 3.74)−0.08
% HRmax-target (%)93.6 ± 8.894.8 ± 7.20.381.17 (−1.46 to 3.81)0.16
Lamax (mmol·L−1)6.99 ± 1.477.62 ± 1.810.010.63 (0.14 to 1.11)0.36
RERmax1.20 ± 0.111.21 ± 0.100.650.01 (−0.03 to 0.04)0.1
Pmax—maximum power output; % Pmax-target—Pmax as a percentage of target standard power output (Pmax-target) [28]; VO2 max—maximum oxygen uptake; VO2 max rel.—maximum oxygen uptake relative to body weight; % VO2 max-target—VO2 max as a percentage of target standard VO2 max [28]; HRmax—maximum heart rate; % HRmax-target—HRmax as a percentage of target standard HRmax [28]; Lamax—maximum lactate concentration; RERmax—maximum respiratory exchange ratio; g—effect size (Hedges’ g); results are shown as M ± SD; significantly different p < 0.05).
Table 3. Power output (P), oxygen uptake (VO2), heart rate (HR) and blood lactate concentration (La) at the first lactate (LTP1) and ventilatory threshold (VT1) with corresponding percentages to the maximal values.
VariablesFemale WorkersMale Workersp-ValueMean Diff. (95% CI)g
PLTP1 (W)58.4 ± 14.894.1 ± 30.5<0.000135.74 (29.58 to 41.91)1.28
% Pmax (%)38.9 ± 7.442.8 ± 8.00.0013.9 (1.55 to 6.25)0.5
VO2 LTP1 (L·min−1)1.09 ± 0.221.54 ± 0.37<0.00010.45 (0.37 to 0.53)1.31
% VO2 max (%)57.0 ± 8.153.3 ± 7.40.004−3.71 (−6.21 to −1.21)−0.49
HRLTP1 (b·min−1)127.4 ± 16.7122.1 ± 12.4<0.05−5.39 (−10.36 to −0.42)−0.39
% HRmax (%)71.7 ± 5.769.3 ± 6.0<0.0001−15.83 (−16.89 to −14.78)−0.4
LaLTP1 (mmol·L−1)1.34 ± 0.451.42 ± 0.440.260.08 (−0.06 to 0.22)0.18
PVT1 (W)60.8 ±17.398.2 ± 31.6<0.000137.45 (30.76 to 44.14)1.28
% Pmax (%)40.5 ± 8.144.5 ± 7.9<0.0014.50 (1.97 to 7.04)0.5
VO2 VT1 (L·min−1)1.10 ± 0.251.58 ± 0.38<0.00010.48 (0.39 to 0.57)1.35
% VO2 max (%)57.0 ± 7.954.7 ±5.30.06−2.30 (−4.75 to 0.14)−0.39
HRVT1 (b·min−1)127.7 ± 16.3123.4 ± 11.90.08−4.30 (−9.17 to 0.57)−0.33
% HRmax (%)71.8 ± 5.470.1 ± 5.3<0.05−1.74 (−3.42 to −0.06)−0.32
LaVT1 (mmol·L−1)1.55 ± 0.501.64 ± 0.410.250.09 (−0.07 to 0.25)0.21
PLTP1/PVT1—power output at the first lactate (LTP1) or ventilatory threshold (VT1); % Pmax—PLTP1/PVT1 as a percentage of maximum power output; VO2 LTP1/VO2 VT1—oxygen uptake at LTP1/VT1; % VO2 max—VO2 LTP1/VO2 VT1 as a percentage of maximum oxygen uptake; HRLTP1/HRVT1—heart rate at LTP1/VT1; % HRmax—HRLTP1/HRVT1 as a percentage of maximum heart rate; LaLTP1/LaVT1—lactate concentration at LTP1/VT1; g—effect size (Hedges’ g); results are shown as M ± SD; significantly different p < 0.05).
Table 4. Results of the measurements during a work shift with percentages based on the maximum heart rate (HRmax) and the heart rate at LTP1 (HRLTP1).
VariablesFemale WorkersMale Workersp-ValueMean Diff. (95% CI)g
HR8h (b·min−1)99.3 ± 10.096.9 ± 14.10.17−2.41(−5.84 to 1.09)−0.18
% HRLTP1 (%)78.9 ± 10.279.9 ± 12.10.521.07(−2.24 to 4.38)0.09
% HRmax (%)56.2 ± 6.255.2 ± 8.50.33−1.03 (−3.14 to 1.08)−0.12
HR20 (b·min−1)101.0 ± 12.1100.2 ± 16.00.71−0.75 (−4.82 to 3.32)−0.05
% HRLTP1 (%)80.1 ± 11.582.7 ± 13.80.182.54 (1.20 to 6.27)0.20
% HRmax (%)57.2 ± 7.657.1 ± 9.50.92−0.12 (−2.63 to 2.39)−0.01
VO2 20 (L·min−1)0.72 ± 0.251.00 ± 0.30 <0.00010.28(0.20 to 0.36)1.00
% VO2 LTP1 (%)67.4 ± 23.967.9 ± 26.30.890.54 (−7.10 to 8.17)0.02
% VO2 max (%)37.8 ± 12.335.3 ± 11.50.19−2.51 (−6.30 to 1.28)−0.21
EEr24h (kcal)1366 ± 1741766 ± 154<0.0001400 (347 to 453)2.52
EE8h (kcal)1639 ± 5372249 ± 691<0.0001610 (431 to 789)0.92
MET8h (EE)25.2 ± 6.927.8 ± 8.9<0.052.57 (0.27 to 4.87)0.31
WEE8h (kcal)1184 ± 5181660 ± 677<0.0001477 (304 to 650)0.74
MET8h (WEE)25.21 ± 6.9127.78 ± 8.87<0.052.57 (0.27 to 4.86)0.3
MET1h (WEE)3.15 ± 0.863.47 ± 1.11<0.050.30 (0.01 to 0.59)0.3
HR8h—heart rate during the eight hours working; HR20—heart rate during the 20 min measurement of oxygen uptake; % HRLTP1—HR8h/HR20 as a percentage of the heart rate at the first lactate threshold (LTP1); % HRmax—HR8h/HR20 as a percentage of maximum heart rate; VO2 20—oxygen uptake during the 20 min measurement; % VO2 LTP1—VO2 20 as a percentage of the oxygen uptake at LTP1; % VO2 max—VO2 20 as a percentage of maximum oxygen uptake; EEr24h—24 h resting energy expenditure; EE8h—total energy expenditure during eight hours of work; WEE8h—working energy expenditure during the eight hours work with the respective metabolic equivalents (MET8h/MET1h); g—effect size (Hedges’ g); results are shown as M ± SD; significantly different p < 0.05).