Effect of Progressive Fatigue on Session RPE

 ,
, 
 ,
, 

Abstract
1. Introduction
2. Materials and Methods
2.1. Participants
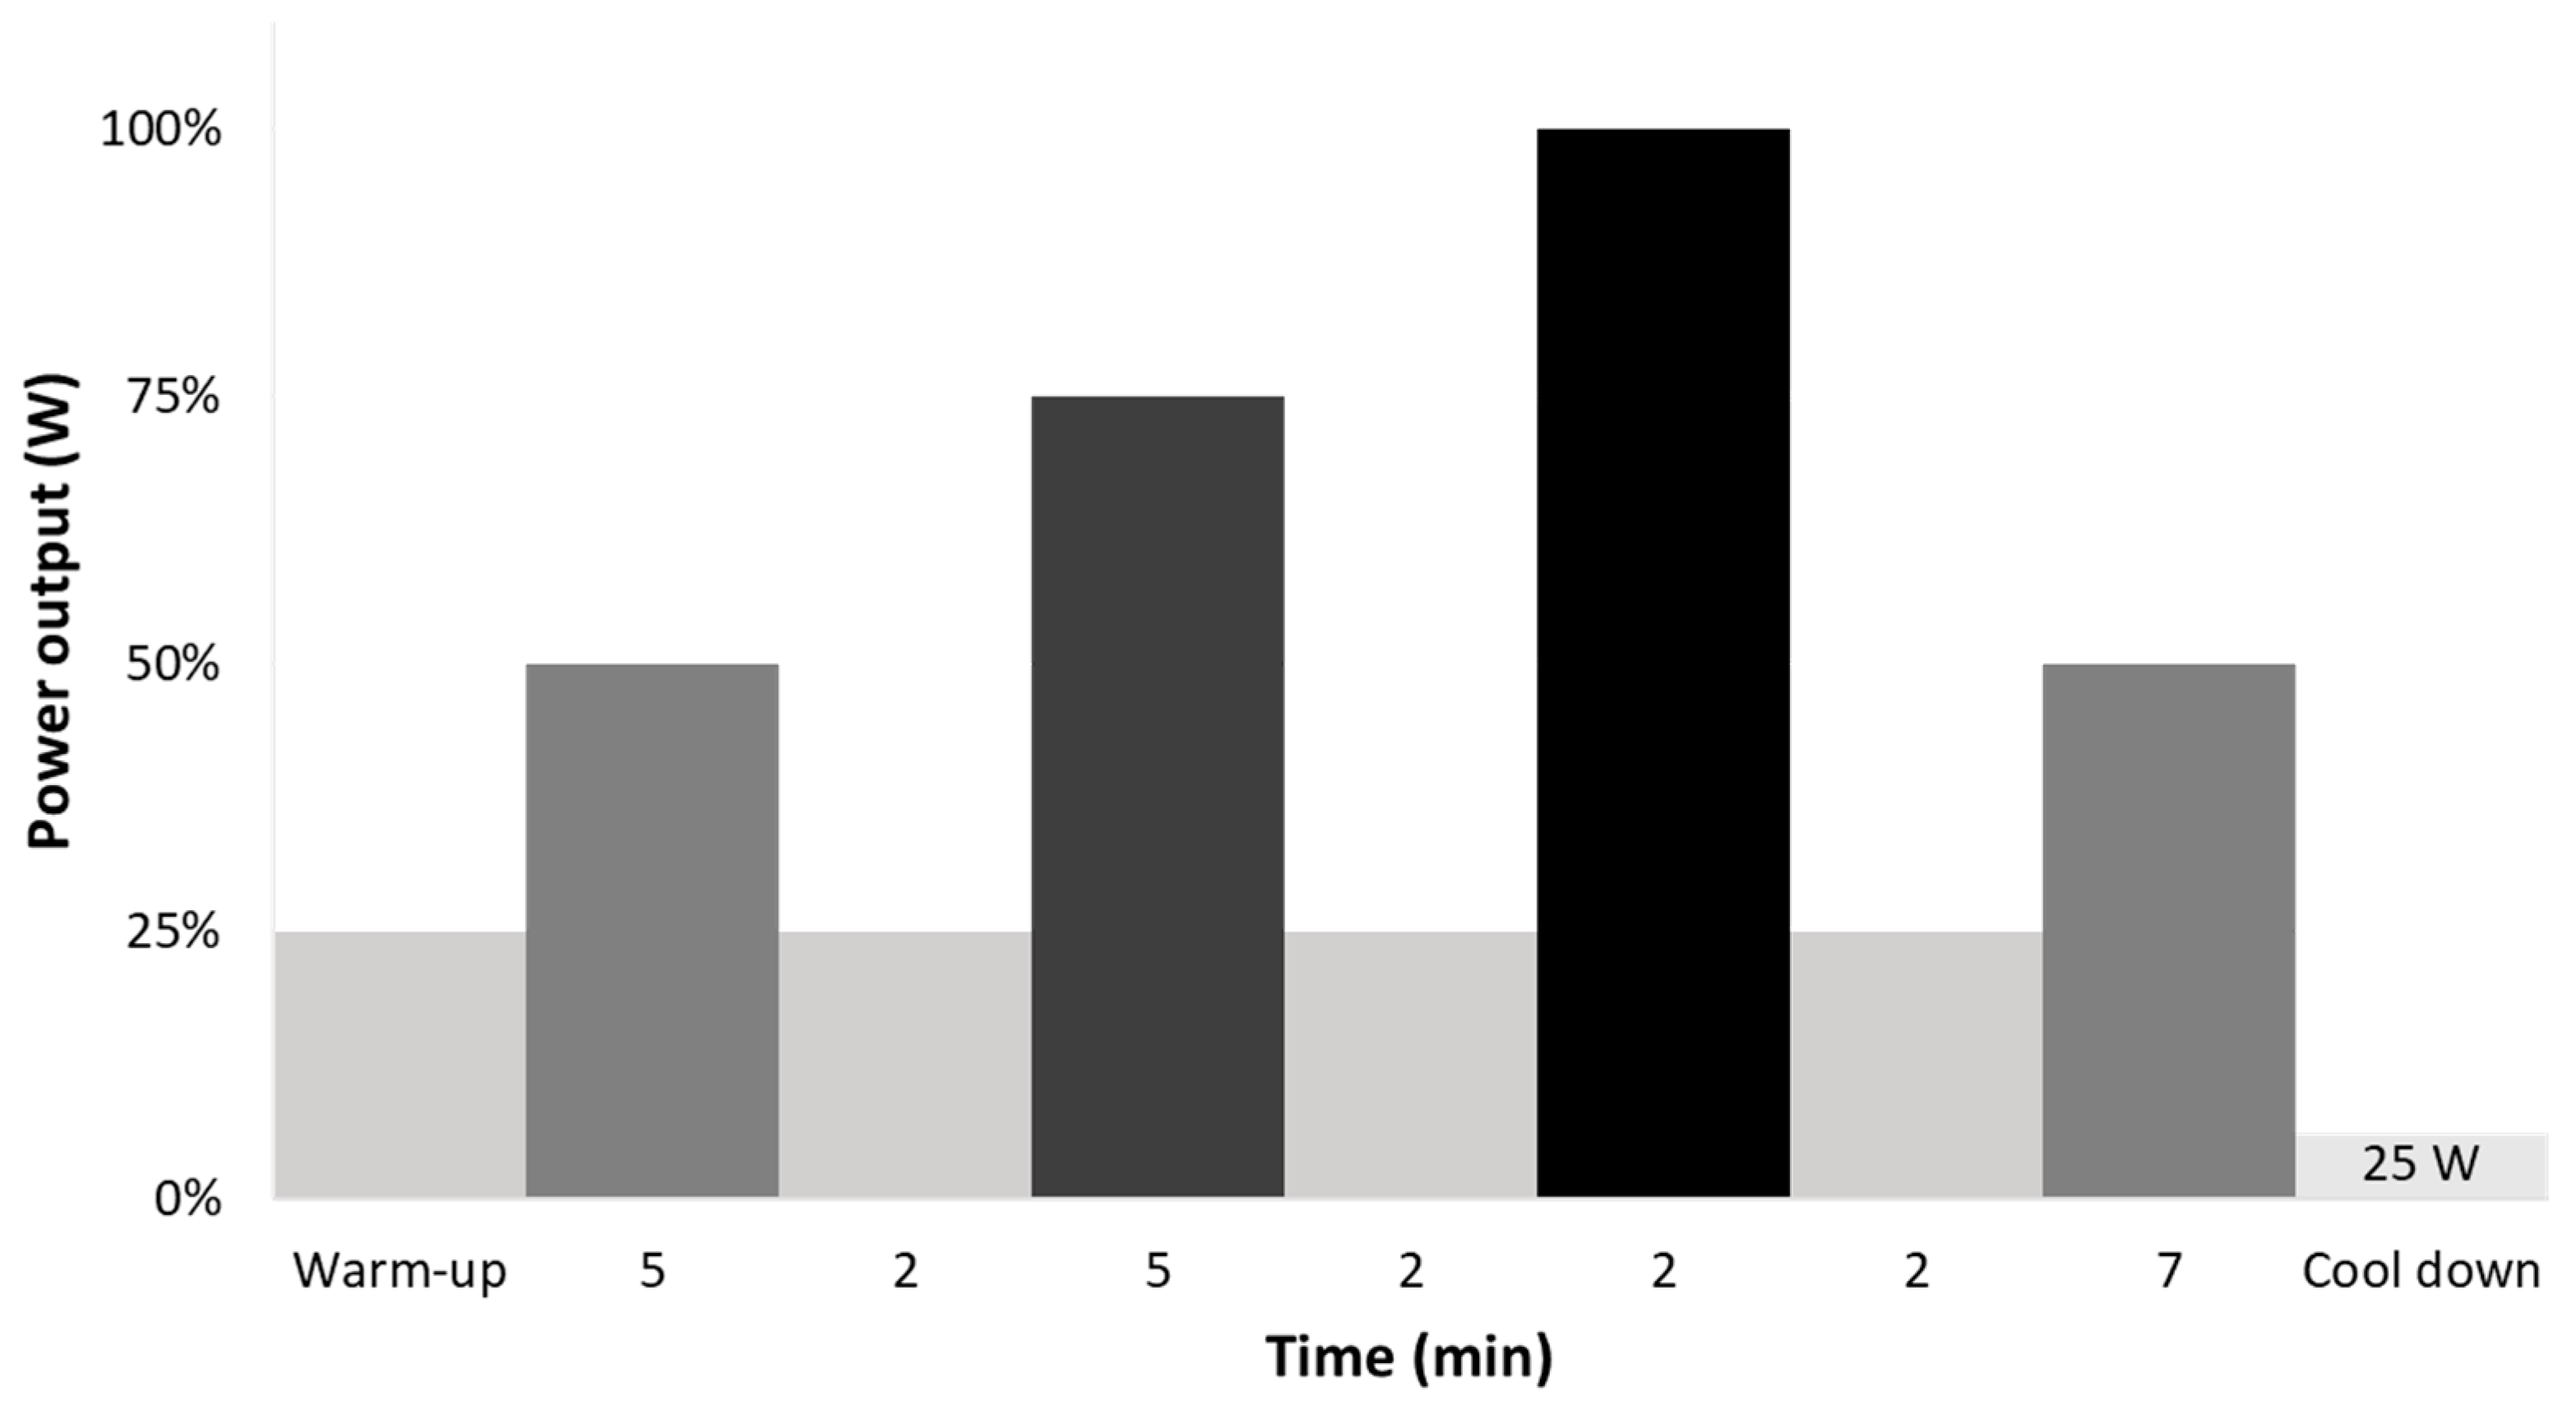
2.2. Procedures
2.3. Statistical Analysis
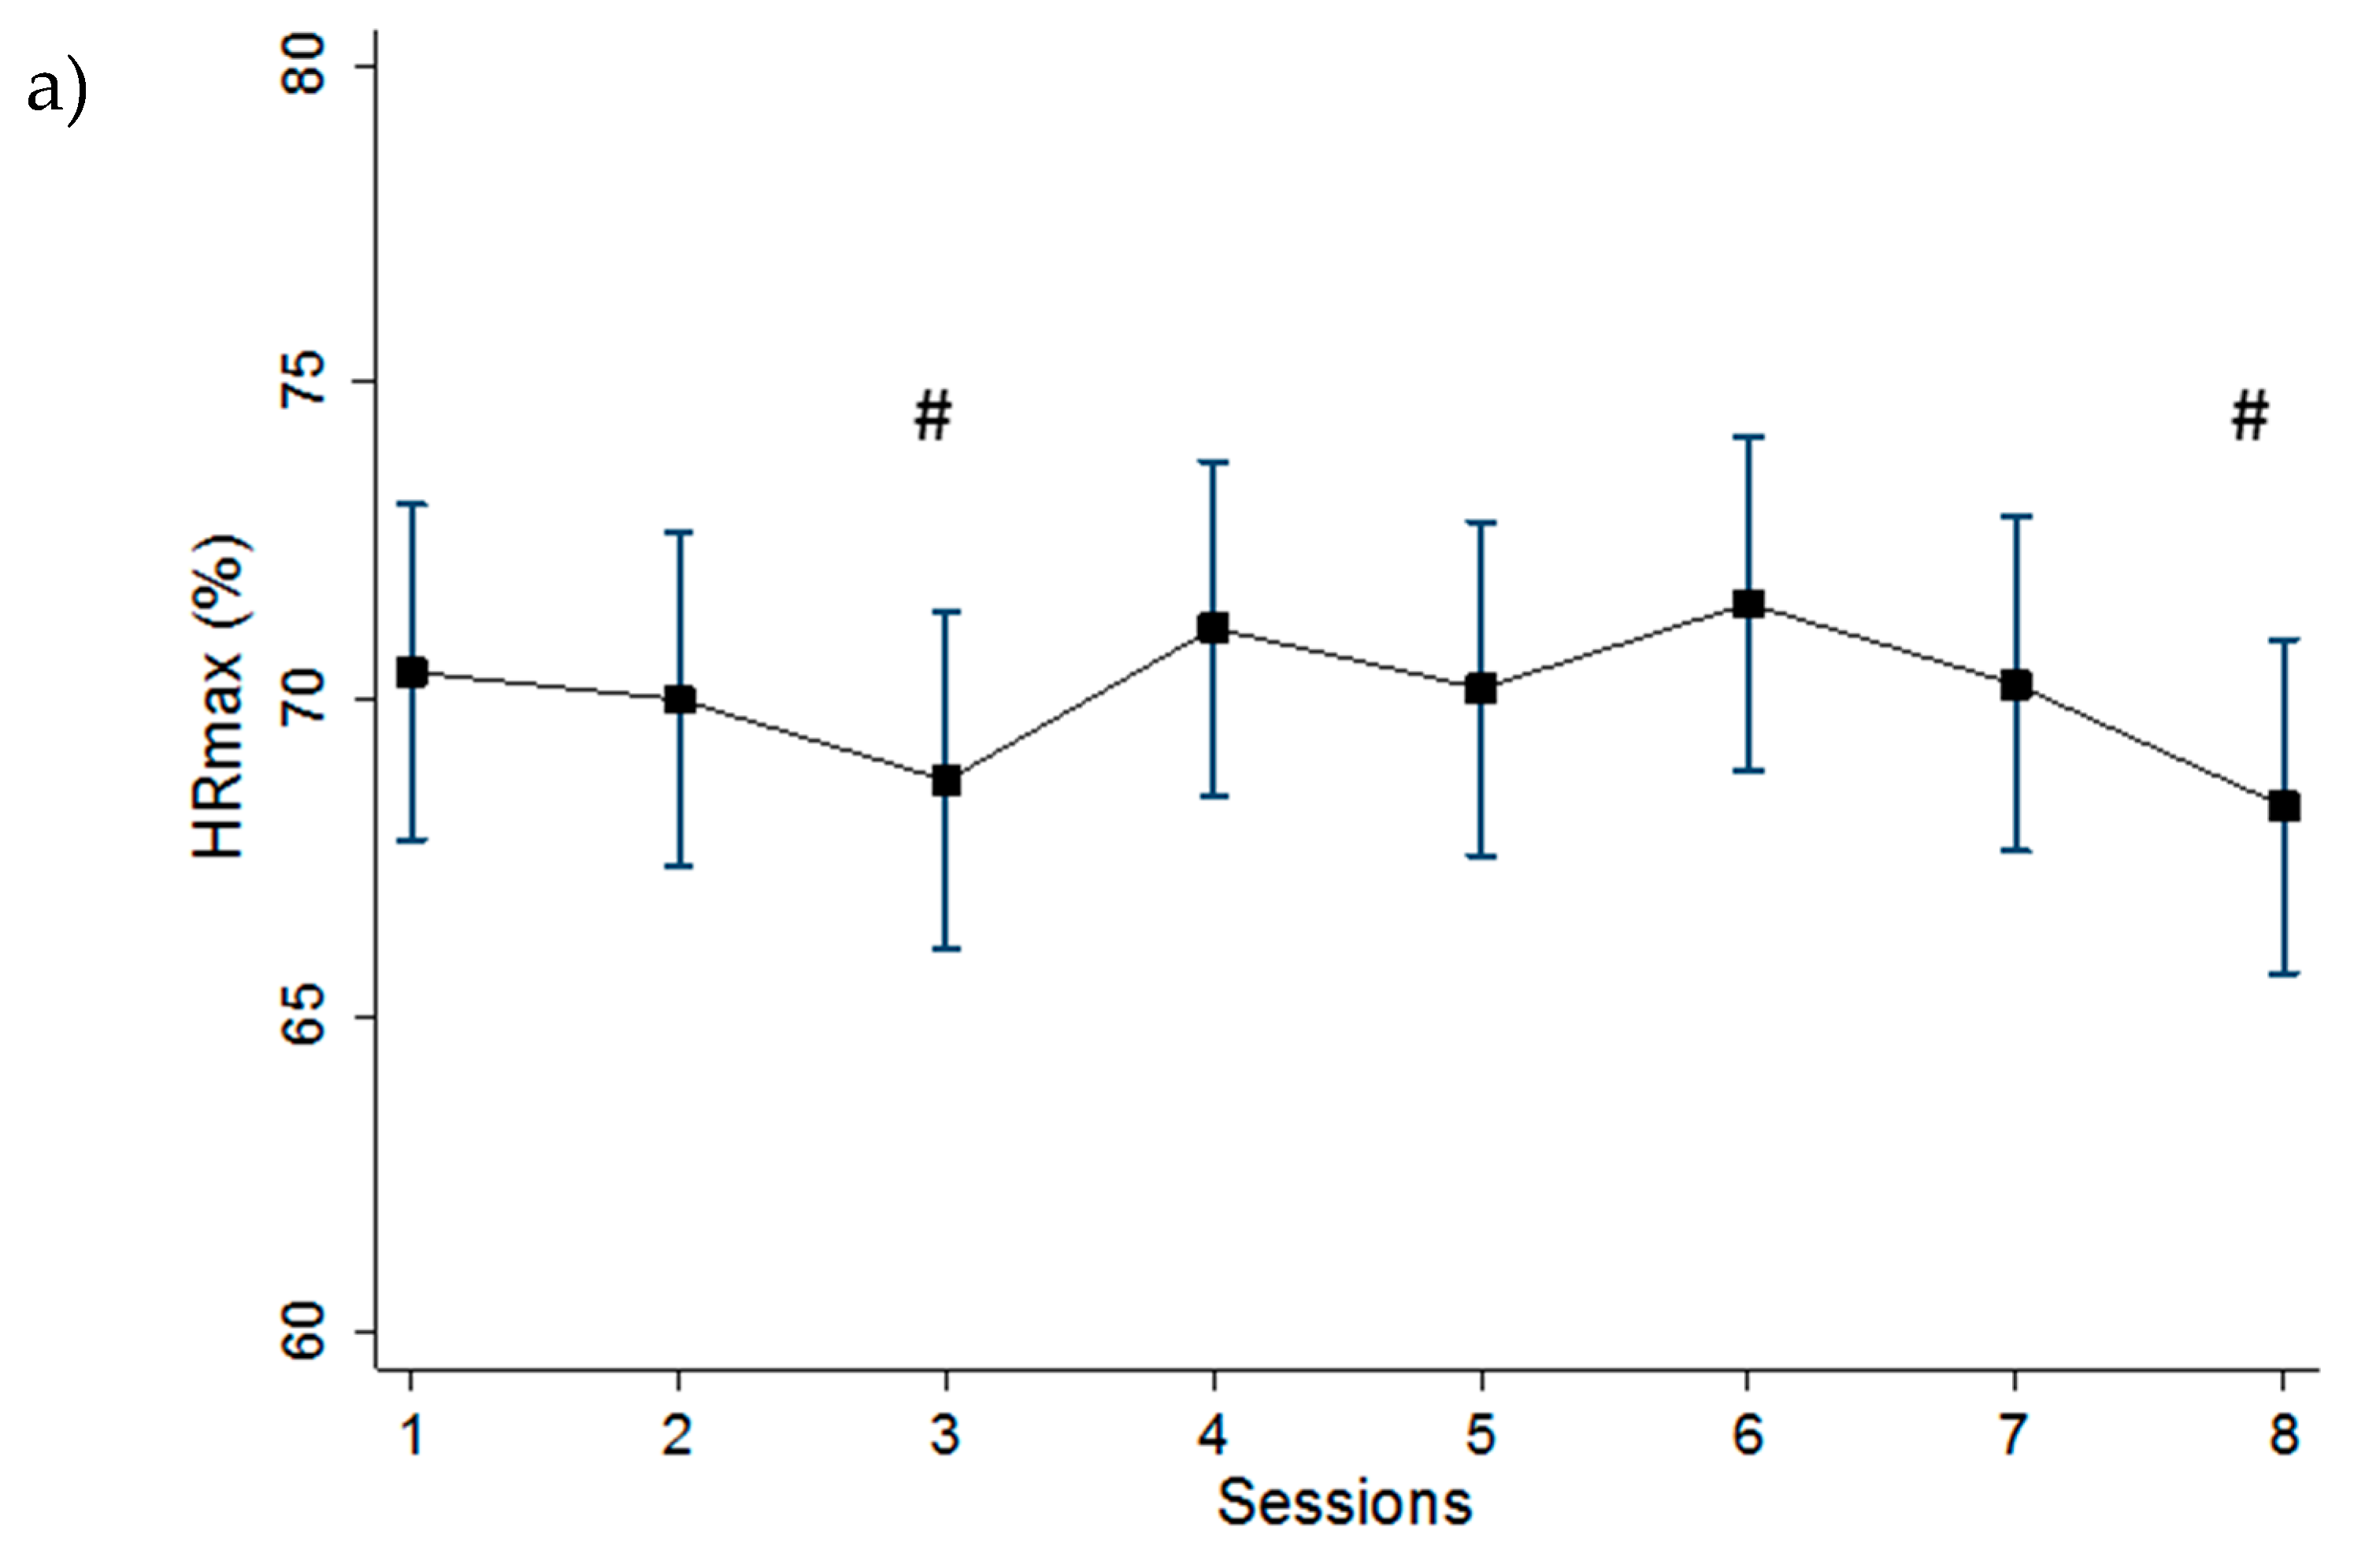
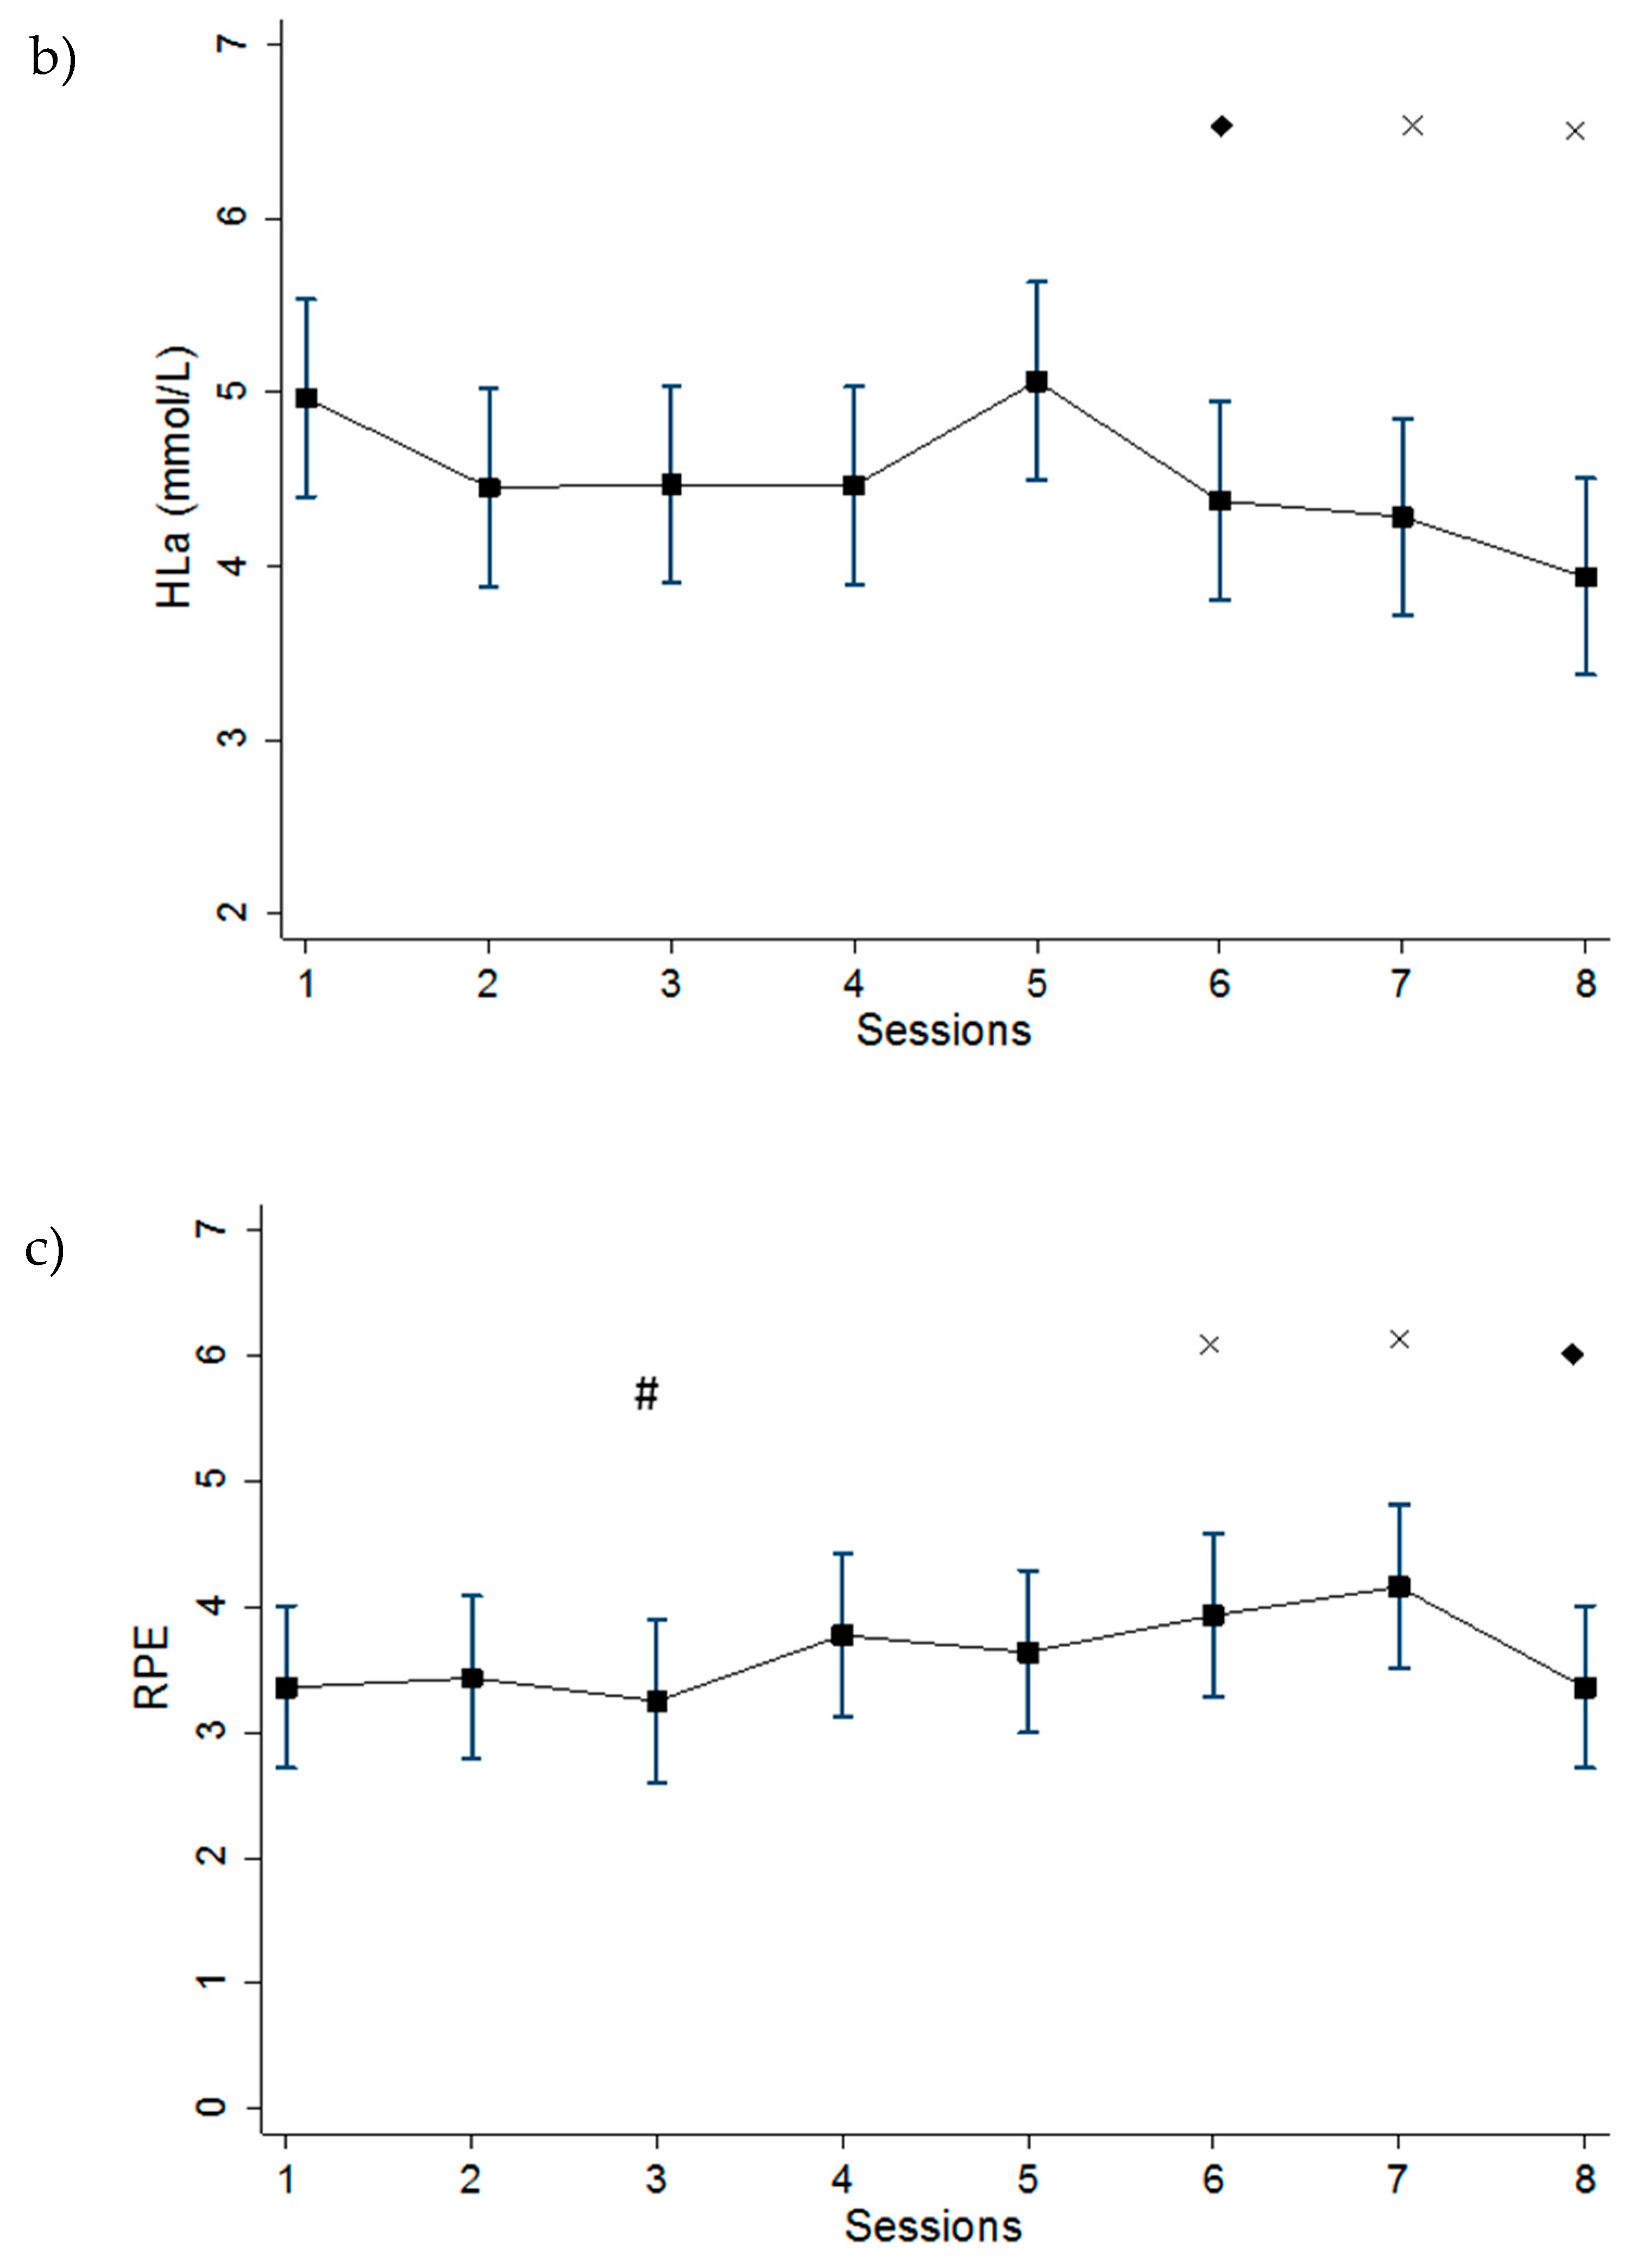
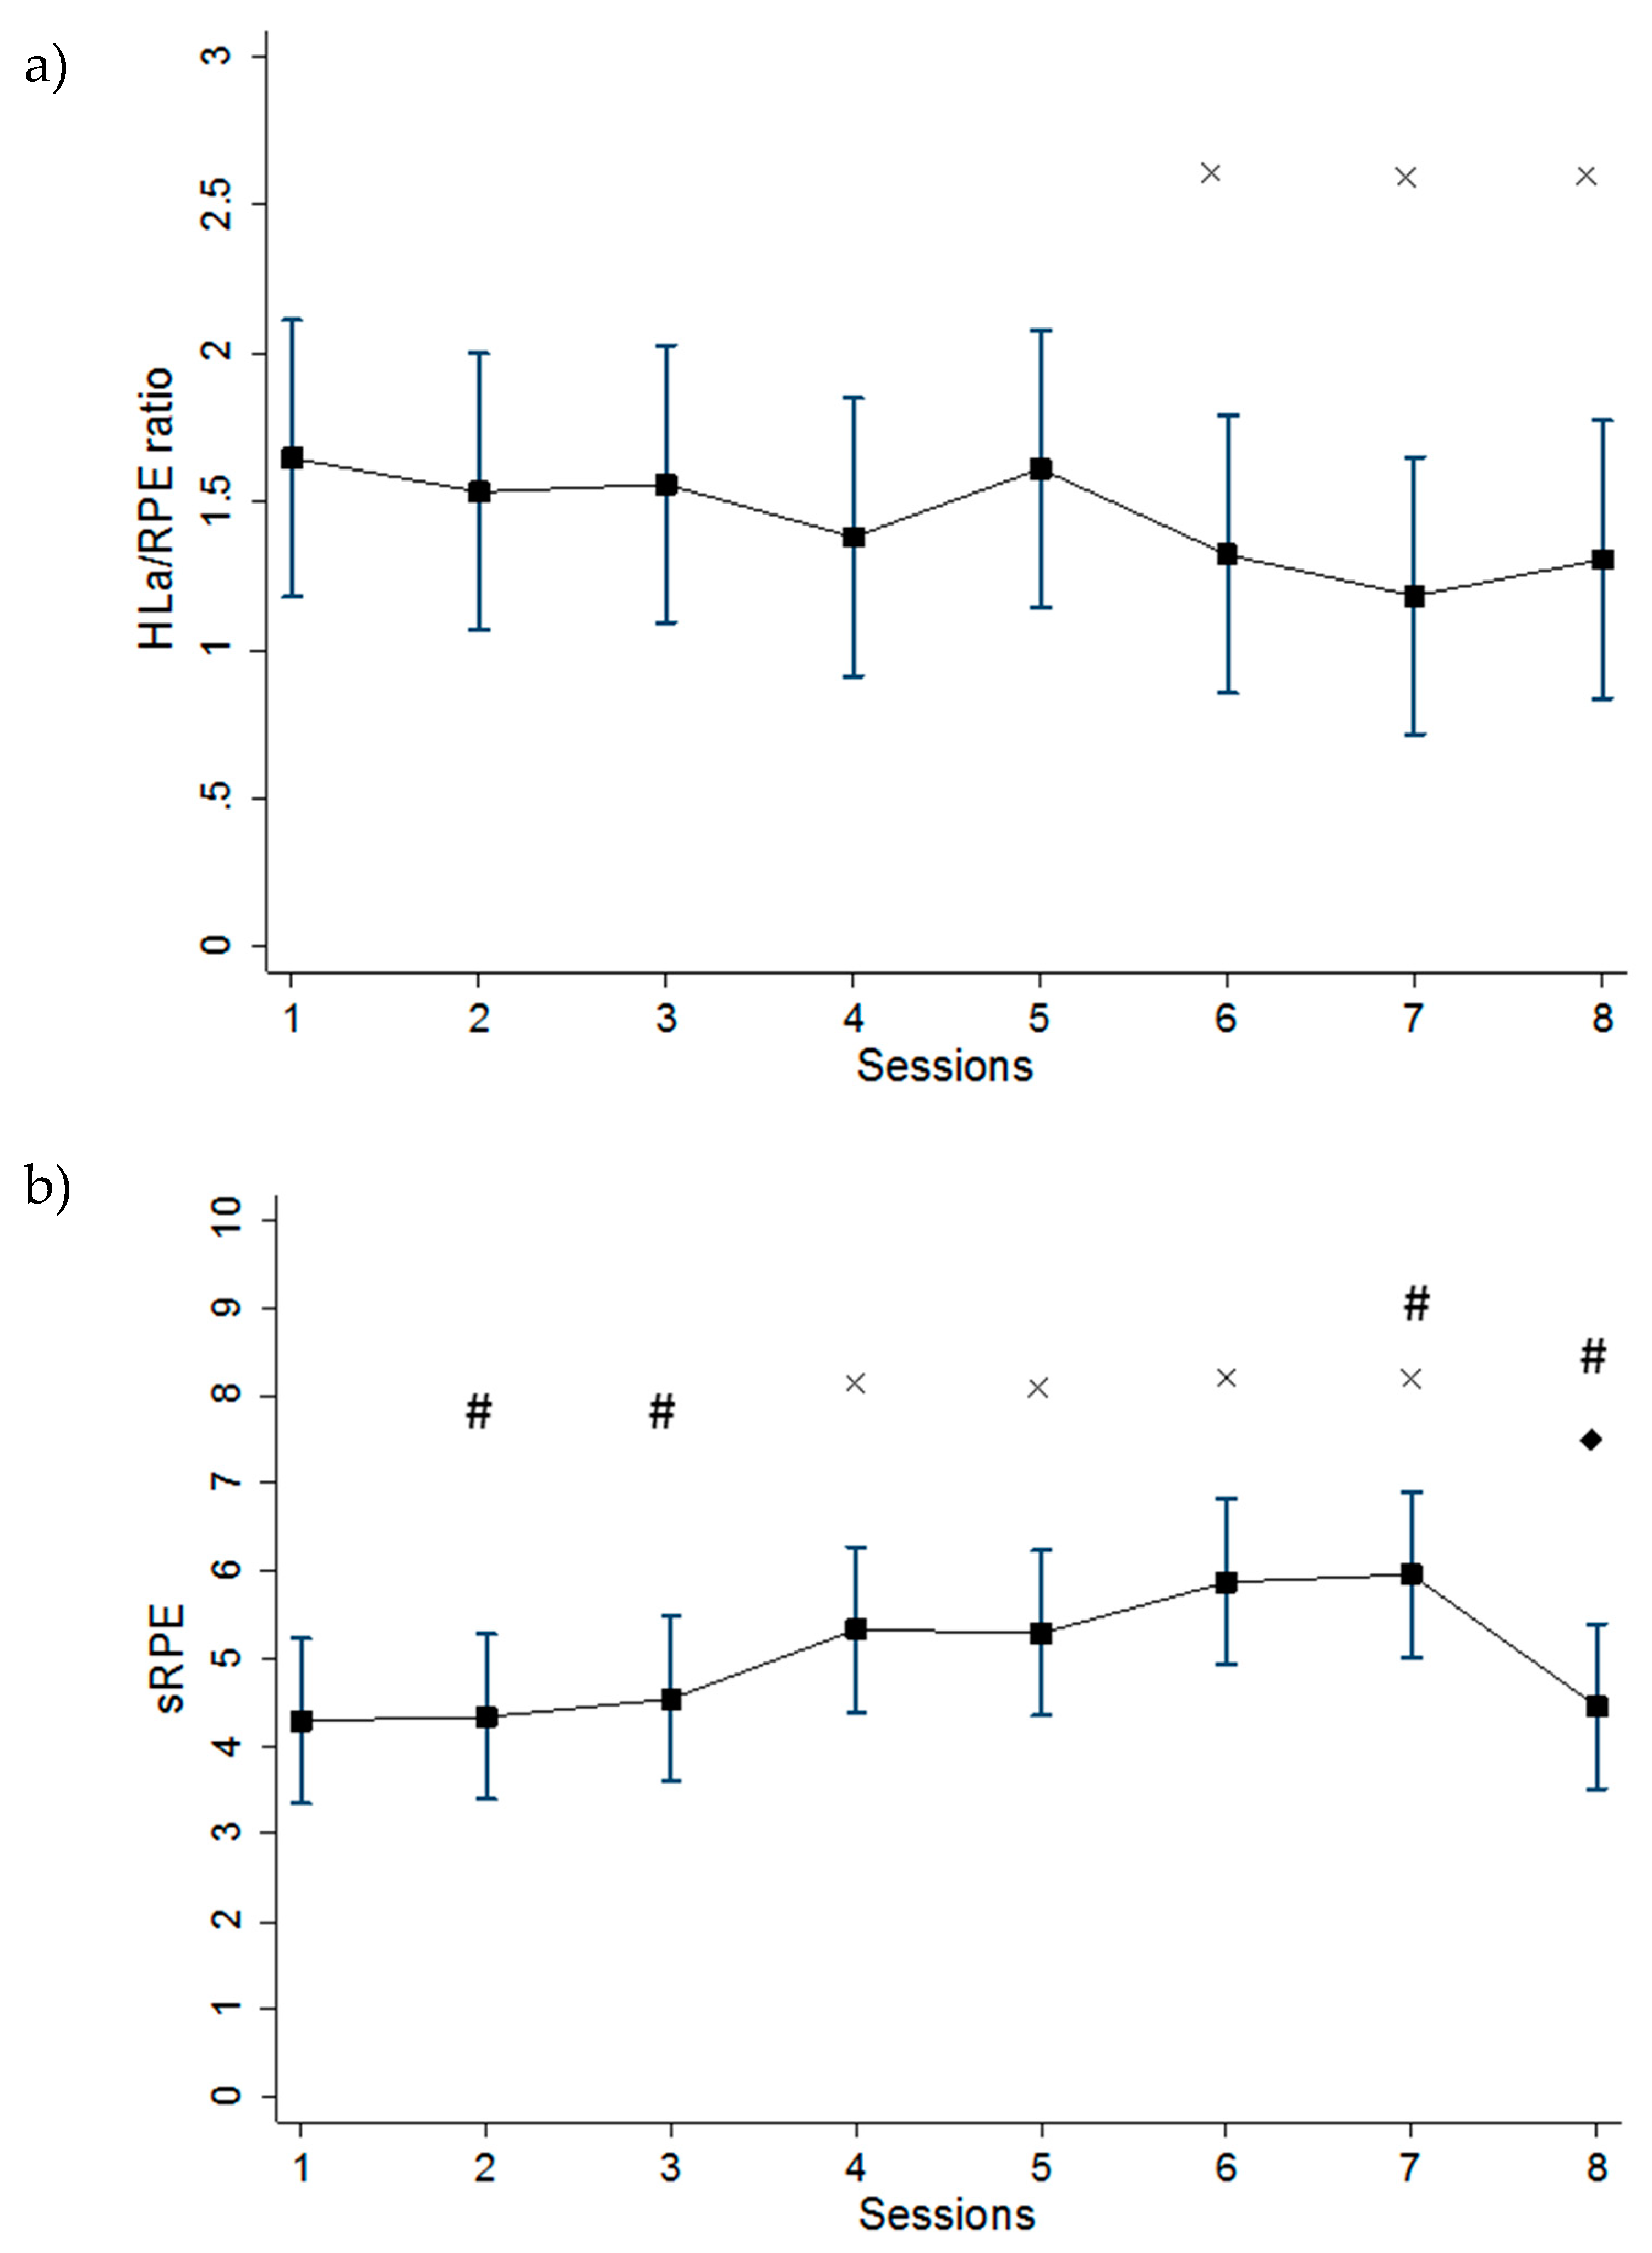
3. Results
4. Discussion
5. Conclusions
Author Contributions
Funding
Acknowledgments
Conflicts of Interest
References
- Foster, C.; Rodriguez-Marroyo, J.A.; de Koning, J.J. Monitoring Training Loads: The Past, the Present, and the Future. Int. J. Sports Physiol. Perform. 2017, 12, S2–S8. [Google Scholar] [CrossRef]
- Meeusen, R.; Duclos, M.; Foster, C.; Fry, A.; Gleeson, M.; Nieman, D.; Raglin, J.; Rietjens, G.; Steinacker, J.; Urhausen, A. Prevention, Diagnosis, and Treatment of the Overtraining Syndrome. Med. Sci. Sports Exerc. 2013, 45, 186–205. [Google Scholar] [CrossRef]
- Halson, S.L. Monitoring Training Load to Understand Fatigue in Athletes. Sports Med. 2014, 44, 139–147. [Google Scholar] [CrossRef]
- Urhausen, A.; Kindermann, W. Diagnosis of Overtraining. Sports Med. 2002, 32, 95–102. [Google Scholar] [CrossRef]
- Costill, D.L.; Bowers, R.; Branam, G.; Sparks, K. Muscle Glycogen Utilization during Prolonged Exercise on Successive Days. J. Appl. Physiol. 1971, 31, 834–838. [Google Scholar] [CrossRef]
- Foster, C.; Snyder, A.; Thompson, N.; Kuettel, K. Normalization of the Blood Lactate Profile in Athletes. Int. J. Sports Med. 1988, 09, 198–200. [Google Scholar] [CrossRef]
- Foster, C. Monitoring Training in Athletes with Reference to Overtraining Syndrome. Med. Sci. Sports Exerc. 1998, 30, 1164–1168. [Google Scholar] [CrossRef]
- Eston, R. Use of Ratings of Perceived Exertion in Sports. Int. J. Sports Physiol. Perform. 2012, 7, 175–182. [Google Scholar] [CrossRef]
- Foster, C.; Hector, L.L.; Welsh, R.; Schrager, M.; Green, M.A.; Snyder, A.C. Effects of Specific versus Cross-Training on Running Performance. Eur. J. Appl. Physiol. Occup. Physiol. 1995, 70, 367–372. [Google Scholar] [CrossRef]
- Foster, C.; Florhaug, J.A.; Franklin, J.; Gottschall, L.; Hrovatin, L.A.; Parker, S.; Doleshal, P.; Dodge, C. A New Approach to Monitoring Exercise Training. J. Strength Cond. Res. 2001, 15, 109–115. [Google Scholar]
- Borg, G. Borg’s Perceived Exertion and Pain Scales; Human Kinetics: Champaign, IL, USA, 1998. [Google Scholar]
- Arney, B.E.; Glover, R.; Fusco, A.; Cortis, C.; de Koning, J.J.; van Erp, T.; Jaime, S.; Mikat, R.P.; Porcari, J.P.; Foster, C. Comparison of RPE (Rating of Perceived Exertion) Scales for Session RPE. Int. J. Sports Physiol. Perform. 2019, 14, 994–996. [Google Scholar] [CrossRef] [PubMed]
- Arney, B.E.; Glover, R.; Fusco, A.; Cortis, C.; de Koning, J.J.; van Erp, T.; Jaime, S.; Mikat, R.P.; Porcari, J.P.; Foster, C. Comparison of Rating of Perceived Exertion Scales during Incremental and Interval Exercise. Kinesiology 2019, 51, 150–157. [Google Scholar] [CrossRef]
- Fitz-Clarke, J.R.; Morton, R.H.; Banister, E.W. Optimizing Athletic Performance by Influence Curves. J. Appl. Physiol. 1991, 71, 1151–1158. [Google Scholar] [CrossRef] [PubMed]
- Impellizzeri, F.M.; Marcora, S.M.; Coutts, A.J. Internal and External Training Load: 15 Years On. Int. J. Sports Physiol. Perform. 2019, 14, 270–273. [Google Scholar] [CrossRef]
- Fusco, A.; Knutson, C.; King, C.; Mikat, R.P.; Porcari, J.P.; Cortis, C.; Foster, C. Session RPE During Prolonged Exercise Training. Int. J. Sports Physiol. Perform. 2020, 15, 292–294. [Google Scholar] [CrossRef]
- De Koning, J.; Noordhof, D.; Lucia, A.; Foster, C. Factors Affecting Gross Efficiency in Cycling. Int. J. Sports Med. 2012, 33, 880–885. [Google Scholar] [CrossRef]
- Snyder, A.; Jeukendrup, A.; Hesselink, M.; Kuipers, H.; Foster, C. A Physiological/Psychological Indicator of Over-Reaching during Intensive Training. Int. J. Sports Med. 1993, 14, 29–32. [Google Scholar] [CrossRef]
- Hopkins, W.G. Available online: http://www.sportsci.org/resource/stats/effectmag.html#cohen (accessed on 6 November 2019).
- Hedelin, R.; Kentta, G.; Wilklund, U.; Bjerle, P.; Henriksson-Larsen, K. Short-Term Overtraining: Effects on Performance, Circulatory Responses, and Heart Rate Variability. Med. Sci. Sports Exerc. 2000, 32, 1480–1484. [Google Scholar] [CrossRef]
- Wilmore, J.H.; Stanforth, P.R.; Gagnon, J.; Leon, A.S.; Rao, D.C.; Skinner, J.S.; Bouchard, C. Endurance Exercise Training Has a Minimal Effect on Resting Heart Rate: The HERITAGE Study. Med. Sci. Sports Exerc. 1996, 28, 829–835. [Google Scholar] [CrossRef]
- Lamberts, R.P.; Lemmink, K.A.P.M.; Durandt, J.J.; Lambert, M.I. Variation in Heart Rate during Submaximal Exercise: Implications for Monitoring Training. J. Strength Cond. Res. 2004, 18, 641–645. [Google Scholar] [CrossRef]
- Powers, S.; Howley, E. Exercise Physiology: Theory and Application to Fitness and Performance, 8th ed.; McGraw Hill Companies: New York, NY, USA, 2012. [Google Scholar]
- Snyder, A.C. Overtraining and Glycogen Depletion Hypothesis. Med. Sci. Sports Exerc. 1998, 30, 1146–1150. [Google Scholar] [CrossRef] [PubMed]
- Gescheit, D.T.; Cormack, S.J.; Reid, M.; Duffield, R. Consecutive Days of Prolonged Tennis Match Play: Performance, Physical, and Perceptual Responses in Trained Players. Int. J. Sports Physiol. Perform. 2015, 10, 913–920. [Google Scholar] [CrossRef] [PubMed]
- Haddad, M.; Chaouachi, A.; Wong, D.P.; Castagna, C.; Hambli, M.; Hue, O.; Chamari, K. Influence of Fatigue, Stress, Muscle Soreness and Sleep on Perceived Exertion during Submaximal Effort. Physiol. Behav. 2013, 119, 185–189. [Google Scholar] [CrossRef] [PubMed]
- Green, J.M.; McLester, J.R.; Crews, T.R.; Wickwire, P.J.; Pritchett, R.C.; Redden, A. RPE-Lactate Dissociation during Extended Cycling. Eur. J. Appl. Physiol. 2005, 94, 145–150. [Google Scholar] [CrossRef] [PubMed]
- Weltman, A.; Weltman, J.Y.; Kanaley, J.A.; Rogol, A.D.; Veldhuis, J.D.; Hartman, M.L. Repeated Bouts of Exercise Alter the Blood Lactate-RPE Relation. Med. Sci. Sports Exerc. 1998, 30, 1113–1117. [Google Scholar] [CrossRef] [PubMed]
- Garcin, M.; Fleury, A.; Billat, V. The Ratio HLa: RPE as a Tool to Appreciate Overreaching in Young High-Level Middle-Distance Runners. Int. J. Sports Med. 2002, 23, 16–21. [Google Scholar] [CrossRef] [PubMed]
- Herman, L.; Foster, C.; Maher, M.; Mikat, R.; Porcari, J. Validity and Reliability of the Session RPE Method for Monitoring Exercise Training Intensity. S. Afr. J. Sport. Med. 2006, 18, 14. [Google Scholar] [CrossRef]
- Ten Haaf, T.; van Staveren, S.; Oudenhoven, E.; Piacentini, M.F.; Meeusen, R.; Roelands, B.; Koenderman, L.; Daanen, H.A.M.; Foster, C.; de Koning, J.J. Prediction of Functional Overreaching From Subjective Fatigue and Readiness to Train After Only 3 Days of Cycling. Int. J. Sports Physiol. Perform. 2017, 12, S87–S94. [Google Scholar] [CrossRef]


| Characteristics | Females (n = 6) | Males (n = 6) |
|---|---|---|
| Age (years) | 21.2 ± 3.0 | 21.2 ± 2.9 |
| Mass (kg) | 67.5 ± 8.8 | 76.8 ± 5.7 |
| Height (cm) | 171.0 ± 8.6 | 176.1 ± 4.1 |
| Peak Power Output (W) | 190.5 ± 24.6 | 258.5 ± 31.0 |
| VO2peak (mL/kg/min) | 46.8 ± 2.6 | 51.8 ± 6.1 |
© 2020 by the authors. Licensee MDPI, Basel, Switzerland. This article is an open access article distributed under the terms and conditions of the Creative Commons Attribution (CC BY) license (http://creativecommons.org/licenses/by/4.0/).
Share and Cite
Fusco, A.; Sustercich, W.; Edgerton, K.; Cortis, C.; Jaime, S.J.; Mikat, R.P.; Porcari, J.P.; Foster, C. Effect of Progressive Fatigue on Session RPE. J. Funct. Morphol. Kinesiol. 2020, 5, 15. https://doi.org/10.3390/jfmk5010015
Fusco A, Sustercich W, Edgerton K, Cortis C, Jaime SJ, Mikat RP, Porcari JP, Foster C. Effect of Progressive Fatigue on Session RPE. Journal of Functional Morphology and Kinesiology. 2020; 5(1):15. https://doi.org/10.3390/jfmk5010015
Chicago/Turabian StyleFusco, Andrea, William Sustercich, Keegan Edgerton, Cristina Cortis, Salvador J. Jaime, Richard P. Mikat, John P. Porcari, and Carl Foster. 2020. "Effect of Progressive Fatigue on Session RPE" Journal of Functional Morphology and Kinesiology 5, no. 1: 15. https://doi.org/10.3390/jfmk5010015
APA StyleFusco, A., Sustercich, W., Edgerton, K., Cortis, C., Jaime, S. J., Mikat, R. P., Porcari, J. P., & Foster, C. (2020). Effect of Progressive Fatigue on Session RPE. Journal of Functional Morphology and Kinesiology, 5(1), 15. https://doi.org/10.3390/jfmk5010015