1. Introduction
A task-based clinical assessment of mobility and dynamic postural control that elicits full kinematic chain (foot to hand) three-dimensional joint movements has been advocated [
1,
2]. This is clinically important considering that testing of joints in isolation does not capture the neuromuscular control involved in the joint or muscular synergies necessary for dynamic postural control. Foot and hand reaches are task-driven tests that can capture this interaction. The star excursion balance test (SEBT) is a well-established, reliable clinical tool for dynamic postural control [
3] that assesses different neuromuscular functions, such as proprioception [
4], joint range of motion (ROM) [
5] and lower extremity strength and balance [
6]. Clinically, the SEBT has proved to be sensitive in detecting functional deficits in patients with different lower extremity dysfunctions and diagnoses [
3], improvements in response to training [
7], and predicting the risk of lower extremity injuries [
8]. However, the SEBT does not examine trunk, upper extremity and all hip joint movements in the assessment of dynamic postural control, and therefore is not well suited to revealing functional deficits in these joints in combination with lower extremity joint movements. A systematic combination of hand reaches has the potential to capture this interaction.
Hand reaches beyond arm’s length from standing elicit a dual role of the trunk and lower extremities in both postural stability and joint movements in transferring the hand to the target, linking posture and movement coordination [
9,
10,
11]. As reach distance increases, the trunk, upper and lower extremities work together as one functional unit to move the body toward the target [
9] with a greater movement of center of the mass (COM) [
9,
11] and increased joint movements [
12]. In addition, different reach directions describe different limits of stability [
13]. Furthermore, 95% of the activities of daily living involve trunk and arm movement [
14], and falls often occur while reaching [
15]. Hand action is also closely linked with movement of the rest of the body and thus with performance in volleyball, tennis, golf and throwing sports. Therefore, a systematic combination of hand reaches in different directions might prove to be a highly relevant clinical tool.
Currently, different hand reach tests are used for assessing dynamic postural control and upper body mobility and stability [
13,
16,
17,
18,
19]. However, a validated and reliability-tested hand reach test battery, comparable to the SEBT, that elicits ankle, knee, general hip, trunk and upper extremity joint movements in standing is currently not available. Such a test battery would provide the clinician with a tool for quantitative (cm or °), qualitative (magnitude and coordination) and subjective assessment of dynamic postural control and full body movement (functional mobility). Therefore, we developed the hand reach star excursion balance test (HSEBT), which consists of ten different hand reaches on each foot in the same directions as the SEBT, with the addition of two rotational reaches. The HSEBT measures hand reach distance (cm or °) while engaging the full kinetic chain (hand to foot) under reach-specific constraints dictated, for example, by stance position and reaching arm. Thus, the HSEBT has the potential to complement the SEBT as a clinical tool in the assessment of dynamic postural control.
The current paper reports on two studies that were conducted to evaluate the reliability and internal validity of the HSEBT. Specifically, the purposes were to (i) determine test–retest reliability; (ii) document the inter-rater reliability of all HSEBT reaches; (iii) validate reach measurements (cm and °) collected by a trained physiotherapist against kinematic measurements and (iv) provide reference data for a young healthy male population.
2. Materials and Methods
2.1. Participants
Two convenience samples of 29 (age 25.4 ± 6.4 years; height 180.0 ± 9.3 cm; mean ± SD) and 28 (age 23.8 ± 2.2 years; height 181 ± 6.0 cm; mean ± SD) recreationally active, healthy male subjects volunteered for the reliability analysis and kinematic validation respectively. Exclusion criteria were musculoskeletal or neurological dysfunction or injury in the past six months. All subjects gave written informed consent. The regional committees for medical and health research ethics in Norway (reference number: 2012/1736 A; approval date: 12 October 2012) and Norwegian Data Protection Agency (reference number: 40996) approved the study, and it was carried out according to the rules of the Declaration of Helsinki. The subjects’ height and weight were obtained using a Seca model 217 stadiometer and a Seca flat scale (Seca GmbH. & Co., Hamburg, Germany).
2.2. Research Design
Reliability was determined using a within-subjects repeated measures design, while the validation was a cross-sectional study.
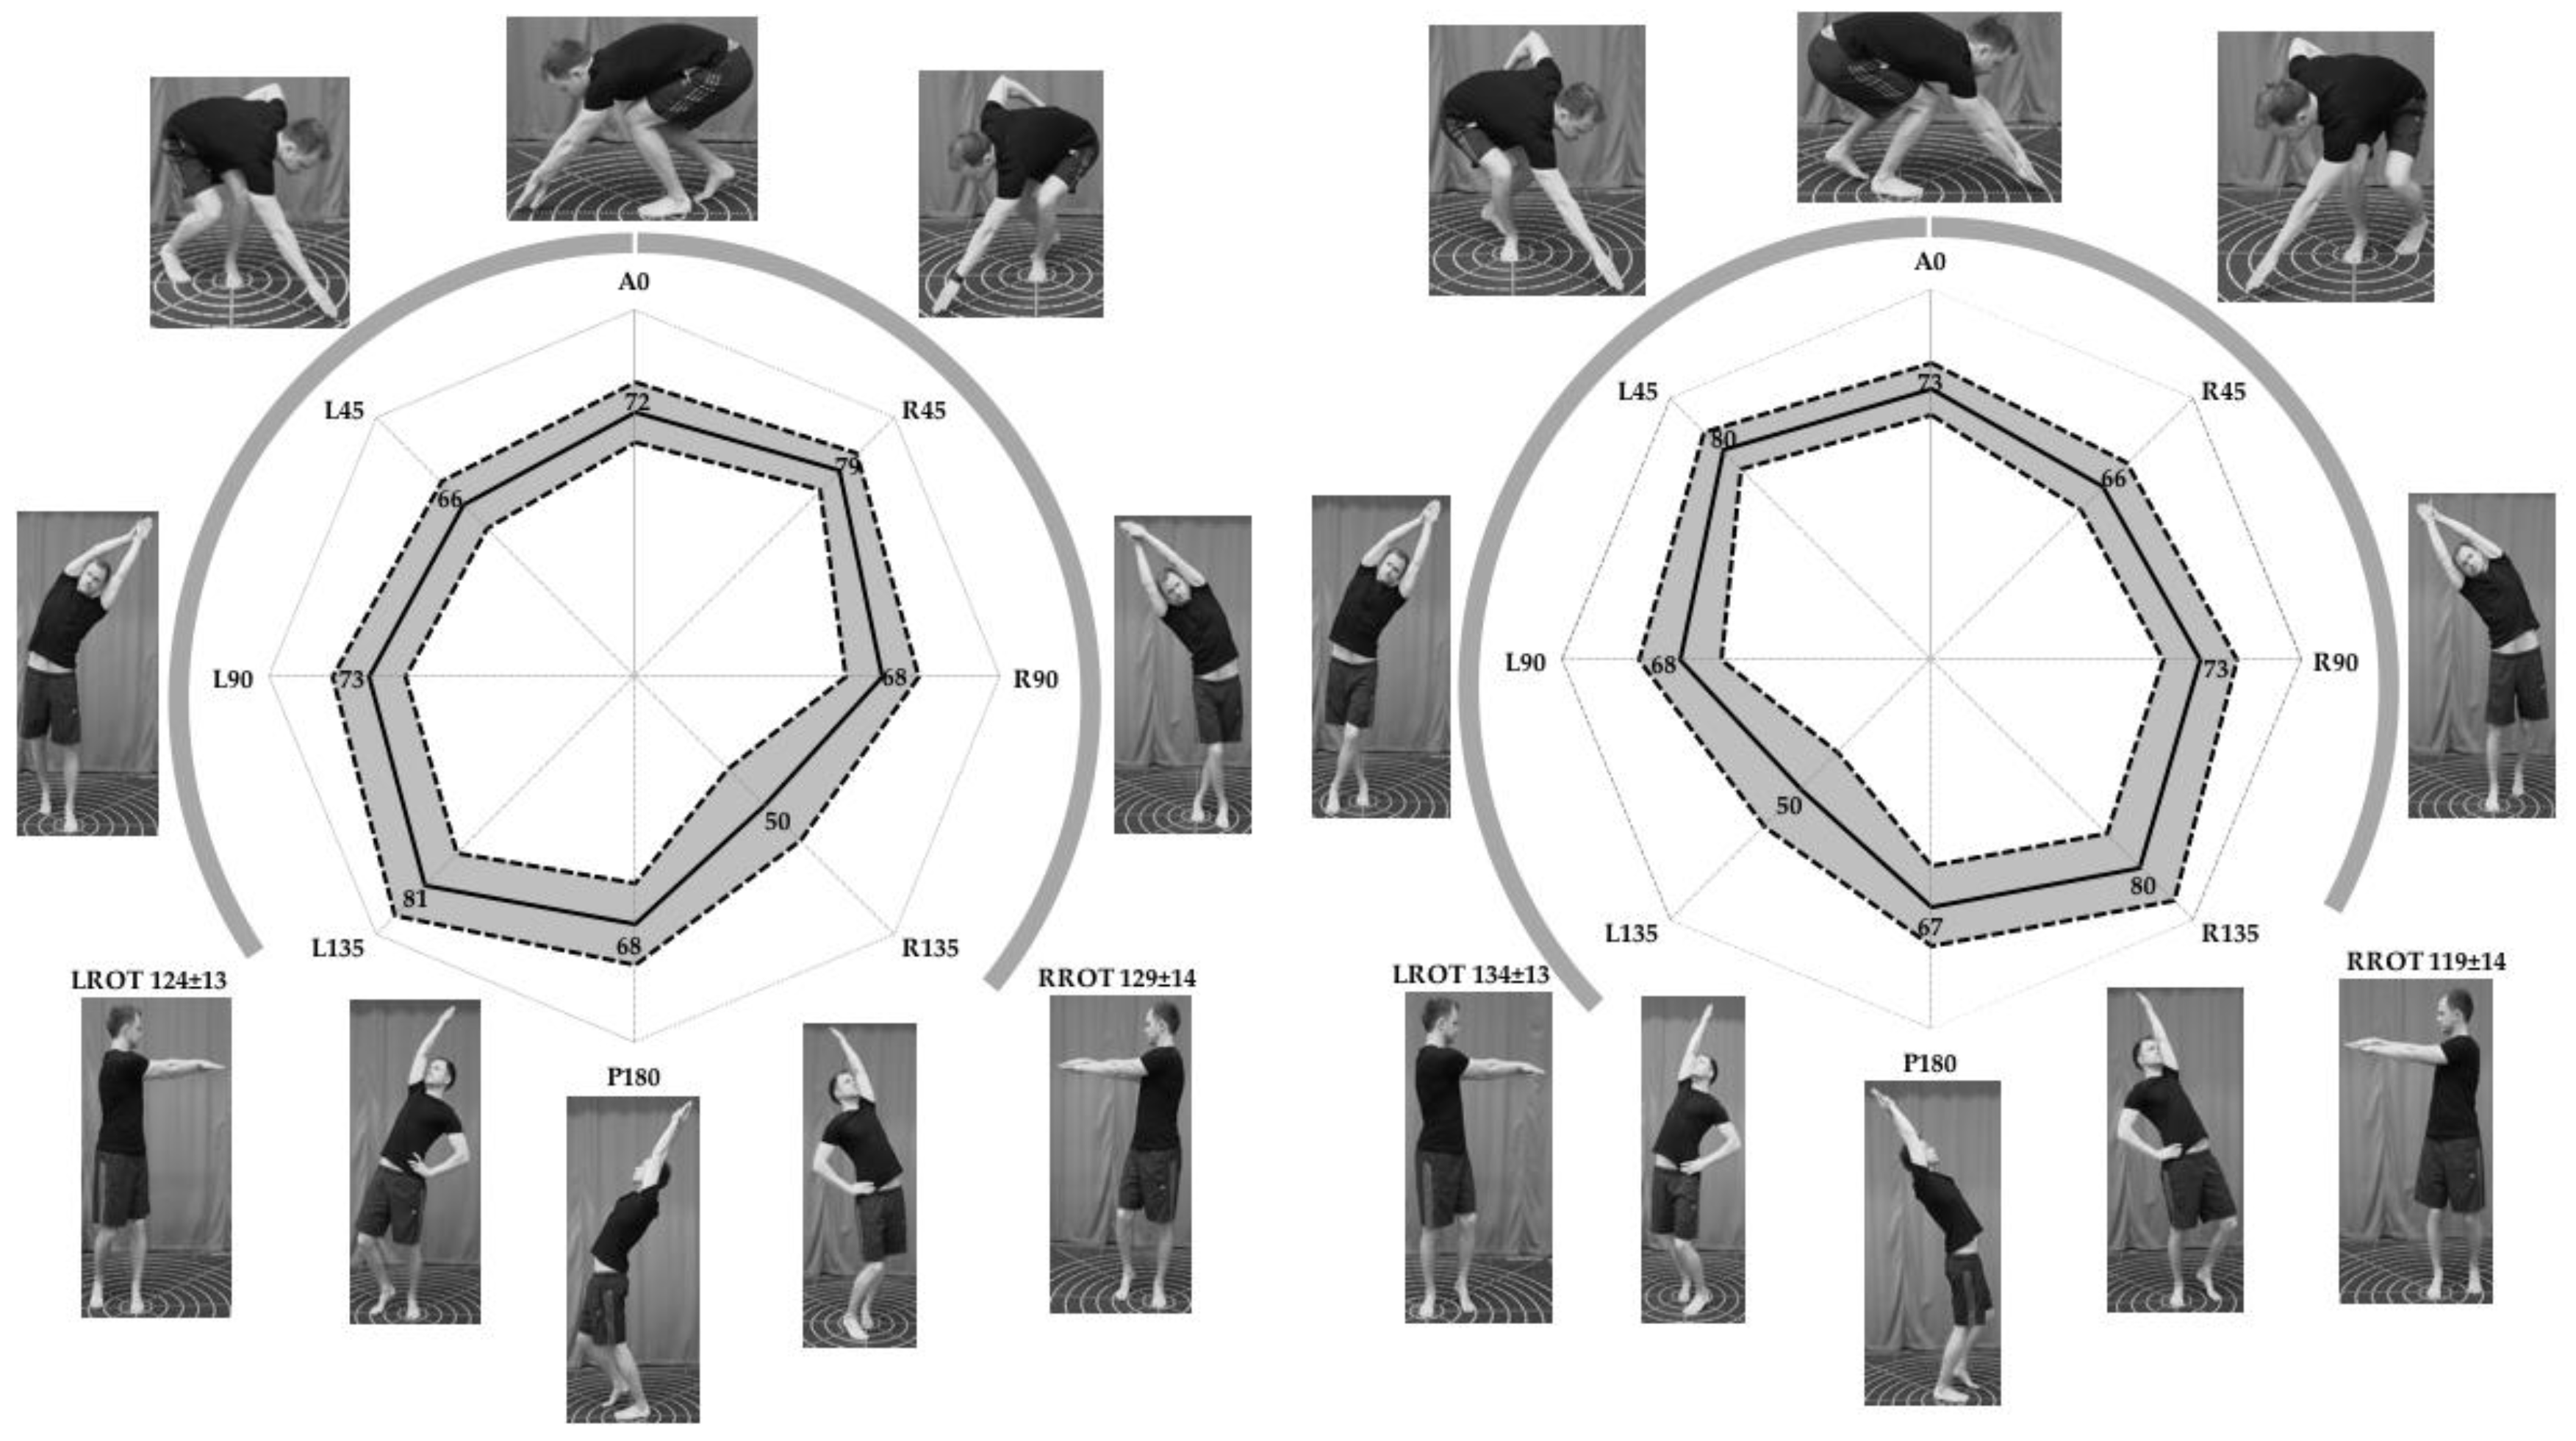
2.3. Procedures Hand Reach Star Excursion Balance Test (HSEBT)
The HSEBT consists of eight horizontal and two rotational hand reach tests executed separately standing on the right and the left foot. Similar to the SEBT [
3], the horizontal HSEBT reaches are performed along eight reaching directions at 45 degree intervals and categorized into movement patterns according to the following criteria: (1) flexion (three reaches forward to the ground); (2) extension (three reaches backward overhead) and (3) lateral (two reaches laterally overhead). The two rotational reaches are performed with both shoulders flexed to 90°. Furthermore, hand reaches are classified as either pure plane (reaches within a cardinal plane) or diagonal (reaches that combine planes of motion).
The individual hand reach tests were defined based on the anatomical neutral position as follows: direction (i.e., anterior (A); posterior (P)), side of body (left (L); right (R)); angle at 45° increments from anterior (0°) to posterior (180°); and movement (rotation (ROT)). Thus, pure plane reaches were named A0, P180, R90, L90, LROT and RROT, while diagonal reaches were named R45, R135, L45, and L135. The pure plane and diagonal reaches are bilateral and unilateral hand reaches, respectively.
Table 1 and
Table 2 identify stance foot and hand(s) reaching, while
Figure 1 shows the maximum reach positions for all tests. Note that these definitions differ from the SEBT reaching directions defined based on stance foot [
3].
All reaches were performed in the same order (
Table 1 and
Table 2) and testing procedures were based on starting position, movement and measurement. The starting positions were defined as follows: (1) one foot (stance foot) without footwear, positioned in the center of the testing mat; (2) longitudinal axis of stance foot (bisection of heel to second toe) aligned with the A0 to P180 line; (3) other foot (support foot) placed at a 135° angle (toe-touch) relative to the reach vector and rotated in the direction of the reach, with the exception of rotational and lateral movement patterns, where the support foot is oriented in the A0 direction; (4) support foot placed parallel to the stance foot (L90 or R90) for rotational reaches; and (5) diagonal reaches are unilateral hand reaches where the trunk is aligned with the reach vector prior to reaching, and the hand reaching is based on crossing the A0 to P180 line from starting to maximum reach position with the other hand placed on the hip. Movement was defined as follows: (1) the heel and the head of the first and fifth metatarsals of the stance foot maintain ground contact while reaching; (2) elbows extended and wrists in neutral positions; (3) when reaching to the floor (flexion), no weight support with the reaching hand(s) was allowed; and (4) subjects were instructed to reach as far as possible and return to the starting position without losing balance. Measurement was defined as follows: (1) all horizontal reach distances were measured in centimeters (cm) from the center of the mat to the tip of the third digit; (2) rotational reaches were measured in degrees (°); and (3) in extension, lateral, and rotational reaches a plumb line (extension, lateral) or a rod (rotation) was used to project the position of the middle digit to the testing mat. A minimum of three practice trials were given for each reach, after which three valid reaches were recorded, with the maximum value used for analysis.
Similarly to when conducting an SEBT, drawing or taping a star onto the ground to indicate the direction of axes and their scale (cm), with the addition of concentric circles marked at 5° intervals, proved to be a helpful preparation. For ease of measurement, a mat with imprinted reaching directions with marks at 2 cm intervals and nine concentric circles at 10 cm intervals (Athletic Knowledge Nordic AB, Stockholm, Sweden) was used to determine reach performance. The outer concentric circle (90 cm radius) with marks at 5-degree intervals was used to measure rotational reaches.
2.4. Procedure Testing Reliability
Each subject completed the HSEBT a total of four times across four different days. One of three raters (convenience sample) administered the HSEBT independently each day, thus one rater administered the HSEBT twice. Specifically, the rater who tested all subjects twice was a physical therapist with two years’ experience in administering the HSEBT, while the other two raters were sports science students with one year of experience. All tests were done independently by each rater, the order of raters was randomized for each subject, and the order of reaches was the same for all sessions (
Table 1 and
Table 2). Testing sessions for each subject were scheduled at the same time of day when possible; 8 a.m.–12 noon (morning) or 12 noon–6 p.m. (afternoon), since time of day has been found to influence performance on a similar test battery (SEBT) [
20]. Raters were blinded to inter-rater reliability and test–retest reliability results.
2.5. Procedure Testing Validity
For the validity assessment, the volunteers were equipped with reflective markers to capture movements and postures while executing the HSEBT. The motion tracking system consisted of 15 Oqus cameras (ProReflex®, Qualisys Inc., Gothenburg, Sweden) recording at 480 Hz. A total of seventy-nine spherical reflective markers (20 mm Ø) were attached over specific anatomical landmarks using bi-adhesive tape. For the purpose of validation (cm and °), the following markers were used: foot (calcaneal, 1st and 5th metacarpal marker); leg (medial and lateral malleoli marker); hand (dorsal surface 5th metacarpal marker); upper arm (medial and lateral epicondyle and marker clusters (attached firmly using tensoplast elastic tape (BSN Medical GmBH, Hamburg, Germany)); and the thorax segment (acromion). Markers were identified using Qualisys software (Göteborg, Sweden). Gaps in marker trajectories were interpolated and reconstructed as needed. Otherwise marker data were not treated or filtered.
All HSEBT reaches were recorded on the same testing mat and performed according to the testing procedures described previously, with the exception of the measurements for extension, lateral and rotational movement patterns. These measurement procedures were changed since a tester standing next to the subject obstructed the field of view for multiple cameras, making the tracking of markers difficult. For these movement patterns a vertical pole mounted on a plate was used and moved along the horizontal reach vectors or along the outer concentric circle to the maximum reach position by a tester lying on the floor. The order of tests (
Table 3) was the same for all subjects. The maximum reach distance of three trials (Max
m) for each HSEBT reach was used for analysis.
Analysis of kinematic data was done using Visual 3D® (C-Motion Inc., Rockville, MD, USA). Calibration of the kinematic model was carried out using marker locations registered while standing. Local coordinate systems for the foot and upper arm were created according to the International Society of Biomechanics (ISB) recommendations. Specifically, the local foot coordinate system was located at ground level with the origin at the midpoint between the calcaneal marker and the midpoint between the two metacarpal markers to reflect the center of the testing mat. A ZYZ cardan sequence (Zfirst = horizontal adduction and abduction, Y = abduction and adduction, Zthird = internal and external rotation) was used for orientation of the upper arm segments in the validation of rotational reaches.
Maximum reach events were defined as the position of the ipsilateral metacarpal marker relative to the stance foot in the global coordinate system (orientations: x (+) anterior, y (+) right lateral and z (+) vertical) for the different HSEBT reaches as follows: flexion (minimum z-coordinate value), lateral (minimum and maximum y-coordinate values), extension (minimum z-coordinate value except P180 reaches the minimum x-coordinate value) and rotational movement patterns (minimum x-coordinate value). Reach distances (Maxkin) for the horizontal reaches were then calculated from the position of the metacarpal marker at the maximum reach event in the coordinate system of the stance foot. Specifically, Maxkin was quantified as |x| and |y| (pure plane reaches) and √(x2 + y2) (diagonal reaches). An underestimation of Maxkin relative to Maxm is expected for horizontal reaches since the foot coordinate system is not exactly aligned with the center of the testing mat, and the position of the 5th metacarpal marker underestimates the position of the distal-most point of the third digit. Maxkin for rotational reaches was defined as the orientation (°) (first rotation (Z) of the ipsilateral upper arm segment) at the maximum reach event resolved in the local coordinate system of the stance foot.
2.6. Statistical Analysis
Descriptive statistics (mean and standard deviation (SD)) were calculated in Excel for Mac OS 10.10.5 (Apple Inc., Cupertino, CA, USA), version 14.4.8 (Microsoft Corp., Redmond, WA, USA) for all tests included in the analysis of inter-rater and test–retest reliability. Specifically, test–retest and inter-rater SDs were calculated using Equations (1) and (2) respectively. All other analyses were done using IBM SPSS version 21.0 (IBM, Armonk, NY, USA). Inter-rater and test–retest reliability were assessed for each test by calculating intraclass correlation coefficients (ICC
2,3) and (ICC
2,1) respectively. The following criteria were used to evaluate ICCs: high ≥0.90, 0.80–0.89 moderate and below 0.80 questionable. Stability of measurements was assessed by calculating the standard error of measurement (Equation (3)), and the coefficient of variation (CV) for test–retest (Equation (4)) and inter-rater reliability (Equation (5)). Minimal detectable change (MDC
95) was calculated for a 95% confidence interval for both test–retest and interrater reliability (Equation (6)). A within-subjects repeated-measures analysis of variance (ANOVA) was performed with the independent variable being day (1, 2, 3, 4) to identify whether any learning effects had occurred between sessions. The same analysis was done with the independent variable being rater (1, 2, 3), where only the first session of the rater who tested the subjects twice was used. The level of significance was set at 95% (α = 0.05).
The validity of HSEBT reaches was determined by comparing Max
m to Max
kin using linear regression analysis and the Bland Altman method. Correlation coefficients of 0.50–0.75 and >0.75 were considered moderate to good and good to excellent, respectively. The normal distribution of difference between measurements (Equation (7)) was assessed using the Shapiro-Wilk test. In the presence of a non-normal distribution of Max
diff, a ratio of manual to kinematic measurements was calculated (Equation (8)) and used in the subsequent analysis. Bland Altman plots were then generated for Max
diff or r
m_kin (
y-axis) and averages of measurements (Equation (9)) (
x-axis). Bias between measurements (Max
diffmean) was calculated (Equation (10)) with standard deviation (Max
diffSD) and then plotted with 95% confidence interval (Max
diffmean ± 1.96Max
diffSD). Then standard error difference scores were calculated (Equation (11)). Max
diff outliers were determined using the outlier labelling rule of 2.2 multiples of the upper and lower quartiles. Values outside this range were removed from the analysis.
3. Results
There were 6.4 ± 6.1 days between sessions and 63.2% of the test sessions were scheduled at the same time of the day (morning or afternoon) as the previous tests. HSEBT reach tests, ICC, SEM and CV for interrater and test–retest reliability are listed in
Table 1, which is organized so that the same tests, left and right, follow each other (grey and white). In addition, HSEBT reach scores (mean ± SD) for all hand reach tests (four sessions) are presented in
Figure 1.
Test–retest reliability was moderate to high for 19/20 HSEBT reaches (ICC: 0.80 to 0.96) with right foot L90 reach being questionable (ICC = 0.77). SEM ranged from 0.3 to 2.8 cm and 1.7° to 2.6° for horizontal and rotational reaches respectively, while CV ranged from 2.1% to 13.1%. MDC
95 ranged from 0.9–7.9 cm and 4.7°–7.2° for horizontal and rotational reaches, respectively (
Table 1).
Inter-rater reliability was high (ICC: 0.90 to 0.98) with SEM ranging from 0.3 to 2.1 cm and 1.8° to 2.4° for horizontal and rotational reaches respectively. CV values ranged from 3.1% to 14.6% (
Table 1). MDC
95 ranged from 0.9 to 5.7 cm and 5.1° to 6.6° for horizontal and rotational reaches, respectively (
Table 1). There was no effect of test session (day) on the results; however, a significant difference between raters was observed for the following tests (maximum difference between raters identified in parentheses): left foot A0 reach (1.4 cm); right foot L135 reach (5.6 cm); left foot L90 reach (2.6 cm); right foot LROT reach (6.9°); and L foot LROT reach (5.4°) (
Table 2).
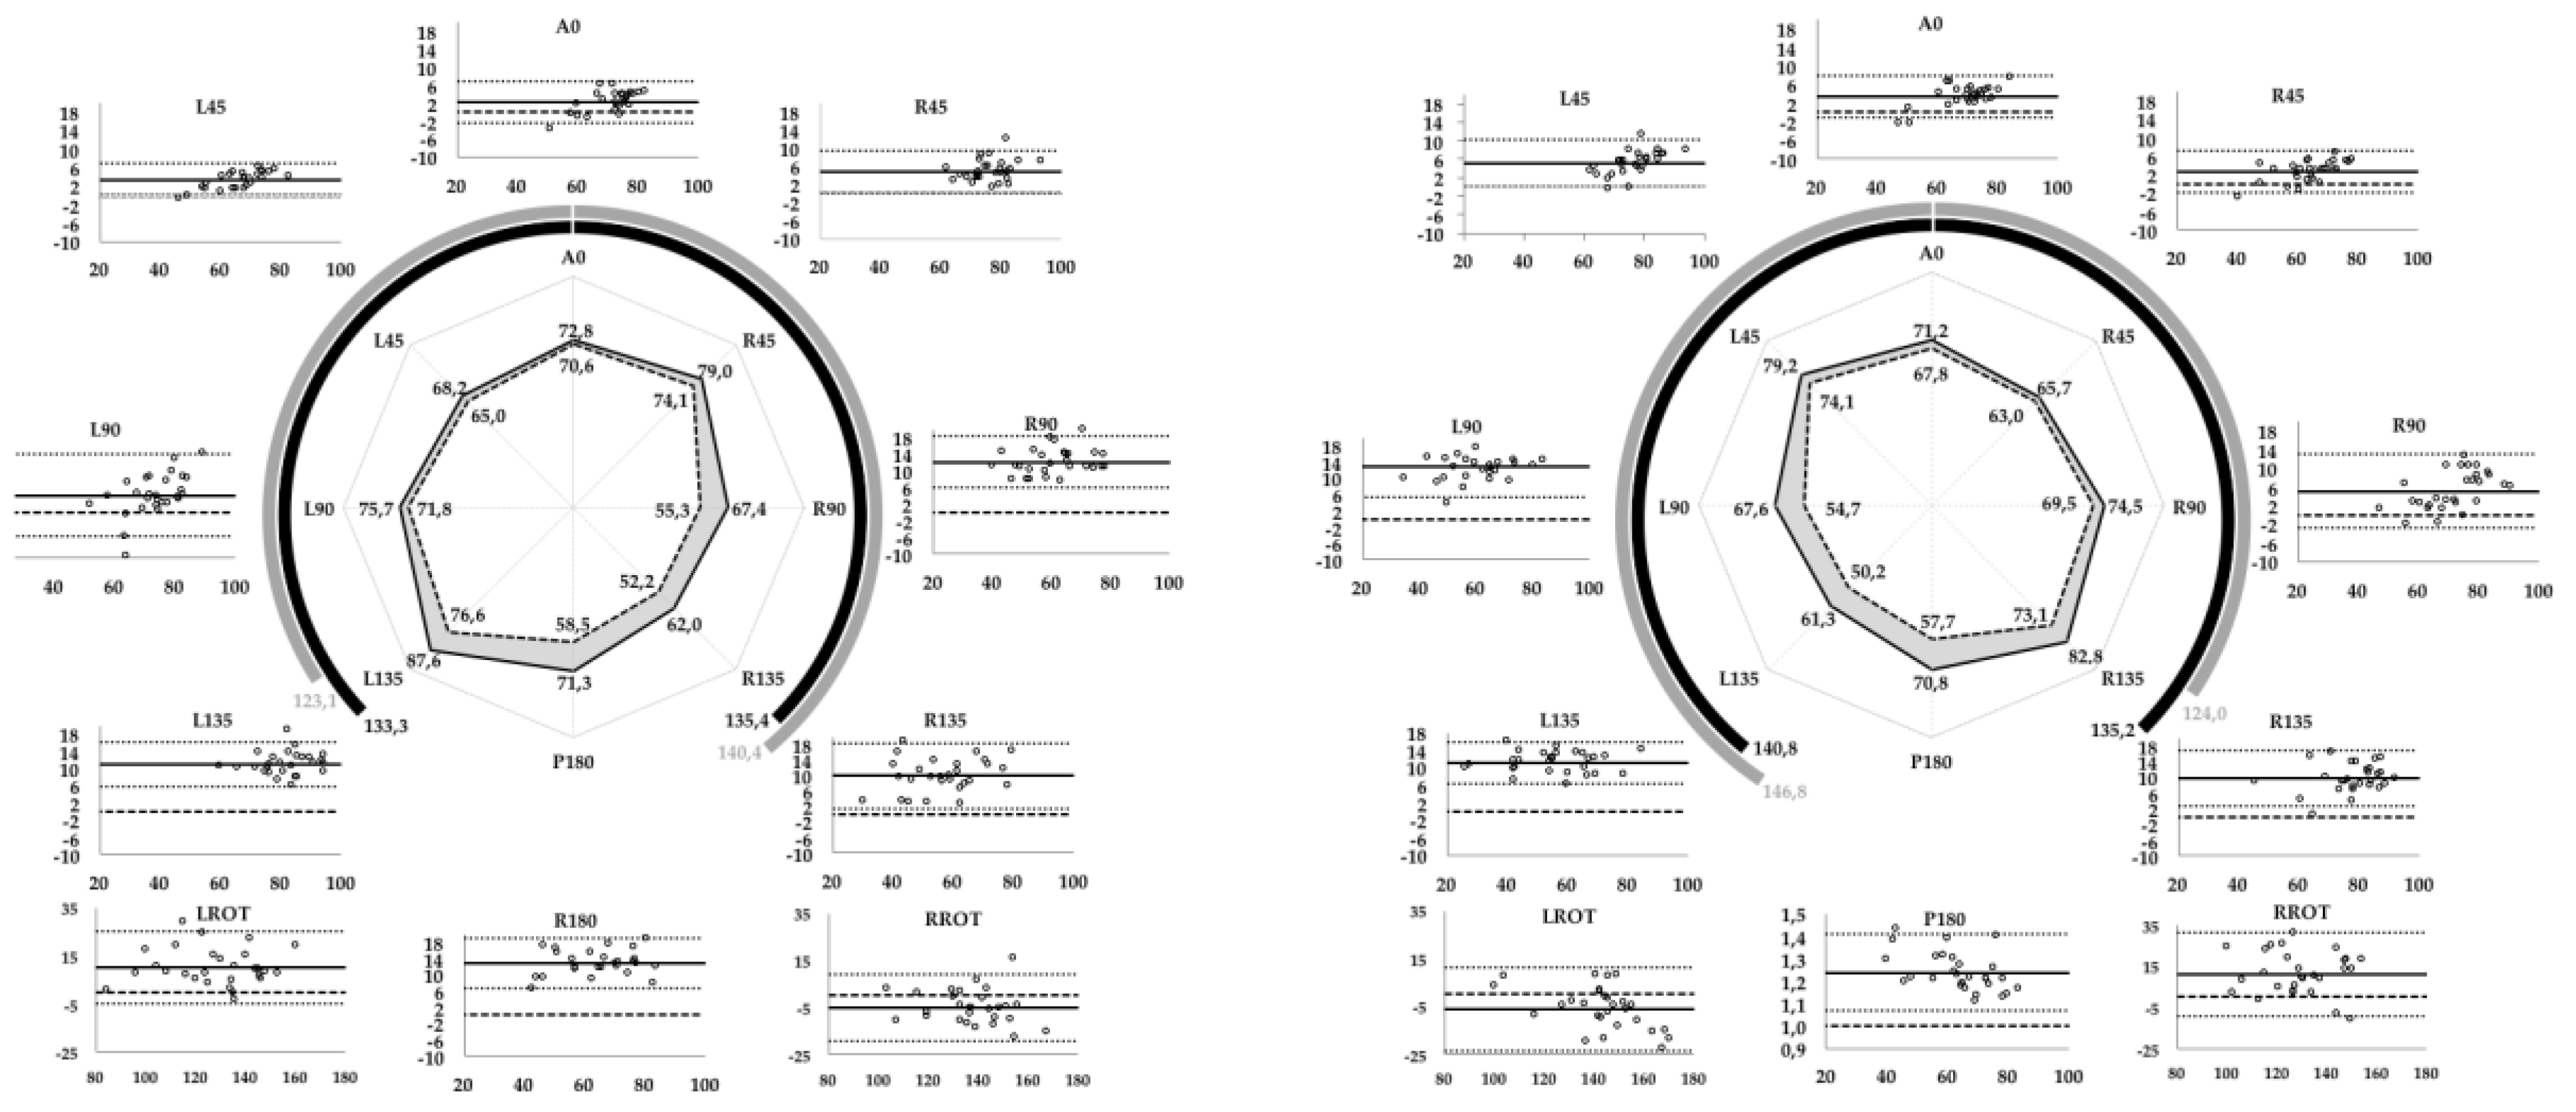
There was a strong relationship between Max
m and Max
kin measurements for all HSEBT reaches. Max
m and Max
kin measurements for 18/20 tests had excellent correlation coefficients (
r ≥ 0.90) and a shared variance of 81 to 97%, while two tests, left foot RROT (
r = 0.89) and right foot RROT (
r = 0.79), had a shared variance of 79% and 63% respectively (
Table 3). Max
diff was normally distributed as assessed by Shapiro Wilk’s test with one exception, right foot P180 reach (
p = 0.045); however, r
m_kin for this test was normally distributed (
r = 0.067) and used in the agreement analysis (
Table 3). There was a positive fixed bias (Max
diffmean) for all horizontal reaches ranging from 2.2 to 12.8 cm and 23.7% (
rm-kin = 1.237) for the right foot P180 reach test. Fixed biases for the rotational reaches were positive for ipsilateral (10.2 to 11.2°) and negative for contralateral rotational reaches (−5.0 to −6.0°) (
Table 3 and
Figure 2).
4. Discussion
The current study has established the HSEBT as a reliable and valid test battery for hand reaches, with description of the testing procedures and reference values for a young, healthy male population. The HSEBT has moderate to high test–retest and inter-rater reliability, with ICC results similar to or better than comparable tests such as SEBT [
21] and functional reach test (FR) [
22]. Response stability (SEM and CV) was also comparable to these tests [
16,
21,
22], while MDC
95 was smaller than what has been reported for the SEBT [
23]. No learning effect between test sessions was observed, but there was a small yet systematic difference between raters in five tests. Manual (Max
m) and calculated (Max
kin) hand reach measurements had good to excellent correlation. However, agreement analysis showed a fixed bias for all HSEBT reaches, which can be partially explained by the methods used for kinematic calculation (Max
kin).
The reliability results (ICC values) obtained in the current study are comparable to other tests of dynamic postural control and functional mobility. The HSEBT test–retest reliability ICC values ranged from 0.77 to 0.96, while FR test–retest reliability ICC values of 0.89 and 0.92 have been reported [
16,
22]. Upper quarter Y balance tests and the multi-directional reach tests were found to range from 0.80 to 0.99 [
19] and 0.93 to 0.95 [
13], respectively. SEBT ICC test–retest values range from 0.84 to 0.98 [
23,
24,
25,
26]. Furthermore, the inter-rater reliability of the HSEBT was high, with ICC values ranging from 0.90 to 0.98. FR inter-rater ICC values between 0.73 and 0.98 have been reported [
22,
27,
28], while SEBT values range from 0.81 to 0.93 [
21,
24,
26,
29]. Even though our ICC results showed high HSEBT inter-rater reliability, the repeated measure ANOVA results suggested that in five of the 20 tests at least one rater differed systematically from the other raters (
Table 2). Effects of test administrators on the results therefore cannot be ruled out. In contrast, test day did not have an impact on the results (
Table 2).
Response stability, as quantified by SEM, ranged in the current study from 0.3 to 2.8 cm and from 1.7° to 2.6° for both test–retest and interrater reliability. The SEM values reported for the SEBT range from 2.2 to 4.8 cm and 2.0 to 5.0 cm for test–retest and inter-rater reliability, respectively [
21,
23,
30], while FR ranged from 2.1 to 4.0 cm and 2.1 to 4.3 cm for inter-rater and test–retest reliability, respectively [
22]. In summary, the SEM values found for HSEBT are comparable or lower than those established for the SEBT and FR.
However, CV is a more appropriate measure of response stability than SEM when comparing HSEBT to SEBT and FR. In the current study the CV ranged from 2.1% to 13.1% and 3.1% to 14.6% for test–retest and inter-rater reliability, respectively. Some of these values are higher than the test–retest CVs reported for the SEBT, 2.0% to 4.6% [
25], and the FR, 2.5% [
16]. One potential reason for these relatively large variations is the influence of visual feedback. When subjects could see how far they reached (flexion) a considerably lower variation was observed (test–retest CV: 2.1–3.8%; inter-rater CV: 3.1–5.2%), than when the subjects were blind to the test results (lateral and extension) (test–retest CV: 5.2–13.1%; inter-rater CV: 5.6–14.6%).
MDC values are change scores important from both a clinical and a research perspective. MDC
95 for the horizontal and rotational reaches ranged from 0.9 to 7.9 cm and 4.7° to 7.2° respectively for both inter-rater and test–retest reliability (
Table 1). Based on clinical experience, a 5 cm change in flexion and 7 cm change in lateral and extension movement patterns have been considered clinically meaningful in documenting change or right-to-left asymmetry. However, our results suggest that mostly lower values, 0.9 to 2.8 cm, 2.3 to 6.3 cm, and 2.2 to 7.9 cm, can be used in flexion, lateral and extension movement patterns respectively (
Table 1). Based on our findings and clinical experience we recommend 5 cm in flexion and 7 cm in lateral and extension movement patterns as a clinically meaningful difference. These values are comparable to what has been reported for the SEBT (5–7 cm) [
23], while others have found slightly greater values [
24]. In their discussion, Munro and co-workers argue that an MDC of 5–7 cm (6–8% of leg length) puts into question previously established side differences of 4.2 cm and 2–5% in patients with and without chronic ankle instability (CAI) [
23], as well as the 4 cm SEBT side difference used to determine risk of lower extremity injury in high school basketball players [
25].
There was a good to excellent relationship between Max
m and Max
kin measurements, similar standard deviations, and a shared variance ranging from 63% to 97% for all HSEBT reaches. However, agreement analysis using the Bland Altman method found a fixed bias for all tests, which can be partially explained by the position of the center of the foot coordinate system relative to the geometric center of the foot, and the orientation of the hand at maximum reach position. The observed differences in fixed biases for the horizontal reaches ranged from 2.2 to 5.1 cm, 3.8 to 12.8 cm and 9.7 to 12.8 cm (
Table 3) for flexion, lateral and extension movement patterns, respectively. The difference between flexion and extension movement patterns can be partially explained by the definition of the foot coordinate system. The center of the foot coordinate system will be posterior to the geometrical center of the foot used as a reference for foot placement on the testing mat. This will decrease and increase the influence of the distance (cm) from the 5th metacarpal marker to the distal-most point of the third digit in flexion and extension movement patterns, respectively, based on the assumption of similar hand orientation. The influence of hand orientation can be exemplified and may partially explain the observed differences between lateral movement patterns. There were directional specific differences in the fixed bias for ipsilateral and contralateral overhead reaches of 3.8 to 5.1 cm and 12.0 to 12.8 cm, respectively. The hand had a stronger vertical orientation in the maximum reach position in the ipsilateral than in the contralateral overhead reach (visual observation). Thus, the 5th metacarpal marker will better approximate the position of the distal-most point of the third digit (
y-coordinate) in the ipsilateral than in the contralateral overhead reach. Fixed bias for rotational reaches can be partially explained by the orientation of the ipsilateral upper arm to the stance foot at the maximum reach event. Max
kin values were higher and lower than Max
m for contralateral and ipsilateral rotational reaches, respectively. A greater contribution of shoulder horizontal adduction in contralateral rather than horizontal abduction in ipsilateral rotational reaches (visual observation) can explain the observed difference. Based on the good to excellent correlation coefficients between Max
m and Max
kin, and because kinematic methods can explain the observed fixed biases, manual measurements of hand reach distance (cm) and rotation (°) seem valid.
4.1. Clinical Application
Future research should focus on the HSEBT as a clinical measure for dynamic postural control and functional joint mobility testing in different populations. In particular, the application of HSEBT, possibly in combination with SEBT, should be explored in sports where hand and arm action is closely linked with the movement of the rest of body, such as volleyball, tennis, golf and various throwing sports. Furthermore, different reach directions describe different limits of stability [
13] and since falls often occur while reaching [
15] HSEBT may be an interesting clinical tool in determining fall risks. In addition, the ability to assess the influence of other joints and regions on specific diagnoses such as low back pain (LBP) and shoulder instability has the potential to offer information about causative factors. We also believe that the HSEBT is a clinical measure that has the potential to differentiate pathological conditions, similar to the SEBT. The HSEBT may serve as a weight-bearing version of current clinical tests; for example, the L foot L45/R foot R45 triggers the same hip joint movements (flexion, adduction and internal rotation) that comprise a clinical test for hip impingement (FADIR).
4.2. Study Limitations
In future studies, learning effects, rest periods, and the randomization of reach orders and populations should be addressed. Each subject was given at least three warm-up attempts per reach. These were not documented and more attempts were given if the subjects were unable to complete the reach as defined by the testing procedures. Documentation of warm-up reaches could have provided additional information about learning effects. Future studies should include females, a wider age-range and different diagnoses, since only a young, healthy, male population was studied. However, the current study provides reference data that can be used for future comparisons.
The kinematic methods used to calculate maximum reach position could be improved since a fixed bias was observed for all tests. Placement of a marker at the distal-most point of the third digit of the reaching hand, and using an external reference frame (markers) with a geometrical center in the center of the mat, rather than the coordinate system of the foot, would have optimized kinematic distance calculations. In addition, the pole used to measure lateral and extension movement patterns introduced a measurement error, because the center of the base of the pole (4 cm diameter) had to be projected onto the reaching vector. However, this was necessary since the presence of a tester standing next to the subject obstructed the view of the markers used for kinematic analysis.


