1. Introduction
Competitive swimming is a worldwide sport, consisting of athletes of all ages and a multitude of strokes: butterfly, breaststroke, backstroke, and freestyle [
1]. Swimming events are often categorized as either sprint, middle-distance or distance [
1,
2,
3]. These categories are determined based on which energy systems are required for each specific distance [
4,
5]. Sprint swimming usually consists of distances that are 100 m or less, and requires short, high-intensity, explosive uses of energy that last under 60 s [
6]. In contrast, distance swimming usually consists of distances that are 400 m or more, and requires long, low-intensity, controlled uses of energy that last longer than five minutes. Middle-distance swimming usually falls between the two. Swimming performance is influenced by anthropometrical, physiological, and biomechanical factors [
1,
2,
3]. The influences of each factor have been a topic of interest in swimming research as studies have shifted from an anthropometrical and biomechanical focus to a physiological focus. While one study indicated that biomechanical factors explained most of a 100 m freestyle swim performance variability (90.3%), followed by anthropometrical (45.8%) and physiological (45.2%) parameters, a focus on physiological variables is stressed due to training adaptability and conditioning [
3].
One physiological factor this study aims to explore is the distribution of muscle composition made up of slow-twitch oxidative (type I) and fast-twitch (oxidative type IIa and glycolytic type IIx) muscle fibers [
5]. Slow-twitch (ST) fibers are predominantly suited for aerobic activities and repetitive submaximal contractions, as they are oxidative, fatigue-resistant, and have increased mitochondrial activity. In contrast, fast-twitch (FT) fibers are predominantly suited for anaerobic activities, as they generate high force, fatigue quicker, and rely on alactic and lactic energy systems. Understanding fiber types is important because these factors can help explain individual differences in sprint and distance performance, responses to training, and further help in designing programs best fit for the success of the athlete [
7]. The previous literature suggests that sprint-oriented athletes are associated with predominantly FT fibers while distance-oriented athletes are associated with predominantly ST fibers [
8]. Furthermore, swimming research has aligned with the literature, as sprint swimming ability is closely related to high relative FT fiber expression and usage of an anaerobic energy system, while distance swimming ability is closely related to high relative ST fiber expression and usage of an aerobic energy system [
9]. A study done by Gerard et al. found that biopsied muscle fiber type distribution profiles matched their respective classified swimming specialty in elite sprint and long-distance swimmers [
9]. To determine the makeup of specific muscle fiber typology, several different methods can be implemented.
Muscle biopsies are invasive, expensive, time-consuming, and technically challenging. Alternatively, non-invasive studies have shown that the usage of surface electromyography (sEMG) could be used for the determination of muscle fiber type [
10], while there is an active debate on the accuracy and interpretation of sEMG muscle fiber typing [
11]. In the absence of a muscle biopsy and sEMG, performance tests to accurately estimate muscle fiber types can be effective, rapid, and noninvasive alternatives [
12,
13]. For example, a protocol developed by Suter et al., consisting of a knee extension fatigue test performed on an isokinetic dynamometer, was demonstrated to be an effective way of determining relative muscle fiber distribution [
13]. Using a series of noninvasive functional isokinetic testing and muscle biopsy analysis for proportion of type I vs. type II fibers (%), correlations and regression models were used to explore the relations between biopsy-derived fiber type (%type I vs. %type II) and muscle function. A fatigue test of 60 maximal contractions was used to derive an estimate of the distribution of FT types in the vastus lateralis, based on the principle that a larger drop in torque output over time would correspond with a greater proportion (%) of type II vs. type I muscle fibers [
13]. The authors reported the highest correlation (r = −0.64) of %type II fibers with the relative drop in torque after 55 repetitions (T55 = torque of reps 53–55/Peak torque during test), and in the regression model, the T55 accounted for 41% of the variance in type II% fiber and the root mean square error was 8% [
13]. An individual’s response to these tests can provide valuable information about their physiology and likely sprint and distance performances of swimmers, but this has yet to be tested.
Another physiological property this study aims to explore is lactate, which accumulates in the blood as blood lactate (B
lac) and is easily measured. Lactate is a byproduct of anaerobic glycolysis and increases with intensity. B
lac accumulates when the body’s demand for oxygen exceeds the supply, and thus is often used as a marker of an individual’s ability to work under anaerobic conditions, such as sprinting, and the ability to clear lactate through aerobic processes [
5]. Lactate plays a vital role in buffering the hydrogen ion (H
+) buildup in the bloodstream during ATP hydrolysis [
5]. B
lac has become the center of attention for swimming research, as lactate threshold and post-exercise lactate levels and clearance are commonly used to track swim progress and performance [
4]. Several studies have shown that B
lac is a measure of anaerobic capacity, and it has previously been used to differentiate between sprint and distance swimmers [
1,
2,
3,
4]. Short duration, high-intensity requirements from sprint swimming have been associated with high levels of B
lac accumulation and accumulation rates, and lower clearance rates, while the opposite holds true for longer duration, lower-intensity requirements from distance swimming [
1,
2,
3,
4].
A common swim test performed to produce adequate amounts of lactate is the maximal anaerobic lactic test (MANLT), which, upon completion, is followed by B
lac measurements at different time points such as 3 min and 12 min post-test [
14,
15]. In one study, performed by Pelayo et al., measurements of B
lac concentration and performance during the MANLT during a 23-week swim season (weeks 1–10 doing aerobic training and weeks 11–23 doing anaerobic training) of six national swimmers were assessed periodically and compared [
14]. The study found that % B
lac recovery was positively correlated with the percentage of aerobic training, while % B
lac recovery was negatively correlated with the percentage of anaerobic training [
14]. These results suggest that % B
lac recovery could be an efficient marker for monitoring the impact of aerobic and anaerobic training. In an additional study conducted by Mavroudi et al., B
lac responses of highly trained swimmers compared to maximal effort sprints suggested that maximal B
lac accumulation rates were a good index of anaerobic lactic power [
15]. Similarly, Lätt et al. found that change in B
lac accumulation was the best physiological indicator of sprint swimming performance [
3]. No studies, to date, have used a combination of a fatigue test that estimates relative muscle fiber type (%fast twitch vs. slow twitch) and the MANLT that measures B
lac accumulation levels post-exercise to match and compare these test results to previously determined self/coach-identified sprint or distance event status in Division III college swimmer profiles.
Thus, we aimed to characterize these two physiological factors (Blac and %FT), how they are reflected in a swimmer’s sprint or distance status, and explore the association between estimated fiber type and Blac. Therefore, the purpose of this exploratory feasibility study was to characterize estimated muscle fiber type (i.e., %fast twitch) and Blac profiles between Division III collegiate self/coach-identified distance or sprint swimmers. It was hypothesized that sprint swimmers would exhibit greater relative content (%) of estimated fast-twitch muscle fibers and anaerobic capacity, consisting of a higher Blac maximum and minimum, and lower Blac percent decreases from all measurement times compared to distance swimmers. The findings of the current exploratory feasibility study can help guide future studies of larger scale by providing preliminary data and estimates of effect size and providing hypothesis-generating analyses.
2. Methods
2.1. Participants and General Procedures
Healthy college-aged male and female self/coach-identified sprint (n = 13) and distance (n = 9) swimmers on an NCAA Division III swim team were recruited to participate in this pilot study. Recruitment was carried out through Skidmore College email, word of mouth, and text for individuals who fit the experiment criteria. Participants were required to be an active member of the Skidmore College Division III Swimming team during the 2023–2024 season, present with no contraindications on a healthy history screening form, able to perform repeated maximal effort leg extensions and flexions, and complete a maximal anaerobic lactate swim test (MANLT) to fit the inclusion criteria. Exclusion criteria excluded participants with significant health conditions contraindicating physical activity and recovery, who smoked, and/or wore any implanted/internal electrical medical devices. All participants reported no physical or health limitations, as determined by a medical health history questionnaire and physical activity readiness questionnaire. Participants gave their written informed consent prior to participation. This study was performed in accordance with the Declaration of Helsinki, and all procedures were approved by the local ethics committee at Skidmore College (IRB# 2402-1131).
2.2. Experiment Overview
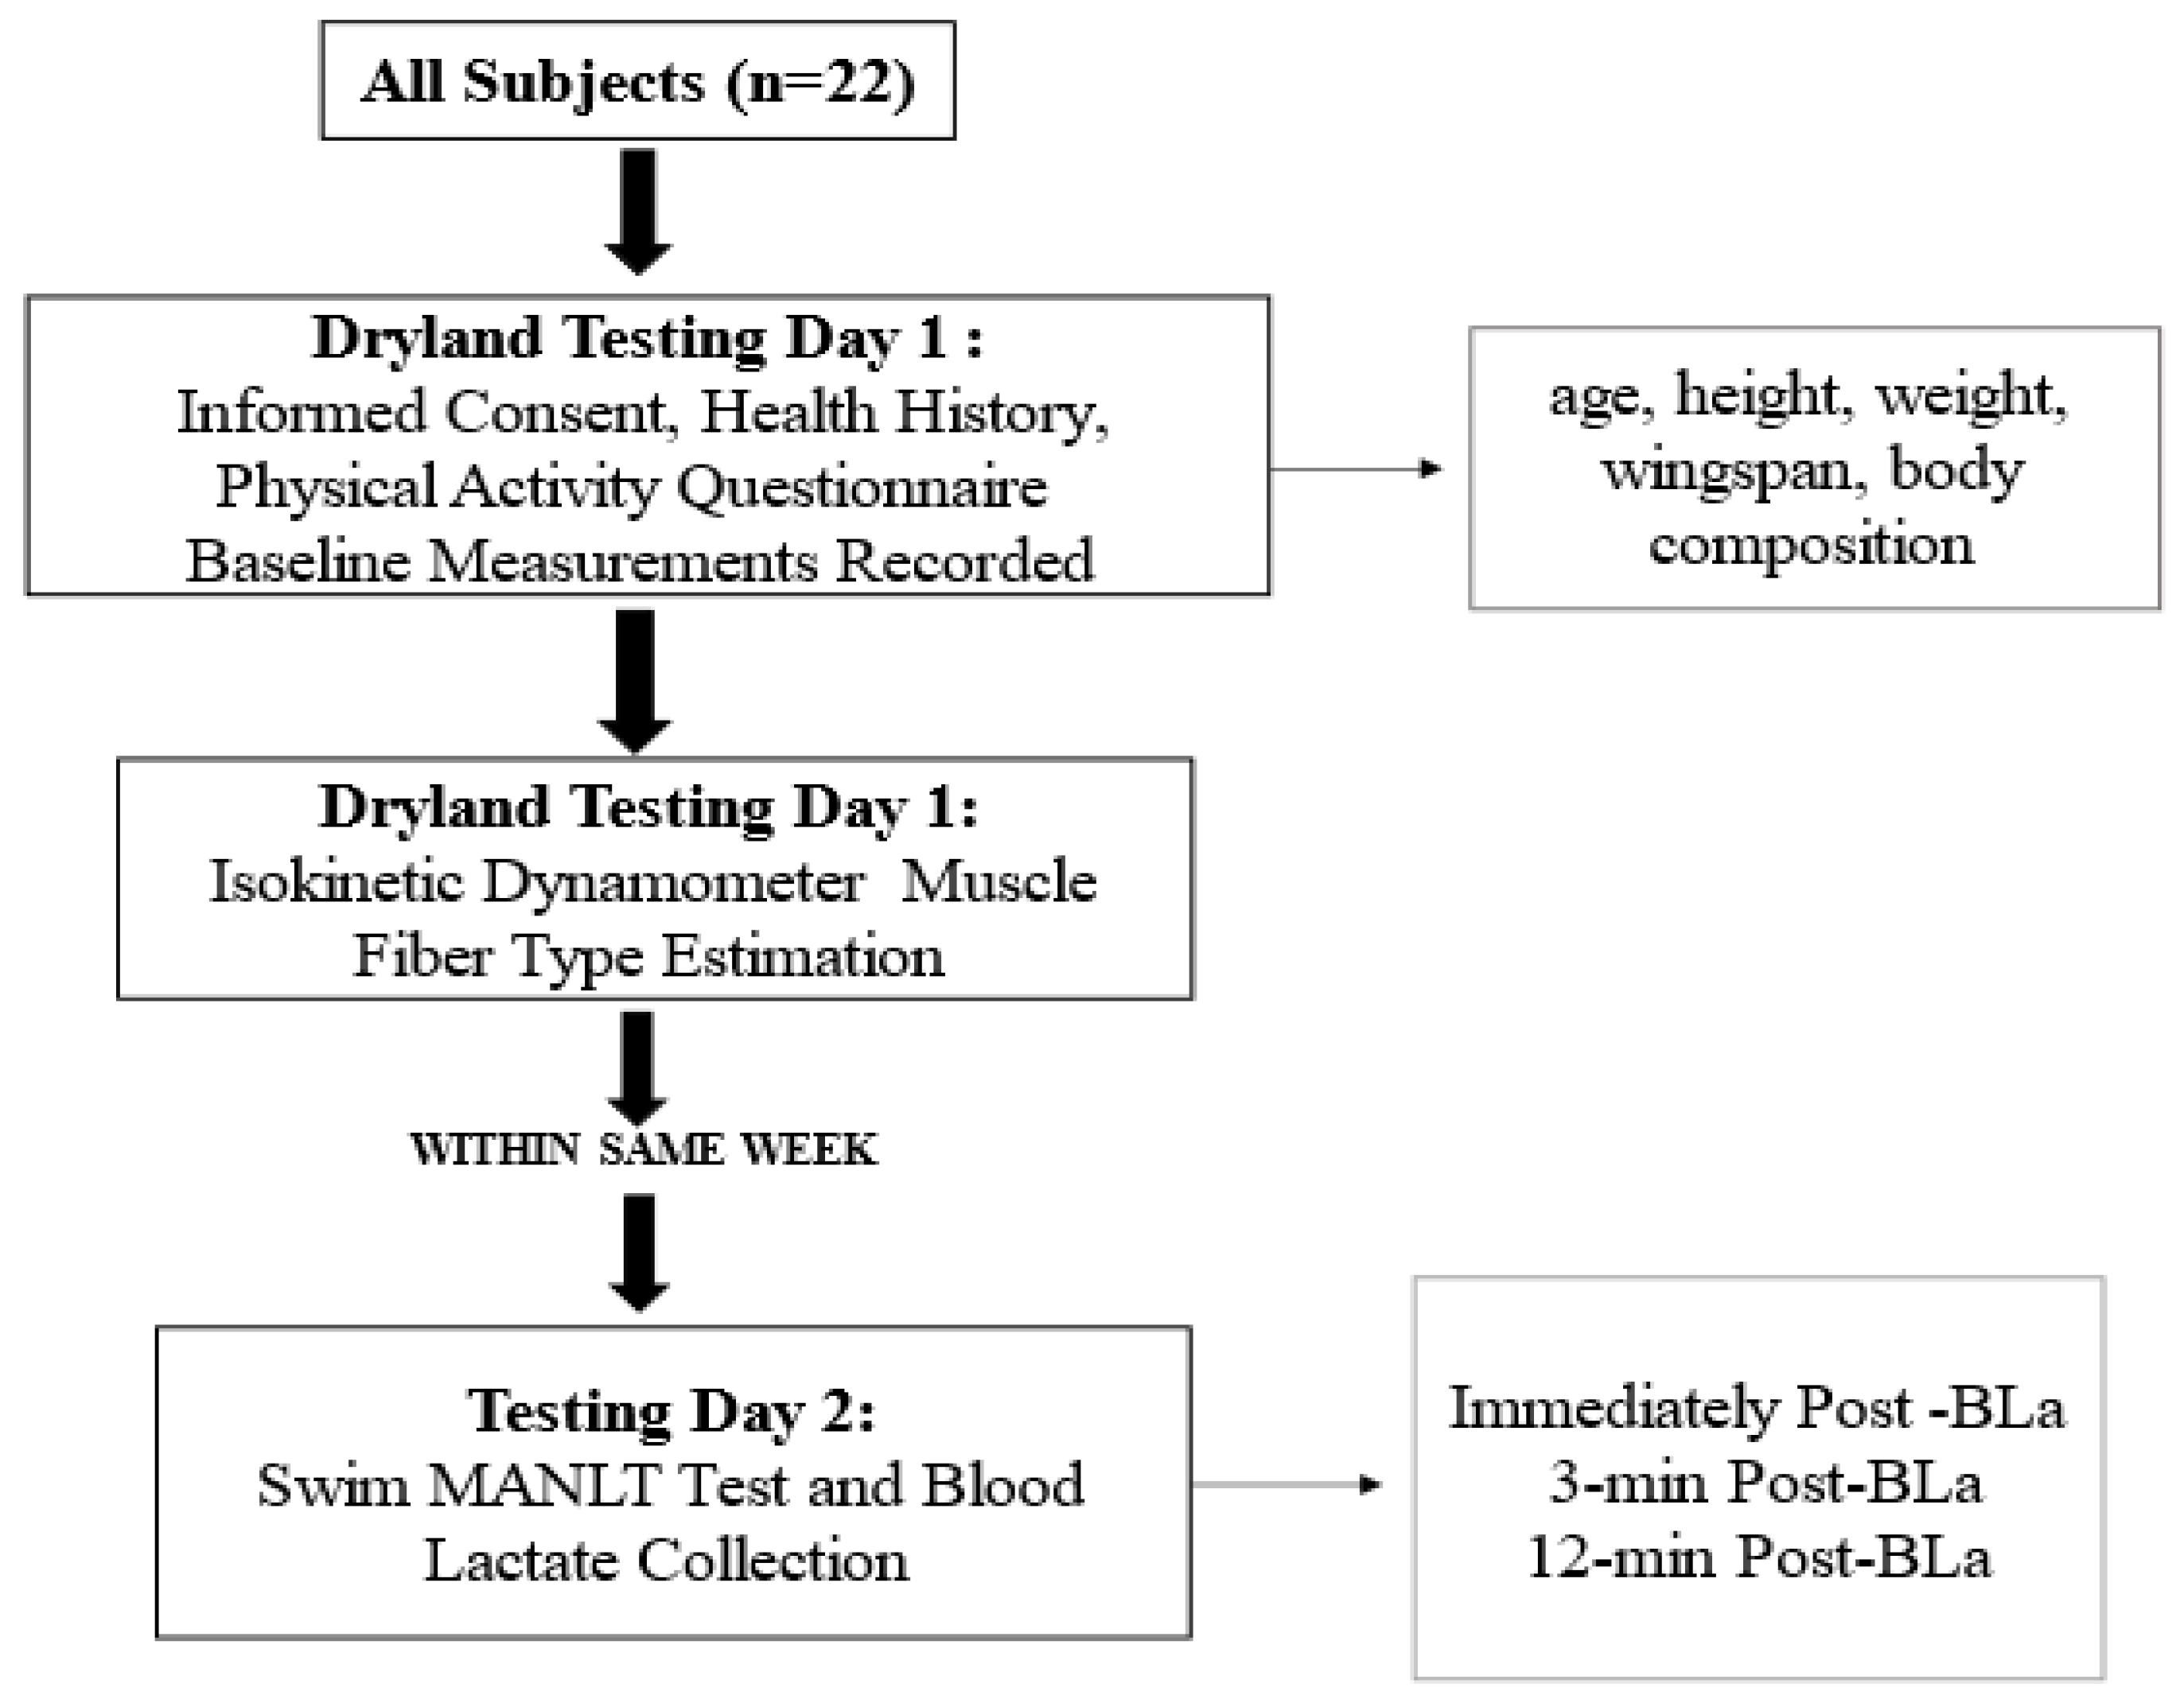
An experimental cross-sectional study analyzed if differences existed in muscle fiber types and lactate profiles between Division III collegiate distance and sprint swimmers. Prior to the beginning of data collection, all participants underwent in-person baseline testing at Skidmore College. Upon the participants’ arrival, written informed consent was obtained, and participants were screened for eligibility. Healthy college-aged male and female swimmers (n = 22, 19.7 ± 1.0 yr) performed a knee extension fatigue test on an isokinetic dynamometer and a MANLT on separate visits, respectively. Peak torque and knee extension repetitions of 53, 54, and 55 were measured and used to determine FT muscle percentage. B
lac (mmol/L) was measured immediately, 3 min, and 12 min post-MANLT.
Figure 1 displays the experimental overview.
2.3. Anthropometrics, Body Composition and Self-Identification of Event Type
Baseline measurements of age (yr), height (cm), and wingspan (inch) were recorded before any testing. Age was self-reported. Height was measured to the nearest 0.01 cm using a stadiometer (Seca, Mt. Pleasant, SC, USA), and wingspan was measured to the nearest 0.01 inch using a measuring tape (Gulick II Plus, Perform Better, West Warwick, RI, USA). Total body composition variables of body mass (BM, kg), body fat percentage (BF%), muscle mass (MM, kg), and percent body water (BW%) were measured using a Tanita body composition scale (RD-545, Tanita, Arlington Heights, IL, USA). All anthropometric assessments were performed by trained members of the research team to ensure accuracy and consistency (typical in-house reliability coefficient of variation < 1%). Participants verbally informed the tester if they considered themselves a sprint or distance swimmer, and further identification was influenced by the head coach’s input.
2.4. Isokinetic Dynamometer Variables: Torque Values and FT Fiber Distribution
After baseline measurements were recorded, participants were asked to perform 55 single right knee extensor and flexor contractions at an angular velocity of 90°∙s
−1 [
13] while seated and secured via an HUMAC NORM Cybex isokinetic dynamometer (HUMAC Norm, Computer Sports Medicine Inc., Stoughton, MA, USA) [
16,
17]. Subjects were continuously encouraged to perform a maximal effort for each contraction and were provided with visual force output feedback (i.e., a screen displayed their data in real time). The means of contractions 3–5, 13–15, 23–25, 33–35, 43–45, and 53–55 were calculated and expressed as percentages of the highest torque [
13]. Absolute and relative torque (T) values were measured and further used to estimate the relative fast-twitch muscle fiber percentage (%FT fibers). Briefly, this fatigue test of 55 maximal knee extension/flexion contractions was used to derive an estimate of the relative distribution of fiber types (% fast twitch vs. % slow twitch) in the vastus lateralis, based on the principle that a larger drop in torque output over time would correspond with a greater proportion (%) of type II vs. type I muscle fibers [
13]. To ensure adequate performance, participants were asked to refrain from exercise 24 h prior to any and all testing.
2.5. Maximal Anaerobic Lactic Test (MANLT) and Blood Lactate Measurements
The swim test of the study was performed at the Skidmore College Williamson Sports Center 25-yard pool. Swimmers were instructed to perform a standard 1650-yard warm-up and cool-down swim. The MANLT [
14] was performed following completion of the warm-up. Swimmers completed four sets of 50-yard freestyle all-out sprints with 10 s of rest in between each set. A 50-yard freestyle consists of two lengths back and forth. Once each 50 was completed, the swimmer was allotted 10 s of rest before they performed the next repetition. Participants were verbally encouraged to perform at maximal effort by testers and were instructed when ten seconds had passed after each 50-yard swim. Individual 50-yard swim times were recorded via stopwatch (seconds). After the completion of the MANLT, B
lac levels (mmol/La) were measured using a lactate analyzer (Lactate Pro, Nova Biomedical, Waltham, MA, USA) immediately following the test, 3 min after the test, and 12 min after the test. Subjects were instructed to maintain a seated passive recovery during these measurements. A pressure-activated lancet in the fingertip of the non-dominant hand was used. An amount of 0.7 µL of blood was collected for each finger stick. In our laboratory, within-day reliability of Blac measures is <2% coefficient of variation (CV). The MANLT testing procedure was adapted from Pelayo et al. to measure the maximal anaerobic contribution and rate of lactate clearance [
14].
2.6. Triton Wear
Swimmers wore their personal Triton Wear device, a wearable accelerometer, used to track swim metrics (Triton Wear, Toronto, ON, Canada). This device was placed under the swim caps and was used by every swimmer during the swim competition season practices. Swimmers were instructed to connect their personal Triton Wear device to their cell phone via Bluetooth. The measurements analyzed from the MANLT were 50-yard swim time (s) for each 50 yd. Upon completion of the MANLT, a data file containing the swimmer’s recorded metrics was exported and downloaded for analysis.
2.7. Data Collection and Analysis
All statistical analyses were carried out using open-source software (Jamovi, v 2.5, Sydney, Australia) [
18]. The Shapiro–Wilk and Levene’s tests of normality and assumption were conducted to see if the data were normally distributed and variances were similar between samples, respectively. Maximal and minimum Blac levels were calculated for sprint and distance swimmers as the highest (Blac Maximal) and lowest (Blac Minimum) value for each swimmer during the post-MANLT recovery period (0–12 mins). Comparisons between sprint and distance group maximal, minimum, and 0, 3, and 12 min post-test values, B
lac levels, B
lac percent recovery between 0 and 12 min, 0–3 min, and 3–12 min post-test, and %FT fiber were performed via an unpaired
t-test. Cohen’s d was used as an estimate of effect size, and, as per tradition, effects of 0.2, 0.5, and 0.8 or greater were interpreted as small, moderate, or large effects. Pearson’s correlational analysis was conducted to explore the potential relationship between %FT fiber and B
lac max. The Shapiro–Wilk test of normality was conducted to see if the data were normally distributed; if a violation was found, Spearman’s rho would be used. The r value was used as an estimate of effect size, and, as per tradition, the strength of the relationship was defined as follows: r values of 0.00–0.10, 0.10–0.39, 0.40–0.69, 0.70–0.89, and 0.90–1.00 were interpreted as negligible, weak, moderate, strong, or very strong correlations, respectively. All levels of significance were set as
p < 0.05 and used a two-tailed approach. All data are expressed as means ± standard deviation.
4. Discussion
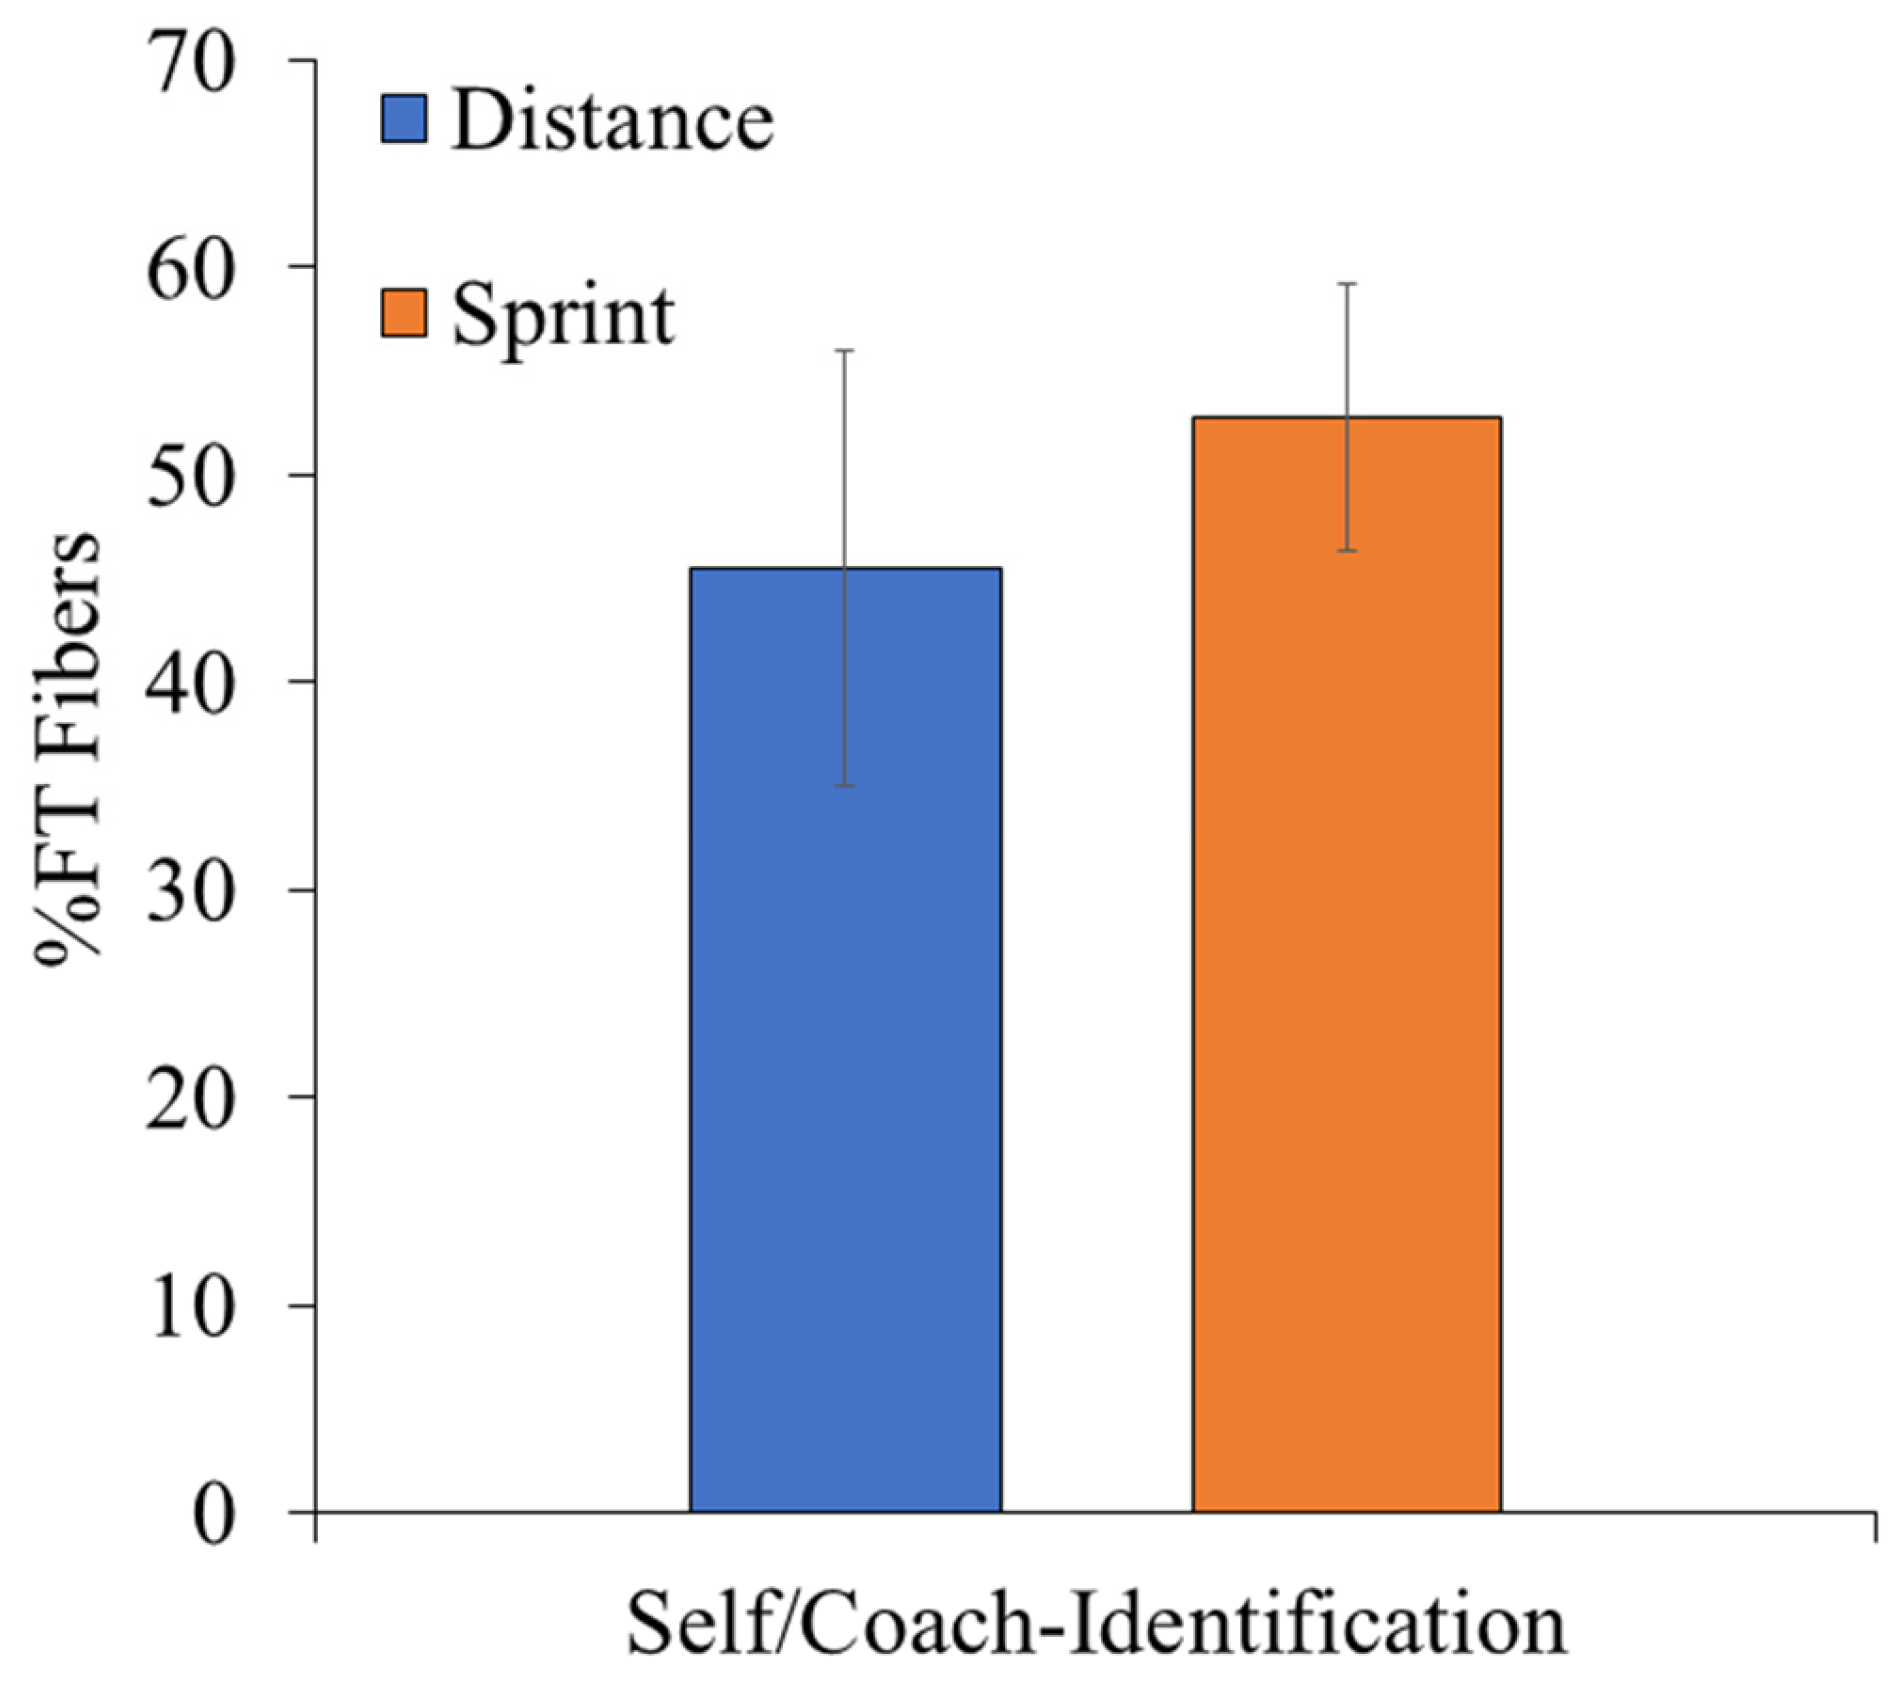
The purpose of this exploratory feasibility study was to characterize estimated muscle fiber types and blood lactate profiles between Division III collegiate distance and sprint swimmers. It was hypothesized that sprint swimmers would exhibit greater %FT muscle fibers and anaerobic capacity, consisting of a higher Blac max and min, and lower Blac percent decreases from all measurement times compared to distance swimmers. Somewhat contrary to our hypothesis, the differences between self/coach-identified sprint and distance swimmers were not significant, even if the data trended directionally towards the expected outcome, namely sprinters aligning with greater estimated %FT muscle fibers and Blac, while distance exhibited greater estimated %ST muscle fibers and lower Blac in this small single-team sample. These protocols were very well tolerated and completion was 100%, suggesting a strong likelihood of implementation. The directional patterns and moderate associations between estimated fast-twitch fiber percentage and maximal Blac warrant evaluation in a larger, prospectively designed study, and will hopefully be hypothesis-generating for such studies.
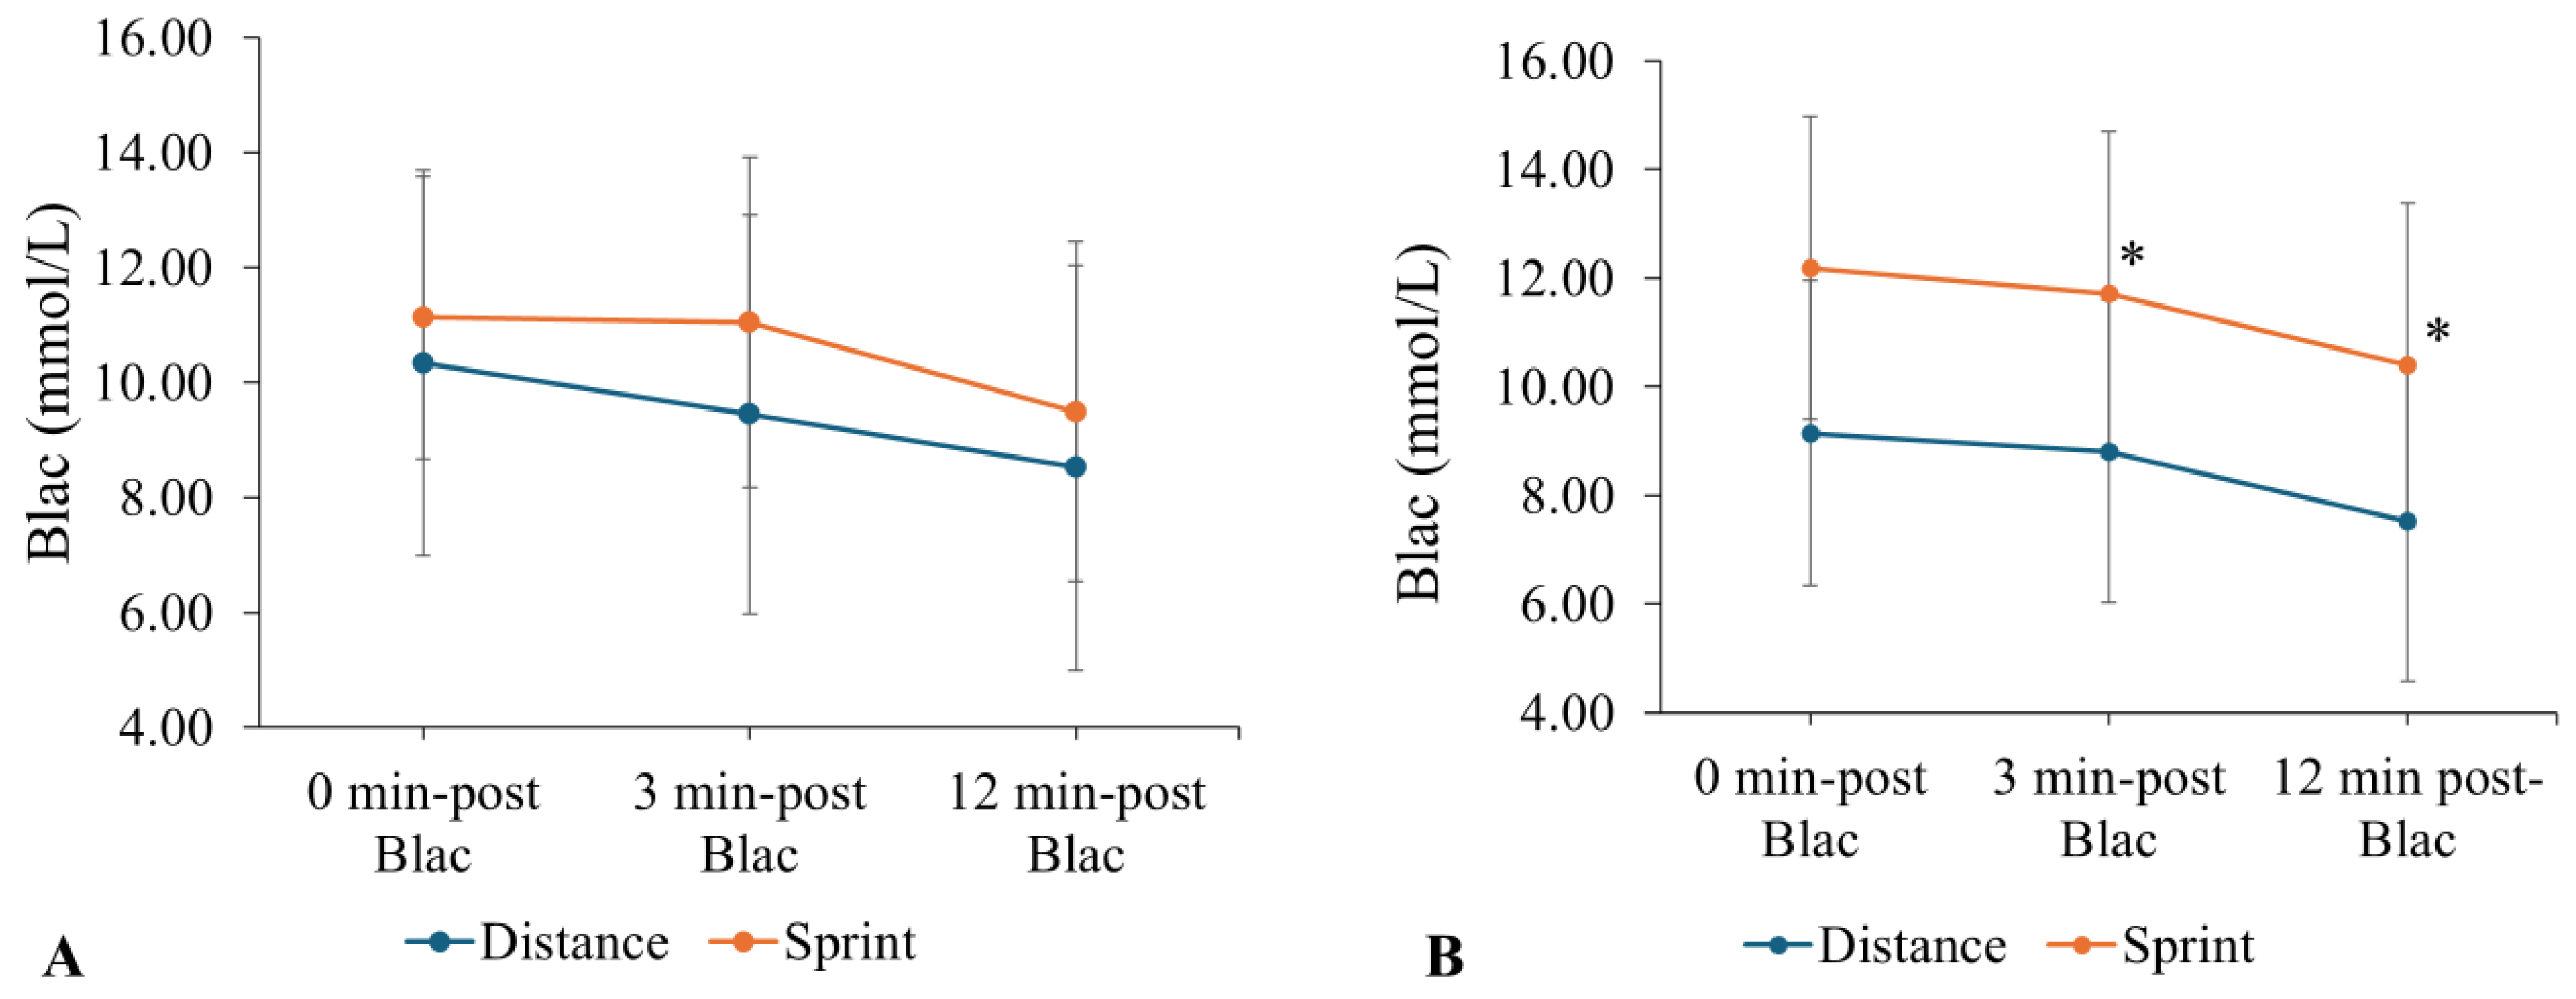
No significant differences existed between self/coach-identified groups (sprint vs. distance) in Blac max (11.65 ± 2.52 mmol/L compared to 10.51 ± 3.49 mmol/L), Blac min (9.36 ± 2.94 mmol/L compared to 8.33 ± 3.30 mmol/L), and Blac percent recovery 0–12 min, 0–3 min, and 3–12 min-post-MANLT. Though nonsignificant, there were overall greater values for self/coach-identified sprint swimmers in Blac max, Blac min, and Blac percent recovery 3–12 min post-MANLT. There was overall greater Blac percent recovery 0–12 min and 0–3 min post-MANLT in self/coach-identified distance swimmers. Specific data pairwise comparisons did, however, yield significant differences between sprint and distance groups, as there was a trend for greater lactate clearance for distance swimmers and higher Blac maximum and minimum values.
Our exploratory study suggests that overall, self/coach-identification was generally estimated in the right direction in matching athlete profiles to their expected muscle fiber type estimation (%FT). While more than half of the results from the fatigue tests indicated the expected predominant muscle fiber type percentages (e.g., greater %FT with Sprinters), there were athlete-event profiles that did not match up to their expected muscle fiber types. Such discrepancy could relate to multiple factors, such as limited precision in the estimation of muscle fiber type, event classifications and training are not purely dichotomous, and/or the onset of detraining in the post-competitive season. These potential factors are addressed in more detail below.
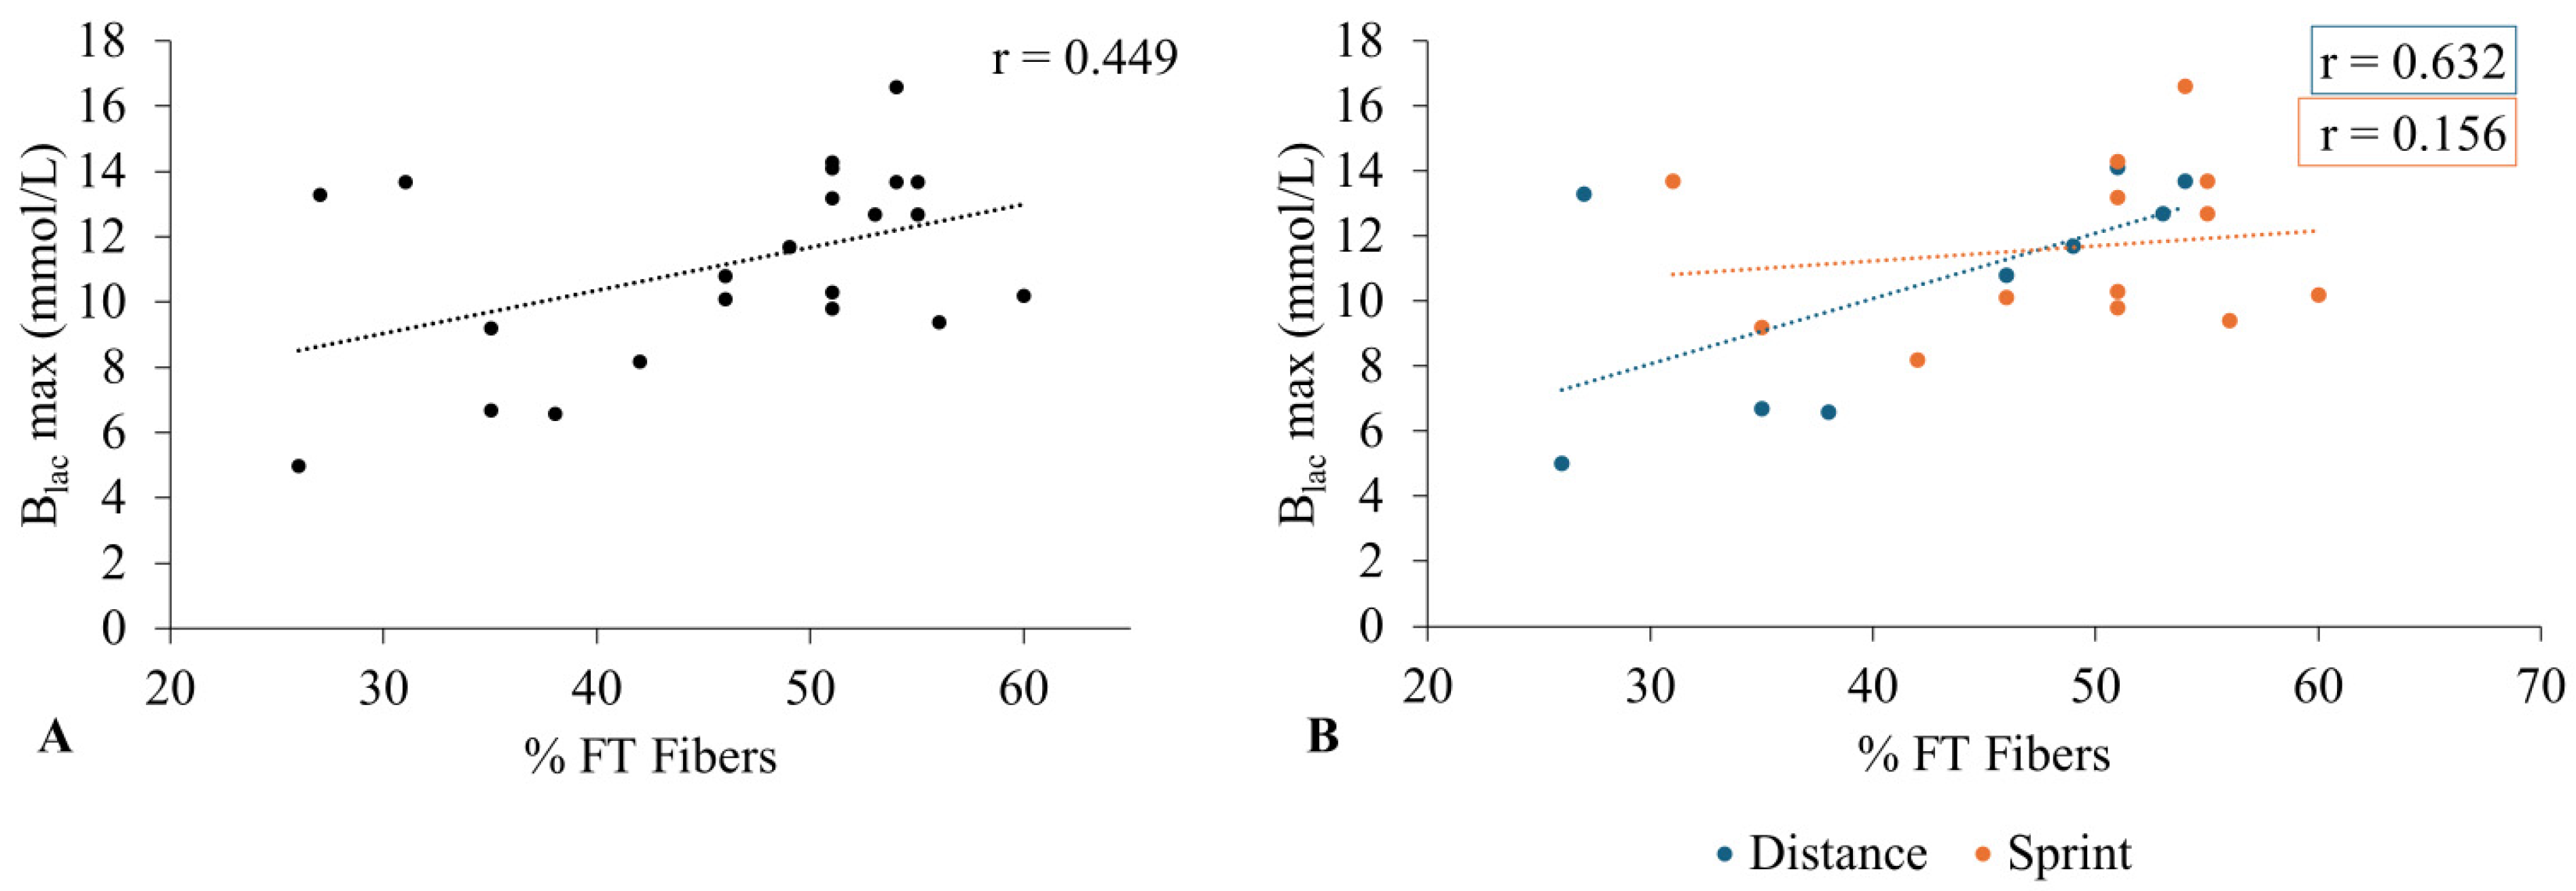
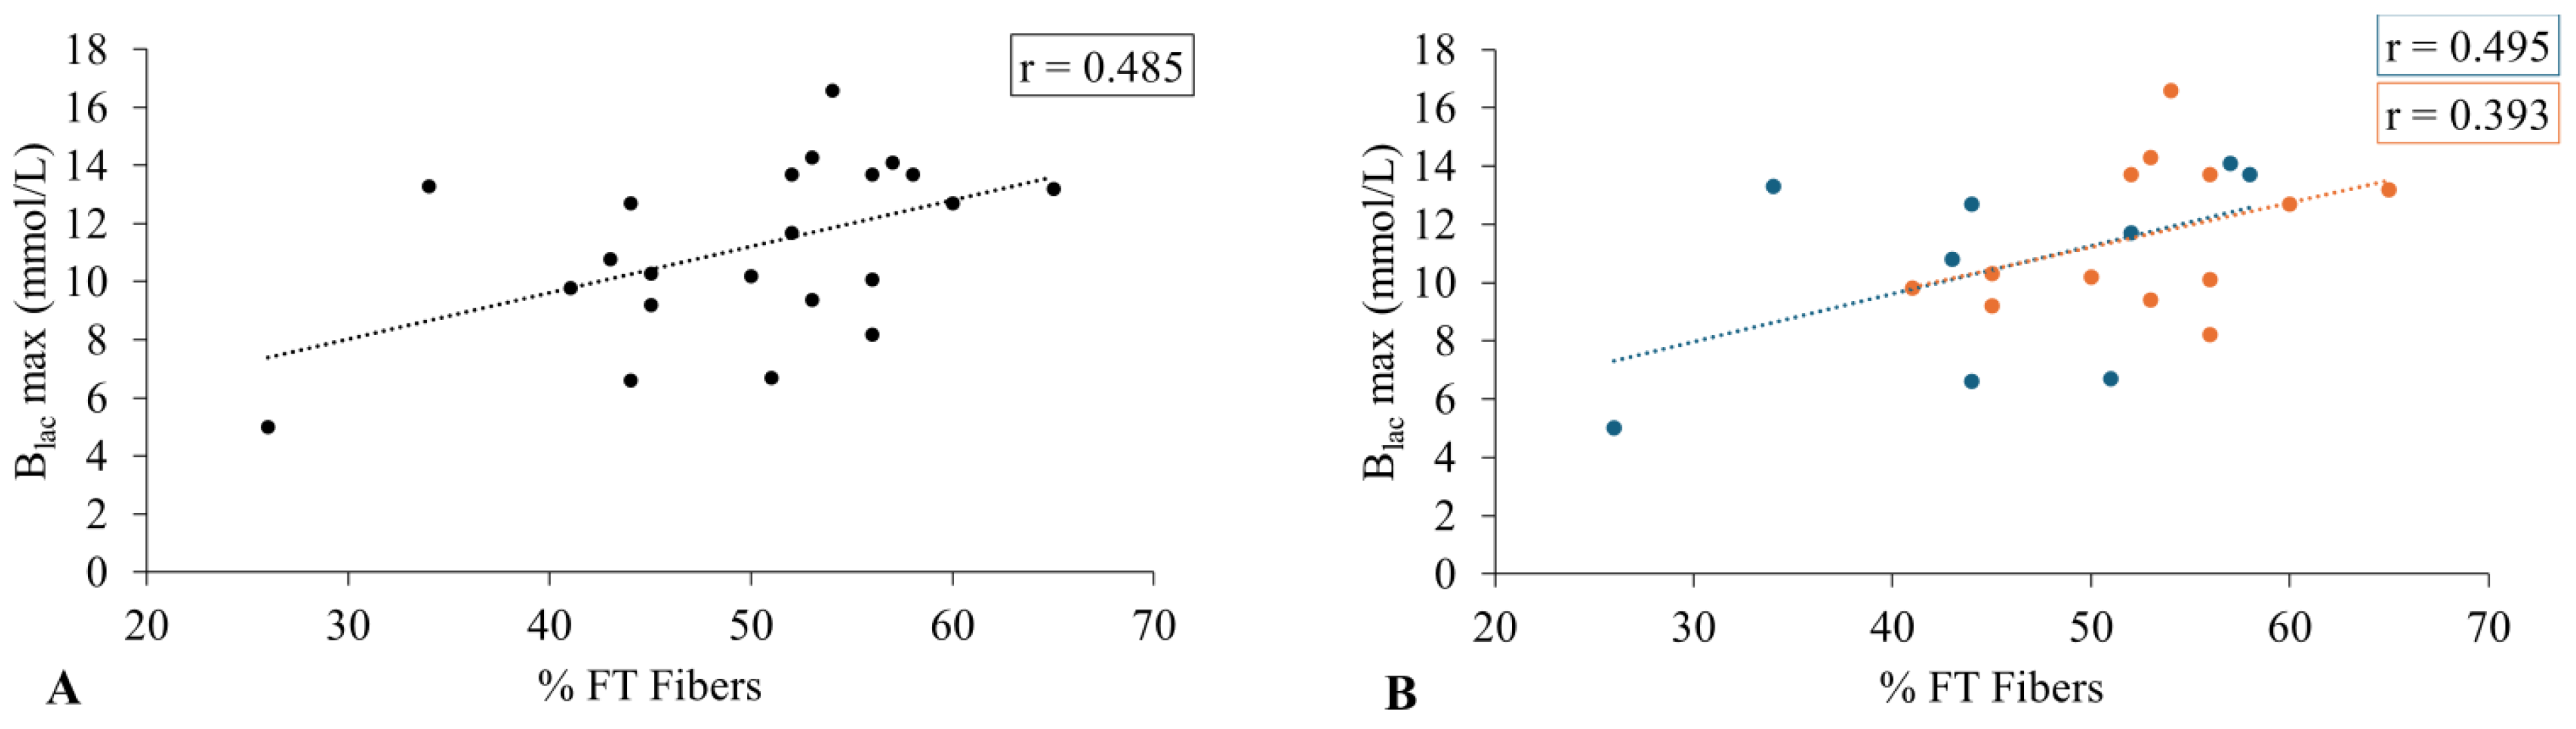
Distinct differences in our self/coach-identified swimmers were not as clear as the estimated fiber type classification in
Figure 4B and
Figure 5B. There was a weak relationship for self/coach-identified sprinters and a moderate relationship for self/coach-identified distance swimmers. However, there was also a moderate positive relationship between %FT fiber and B
lac maximum value from extensor data of all subjects, indicating that a trend in increased %FT fibers suggests an increase in maximal B
lac. Further research is needed to determine the physiological parameters of swimmers during their pre-season and/or in-season training as opposed to those of swimmers in their post-season.
As previous research has shown, sprint swimmers tend to have a relatively higher proportion of FT muscle fibers (%type II), which allows for the necessary quick, explosive bursts of speed and power [
9]. The opposite holds true for distance swimmers, as they tend to have a more balanced distribution of a higher proportion of slow-twitch muscle fibers (type I), which are more fatigue-resistant and efficient at utilizing oxygen. This study mostly supported this trend. However, self/coach-identification was not completely accurate in the percentage of muscle fiber types nor their expected lactate outcomes. There are several explanations for these discrepancies. For instance, the wide variety of physical activity could have influenced their performance on the isokinetic dynamometer, and thus determined their muscle fiber type composition post-season rather than what they would consider themselves to be during in-season training and competition. In addition, while swimmers were dichotomously determined to be either sprint or distance swimmers, swimmers on the swim team often considered themselves to be middle-distance swimmers, as many compete in 200-yard events.
4.1. Conditioning of Swimmers
All tests in this study were conducted seven to eight weeks after the swimmers’ competition season. During the 23-week competition season, swimmers regularly swam for two hours, six days per week with a combination of anaerobic and aerobic training and two hours per week of strength conditioning. During the seven to eight weeks post-competition season, swimmers partook, or did not partake, in different forms of physical activity as they were no longer regulated under a strict training schedule. The physical activity questionnaire completed at the beginning of the study indicated that the participants performed a range of moderate, vigorous, and/or strength training within the past eight weeks prior to their first test. Swimmers verbally confirmed their type of exercise as well. Of the 22 participants, only three swimmers had shown consistency in swimming training (>three days a week for ~1–2 h of aerobic training). Results from this study were expected to be influenced by two principles that could have resulted from these conditions: the detraining principle and muscle adaptations to the uncontrolled forms of exercise.
4.2. Detraining Principle
One explanation for the discrepancy in expected estimated muscle type distribution and lactate profiles of the self/coach-determined sprint and distance swimmers could have been due to detraining, which is the partial or complete loss of training-induced anatomical, physiological, and functional adaptations with reduced training, or even training cessation [
19,
20]. Participants in this study suffered from detraining. Detraining has been linked with capillarization, arterial-venous oxygen difference, and oxidative enzyme activity declines in athletes. While breaks allow for relief from the strain of training, a prolonged break may produce decrements in such variables. Specifically, energetic and kinematic adaptations may decline when training loads are decreased after the main competition seasons. It is thought that detraining may increase oxygen uptake (VO
2) and B
lac concentrations for a given effort, making it more difficult to sustain the swimming speeds reached at the end of a complete season [
19,
20].
In a longitudinal cohort study conducted on age-group swimmers (14–15 years), researchers found that a four-week off-season detraining resulted in swimmer performance, energetic, and kinematic changes [
19]. In this study, anthropometric growth and non-swimming-specific physical activities during the detraining period were controlled when comparing measurements immediately post-competition season and then measurements made after a four-week off-season period. Researchers found that lactate peak ([La
−] peak) after detraining was higher than post-competition season measurements (
p < 0.001; d = 0.90) [
19]. Anaerobic alactic (
p < 0.01; d = 0.99) and anaerobic lactic energy were also higher (
p < 0.001; d = 0.92), while aerobic contribution decreased by 1.8% (
p < 0.01; d = −1.19). Furthermore, anaerobic lactate contribution was found to increase by 1.6% (
p < 0.01; d = 1.08). This study suggested that changes in muscle structure during cessation could be explained by decreases in mitochondrial content and function, impacting the aerobic energy pathway [
19,
20].
In addition, one study reported that there was a 12–18% decrease in maximal ATP production rates in isolated mitochondria following a three-week period of detraining in line with the reduction in mitochondrial respiration [
21]. The decrease in mitochondrial function with training is accompanied by decreases in mitochondrial enzymes such as cytochrome c oxidase and succinate dehydrogenase at differing response rates [
19,
20,
21]. Interestingly, mitochondrial respiration, measured via a deltoid muscle biopsy of eight male elite swimmers, decreased by 50% after only one week of inactivity and showed no further changes over the next three weeks in a study done by Costill et al. [
21]. Swimmer’s physiological measurements were taken post-five months of intense training and then throughout a four-week detraining period. Throughout the detraining period, muscle glycogen decreased significantly, and post-swim B
lac increased significantly. However, weeks of detraining seemed to have no effect on muscle enzyme activities, and glycolytic enzymes showed an insignificant decline. In addition to these changes, Bishop et al. found that exercise-induced adaptations are quickly reversed following a reduction or cessation of physical activity, indicating muscle plasticity [
20]. Overall, there is evidence to support arguments that decrements in performance and rise in post-exercise B
lac in weeks following cessation of exercise training are the combined result of a decline in muscle’s respiratory capacity and diminished oxygen transport system [
21].
4.3. Unregulated Exercise
Studies have shown that training can influence muscle fiber composition and characteristics [
14,
22]. For example, endurance training can lead to training adaptations influencing the oxidative capacity of both fiber types, increasing their ability to effectively perform. Sprint training has also been shown to increase the size and number of fast-twitch fibers. The physical activity questionnaire indicated whether swimmers performed moderate, vigorous, and/or strength training within the past eight weeks prior to their first test. Swimmers verbally confirmed their type of exercise as well. Therefore, the wide variety of physical activity could have influenced their performance on the isokinetic dynamometer and thus determined their muscle fiber type composition post-season rather than what they would consider themselves to be during in-season training and competition.
4.4. Experimental Considerations
This exploratory feasibility study was limited by several factors, such as sample size, unregulated physical activity, and perceived effort on tests. The sample size used in the current study was modest (n = 22, ~50% of team total), and the disproportionate number of males compared to females could have impacted the results of the study, as there are potential sex differences in physiological profiles not accounted for. As an exploratory pilot feasibility study, this work was not designed or powered to definitively test hypotheses or establish intervention effectiveness. Rather, the findings should be interpreted as preliminary and intended to inform the design of future adequately powered studies to generate hypotheses and provide estimates of effect size. The unregulated physical activity routine of every athlete was also not controlled for. This study was conducted 7–8 weeks post the swimmers’ championship meet, where their training had been consistent and most individualized to their self/coach-identified specialty, or as a middle-distance swimmer. During the post-season, participants ranged from engaging in weight training, moderate and vigorous exercise, to no exercise at all. Their activity levels were of all different durations, intensities, and modalities. Diet, water intake, and sleep were also not regulated prior to tests, which could have impacted their test performances on the day of. Lastly, swimmers were instructed to try their hardest on each test. Some may not have been performing all tests with such intentionality. Sources of error in this study could have included inaccurate anthropometric measurements, incorrect knee positioning on the HUMAC norm, and Triton Wear malfunctions. Future studies should also document athlete experience (years or seasons of swimming) as this may play into the relation of muscle fiber type differentiation and performance.
4.5. Future Directions and Practical Implications for Practitioners
There has been limited research on the comparisons of muscle fiber type estimation testing and Blac measurements following an all-out swimming test or race. These assessments have the potential to provide useful feedback for coaches and athletes when designing or testing the efficacy of training programs and race strategies. If confirmed by larger prospective studies, by implementing such testing during in-season training prior to major competition, swimmers will be collectively regulated and specialized, and thus their performance results would be more indicative of the success of conditioning. This is important so coaches and athletes can develop a training program tailored to maximize the genetic and physiological potential of their respective desired athlete profile. For example, if a swimmer is shown to have a naturally high proportion of FT fibers and struggles with endurance, a coach can incorporate more aerobic base training to enhance lactate clearance and improve the oxidative capacity of those fibers, but also tailor training and event selection towards sprint events for the best chances of competitive success for the individual and team. More research is needed, and in larger samples, to better understand the practical utility of the MANLT and estimation of muscle fiber type in swimmers.