

Estimation of the External Knee Adduction Moment Using Inertial Measurement Unit Sensors on the Shank and Lower Back: A Pilot Study

 , ,
, ,
Abstract
1. Introduction
2. Methods
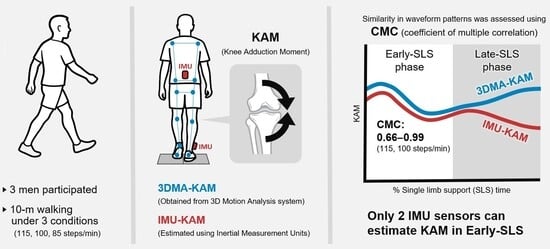
2.1. Participants
2.2. Gait Task
2.3. Data Collection
2.4. Data Analysis
2.4.1. Optical System
2.4.2. Inertial System
2.4.3. Analysis Interval
2.5. Statistical Analysis
3. Results
3.1. Walking Speed, Step Length, and Step Rate Under Different Gait Conditions
3.2. IMU-KAM and 3DMA-KAM
3.2.1. Early-SLS Phase
3.2.2. Late-SLS Phase
3.3. GRF-VT and FP-STA
4. Discussion
4.1. Changes in Spatiotemporal Parameters Under Different Gait Conditions
4.2. Characteristics of IMU-KAM and 3DMA-KAM
4.2.1. Characteristics of the Early-SLS Phase
4.2.2. Characteristics of the Late-SLS Phase
4.3. Characteristics of GRF-VT and FP-STA
4.4. Strengths, Limitations, Future Directions, and Practical Applications
5. Conclusions
Author Contributions
Funding
Institutional Review Board Statement
Informed Consent Statement
Data Availability Statement
Acknowledgments
Conflicts of Interest
References
- Hulleck, A.A.; Menoth Mohan, D.; Abdallah, N.; El Rich, M.; Khalaf, K. Present and Future of Gait Assessment in Clinical Practice: Towards the Application of Novel Trends and Technologies. Front. Med. Technol. 2022, 4, 901331. [Google Scholar] [CrossRef]
- Wren, T.A.L.; Tucker, C.A.; Rethlefsen, S.A.; Gorton, G.E.; Õunpuu, S. Clinical Efficacy of Instrumented Gait Analysis: Systematic Review 2020 Update. Gait Posture 2020, 80, 274–279. [Google Scholar] [CrossRef]
- Miyashita, T.; Kudo, S.; Maekawa, Y. Assessment of Walking Disorder in Community-Dwelling Japanese Middle-Aged and Elderly Women Using an Inertial Sensor. PeerJ 2021, 9, e11269. [Google Scholar] [CrossRef] [PubMed]
- Boyer, K.A.; Johnson, R.T.; Banks, J.J.; Jewell, C.; Hafer, J.F. Systematic Review and Meta-Analysis of Gait Mechanics in Young and Older Adults. Exp. Gerontol. 2017, 95, 63–70. [Google Scholar] [CrossRef]
- Kutzner, I.; Trepczynski, A.; Heller, M.O.; Bergmann, G. Knee Adduction Moment and Medial Contact Force–Facts about Their Correlation during Gait. PLoS ONE 2013, 8, e81036. [Google Scholar] [CrossRef]
- Zhao, D.; Banks, S.A.; Mitchell, K.H.; D’Lima, D.D.; Colwell, C.W.; Fregly, B.J. Correlation between the Knee Adduction Torque and Medial Contact Force for a Variety of Gait Patterns. J. Orthop. Res. 2007, 25, 789–797. [Google Scholar] [CrossRef] [PubMed]
- Hall, M.; Bennell, K.L.; Wrigley, T.V.; Metcalf, B.R.; Campbell, P.K.; Kasza, J.; Paterson, K.L.; Hunter, D.J.; Hinman, R.S. The Knee Adduction Moment and Knee Osteoarthritis Symptoms: Relationships According to Radiographic Disease Severity. Osteoarthr. Cartil. 2017, 25, 34–41. [Google Scholar] [CrossRef] [PubMed]
- Favre, J.; Jolles, B.M. Gait Analysis of Patients with Knee Osteoarthritis Highlights a Pathological Mechanical Pathway and Provides a Basis for Therapeutic Interventions. EFORT Open Rev. 2016, 1, 368–374. [Google Scholar] [CrossRef]
- Bennell, K.L.; Bowles, K.-A.; Wang, Y.; Cicuttini, F.; Davies-Tuck, M.; Hinman, R.S. Higher Dynamic Medial Knee Load Predicts Greater Cartilage Loss over 12 Months in Medial Knee Osteoarthritis. Ann. Rheum. Dis. 2011, 70, 1770–1774. [Google Scholar] [CrossRef]
- D’Souza, N.; Charlton, J.; Grayson, J.; Kobayashi, S.; Hutchison, L.; Hunt, M.; Simic, M. Are Biomechanics during Gait Associated with the Structural Disease Onset and Progression of Lower Limb Osteoarthritis? A Systematic Review and Meta-Analysis. Osteoarthr. Cartil. 2022, 30, 381–394. [Google Scholar] [CrossRef]
- Foroughi, N.; Smith, R.; Vanwanseele, B. The Association of External Knee Adduction Moment with Biomechanical Variables in Osteoarthritis: A Systematic Review. Knee 2009, 16, 303–309. [Google Scholar] [CrossRef]
- Astephen, J.L.; Deluzio, K.J.; Caldwell, G.E.; Dunbar, M.J. Biomechanical Changes at the Hip, Knee, and Ankle Joints during Gait Are Associated with Knee Osteoarthritis Severity. J. Orthop. Res. 2008, 26, 332–341. [Google Scholar] [CrossRef]
- Hatfield, G.L.; Stanish, W.D.; Hubley-Kozey, C.L. Three-Dimensional Biomechanical Gait Characteristics at Baseline Are Associated with Progression to Total Knee Arthroplasty. Arthritis Care Res. 2015, 67, 1004–1014. [Google Scholar] [CrossRef]
- Hutabarat, Y.; Owaki, D.; Hayashibe, M. Recent Advances in Quantitative Gait Analysis Using Wearable Sensors: A Review. IEEE Sens. J. 2021, 21, 26470–26487. [Google Scholar] [CrossRef]
- Boswell, M.A.; Uhlrich, S.D.; Kidziński, Ł.; Thomas, K.; Kolesar, J.A.; Gold, G.E.; Beaupre, G.S.; Delp, S.L. A Neural Network to Predict the Knee Adduction Moment in Patients with Osteoarthritis Using Anatomical Landmarks Obtainable from 2D Video Analysis. Osteoarthr. Cartil. 2021, 29, 346–356. [Google Scholar] [CrossRef]
- Iwama, Y.; Harato, K.; Kobayashi, S.; Niki, Y.; Ogihara, N.; Matsumoto, M.; Nakamura, M.; Nagura, T. Estimation of the External Knee Adduction Moment during Gait Using an Inertial Measurement Unit in Patients with Knee Osteoarthritis. Sensors 2021, 21, 1418. [Google Scholar] [CrossRef]
- Salisu, S.; Ruhaiyem, N.I.R.; Eisa, T.A.E.; Nasser, M.; Saeed, F.; Younis, H.A. Motion Capture Technologies for Ergonomics: A Systematic Literature Review. Diagnostics 2023, 13, 2593. [Google Scholar] [CrossRef]
- Stetter, B.J.; Krafft, F.C.; Ringhof, S.; Stein, T.; Sell, S. A Machine Learning and Wearable Sensor Based Approach to Estimate External Knee Flexion and Adduction Moments During Various Locomotion Tasks. Front. Bioeng. Biotechnol. 2020, 8, 9. [Google Scholar] [CrossRef] [PubMed]
- Akiba, A.; Harato, K.; Yoshihara, H.; Iwama, Y.; Nishizawa, K.; Nagura, T.; Nakamura, M. Development of a Wearable System to Estimate Knee Adduction Moment of Patients with Knee Osteoarthritis During Gait Using a Single Inertial Measurement Unit. J. Jt. Surg. Res. 2025, 3, 84–89. [Google Scholar] [CrossRef]
- Kobsar, D.; Masood, Z.; Khan, H.; Khalil, N.; Kiwan, M.Y.; Ridd, S.; Tobis, M. Wearable Inertial Sensors for Gait Analysis in Adults with Osteoarthritis—A Scoping Review. Sensors 2020, 20, 7143. [Google Scholar] [CrossRef] [PubMed]
- Baniasad, M.; Martin, R.; Crevoisier, X.; Pichonnaz, C.; Becce, F.; Aminian, K. Knee Adduction Moment Decomposition: Toward Better Clinical Decision-Making. Front. Bioeng. Biotechnol. 2022, 10, 1017711. [Google Scholar] [CrossRef]
- Favre, J.; Jolles, B.M.; Aissaoui, R.; Aminian, K. Ambulatory Measurement of 3D Knee Joint Angle. J. Biomech. 2008, 41, 1029–1035. [Google Scholar] [CrossRef]
- Favre, J.; Luthi, F.; Jolles, B.M.; Siegrist, O.; Najafi, B.; Aminian, K. A New Ambulatory System for Comparative Evaluation of the Three-Dimensional Knee Kinematics, Applied to Anterior Cruciate Ligament Injuries. Knee Surg. Sports Traumatol. Arthr. 2006, 14, 592–604. [Google Scholar] [CrossRef]
- Carcreff, L.; Payen, G.; Grouvel, G.; Massé, F.; Armand, S. Three-Dimensional Lower-Limb Kinematics from Accelerometers and Gyroscopes with Simple and Minimal Functional Calibration Tasks: Validation on Asymptomatic Participants. Sensors 2022, 22, 5657. [Google Scholar] [CrossRef]
- Ancillao, A.; Tedesco, S.; Barton, J.; O’Flynn, B. Indirect Measurement of Ground Reaction Forces and Moments by Means of Wearable Inertial Sensors: A Systematic Review. Sensors 2018, 18, 2564. [Google Scholar] [CrossRef]
- Shahabpoor, E.; Pavic, A. Measurement of Walking Ground Reactions in Real-Life Environments: A Systematic Review of Techniques and Technologies. Sensors 2017, 17, 2085. [Google Scholar] [CrossRef]
- Karatsidis, A.; Bellusci, G.; Schepers, H.M.; de Zee, M.; Andersen, M.S.; Veltink, P.H. Estimation of Ground Reaction Forces and Moments During Gait Using Only Inertial Motion Capture. Sensors 2016, 17, 75. [Google Scholar] [CrossRef] [PubMed]
- Mohamed Refai, M.I.; van Beijnum, B.-J.F.; Buurke, J.H.; Veltink, P.H. Portable Gait Lab: Estimating Over-Ground 3D Ground Reaction Forces Using Only a Pelvis IMU. Sensors 2020, 20, 6363. [Google Scholar] [CrossRef] [PubMed]
- Hart, H.F.; Birmingham, T.B.; Primeau, C.A.; Pinto, R.; Leitch, K.; Giffin, J.R. Associations Between Cadence and Knee Loading in Patients with Knee Osteoarthritis. Arthritis Care Res. 2021, 73, 1667–1671. [Google Scholar] [CrossRef] [PubMed]
- James, K.A.; Corrigan, P.; Yen, S.-C.; Hasson, C.J.; Davis, I.S.; Stefanik, J.J. Effects of Increasing Walking Cadence on Gait Biomechanics in Adults with Knee Osteoarthritis. J. Biomech. 2024, 177, 112394. [Google Scholar] [CrossRef]
- Robbins, S.M.K.; Maly, M.R. The Effect of Gait Speed on the Knee Adduction Moment Depends on Waveform Summary Measures. Gait Posture 2009, 30, 543–546. [Google Scholar] [CrossRef]
- Schmitz, A.; Noehren, B. What Predicts the First Peak of the Knee Adduction Moment? Knee 2014, 21, 1077–1083. [Google Scholar] [CrossRef] [PubMed]
- Mobbs, L.; Fernando, V.; Fonseka, R.D.; Natarajan, P.; Maharaj, M.; Mobbs, R.J. Normative Database of Spatiotemporal Gait Metrics Across Age Groups: An Observational Case–Control Study. Sensors 2025, 25, 581. [Google Scholar] [CrossRef] [PubMed]
- Murtagh, E.M.; Mair, J.L.; Aguiar, E.; Tudor-Locke, C.; Murphy, M.H. Outdoor Walking Speeds of Apparently Healthy Adults: A Systematic Review and Meta-Analysis. Sports Med. 2021, 51, 125–141. [Google Scholar] [CrossRef] [PubMed]
- Tudor-Locke, C.; Han, H.; Aguiar, E.J.; Barreira, T.V.; Schuna, J.M., Jr.; Kang, M.; Rowe, D.A. How Fast Is Fast Enough? Walking Cadence (Steps/Min) as a Practical Estimate of Intensity in Adults: A Narrative Review. Br. J. Sports Med. 2018, 52, 776–788. [Google Scholar] [CrossRef]
- Urbanek, J.K.; Roth, D.L.; Karas, M.; Wanigatunga, A.A.; Mitchell, C.M.; Juraschek, S.P.; Cai, Y.; Appel, L.J.; Schrack, J.A. Free-Living Gait Cadence Measured by Wearable Accelerometer: A Promising Alternative to Traditional Measures of Mobility for Assessing Fall Risk. J. Gerontol. A Biol. Sci. Med. Sci. 2022, 78, 802–810. [Google Scholar] [CrossRef]
- Lordall, J.; Oates, A.R.; Lanovaz, J.L. Spatiotemporal Walking Performance in Different Settings: Effects of Walking Speed and Sex. Front. Sports Act. Living 2024, 6, 1277587. [Google Scholar] [CrossRef]
- Kito, N.; Shinkoda, K.; Yamasaki, T.; Kanemura, N.; Anan, M.; Okanishi, N.; Ozawa, J.; Moriyama, H. Contribution of Knee Adduction Moment Impulse to Pain and Disability in Japanese Women with Medial Knee Osteoarthritis. Clin. Biomech. 2010, 25, 914–919. [Google Scholar] [CrossRef]
- Niswander, W.; Wang, W.; Kontson, K. Optimization of IMU Sensor Placement for the Measurement of Lower Limb Joint Kinematics. Sensors 2020, 20, 5993. [Google Scholar] [CrossRef]
- Jiang, X.; Napier, C.; Hannigan, B.; Eng, J.J.; Menon, C. Estimating Vertical Ground Reaction Force during Walking Using a Single Inertial Sensor. Sensors 2020, 20, 4345. [Google Scholar] [CrossRef]
- Tadano, S.; Takeda, R.; Miyagawa, H. Three Dimensional Gait Analysis Using Wearable Acceleration and Gyro Sensors Based on Quaternion Calculations. Sensors 2013, 13, 9321–9343. [Google Scholar] [CrossRef]
- Thorp, L.E.; Sumner, D.R.; Block, J.A.; Moisio, K.C.; Shott, S.; Wimmer, M.A. Knee Joint Loading Differs in Individuals with Mild Compared with Moderate Medial Knee Osteoarthritis. Arthritis Rheum 2006, 54, 3842–3849. [Google Scholar] [CrossRef]
- Ferrari, A.; Cutti, A.G.; Cappello, A. A New Formulation of the Coefficient of Multiple Correlation to Assess the Similarity of Waveforms Measured Synchronously by Different Motion Analysis Protocols. Gait Posture 2010, 31, 540–542. [Google Scholar] [CrossRef] [PubMed]
- Kadaba, M.P.; Ramakrishnan, H.K.; Wootten, M.E.; Gainey, J.; Gorton, G.; Cochran, G.V.B. Repeatability of Kinematic, Kinetic, and Electromyographic Data in Normal Adult Gait. J. Orthop. Res. 1989, 7, 849–860. [Google Scholar] [CrossRef] [PubMed]
- Ino, T.; Samukawa, M.; Ishida, T.; Wada, N.; Koshino, Y.; Kasahara, S.; Tohyama, H. Validity of AI-Based Gait Analysis for Simultaneous Measurement of Bilateral Lower Limb Kinematics Using a Single Video Camera. Sensors 2023, 23, 9799. [Google Scholar] [CrossRef] [PubMed]
- Sekiya, N.; Nagasaki, H.; Ito, H.; Furuna, T. The invariant relationship between step length and step rate during free walking. J. Hum. Mov. Stud. 1996, 30, 241–257. [Google Scholar]
- Rutherford, D.J.; Hubley-Kozey, C.L.; Deluzio, K.J.; Stanish, W.D.; Dunbar, M. Foot Progression Angle and the Knee Adduction Moment: A Cross-Sectional Investigation in Knee Osteoarthritis. Osteoarthr. Cartil. 2008, 16, 883–889. [Google Scholar] [CrossRef]
- Tas, S. Effects of Severity of Osteoarthritis on the Temporospatial Gait Parameters in Patients with Knee Osteoarthritis. Acta Orthop. Traumatol. Turc. 2014, 48, 635–641. [Google Scholar] [CrossRef]
- Elbaz, A.; Mor, A.; Segal, G.; Debi, R.; Shazar, N.; Herman, A. Novel Classification of Knee Osteoarthritis Severity Based on Spatiotemporal Gait Analysis. Osteoarthr. Cartil. 2014, 22, 457–463. [Google Scholar] [CrossRef]
- Mills, K.; Hunt, M.A.; Ferber, R. Biomechanical Deviations during Level Walking Associated with Knee Osteoarthritis: A Systematic Review and Meta-Analysis. Arthritis Care Res. 2013, 65, 1643–1665. [Google Scholar] [CrossRef]
- James, K.A.; Neogi, T.; Felson, D.T.; Corrigan, P.; Lewis, C.L.; Davis, I.S.; Bacon, K.L.; Torner, J.C.; Lewis, C.E.; Nevitt, M.C.; et al. Association of Walking Cadence to Changes in Knee Pain and Physical Function: The Multicenter Osteoarthritis Study. Osteoarthr. Cartil. Open 2025, 7, 100575. [Google Scholar] [CrossRef] [PubMed]
- Kim, Y. Influence of Internal and External Foot Rotation on Peak Knee Adduction Moments and Ankle Moments during Gait in Individuals with Knee Osteoarthritis: A Cross-Sectional Study. Bioengineering 2024, 11, 696. [Google Scholar] [CrossRef]
- van den Noort, J.J.C.; van der Esch, M.; Steultjens, M.P.M.; Dekker, J.; Schepers, M.H.M.; Veltink, P.H.; Harlaar, J. Ambulatory Measurement of the Knee Adduction Moment in Patients with Osteoarthritis of the Knee. J. Biomech. 2013, 46, 43–49. [Google Scholar] [CrossRef]
- van den Noort, J.C.; van der Esch, M.; Steultjens, M.P.M.; Dekker, J.; Schepers, H.M.; Veltink, P.H.; Harlaar, J. The Knee Adduction Moment Measured with an Instrumented Force Shoe in Patients with Knee Osteoarthritis. J. Biomech. 2012, 45, 281–288. [Google Scholar] [CrossRef]
- Brockett, C.L.; Chapman, G.J. Biomechanics of the Ankle. Orthop. Trauma 2016, 30, 232–238. [Google Scholar] [CrossRef] [PubMed]
- Jeon, E.; Cho, H. A Novel Method for Gait Analysis on Center of Pressure Excursion Based on a Pressure-Sensitive Mat. Int. J. Environ. Res. Public Health 2020, 17, 7845. [Google Scholar] [CrossRef] [PubMed]
- Yin, L.; Chen, P.; Xu, J.; Gong, Y.; Zhuang, Y.; Chen, Y.; Wang, L. Validity and Reliability of Inertial Measurement Units for Measuring Gait Kinematics in Older Adults across Varying Fall Risk Levels and Walking Speeds. BMC Geriatr. 2025, 25, 336. [Google Scholar] [CrossRef]
- Zeng, Z.; Liu, Y.; Li, P.; Wang, L. Validity and Reliability of Inertial Measurement Units Measurements for Running Kinematics in Different Foot Strike Pattern Runners. Front. Bioeng. Biotechnol. 2022, 10, 1005496. [Google Scholar] [CrossRef]


| CMC | |||||||
|---|---|---|---|---|---|---|---|
| Preferred | Reduced | Lowest | |||||
| Early-SLS Phase | Late-SLS Phase | Early-SLS Phase | Late-SLS Phase | Early-SLS Phase | Late-SLS Phase | ||
| Participant 1 | Trial 1 | 0.98 | NaN | 0.74 | NaN | 0.62 | 0.77 |
| Trial 2 | 0.99 | 0.29 | 0.86 | NaN | 0.80 | NaN | |
| Participant 2 | Trial 1 | 0.97 | 0.55 | 0.83 | NaN | 0.82 | NaN |
| Trial 2 | 0.67 | NaN | 0.89 | NaN | 0.43 | 0.23 | |
| Participant 3 | Trial 1 | 0.83 | NaN | 0.66 | NaN | 0.52 | NaN |
| Trial 2 | 0.93 | NaN | 0.75 | NaN | 0.48 | NaN | |
| CMC | |||||||
|---|---|---|---|---|---|---|---|
| Preferred | Reduced | Lowest | |||||
| Early-SLS Phase | Late-SLS Phase | Early-SLS Phase | Late-SLS Phase | Early-SLS Phase | Late-SLS Phase | ||
| Participant 1 | Trial 1 | 0.85 | 0.74 | 0.91 | 0.89 | 0.68 | 0.97 |
| Trial 2 | 0.99 | 0.94 | 0.93 | 0.92 | 0.46 | 0.69 | |
| Participant 2 | Trial 1 | 0.97 | 0.89 | 0.91 | 0.57 | NaN | NaN |
| Trial 2 | 0.99 | 0.82 | 0.85 | NaN | 0.54 | NaN | |
| Participant 3 | Trial 1 | 0.77 | NaN | 0.86 | 0.77 | 0.04 | 0.71 |
| Trial 2 | 0.67 | 0.13 | 0.84 | 0.44 | 0.84 | 0.81 | |
| CMC | |||||||
|---|---|---|---|---|---|---|---|
| Preferred | Reduced | Lowest | |||||
| Early-SLS Phase | Late-SLS Phase | Early-SLS Phase | Late-SLS Phase | Early-SLS Phase | Late-SLS Phase | ||
| Participant 1 | Trial 1 | 0.70 | 0.96 | 0.30 | 0.59 | NaN | NaN |
| Trial 2 | 0.56 | 0.90 | NaN | 0.89 | NaN | 0.69 | |
| Participant 2 | Trial 1 | NaN | 0.35 | NaN | NaN | 0.89 | NaN |
| Trial 2 | NaN | 0.56 | NaN | 0.72 | NaN | NaN | |
| Participant 3 | Trial 1 | NaN | NaN | NaN | NaN | NaN | NaN |
| Trial 2 | NaN | NaN | NaN | NaN | NaN | NaN | |
Disclaimer/Publisher’s Note: The statements, opinions and data contained in all publications are solely those of the individual author(s) and contributor(s) and not of MDPI and/or the editor(s). MDPI and/or the editor(s) disclaim responsibility for any injury to people or property resulting from any ideas, methods, instructions or products referred to in the content. |
© 2025 by the authors. Licensee MDPI, Basel, Switzerland. This article is an open access article distributed under the terms and conditions of the Creative Commons Attribution (CC BY) license (https://creativecommons.org/licenses/by/4.0/).
Share and Cite
Matsuda, T.; Watanabe, J.; Sotokawa, T.; Shishime, T.; Katoh, H. Estimation of the External Knee Adduction Moment Using Inertial Measurement Unit Sensors on the Shank and Lower Back: A Pilot Study. J. Funct. Morphol. Kinesiol. 2025, 10, 356. https://doi.org/10.3390/jfmk10030356
Matsuda T, Watanabe J, Sotokawa T, Shishime T, Katoh H. Estimation of the External Knee Adduction Moment Using Inertial Measurement Unit Sensors on the Shank and Lower Back: A Pilot Study. Journal of Functional Morphology and Kinesiology. 2025; 10(3):356. https://doi.org/10.3390/jfmk10030356
Chicago/Turabian StyleMatsuda, Tomoaki, Junichi Watanabe, Tasuku Sotokawa, Toru Shishime, and Hiroshi Katoh. 2025. "Estimation of the External Knee Adduction Moment Using Inertial Measurement Unit Sensors on the Shank and Lower Back: A Pilot Study" Journal of Functional Morphology and Kinesiology 10, no. 3: 356. https://doi.org/10.3390/jfmk10030356
APA StyleMatsuda, T., Watanabe, J., Sotokawa, T., Shishime, T., & Katoh, H. (2025). Estimation of the External Knee Adduction Moment Using Inertial Measurement Unit Sensors on the Shank and Lower Back: A Pilot Study. Journal of Functional Morphology and Kinesiology, 10(3), 356. https://doi.org/10.3390/jfmk10030356