
Effects of Integrating a Plyometric Training Program During Physical Education Classes on Ballistic Neuromuscular Performance

 ,
,  ,
,  and
and 
Abstract
1. Introduction
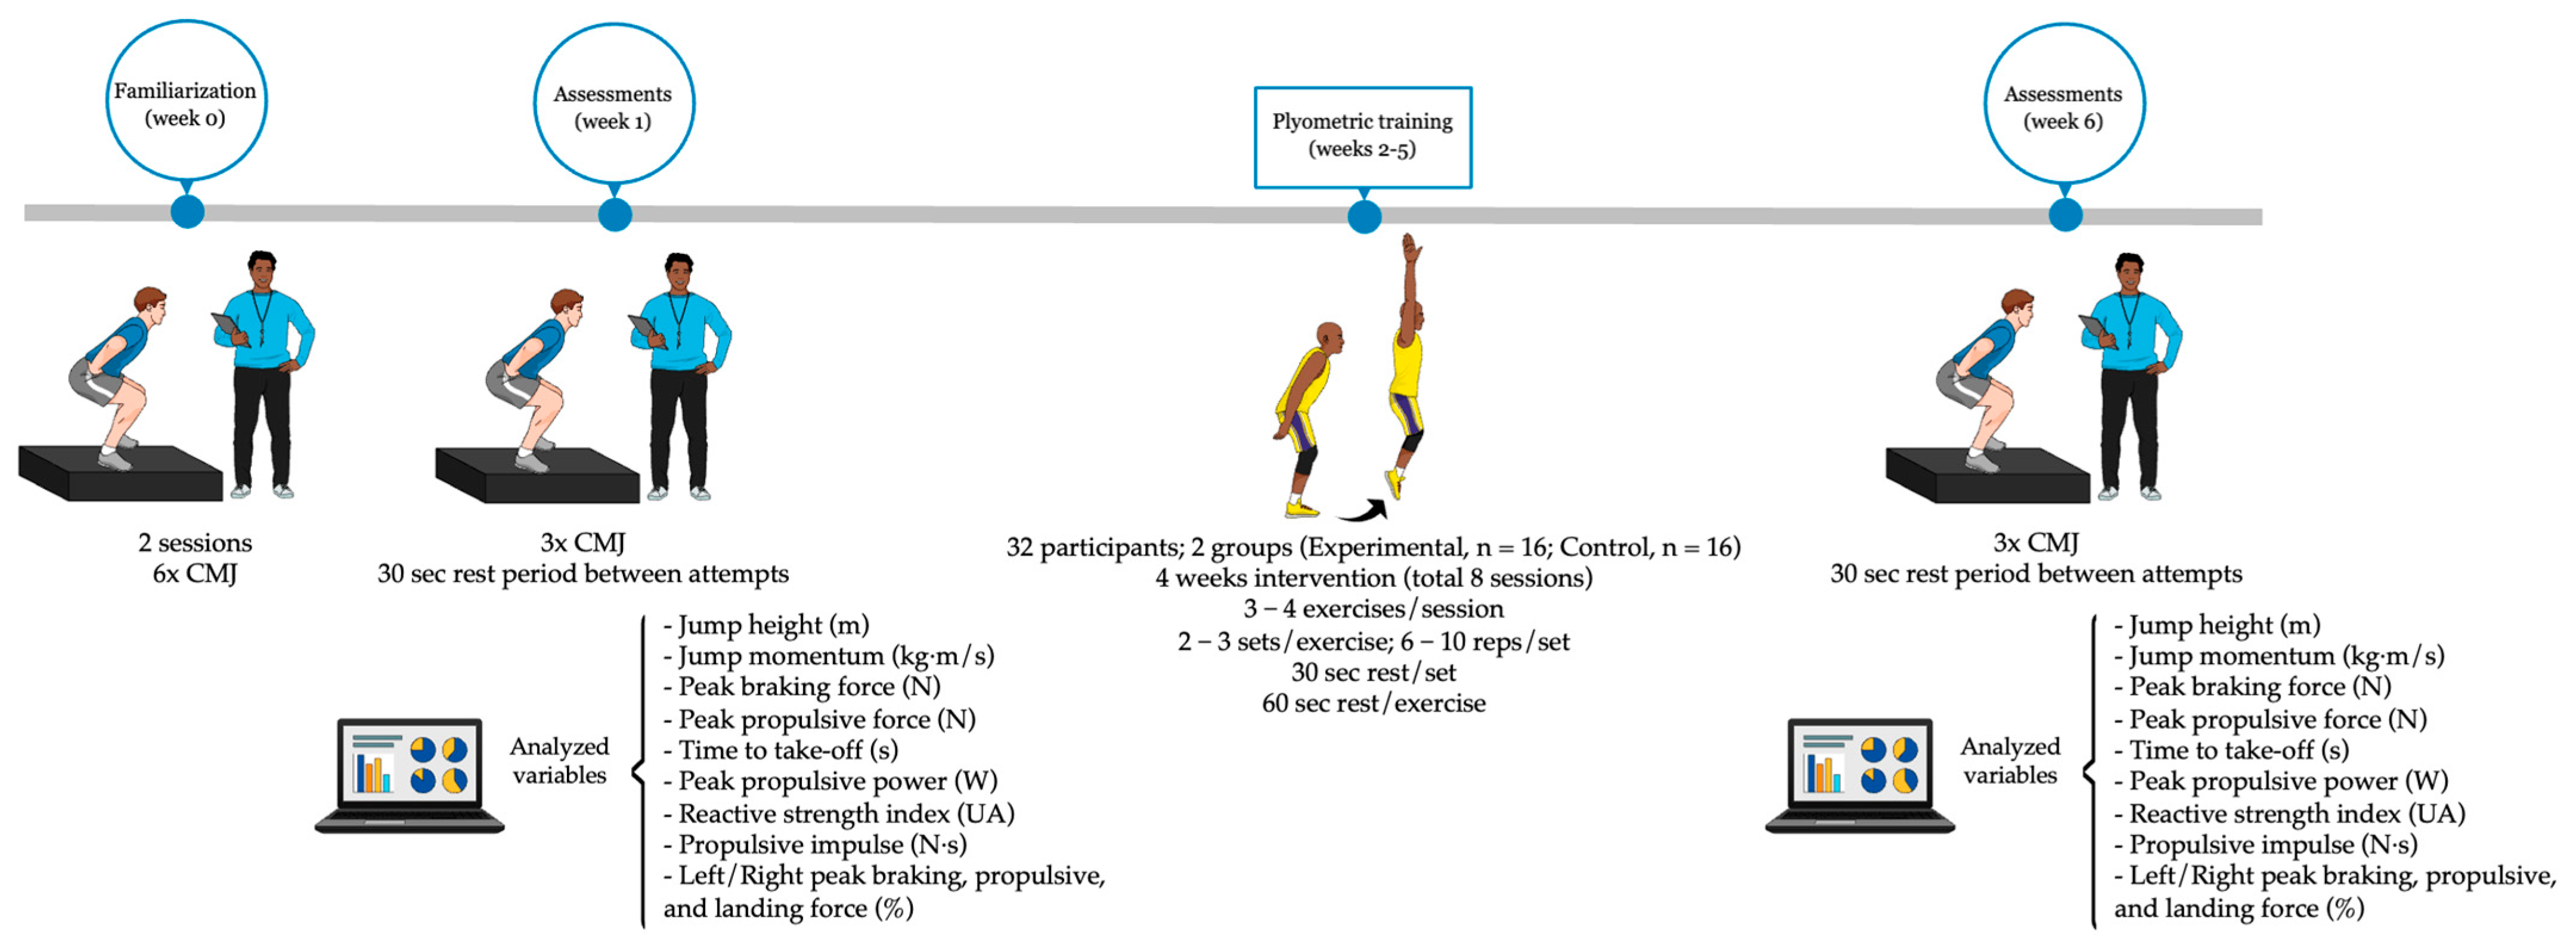
2. Materials and Methods
2.1. Participants
2.2. Procedures
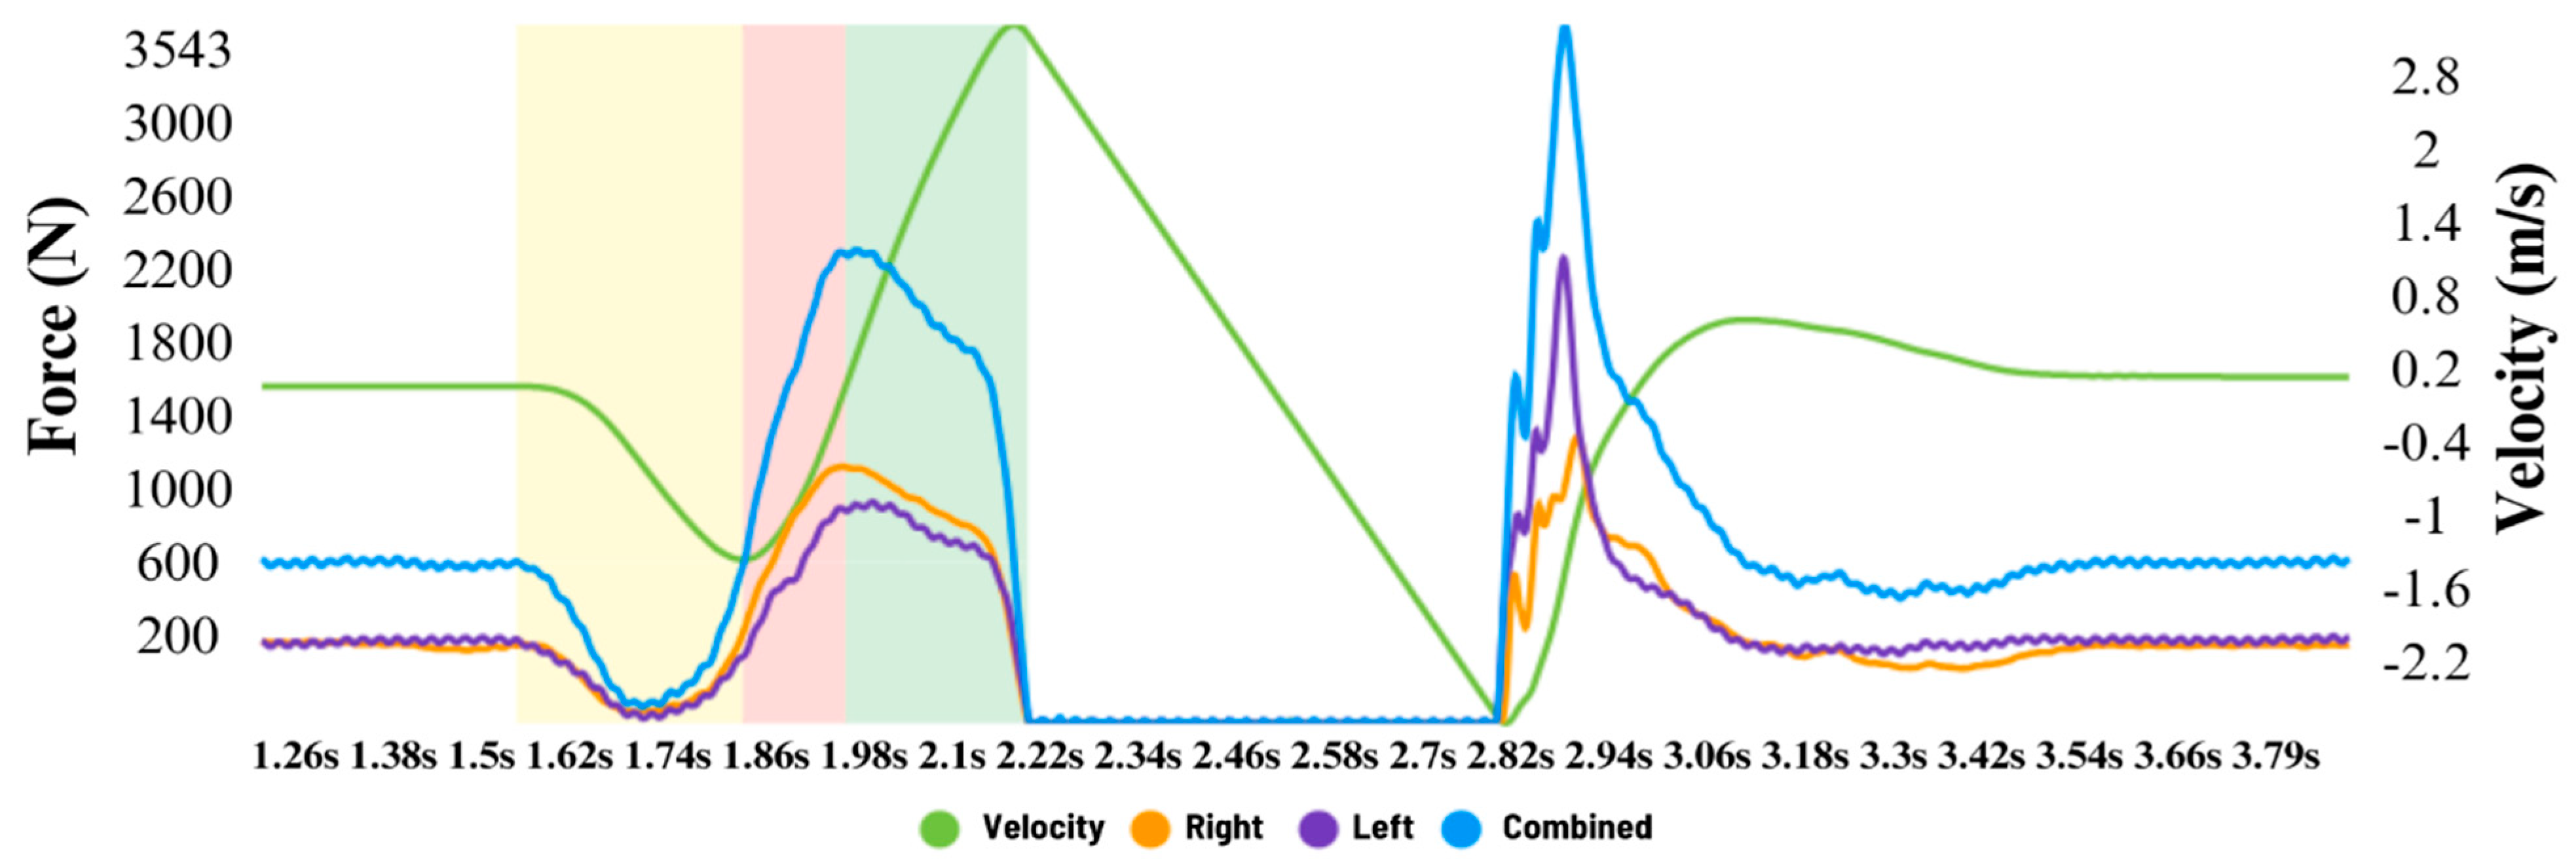
2.3. Assessments
Plyometric Training Program
2.4. Statistical Analysis
3. Results
4. Discussion
5. Conclusions
Author Contributions
Funding
Institutional Review Board Statement
Informed Consent Statement
Data Availability Statement
Conflicts of Interest
Abbreviations
| CG | Control Group |
| CMJ | Countermovement Jump |
| EG | Experimental Group |
| ES | Effect Size |
| L|R | Left–Right Ratio |
| mRSI | Modified Reactive Strength Index |
| RSI | Reactive Strength Index |
| SSC | Stretch–Shortening Cycle |
References
- Romero, C.; Ramirez-Campillo, R.; Alvarez, C.; Moran, J.; Slimani, M.; Gonzalez, J.; Banzer, W.E. Effects of Maturation on Physical Fitness Adaptations to Plyometric Jump Training in Youth Females. J. Strength Cond. Res. 2021, 35, 2870–2877. [Google Scholar] [CrossRef]
- Markovic, G.; Mikulic, P. Neuro-Musculoskeletal and Performance Adaptations to Lower-Extremity Plyometric Training. Sports Med. 2010, 40, 859–895. [Google Scholar] [CrossRef] [PubMed]
- Hirayama, K.; Iwanuma, S.; Ikeda, N.; Yoshikawa, A.; Ema, R.; Kawakami, Y. Plyometric Training Favors Optimizing Muscle–Tendon Behavior during Depth Jumping. Front. Physiol. 2017, 8, 16. [Google Scholar] [CrossRef] [PubMed]
- Al Attar, W.S.A.; Bakhsh, J.M.; Khaledi, E.H.; Ghulam, H.; Sanders, R.H. Injury Prevention Programs That Include Plyometric Exercises Reduce the Incidence of Anterior Cruciate Ligament Injury: A Systematic Review of Cluster Randomised Trials. J. Physiother. 2022, 68, 255–261. [Google Scholar] [CrossRef]
- Bedoya, A.A.; Miltenberger, M.R.; Lopez, R.M. Plyometric Training Effects on Athletic Performance in Youth Soccer Athletes: A Systematic Review. J. Strength Cond. Res. 2015, 29, 2351–2360. [Google Scholar] [CrossRef]
- Markovic, G.; Jukic, I.; Milanovic, D.; Metikos, D. Effects of Sprint and Plyometric Training on Muscle Function and Athletic Performance. J. Strength Cond. Res. 2007, 21, 543–549. [Google Scholar] [PubMed]
- Ricart-Luna, B.; Domínguez-Navarro, F.; Gene-Morales, J.; Colado, J.C.; Juesas, Á.; Portes, R.; Chulvi-Medrano, I. Effects of a 4-Week Weightlifting or Plyometric Training Mesocycle on Physical Performance in Highly Trained Adolescent Basketball Players. J. Sports Sci. 2025, 43, 637–648. [Google Scholar] [CrossRef]
- Alonso-Aubin, D.A.; Moya del Saz, I.; Martínez-Guardado, I.; Chulvi-Medrano, I. An Integrative Neuromuscular Training Program in Physical Education Classes Improves Strength and Speed Performance. Healthcare 2025, 13, 1372. [Google Scholar] [CrossRef]
- Granacher, U.; Muehlbauer, T.; Doerflinger, B.; Strohmeier, R.; Gollhofer, A. Promoting Strength and Balance in Adolescents during Physical Education: Effects of a Short-Term Resistance Training. J. Strength Cond. Res. 2011, 25, 940–949. [Google Scholar] [CrossRef]
- Marzouki, H.; Dridi, R.; Ouergui, I.; Selmi, O.; Mbarki, R.; Klai, R.; Bouhlel, E.; Weiss, K.; Knechtle, B. Effects of Surface-Type Plyometric Training on Physical Fitness in Schoolchildren of Both Sexes: A Randomized Controlled Intervention. Biology 2022, 11, 1035. [Google Scholar] [CrossRef]
- Marzouki, H.; Ouergui, I.; Dridi, R.; Selmi, O.; Mbarki, R.; Mjadri, N.; Thuany, M.; Andrade, M.S.; Bouhlel, E.; Weiss, K. Effects of Four Weeks of Plyometric Training Performed in Different Training Surfaces on Physical Performances in School Children: Age and Sex Comparisons. Children 2022, 9, 1914. [Google Scholar] [CrossRef]
- Radwan, N.L.; Mahmoud, W.S.; Mohamed, R.A.; Ibrahim, M.M. Effect of Adding Plyometric Training to Physical Education Sessions on Specific Biomechanical Parameters in Primary School Girls. J. Musculoskelet. Neuronal Interact. 2021, 21, 237. [Google Scholar] [PubMed]
- Lake, J.; Mundy, P.; Comfort, P.; McMahon, J.J.; Suchomel, T.J.; Carden, P. Concurrent Validity of a Portable Force Plate Using Vertical Jump Force–Time Characteristics. J. Appl. Biomech. 2018, 34, 410–413. [Google Scholar] [CrossRef]
- Bishop, C.; Jordan, M.; Torres-Ronda, L.; Loturco, I.; Harry, J.; Virgile, A.; Mundy, P.; Turner, A.; Comfort, P. Selecting Metrics That Matter: Comparing the Use of the Countermovement Jump for Performance Profiling, Neuromuscular Fatigue Monitoring, and Injury Rehabilitation Testing. Strength Cond. J. 2023, 45, 545–553. [Google Scholar] [CrossRef]
- Moran, J.J.; Sandercock, G.R.; Ramírez-Campillo, R.; Meylan, C.M.; Collison, J.A.; Parry, D.A. Age-Related Variation in Male Youth Athletes’ Countermovement Jump after Plyometric Training: A Meta-Analysis of Controlled Trials. J. Strength Cond. Res. 2017, 31, 552–565. [Google Scholar] [CrossRef]
- Sánchez-Sixto, A.; Harrison, A.J.; Floría, P. Effects of Plyometric vs. Combined Plyometric Training on Vertical Jump Biomechanics in Female Basketball Players. J. Hum. Kinet. 2021, 77, 25. [Google Scholar] [CrossRef] [PubMed]
- McErlain-Naylor, S.A.; Beato, M. Factors Influencing the Jump Momentum—Sprint Momentum Correlation: A Data Simulation. Eur. J. Sport Sci. 2022, 22, 1847–1855. [Google Scholar] [CrossRef]
- Loturco, I.; Zabaloy, S.; Bishop, C.; Mercer, V.P.; Moura, T.B.; Ramos, M.S.; Freitas, T.T.; Pereira, L.A. Jump Squat Momentum: An Alternative Method to Prescribe Jump Squat Loads for Elite Rugby Union Players. J. Strength Cond. Res. 2025. [Google Scholar]
- Barker, L.A.; Harry, J.R.; Mercer, J.A. Relationships between Countermovement Jump Ground Reaction Forces and Jump Height, Reactive Strength Index, and Jump Time. J. Strength Cond. Res. 2018, 32, 248–254. [Google Scholar] [CrossRef]
- Focke, A.; Strutzenberger, G.; Jekauc, D.; Worth, A.; Woll, A.; Schwameder, H. Effects of Age, Sex and Activity Level on Counter-movement Jump Performance in Children and Adolescents. Eur. J. Sport Sci. 2013, 13, 518–526. [Google Scholar] [CrossRef]
- Lloyd, R.S.; Oliver, J.L.; Hughes, M.G.; Williams, C.A. The Influence of Chronological Age on Periods of Accelerated Adaptation of Stretch-Shortening Cycle Performance in Pre and Postpubescent Boys. J. Strength Cond. Res. 2011, 25, 1889–1897. [Google Scholar] [CrossRef]
- Barillas, S.R.; Oliver, J.L.; Lloyd, R.S.; Pedley, J.S. Kinetic Responses to External Cues Are Specific to Both the Type of Cue and Type of Exercise in Adolescent Athletes. J. Strength Cond. Res. 2023, 37, 597–605. [Google Scholar] [CrossRef] [PubMed]
- Cardiel-Sánchez, S.; Rubio-Peirotén, A.; Molina-Molina, A.; Gómez, C.G.-C.; Almenar-Arasanz, A.; Ráfales-Perucha, A.; Roche-Seruendo, L.E.; Cartón-Llorente, A. Effects of Plyometric Training on Running Biomechanics and Jumping Ability of U14 Athletes. J. Strength Cond. Res. 2024, 38, e656–e663. [Google Scholar] [CrossRef] [PubMed]
- Cabarkapa, D.V.; Cabarkapa, D.; Aleksic, J.; Ranisavljev, I.; Fry, A.C. Does the Short-Term Learning Effect Impact Vertical Jump Performance Assessment on a Portable Force Plate System? Front. Sports Act. Living 2024, 6, 1441022. [Google Scholar] [CrossRef] [PubMed]
- Kubo, K.; Ikebukuro, T.; Yata, H. Effects of Plyometric Training on Muscle–Tendon Mechanical Properties and Behavior of Fascicles during Jumping. Physiol. Rep. 2021, 9, e15073. [Google Scholar] [CrossRef]
- Duchateau, J.; Hainaut, K. Mechanisms of Muscle and Motor Unit Adaptation to Explosive Power Training. In Strength and Power in Sport, 2nd ed.; Komi, P.V., Ed.; Blackwell Science: Oxford, UK, 2003; pp. 315–330. [Google Scholar]
- Barrio, E.D.; Thapa, R.K.; Villanueva-Flores, F.; Garcia-Atutxa, I.; Santibañez-Gutierrez, A.; Fernández-Landa, J.; Ramirez-Campillo, R. Plyometric Jump Training Exercise Optimization for Maximizing Human Performance: A Systematic Scoping Review and Identification of Gaps in the Existing Literature. Sports 2023, 11, 150. [Google Scholar] [CrossRef]
- Flanagan, S.D.; Dunn-Lewis, C.; Comstock, B.A.; Maresh, C.M.; Volek, J.S.; Denegar, C.R.; Kraemer, W.J. Cortical Activity during a Highly-Trained Resistance Exercise Movement Emphasizing Force, Power or Volume. Brain Sci. 2012, 2, 649–666. [Google Scholar] [CrossRef]

| Week 1 | ||||
|---|---|---|---|---|
| Day | Exercise | Series | Repetitions | Contacts |
| 1 | Snap downs | 2 | 8 | 16 |
| Pogo jumps | 2 | 10 | 20 | |
| CMJ to box (0.30 m) | 2 | 6 | 12 | |
| 2 | Snap downs | 3 | 8 | 24 |
| Pogo jumps | 3 | 10 | 30 | |
| CMJ to box (0.30 m) | 3 | 6 | 18 | |
| Total contacts/week | 120 | |||
| Week 2 | ||||
| Day | Exercise | Series | Repetitions | Contacts |
| 1 | Pogo jumps | 3 | 8 | 24 |
| CMJ to box (0.40 m) | 3 | 6 | 24 | |
| Right unilateral vertical jumps | 3 | 6 | 18 | |
| Left unilateral vertical jumps | 3 | 6 | 18 | |
| 2 | Pogo jumps | 3 | 10 | 30 |
| CMJ to box (0.40 m) | 3 | 8 | 24 | |
| Right unilateral vertical jumps | 3 | 8 | 24 | |
| Left unilateral vertical jumps | 3 | 8 | 24 | |
| Total contacts/week | 186 | |||
| Week 3 | ||||
| Day | Exercise | Series | Repetitions | Contacts |
| 1 | CMJ to box (0.40 m) | 3 | 8 | 24 |
| Right unilateral vertical jumps | 3 | 10 | 30 | |
| Left unilateral vertical jumps | 3 | 10 | 30 | |
| Drop jump (0.40 m) | 3 | 6 | 18 | |
| 2 | CMJ to box (0.40 m) | 3 | 8 | 24 |
| Right unilateral vertical jumps | 3 | 10 | 30 | |
| Left unilateral vertical jumps | 3 | 10 | 30 | |
| Drop jump (0.40 m) | 3 | 8 | 24 | |
| Total contacts/week | 210 | |||
| Week 4 | ||||
| Day | Exercise | Series | Repetitions | Contacts |
| 1 | CMJ to box (0.40 m) | 3 | 8 | 24 |
| Right unilateral vertical jumps | 3 | 10 | 30 | |
| Left unilateral vertical jumps | 3 | 10 | 30 | |
| Drop jump (0.40 m) | 3 | 6 | 18 | |
| 2 | CMJ to box (0.40 m) | 3 | 8 | 24 |
| Right unilateral vertical jumps | 3 | 10 | 30 | |
| Left unilateral vertical jumps | 3 | 10 | 30 | |
| Drop jump (0.40 m) | 3 | 8 | 24 | |
| Total contacts/week | 210 | |||
| Group | Metric | Before Plyometric Training | After Plyometric Training | t-test | Significance Index | Effect Size | |||
|---|---|---|---|---|---|---|---|---|---|
| Mean ± SD | CI (95%) | Mean ± SD | CI (95%) | t | p | Cohen d | Interpretation | ||
| Experimental | Jump height (m) | 0.23 ± 0.08 | 0.14–0.22 | 0.25 ± 0.09 | 0.16–0.28 | 3.24 | 0.006 ** | 0.83 | Large |
| Jump momentum (kg·m/s) | 130.58 ± 27.23 | 94.89–134.98 | 134.33 ± 29.61 | 102.76–147.26 | 3.10 | 0.008 ** | 0.80 | Large | |
| Peak braking force (N) | 1375.93 ± 302.13 | 1262.84–1530.49 | 1354.84 ± 289.40 | 1353.85–1682.45 | 0.55 | 0.59 | 0.14 | Trivial | |
| Peak relative braking force (N/kg) | 227.60 ± 38.64 | 216.37–257.52 | 221.19 ± 34.71 | 232.91–278.20 | 1.03 | 0.31 | 0.26 | Small | |
| Peak propulsive force (N) | 1502.40 ± 332.21 | 1318.28–1627.97 | 1491.40 ± 337.98 | 1442.23–1808.53 | 0.27 | 0.78 | 0.07 | Trivial | |
| Peak relative propulsive force (N/kg) | 249.00 ± 35.20 | 227.97–270.52 | 274.00 ± 43.70 | 247.49–300.27 | 0.85 | 0.40 | 0.22 | Small | |
| Time to take-off (s) | 0.72 ± 0.11 | 0.50–0.64 | 0.73 ± 0.12 | 0.63–0.78 | 0.76 | 0.45 | 0.19 | Trivial | |
| Take-off velocity (m/s) | 2.10 ± 0.39 | 1.67–2.06 | 2.19 ± 0.44 | 1.79–2.31 | 3.62 | 0.003 ** | 0.93 | Large | |
| Peak propulsive power (W) | 2663.00 ± 733.50 | 1972.97–2947.71 | 2549.63 ± 667.40 | 1918.43–2762.56 | 2.99 | 0.01 ** | 0.77 | Moderate | |
| RSI (UA) | 0.60 ± 0.15 | 0.61–0.74 | 0.61 ± 0.16 | 0.54–0.64 | 1.44 | 0.17 | 0.37 | Small | |
| mRSI (UA) | 0.33 ± 0.14 | 0.25–0.41 | 0.35 ± 0.16 | 0.26–0.44 | 1.44 | 0.17 | 0.37 | Small | |
| Propulsive impulse (N·s) | 277.60 ± 52.08 | 249.91–306.37 | 278.14 ± 49.04 | 251.27–305.48 | −0.14 | 0.88 | −0.03 | Trivial | |
| L|R Peak braking force (%) | −3.66 ± 7.61 | −2.81–5.55 | −2.10 ± 8.46 | −2.53–6.23 | −1.36 | 0.19 | −0.35 | Small | |
| L|R Peak propulsive force (%) | −1.80 ± 4.26 | −2.24–4.58 | −1.85 ± 4.17 | −2.53–4.84 | 0.06 | 0.95 | 0.01 | Trivial | |
| L|R Peak landing force (%) | −3.14 ± 12.14 | −7.25–1.46 | 1.43 ± 11.10 | −10.24–0.73 | −1.21 | 0.24 | −0.31 | Small | |
| Control | Jump height (m) | 0.22 ± 0.09 | 0.16–0.28 | 0.18 ± 0.06 | 0.14–0.22 | 2.39 | 0.034 ** | 0.66 | Moderate |
| Jump momentum (kg·m/s) | 125.01 ± 36.82 | 102.76–147.26 | 114.93 ± 33.16 | 94.89–134.98 | 2.12 | 0.05 * | 0.58 | Moderate | |
| Peak braking force (N) | 1396.66 ± 221.45 | 1262.28–1530.49 | 1518.15 ± 271.88 | 1353.85–1682.45 | −1.59 | 0.13 | −0.44 | Small | |
| Peak relative braking force (N/kg) | 236.94 ± 34.04 | 216.37–257.52 | 255.55 ± 37.47 | 232.91–278.20 | −1.49 | 0.16 | −0.41 | Small | |
| Peak propulsive force (N) | 1473.12 ± 256.24 | 1318.28–1627.97 | 1625.38 ± 303.07 | 1442.23–1808.53 | −2.15 | 0.05 * | −0.59 | Moderate | |
| Peak relative propulsive force (N/kg) | 249.25 ± 35.20 | 227.97–270.52 | 273.88 ± 43.66 | 247.49–300.27 | −2.08 | 0.05 * | −0.57 | Moderate | |
| Time to take-off (s) | 0.71 ± 0.13 | 0.63–0.78 | 0.57 ± 0.11 | 0.50–0.64 | 3.97 | 0.002 ** | 1.10 | Large | |
| Take-off velocity (m/s) | 2.05 ± 0.43 | 1.79–2.31 | 1.86 ± 0.32 | 1.67–2.06 | 2.25 | 0.04 * | 0.62 | Moderate | |
| Peak propulsive power (W) | 2460.34 ± 806.51 | 1972.97–2947.71 | 2340.50 ± 698.44 | 1918.43–2762.56 | 1.09 | 0.29 | 0.30 | Small | |
| RSI (UA) | 0.59 ± 0.08 | 0.54–0.64 | 0.67 ± 0.10 | 0.61–0.74 | −2.95 | 0.01 * | −0.82 | Large | |
| mRSI (UA) | 0.31 ± 0.09 | 0.25–0.36 | 0.32 ± 0.08 | 0.26–0.37 | −0.46 | 0.65 | −0.12 | Trivial | |
| Propulsive impulse (N·s) | 261.12 ± 69.81 | 218.93–303.31 | 233.30 ± 69.68 | 191.19–275.41 | 3.37 | 0.006 ** | 0.93 | Large | |
| L|R Peak braking force (%) | 1.37 ± 6.92 | −2.81–5.55 | 1.85 ± 7.25 | −2.54–6.23 | −0.59 | 0.56 | −0.16 | Trivial | |
| L|R Peak propulsive force (%) | 1.17 ± 5.64 | −2.24–4.58 | 1.24 ± 5.96 | −2.35–4.84 | −0.11 | 0.91 | −0.03 | Trivial | |
| L|R Peak landing force (%) | −2.89 ± 7.21 | −7.52–1.46 | −5.48 ± 7.86 | −10.24–0.73 | 1.23 | 0.23 | 0.34 | Trivial | |
| Metric | t-test (EG–CG) | Significance Index | Mean Difference | SE of the Difference | CI (95%) | Effect Size | ||
|---|---|---|---|---|---|---|---|---|
| t | p | Lower | Upper | Cohen d | Interpretation | |||
| System weight | −0.88 | 0.38 | −4.06 | 4.59 | −13.51 | 5.37 | −0.33 | Small |
| Jump height (m) | 1.12 | 0.27 | −0.01 | 0.01 | −0.05 | 0.01 | −0.42 | Small |
| Jump momentum (kg·m/s) | −1.38 | 0.17 | −6.33 | 4.58 | −15.76 | 3.09 | −0.52 | Moderate |
| Peak braking force (N) | 1.74 | 0.09 | 142.57 | 81.69 | −25.35 | 310.50 | 0.66 | Moderate |
| Peak relative braking force (N/kg) | 1.87 | 0.07 | 25.02 | 13.31 | −2.34 | 52.39 | 0.71 | Moderate |
| Peak propulsive force (N) | 2.08 | 0.04 * | 163.25 | 78.48 | 1.92 | 324.59 | 0.78 | Moderate |
| Peak relative propulsive force (N/kg) | 2.33 | 0.02 * | 29.94 | 12.85 | 3.53 | 56.36 | 0.88 | Large |
| Time to take-off (s) | −3.02 | 0.005 ** | −0.11 | 0.03 | −0.19 | −0.03 | −1.14 | Large |
| Take-off velocity (m/s) | −1.22 | 0.23 | −0.09 | 0.08 | −0.26 | 0.06 | −0.46 | Small |
| Peak propulsive power (W) | −0.05 | 0.95 | −6.47 | 109.63 | −231.83 | 218.89 | −0.02 | Trivial |
| RSI (UA) | 2.53 | 0.01 * | 0.09 | 0.03 | 0.01 | 0.17 | 0.96 | Large |
| mRSI (UA) | 1.27 | 0.21 | 0.03 | 0.02 | −0.02 | 0.08 | 0.48 | Small |
| Propulsive impulse (N·s) | −3.28 | 0.003 ** | −28.35 | 8.63 | −46.10 | −10.61 | −1.24 | Large |
| L|R Peak braking force (%) | −0.74 | 0.46 | −1.07 | 1.43 | −4.02 | 1.88 | −0.28 | Small |
| L|R Peak propulsive force (%) | 0.11 | 0.90 | 0.12 | 1.03 | −2.01 | 2.25 | 0.04 | Trivial |
| L|R Peak landing force (%) | −1.59 | 0.12 | −7.16 | 4.48 | −16.39 | 2.05 | −0.60 | Moderate |
| L|R Braking impulse index | −0.16 | 0.87 | −0.57 | 3.55 | −7.89 | 6.73 | −0.06 | Trivial |
| L|R Propulsive impulse index | −0.02 | 0.98 | −0.03 | 1.51 | −3.14 | 3.07 | 0.00 | Trivial |
| L|R Landing impulse index | 0.89 | 0.37 | 8.59 | 9.55 | −11.03 | 28.22 | 0.34 | Small |
Disclaimer/Publisher’s Note: The statements, opinions and data contained in all publications are solely those of the individual author(s) and contributor(s) and not of MDPI and/or the editor(s). MDPI and/or the editor(s) disclaim responsibility for any injury to people or property resulting from any ideas, methods, instructions or products referred to in the content. |
© 2025 by the authors. Licensee MDPI, Basel, Switzerland. This article is an open access article distributed under the terms and conditions of the Creative Commons Attribution (CC BY) license (https://creativecommons.org/licenses/by/4.0/).
Share and Cite
Alonso-Aubin, D.A.; Saez-Berlanga, Á.; Chulvi-Medrano, I.; Martínez-Guardado, I. Effects of Integrating a Plyometric Training Program During Physical Education Classes on Ballistic Neuromuscular Performance. J. Funct. Morphol. Kinesiol. 2025, 10, 240. https://doi.org/10.3390/jfmk10030240
Alonso-Aubin DA, Saez-Berlanga Á, Chulvi-Medrano I, Martínez-Guardado I. Effects of Integrating a Plyometric Training Program During Physical Education Classes on Ballistic Neuromuscular Performance. Journal of Functional Morphology and Kinesiology. 2025; 10(3):240. https://doi.org/10.3390/jfmk10030240
Chicago/Turabian StyleAlonso-Aubin, Diego A., Ángel Saez-Berlanga, Iván Chulvi-Medrano, and Ismael Martínez-Guardado. 2025. "Effects of Integrating a Plyometric Training Program During Physical Education Classes on Ballistic Neuromuscular Performance" Journal of Functional Morphology and Kinesiology 10, no. 3: 240. https://doi.org/10.3390/jfmk10030240
APA StyleAlonso-Aubin, D. A., Saez-Berlanga, Á., Chulvi-Medrano, I., & Martínez-Guardado, I. (2025). Effects of Integrating a Plyometric Training Program During Physical Education Classes on Ballistic Neuromuscular Performance. Journal of Functional Morphology and Kinesiology, 10(3), 240. https://doi.org/10.3390/jfmk10030240