Article

Design of a Fiber Temperature and Strain Sensor Model Using a Fiber Bragg Grating to Monitor Road Surface Conditions

by
Gulzhan Kashaganova
1,2,3,
Ainur Kozbakova
2,4,*,
Timur Kartbayev
5,
Kulzhan Togzhanova
2,
Zhuldyz Alimseitova
3 and
Gani Sergazin
6
1
Department of Computer and Software Engineering, Turan University, Almaty 050013, Kazakhstan
2
Department of Information Technologies, Almaty Technological University, Almaty 050061, Kazakhstan
3
Department of Cybersecurity, Information Processing and Storage, Satbayev University, Almaty 050013, Kazakhstan
4
Institute of Information and Computational Technologies, Committee of Science of the Ministry of Science and Higher Education of the Republic of Kazakhstan, Almaty 050010, Kazakhstan
5
Department of Digital Development, Kazakhstan Kazakh National Women’s Teacher Training University, Almaty 050000, Kazakhstan
6
Department of Science and Cooperation, Academy of Logistics and Transport, Almaty 050012, Kazakhstan
*
Author to whom correspondence should be addressed.
Inventions 2024, 9(5), 100; https://doi.org/10.3390/inventions9050100
Submission received: 12 August 2024 / Revised: 22 August 2024 / Accepted: 30 August 2024 / Published: 13 September 2024
(This article belongs to the Section Inventions and Innovation in Advanced Manufacturing)

Abstract

:
In this paper, the types and principles of operation of fiber sensors based on fiber Bragg gratings (FBGs) are investigated. The influence of strain and temperature on the characteristics of FBGs is considered, and a method for the simultaneous measurement of these parameters is presented. Laboratory studies were carried out in the temperature range from +18 °C to +135 °C with an incremental step of 5 °C, with the actual temperature not deviating by more than ±0.5 °C. From the data obtained, the Bragg wavelength–temperature relationships were plotted, which showed a linear increase in wavelength with increasing temperature. This study shows that the use of two FBGs with a different sensitivity to temperature and strain allowed for the simultaneous measurement of both parameters. Numerical models created in the MATLAB R2022b environment confirmed the high accuracy and precision of the measurements. The FBG-based sensors demonstrated a robust performance in harsh environments, withstanding temperatures of up to 160 °C and high humidity, making them applicable in various industries and sciences. This work confirms that FBGs are a promising tool for accurate temperature and strain measurements, providing reliable results in harsh environments.

1. Introduction

Currently, the number of vehicles in Kazakhstan is increasing, which has led to the active use of pavement monitoring systems. Monitoring is the process of measuring and controlling the required parameters of an object during its construction and operation. The object of monitoring can be one of various elements of an object or an object as a whole. Today, one of the monitoring systems used is the fiber optic monitoring system, which allows for the operational monitoring of the condition of an object to detect the possibility of emergencies at an early stage. Fiber optic monitoring systems consist of an integrator, a fiber optic sensor, engineering methods, and software.
In our work, the object of monitoring was the condition of a road surface. Pavement monitoring can include visual inspection of the surface, monitoring of traffic and weather conditions, and measurements on the pavement itself. Road surface testing is critical to maintaining infrastructure and ensuring road safety. However, these tests are often time-consuming and costly. Traditional destructive methods, such as sampling and laboratory testing, provide detailed data on the physical and mechanical properties of road materials, but they involve damaging the surface and often require a long analysis time. At the same time, non-destructive methods, such as the use of fiber optic sensors based on Bragg gratings (FBGs), offer the possibility of continuously monitoring road conditions without damaging the road surface. These methods can significantly reduce the time and cost of research, while providing a high accuracy and efficiency of data collection.
Road infrastructure is one of the main public assets, as it contributes to the social and economic development of any country. One of the most important indicators of road quality is the condition of the road surface. As traffic volumes increase, roads are more likely to develop cracks and potholes and undergo the effects of bad weather, a poor construction quality, and inadequate maintenance. The road surface is subject to severe wear and tear, which is a serious problem. Like other industry products, road infrastructure requires preservation, maintenance, and repair. Some pavement damage can be assessed by visual inspection. However, the vastness of any road network complicates this task, making it difficult to correctly and promptly determine the condition of the pavement. The early detection of pavement deterioration will extend the life of the pavement, bring economic benefits to the maintenance of the transportation network, and improve the safety and comfort of road users.
Nowadays, with the development of information and sensor technology, as well as the increase in vehicle production and freight transportation requirements, more and more durable road surfaces with excellent performance are being built, which requires their timely monitoring. Pavement monitoring systems play an important role in improving road safety, reducing accidents, and protecting vehicles from damage on bad roads. A considerable number of innovative fiber-based sensor systems have been developed, which offer advantages such as a small size, light weight, resistance to electromagnetic interference and corrosion, and in-line mounting. Various fiber-based sensor monitoring systems have been developed for the continuous operational measurement and condition assessment of various engineering structures such as bridges, buildings, tunnels, pipelines, wind turbines, and rail and road infrastructure.
In recent years, various monitoring methods have been applied to road surfaces, and various sensors have been developed, such as strain, stress, temperature, humidity, and deflection sensors, as well as systems for detecting damage to the road surface [1,2,3]. A study [4] developed a non-contact camera-based measurement system to predict pavement failure; another [5] developed a three-dimensional deformation control sensor that can be installed in asphalt pavements; in [6], X-ray computed tomography was used to measure damage to asphalt material; and in [7], a long-period fiber grating sensor for asphalt pavement pressure measurement was developed. The most proven technology is the fiber sensor based on Bragg fiber gratings (FBGs) [8]. Fiber sensors with FBG technology provide more accurate real-time mechanical damage detection in pavement monitoring and have advantages over other measuring systems. In [9,10], a study was conducted to check the deformation of a pavement depending on the coating layer, that is, sensors based on FBGs were installed in the pavement section. In addition, depending on the load, the peak value of the reaction to dynamic deformation was measured. Moreover, this was found to be the best solution for monitoring the reaction of a road surface, and the best procedures for applying sensors on a road surface were presented.
Fiber sensors based on an FBG are widely used tools for monitoring the integrity and malfunction of road surfaces. Several types of fiber sensors are used to monitor road surface condition data. Information about the deformation, temperature, and pressure of each pavement layer can be measured in real-time using a fiber sensor. Nowadays, in the design, maintenance, and planning of a road surface, fiber sensors are becoming more important tools. They are used on difficult and harsh road surfaces due to the effective properties of the sensors. In this paper, we provide a comprehensive overview of the use of fiber optic sensors based on FBGs of various structures and their applications for monitoring road infrastructure.
The grating size in fiber Bragg grating (FBG)-based fiber optic sensors plays a key role in their operation and measurement accuracy. The length of the FBG grille is 15 mm. The importance of the grating size can be considered from several perspectives. For instance, the grating size, determined by the period and length of the grating, directly affects the spectral characteristics of the sensor. It determines the center Bragg wavelength at which light reflection occurs as well as the bandwidth. This is important for tuning the sensor to specific wavelengths, allowing for an accurate measurement of parameters such as strain or temperature. In addition, in terms of sensitivity and resolution, the longer the grating, the higher the sensitivity of the sensor, as the interaction of light with the modified fiber section is increased. However, increasing the grating length can lead to a decrease in spectral resolution, so a balance must be found between the grating length and the required resolution. Measurement stability: The grating size also affects the stability of the sensor. Longer gratings can be less sensitive to external influences such as vibration or temperature changes, which provides more stable and reliable measurements under different conditions. Spatial resolution: In the case of variable-period gratings (so-called “chirped” gratings), varying the period along the length of the grating can compensate for dispersion in optical systems and extend the range of measurable parameters such as temperature or strain.
Multichannel measurements: With a reduction in the grating period, it is possible to create multichannel sensing systems where multiple gratings can be recorded on a single fiber, allowing simultaneous measurements at multiple points. With the help of well-known fiber optic sensors with Bragg gratings, various measurements of physical parameters can be performed. For example, this type of sensor can be used for strain measurement [11], temperature [12,13], pressure [14], electric and magnetic fields, acceleration, tilt angle, vibration [15], humidity [16], viscosity [17], material defects [18], the refractive index, and its distribution [19]. For the simultaneous measurement of two physical quantities on the basis of fiber Bragg gratings, constant and variable-period gratings as well as tilted gratings are often used. Bragg grating sensors have several advantages over other types of sensors. The most important advantages include the frequent nature of the output signal, ability to measure strain, small size and weight, point measurement of physical quantities (the sensitive part can have length from several to several tens of millimeters, resistance to electromagnetic interference, and no possibility of self-ignition—therefore, they can be used near sources in explosive environments), the fact that distance has very little effect on the signal reflected from the fiber Bragg grating, and that up to 100 gratings can be recorded on a single fiber if appropriate measurement systems are used [20,21,22].
The temperature sensitivity of fiber Bragg grating (FBG)-based fiber sensors plays a key role in their application for various monitoring systems. Fiber Bragg gratings (FBGs) exhibit a high sensitivity to temperature. They work on the basis of reflecting a specific wavelength of light that varies with temperature. This wavelength change is very accurately measured, making FBG-based fiber sensors ideal for high-precision temperature measurements with a resolution in the order of 0.1 °C or even lower. They can measure temperatures ranging from −200 °C to +300 °C and beyond, with the ability to extend this range through the use of specialized materials.
Here, they are compared with other alternative technologies:
  • Thermocouples: Thermocouples are sensors that utilize the potential difference that occurs at the junction of two different metals when the temperature changes. Thermocouples can measure temperature extremes of 2000 °C or higher. However, their accuracy and sensitivity are much lower than FBG-based fiber sensors. Thermocouples are also susceptible to electrical interference and require frequent calibration.
  • Resistive thermometers (RTDs): RTDs, or resistive thermometers, measure temperature based on the change in resistance of the metal as the temperature changes. They provide a high accuracy over a range of −200 °C to +850 °C, but their sensitivity and stability can decrease over time. RTDs also require electrical connections, which can limit their use in extreme environments.
  • Infrared sensors: Infrared sensors measure temperature by the radiant heat energy of an object. They are suitable for non-contact monitoring and can operate over a wide temperature range, but their accuracy depends on the emissivity of the surface, and they may be ineffective in the presence of dust, smoke, or other interference.
  • Temperature-compensated electrical strain gauges: Strain gauges measure mechanical strain, but their accuracy can be compromised by changes in temperature. Complex circuitry and calibration are required to compensate for temperature effects, but even with temperature compensation, these sensors can be less accurate than FBG-based fiber sensors.
This work could form the basis for future research. It is important to consider several key areas of development that may be useful for further in-depth study of the topic presented in this article [23]. The work on fractional thermal transport calculations in nanofibers has great potential for future research and could form the basis for the development of new theoretical and applied approaches in the field of heat transfer in nanomaterials. Ref. [24] discusses the effect of adhesion between a fiber Bragg grating-based fiber sensor and the measured structure on the sensitivity of the sensor. An adhesive with a high shear strength contributes to the sensitivity of the sensor. Experimentally, the use of different adhesives with different adhesion characteristics was found to affect the sensitivity, repeatability, and hysteresis errors of the sensor, showing that proper adhesive selection is important to achieve a high measurement accuracy.

2. Materials and Methods

One of the biggest advantages of using FBG-based fiber optic sensors in road infrastructure is the ability to use a single sensor that performs continuous measurement along its entire length instead of a very large number of point sensors. An FBG is a microstructure a few millimeters long created by modifying a standard germanium single-mode telecommunication fiber using an ultraviolet laser. This microstructure causes a periodic change in the refractive index of the optical fiber. When light passes through the fiber, the Bragg grating reflects a very narrow range of wavelengths, and all other wavelengths pass through the grating. The center of this range of reflected wavelengths is called the Bragg wavelength. The FBG period increases when the optical fiber is physically stretched or compressed, causing a shift in the Bragg wavelength, which is then detected and recorded by the data acquisition system [9,10].
The experimental studies were carried out in the Laboratory of Optoelectronics and Laser Engineering of Lublin University of Technology. The system consists of an optical spectrum analyzer, a superluminescent diode, fiber Bragg gratings, a personal computer, a fixed support, a movable support, and a measuring system. A THORLABS S5FC1550S–A2 SLED diode served as a light source for the periodic sensors. The spectra were measured using a YOKOGAWA AQ6370D optical spectrum analyzer. The following programs were used to perform the research and modeling within the framework of the work: MATLAB R2022b was used to create numerical models of fiber optic sensors based on Bragg gratings (FBGs). The program allowed for computer modeling of various sensor parameters, such as the grating length, refractive index, Bragg length, and apodization profile. Using MATLAB R2022b, the spectral characteristics of the gratings were obtained at different temperatures. The spectrum analyzer was used to measure the spectral characteristics of fiber optic sensors based on Bragg gratings. This program was important for assessing the change in Bragg wavelength with temperature and deformation. These programs and tools allowed for obtaining the high-precision data necessary for studying the characteristics of fiber optic sensors under conditions close to real ones.
Figure 1 shows an example of asphalt pavement installation, with Figure 1a presenting the developed FBG-based sensor, and Figure 1b,c showing the installation of an FBG into the finished asphalt base layer. The method includes embedding FBG sensors in a finished asphalt base layer that serves as the base layer of a road. The asphalt base layer is prepared and compacted to the required specifications. FBG sensors are strategically placed within the asphalt layer. The sensors must be precisely positioned to ensure that the desired parameters are measured. The sensors are carefully incorporated into the asphalt mix. This may involve creating grooves or slots in the asphalt where the sensors can be securely placed. Once the sensors are installed, the asphalt is compacted and sealed, ensuring that the sensors are securely in place and protected from external damage. An additional layer of asphalt can be applied on top to complete the pavement, providing additional protection and integration of the sensors. Figure 1d,e show the process of installing FBGs into a previously constructed asphalt layer. This method involves installing FBG sensors into an existing asphalt pavement that has already been constructed. The existing asphalt surface is cleaned and prepared to ensure proper adhesion and installation of the sensors. Grooves or channels are cut into the existing asphalt layer to accommodate the FBG sensors. These grooves must be precise to ensure a proper placement of the sensors. The FBG sensors are placed in the pre-cut grooves. Care must be taken to ensure that the sensors are properly positioned to measure the specified parameters. The grooves in which the sensors are placed are filled with an appropriate sealing material such as bituminous mastic or other compatible compound. This ensures that the sensors are securely mounted and protected from traffic loads and environmental conditions. The surface is then treated to ensure the road is smooth and level while maintaining the integrity and functionality of the sensors embedded in the asphalt. Both methods focus on integrating FBG sensors into asphalt layers for monitoring purposes, but the approach differs depending on whether the installation occurs during the construction of the asphalt layer or within an already constructed layer.
The working principle of a fiber-sensor-based FBG is shown in Figure 2. The figure shows the grating structure, refractive index profile, and spectra of the corresponding signals at the input, at the output, and reflected from the grating.
An FBG can act as a reflector with a certain wavelength that reflects a certain wavelength of light and allows all others to pass. The Bragg wavelength λB is given by (1):
λB = 2neff·Λ,
where λB is the average wavelength of the input light that will be reflected back from the fiber optic Bragg grating, neff is the main refractive index, and Λ is the grating period.
For light with a wavelength equal to λB, all back-reflected partial waves are in phase with each other and interfere constructively. The reflection of light with a Bragg wavelength from the FBG can reach 100%, while light with a different wavelength can pass through virtually lossless. This is achieved by creating a periodic change in refractive index in the fiber core, which forms a dielectric mirror that reflects certain wavelengths.
Because of the growing interest in FBGs, many varieties of them have appeared on the market. The structure of FBGs varies depending on the refractive index (RI) or grating period values. The lattice period can be constant or variable and can be localized or distributed in the superstructure. The refractive index has two main characteristics: refractive index profile and displacement. Depending on the type of grating, FBGs can be uniform, long-period, alternating, apodized, tilted, and with periodic perturbation of the refractive index within the optical fiber core.
Let us consider these structures in more detail. The simplest type of grating is a homogeneous grating with a constant period and amplitude of RI modulation along its length. These types of fiber gratings, in which the phase surfaces are perpendicular to the fiber and the refractive index changes in the core have a fixed period, are the basic element of most Bragg gratings. There are typically three types of uniform gratings: FBGs, long-period fiber gratings (LPFGs), and tilted fiber gratings (TFBGs). The FBG frequency is typically around 100 nm and the refractive index modulation depth is around 10-5 to 10-3. The bandwidth depends on several parameters, particularly the grating length, but is typically around 0.05 nm to 0.3 nm for most sensor applications. Such gratings are used as narrowband filters in multiplexers and demultiplexers [25], as well as mirrors of fiber [26] and semiconductor lasers [27], and fiber-optic sensors [28].
The LPG spectral characteristics depend on parameters such as temperature, fiber tension, and bending, as well as on the properties of the medium surrounding the fiber with the grating. Long-period gratings contain a set of grating components ΔL in length and sections separating them without refractive index modulation with length δ1, the so-called “dead zones” (Figure 3). It should be noted that the lengths of the grating components and the lengths of the “dead zones” can vary. The spectrum of light reflected from such a structure has several narrow peaks. The main difference between LPGs and Bragg gratings is the period of change in the refractive index in the fiber optical. For Bragg gratings, the period value is of the same order as the wavelength, while for LPGs, the period value is several hundred micrometers. Due to this physical feature, LPGs are characterized by an ease of manufacture, as well as higher resistance to external influences, in particular high temperatures (over 300 °C) and ionizing cures.
Long-period fiber gratings have many important applications in various fiber optic devices such as physical sensors [29,30,31,32] and spectral-selective absorbing filters [33], including tunable [34], optical radiation modulators [35] and others. One of the significant applications of long-period gratings in telecommunication systems is smoothing of the gain spectrum of fiber amplifiers used in systems with spectral channel compaction, as well as luminescence spectra of broadband sources. The main advantages of this method are the ease of fabrication and use of gratings, wide spectral range and high gain after smoothing, low loss at the pump wavelength, and absence of a reflected wave.
Figure 3. Schematic diagram of long-period gratings [36].
Inventions 09 00100 g003
When considering the above advantages and investigating the temperature dependence of the transmission spectrum, LPFGs can be used as temperature, stress, and strain sensors. This involves a structure in which the Bragg grating plane is not perpendicular to the fiber axis but forms an angle, typically 45°. The schematic structure of an inclined grating is shown in Figure 4.
TFBGs are a special type of grating in which the change in refractive index in the fiber core occurs at an angle to the fiber axis. The purpose of this angle is to couple the light of the main mode with higher-order envelope modes and to break the cylindrical symmetry of the coupling process with respect to the polarization state of the guided light.
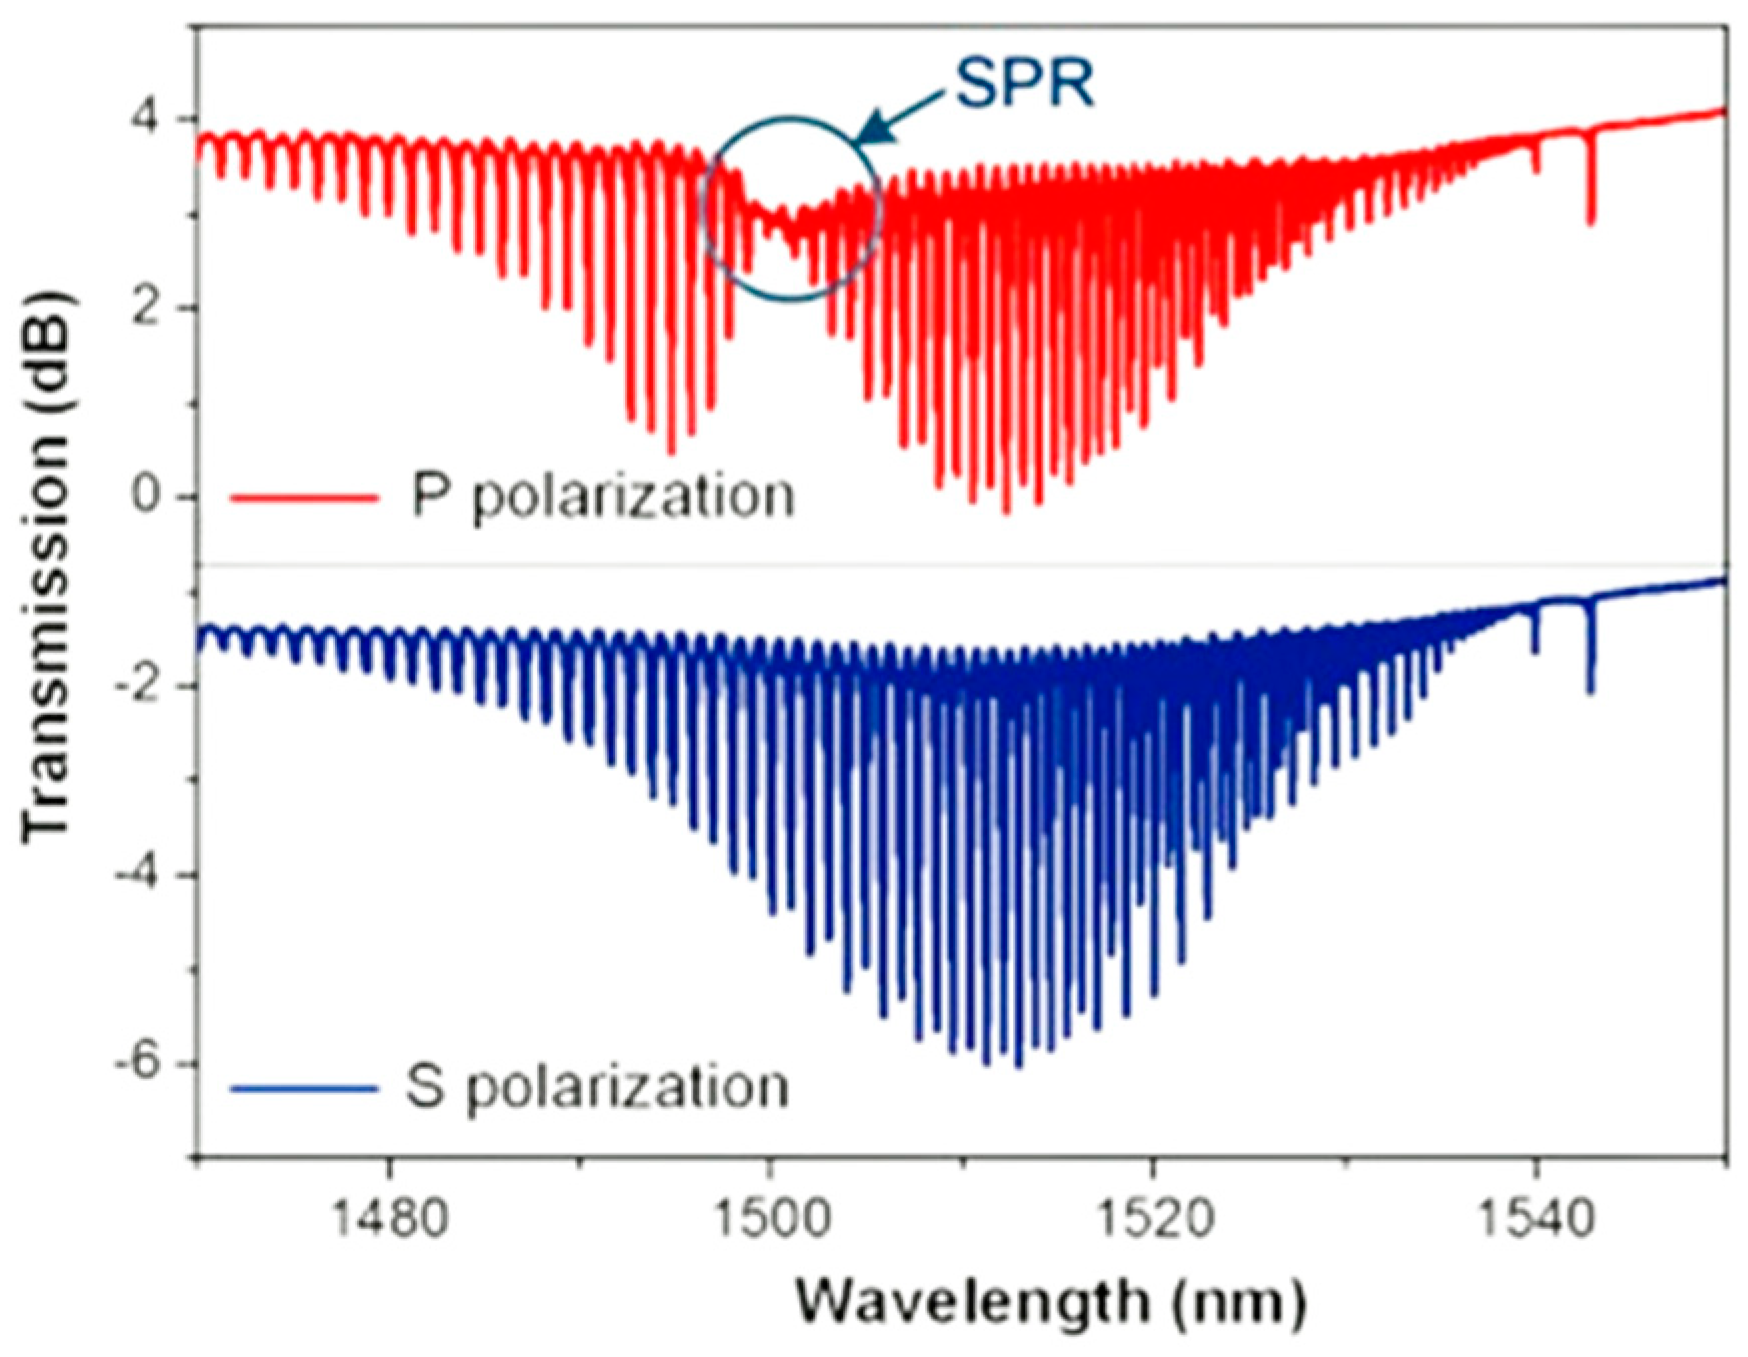
Consequently, TFBGs can easily excite higher-order shell modes, improving the interaction between light and the fiber environment. A TFBG has a number of advantages: its properties have been widely studied; the technology of recording Bragg gratings with high parameters has been developed; relative mechanical strength; small size; simplicity of design; ease of use; sensitivity to changes in the refractive index of the external environment; and absence of influence of the composition of the medium [37]. Increasing the sensitivity of TFBGs for measuring low concentrations is possible by applying a metal coating to excite surface plasma resonance (SPR); thus, the ambient refractive index can be accurately detected by measuring changes in the transmitted TFBG spectra. Figure 5 shows the TFBG transmission spectrum.
Figure 5 shows the TFBG wavelength response obtained by extracting the wavelength shifts of the most attenuated resonance in the spectrum. The TFBG sensor operates in the usual 1550 nm communication wavelength range, so the advantages of modern and inexpensive fiber optic devices can be used to demodulate the sensor. Figure 6 shows the transmission and reflection characteristics of a long-period grating consisting of eleven 0.182 mm long grids separated by a 1555 mm interval [34].
Apodized FBGs: One of the main problems associated with Bragg gratings is the appearance of so-called side lobes in the spectrum. To eliminate this phenomenon, an apodization technique is used. This means that the amplitude of the refractive index changes is modulated so that it gradually increases and decreases according to the function used. Apodized FBG are designed to eliminate side lobes from the reflection spectrum in order to measure sensitivity to physical parameters including temperature, strain, and pressure. The apodized FBGs provide maximum reflectivity, minimum side lobe power loss, and a narrow spectral response. The effect of the proposed apodization function is compared with several other apodization profiles to eliminate side lobes from the FBG spectrum. The sensitivity of the measured value is evaluated by analyzing the changes in Bragg wavelength, which is sensitive to physical parameters.
Due to imperfect changes in the refractive index and reflection of light from the end of a fiber optic fiber, side lobes distort the characteristics of homogeneous Bragg gratings. To effectively utilize Bragg gratings, this phenomenon must be eliminated. One of the most effective ways to eliminate sidebands from spectral characteristics is to use apodization [39]. This involves controlling the refractive index changes at the beginning and end of the Bragg gratings. Apodized Bragg gratings are widely used in telecommunication and sensor technologies such as spectroanalyzers [40], chromatic dispersion compensators where apodization has a positive effect on ripples in the group delay characteristic [41,42], and linear edge filters [43].
In the case of apodized Bragg gratings, the amplitude increases and decreases gradually. The method of modulating the amplitude and hence its rate of rise and fall along the fiber axis depends on the apodization function used. The apodization function is a powerful methodology that reduces the FBG side lobes. Each type of apodization profile has a unique impact. For apodization, this is described by a constant function:
g z = 1
There are the following apodization functions or apodization profiles and their formulas:
  • Gauss function g z = e x p a z L 2 L 2 ;
  • Raised sine function (Raised sine) g z = s i n 2 π z L ;
  • Sine function (Sinc) g z = s i n c X 2 z L / 2 L Y ;
  • Tangent function (Tanh) g z = 1 + t a n h   T 1 2 z L g α ;
  • Blackman function g z = 0.42 + 0.5 c o s   π z a + 2 25 c o s   2 π z a ;
  • Hamming function g z = 1 + H c o s   2 λ z l 1 + H ;
  • Cosine function (Cosine) g z = c o s A π L g z ;
  • Cauchy function (Cauchy) z = 1 2 z L g 2 1 2 B z L g 2 .
The parameter a is used to control the shape of the apodization profile, z is the axis along which the gratings are located, and L is the length of the gratings. The most commonly used apodization functions are the Gauss function, the sine function, the Blackman function, and the cosine function. A graph of the normalized refractive index of apodized gratings with a length of 5 cm is shown in Figure 7.
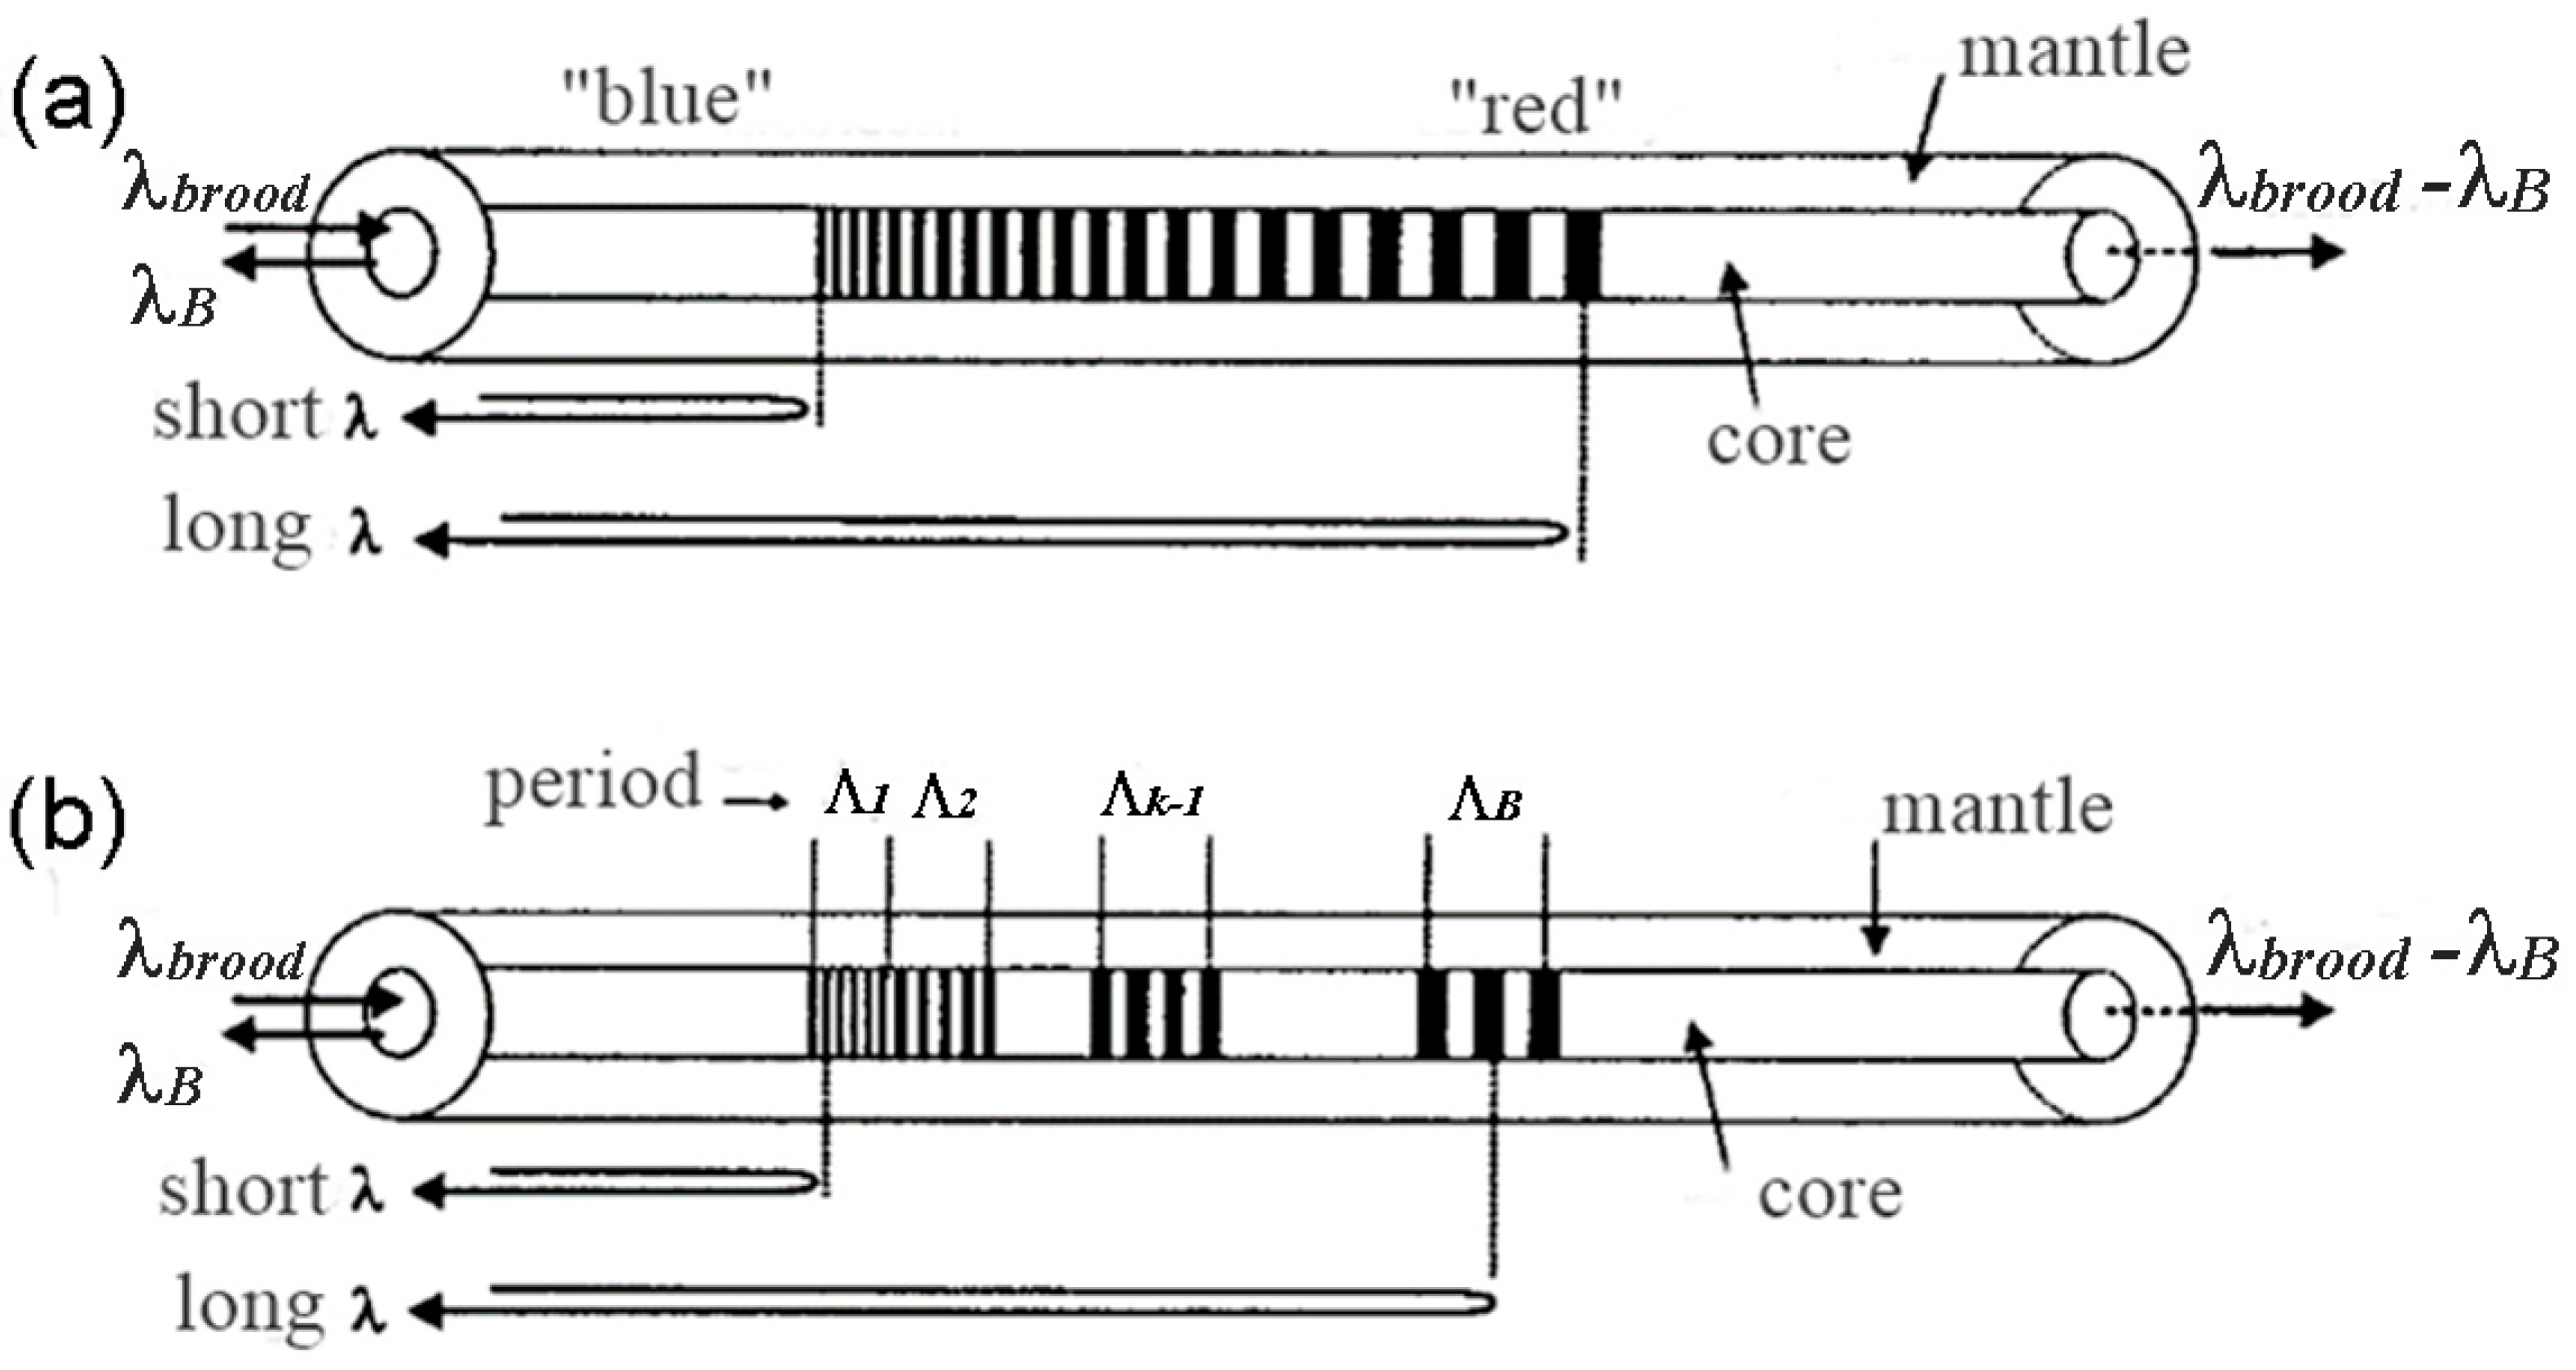
Chirped gratings: Lattices whose period varies with the position along the fiber are called chirped lattices. The period can vary in various ways: for example, symmetrically (increasing or decreasing) to a point half the length of the grating. Alternatively, it can vary linearly with the grating length or take a quadratic form. Another embodiment is to vary the average effective refractive index along the grating length, which may be achieved by changing the amplitude of the modulation refractive index profile or by narrowing the fiber in the region of the grating length. Different wavelengths are reflected from different regions of the grating with different periods: long wavelengths are reflected from the region with a long period, while short wavelengths travel a longer path and are reflected from the region with a short period. As a result, despite the different velocities of the long and short waves, as well as the distances they travel, their arrival time at their destination is the same.
Due to their characteristics, chirped gratings can be used mainly in the field of telecommunications, where they are used for dispersion compensation to compress pulses broadened during propagation. Broadband chirped gratings can also be used to suppress the unabsorbed pumping in an erbium amplifier and equalize its spectrum. High-quality gratings with lengths of more than 1 m have already been obtained [44]. The achieved dispersion value in period-variable gratings of more than 1000 ps/nm [45] can compensate for the dispersion of a 100 km section of a standard fiber optic line at a wavelength of 1.55 microns. The scheme of the grating is shown in Figure 8.
It can be seen from Figure 9 that the sensor does not suffer from cross-sensitivity to temperature. TFBG sensors can be used in fiber optic sensors to measure temperature, deformation, bending, refractive index, vibration, etc. [38]. In the diagram, you can see that different wavelengths are reflected in different places on the grid. This means that the Bragg wavelength is a linear function of position. In this case, the long waves must propagate further along the fiber of the optical fiber before the gratings begin to affect them. After reflection, longer waves are delayed relative to shorter ones, which makes it possible to effectively use these gratings to compensate for dispersion. The spectrum of the beam reflected by the Bragg gratings with a chirp has a shape close to a rectangle, as shown in Figure 10. The band of this spectrum is proportional to the length of the gratings and the coefficient of variation of the period along the length of the gratings.
The temperature sensitivity of chirped Bragg gratings is determined by changes in the refractive index in the core and the chirped period. These values depend on temperature and strain. This dependence underlies the use of chirped Bragg gratings as temperature and strain sensors.
Other types of gratings. Superimposed multiple gratings and superstructured fiber Bragg gratings: Superimposed multiple gratings refer to multiple Bragg gratings located at the same location on an optical fiber. This device is of interest for fiber communications, lasers, and sensor systems because multiple Bragg gratings at the same location act as a comb, which is ideal for multiplexing and demultiplexing signals.
Once multiple Bragg gratings are superimposed on an optical fiber at the same location, the reflectivity of the individual gratings decreases and the wavelengths of the Bragg gratings change due to the change in the effective index of refraction.
A superstructure fiber Bragg grating is a fiber grating structure created with adjustable exposure along the grating length. Thus, the superstructure with a Bragg grating has a periodically varying refractive index modulation envelope. The reflection spectrum of such superstructured gratings has a number of regularly spaced peaks, which provides additional degrees of freedom that can be utilized in the design of grating-based devices. These superstructured gratings can be used as comb filters for signal processing as well as for increasing the reflector tuning of a fiber laser array. There are many other types of gratings for various applications, such as writing gratings into multimode fibers, into birefringent fibers, at the junction of two different fibers, etc. It is difficult to enumerate all fiber gratings, but the operating principles of different types of gratings are similar.
FBG-based fiber sensors for pavement monitoring measure pavement characteristics such as stress, strain, deflection, and temperature. An FBG is a diagnostic tool to accurately and efficiently monitor the in situ behavior of a structure. Sensors used for pavement monitoring must be compatible with the heterogeneous nature and mechanical properties of pavement materials. They must meet the following requirements:
  • The sensors should be as small as possible to minimize interference with the pavement layers.
  • For strain measurement, the stiffness of the sensors should match the stiffness of the pavement mix to properly evaluate the mechanical properties of the pavement.
  • The sensors should be able to withstand the maximum loads experienced during pavement construction, such as temperature and compression.
  • For long-term pavement monitoring, the sensors should be resistant to corrosion and thermo-mechanical conditions.
Most fiber optic sensors used in monitoring systems are sensitive to both strain and temperature, resulting in undesirable cross-sensitivity between the two parameters. Bragg gratings (FBGs) are sensitive to both strain and temperature. This allows FBGs to be used for temperature monitoring, but it is recommended to combine a temperature sensor with a strain sensor to compensate for the effect of temperature on the strain sensor. In addition to strain and temperature, FBG-based sensors can be used in transducers to monitor various other parameters such as tilt, acceleration, pressure, and others.
The sheath-to-core fiber coupling mode is used to distinguish between temperature and strain parameters. FBG sensors can also be used and operated effectively in harsh environments such as high temperature or humidity. Extreme operating conditions require sensors to withstand high temperatures (up to 160 °C), humidity, high compression force, repeated heavy loads, and high coverage. It should be noted that most traditional sensors for other civil structures cannot be used directly for pavement construction.
The currently existing fiber sensors based on FBGs have the following parameters: temperature range from −70 °C to 1000 °C with expansion no more than 0.3 °C; and deformation range from 1 to 10,000 µε. Next, we consider the realization of an FBG-based sensor for strain and temperature measurement. Two Bragg gratings (FBGs) with the same sensitivity can be used as a sensor for strain and temperature measurement. Elements with opposite directions of response to one type of quantity (e.g., strain) and simultaneously with the same directions of response to a second parameter (e.g., temperature) should be selected.
Methods of using fiber sensors based on FBGs for simultaneous determination of deformation and temperature have been developed and investigated, such as the use of two superimposed FBGs [46,47], two solvable wavelengths in an inclined FBG [48], two FBGs recorded with fibers of different diameters [49] or compositions [50], and one FBG recorded in fibers of different diameters [51] or compositions [52], and through the junction point between fibers with different refractive indexes [53] or between fibers with different contents of alloying elements [54]. Alternatively, FBG measurement can be combined with other measurement methods, such as the use of hybrid FBG/fiber gratings with a long period of action (LPGs) [55], and FBGs with an add-on [56].

3. Results

3.1. Characteristics of the Bragg Grid with Respect to Temperature Fluctuations and Strain

FBG optical spectra have good linear characteristics with respect to temperature fluctuations and deformation. Linearity of functions is of great importance when using gratings as temperature sensors. In this regard, fiber sensors based on FBGs make it possible to measure both values simultaneously using the sensitivity of two FBGs to temperature and deformation. For this purpose, gratings are used, in which the sensitivity to temperature changes is much greater, while the sensitivity to deformation is much lower than that of a conventional FBG.
The Bragg wavelength can be shifted due to temperature changes ∆T and mechanical deformation ε in the optical fiber as follows [56,57]:
λ B λ B = k ε ε + k T Δ T
k ε = 1 1 2 n 0 2 1 υ f p 12 υ f p 11
k T = 1 1 2 n 0 2 p 11 2 p 12 α f + ξ n 0
where k ε and k T represent the deformation coefficient and the temperature coefficient of the sensor FBG, respectively [58], n 0 , υ f , α f , and ξ are the refractive index, Poisson’s ratio, thermal expansion coefficient, and thermo–optical coefficient, respectively, and p 11 and p 12 denote the Pockel constants. The principle of sensitivity of the fiber sensor is based on FBGs and on the displacement of the Bragg wavelength, as shown in Equation (3), used to measure mechanical deformation and temperature.
For a shift in the Bragg wavelength due to a change in temperature, the Bragg wavelength shift can be determined by substituting the temperature change ∆T into Equation (2):
Δ λ Β = k T Δ T λ Β = 1 1 2 n 0 2 p 11 2 p 12 α f + ξ n 0 Δ T λ Β
The shift in the Bragg wavelength caused by a change in temperature can be explained by a change in temperature ∆T and thermal deformation εT due to a mismatch in thermal expansion between the optical fiber and the main structure. The thermal deformation obtained by Her and Huang [58] is accepted and presented as follows:
ε T = ( α h α f ) Δ T E f π r f 2 2 h r p E h + 1 E f 1 c o s h ( λ 1 x ) cosh ( λ 1 L f ) + α f Δ T
where α, r, E, and G represent the coefficient of thermal expansion, radius, Young’s modulus, and shear modulus, respectively; and the indices h, f, p, and α denote the basic structure of the optical fiber.
A shift in the Bragg wavelength due to a change in temperature ∆T can be obtained by replacing the thermal deformation εT, as shown in Equation (5), and a change in temperature T in Equation (3) is obtained:
Δ λ B = k ε ε T + k T Δ T λ B
Bragg wavelength shift due to mechanical stress: For a sensor based on FBGs, the voltage transmitted to the optical fiber depends on the characteristics of the connection, the protective coating of the fiber, and the length of the connection. The mechanical load transmitted to the FBG sensor, obtained by Her and Huang [58], is accepted and presented as follows:
ε M = ε 0 E f π r f 2 2 h r p E h + 1 E f 1 c o s h ( λ 1 x ) cosh ( λ 1 L f )
where ε0 is the mechanical deformation.
The Bragg wavelength shift can be determined by substituting the mechanical deformation Equation (7) into Equation (3), which leads to
Δ λ B = k ε ε M λ B
The Bragg wavelength shift due to temperature changes and mechanical deformation can be obtained by summing Equations (6) and (8) as follows:
Δ λ B = k ε ε T + k T Δ T λ B + k ε ε M λ B
Based on the change in the grating parameters, temperature and deformation can be determined simultaneously. The results of wavelength measurements depending on deformation and temperature are discussed below Table 1. Experimental studies were conducted in the laboratories of Optoelectronics of the Faculty of Electrical Engineering and Computer Science of Lublin Technical University.

3.2. Model of Fiber Temperature Sensor Based on in MATLAB R2022b Environment

To conduct simulation studies, it is necessary to write this model using the programming syntax of the MATLAB R2022b environment. The model should include the following parameters:
  • Length of the grating;
  • Refractive index neff;
  • Number of grid periods;
  • Bragg wavelength;
  • Apodization profile;
  • Average value of the refractive index modulation;
  • Amplitude of the refractive index modulation;
  • Grid period;
  • Refractive index of the core in a fiber without a grating.
Thanks to the model implemented in this way in the MATLAB R2022b development environment, after entering the input values of the grating, it was possible to obtain spectral characteristics for various preset temperature values, examples of which are given below. It should be emphasized that by using the mathematical model implemented in this way, it is possible to model gratings with different parameters and in different configurations. Examples of simulated grating graphs in the MATLAB R2022b development environment are in the wavelength range from 1548 nm to 1556 nm. A numerical model created in MATLAB R2022b, which was used in computer modeling, is shown in Figure 11.
The temperature sensitivity of the Bragg grating is determined by the value of the effective refractive index in the core and the period, as shown in Figure 12. Both of these values strongly depend on deformation and temperature. This dependence underlies the use of Bragg gratings in measurement when measuring voltages and temperatures. Next, we will consider the laboratory tests performed, the measurement procedure, and the measurement results.
To identify the temperature dependence, a measuring stand was built, which allows us to study the characteristics of various temperature ranges.
The measuring stand consists of the following elements:
  • Light source;
  • Test probe;
  • Placed in a measuring probe;
  • Spectrum analyzer;
  • Measuring element used to measure temperature.
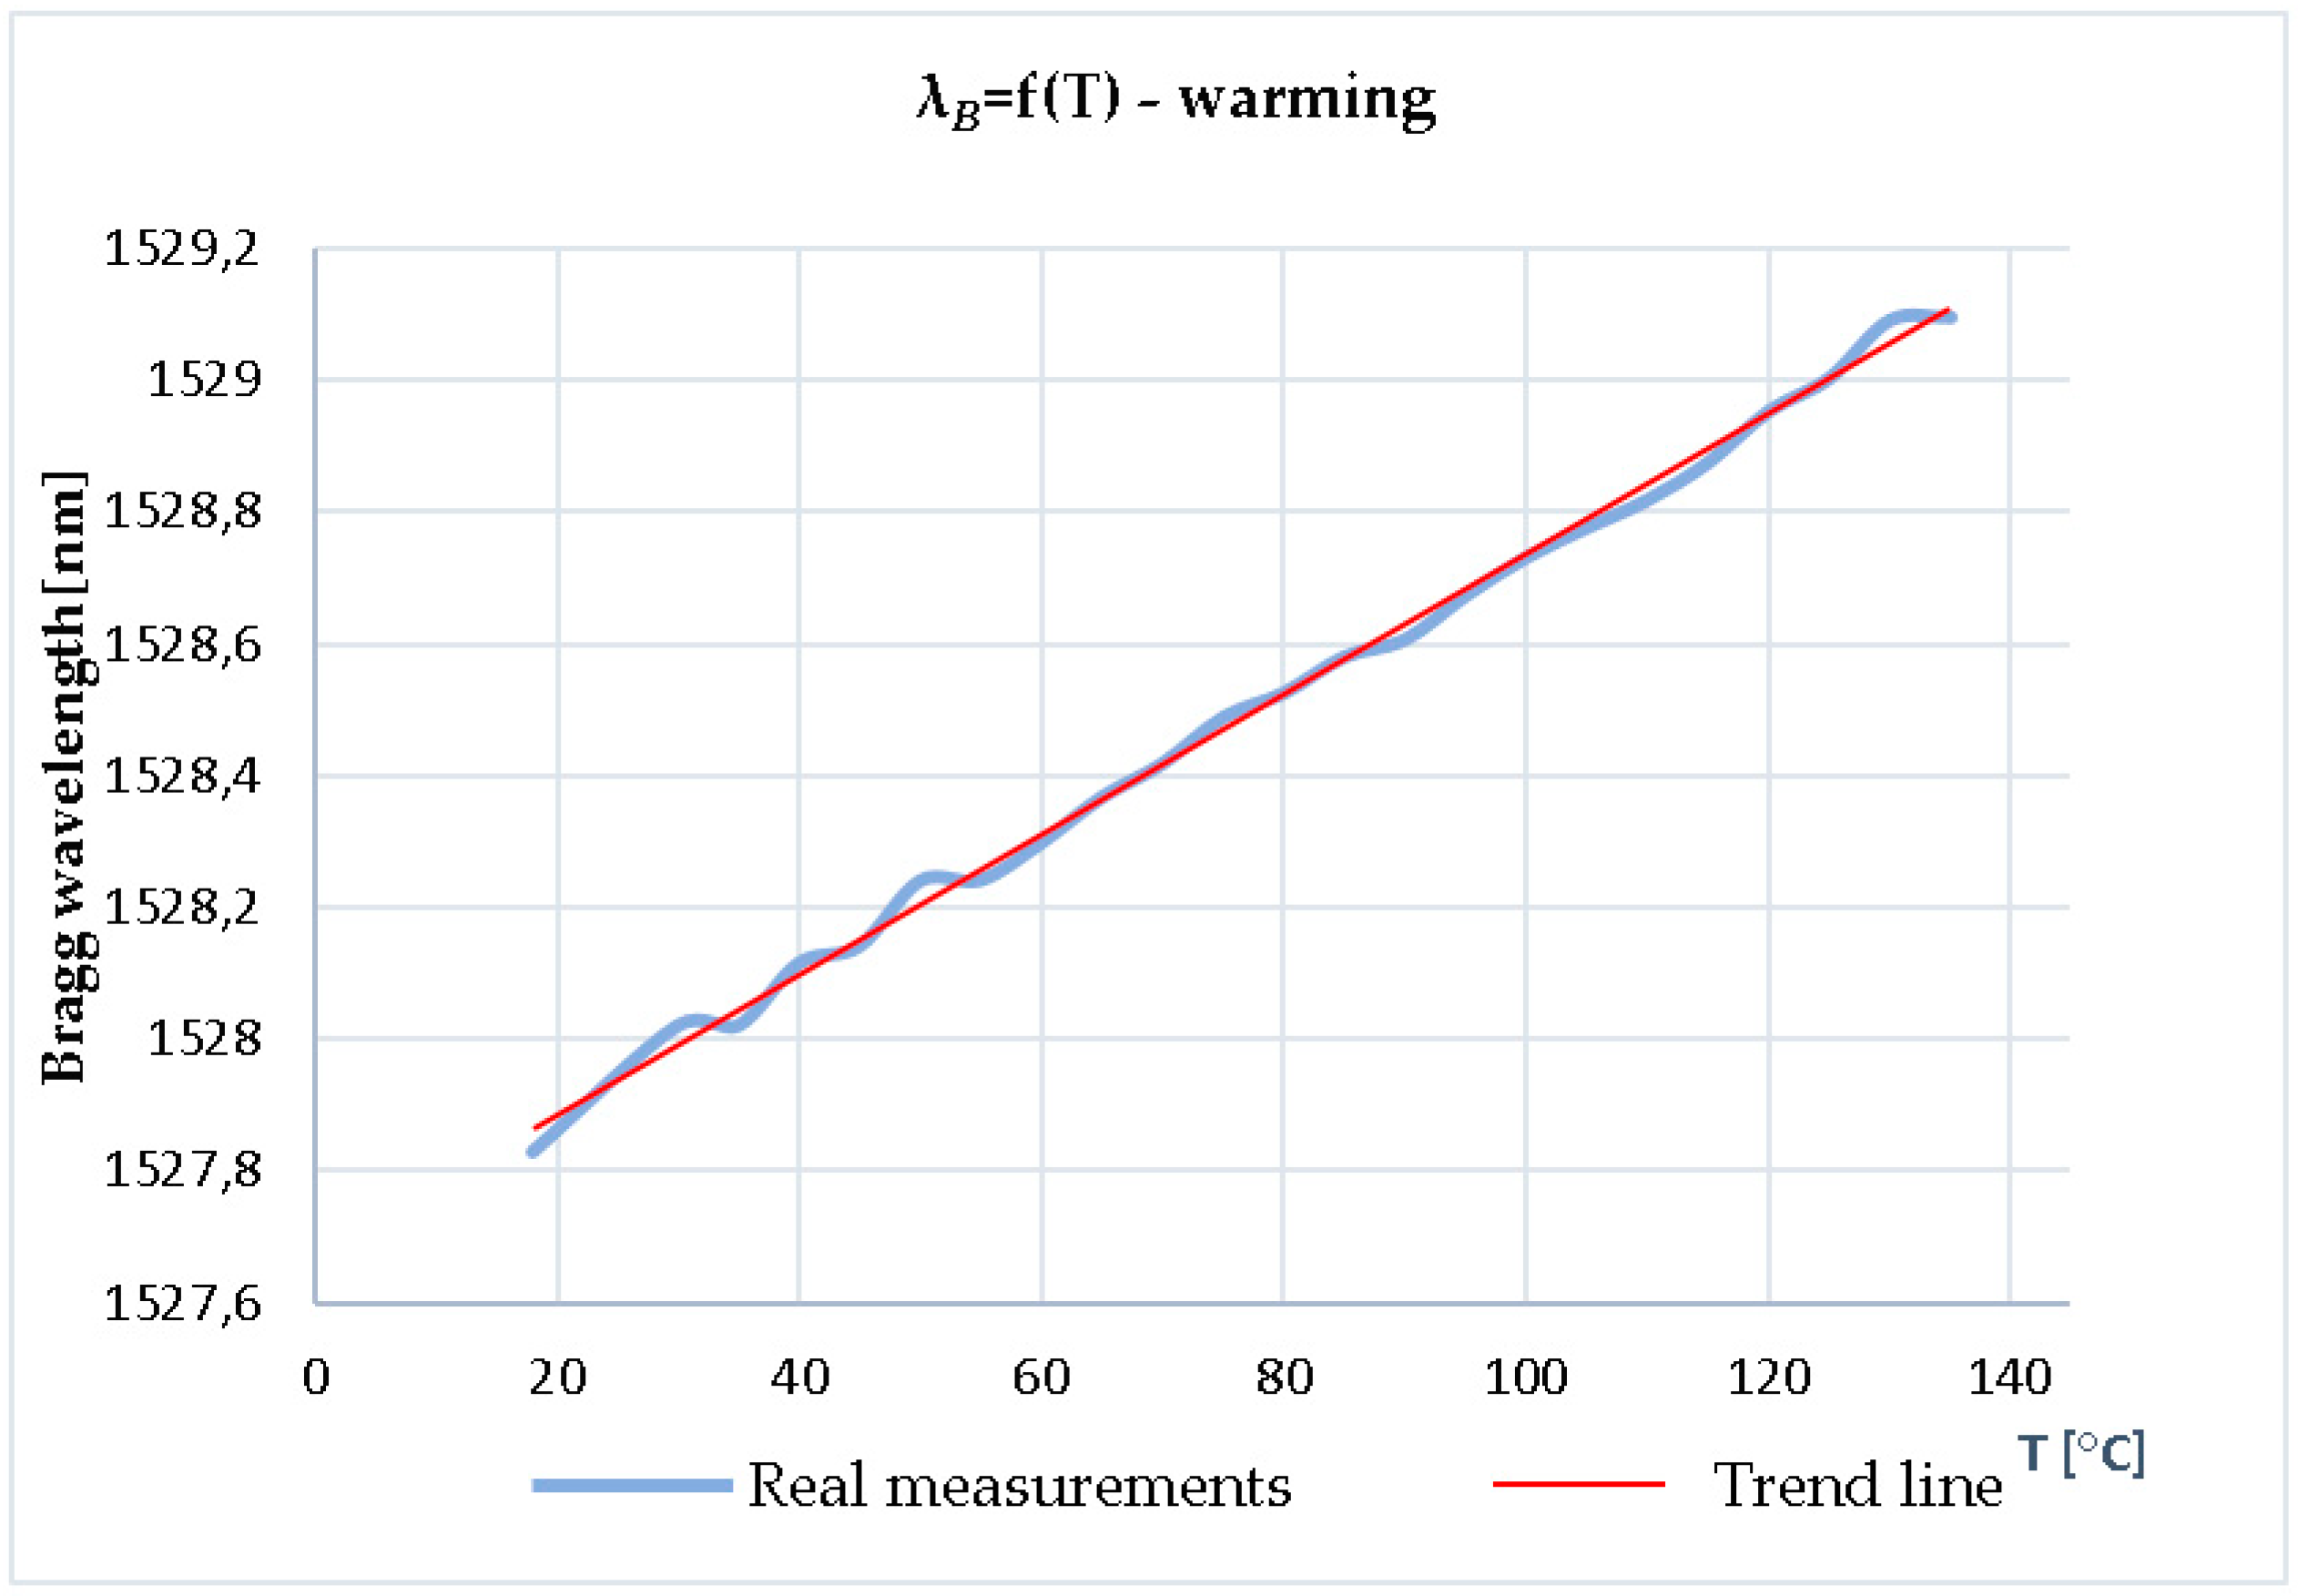
Figure 13 was determined based on spectral characteristics created for specific temperatures. It shows the dependence of the Bragg wavelength on the values of individual temperatures for which measurements were made. It can be seen from the graph that the linearity of the shift in the Bragg wavelength towards longer waves persists with an increasing temperature. Based on this preserved dependence, the temperature sensitivity of the investigated grating was determined. A trend line was laid along the graph containing real measurements, which proves the linearity of changes in the Bragg wavelength.
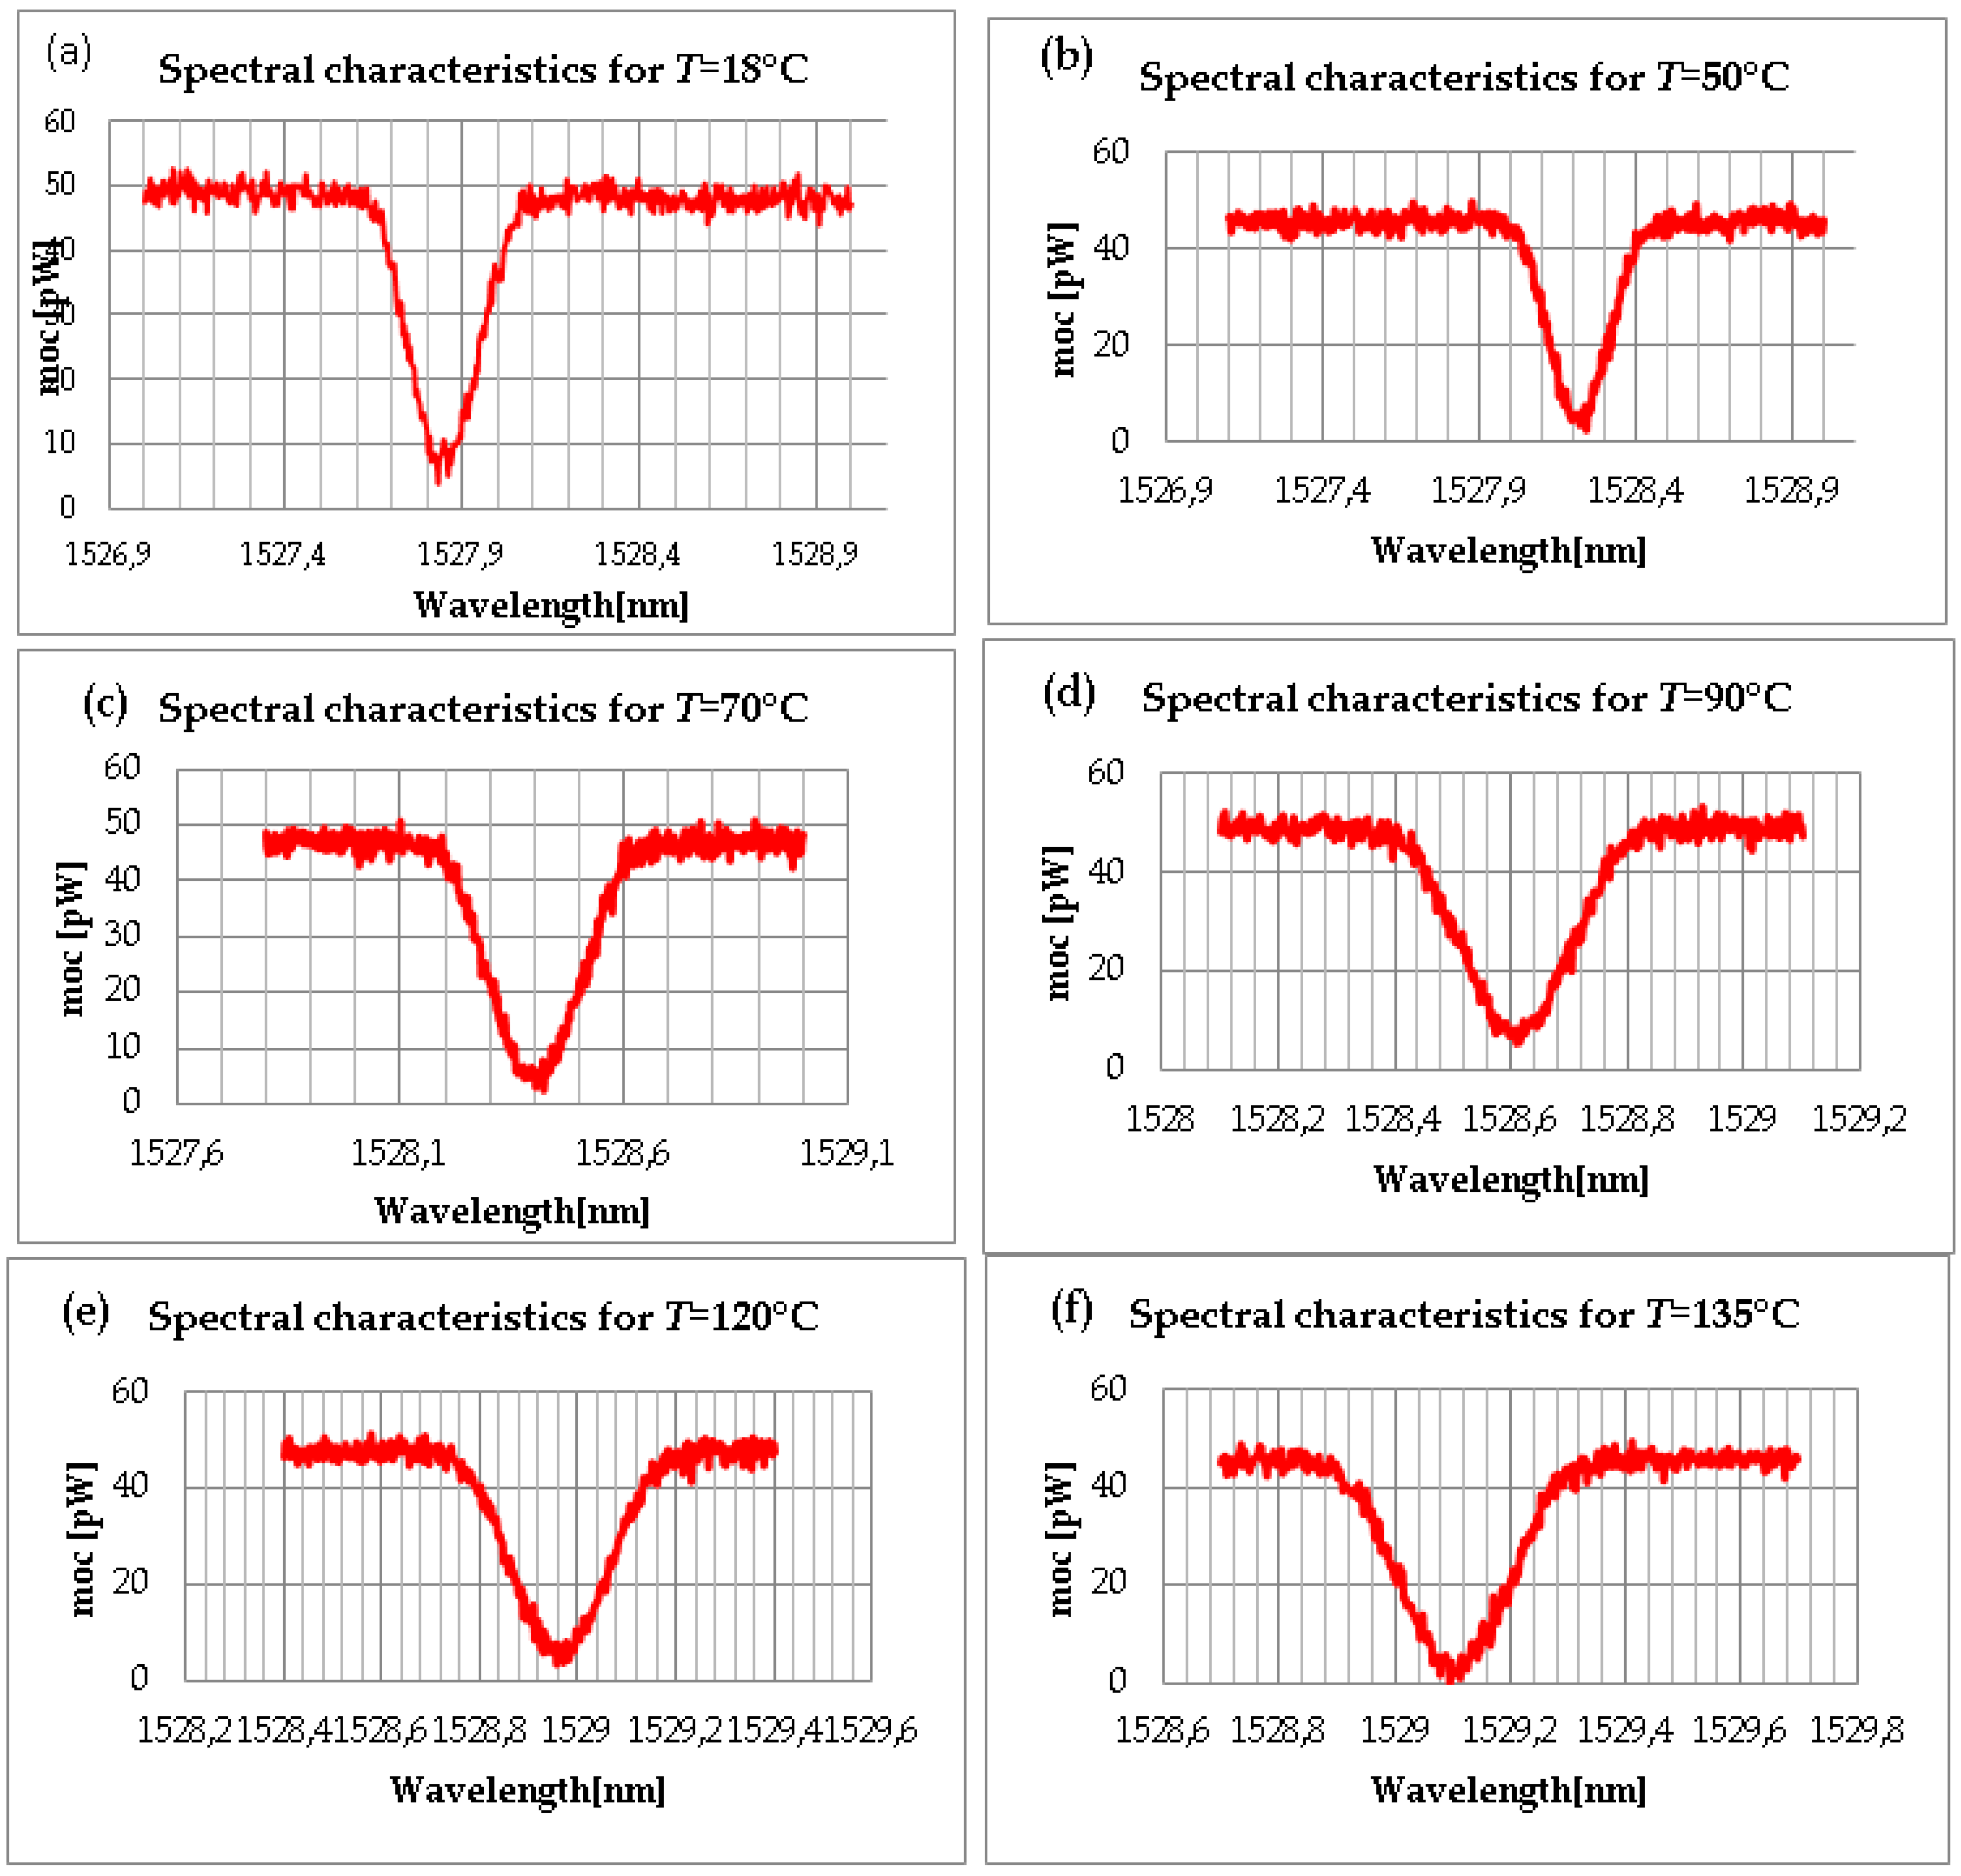
To calculate the power (vertical axis) in Figure 14, spectral analysis of the data obtained from a fiber optic Bragg grating (FBG) sensor was used. Power here is the intensity of reflected or transmitted light at different wavelengths, which is recorded by a spectrum analyzer. Changes in the intensity of reflected light are caused by deformation or temperature changes, which lead to a shift in the Bragg wavelength and, accordingly, a change in the power at these wavelengths. As for the depth of the sensor, it plays a significant role in obtaining the strain values. The deeper the sensor is located in the road surface, the less influence there is from surface changes such as temperature variations or vehicle impacts. In turn, sensors located closer to the surface can more accurately record changes caused by surface impacts, but they may also be more susceptible to external noise and damage. Therefore, the correct selection of the sensor installation depth is a critical factor for the accuracy of the strain measurements.
Figure 14 shows the results of measurements obtained during the experiment. The temperature changes from 18 °C to 135 °C. FBG optical spectra have good linear characteristics with respect to temperature fluctuations and deformation. The linearity of functions is of great importance when using gratings as temperature sensors. In this regard, sensors based on FBGs make it possible to measure both values simultaneously using the sensitivity of two FBGs to temperature and deformation. For this purpose, gratings are used, in which the sensitivity to temperature changes is much greater, while the sensitivity to deformation is much lower than that of a conventional FBG.

4. Conclusions

Research and numerical simulations of an FBG have demonstrated the high efficiency of this method for temperature measurement. During the experiments, it was found that the Bragg wavelength increases with an increasing temperature, and this dependence is linear. The average change in Bragg wavelength was 0.01075 nm/°C, indicating high temperature sensitivity KT. Using FBGs as temperature sensors has a number of advantages: a high-accuracy temperature sensitivity of 0.01075 nm/°C allows you to accurately measure small temperature changes. Tests have been carried out over a temperature range of +18 °C to +135 °C, covering many practical applications. A low strain sensitivity allows temperature measurements to be isolated from mechanical stress, which is important in a number of industrial and scientific applications. In addition, the use of FBG sensors allows for the simultaneous measurement of both temperature and strain, making them versatile for various applications. This is especially true in environments where it is necessary to monitor both parameters, for example, in the design of buildings, pipelines, aviation and space technology.

Author Contributions

Conceptualization, G.K. and A.K.; methodology, G.K., A.K. and G.S.; software, T.K.; validation, K.T. and Z.A.; formal analysis, T.K.; investigation, A.K.; resources, G.K. and A.K.; data curation, K.T.; writing—review and editing, Z.A. and G.S.; visualization, Z.A.; supervision, G.K.; project administration, A.K.; funding acquisition, G.K. All authors have read and agreed to the published version of the manuscript.

Funding

The work was supported by a grant of the project of the GF “Zhas Galym” № AP 14972921 “Research and development of a fiber sensor for monitoring the condition of road surfaces” and funding the Ministry of Science and Higher Education of the Republic of Kazakhstan.

Data Availability Statement

No new data were created or analyzed in this study. Data sharing is not applicable to this article.

Acknowledgments

The research was carried out within the framework of the project of the GF “Zhas Galym” № AP 14972921 “Research and development of a fiber sensor for monitoring the condition of road surfaces”.

Conflicts of Interest

The authors declare no conflicts of interest.

References

  1. Alavi, A.H.; Hasni, H.; Lajnef, N.; Chatti, K. Continuous health monitoring of pavement systems using smart sensing technology. Constr. Build. Mater. 2016, 114, 719–736. [Google Scholar] [CrossRef]
  2. Tan, Y.; Wang, H.; Ma, S.; Xu, H. Quality control of asphalt pavement compaction using fibre Bragg grating sensing technology. Constr. Build. Mater. 2013, 54, 53–59. [Google Scholar]
  3. Timm, D.H.; Priest, A.L.; McEwen, T.V. Design and Instrumentation of the Structural Pavement Experiment at the NCAT Test Track; National Center for Asphalt Technology, Auburn University: Auburn, AL, USA, 2004. [Google Scholar]
  4. Zou, Q.; Cao, Y.; Li, Q.; Mao, Q.; Wang, S. CrackTree: Automatic crack detection from pavement images. Pattern Recognit. Lett. 2012, 33, 227–238. [Google Scholar] [CrossRef]
  5. Zhou, Z.; Liu, W.; Huang, Y.; Wang, H.; Jianping, H.; Huang, M.; Jinping, O. Optical fiber Bragg grating sensor assembly for 3D strain monitoring and its case study in highway pavement. Mech. Syst. Signal Process. 2012, 28, 36–49. [Google Scholar] [CrossRef]
  6. Song, I.; Little, D.N.; Masad, E.A.; Lytton, R. Comprehensive evaluation of damage in asphalt mastics using X-ray CT; continuum mechanics and micromechanics. J. Assoc. Asph. Paving Technol. 2005, 74, 885–920. [Google Scholar]
  7. Liu, H.Y.; Liang, D.K.; Zeng, J. Long period fiber grating transverse load effect-based sensor for asphalt pavement pressure field measurements. Sens. Actuators A Phys. 2016, 168, 262–266. [Google Scholar] [CrossRef]
  8. Kashaganova, G.; Orazaliyeva, S.; Balbayev, G.; Alimseitova, Z.; Carbone, G. Application of Apodized s in Information Security Systems Mechanisms and Machine Science. In Proceedings of the I4SDG Workshop 2021: IFToMM for Sustainable Development Goals 1, Online, 25–26 November 2021; Springer International Publishing: Cham, Switzerland, 2022; Volume 108, pp. 451–460. [Google Scholar]
  9. Jian-Neng, W.; Jaw-Luen, T. Using Sensors to Monitor Pavement Structures. J. Transp. Res. Board 2005, 1913, 165–176. [Google Scholar]
  10. Kashaganova, G.; Kozbakova, A.; Kartbayev, T.; Balbayev, G.; Togzhanova, K.; Alimseitova, Z.; Orazaliyeva, S. Research of a Fiber Sensor Based on for Road Surface Monitoring. J. Electron. 2023, 12, 2491. [Google Scholar] [CrossRef]
  11. Kisala, P. Optoelectronic sensor for simultaneous and independent temperature and elongation measurement using Bragg gratings. Prz. Elektrotech. 2012, 11, 343–346. [Google Scholar]
  12. Wen, X.; Zhang, D.; Qian, Y.; Li, J.; Fei, N. Improving the peak wavelength detection accuracy of Sn–doped, H2–loaded FBG high temperature sensors by wavelet filter and Gaussian curve fitting. Sens. Actuators A Phys. 2012, 174, 91–95. [Google Scholar] [CrossRef]
  13. Peng, H.; Su, Y.; Ye, Z.; Zhou, B. A novel fiber Bragg grating sensor for weak pressure measurement based on the Stokes parameter. Opt. Fiber Technol. 2012, 18, 485–489. [Google Scholar] [CrossRef]
  14. An, J.; Liu, T.; Jin, Y. Fiber optic vibration sensor based on the tilted fiber Bragg grating. Adv. Mater. Sci. Eng. 2013, 2013, 545013. [Google Scholar] [CrossRef]
  15. Makovec, A.; Berruti, G.; Consales, M.; Giordano, M.; Petagna, P.; Buontempo, S.; Breglio, G.; Szillasi, Z.; Beni, N.; Cusano, A. Radiation hard polyimide–coated FBG optical sensors for relative humidity monitoring in the CMS experiment at CERN. J. Instrum. 2014, 9, C03040. [Google Scholar] [CrossRef]
  16. Song, L.; Fang, F.; Zhao, J. Study on viscosity measurement using fiber Bragg grating micro–vibration. Meas. Sci. Technol. 2013, 24, 015301. [Google Scholar] [CrossRef]
  17. Kisala, P. Detection of material defects with indirect method by determining the linear expansion with FBG sensor. Prz. Elektrotech. 2013, 89, 29–33. [Google Scholar]
  18. Kahandawa, G.C.; Epaarachchi, J.; Wang, H.; Lau, K.T. Use of FBG sensors for SHM in aerospace structures. Photonic Sens. 2012, 2, 203–214. [Google Scholar] [CrossRef]
  19. Luo, B.; Zhao, M.; Zhou, X.; Shi, S.; Han, X.; Wang, Y. Etched fiber Bragg grating for refractive index distribution measurement. Opt. Int. J. Light Electron Opt. 2013, 124, 2777–2780. [Google Scholar] [CrossRef]
  20. Garcia, I.; Zubia, J.; Durana, G.; Aldabaldetreku, G.; Illarramendi, M.A.; Villatoro, J. Optical fiber sensors for aircraft structural health monitoring. Sensors 2015, 15, 15494–15519. [Google Scholar] [CrossRef]
  21. Lee, B.H.; Kim, Y.H.; Park, K.S.; Eom, J.B.; Kim, M.J.; Rho, B.S.; Choi, H.Y. Interferometric fiber optic sensors. Sensors 2012, 12, 2467–2486. [Google Scholar] [CrossRef]
  22. Gao, P.; Chen, X.; Feng, W. Simultaneous measurement of external refractive index and temperature based on long–period–grating–inscribed Sagnac interferometer and fiber Bragg grating. Rev. Sci. Instrum. 2012, 83, 105001. [Google Scholar] [CrossRef]
  23. Hernández-Acosta, M.A.; Martines-Arano, H.; Soto-Ruvalcaba, L.; Martínez-González, C.L.; Martínez-Gutiérrez, H.; Torres-Torres, C. Fractional thermal transport and twisted light induced by an optical two-wave mixing in single-wall carbon nanotubes. Int. J. Therm. Sci. 2020, 147, 106136. [Google Scholar] [CrossRef]
  24. Pan, J.; Hou, W.; Wang, L.; Zou, Z.; Xiao, F. Design and experimental study of a fiber Bragg grating strain sensor with enhanced sensitivity. Appl. Opt. 2022, 61, 8172–8179. [Google Scholar] [CrossRef] [PubMed]
  25. Bilodeau, F.; Johnson, D.C.; Theriault, S.; Malo, B.; Albert, J.; Hill, K.O. An all-fiber dense-wavelength multiplexer/demultiplexer using photoimprinted Bragg gratings. IEEE Photonics Technol. Lett. 1995, 7, 388–390. [Google Scholar] [CrossRef]
  26. Dianov, E.M.; Grekov, M.V.; Bufetov, L.A.; Vasiliev, S.A.; Medvedkov, O.I.; Plotnichenko, V.G.; Koltashev, V.V.; Belov, A.V.; Bubnov, M.M.; Semjonov, S.L.; et al. CW high power 1.24 nm and 1.48 μm Raman lasers based on low loss phosphosilicate fibre. Electron. Lett. 1997, 33, 1542–1544. [Google Scholar] [CrossRef]
  27. Archambbault, J.L.; Grubb, S.G. Fiber Gratings in lasers and amplifiers. J. Light. Technol 1997, 15, 1378–1390. [Google Scholar] [CrossRef]
  28. Bird, D.M.; Armitage, J.R.; Kashyap, R.; Fatah, R.M.A.; Cameron, K.H. Narrow line semiconductor laser using fiber grating. Electron. Lett. 1991, 27, 1115–1116. [Google Scholar] [CrossRef]
  29. Vengsarkar, A.M.; Pedrazzani, J.R.; Judkins, J.B.; Lemaire, P.J.; Bergano, N.S.; Davidson, C.R. Long-period fiber-grating-based gain equalizers. Opt. Lett. 1996, 21, 336–338. [Google Scholar] [CrossRef] [PubMed]
  30. Protopopov, V.N.; Karpov, V.I.; Medvedkov, O.I.; Vasiliev, S.A.; Grekov, M.V.; Dianov, E.M.; Palto, S.P. Temperature sensor based on fiber Bragg grating. In Proceedings of the SPIE 4083, Advances in Fiber Optics, Moscow, Russia, 1 March 2000; pp. 224–228. [Google Scholar]
  31. Dianov, E.M.; Kurkov, A.S.; Medvedkov, O.I.; Vasiliev, S.A. Application of photo induced long-period fiber gratings in optical sensors. In Proceedings of the European Conference on Lasers and Electro-Optics 1996, CLEO/Europe’96, Hamburg, Germany, 8–13 September 1996. [Google Scholar]
  32. Dianov, E.M.; Kurkov, A.S.; Medvedkov, O.I.; Vasiliev, S.A. Photo induced long-period fiber grating as a promising sensor element. In Proceedings of the Eurosensors X The 10th European Conference on Solid-State Transducers, Leuven, Belgium, 8–11 September 1996; Volume 5, pp. 1–128. [Google Scholar]
  33. Gu, X.J. Wavelength-division multiplexing isolation fiber filter and light source using cascaded long-period fiber gratings. Opt. Lett. 1998, 23, 509–510. [Google Scholar] [CrossRef]
  34. Starodubov, D.S.; Grubsky, V.; Feinberg, J. All-fiber band pass filter with adjustable transmission. In Proceedings of the Optical Fiber Communication Conference 1999, OFC’P9, San Diego, CA, USA, 21–26 February 1999; pp. 138–140. [Google Scholar]
  35. Starodubov, D.S.; Grubsky, V.; Skorucak, A.; Feinberg, J.; Cai, J.X.; Feng, K.M.; Willner, A.E. Novel fiber amplitude modulators for dynamic channel power equalization in WDM systems. In Proceedings of the Optical Fiber Communication Conference 1998, OFC’98, San Jose, CA, USA, 16–22 February 1997. [Google Scholar]
  36. Kashaganova, G.B. Research and Optimization of Spectral Characteristics of Fiber Optic Bragg Gratings. Doctoral Dissertation, Almaty, Kazakhstan, 2017; p. 120. [Google Scholar]
  37. Kashaganova, G.B. Study of the main parameters of fiber sensors based on inclined fiber Bragg grids and the influence of external factors on them. Bull. KazATC 2022, 4, 537–545. [Google Scholar]
  38. Dong, Y.; Bao, X.; Chen, L. Distributed temperature sensing based on birefringence effect on transient Brillouin grating in a polarization-maintaining photonic crystal fiber. Opt. Lett. 2009, 34, 2590–2592. [Google Scholar] [CrossRef]
  39. Kalimoldayev, M.; Kalizhanova, A.; Wójcik, W.; Kashaganova, G.; Amirgaliyeva, S.; Dasibekov, A.; Kozbakova, A.; Aitkulov, Z. Research of the Spectral Characteristics of Apodized fiber bragg gratings. In ITM Web of Conferences; EDP Sciences: Paris, France, 2018; ISSN 2271-2097. [Google Scholar] [CrossRef]
  40. Wagener, J.L.; Strasser, T.A.; Pedrazzani, J.R.; DeMarco, J.; DiGiovanni, D. Fiber Grating Optical Spectrum Analyzer Tap. In Proceedings of the 11th International Conference on Integrated Optics and Optical Fibre Communications; 23rd European Conference on Optical Communications IOOC-ECOC97, Edinburgh, UK, 22–25 September 1997; IET: London, UK, 1997; pp. 65–68. [Google Scholar] [CrossRef]
  41. Faiyaz, N.M.; Omi, A.I.; Faisal, M. Optimization of Apodization Profile of Chirped fiber Bragg grating for Chromatic Dispersion Compensation Using Chirped Apodized FBG. In Proceedings of the International Conference on Electrical Engineering and Information & Communication Technology (ICEEICT), Dhaka, Bangladesh, 10–12 April 2014; pp. 1–5. [Google Scholar]
  42. Khan, S.S.A.; Islam, M.S. Chromatic Dispersion Compensation Using Linearly Chirped Apodized fiber Bragg grating. In Proceedings of the International Conference on Electrical & Computer Engineering (ICECE 2010), Dhaka, Bangladesh, 18–20 December 2010; pp. 9–12. [Google Scholar]
  43. Bandyopadhyay, S.; Biswas, P.; Pal, A.; Bhadra, S.K.; Dasgupta, K. Empirical Relations for Design of Linear Edge Filters Using Apodized Linearly Chirped. J. Light. Technol. 2008, 26, 3853–3859. [Google Scholar] [CrossRef]
  44. Farahi, F.; Webb, D.J.; Jones, J.D.C.; Jackson, D.A. Simultaneous measurement of temperature and strain: Cross-sensitivity considerations. J. Light. Technol. 1990, 8, 138–142. [Google Scholar] [CrossRef]
  45. Jin, W.; Michie, W.C.; Thursby, G.; Konstantaki, M.; Culshaw, B. Simultaneous measurement of strain and temperature: Error analysis. Opt. Eng. 1997, 36, 598–609. [Google Scholar] [CrossRef]
  46. Xu, M.G.; Archambault, J.L.; Reekie, L.; Dakin, J.P. Simultaneous measurement of strain and temperature using fibre grating sensors. Proc. SPIE 1994, 2360, 191–194. [Google Scholar]
  47. Xu, M.G.; Archambault, J.L.; Reekie, L.; Dakin, J.P. Discrimination between strain and temperature effects using dual-wavelength fibre grating sensors. Electron. Lett. 1994, 30, 1085–1087. [Google Scholar] [CrossRef]
  48. Chehura, E.; James, S.W.; Tatam, R.P. Temperature and strain discrimination using a single tilted fibre Bragg grating. Opt. Commun. 2007, 275, 344–347. [Google Scholar] [CrossRef]
  49. James, S.W.; Dockney, M.L.; Tatam, R.P. Simultaneous independent temperature and strain measurement using in-fibre Bragg grating sensors. Electron. Lett. 1996, 32, 1133–1134. [Google Scholar] [CrossRef]
  50. Cavaleiro, P.M.; Aráujo, F.M.; Ferreira, L.A.; Santos, J.L.; Farahi, F. Simultaneous measurement of strain and temperature using Bragg gratings written in germanosilicate and boron-codoped germanosilicate fibers. IEEE Photonics Technol. Lett. 1999, 11, 1635–1637. [Google Scholar] [CrossRef]
  51. Guan, B.O.; Tam, H.Y.; Chan, H.L.W.; Choy, C.L.; Demokan, M.S. Discrimination between strain and temperature with a single. Microw. Opt. Technol. Lett. 2002, 33, 200–202. [Google Scholar] [CrossRef]
  52. Frazão, O.; Santos, J.L. Simultaneous measurement of strain and temperature using a Bragg grating structure written in germanosilicate fibres. J. Opt. A Pure Appl. Opt. 2004, 6, 553–556. [Google Scholar] [CrossRef]
  53. Patrick, H.J.; Williams, G.M.; Kersey, A.D.; Pedrazzani, J.R.; Vengsarkar, A.M. Hybrid long period fiber grating sensor for strain temperature discrimination. IEEE Photonics Technol. Lett. 1996, 8, 1223–1225. [Google Scholar] [CrossRef]
  54. Guan, B.O.; Tam, H.Y.; Tao, X.M.; Dong, X.Y. Simultaneous strain and temperature measurement using a superstructure. IEEE Photonics Technol. Lett. 2000, 12, 675–677. [Google Scholar] [CrossRef]
  55. Frazao, O.; Romero, R.; Rego, G.; Marques, P.V.S.; Salgado, H.M.; Santos, J.L. Sampled fibre Bragg grating sensors for simultaneous strain and temperature measurement. Electron. Lett. 2002, 38, 693–695. [Google Scholar] [CrossRef]
  56. Frazao, O.; Marques, L.M.; Baptista, J.M. Fibre Bragg grating interrogation based on high-birefringence fiber loop mirror for strain-temperature discrimination. Microw. Opt. Technol. Lett. 2006, 48, 2326–2328. [Google Scholar] [CrossRef]
  57. Kersey, A.D.; Davis, M.A.; Patrick, H.J.; LeBlanc, M.; Koo, K.P.; Askins, C.G.; Putnam, M.A.; Friebele, E.J. Fiber grating sensors. J. Light. Technol. 1997, 15, 1442–1463. [Google Scholar] [CrossRef]
  58. Tosi, D. Review and Analysis of peak tracking techniques for sensors. Sensors 2017, 17, 2368. [Google Scholar] [CrossRef]
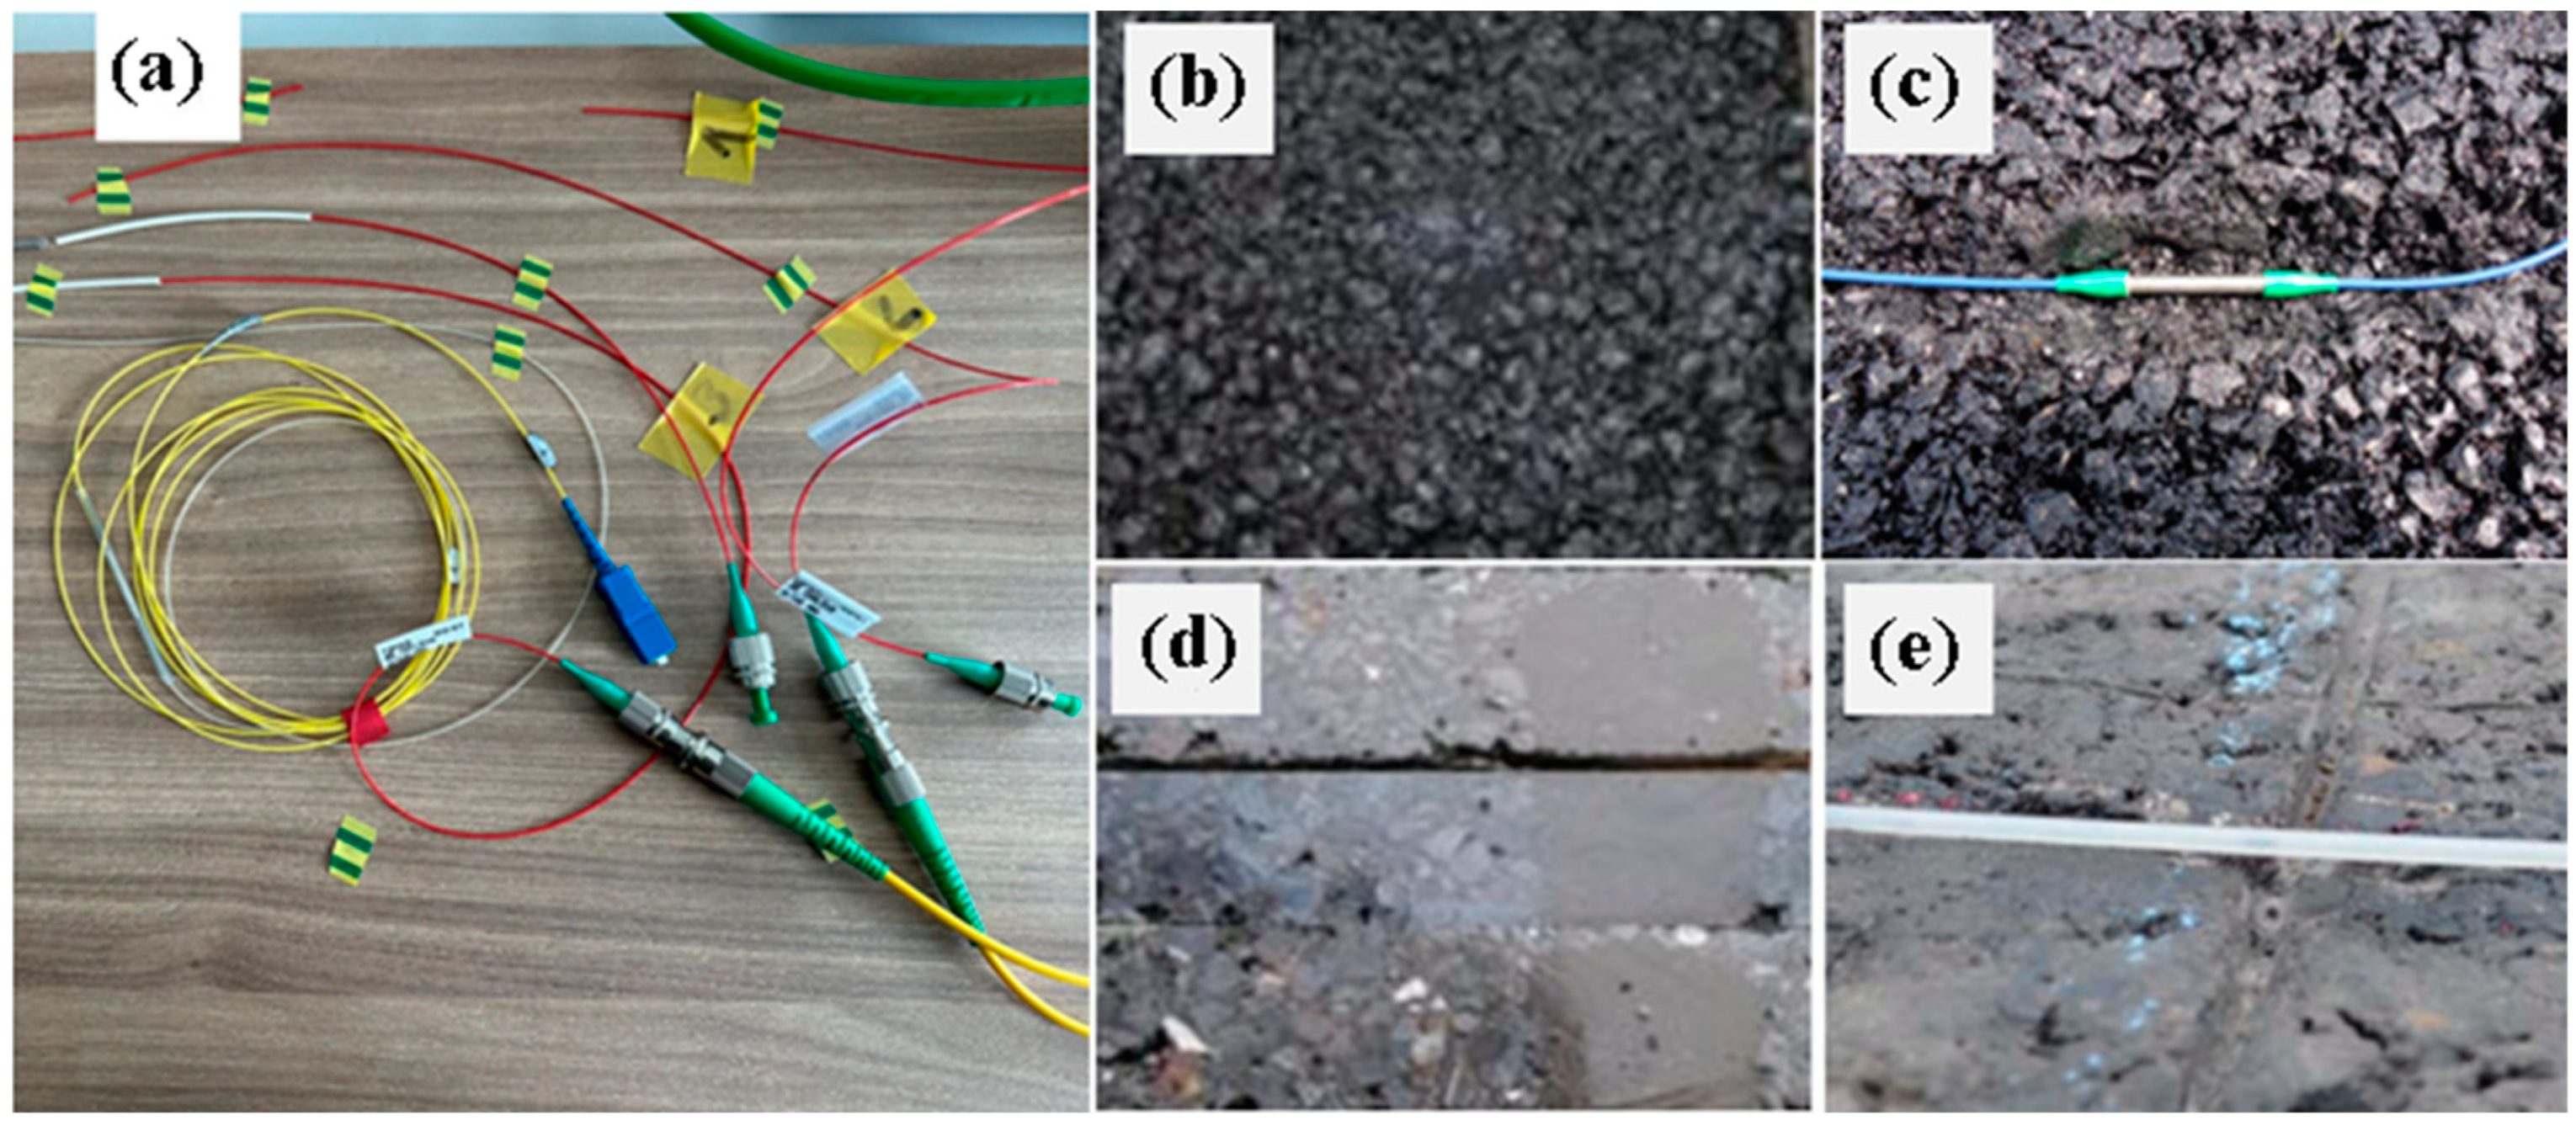
Figure 1. The developed FBG-based sensor (a), installation in the prepared fresh asphalt concrete sample (b,c), and installation in the early old asphalt concrete sample (d,e).
Inventions 09 00100 g001
Figure 2. The principle of operation of the sensor based on an FBG.
Inventions 09 00100 g002
Figure 4. Schematic diagram of a tilted grating [21].
Inventions 09 00100 g004
Figure 5. Transmission spectra [38].
Inventions 09 00100 g005
Figure 6. TFBGs show the wavelength response [21].
Inventions 09 00100 g006
Figure 7. Changes in the refractive index along the apodized Bragg gratings. The normalized refractive index is a black line; the profile (envelope) of the apodization is a red line.
Inventions 09 00100 g007
Figure 8. Schematic diagram with a variable period [21].
Inventions 09 00100 g008
Figure 9. Diagram of a linear chirped grating. Light with longer wavelengths must travel a longer path in the grating before it is reflected (a). Bragg grating scheme with an ascending chirp spike, which replaces long chirped gratings (b) [35].
Inventions 09 00100 g009
Figure 10. Reflectivity spectrum for a grating with a variable period.
Inventions 09 00100 g010
Figure 11. Model in MATLAB R2022b.
Inventions 09 00100 g011
Figure 12. Simulated spectral characteristic of the grating for temperature: (a) T = 300 °C, (b) T = 30 °C.
Inventions 09 00100 g012
Figure 13. Dependence of the Bragg wavelength on temperature.
Inventions 09 00100 g013
Figure 14. Spectral characteristics for temperatures from 18 °C to 135 ° C.
Inventions 09 00100 g014
Table 1. Values of Bragg wavelengths depending on temperature.
ΛB [nm]T [°C]
1527.8318
1528.02230
1528.02235
1528.11740
1528.14345
1528.24250
1528.24355
1528.360
1528.36965
1528.4270
1528.4975
1528.52780
1528.58285
1528.60890
1528.67595
1528.733100
1528.778105
1528.82110
1528.877115
1528.955120
1529.005125
1529.093130
1529.097135
Disclaimer/Publisher’s Note: The statements, opinions and data contained in all publications are solely those of the individual author(s) and contributor(s) and not of MDPI and/or the editor(s). MDPI and/or the editor(s) disclaim responsibility for any injury to people or property resulting from any ideas, methods, instructions or products referred to in the content.