
Innovative Maritime Uncrewed Systems and Satellite Solutions for Shallow Water Bathymetric Assessment


Abstract
1. Introduction
- The traditional crewed hydrographic survey activities are disadvantaged by significant requisites for human and financial resources.
- A novel integration of a medium-depth multibeam sonar with an Unmanned Surface Vehicle (USV) was successfully trialed in a shallow water environment.
- The challenging surf zone area was rapidly surveyed with high accuracy using an innovative LiDAR survey Uncrewed Aerial System (UAS).
- Advanced SDB techniques demonstrated the capability to produce high-resolution products, facilitating remote assessments in hydrographic surveying.
2. Materials and Methods
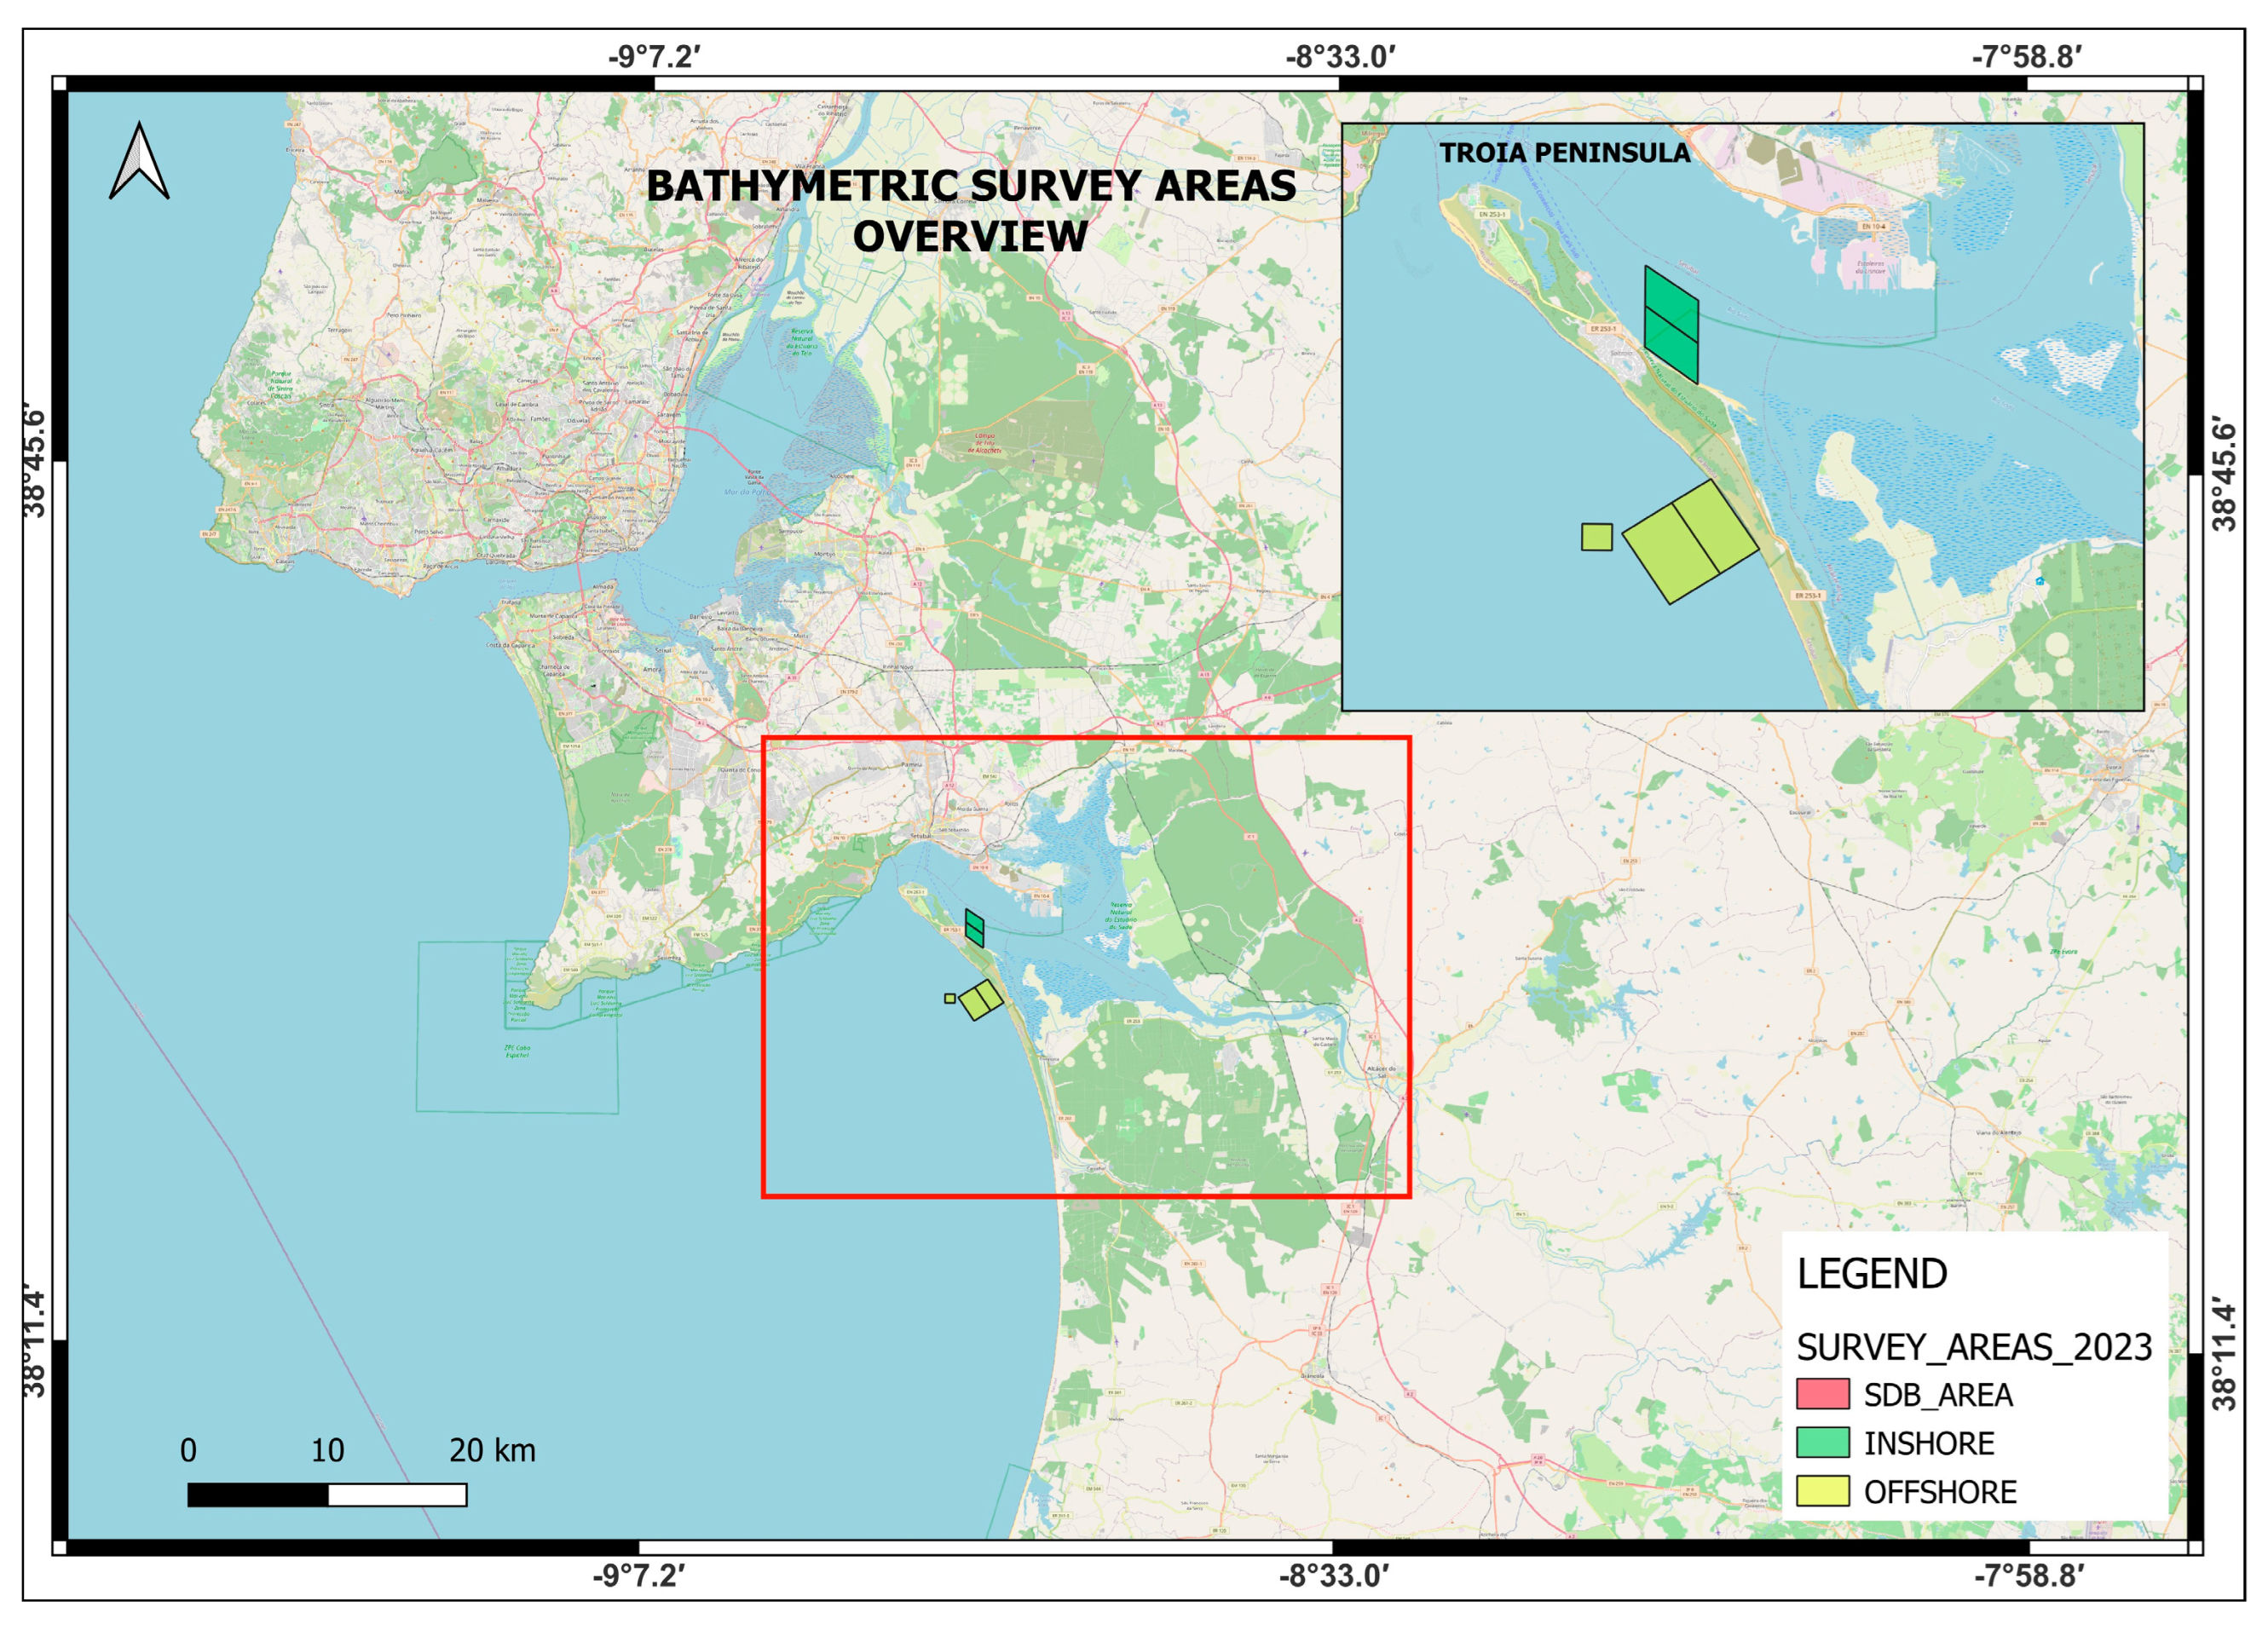
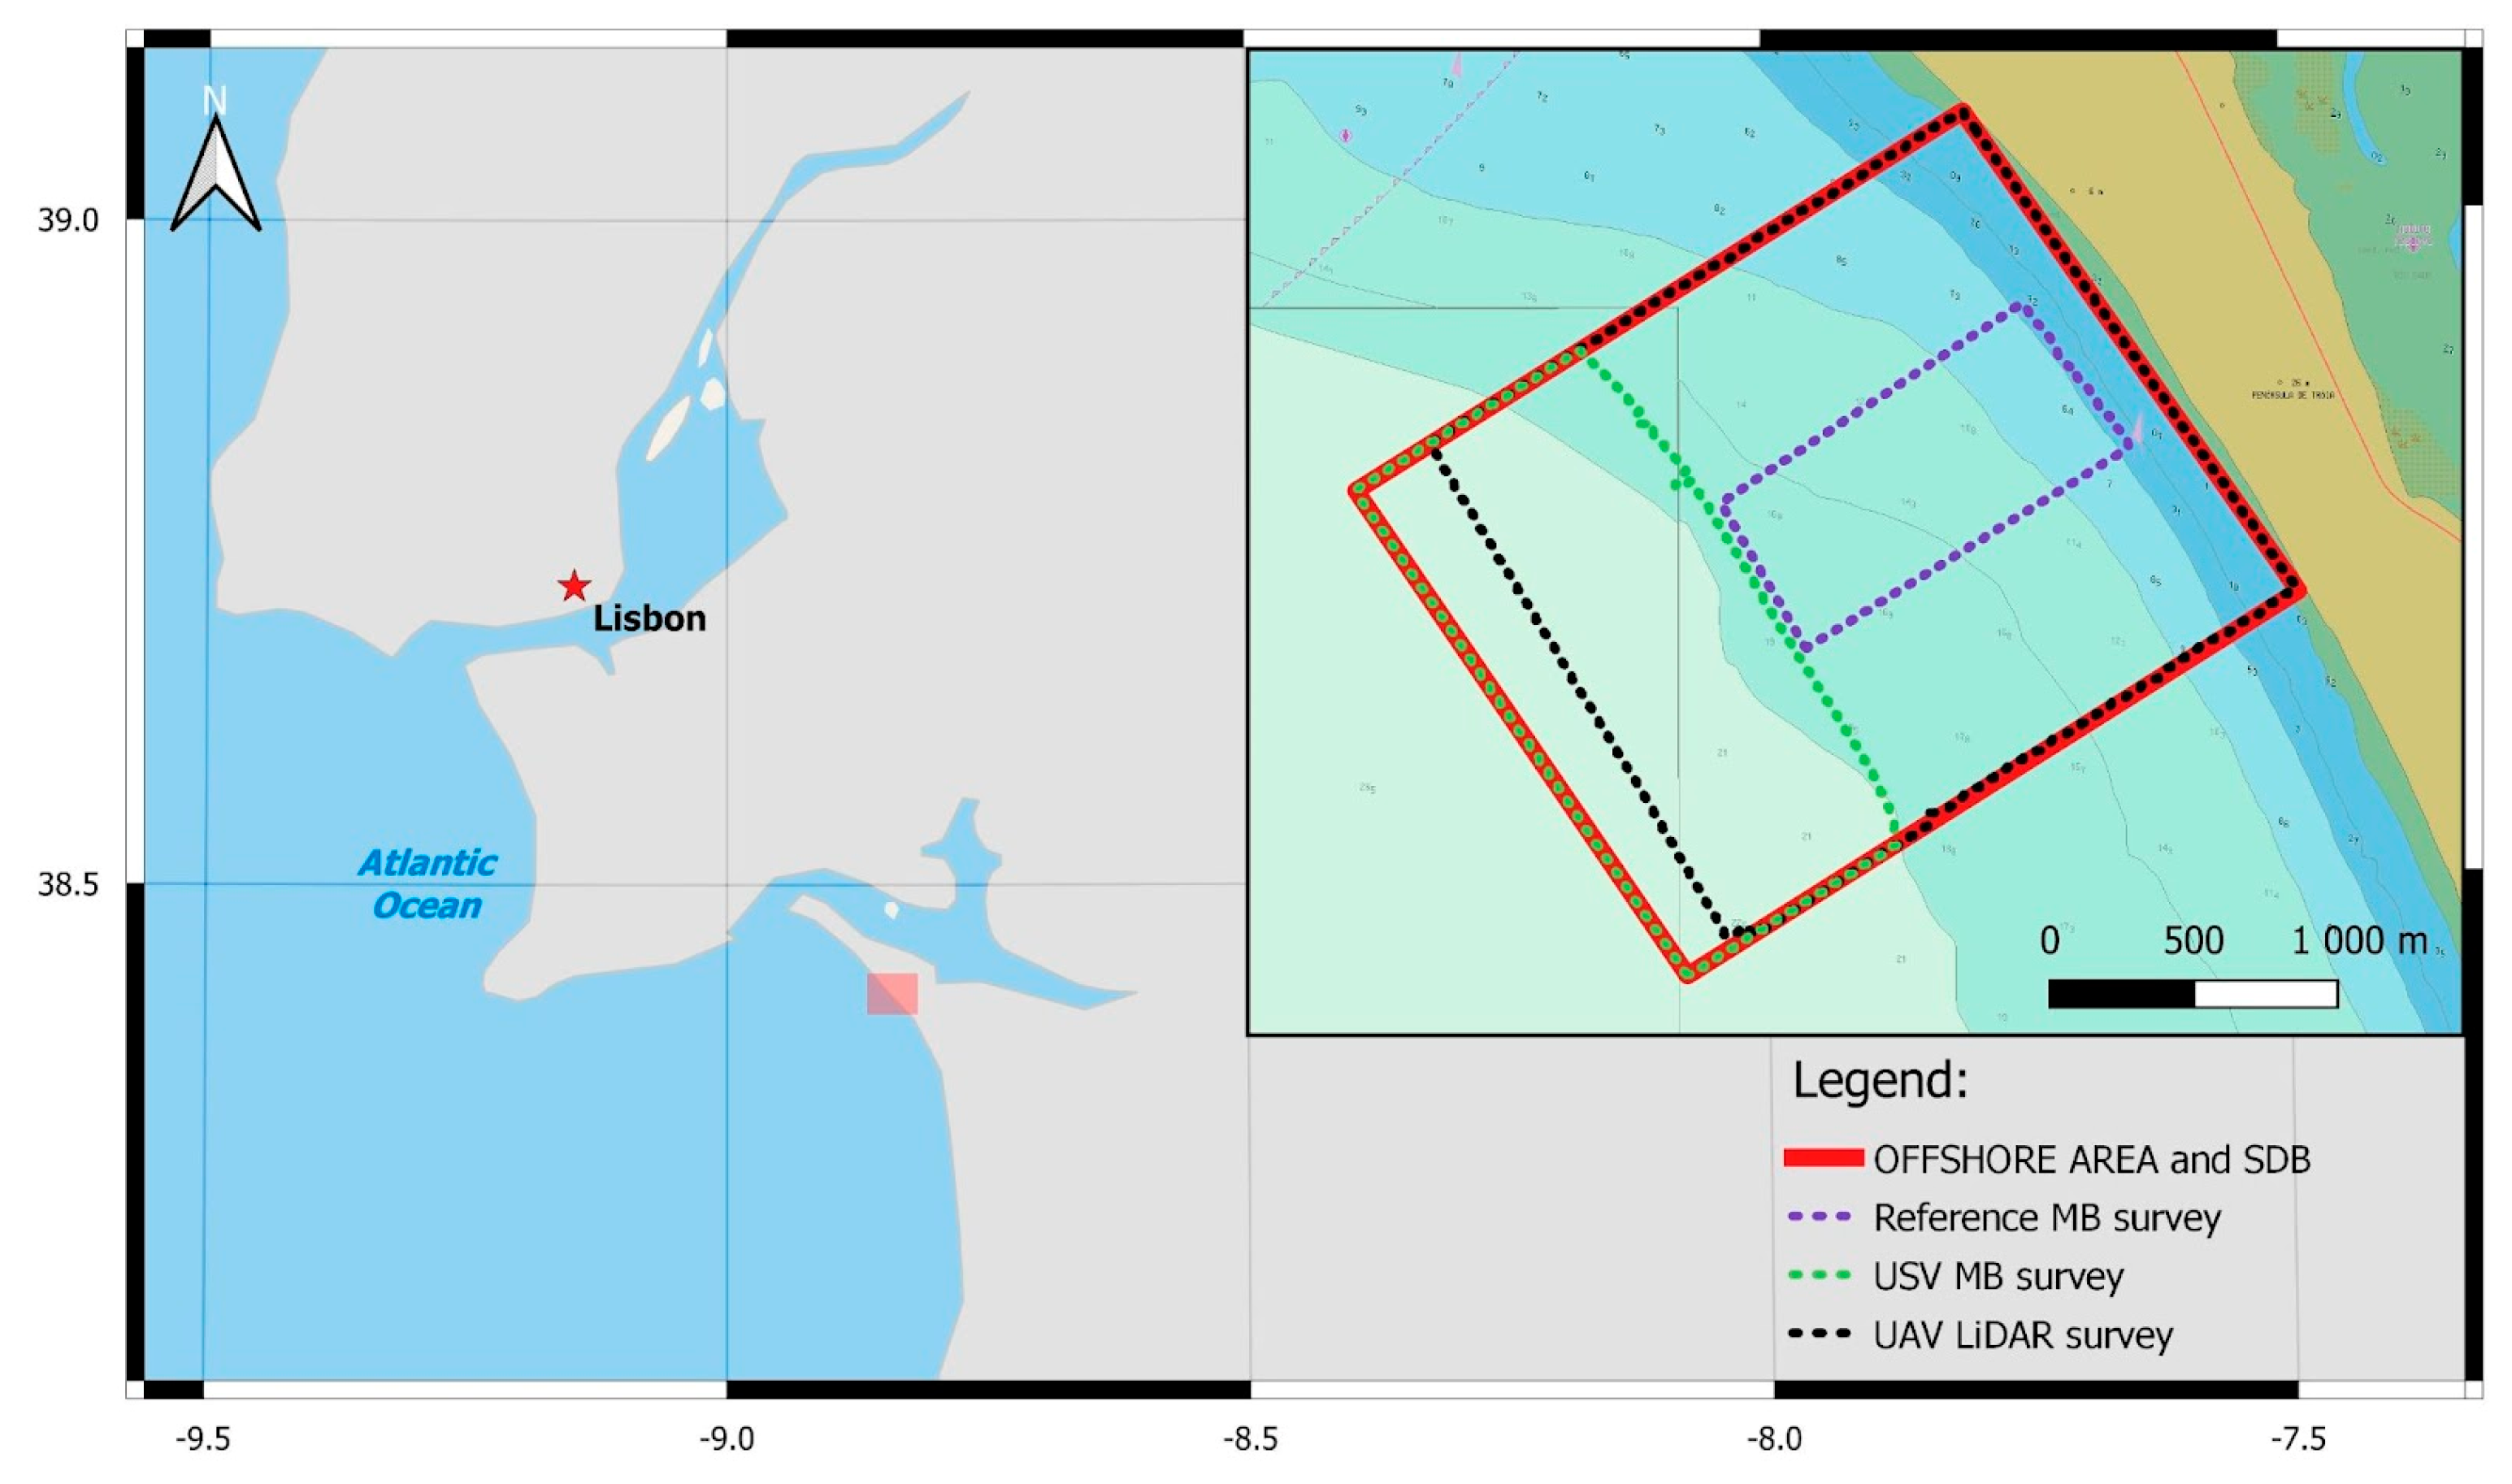
2.1. Description of the Study Area
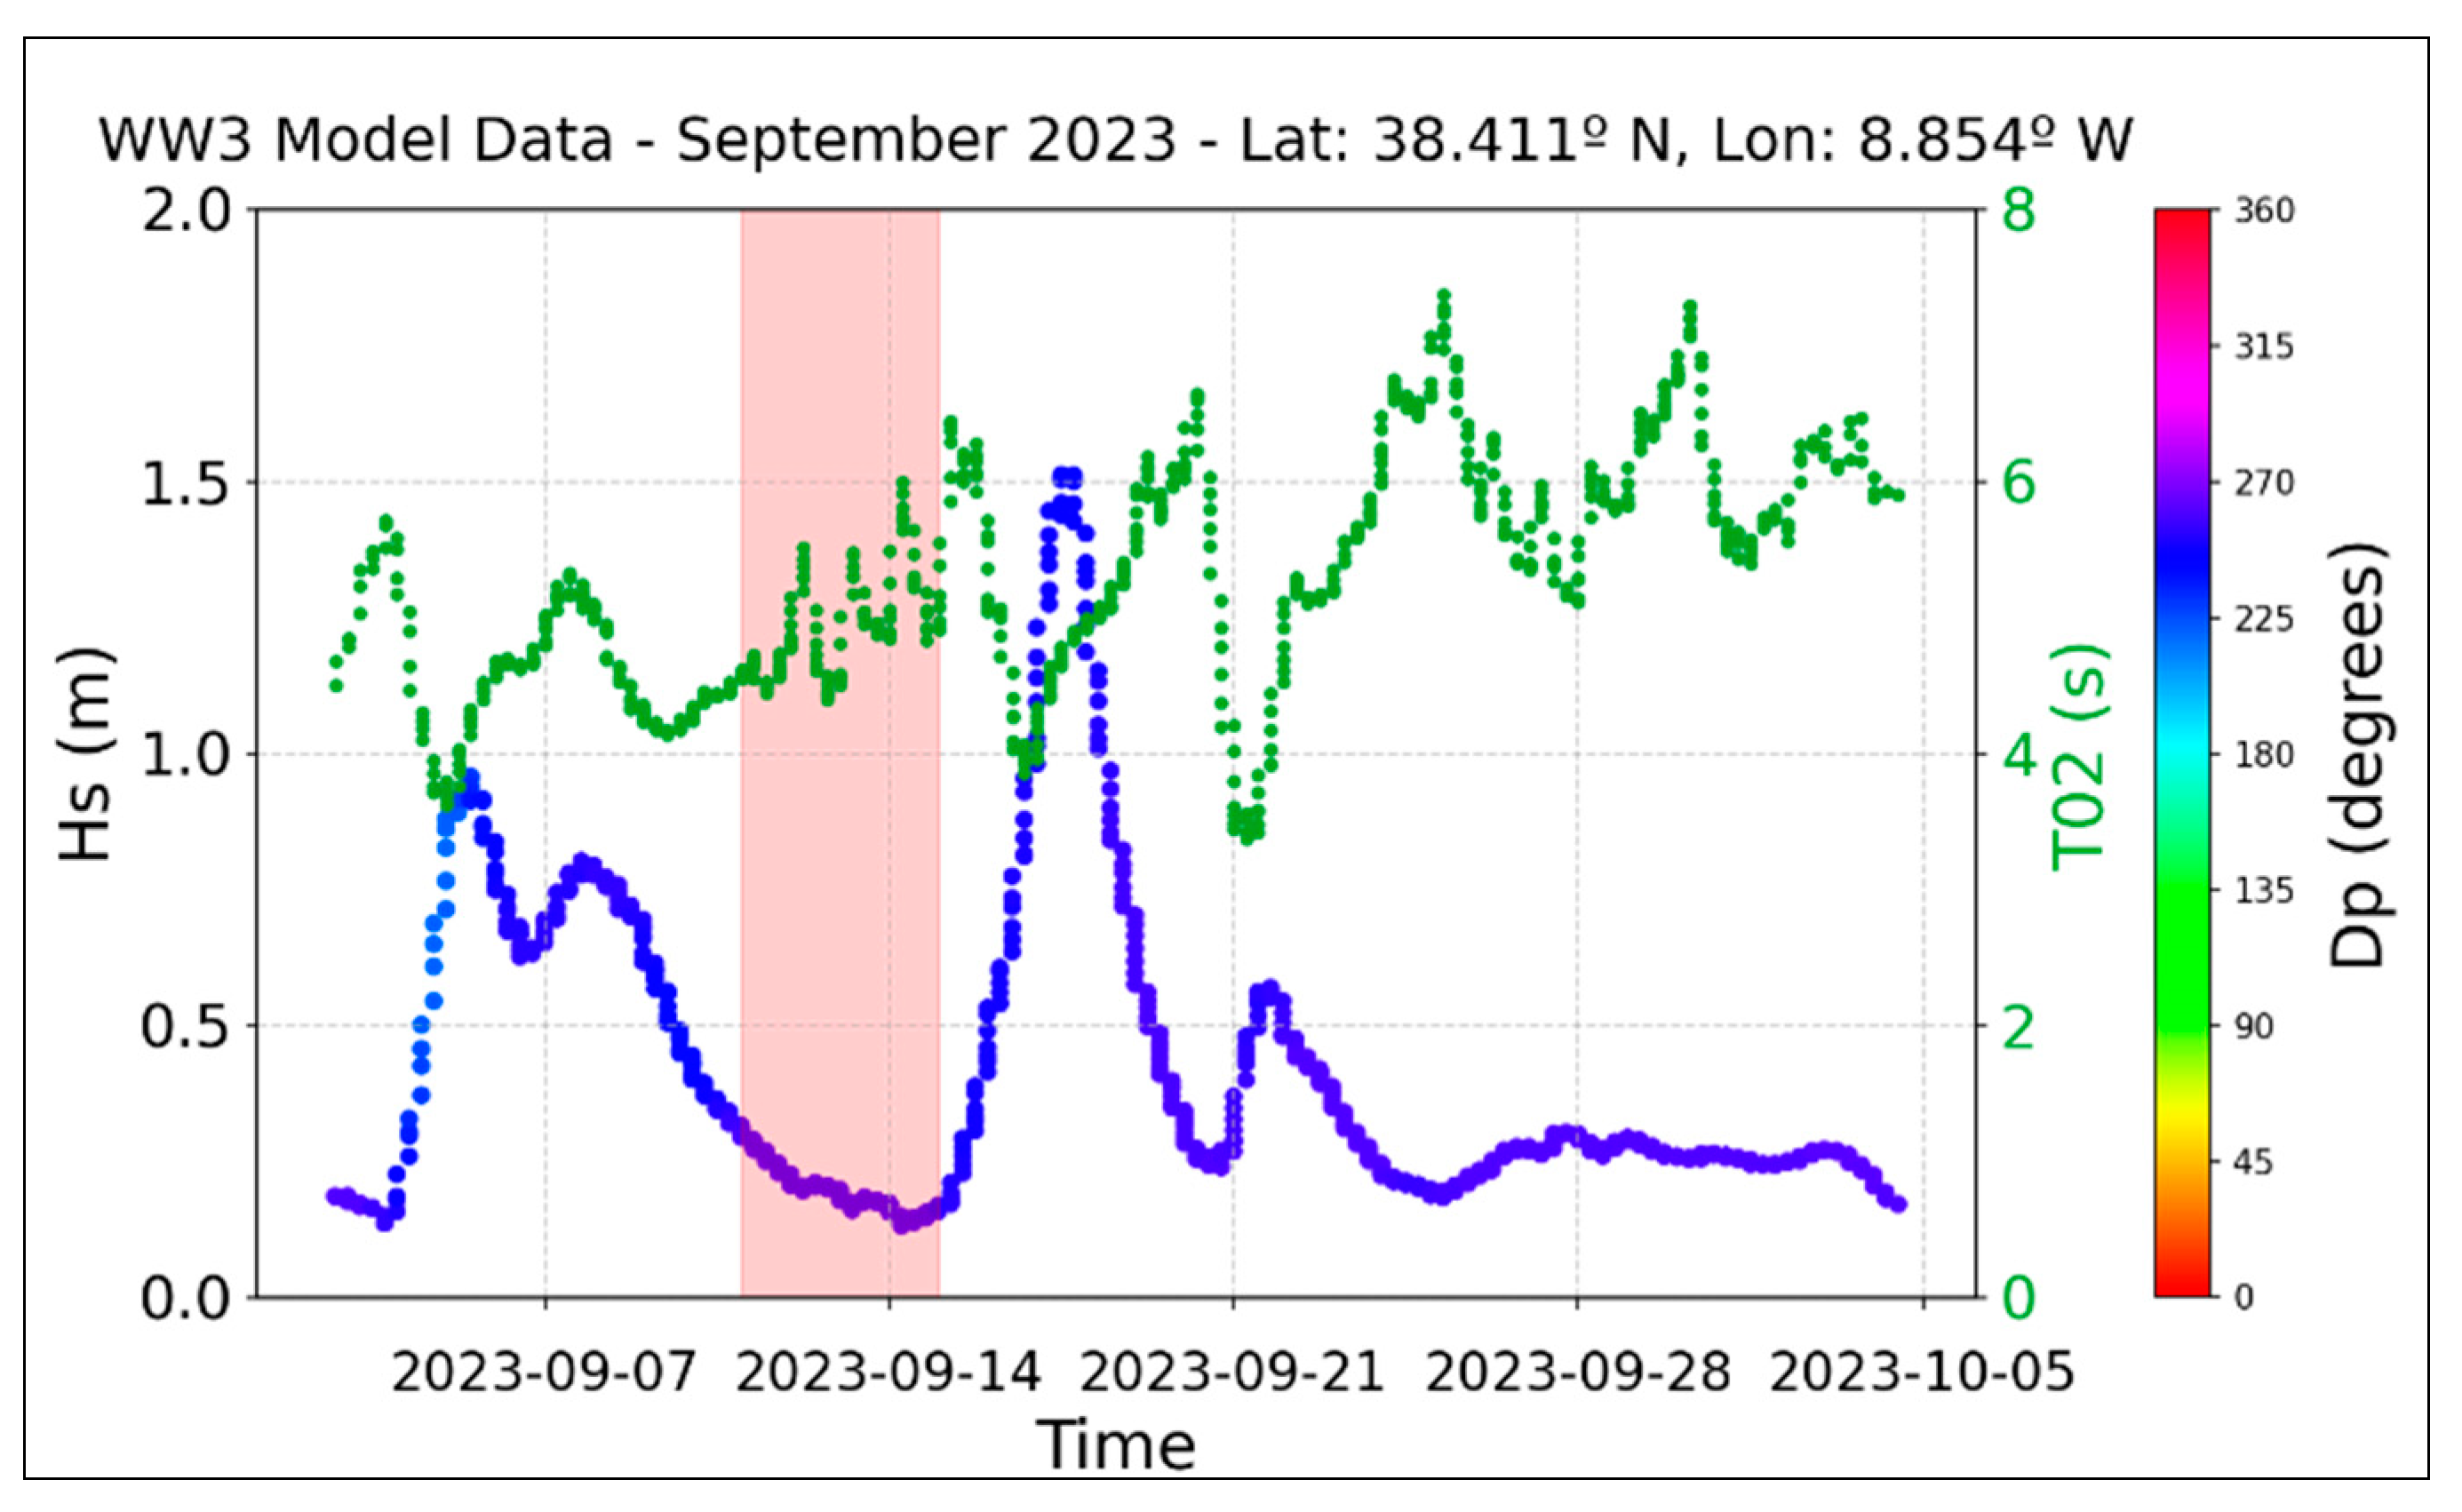
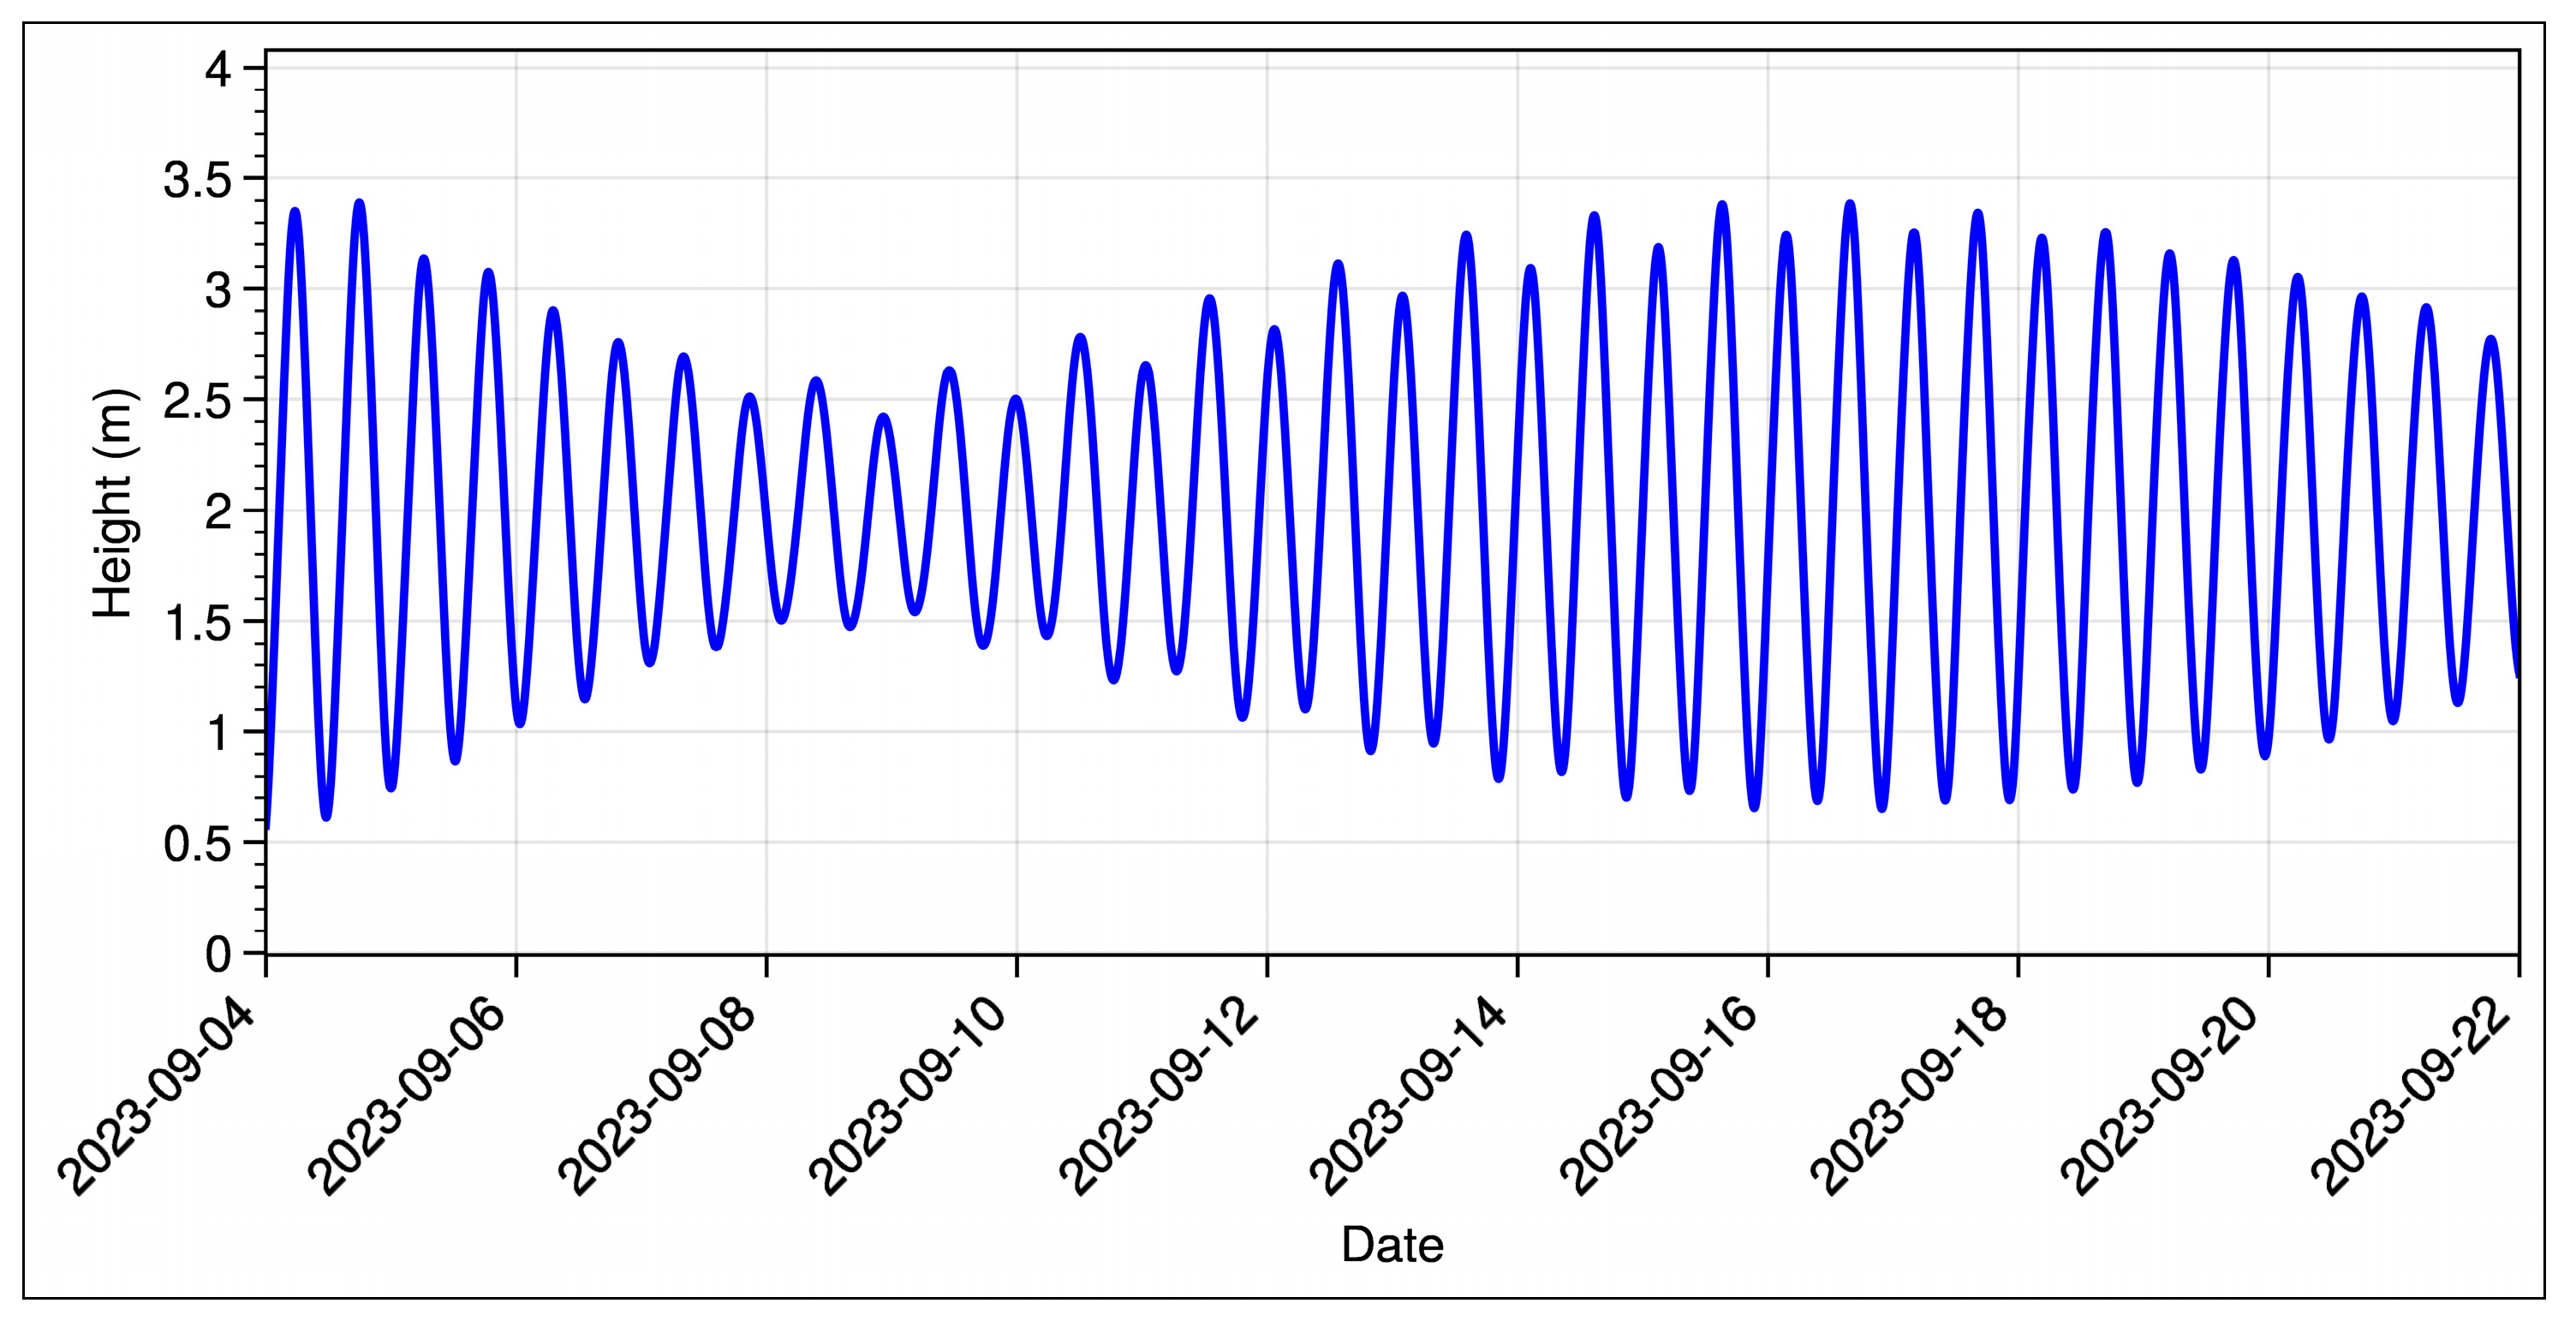
2.1.1. Meteorological and Oceanographic (METOC) Conditions during the Hydrographic Surveys
2.1.2. Challenges of the Hydrographic Surveys in the Study Area
2.2. MUS and Hydrographic Surveys Characterization
2.2.1. Reference Hydrographic Survey
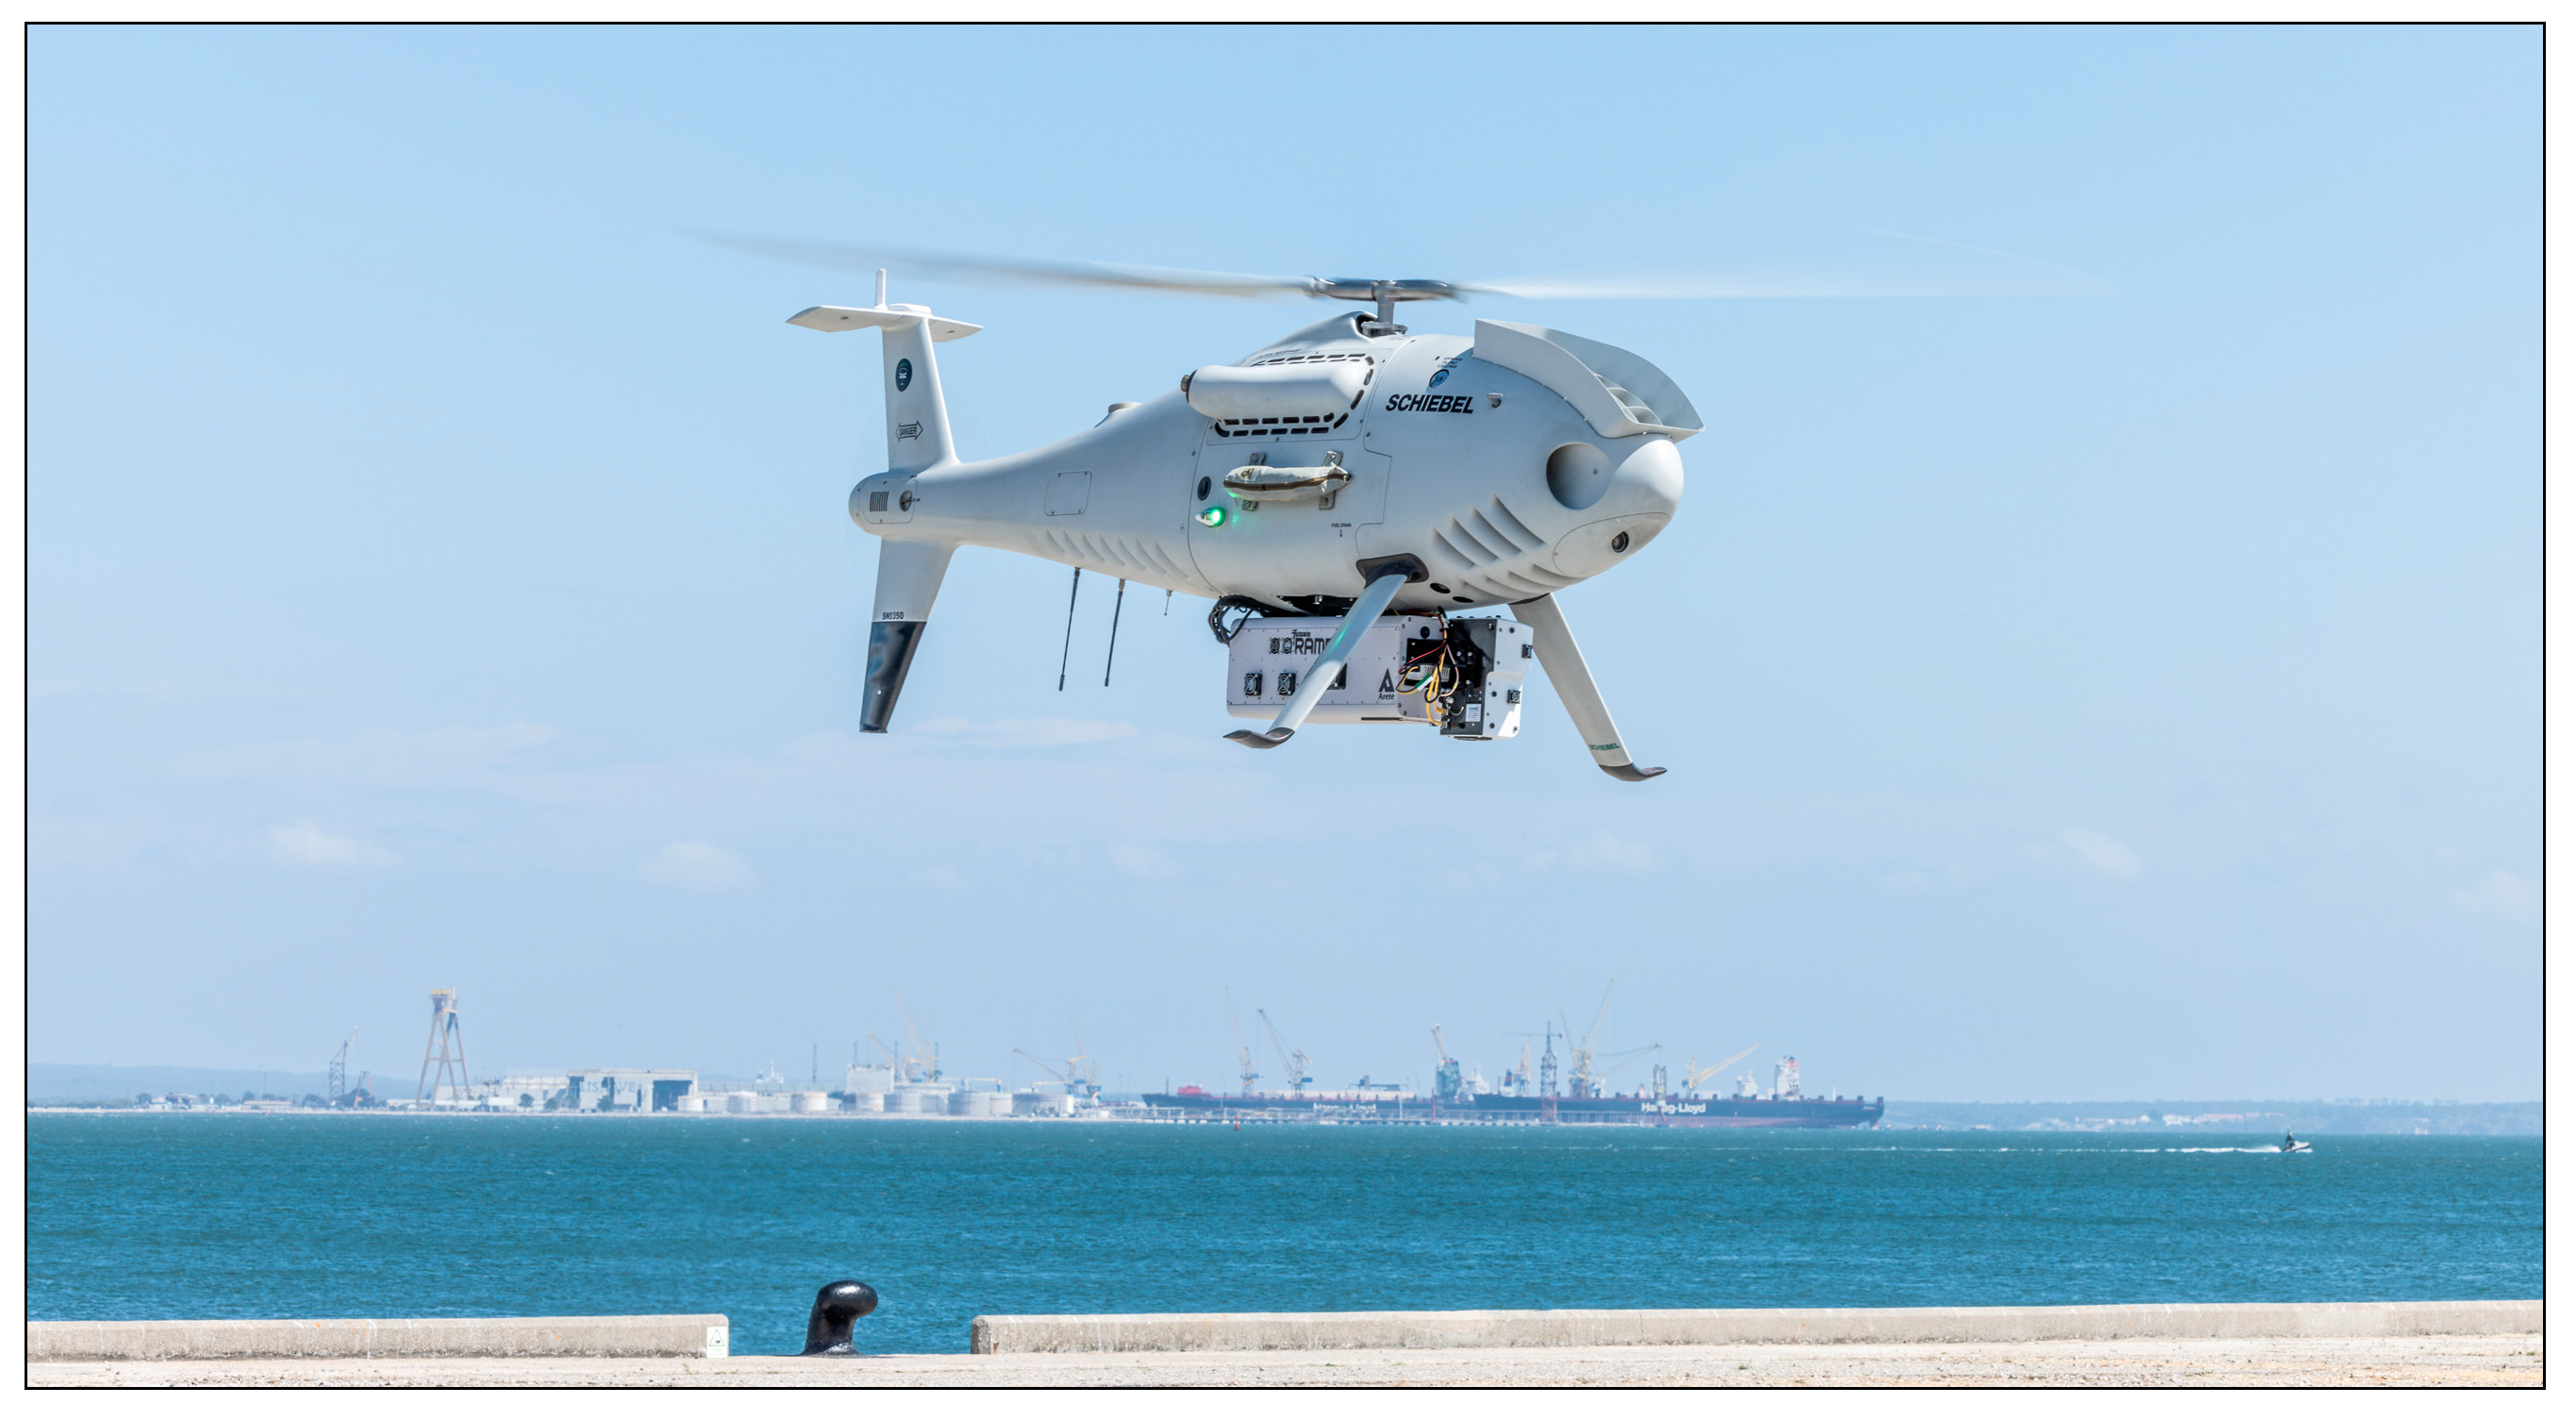
2.2.2. LiDAR UAV Survey
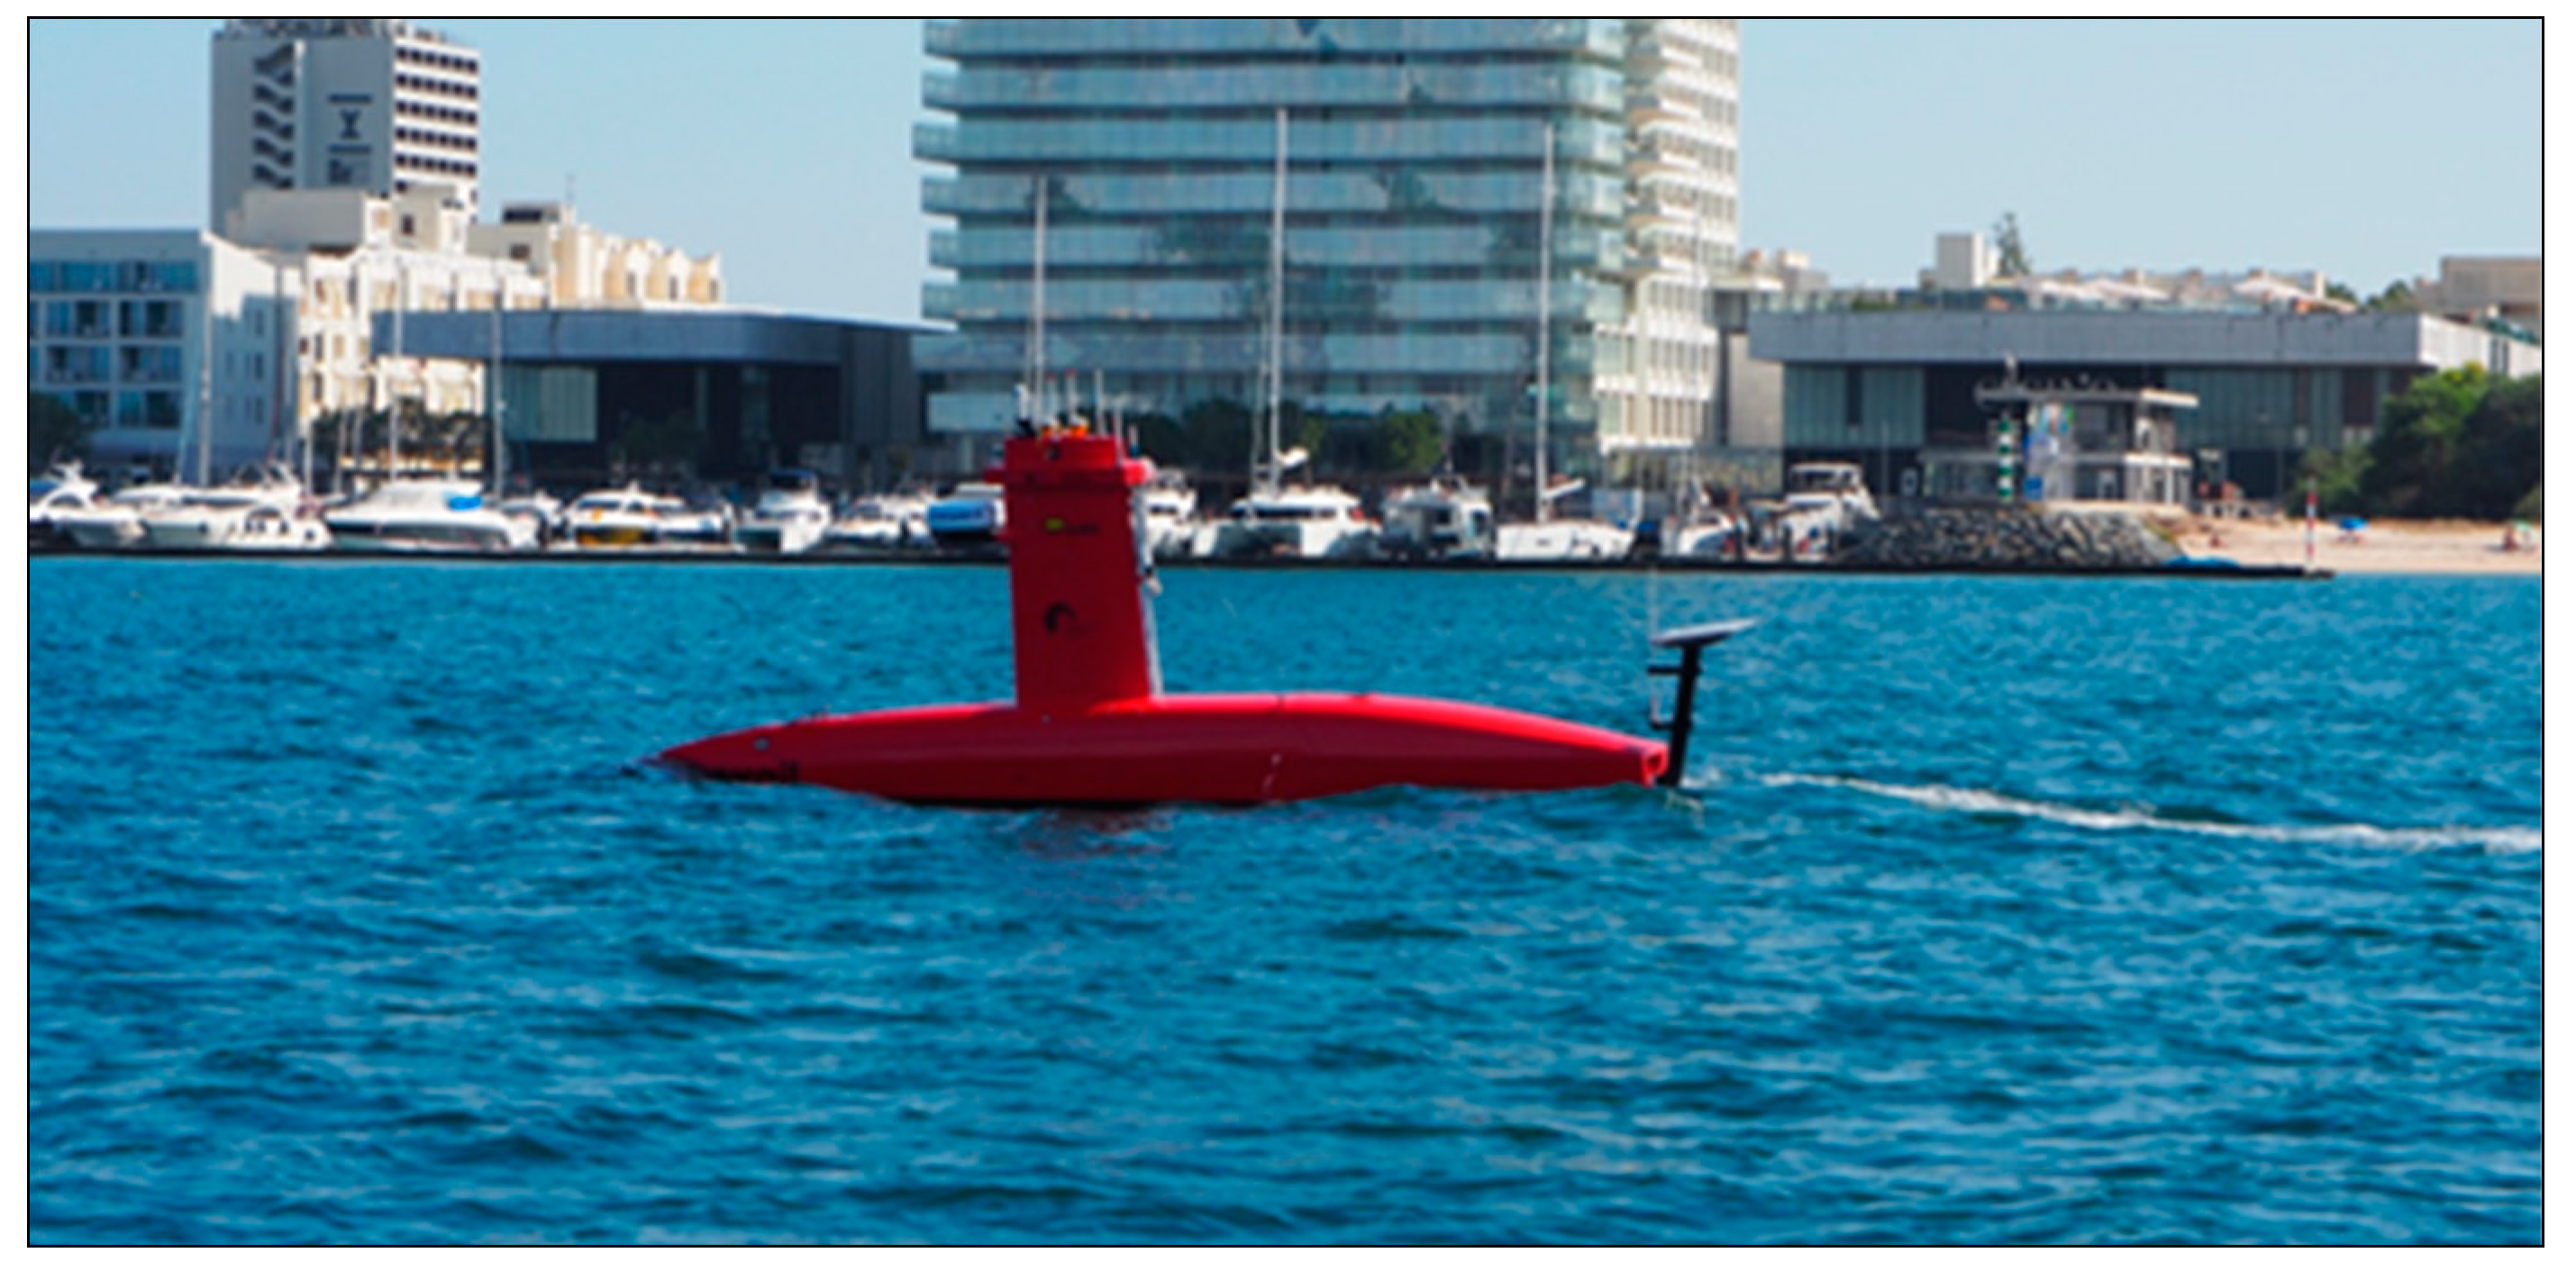
2.2.3. USV MB Survey
2.2.4. Satellite-Derived Bathymetry (SDB)
2.3. Datasets’ Evaluation
3. Results and Discussion
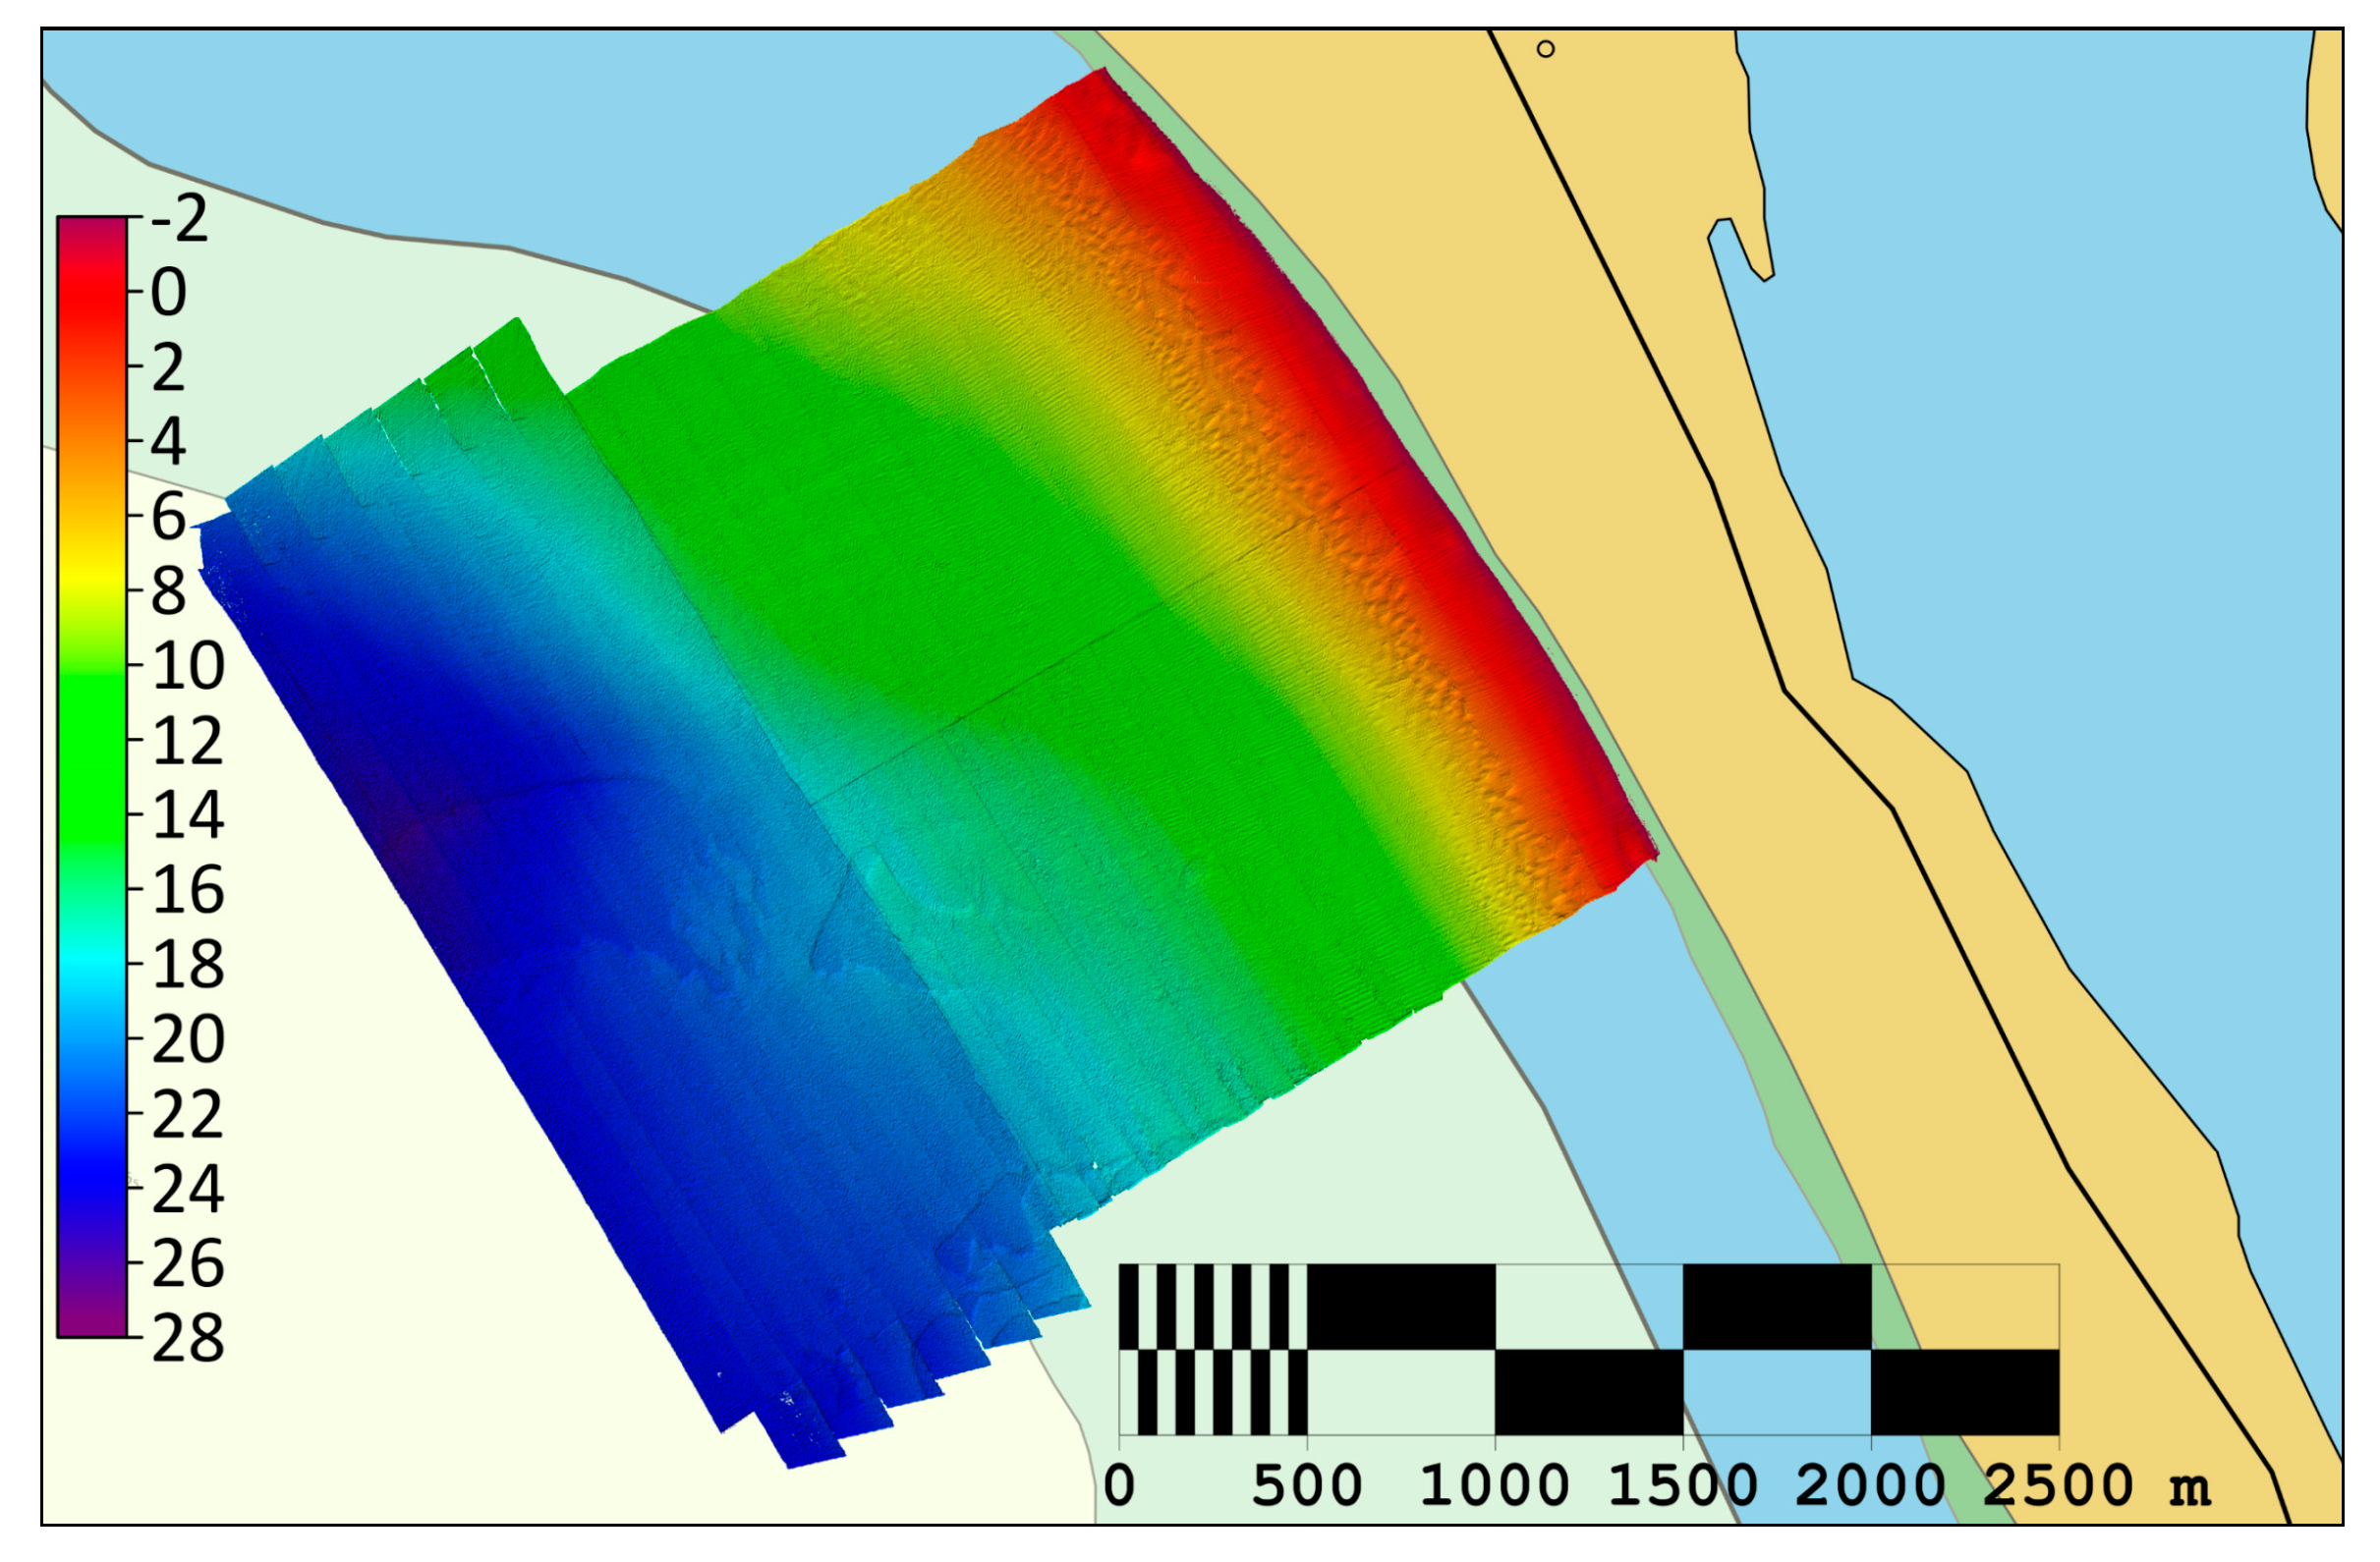
3.1. Reference Bathymetric Survey
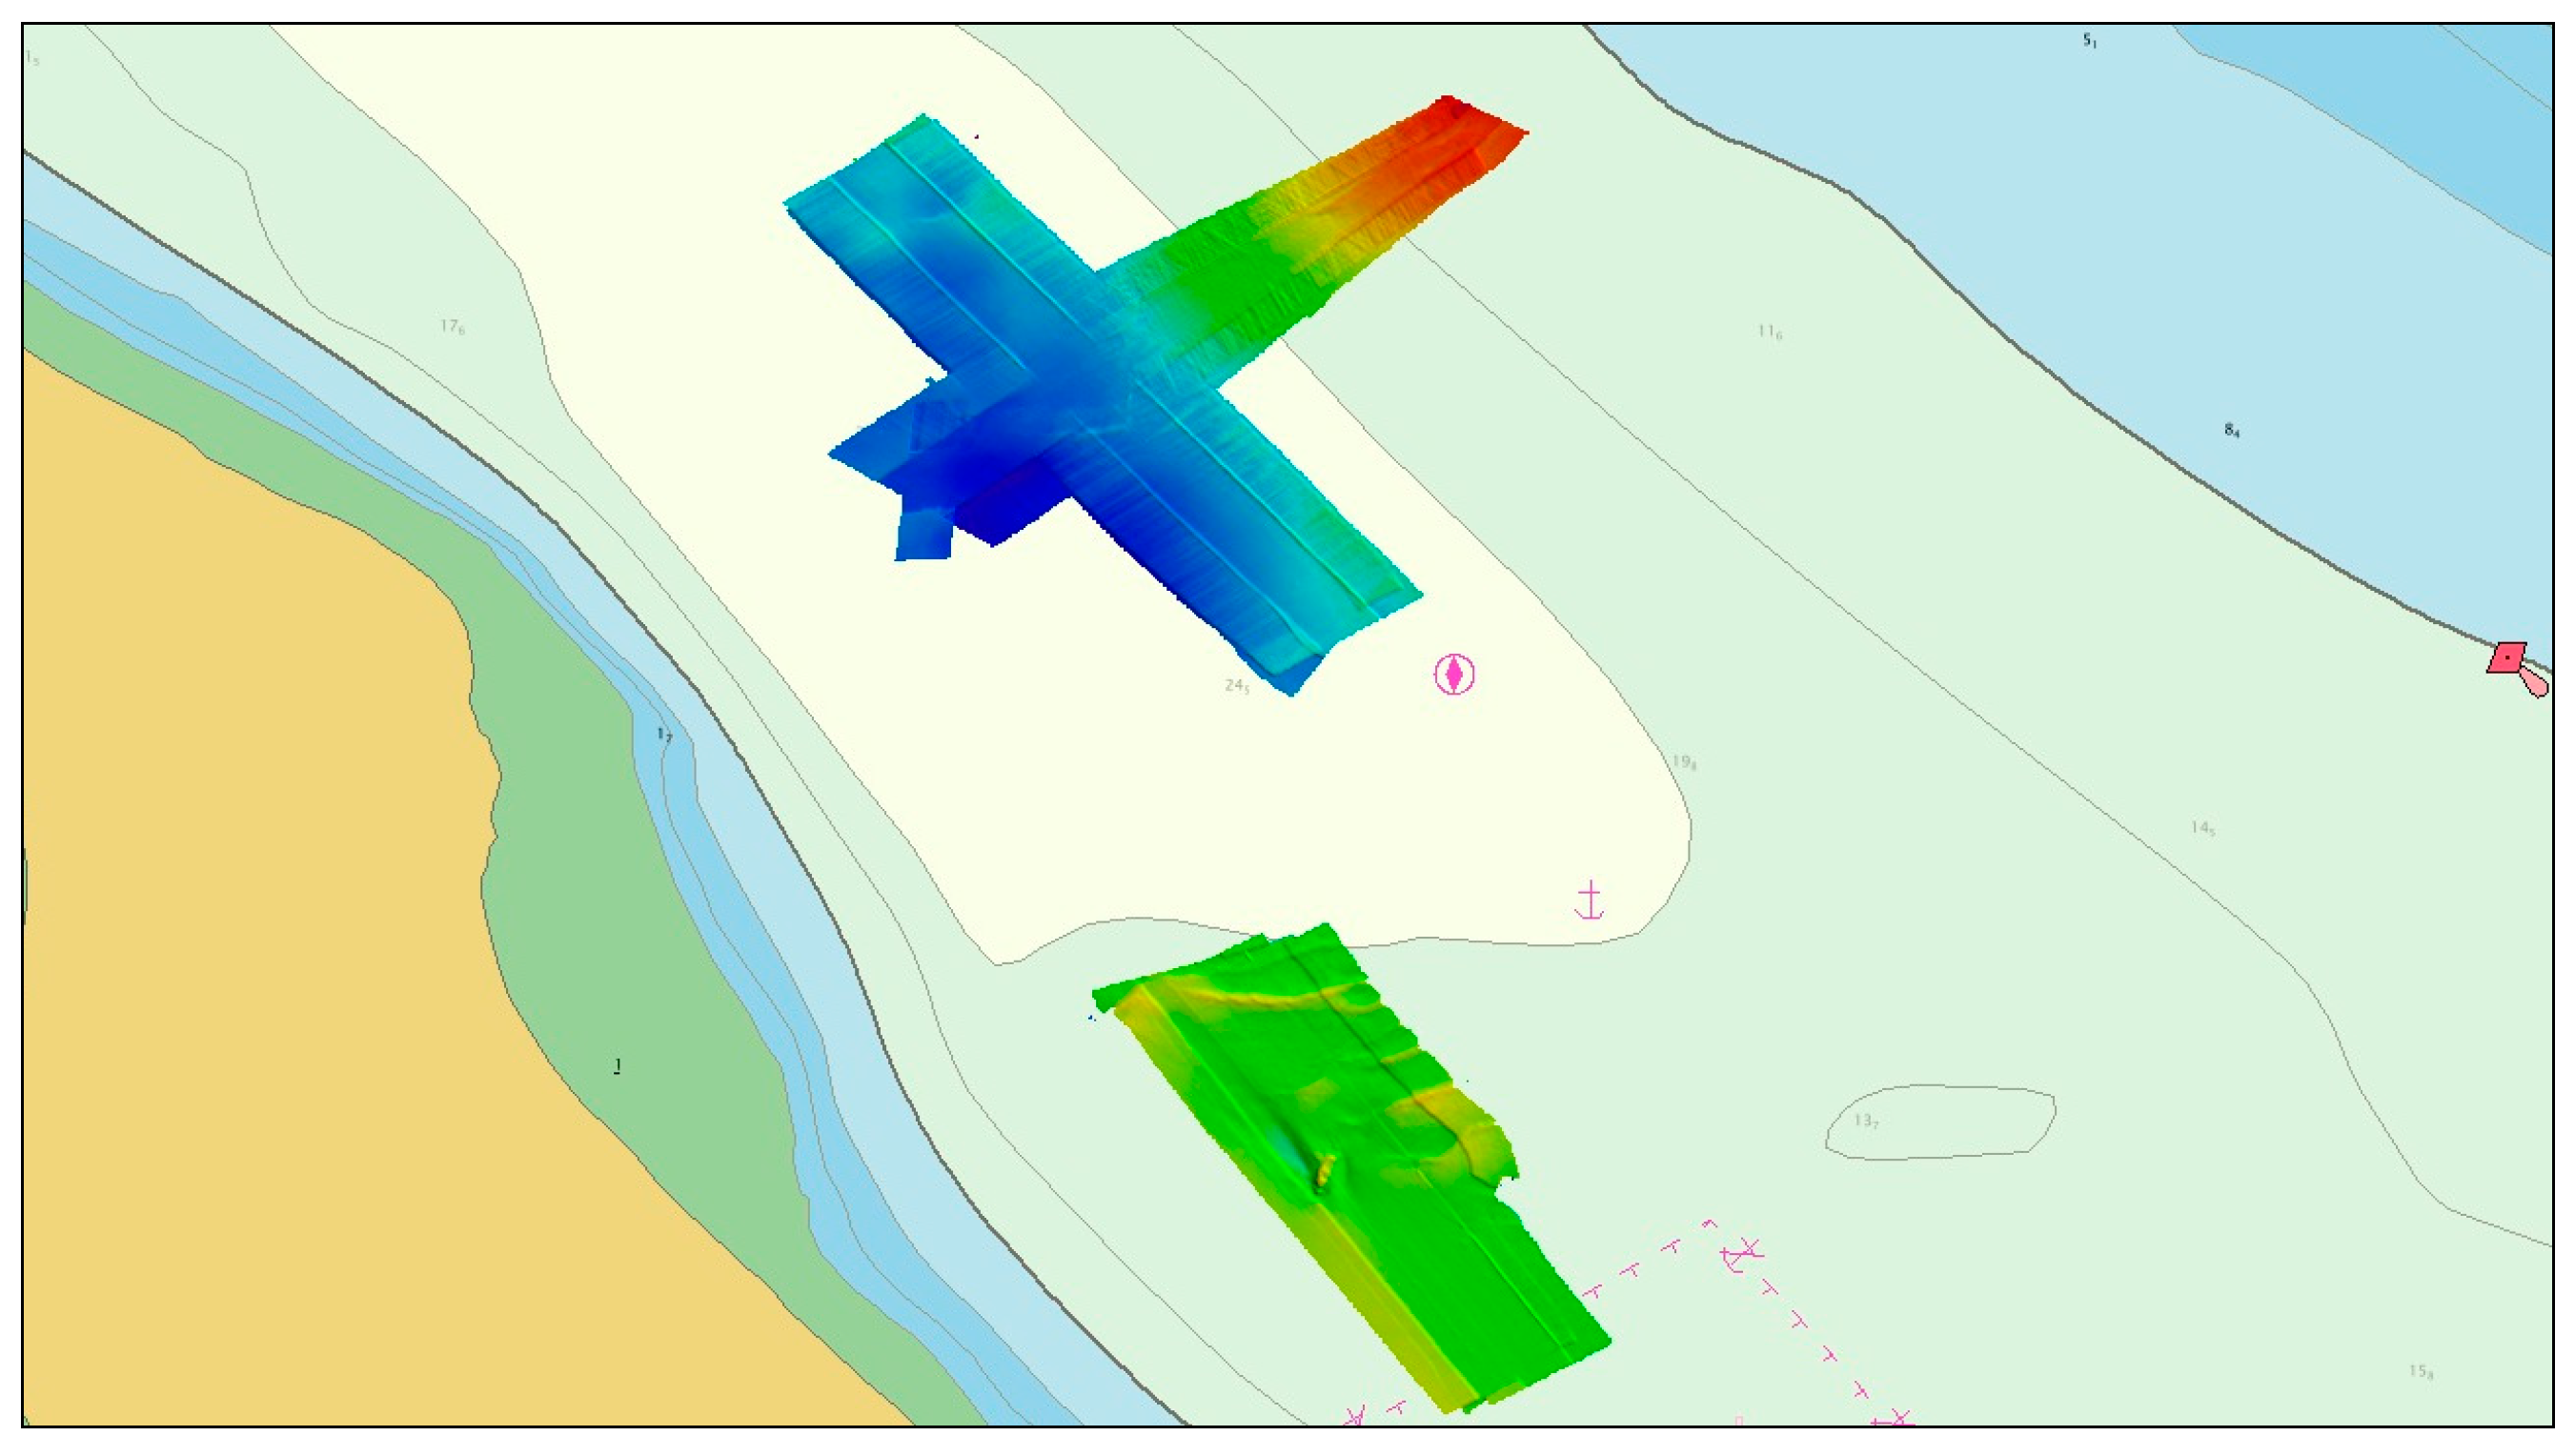
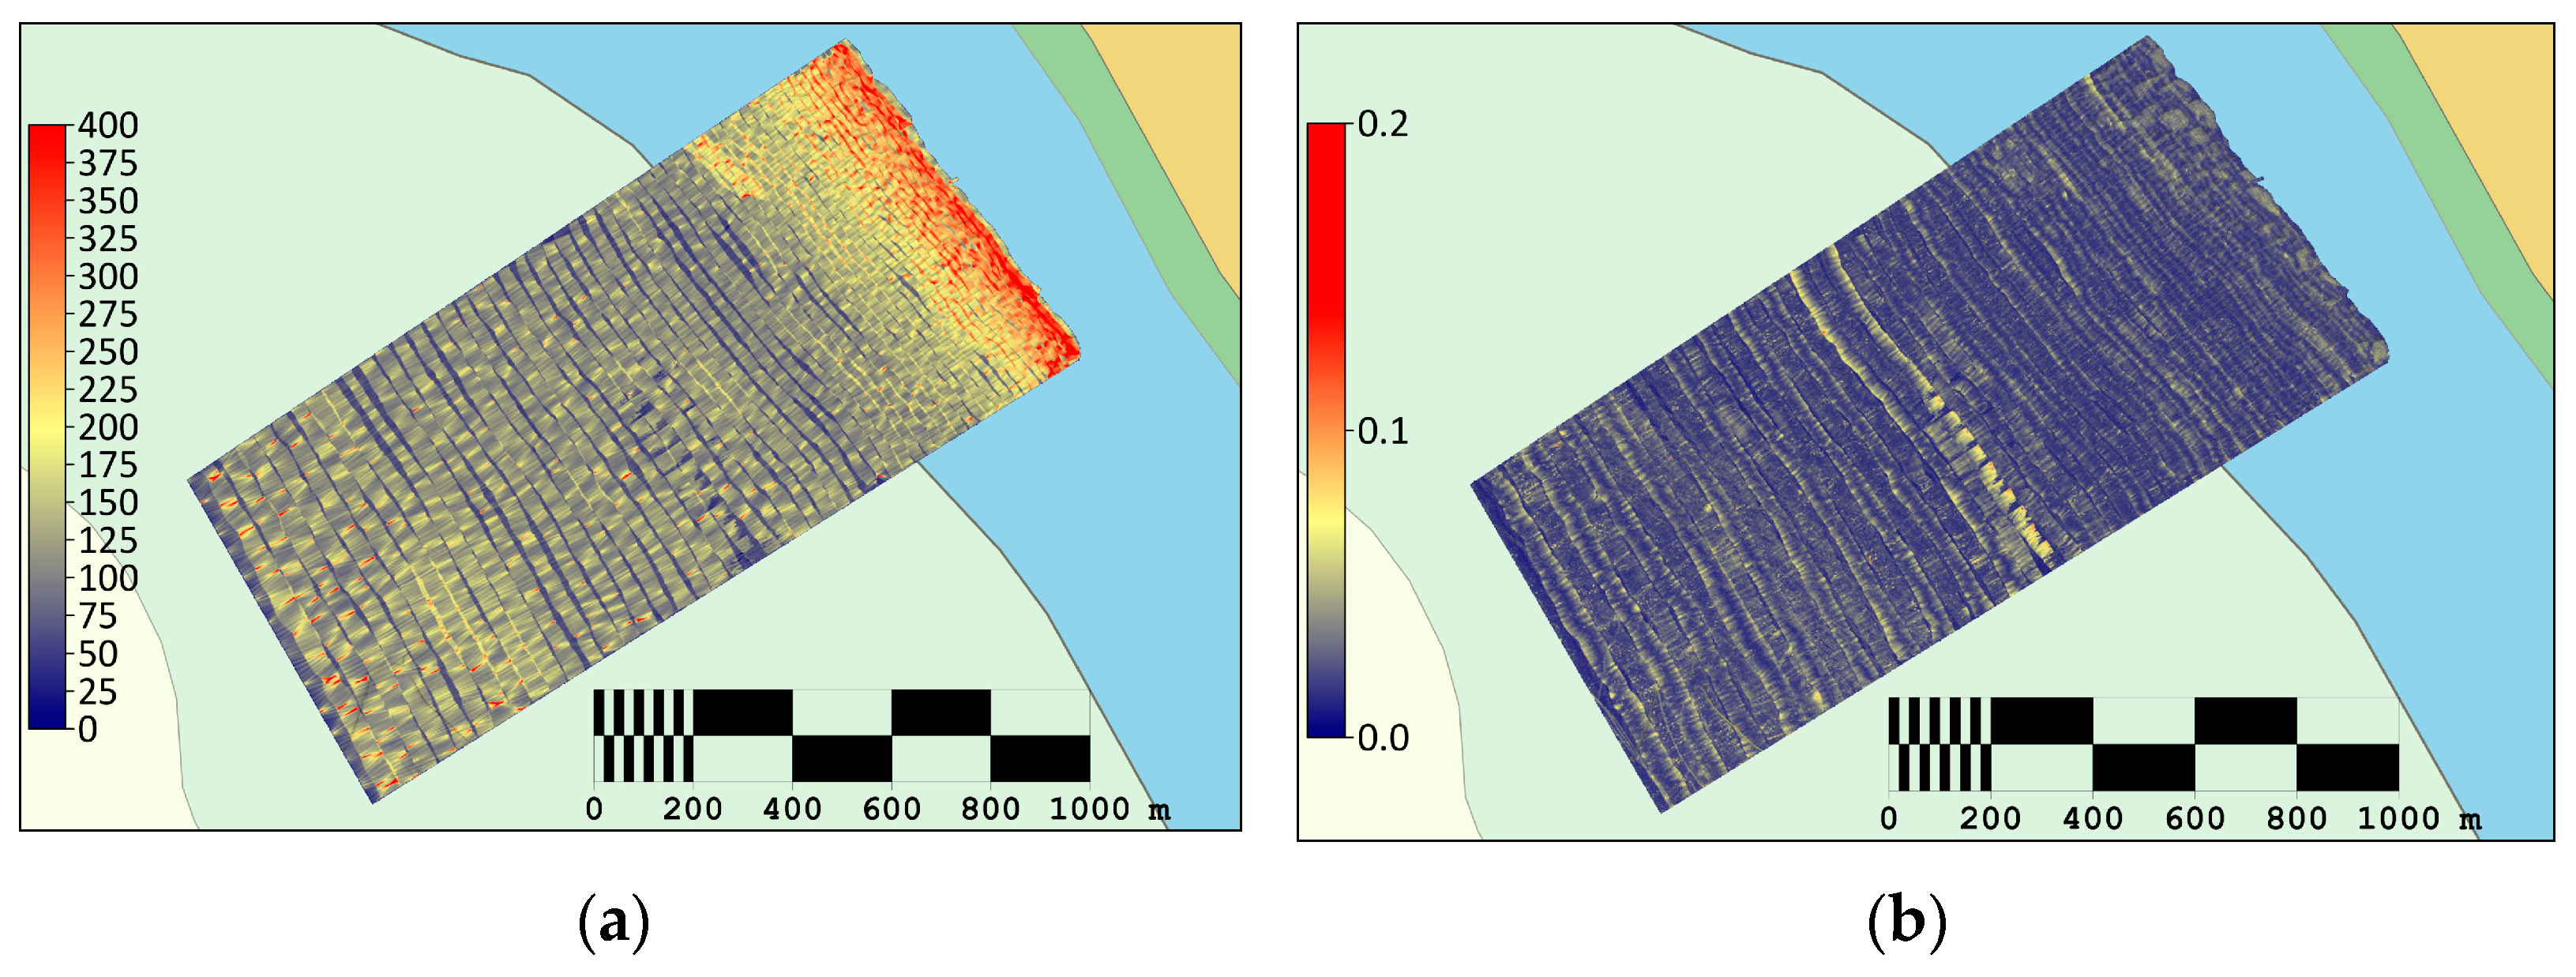
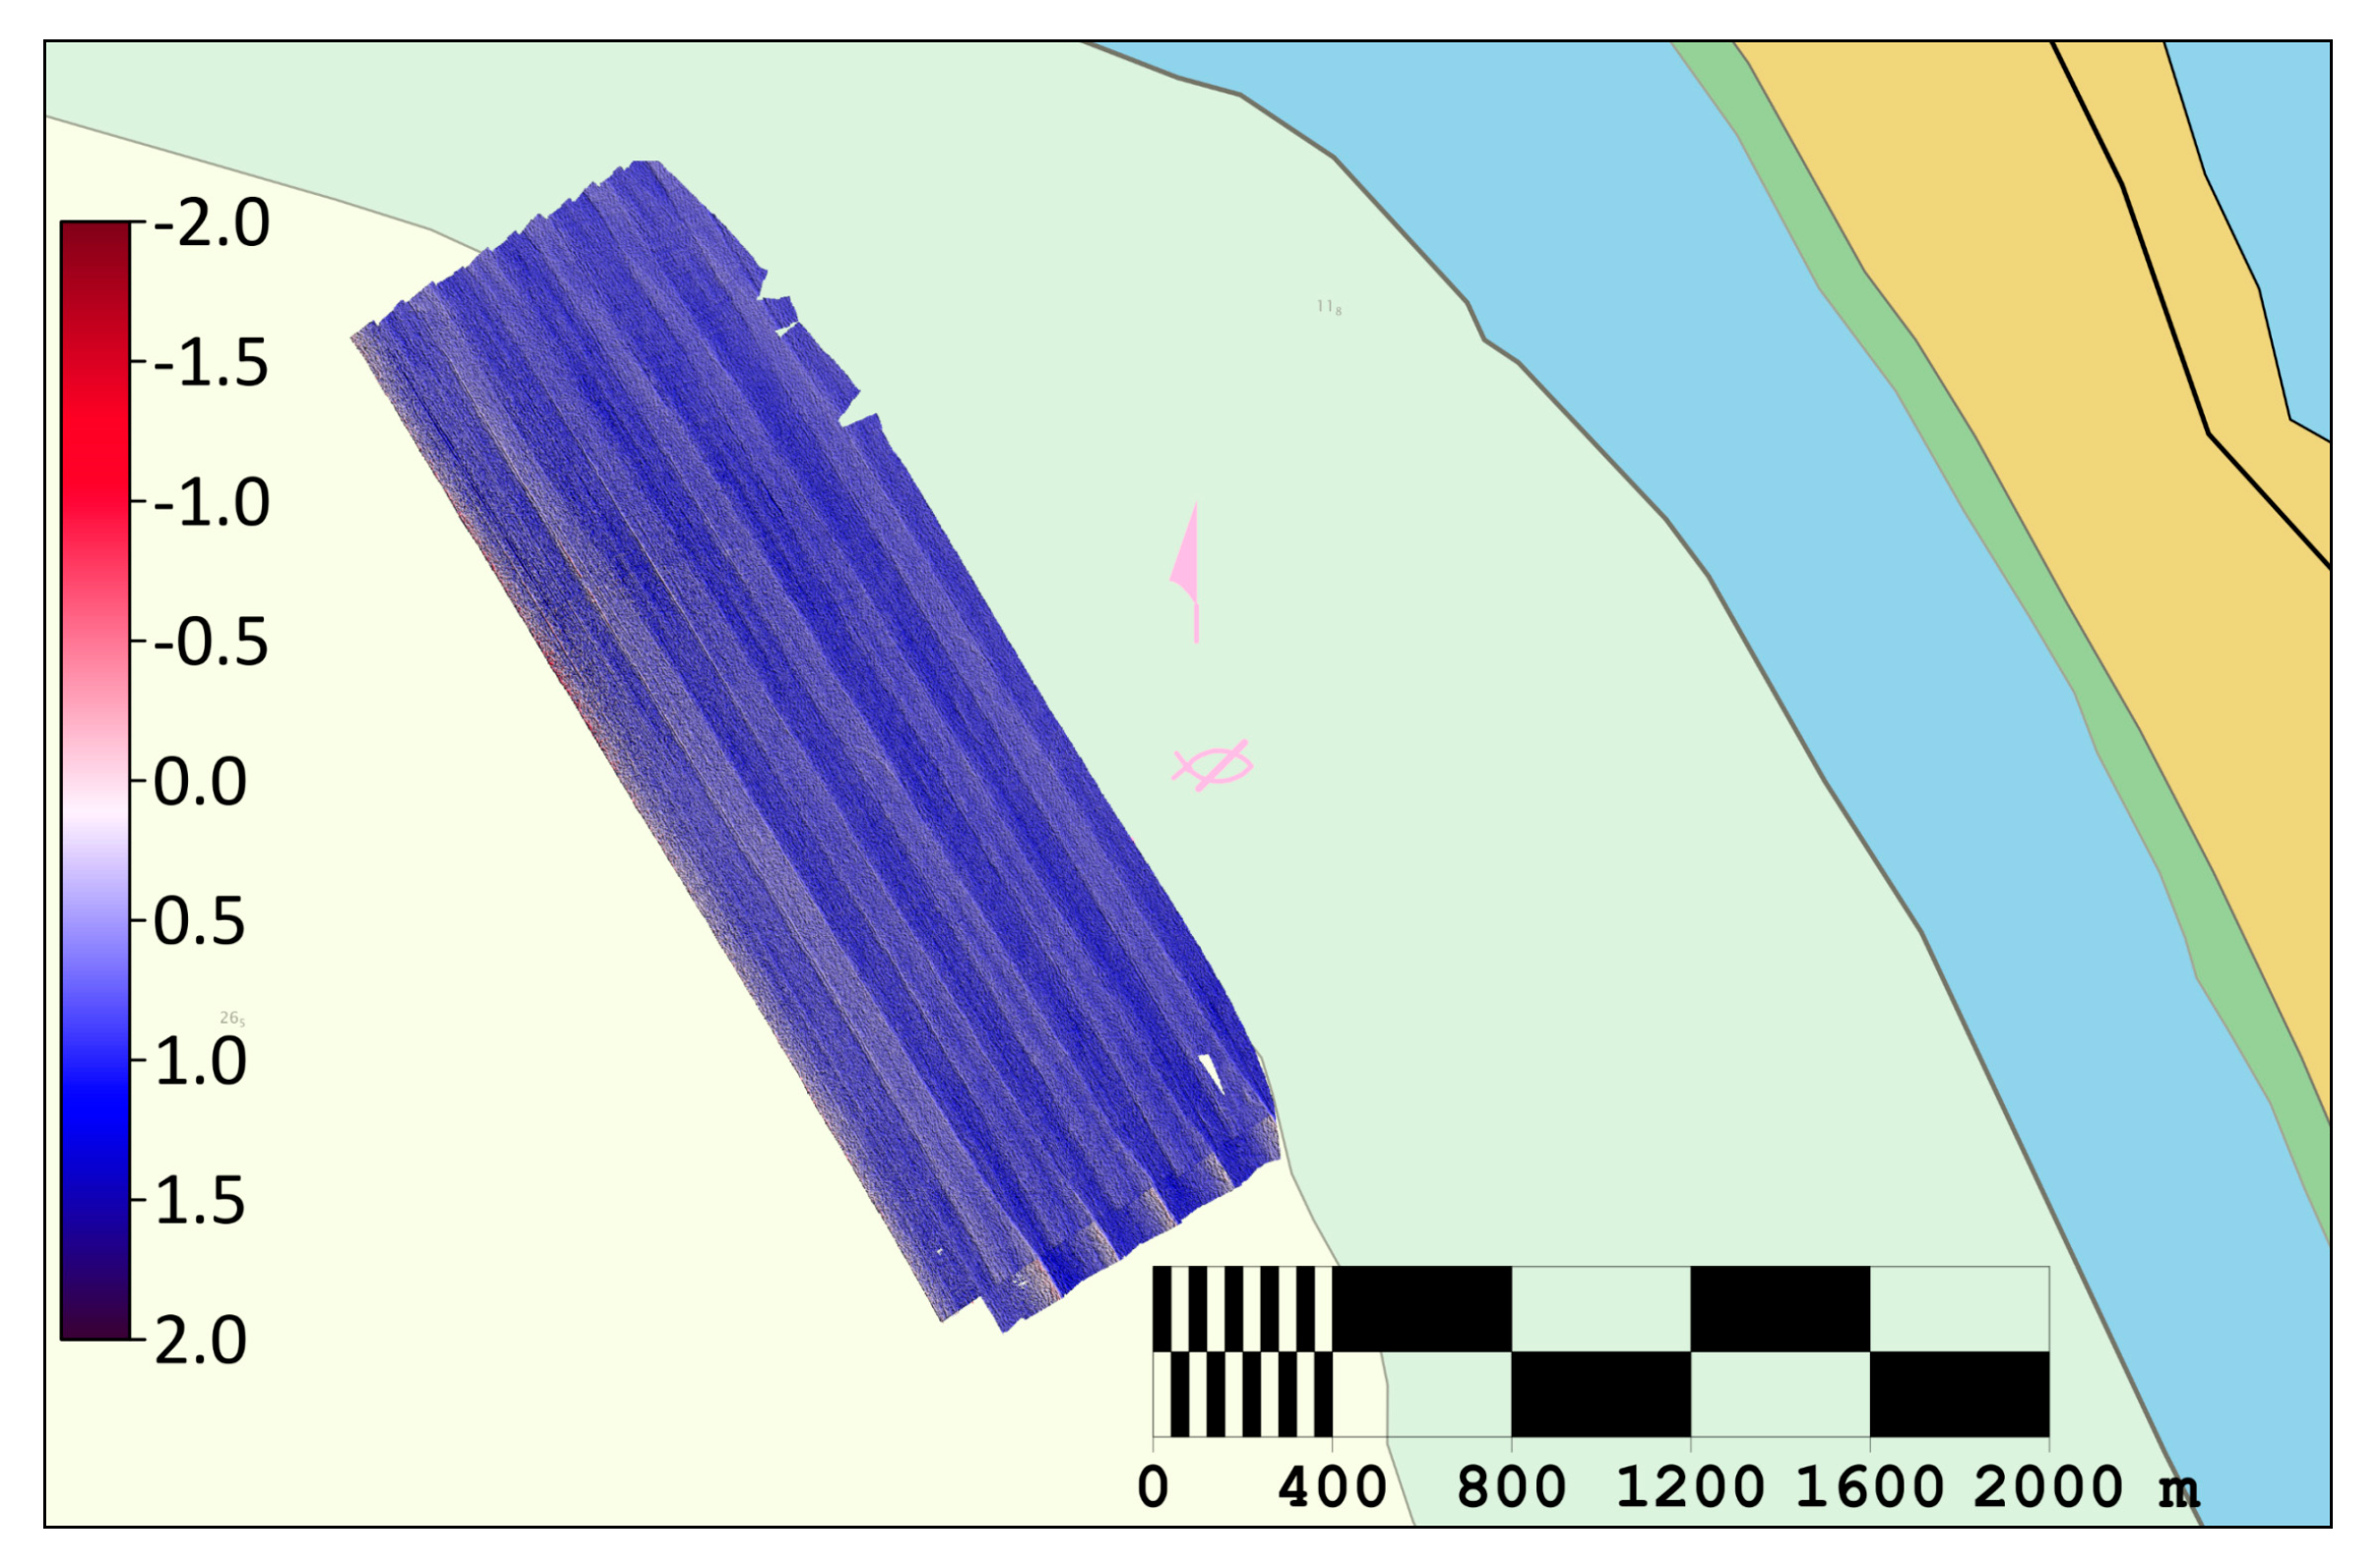
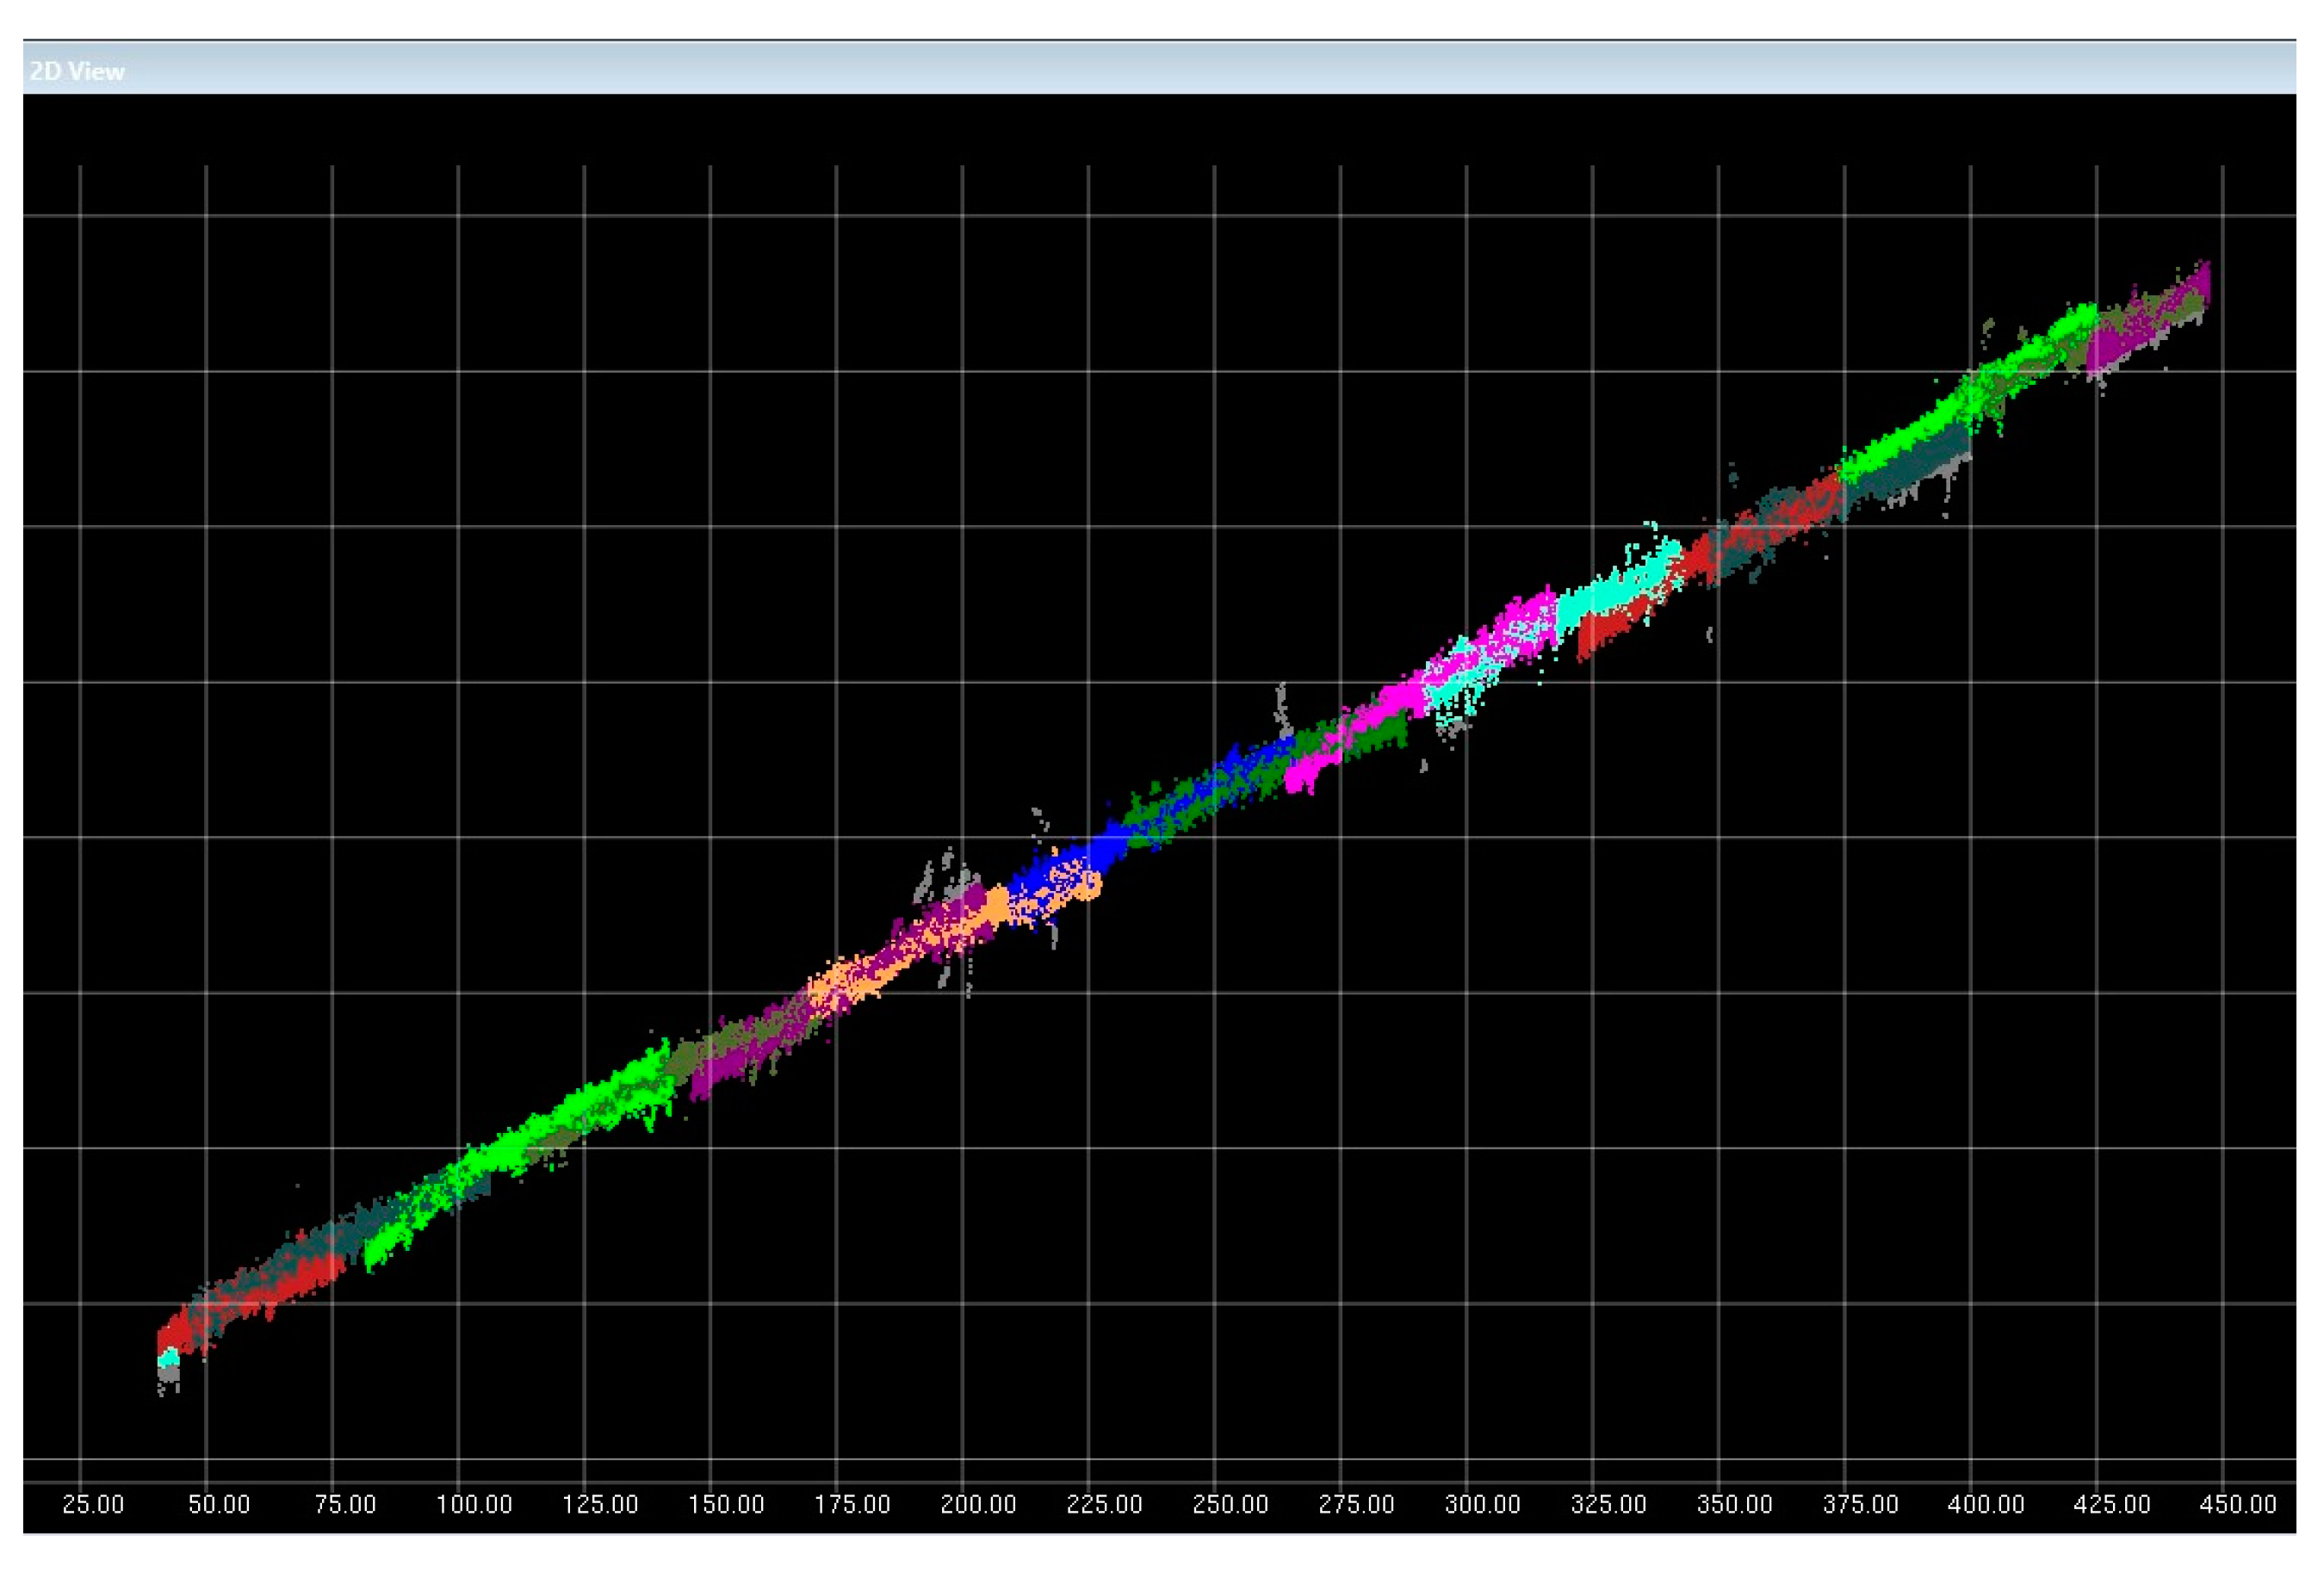
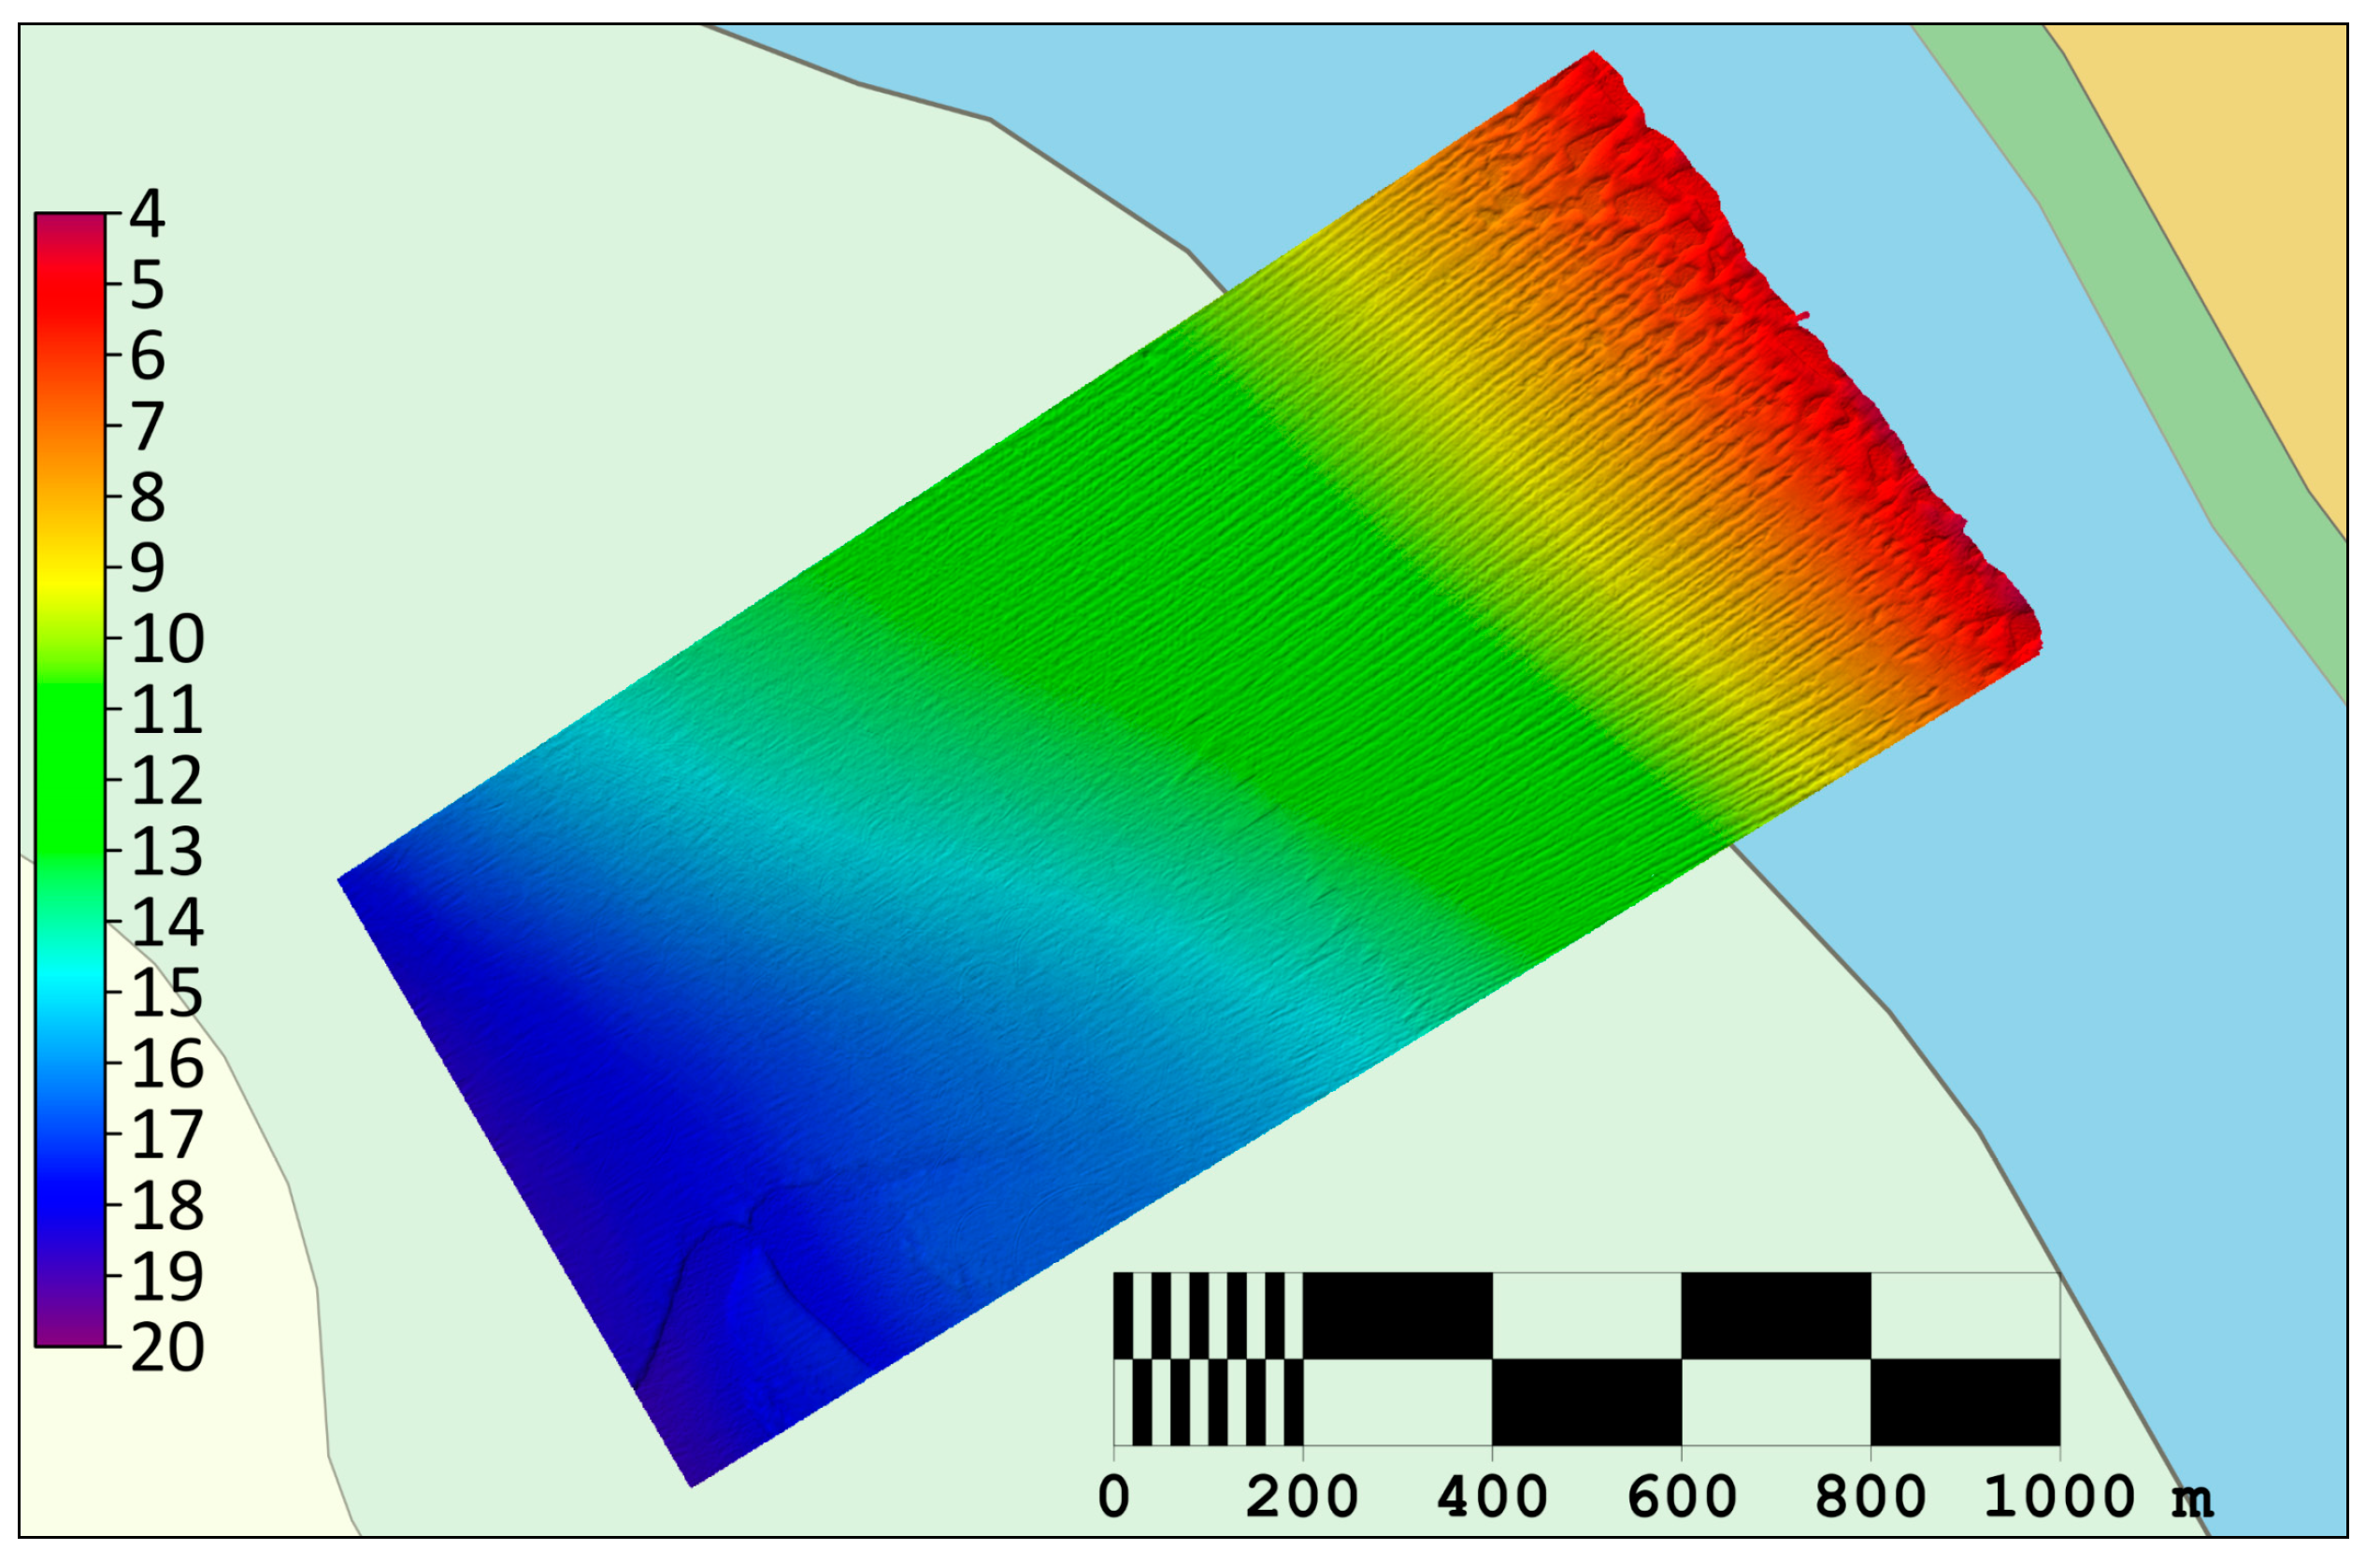
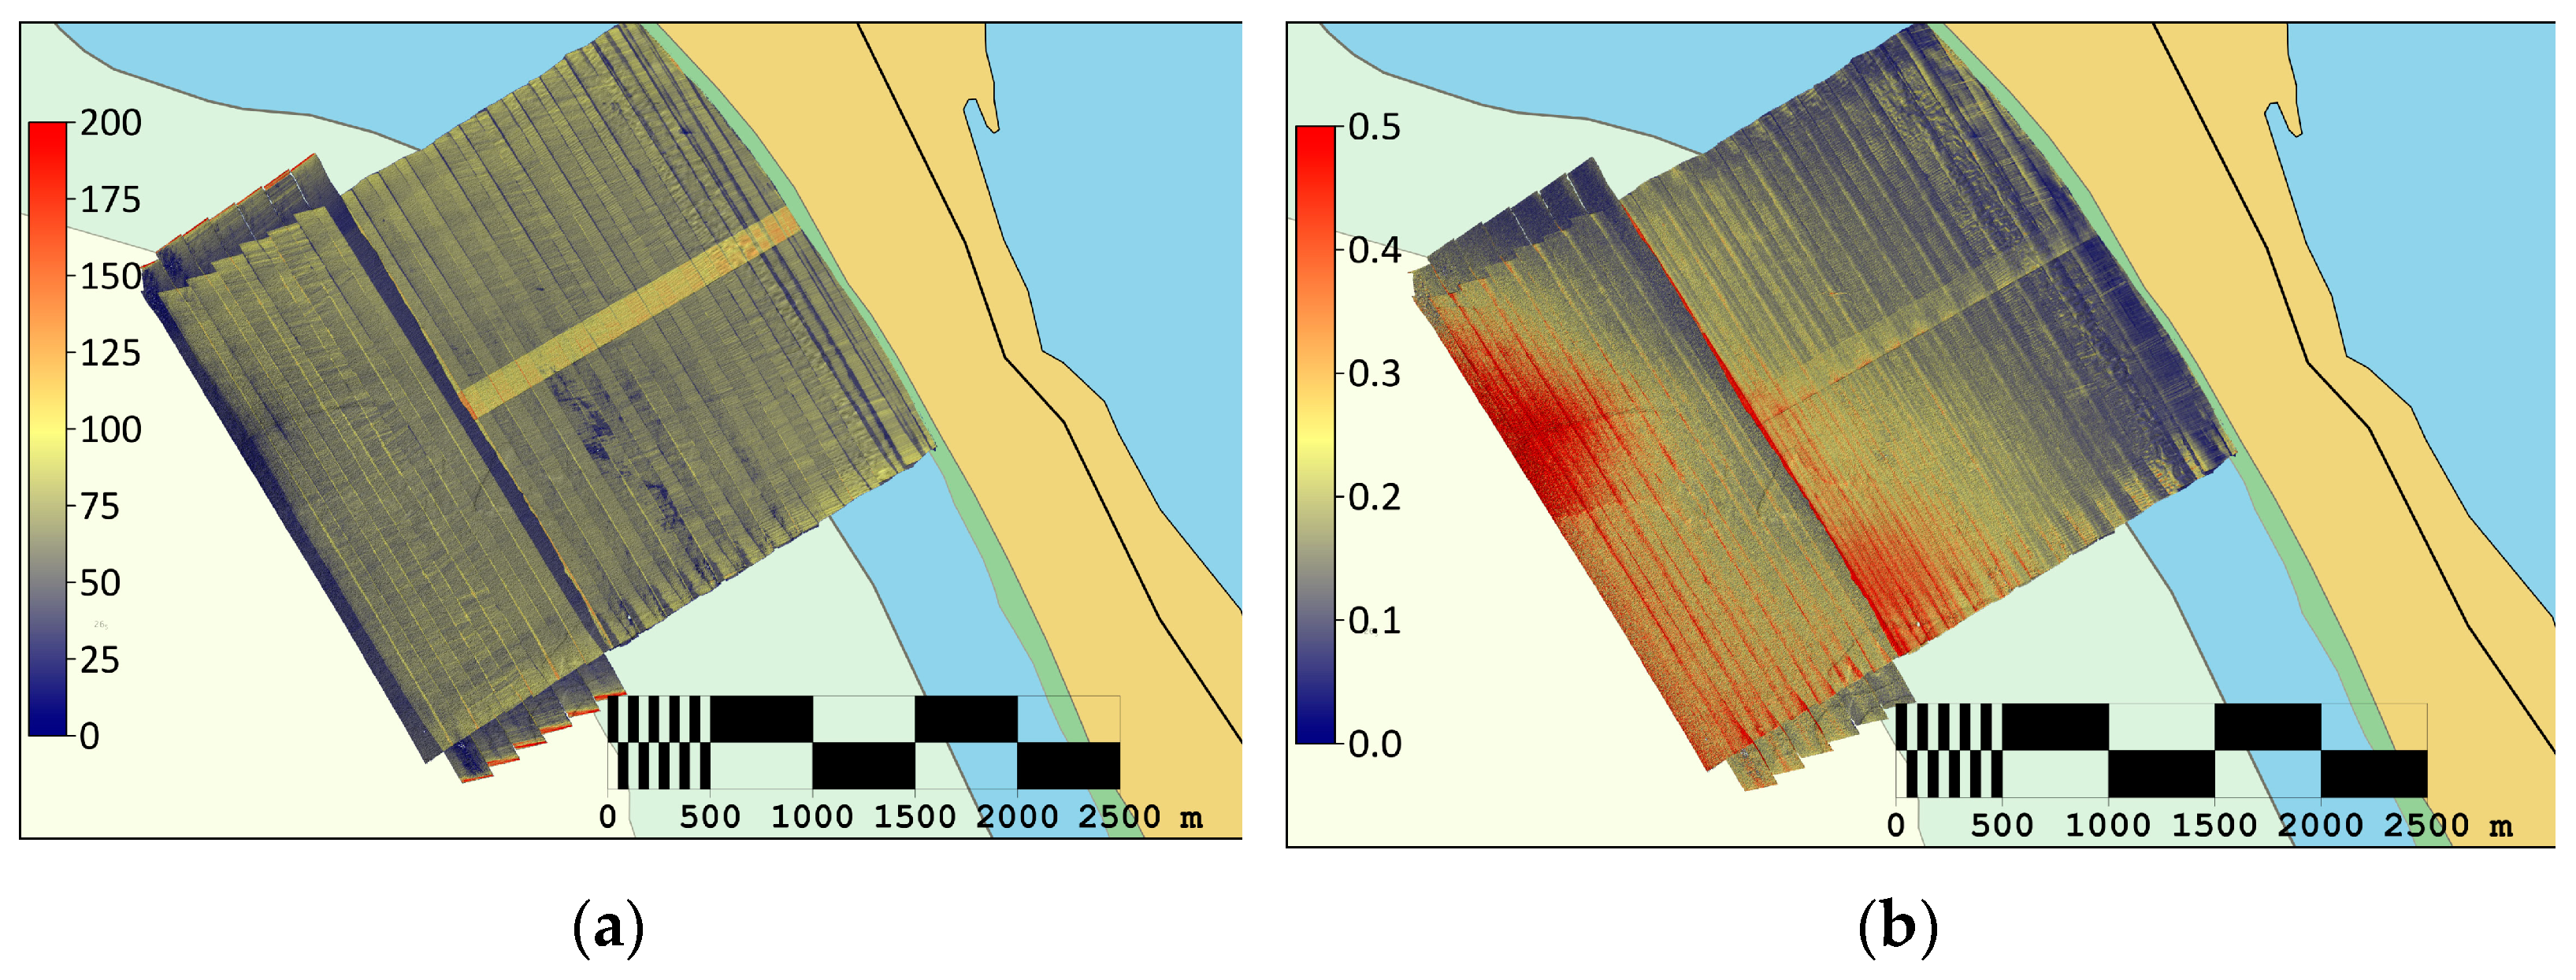
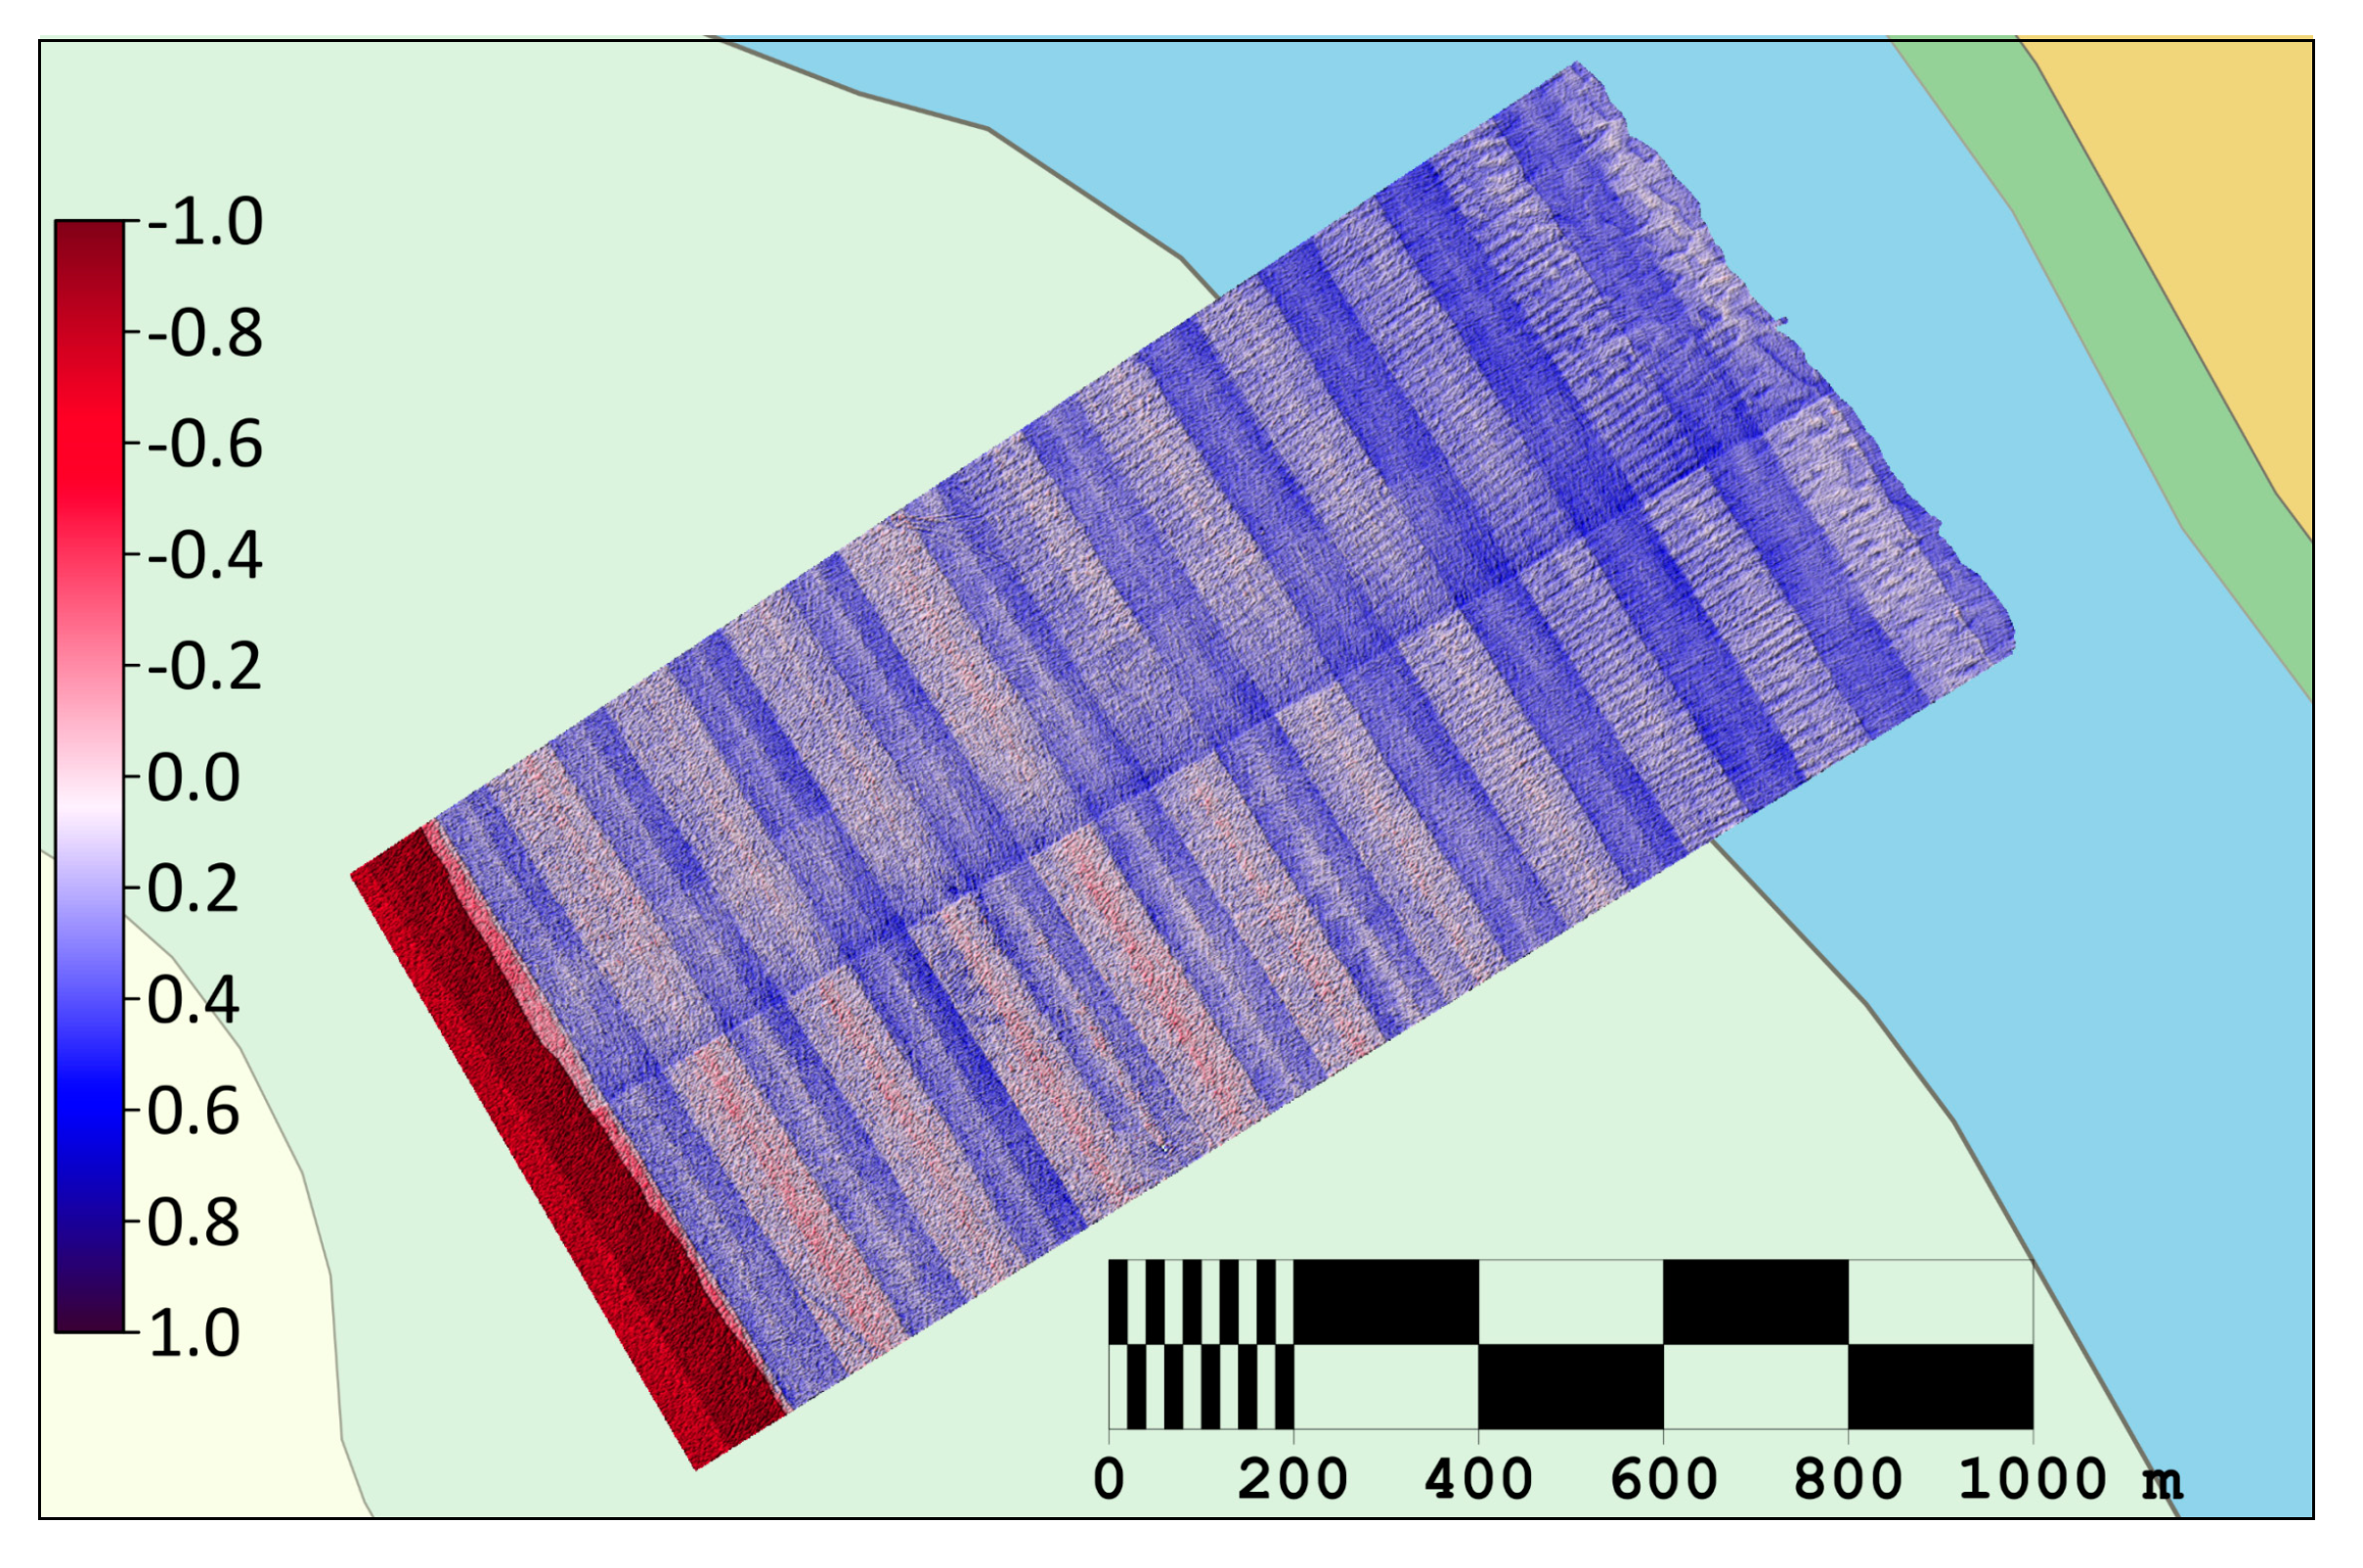
3.2. USV MB Survey Results
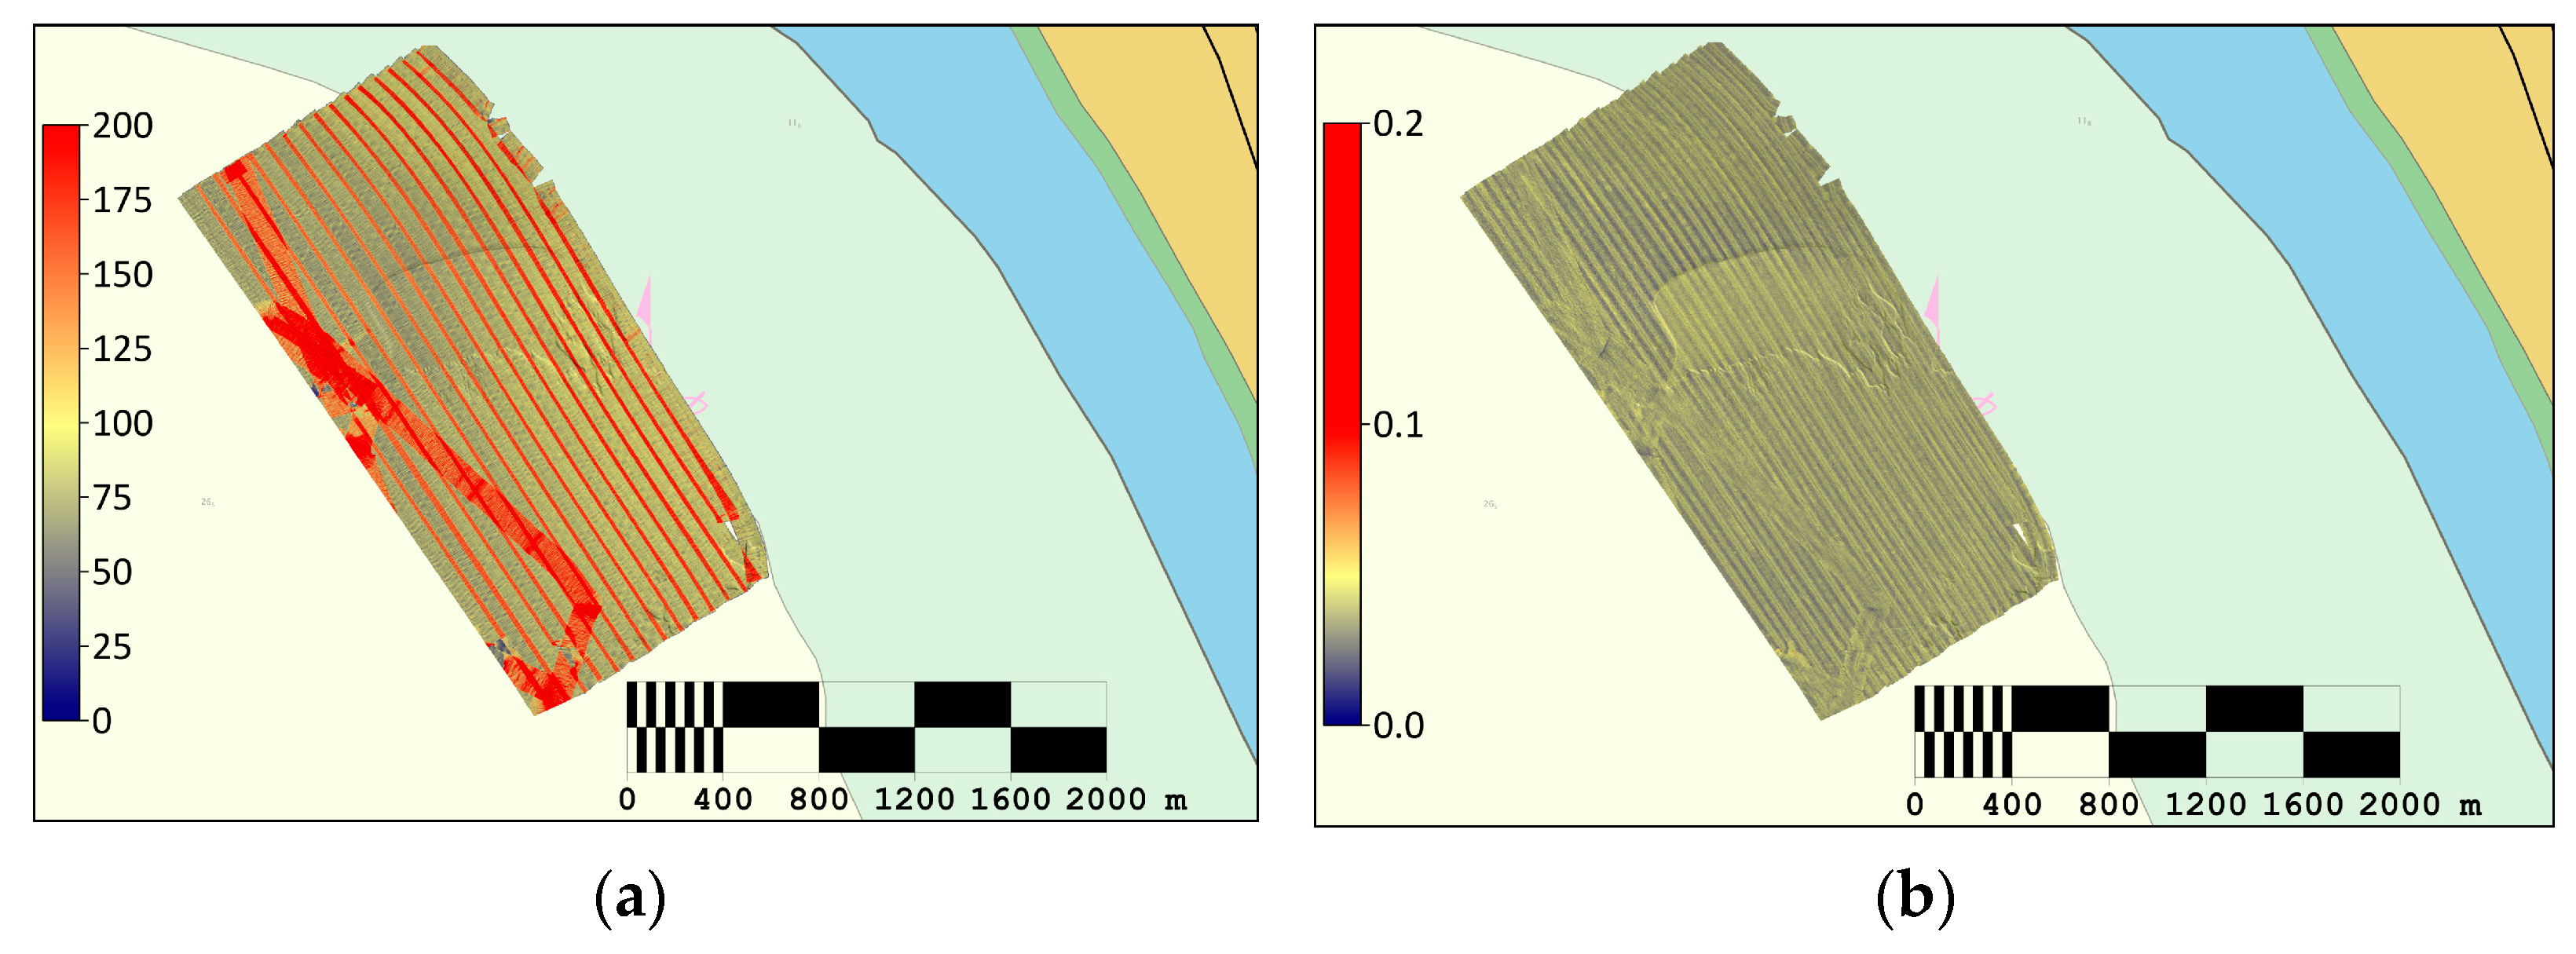
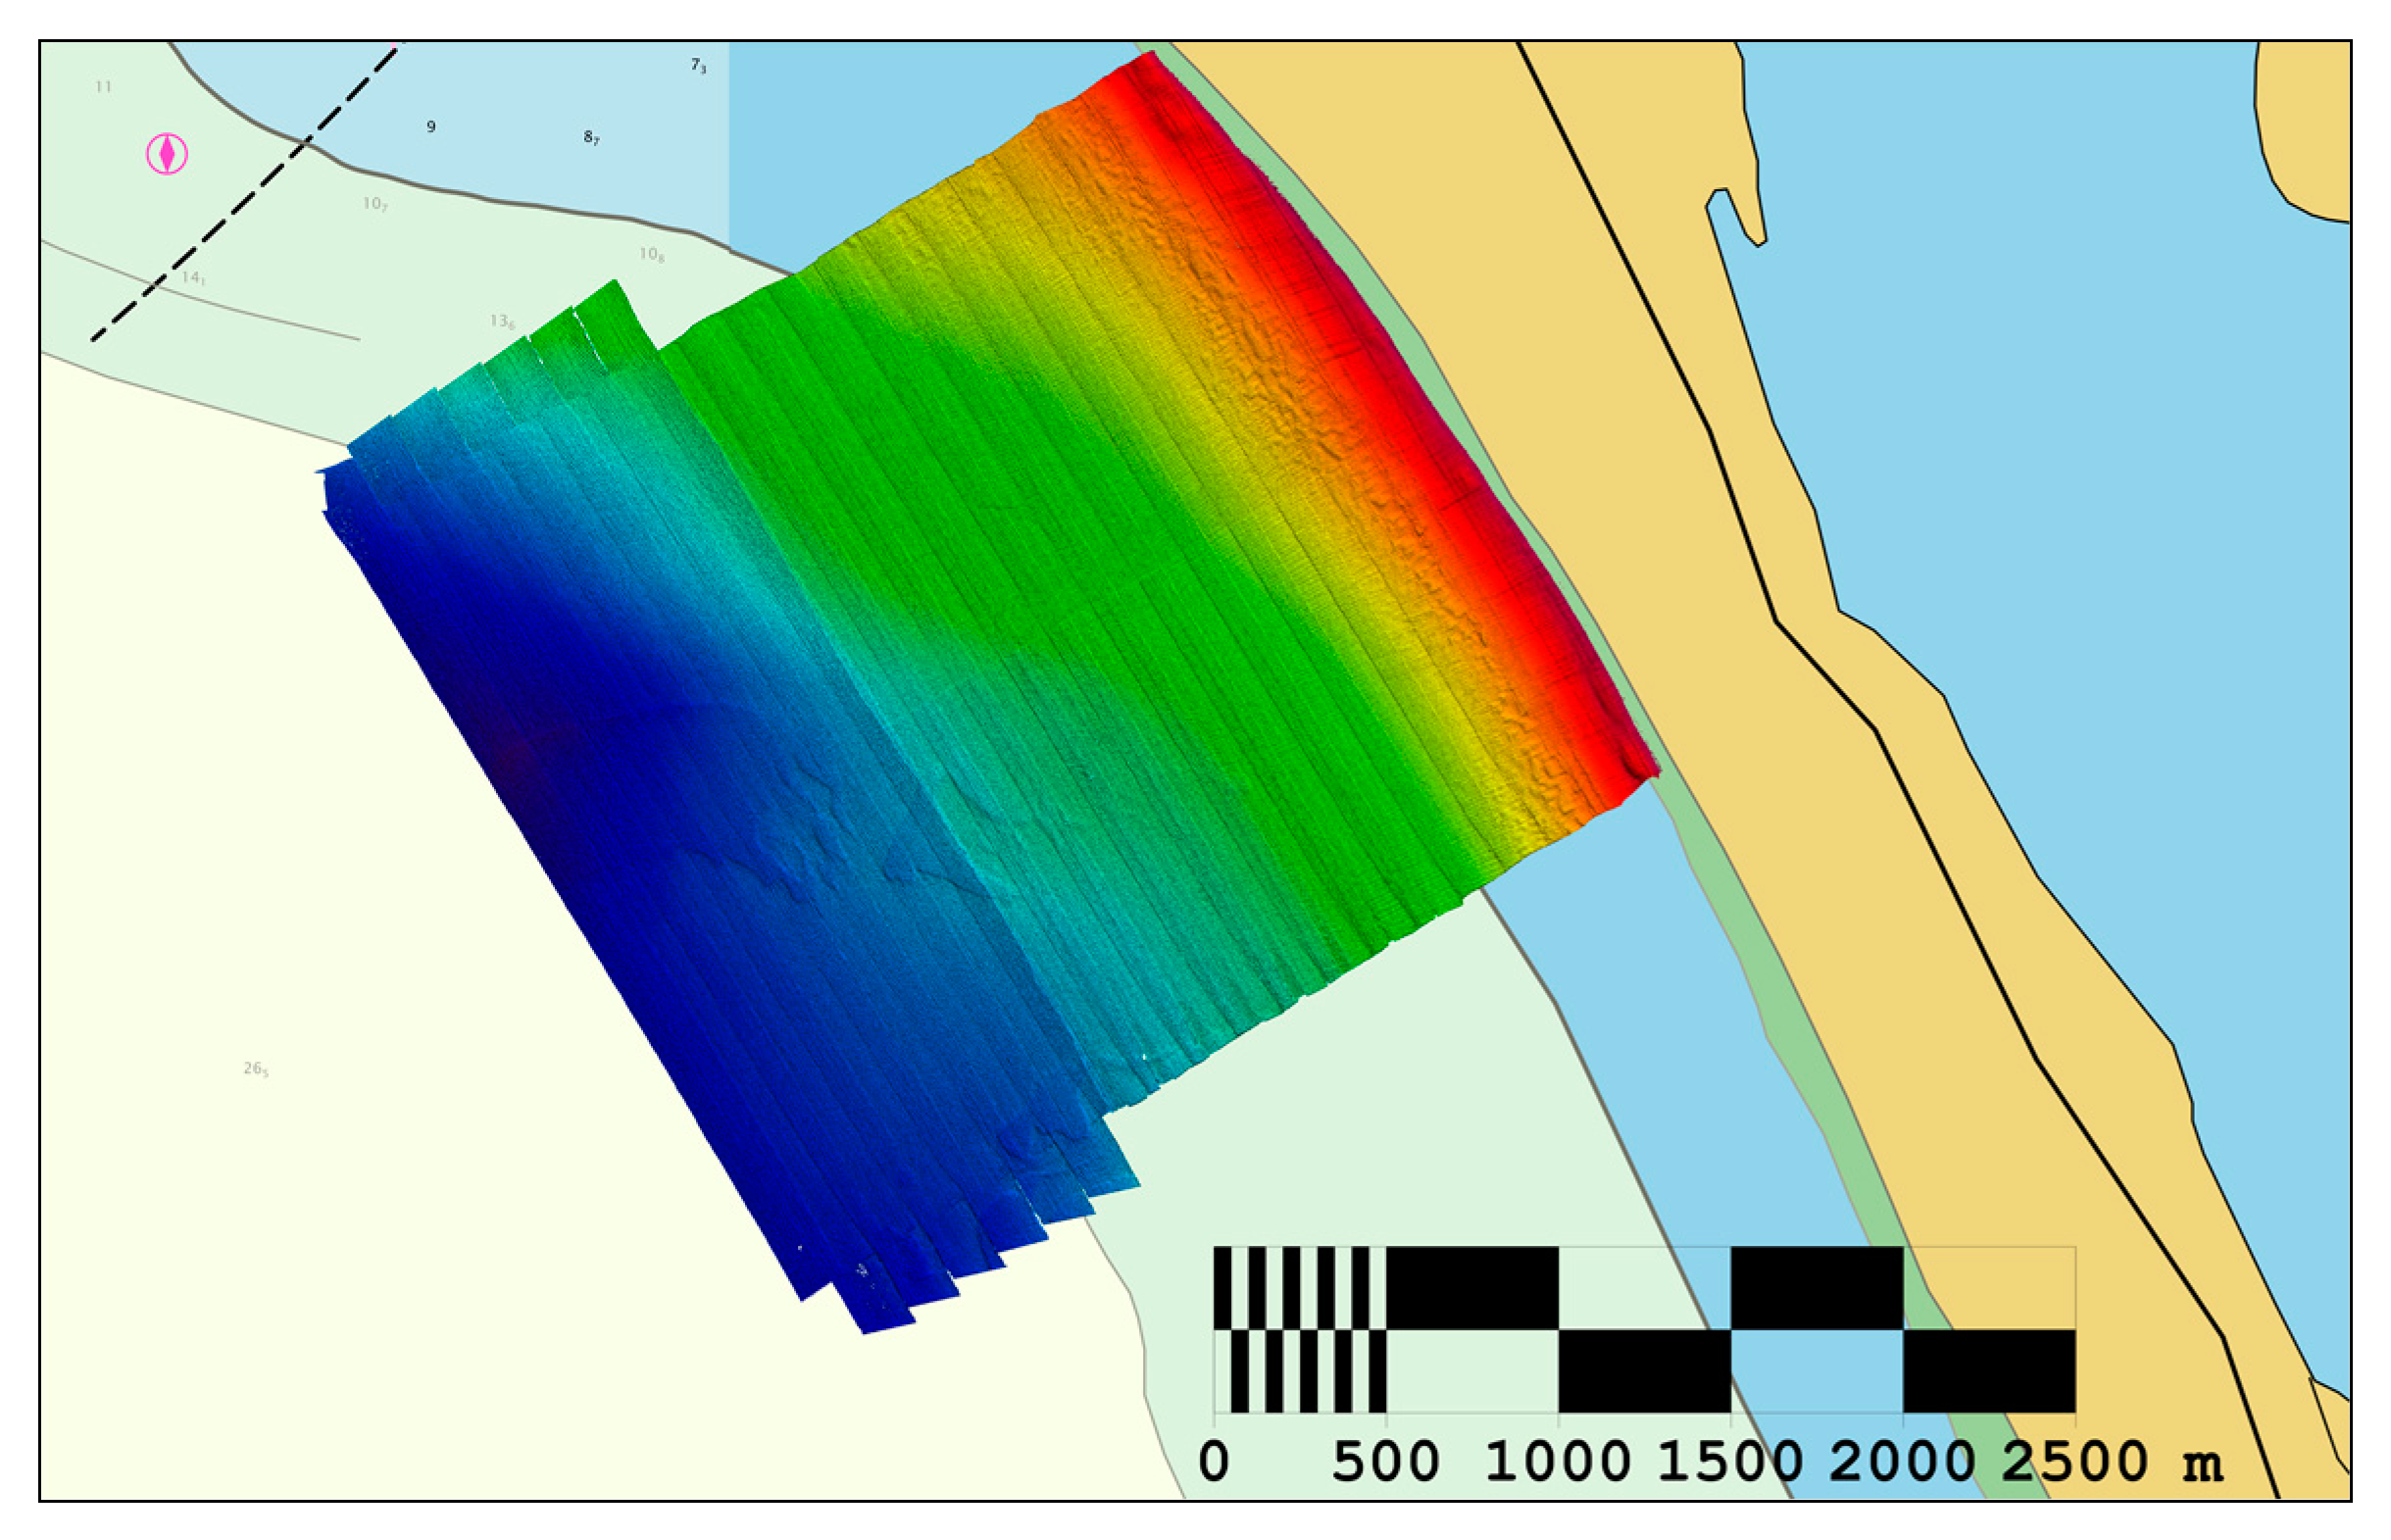
3.3. UAV LiDAR Survey Results
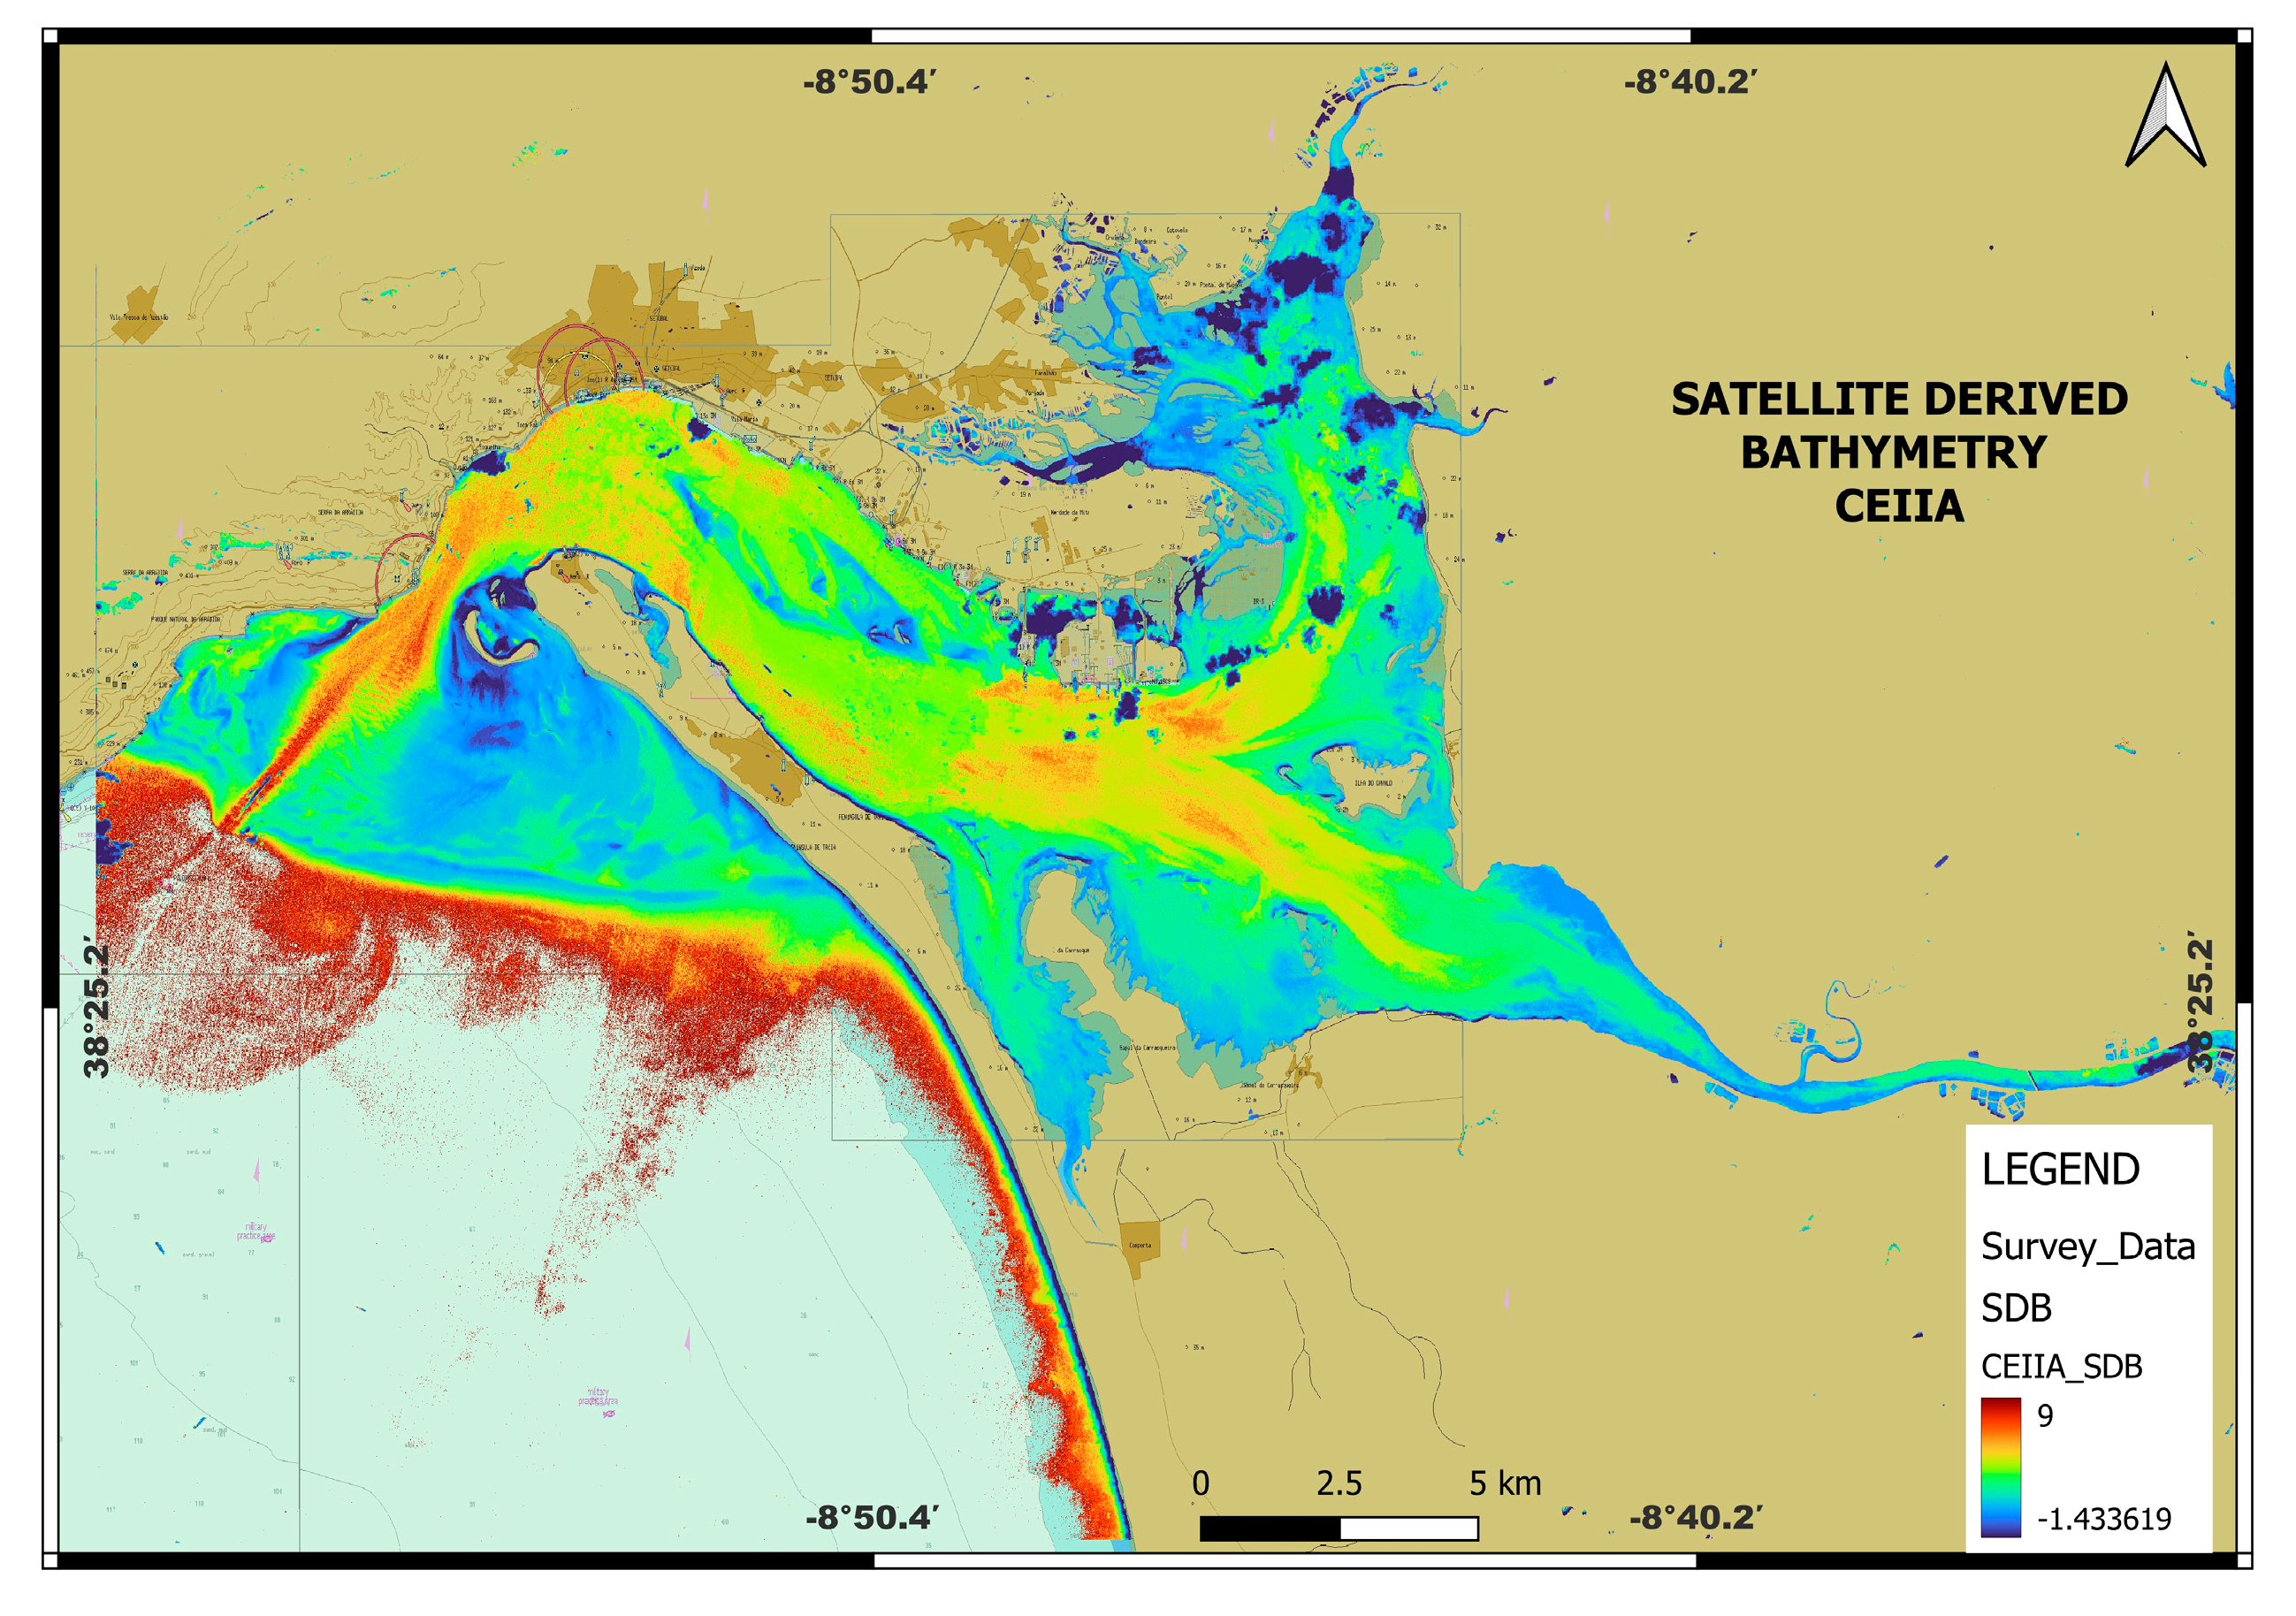
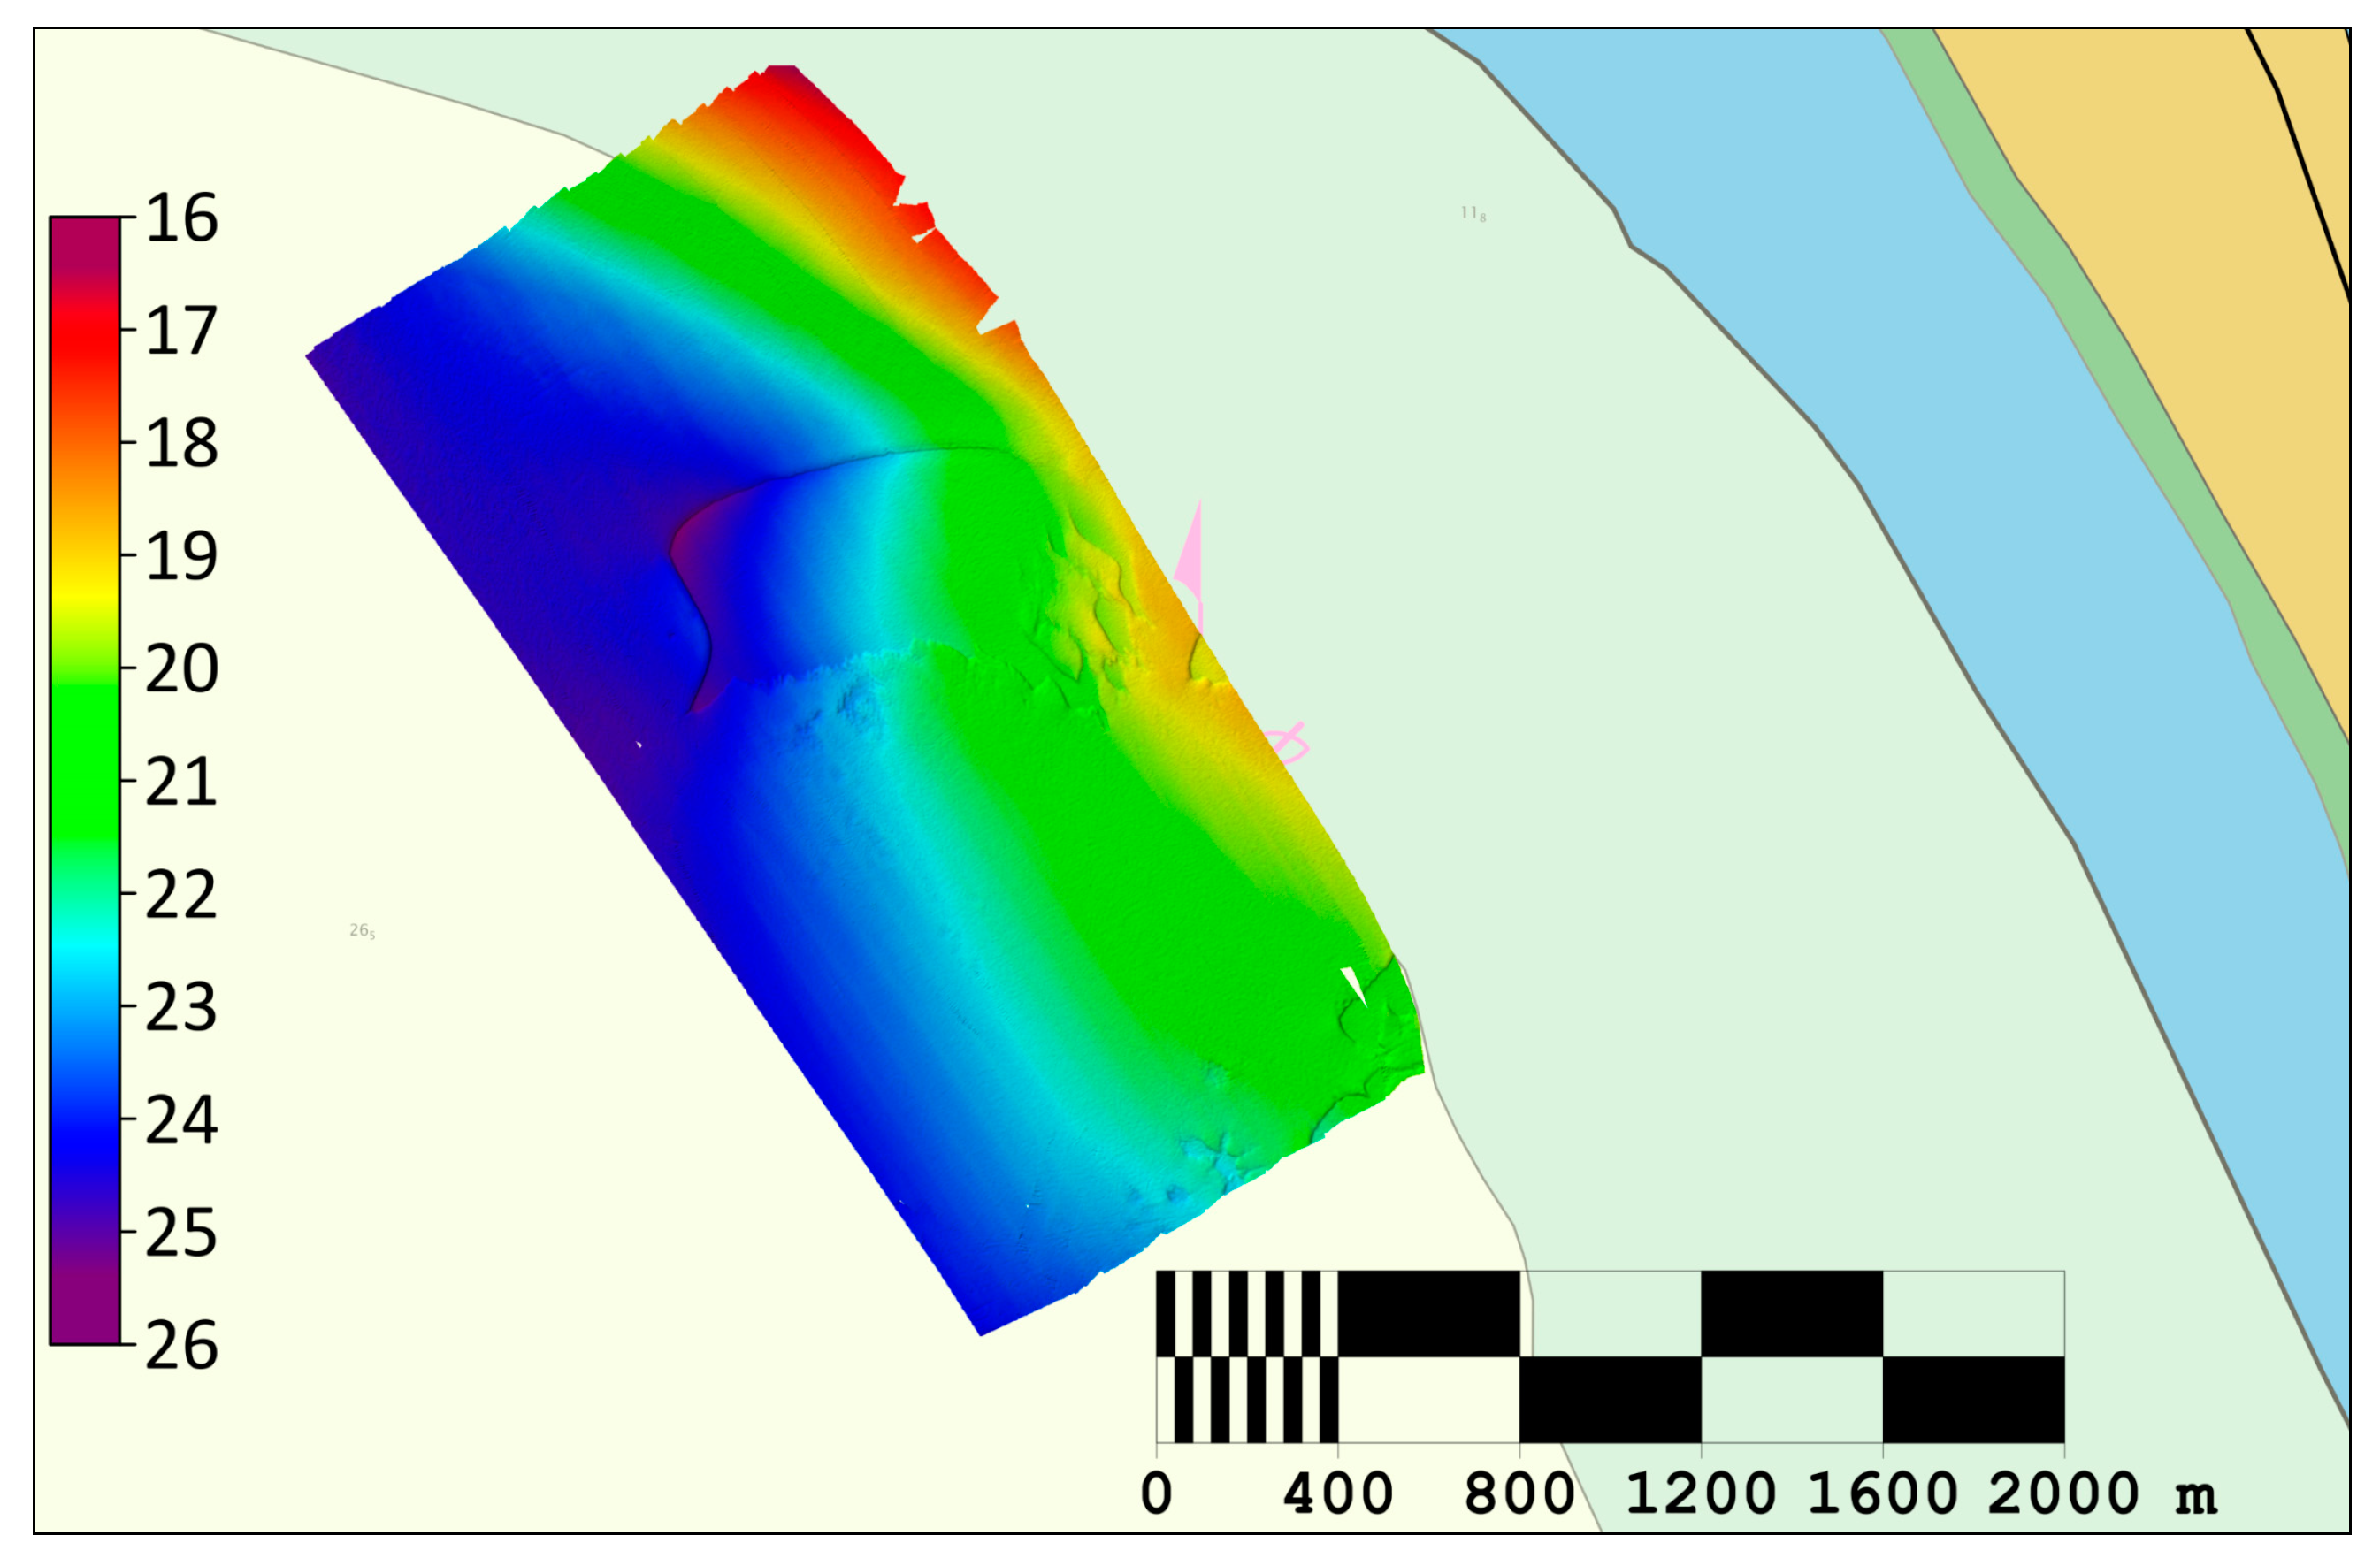
3.4. SDB Results
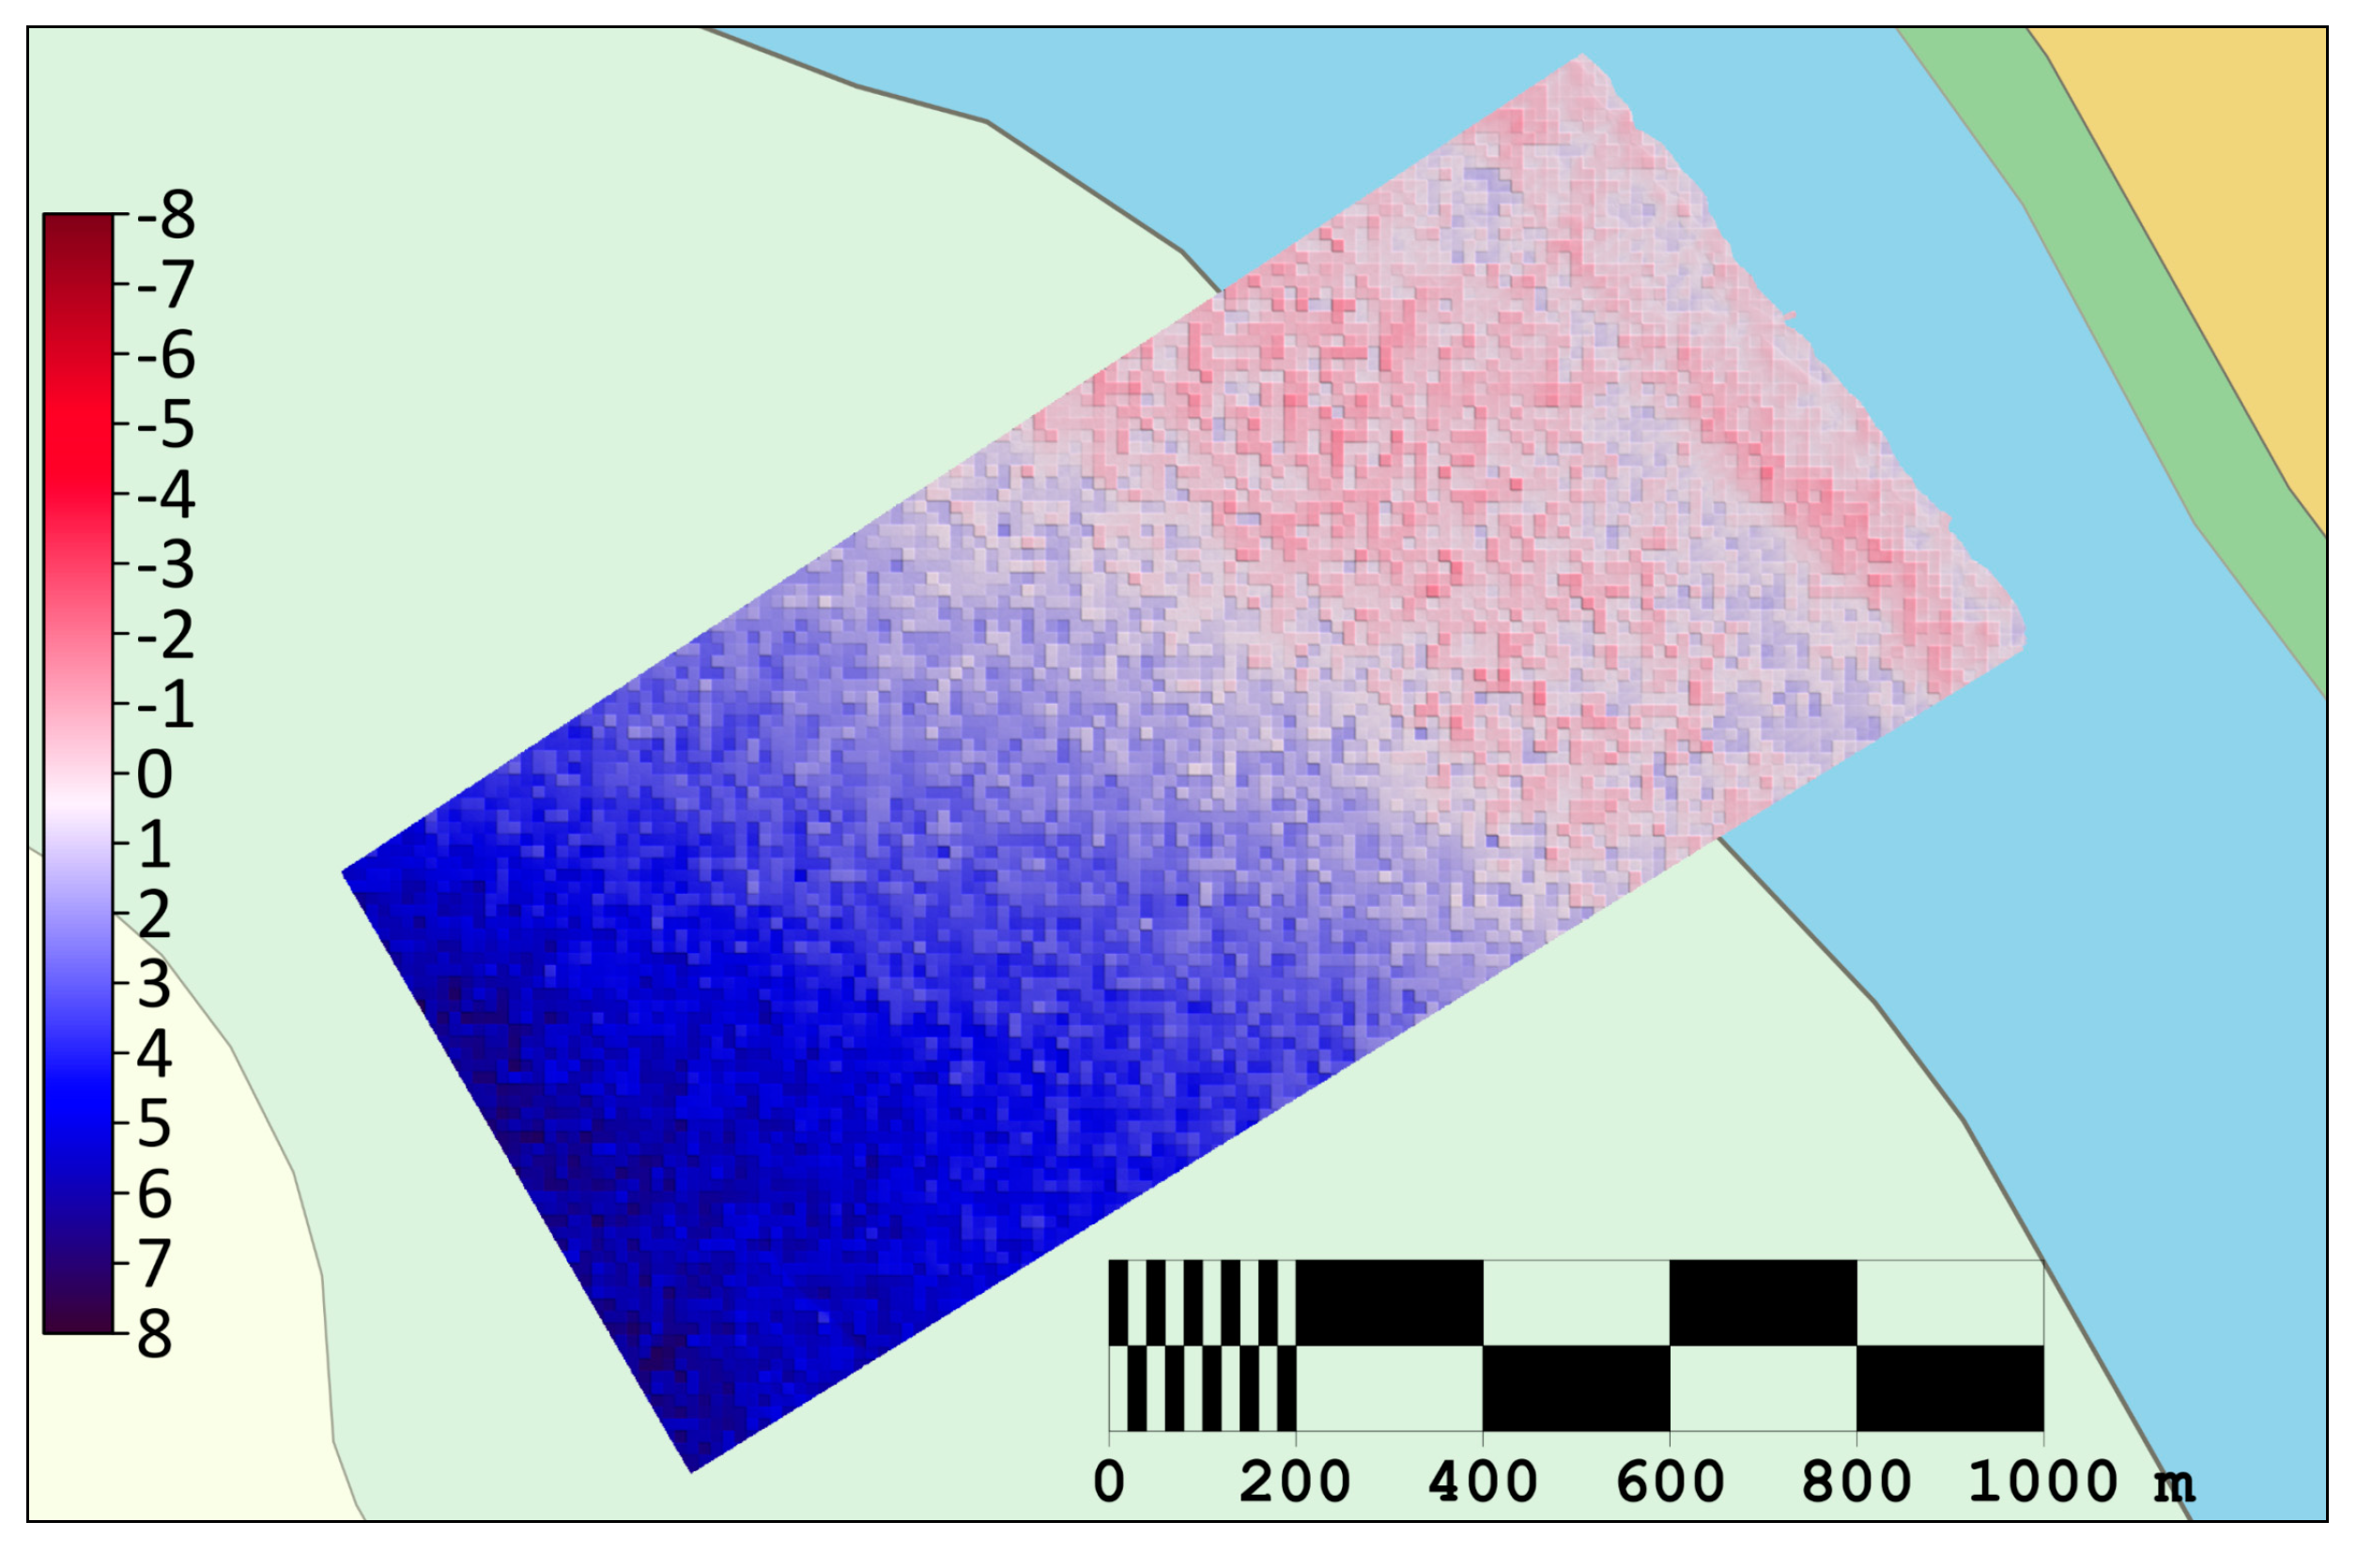
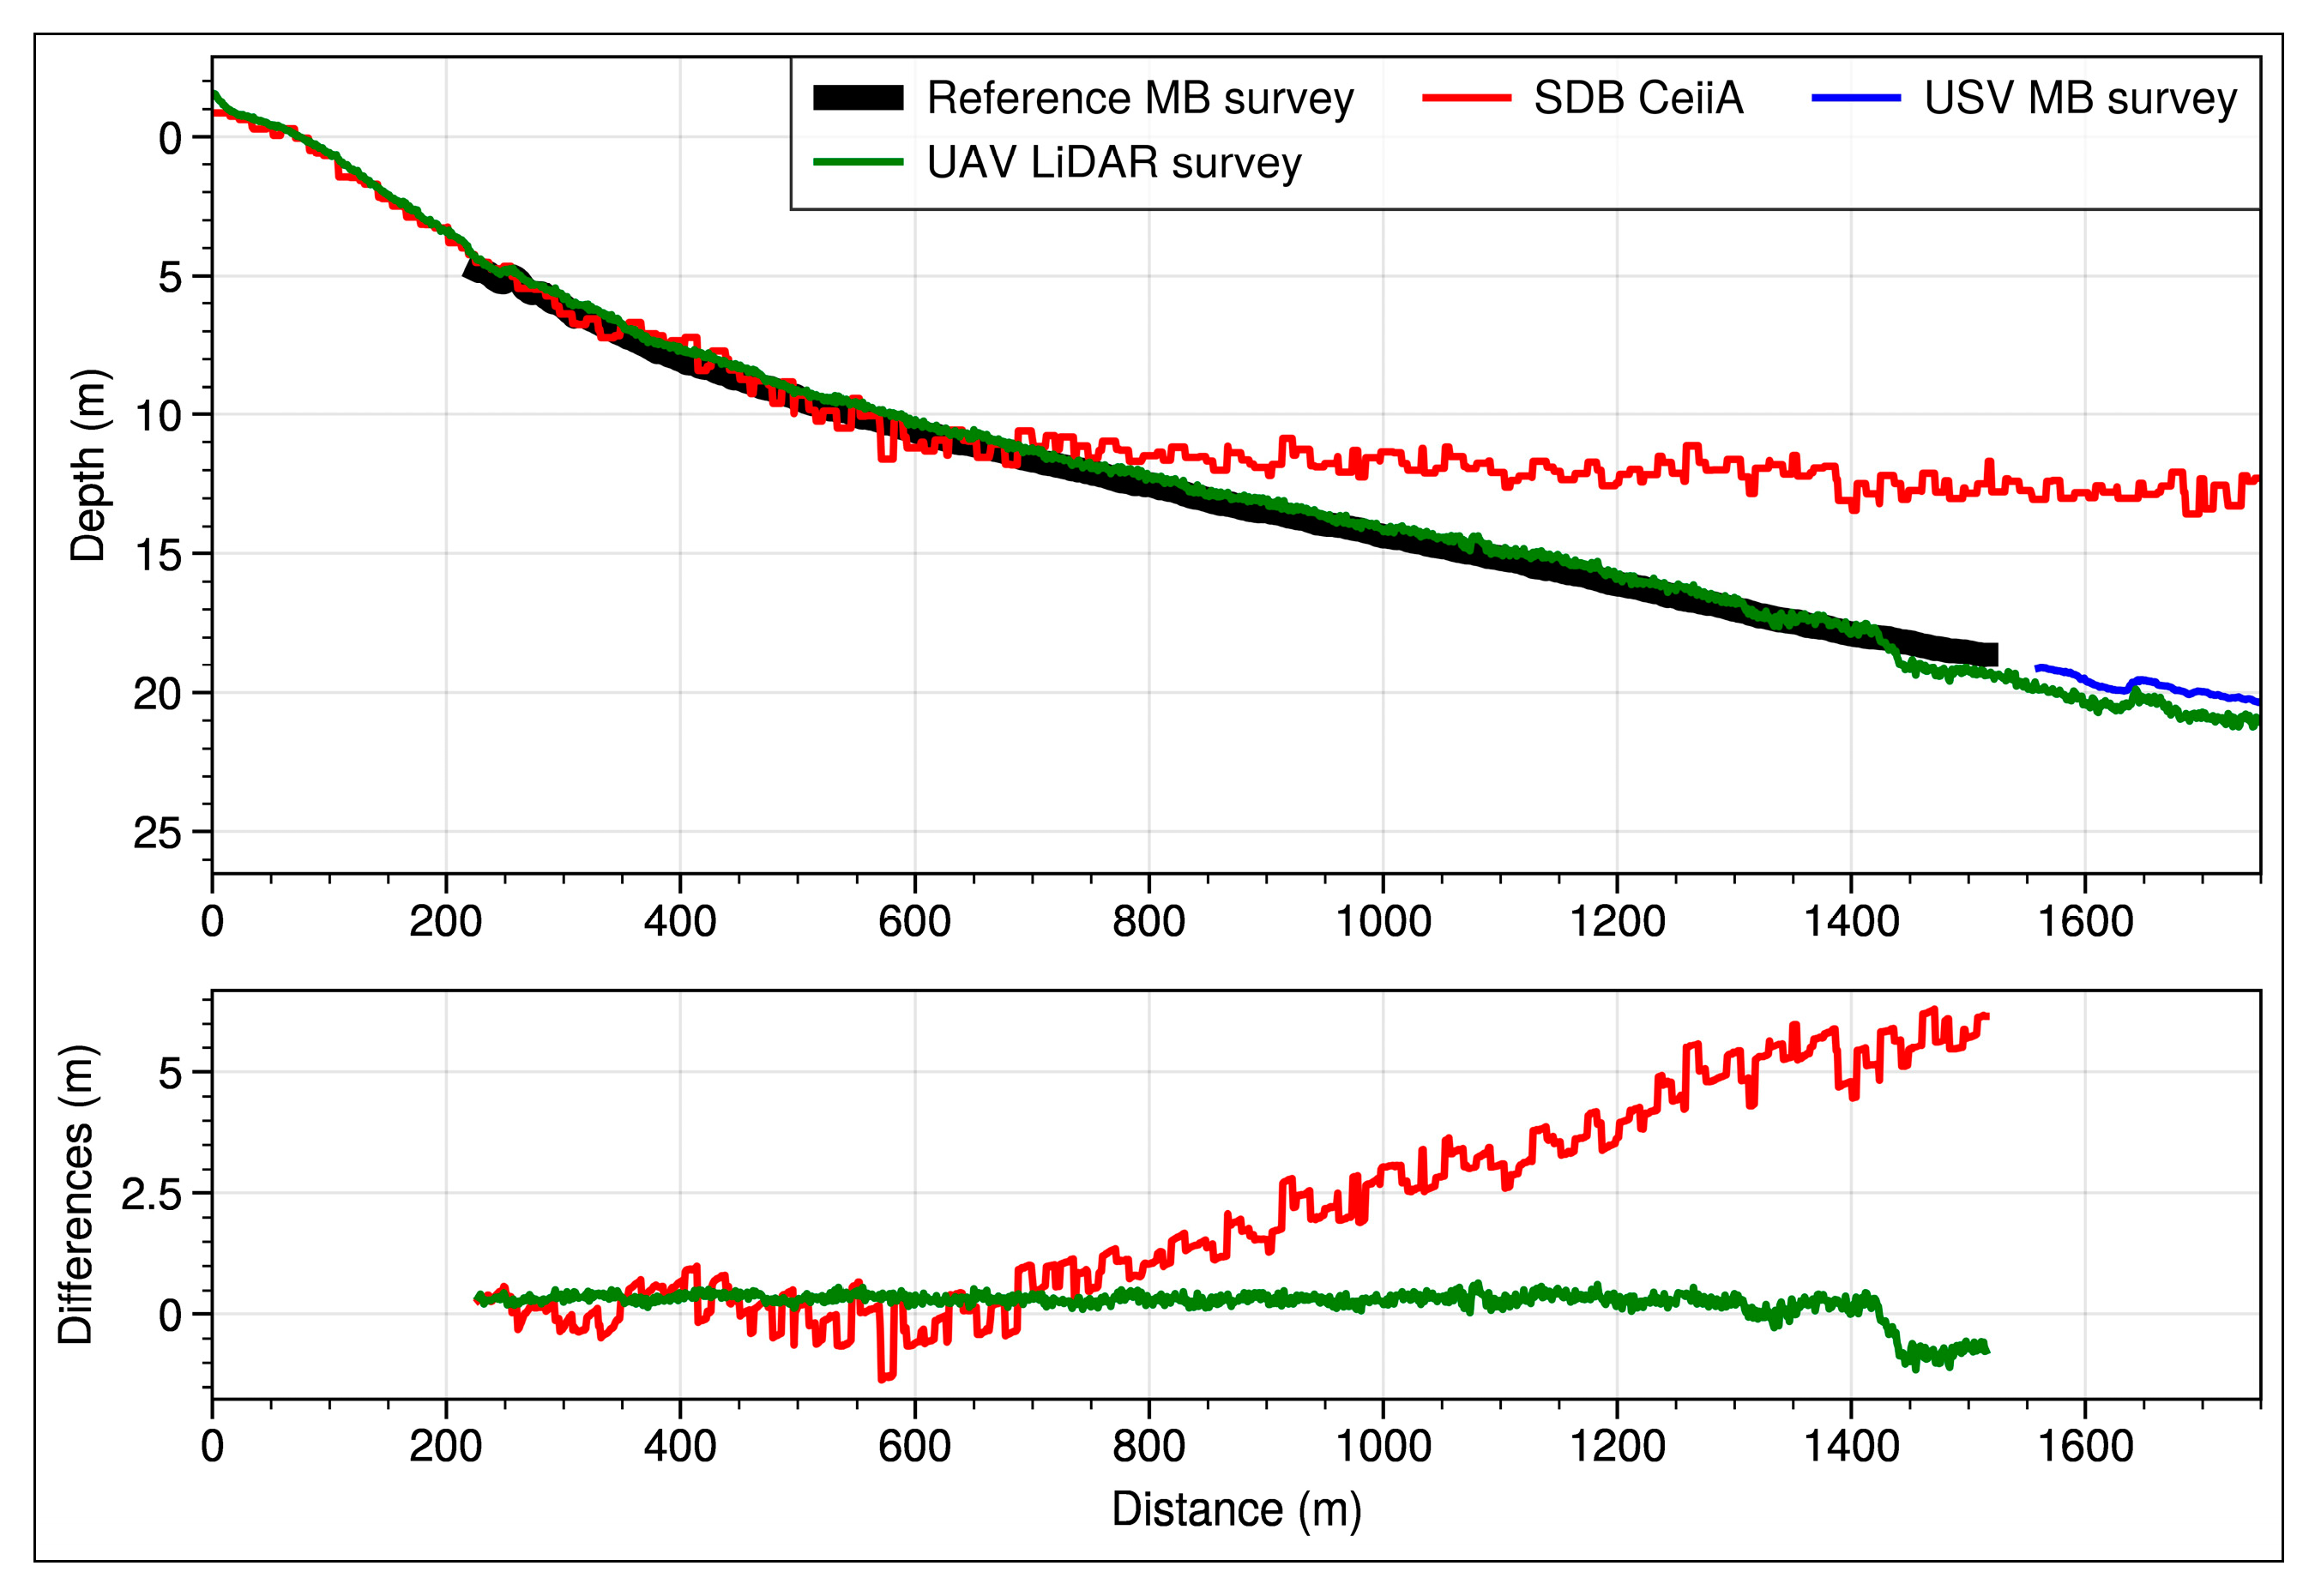
3.5. Dataset Comparison
3.5.1. Horizontal Accuracy Comparison
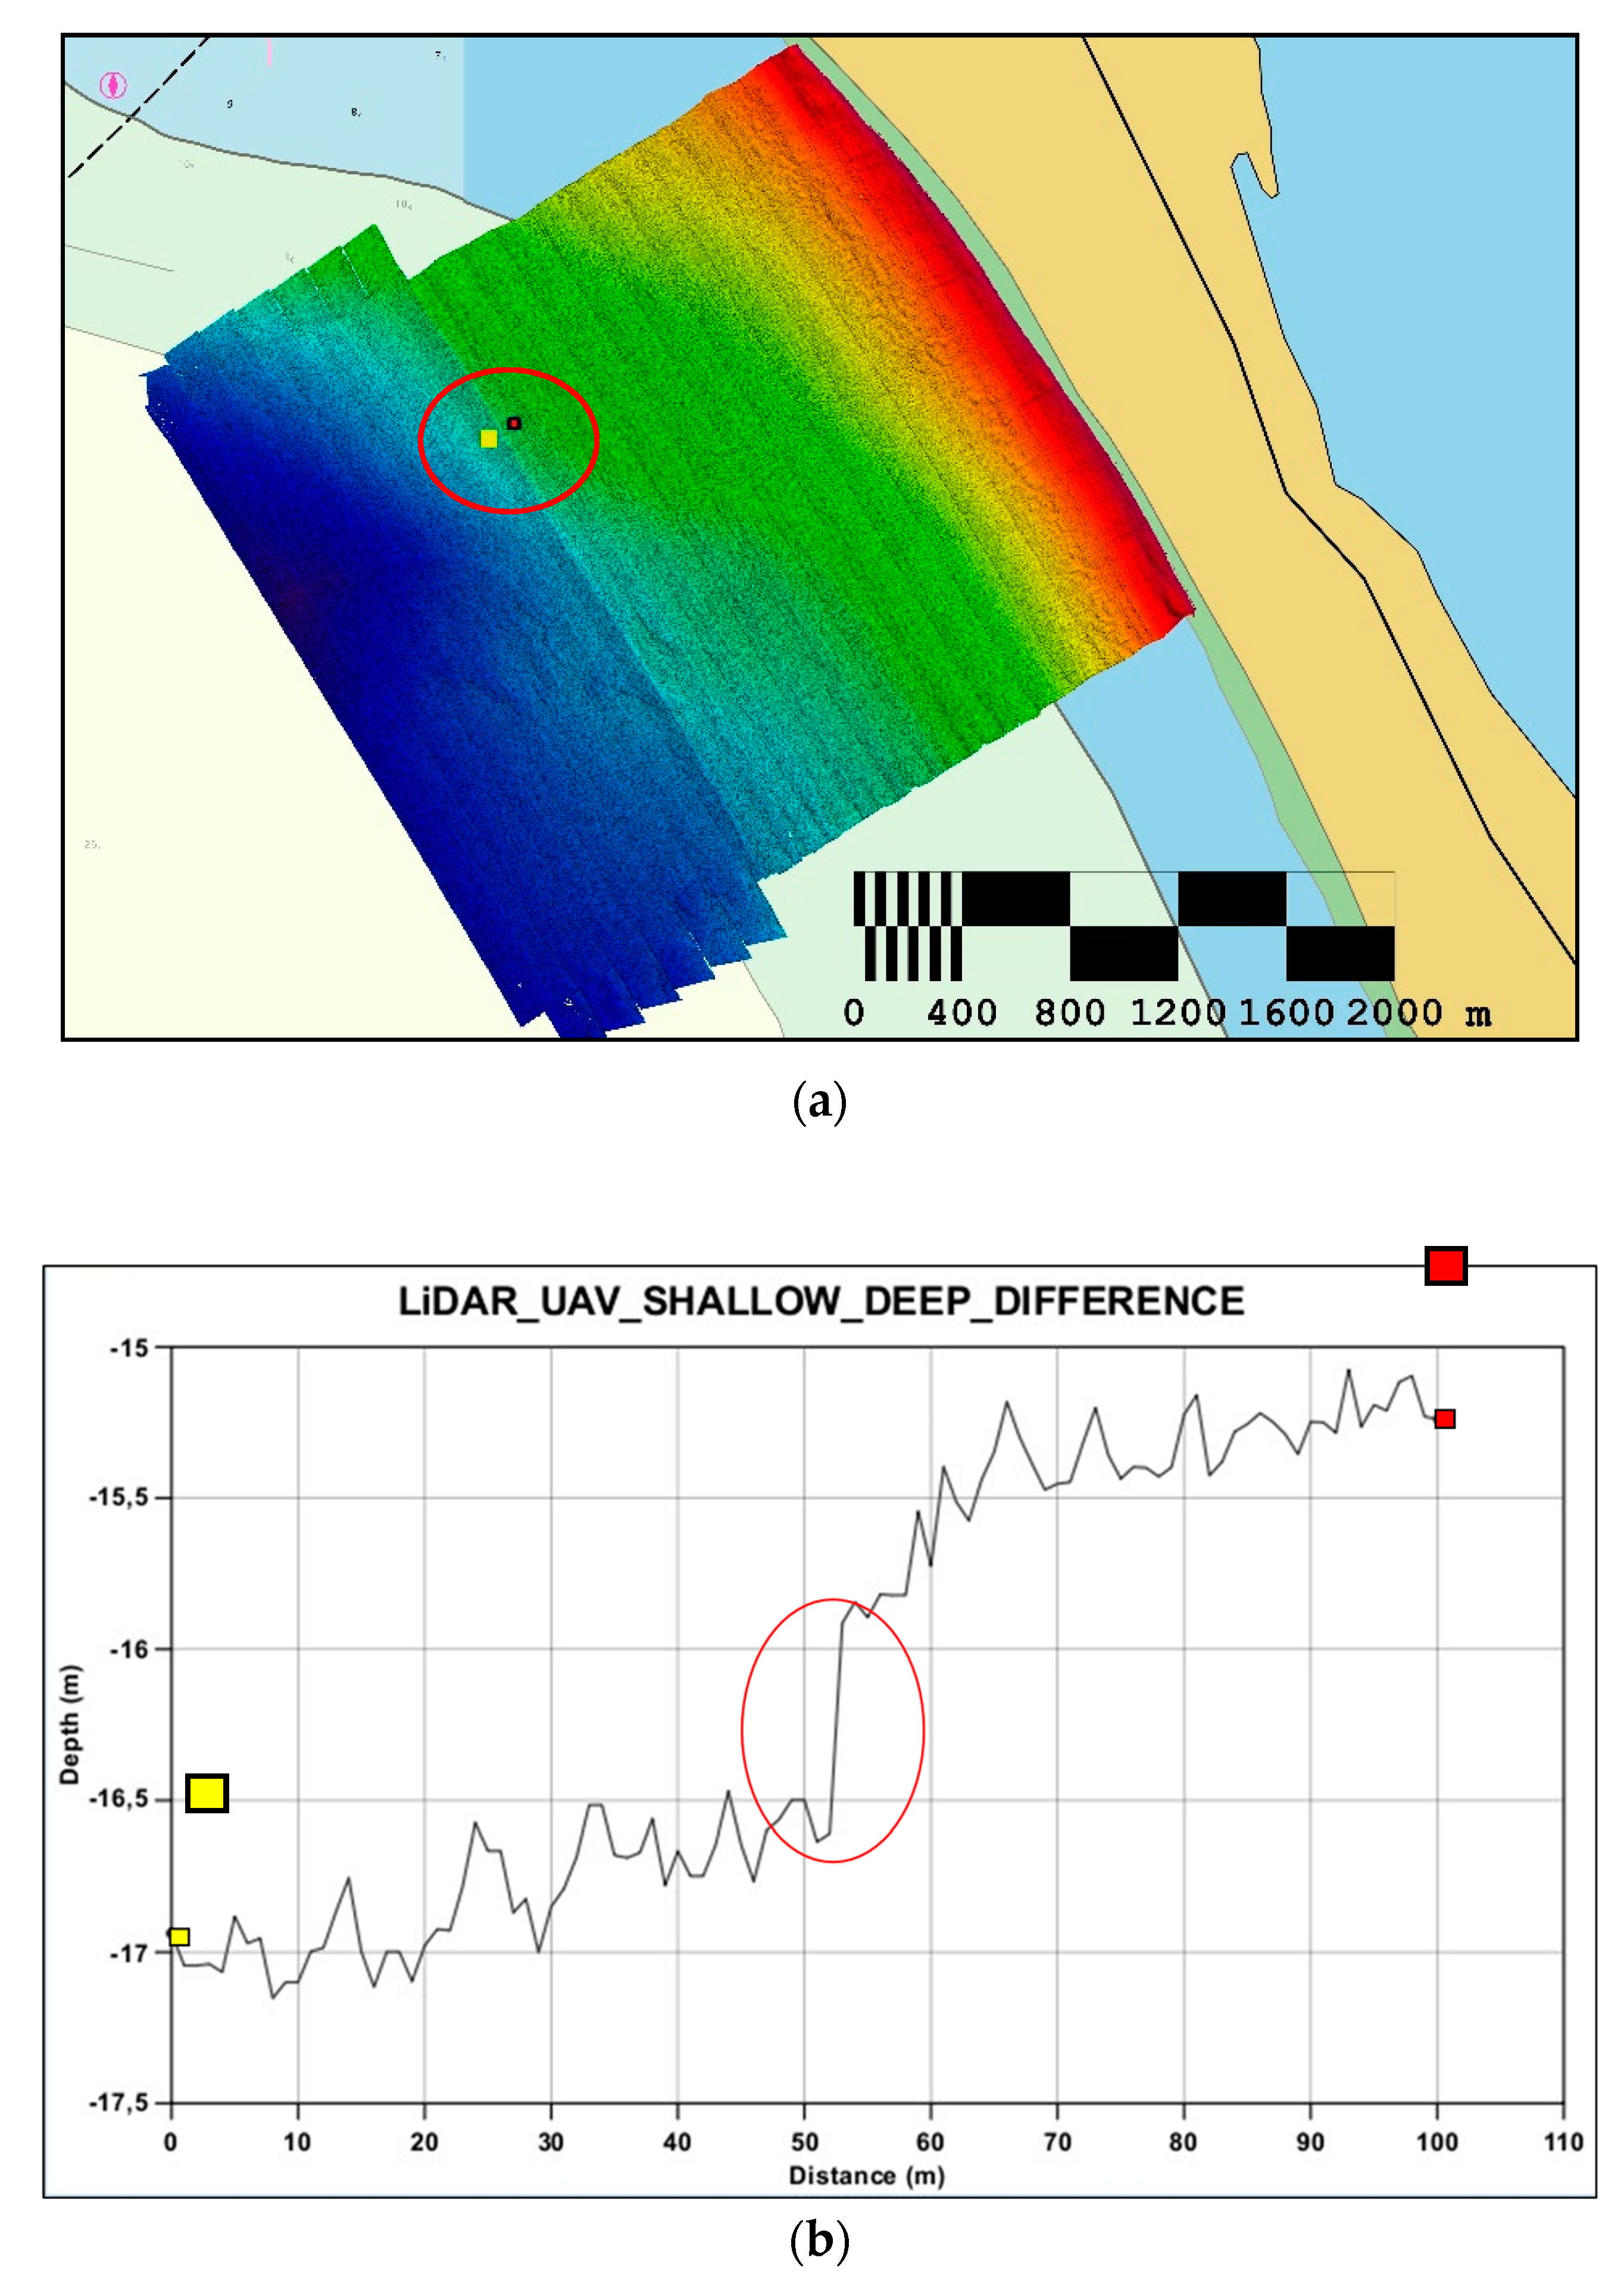
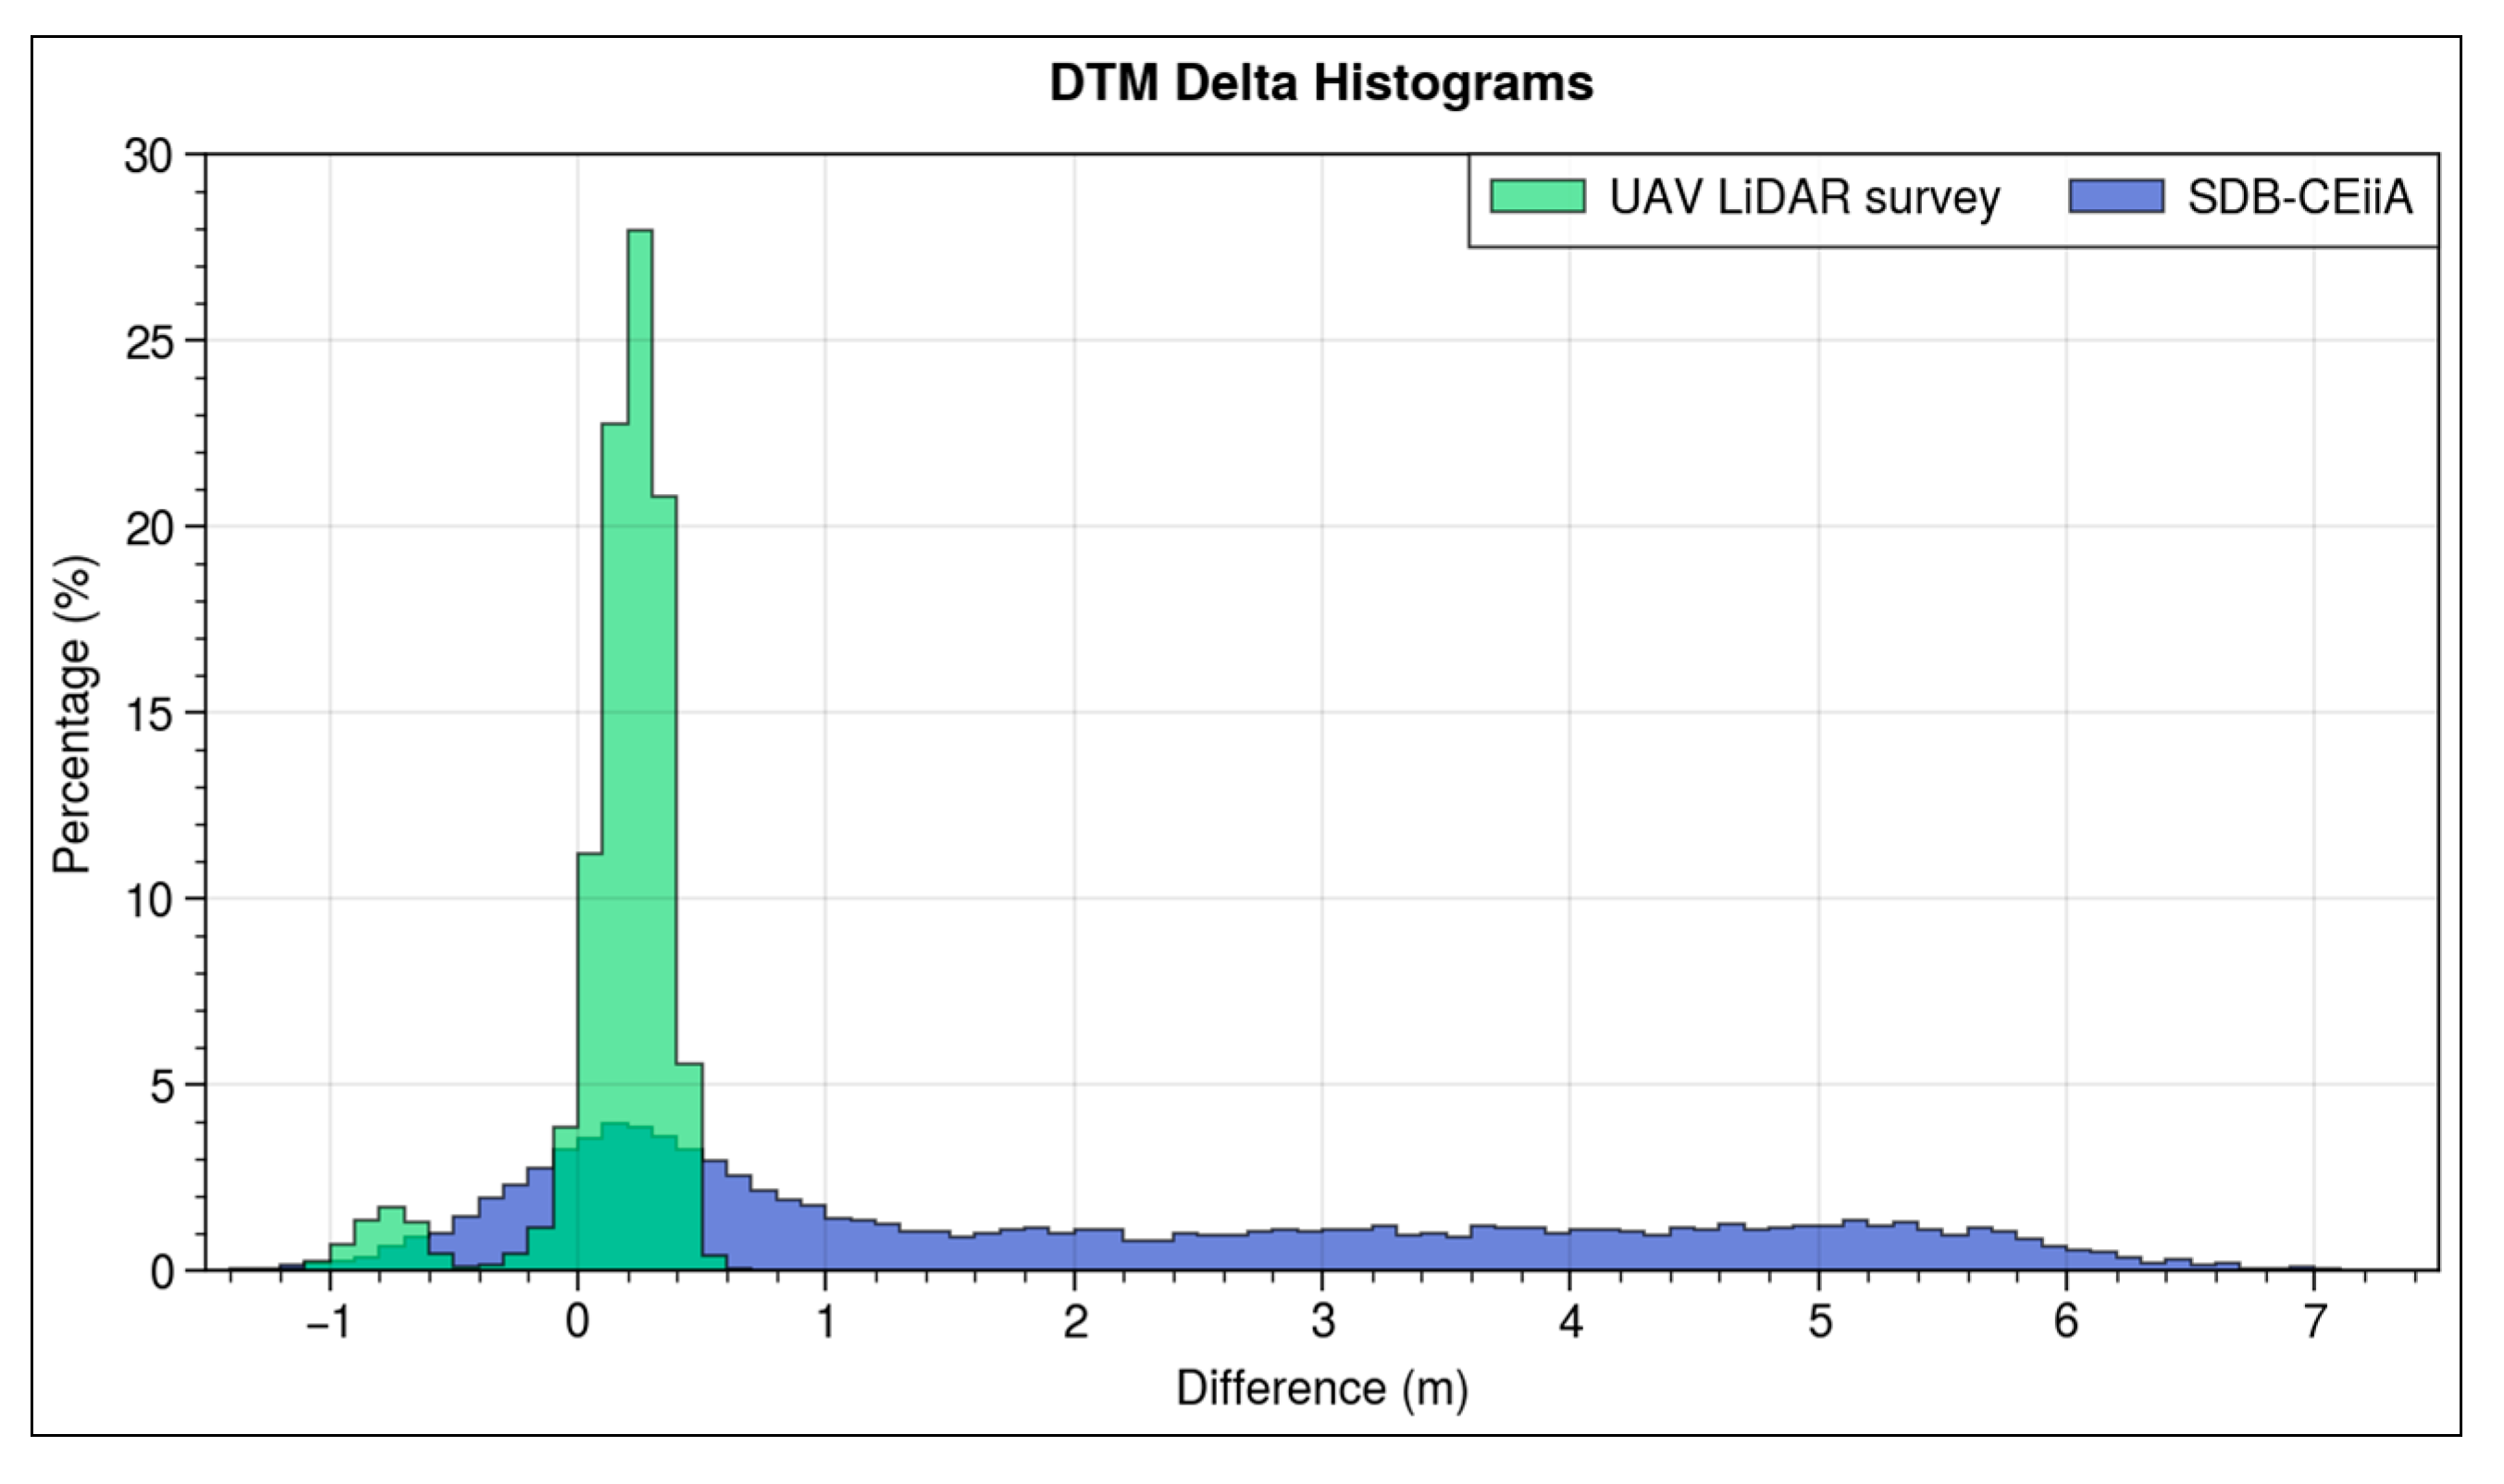
3.5.2. Vertical Accuracy Comparison
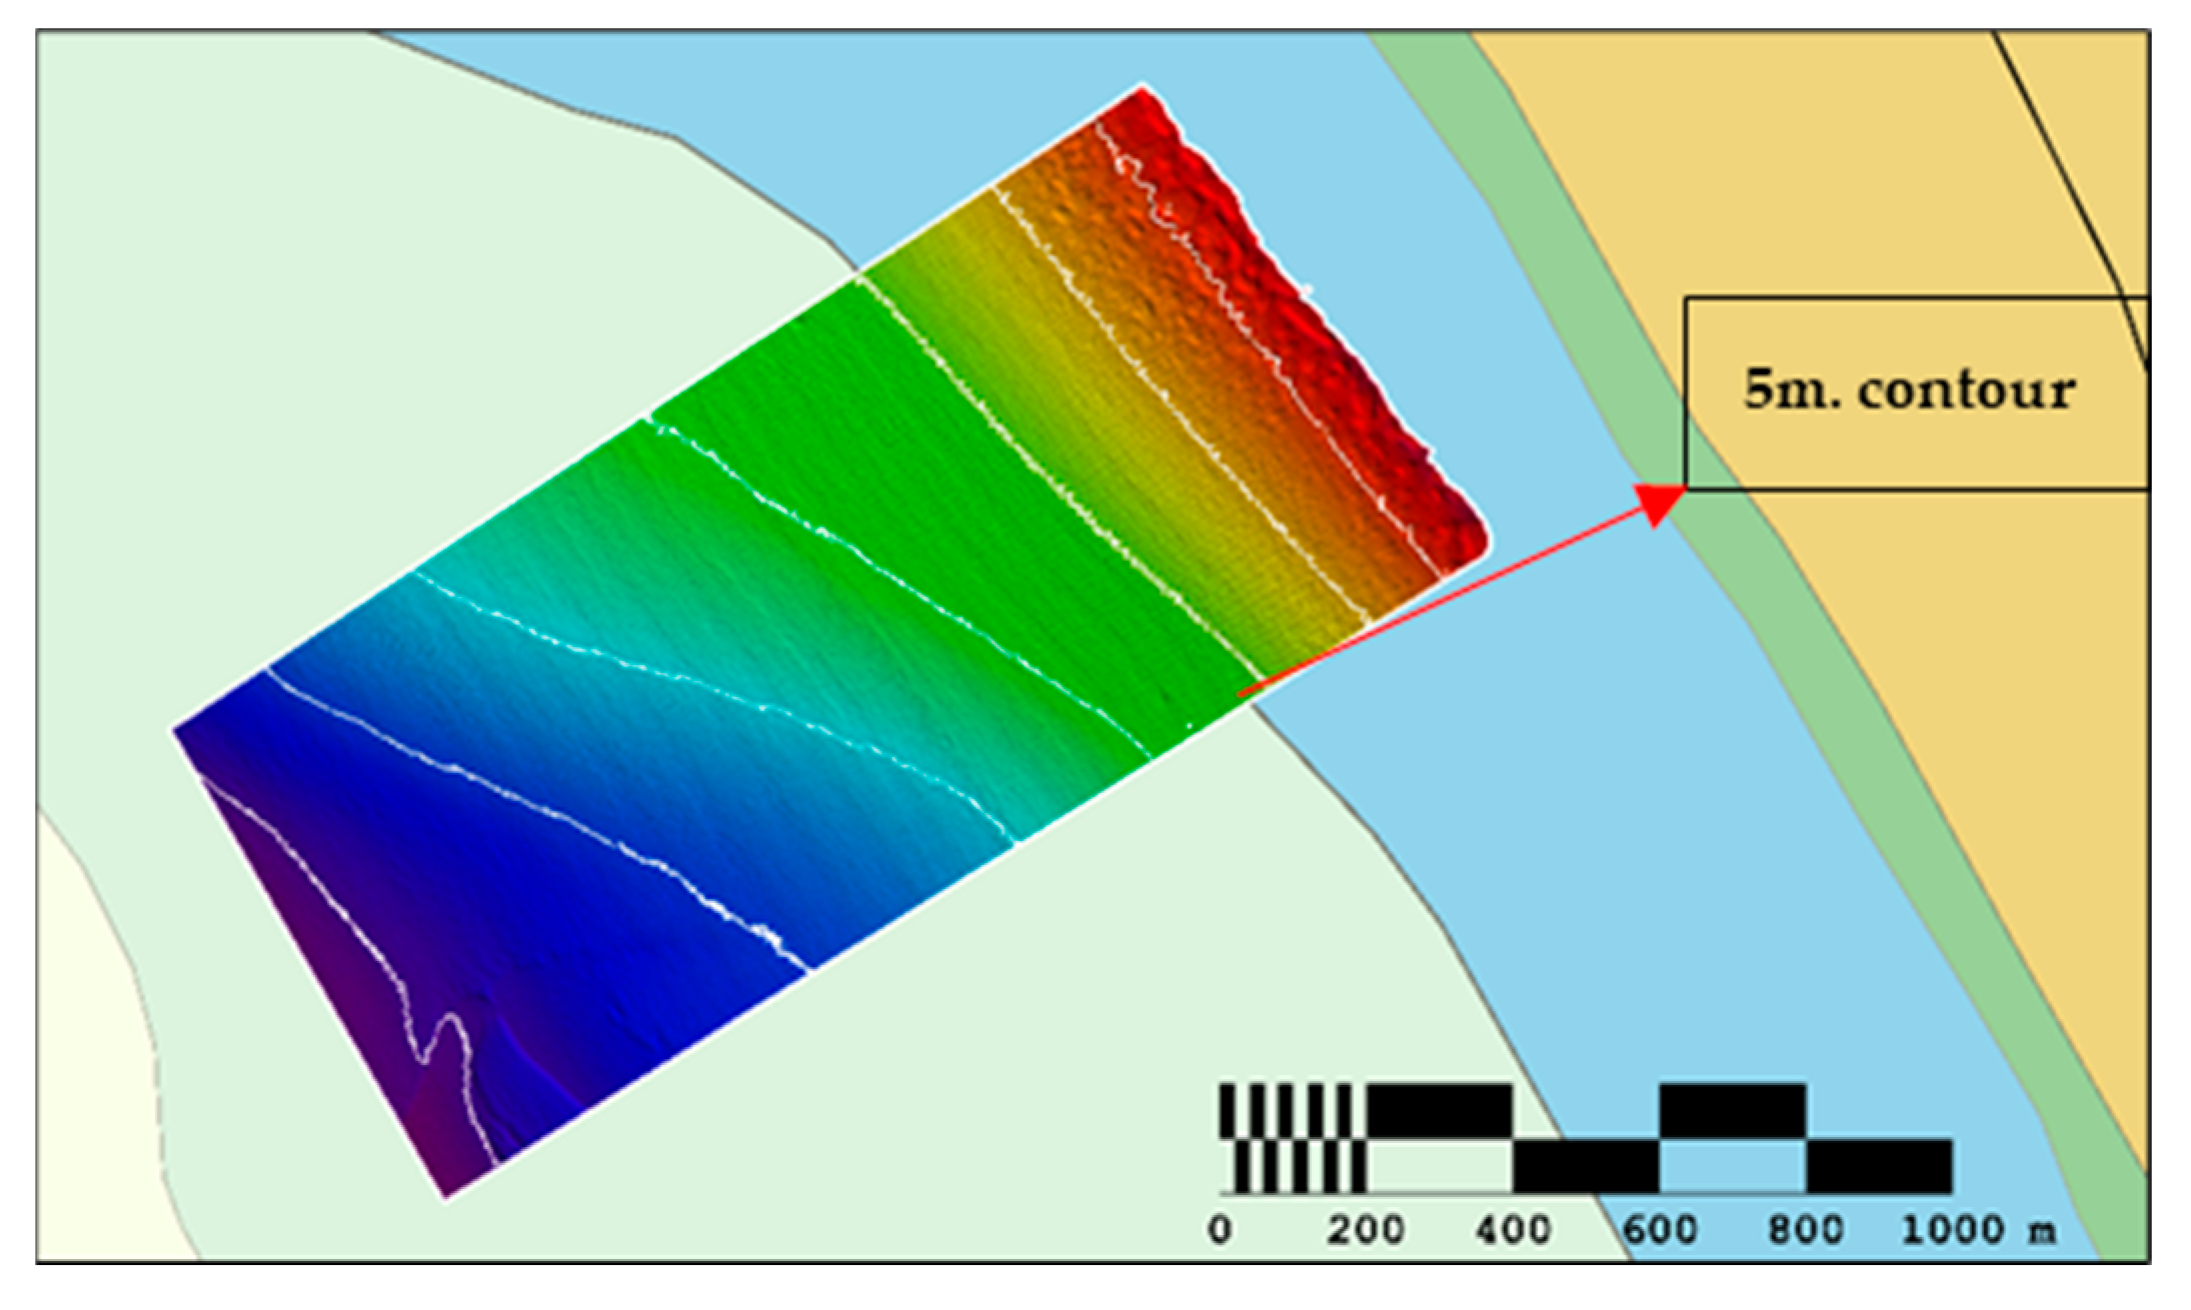
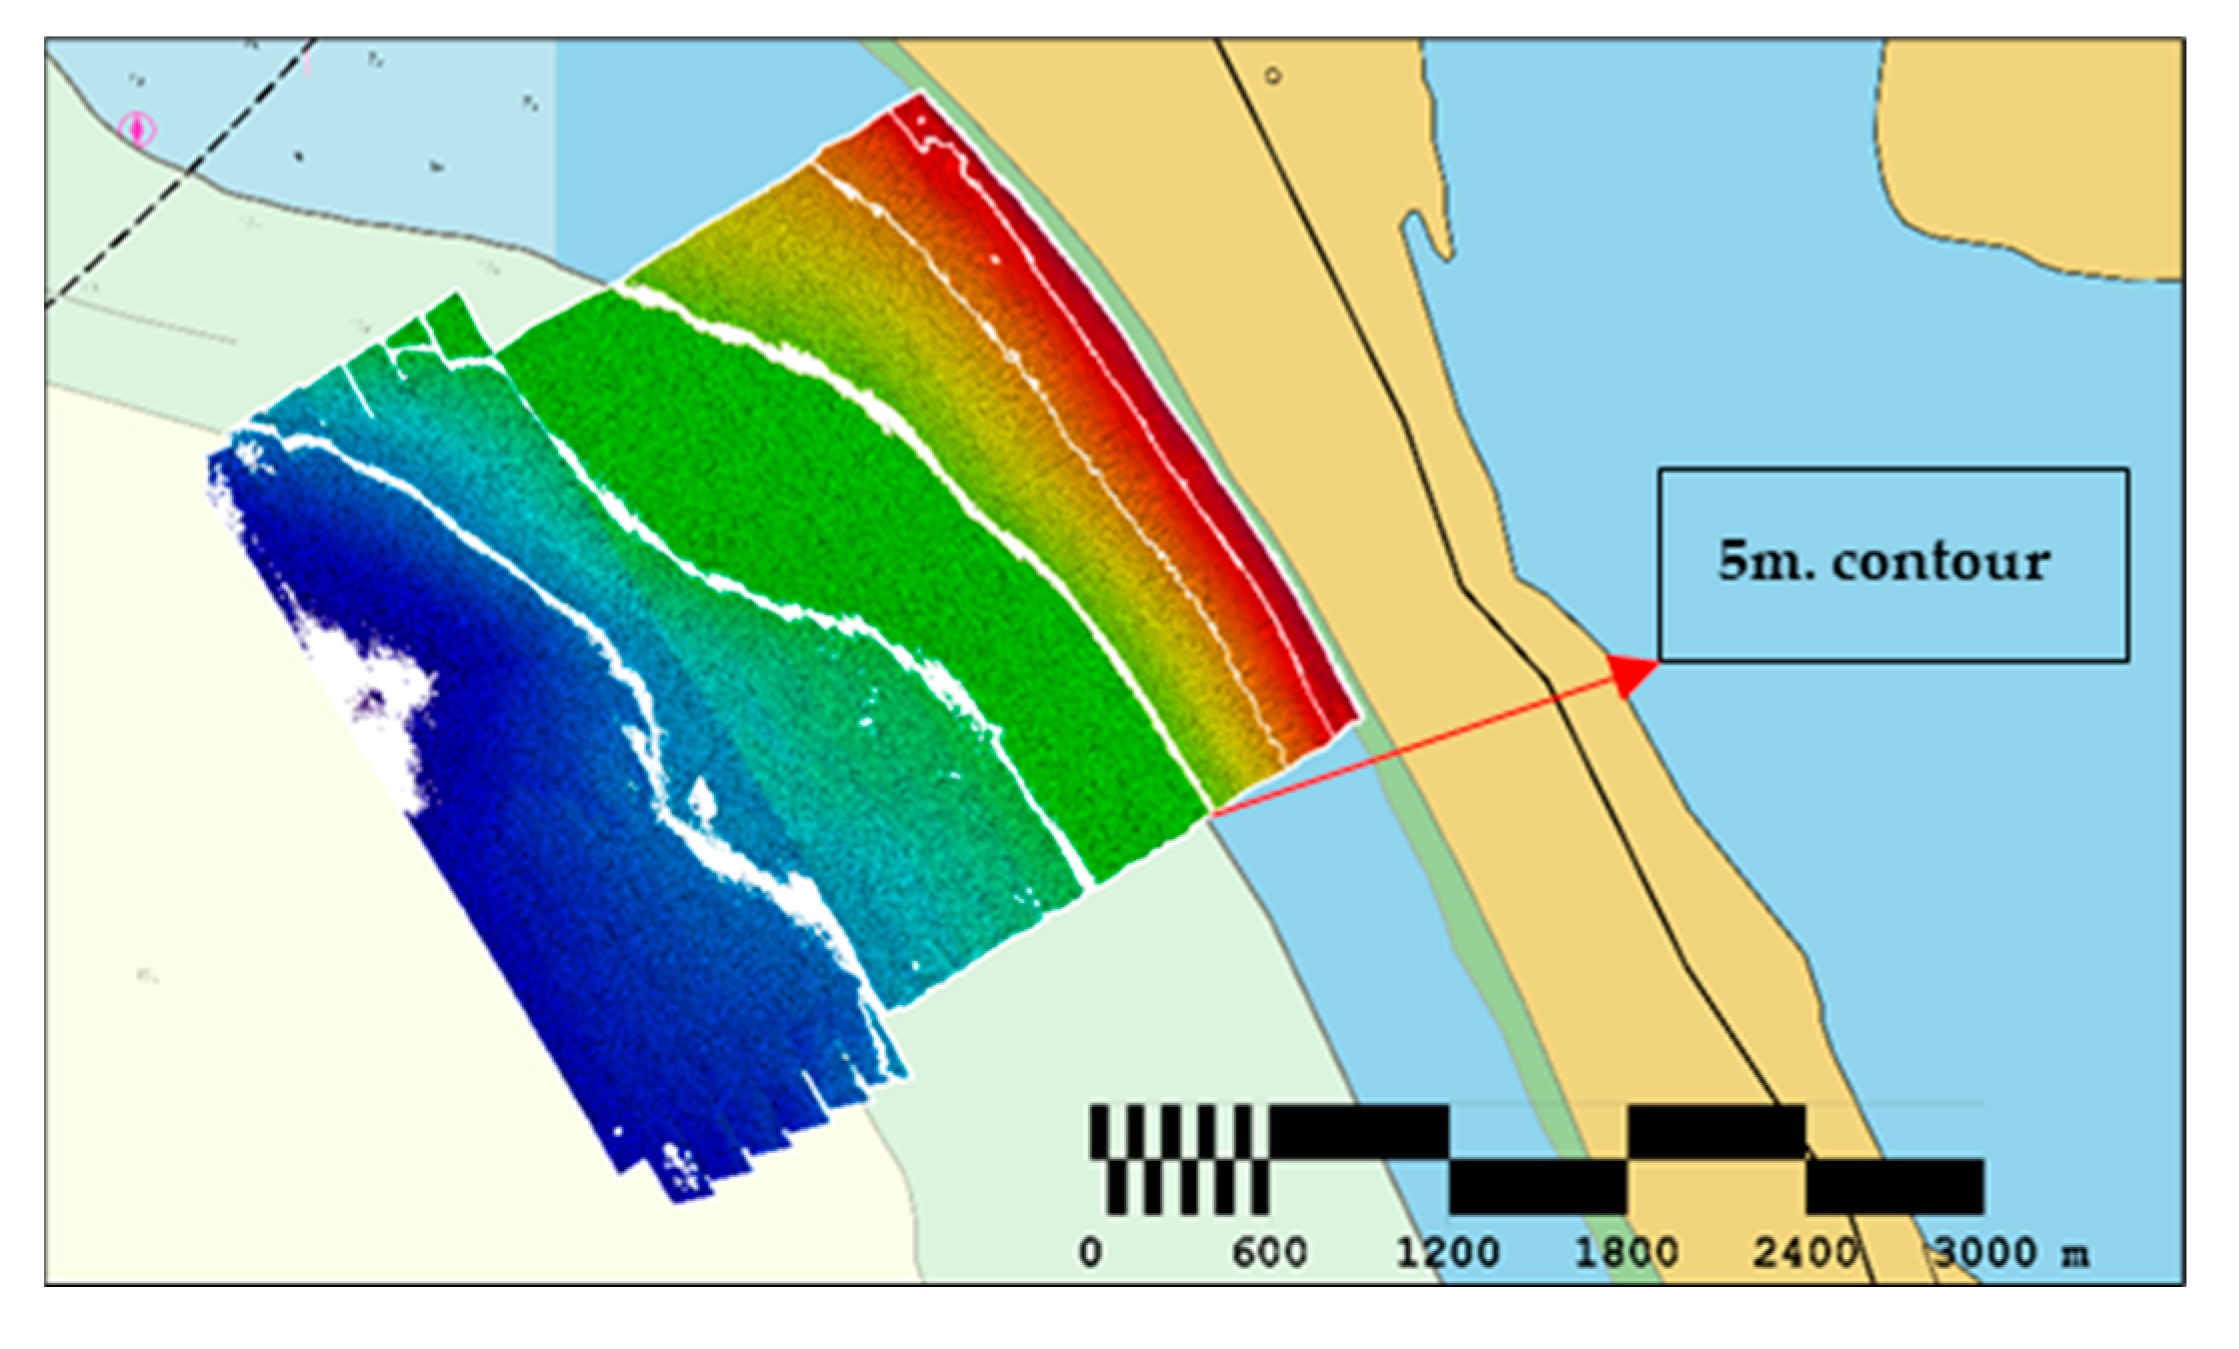
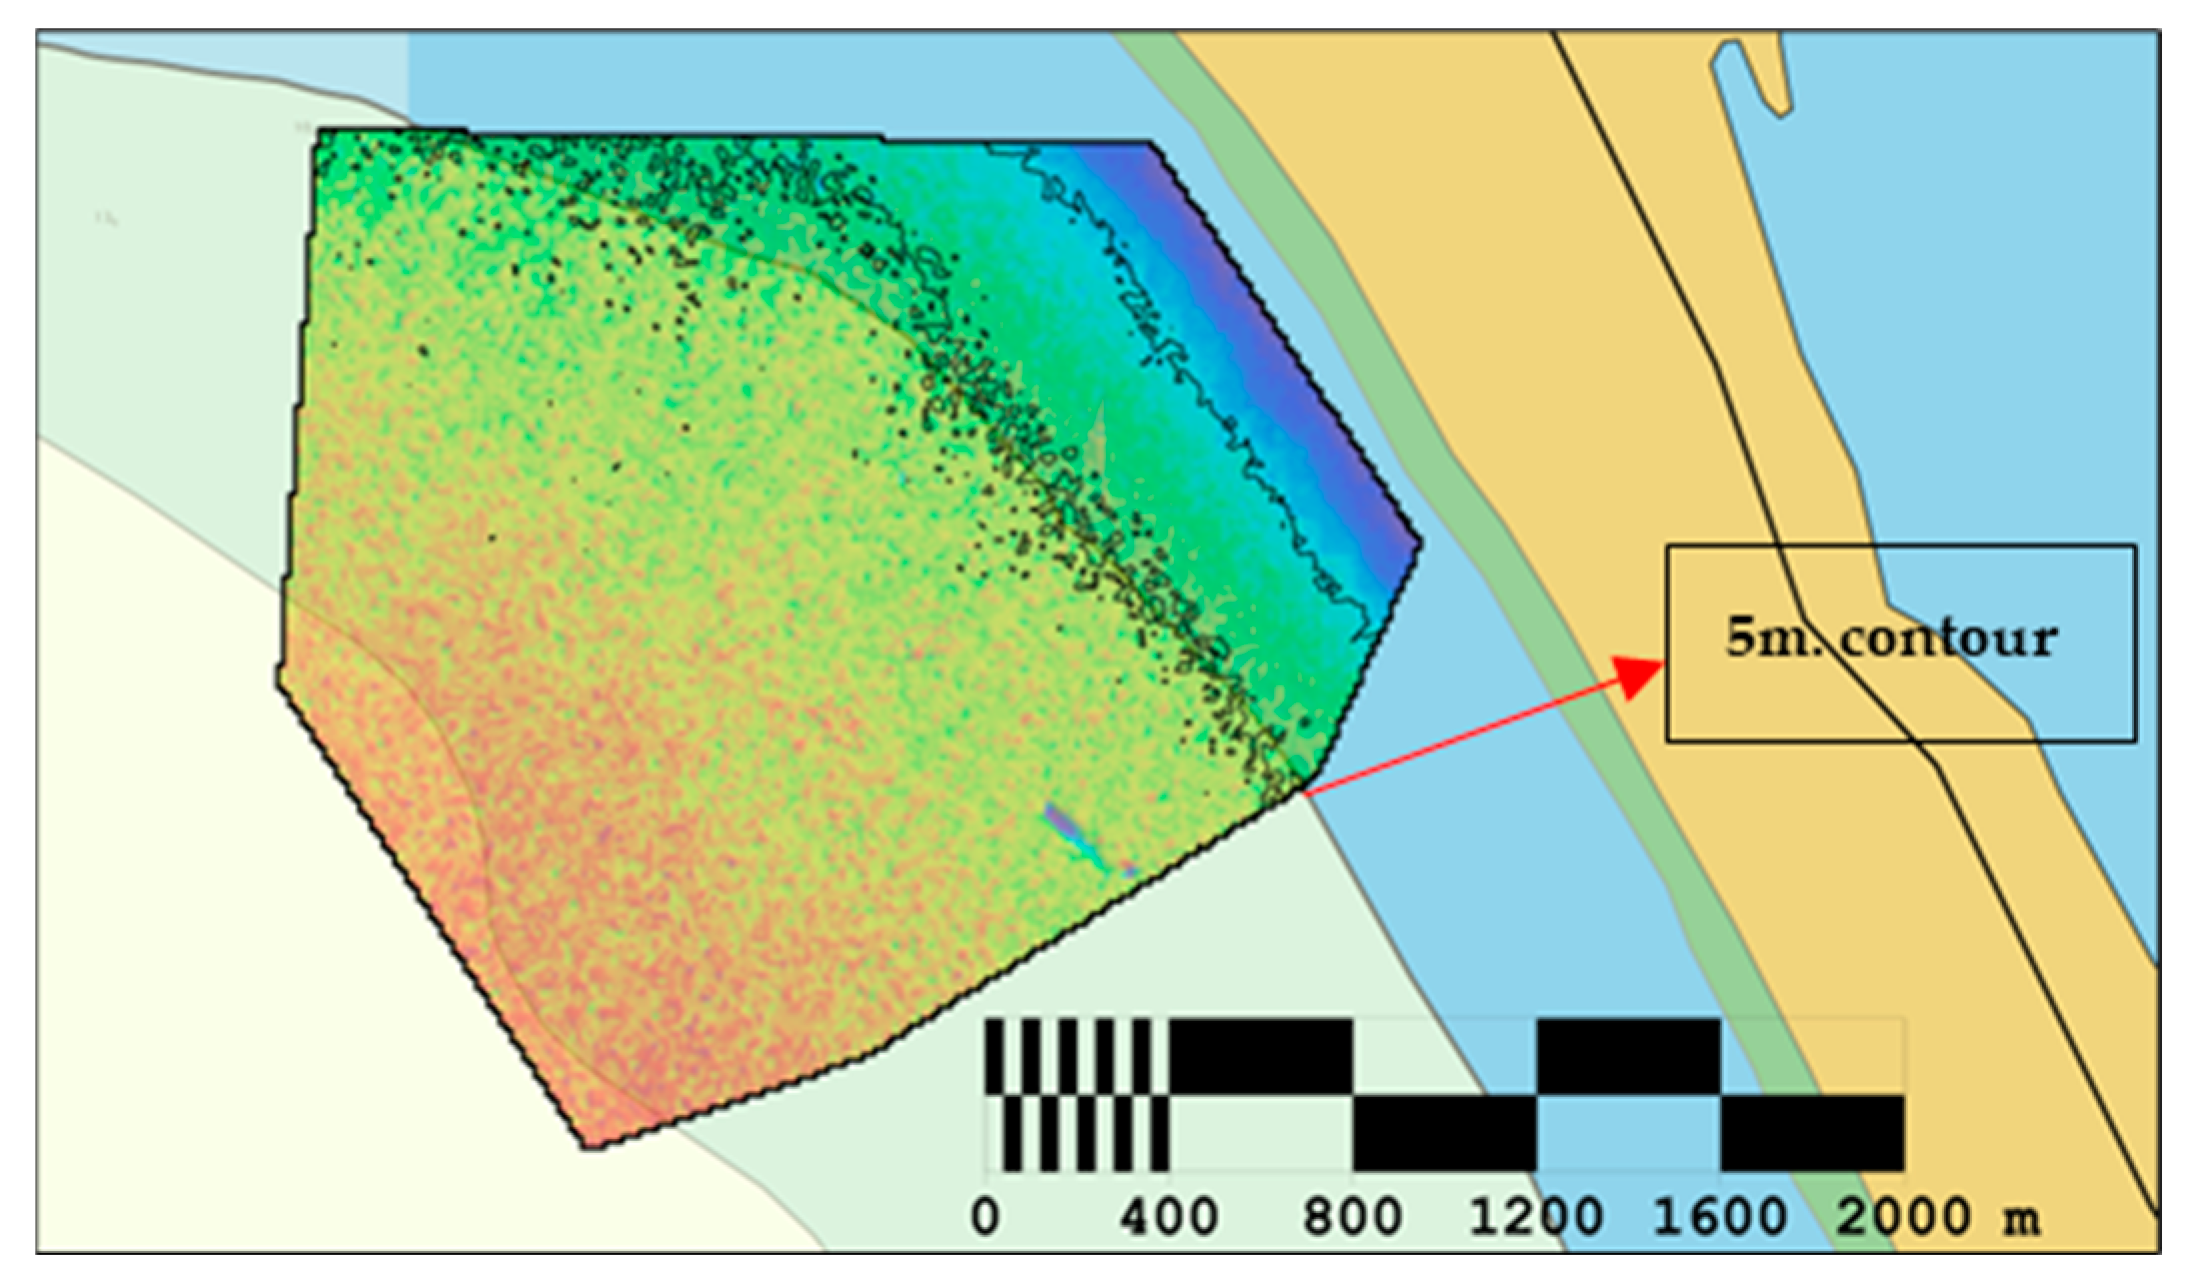
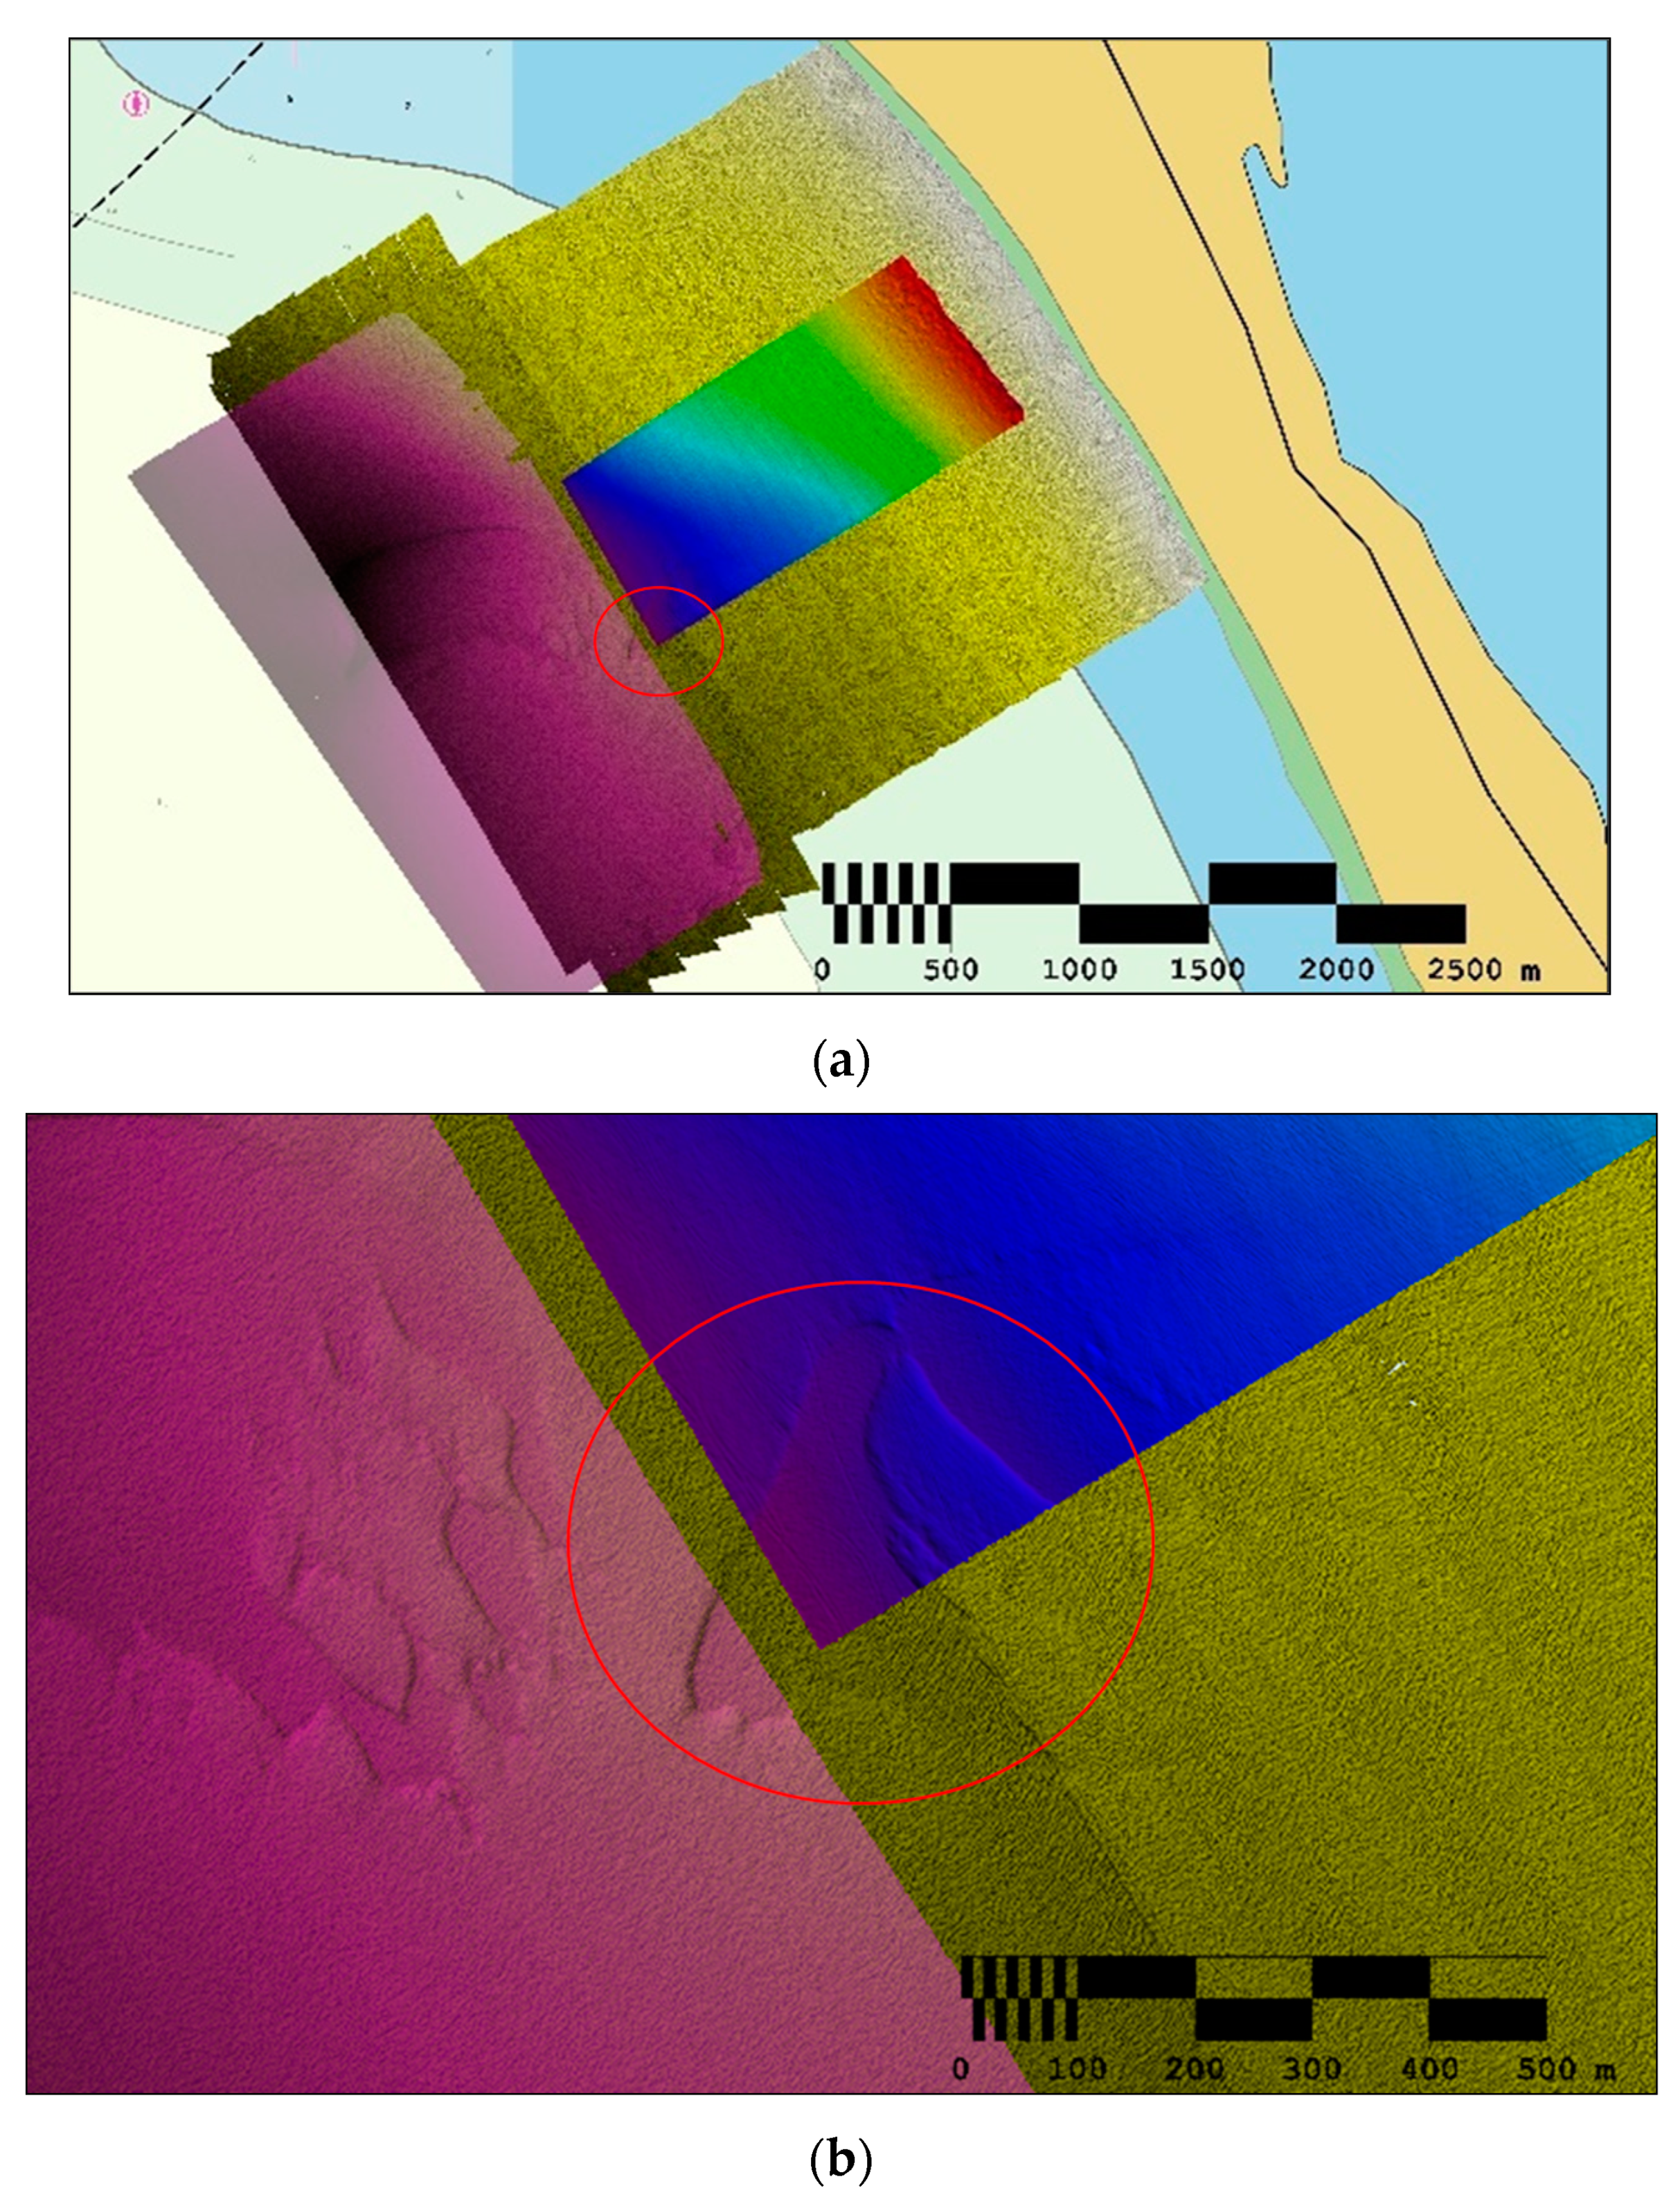
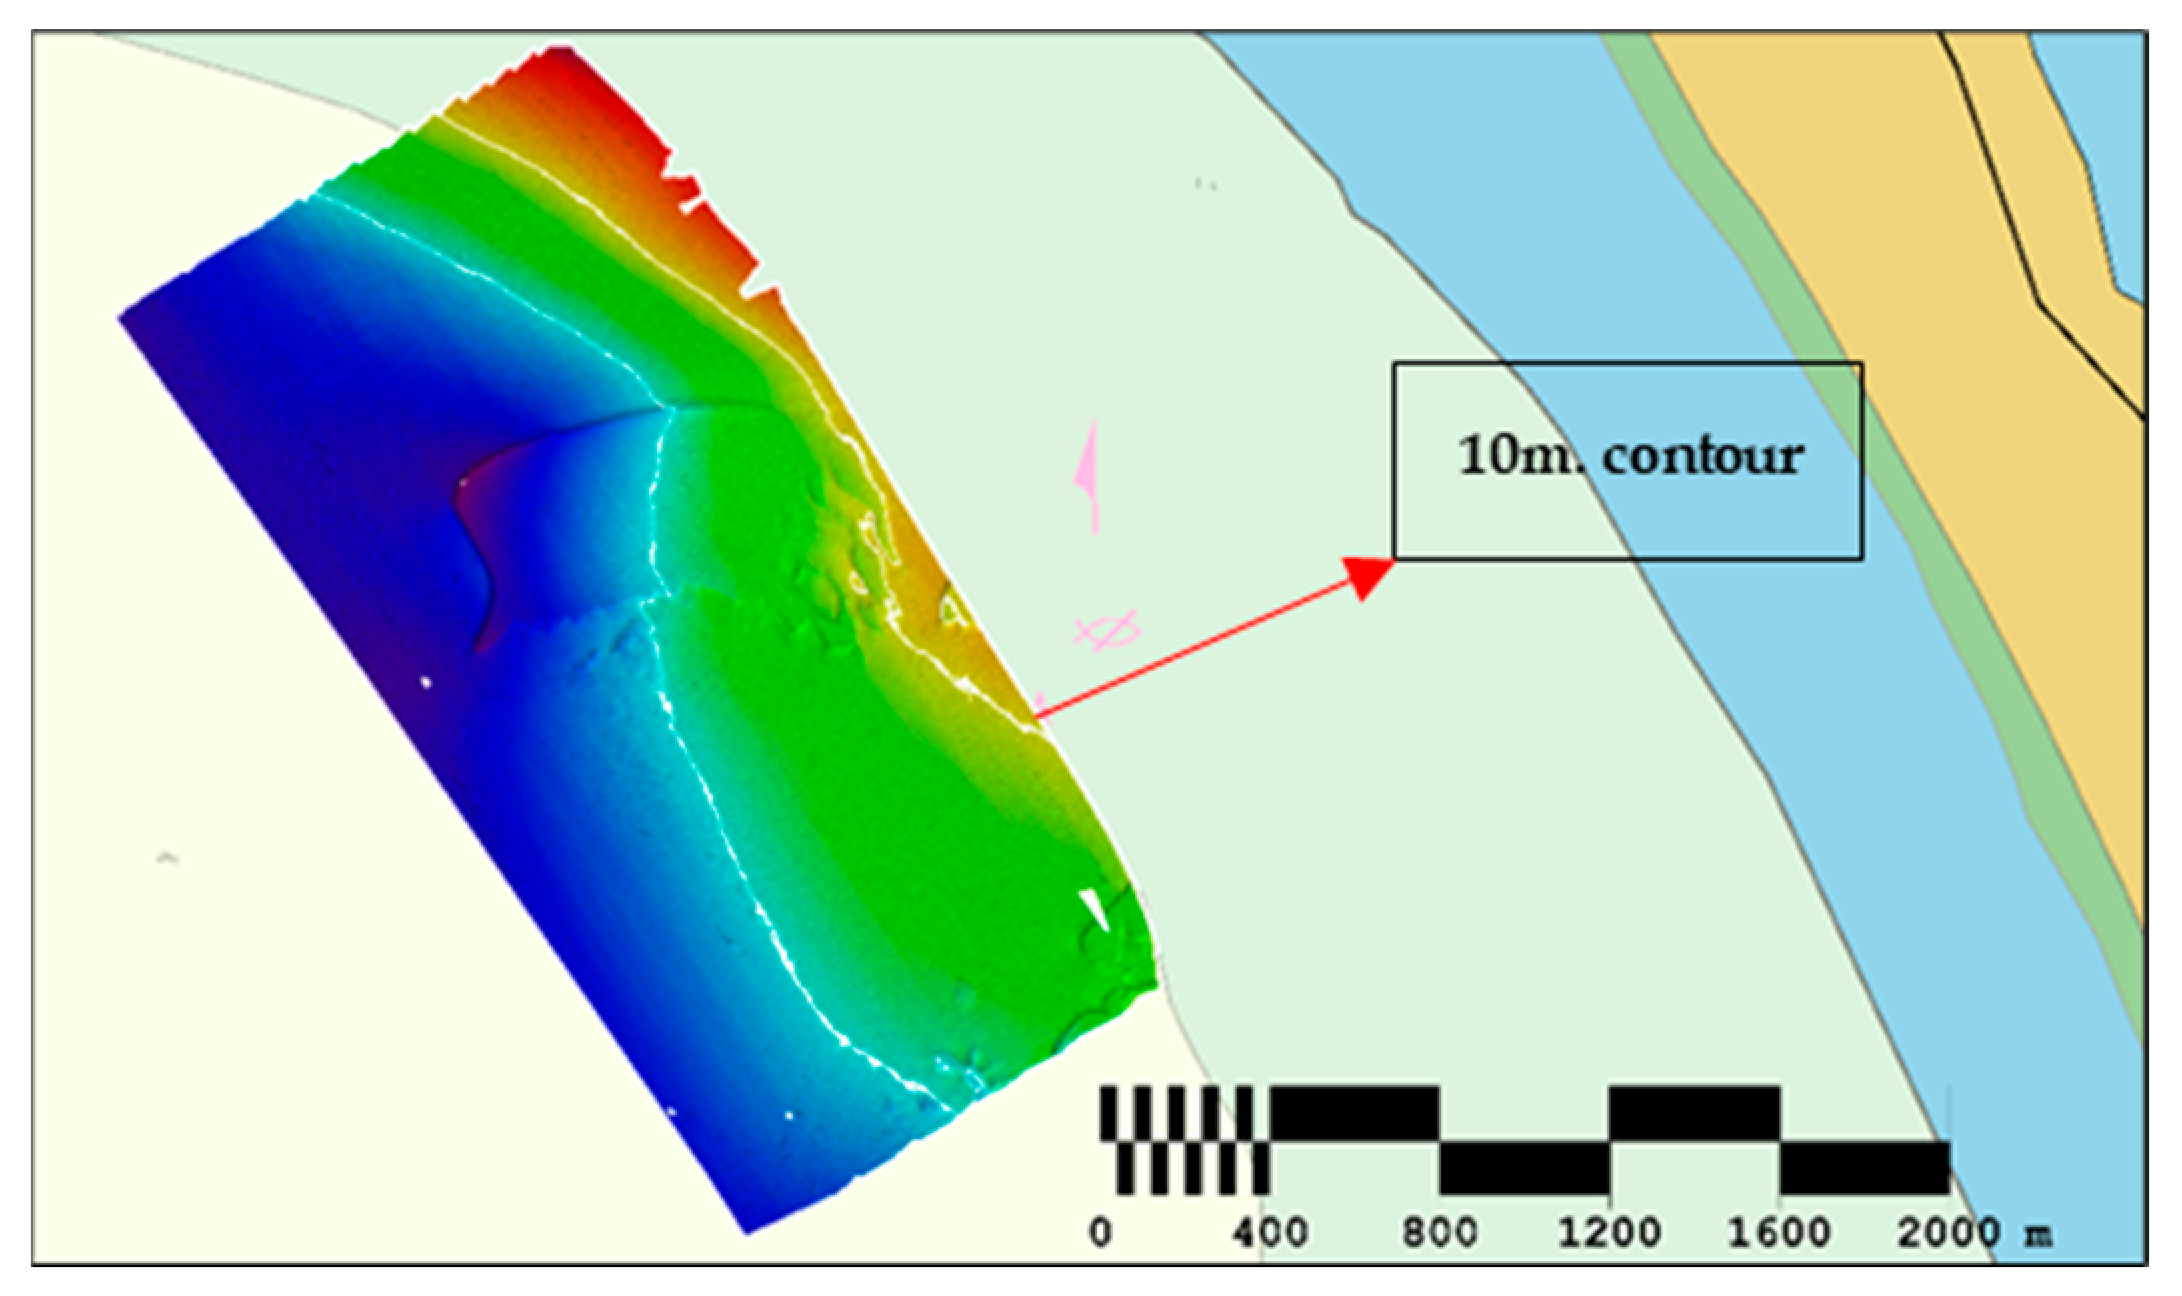
3.5.3. Bathymetric Contours Comparison with the ENC
4. Conclusions
Author Contributions
Funding
Data Availability Statement
Acknowledgments
Conflicts of Interest
References
- Nicholls, R.J.; Cazenave, A. Sea-Level Rise and Its Impact on Coastal Zones. Science 2010, 328, 1517–1520. [Google Scholar] [CrossRef] [PubMed]
- Hoegh-Guldberg, O.; Mumby, P.J.; Hooten, A.J.; Steneck, R.S.; Greenfield, P.; Gomez, E.; Harvell, C.D.; Sale, P.F.; Edwards, A.J.; Caldeira, K.; et al. Coral Reefs under Rapid Climate Change and Ocean Acidification. Science 2007, 318, 1737–1742. [Google Scholar] [CrossRef] [PubMed]
- Zhao, J.; Ouyang, Y.; Wang, A. Status and Development Tendency for Seafloor Terrain Measurement Technology. Acta Geod. Cartogr. Sin. 2017, 46, 1786–1794. [Google Scholar] [CrossRef]
- Sam, L.; Prusty, G.; Gahlot, N. Evaluation of optical remote sensing-based shallow water bathymetry for recursive mapping. Geocarto Int. 2018, 33, 737–753. [Google Scholar] [CrossRef]
- McCombs, M.P.; Mulligan, R.P.; Boegman, L. Offshore wind farm impacts on surface waves and circulation in Eastern Lake Ontario. Coast. Eng. 2014, 93, 32–39. [Google Scholar] [CrossRef]
- Medvešek, I.G.; Šoda, J.; Karin, I.; Maljković, M. The State of the Hydrographic Survey and Assessment of the Potentially Risky Region for Navigation Safety. J. Mar. Sci. Eng. 2023, 11, 1498. [Google Scholar] [CrossRef]
- Bio, A.; Bastos, L.; Granja, H.; Pinho, J.; Gonçalves, J.; Henriques, R.; Madeira, S.; Magalhães, A.; Rodrigues, D. Methods for coastal monitoring and erosion risk assessment: Two Portuguese case studies. Rev. Gestão Costeira Integr.—J. Integr. Coast. Zone Manag. 2015, 15, 47–63. [Google Scholar] [CrossRef]
- Ni, H.; Wang, W.; Ren, Q.; Lu, L.; Wu, J.; Ma, L. Comparison of Single-beam and Multibeam Sonar Systems for Sediment Characterization: Results from Shallow Water Experiment. In Proceedings of the OCEANS 2019 MTS/IEEE SEATTLE, Seattle, WA, USA, 27–31 October 2019; pp. 1–4. [Google Scholar] [CrossRef]
- Lee, Z.; Shangguan, M.; Garcia, R.A.; Lai, W.; Lu, X.; Wang, J.; Yan, X. Confidence Measure of the Shallow-Water Bathymetry Map Obtained through the Fusion of Lidar and Multiband Image Data. J. Remote Sens. 2021, 2021, 9841804. [Google Scholar] [CrossRef]
- Wiehle, S.; Pleskachevsky, A.; Gebhardt, C. Automatic bathymetry retrieval from SAR images. CEAS Space J. 2019, 11, 105–114. [Google Scholar] [CrossRef]
- Legleiter, C.J. The optical river bathymetry toolkit. River Res. Appl. 2021, 37, 555–568. [Google Scholar] [CrossRef]
- Leder, T.D.; Baučić, M.; Leder, N.; Gilić, F. Optical Satellite-Derived Bathymetry: An Overview and WoS and Scopus Bibliometric Analysis. Remote Sens. 2023, 15, 1294. [Google Scholar] [CrossRef]
- Constantinoiu, L.-F.; Rusu, E.; Mihailov, M.-E. UXO Assessment on the Romanian Black Sea Coast. J. Mar. Sci. 2022, 4, 7–17. [Google Scholar] [CrossRef]
- Constantinoiu, L.F.; Quaresma, L.; Rusu, E. Oceanographic environmental assessment using underwater gliders. J. Mar. Technol. Environ. 2022, 2, 12–15. [Google Scholar] [CrossRef]
- Constantinoiu, L.-F.; Bernardino, M.; Rusu, E. Autonomous Shallow Water Hydrographic Survey Using a Proto-Type USV. J. Mar. Sci. Eng. 2023, 11, 799. [Google Scholar] [CrossRef]
- Ślusarczyk, J. Environmental protection in NATO policy. Sci. J. Mil. Univ. Land Forces 2023, 208, 91–103. [Google Scholar] [CrossRef]
- Lam, S.Y.W.; Yip, T.L. Hydrographic surveying and mapping for the coastal construction of Hong Kong Disneyland. Geomatica 2008, 62, 437–443. [Google Scholar]
- Janowski, L.; Wroblewski, R.; Rucinska, M.; Kubowicz-Grajewska, A.; Tysiac, P. Automatic classification and mapping of the seabed using airborne LiDAR bathymetry. Eng. Geol. 2022, 301, 106615. [Google Scholar] [CrossRef]
- Available online: https://www.nato.int/cps/en/natohq/news_218545.htm?selectedLocale=en (accessed on 20 November 2023).
- Whitehouse, B.G.; Vachon, P.W.; Thomas, A.C.; Quinn, R.J.; Renaud, W.M. Rapid environmental assessment (REA) of the maritime battlespace. Can. Mil. J. 2006. Available online: http://www.journal.forces.gc.ca/vo7/no1/opinions-eng.asp (accessed on 19 January 2024).
- Guo, X.; Jin, X.; Jin, S. Shallow Water Bathymetry Mapping from ICESat-2 and Sentinel-2 Based on BP Neural Network Model. Water 2022, 14, 3862. [Google Scholar] [CrossRef]
- Fan, J.; Pei, H.; Lian, Z. Surveying of Nearshore Bathymetry Using UAVs Video Stitching. J. Mar. Sci. Eng. 2023, 11, 770. [Google Scholar] [CrossRef]
- Specht, M.; Stateczny, A.; Specht, C.; Widźgowski, S.; Lewicka, O.; Wiśniewska, M. Concept of an Innovative Autonomous Unmanned System for Bathymetric Monitoring of Shallow Waterbodies (INNOBAT System). Energies 2021, 14, 5370. [Google Scholar] [CrossRef]
- Sallenger, A.H., Jr.; Krabill, W.B.; Swift, R.N.; Brock, J.; List, J.; Hansen, M.; Holman, R.A.; Manizade, S.; Sontag, J.; Meredith, A.; et al. Evaluation of Airborne Topographic Lidar for Quantifying Beach Changes. J. Coast. Res. 2003, 19, 125–133. Available online: http://www.jstor.org/stable/4299152 (accessed on 19 January 2024).
- Mandlburger, G.; Pfennigbauer, M.; Schwarz, R.; Flöry, S.; Nussbaumer, L. Concept and Performance Evaluation of a Novel UAV-Borne Topo-Bathymetric LiDAR Sensor. Remote Sens. 2020, 12, 986. [Google Scholar] [CrossRef]
- l Savio, A.A.; Torres, A.L.; Olivera, M.A.V.; Rojas, S.R.L.; Ibarra, G.T.U.; Neckel, A. Using UAVs and Photogrammetry in Bathymetric Surveys in Shallow Waters. Appl. Sci. 2023, 13, 3420. [Google Scholar] [CrossRef]
- Specht, M.; Specht, C.; Szafran, M.; Makar, A.; Dąbrowski, P.; Lasota, H.; Cywiński, P. The Use of USV to Develop Navigational and Bathymetric Charts of Yacht Ports on the Example of National Sailing Centre in Gdańsk. Remote Sens. 2020, 12, 2585. [Google Scholar] [CrossRef]
- Makar, A. Coastal Bathymetric Sounding in Very Shallow Water Using USV: Study of Public Beach in Gdynia, Poland. Sensors 2023, 23, 4215. [Google Scholar] [CrossRef] [PubMed]
- Naus, K.; Marchel, Ł.; Szymak, P.; Nowak, A. Assessment of the Accuracy of Determining the Angular Position of the Unmanned Bathymetric Surveying Vehicle Based on the Sea Horizon Image. Sensors 2019, 19, 4644. [Google Scholar] [CrossRef] [PubMed]
- He, J.; Lin, J.; Ma, M.; Liao, X. Mapping topo-bathymetry of transparent tufa lakes using UAV-based photogrammetry and RGB imagery. Geomorphology 2021, 389, 107832. [Google Scholar] [CrossRef]
- Yang, Y.; Li, Q.; Zhang, J.; Xie, Y. Iterative Learning-Based Path and Speed Profile Optimization for an Unmanned Surface Vehicle. Sensors 2020, 20, 439. [Google Scholar] [CrossRef]
- João Feio, M.; Ferreira, V. Rios de Portugal—Comunidades, Processos e Alterações; Coimbra University Press: Coimbra, Portugal, 2019; pp. 381–421. ISBN 978-989-26-1624-7. [Google Scholar]
- Available online: https://www.ipma.pt/en/otempo/prev-sam/?p=STB (accessed on 19 September 2023).
- Rocha, M.J.; Rocha, E. Chemical Survey and Risk Assessment of 56 Pesticides in the Sado River Estuary (Iberian Peninsula, Portugal). Toxics 2023, 11, 457. [Google Scholar] [CrossRef]
- Biguino, B.; Sousa, F.; Brito, A.C. Variability of currents and water column structure in a temperate estuarine system (Sado Estuary, Portugal). Water 2021, 13, 187. [Google Scholar] [CrossRef]
- Available online: https://www.gim-international.com/content/article/the-challenges-of-shallow-water-hydrographic-surveying (accessed on 19 January 2024).
- Liang, Y.; Cheng, Z.; Du, Y.; Song, D.; You, Z. An improved method for water depth mapping in turbid waters based on a machine learning model. Estuar. Coast. Shelf Sci. 2024, 296, 108577. [Google Scholar] [CrossRef]
- Available online: https://www.onr.navy.mil (accessed on 21 November 2023).
- Available online: https://arete.com/wp-content/uploads/2023/03/PILLS-Product-Sheet-3-1-23.pdf (accessed on 27 November 2023).
- Available online: https://iho.int/uploads/user/Inter-Regional%20Coordination/RHC/NHC/NHC63/NHC63_%20Open%20session_Fugro_RAMMS_Presentation.pdf (accessed on 19 January 2024).
- Available online: https://schiebel.net/news (accessed on 27 November 2023).
- Available online: https://www.militaryaerospace.com/uncrewed/article/14248222/sensor-uncrewed-lidar (accessed on 20 January 2024).
- Available online: https://www.arditi.pt/en/about.html (accessed on 27 November 2023).
- Available online: https://www.ixblue.com/maritime/maritime-autonomy/uncrewed-surface-vehicles (accessed on 27 November 2023).
- Available online: https://www.kongsberg.com/maritime/products/ocean-science/mapping-systems/multibeam-echo-sounders/em-712-multibeam-echosounder-max.-3600-m (accessed on 20 January 2024).
- Available online: https://www.ixblue.com/wp-content/uploads/2021/12/phins-compact-series-datasheet-2020.pdf (accessed on 19 January 2024).
- Available online: https://www.septentrio.com/en (accessed on 19 January 2024).
- Guériot, D.; Chèdru, J.; Daniel, S.; Maillard, E. The patch test: A comprehensive calibration tool for multibeam echosounders. In Proceedings of the OCEANS 2000 MTS/IEEE Conference and Exhibition, Providence, RI, USA, 11–14 September 2000; Volume 3, pp. 1655–1661. [Google Scholar] [CrossRef]
- Available online: https://www.kongsberg.com/maritime/products/ocean-science/mapping-systems/multibeam-echo-sounders/sis (accessed on 20 January 2024).
- Hughes Clarke, J.E.; Mayer, L.A.; Wells, D.E. Shallow-water imaging multibeam sonars: A new tool for investigating seafloor processes in the coastal zone and on the continental shelf. Mar. Geophys. Res. 1996, 18, 607–629. [Google Scholar] [CrossRef]
- Available online: https://www.kongsberg.com/maritime/about-us/news-and-media/news-archive/2022/em-712-usv/ (accessed on 18 January 2024).
- Available online: https://www.ceiia.com (accessed on 30 November 2023).
- Available online: https://www.esa.int/Applications/Observing_the_Earth/Copernicus (accessed on 11 September 2023).
- Katsoulis-Dimitriou, S.; Lefkaditis, M.; Barmpagiannakos, S.; Kormas, K.A.; Kyparissis, A. Comparison of iCOR and Rayleigh atmospheric correction methods on Sentinel-3 OLCI images for a shallow eutrophic reservoir. PeerJ 2022, 10, e14311. [Google Scholar] [CrossRef] [PubMed]
- Stumpf, R.P.; Holderied, K.; Sinclair, M. Determination of water depth with high-resolution satellite imagery over variable bottom types. Limnol. Oceanogr. 2003, 48, 547–556. [Google Scholar] [CrossRef]
- Available online: https://www.gebco.net/data_and_products/gridded_bathymetry_data (accessed on 11 September 2023).
- Available online: https://geomar.hidrografico.pt (accessed on 4 December 2023).
- Available online: https://iho.int/uploads/user/pubs/standards/s-44/S-44_Edition_6.1.0.pdf (accessed on 5 December 2023).
- Calder, B.R.; Mayer, L.A. Automatic Processing of High-Rate, High-Density Multibeam Echosounder Data. Geochem. Geophys. Geosyst. 2003, 4, 1048. [Google Scholar] [CrossRef]
- Calder, B.; Wells, D. CUBE User’s Manual; Center for Coastal and Ocean Mapping and NOAA/UNH Joint Hydrographic Center University of New Hampshire: Durham, NH, USA, 2007. [Google Scholar]
- Ventura, D. Coastal zone mapping with the world’s first airborne multibeam bathymetric lidar mapping system. Hydrogr. Nachrichten 2020, 115, 48–53. [Google Scholar] [CrossRef]
- Available online: https://www.hydro-international.com/case-study/this-is-how-airborne-multibeam-lidar-coastal-mapping-in-paradise-is-done (accessed on 19 January 2024).


| Technical Specifications | Technical Specifications’ Values |
|---|---|
| Dimensions | 41″ × 10″ × 6″ (LxWxD) | < 2 ft2 volume |
| Weight | <13.6 kg (30 lbs.) |
| Power | <250 W |
| Transmit Specifications | Wavelength: 532 nm | Repetition Rate: 30 Hz ×2 Energy per pulse: 37 mJ | Pulse Width: 5.1 ns |
| Operational Altitude | 300 m |
| Swath Width | 0.9 nominal altitude |
| Operational Speed | Manned: 100–120 kn | Unmanned: 50–60 kn |
| Area Search Rate | Manned: 57 sq km/hr | Unmanned: 31 sq km/hr |
| Depth Penetration | 3 × d−1 |
| Operational Temperature Range | −20 °C to 50 °C |
| Point Density | 25,000 points per second |
| Feature Detection | 2 m cubic features |
| IHO Order | 1 A |
| Platforms | Small aircraft of opportunity (Cessna class and larger), unmanned (Schiebel S-100, SeaHunter UAS), rotary wing |
| Laser Parameters | Values |
|---|---|
| Scan Rate | 60 Hz (2 lasers combined) |
| Flight altitude | 128 m |
| Points across swath | 850 points/line |
| Scan swath width | 115 m |
| Along-track point spacing | 35–50 cm |
| Across-track points spacing | 12 cm |
| Point density | 15–20 points/m2 |
| Kongsberg EM712 USV Technical Specifications | |
|---|---|
| Frequency range | 40 to 100 kHz |
| Max ping rate | 30 Hz |
| Swath coverage sector | Up to 140° |
| Beam spacing | Equiangular, equidistant |
| Roll stabilized beams | ±15° |
| Pitch stabilized beams | ±10° |
| Transducer Tx Length | 970 mm |
| Transducer Rx Length | 970 mm |
| Angular resolution | 1° × 1° (100 kHz) |
| Max. no. of beams per ping | 800 (dual swath mode) |
| Reference MB Survey | USV MB Survey | UAV LiDAR Survey | SDB-cEiiA | |
|---|---|---|---|---|
| Survey Lines Total Length (km) | 34.65 | 37.90 | 74.20 | - |
| Area Survey Time (hh: mm) | 02:49 | 03:17 | 02:21 | - |
| Survey Average Speed (kts) | 6.62 | 6.20 | 40–60 | - |
| Swath overlap (%) | 50 | 15 | 15 | - |
| Area Covered (km2) | 0.78 | 1.94 | 4.56 | 5.08 |
| OFFSHORE Area Covered (%) | 15.37 | 38.21 | 89.74 | 100 |
| Distance between survey lines (m) | 50 | 60 | 100 | - |
| Acquisition Period (DD/MM/YYYY) | 06/09/2023 | 15/09/2023 | 18/09/2023 | 04/01/2023 14/04/2023 |
| Reference MB Survey | USV MB Survey | UAV LiDAR Survey | SDB-cEiiA | SDB-AIRBUS | |
|---|---|---|---|---|---|
| Dataset type | Point Cloud | Point Cloud | Point Cloud | Raster | Raster |
| Dataset file format | KMALL | KMALL | CSVXYZ | GeoTIFF | GeoTIFF |
| DTM Gridding Method | CUBE | CUBE | Basic Weighted Mean | - | - |
| DTM Resolution (m) | 1.00 | 1.00 | 1.00 | 10.0 | 1.20 |
| NODE DENSITY | NODE STD (m) | |
|---|---|---|
| Minimum | 1 | 0.0 |
| Maximum | 1683 | 0.1 |
| Mean | 139.66 | 0.0 |
| Standard Deviation | 59.39 | 0.0 |
| Node Density | Node Std (m) | |
|---|---|---|
| Minimum | 1 | 0.0 |
| Maximum | 3341 | 0.1 |
| Mean | 110.33 | 0.0 |
| Standard Deviation | 61.77 | 0.0 |
| NODE DENSITY | NODE STD (m) | |
|---|---|---|
| Minimum | 1 | 0.0 |
| Maximum | 1173 | 2.6 |
| Mean | 65.60 | 0.2 |
| Standard Deviation | 17.37 | 0.1 |
| UAV LiDAR | SDB-cEiiA | |
|---|---|---|
| Minimum (m) | −1.3 | −1.6 |
| Maximum (m) | 0.8 | 7.2 |
| Mean (m) | 0.2 | 2.1 |
| STD (m) | 0.3 | 2.1 |
Disclaimer/Publisher’s Note: The statements, opinions and data contained in all publications are solely those of the individual author(s) and contributor(s) and not of MDPI and/or the editor(s). MDPI and/or the editor(s) disclaim responsibility for any injury to people or property resulting from any ideas, methods, instructions or products referred to in the content. |
© 2024 by the authors. Licensee MDPI, Basel, Switzerland. This article is an open access article distributed under the terms and conditions of the Creative Commons Attribution (CC BY) license (https://creativecommons.org/licenses/by/4.0/).
Share and Cite
Constantinoiu, L.-F.; Tavares, A.; Cândido, R.M.; Rusu, E. Innovative Maritime Uncrewed Systems and Satellite Solutions for Shallow Water Bathymetric Assessment. Inventions 2024, 9, 20. https://doi.org/10.3390/inventions9010020
Constantinoiu L-F, Tavares A, Cândido RM, Rusu E. Innovative Maritime Uncrewed Systems and Satellite Solutions for Shallow Water Bathymetric Assessment. Inventions. 2024; 9(1):20. https://doi.org/10.3390/inventions9010020
Chicago/Turabian StyleConstantinoiu, Laurențiu-Florin, António Tavares, Rui Miguel Cândido, and Eugen Rusu. 2024. "Innovative Maritime Uncrewed Systems and Satellite Solutions for Shallow Water Bathymetric Assessment" Inventions 9, no. 1: 20. https://doi.org/10.3390/inventions9010020
APA StyleConstantinoiu, L.-F., Tavares, A., Cândido, R. M., & Rusu, E. (2024). Innovative Maritime Uncrewed Systems and Satellite Solutions for Shallow Water Bathymetric Assessment. Inventions, 9(1), 20. https://doi.org/10.3390/inventions9010020