
SpiderID_APP: A User-Friendly APP for Spider Identification in Taiwan Using YOLO-Based Deep Learning Models


 , ,
, ,  , , , ,
  and
and
Abstract
:1. Introduction
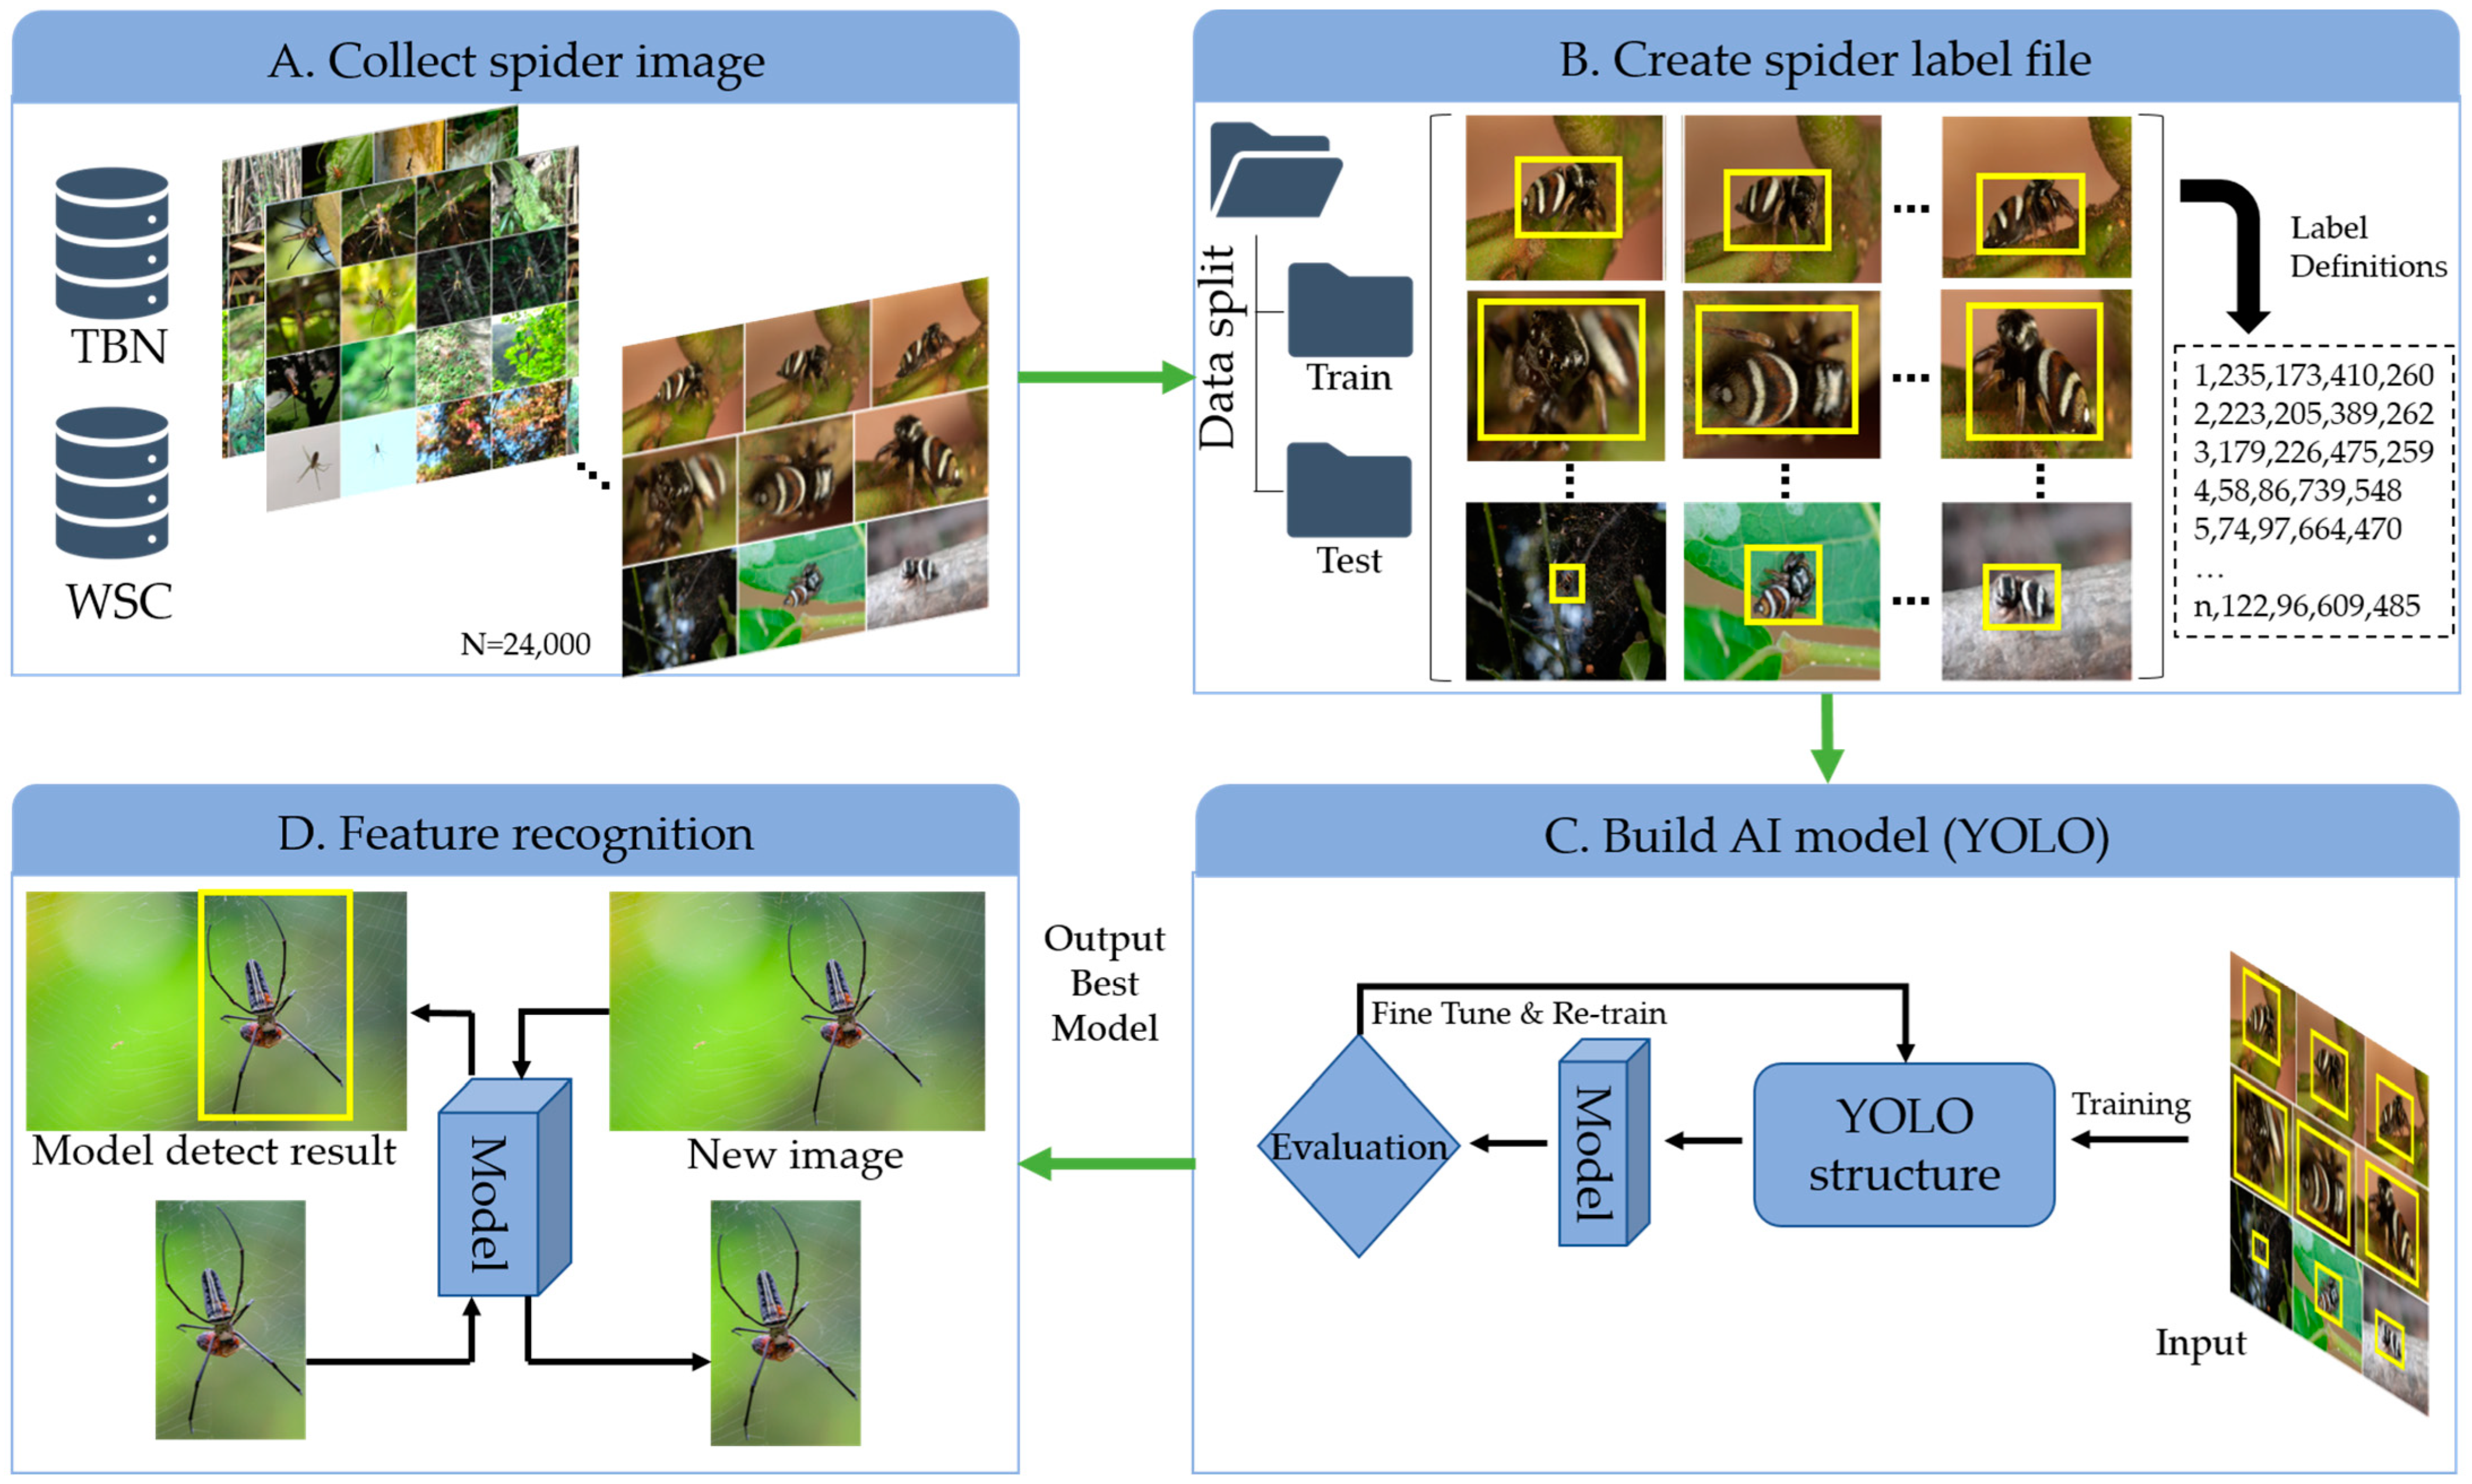
2. Methodology
2.1. Data Collection
2.2. Computer Specification
2.3. Dataset Labeling and Preparation Process
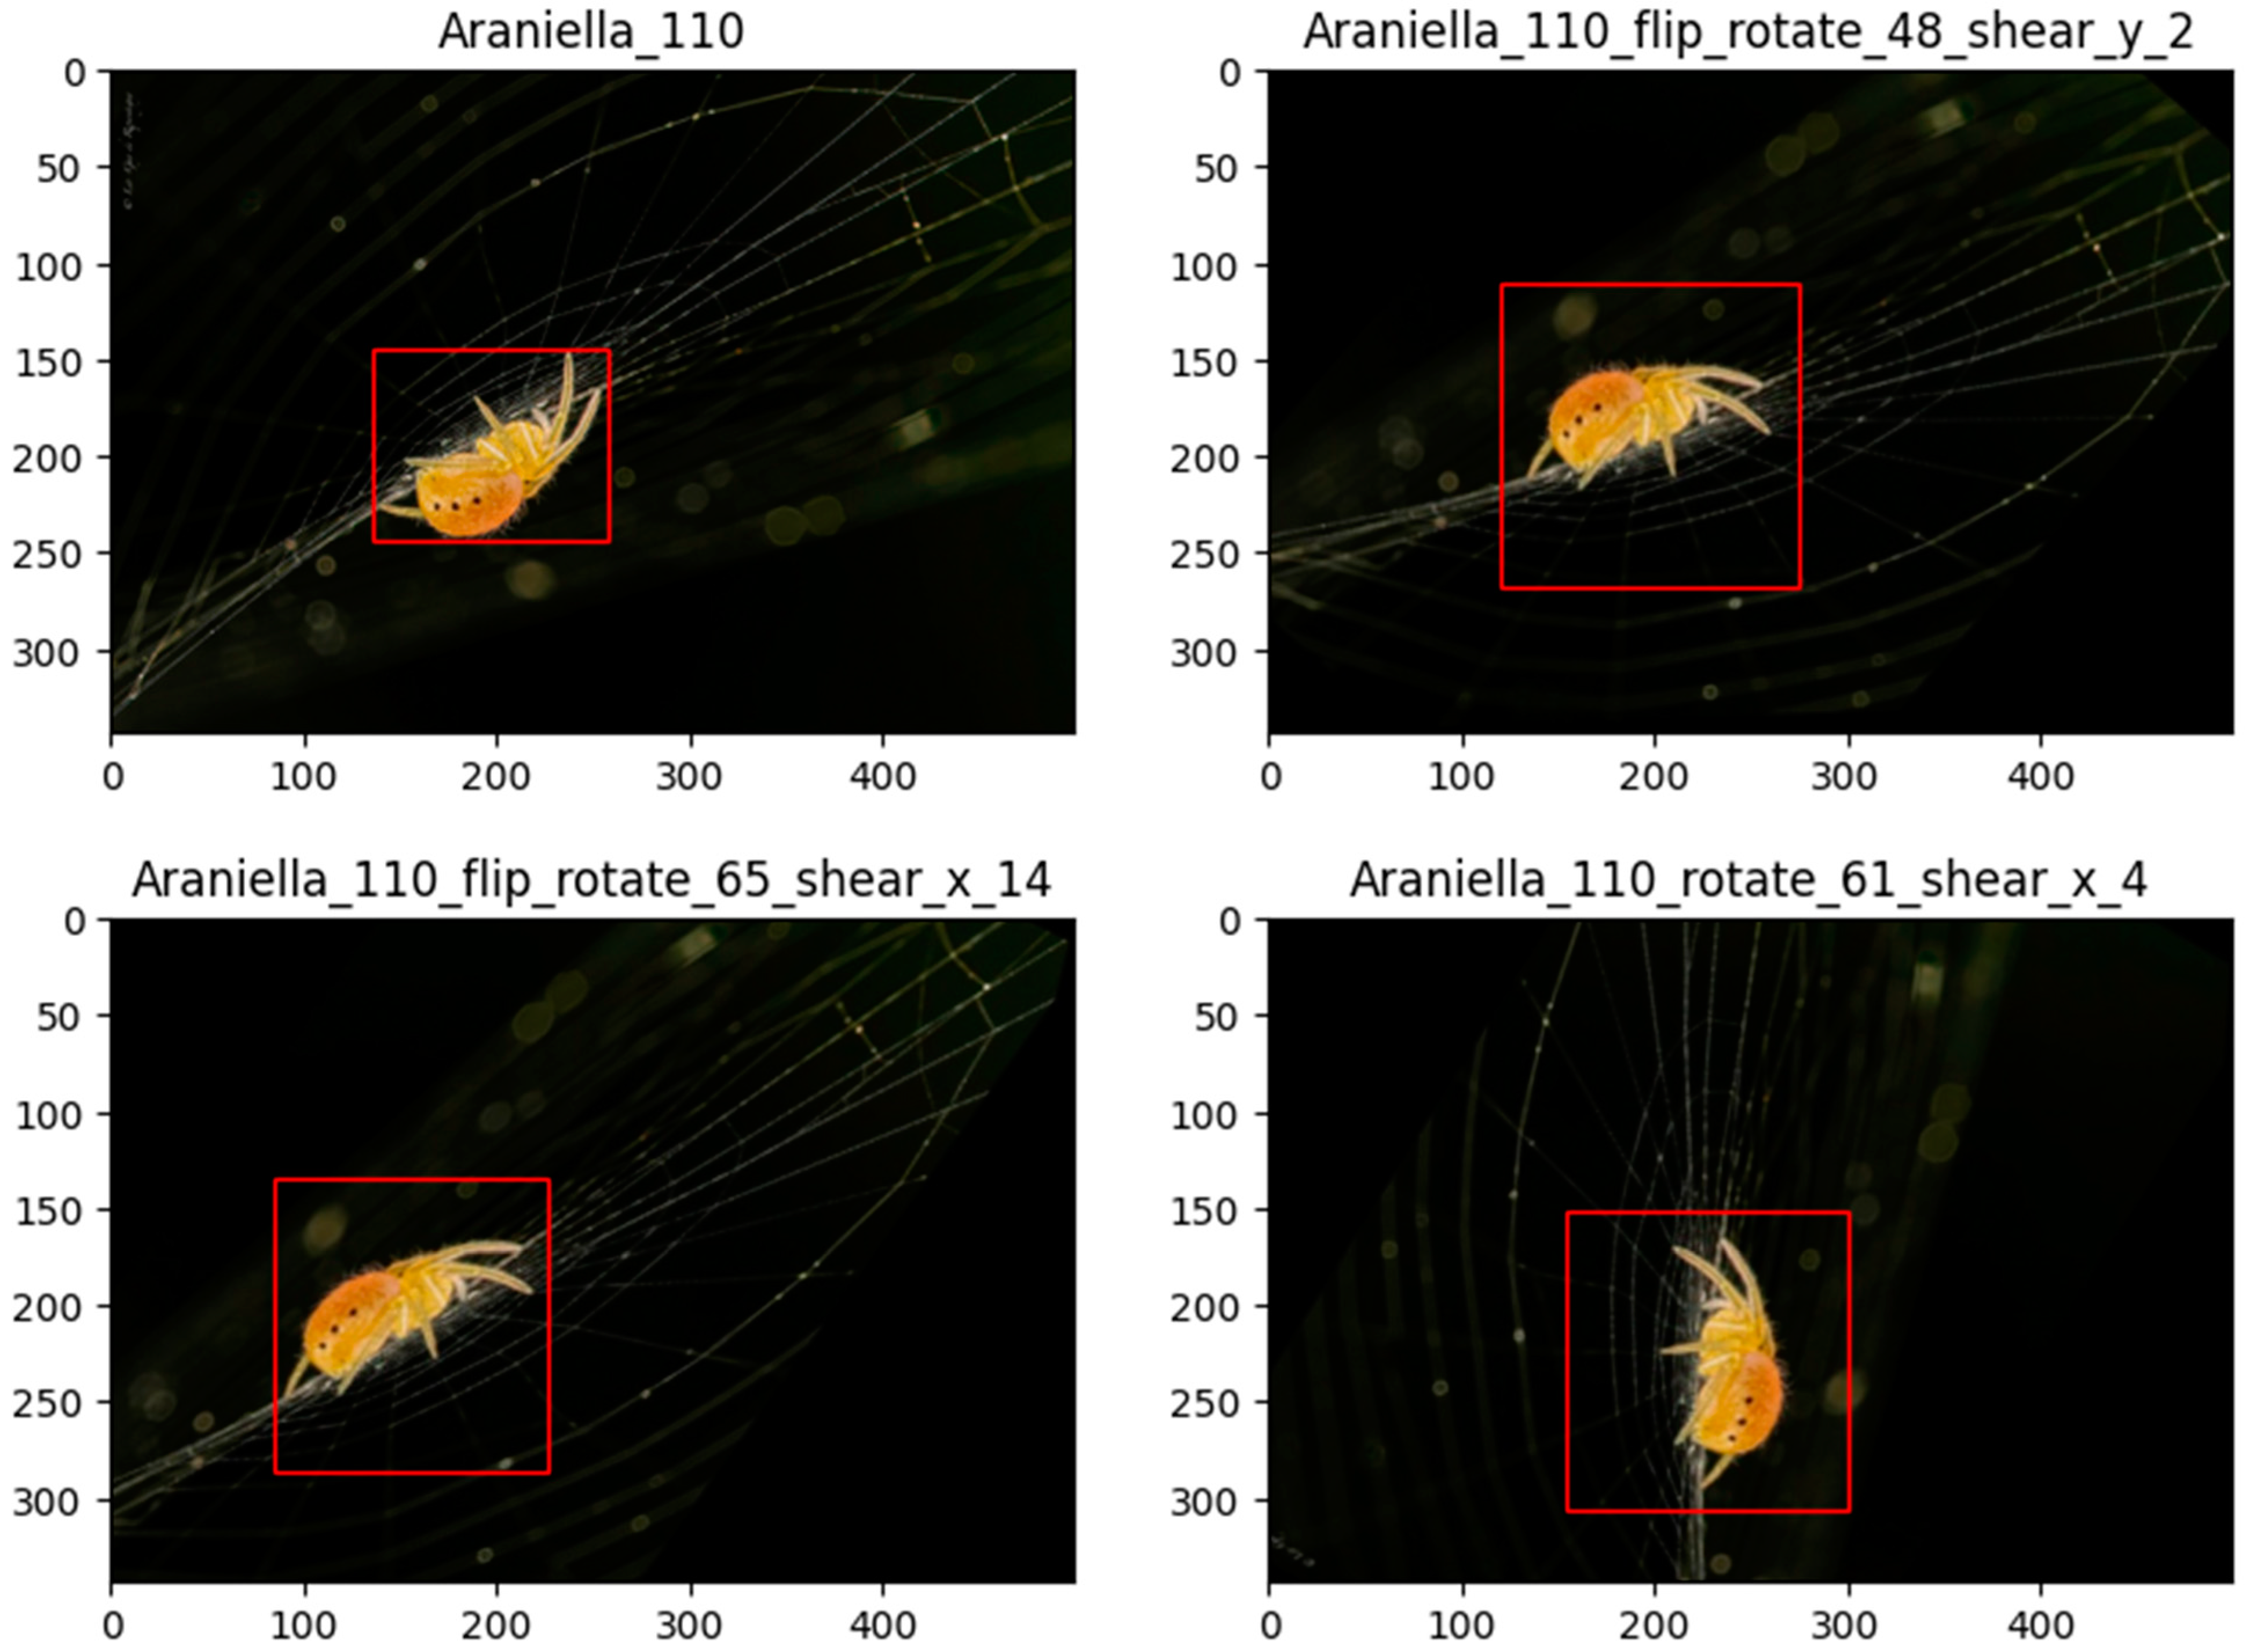
2.4. Data Augmentation and Dataset Balancing
2.5. Model Fine-Tuning Process and Evaluation Metrics
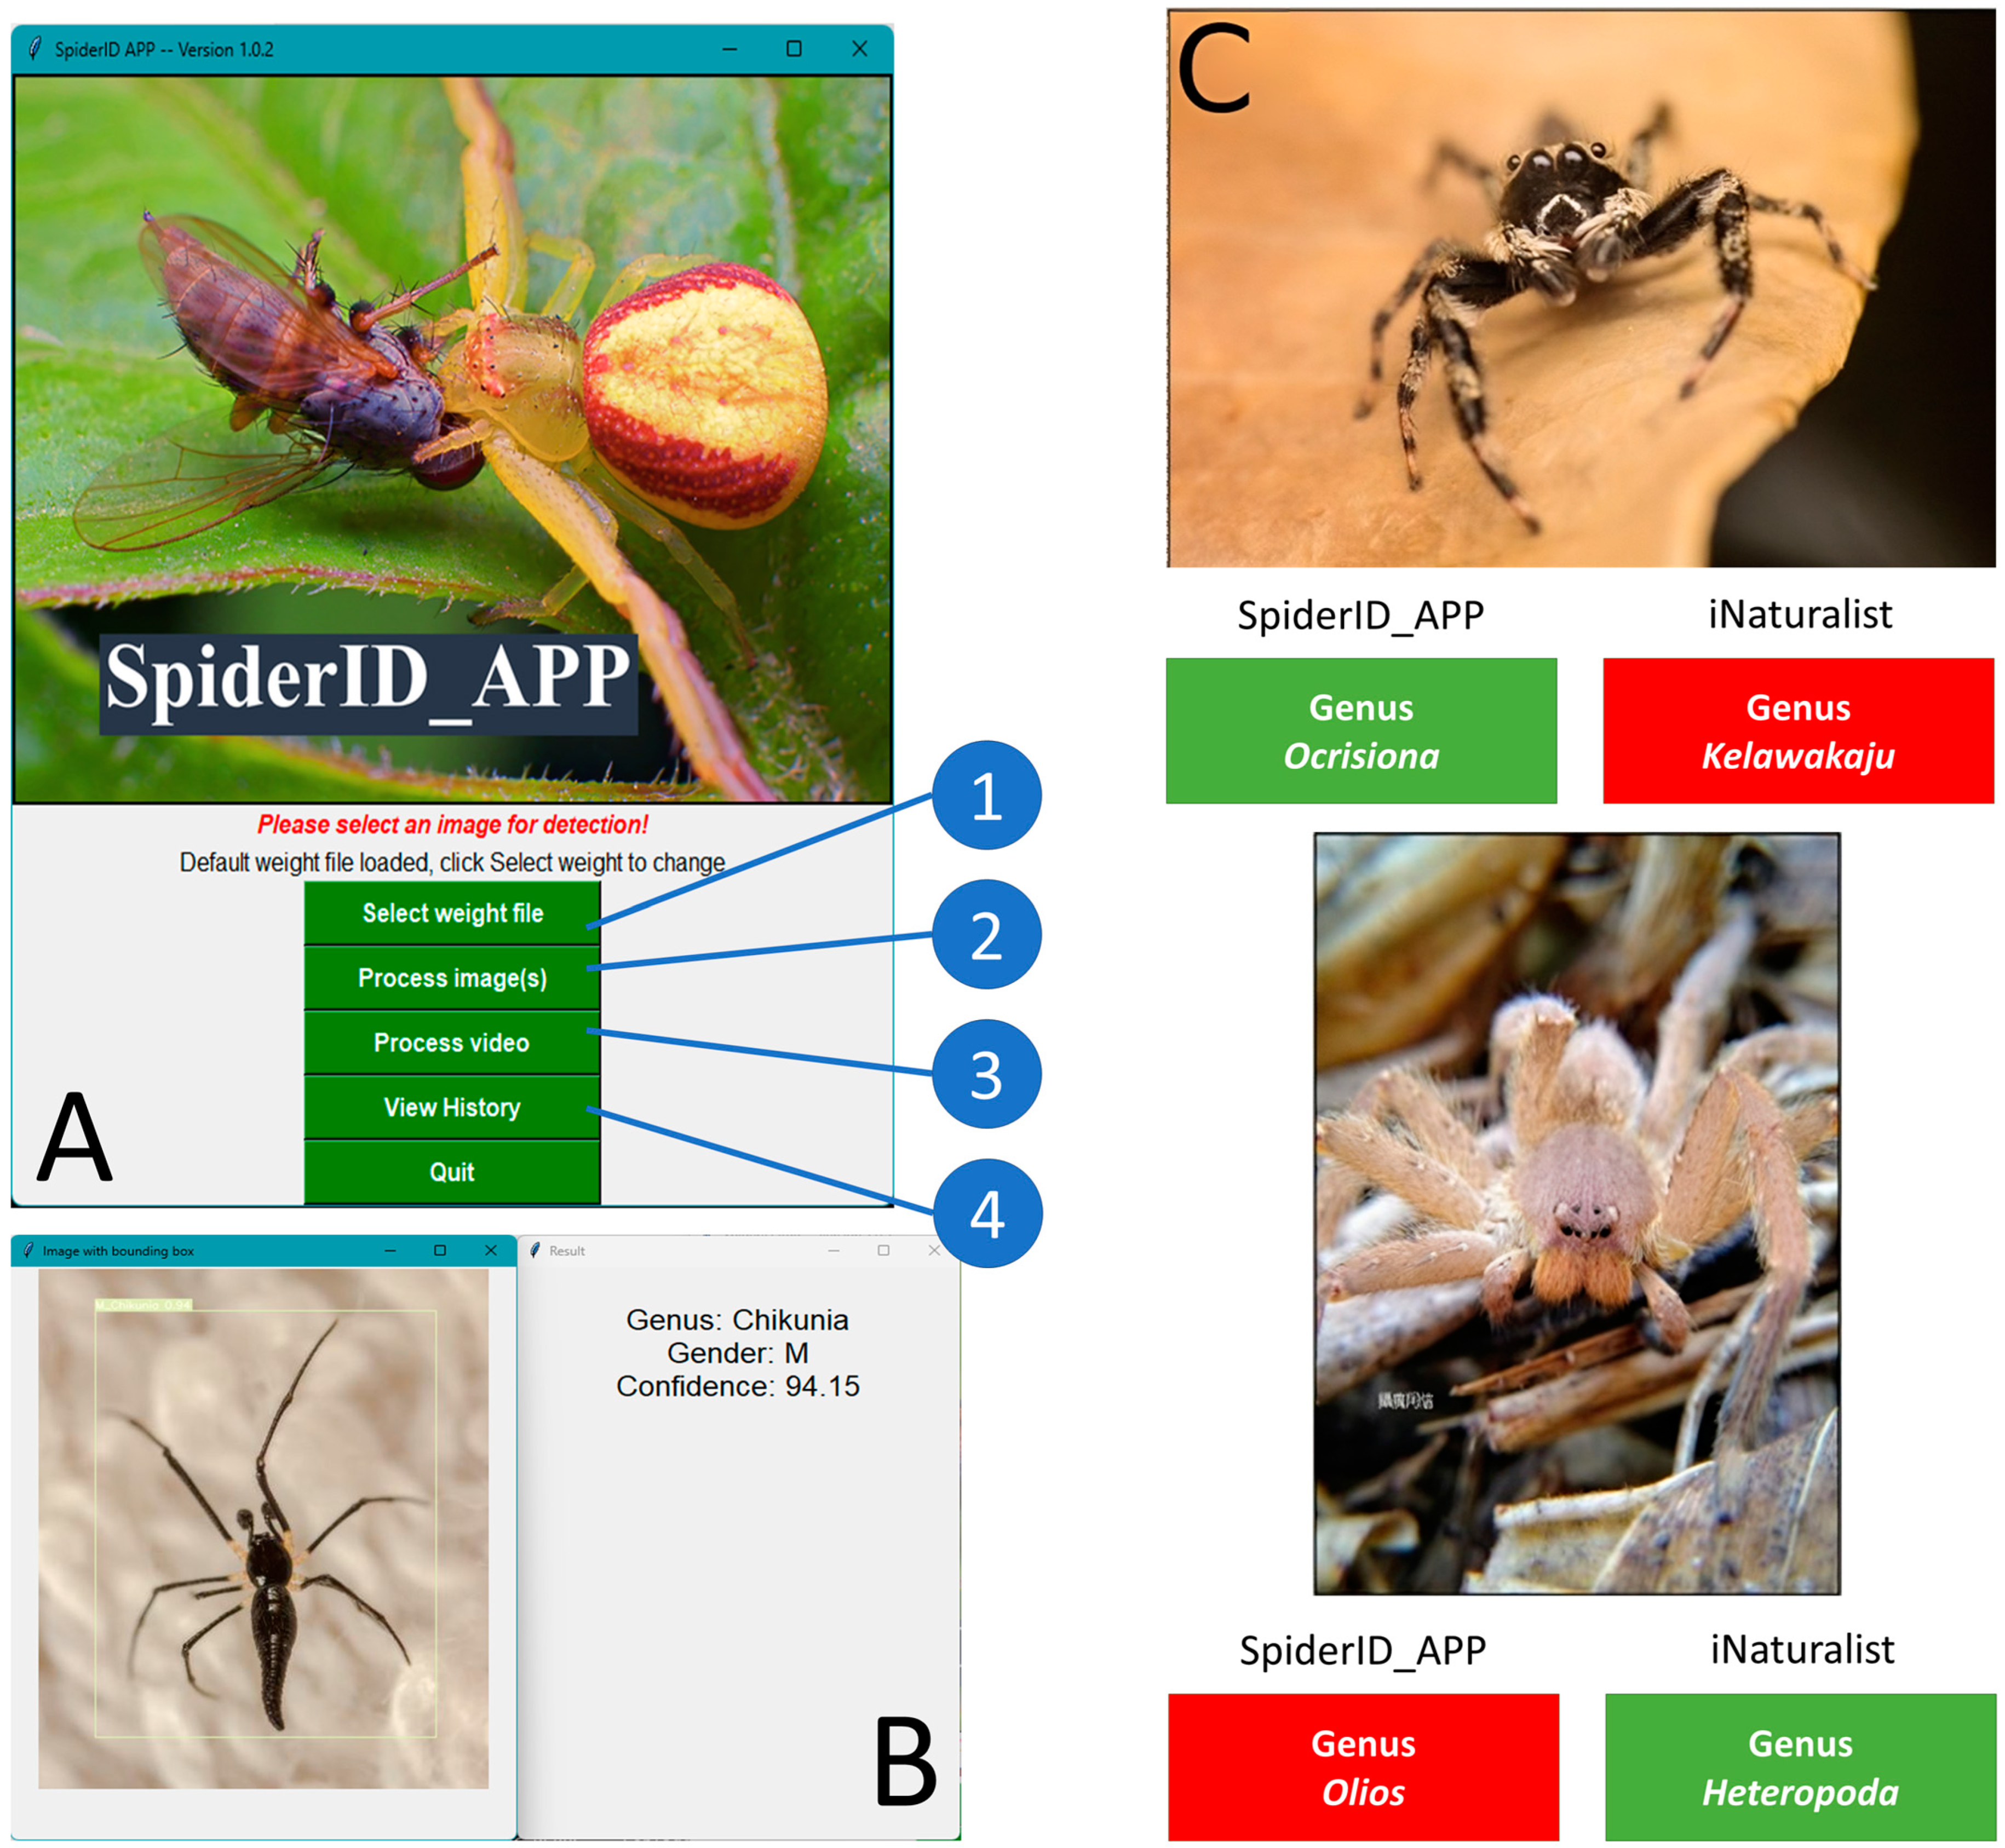
2.6. GUI Design
3. Result
3.1. Data Collection and Preparation
3.2. Model Complexity and Training Time Evaluation
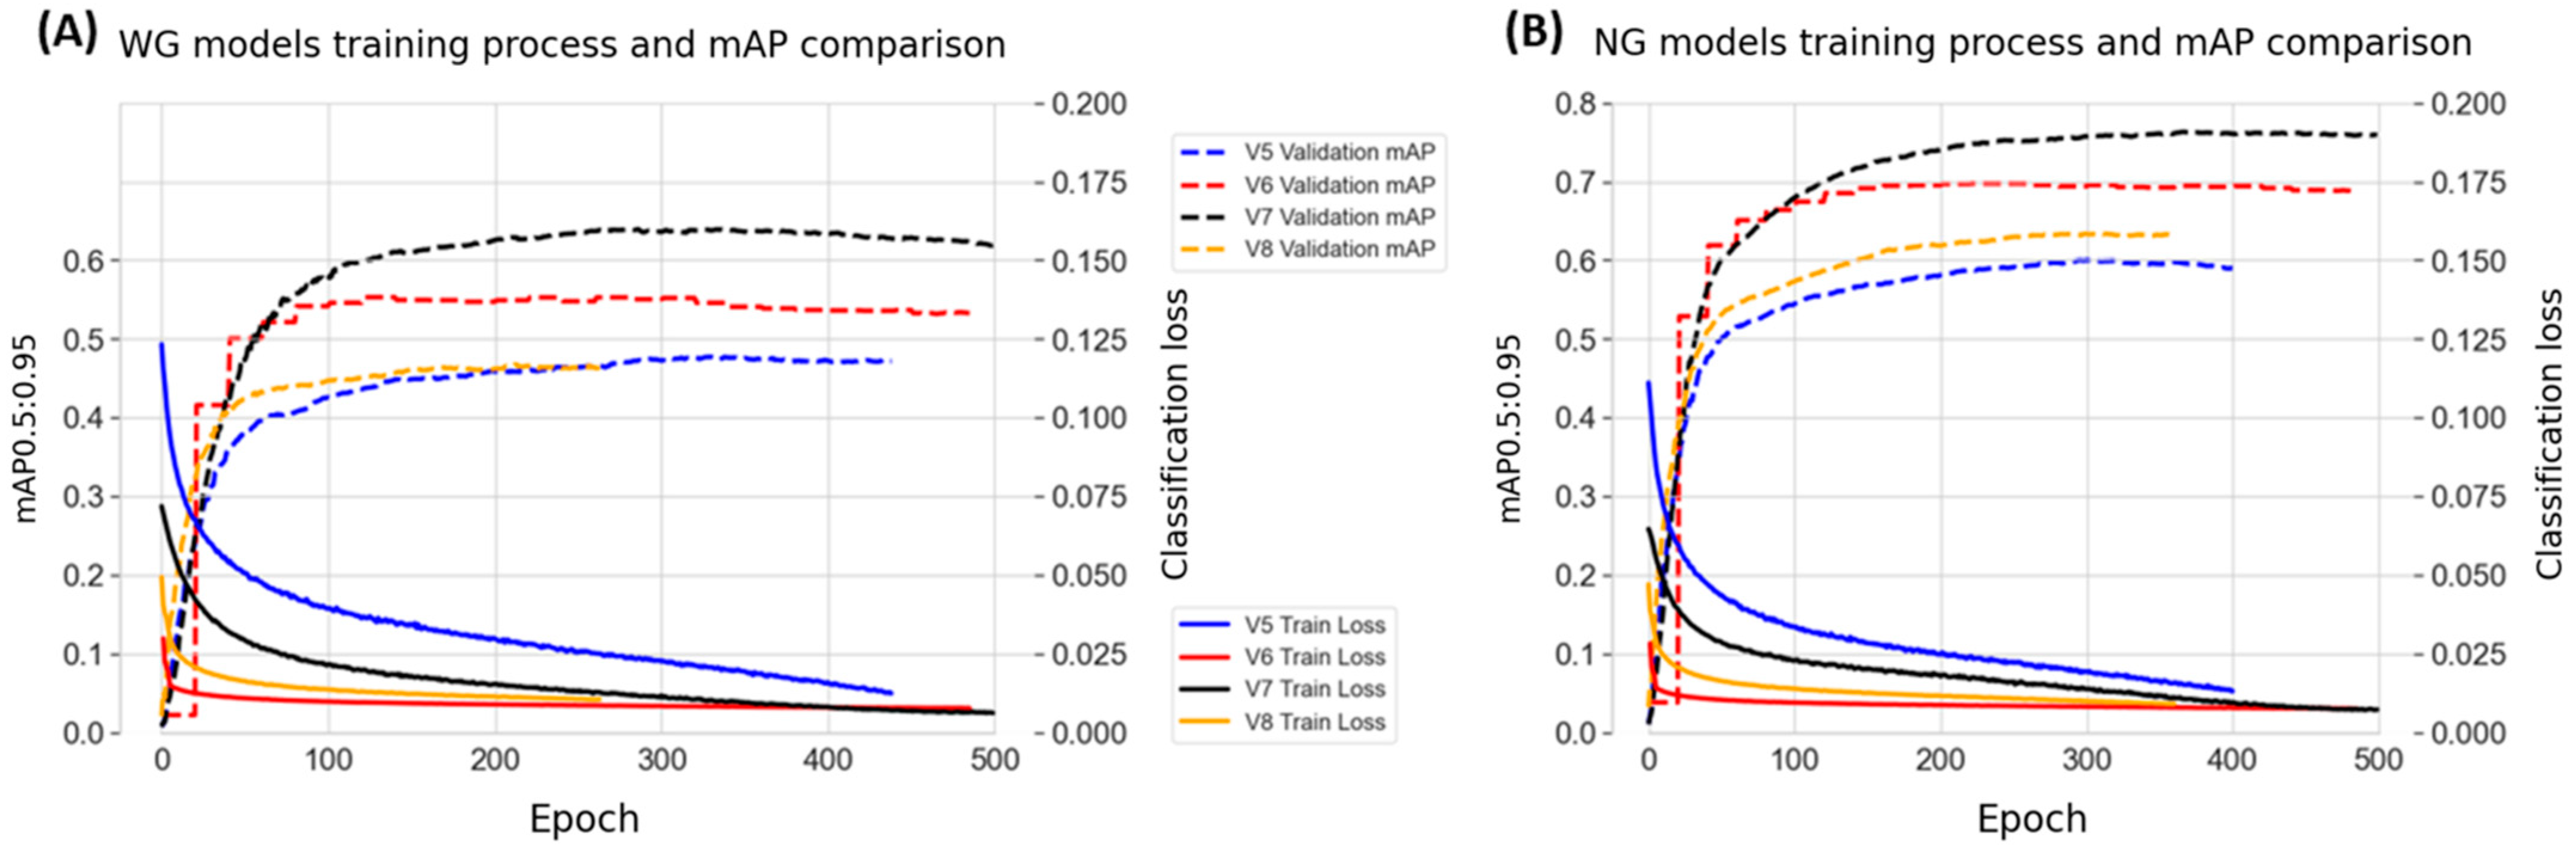
3.3. Cross-Model Evaluation in the Training Process
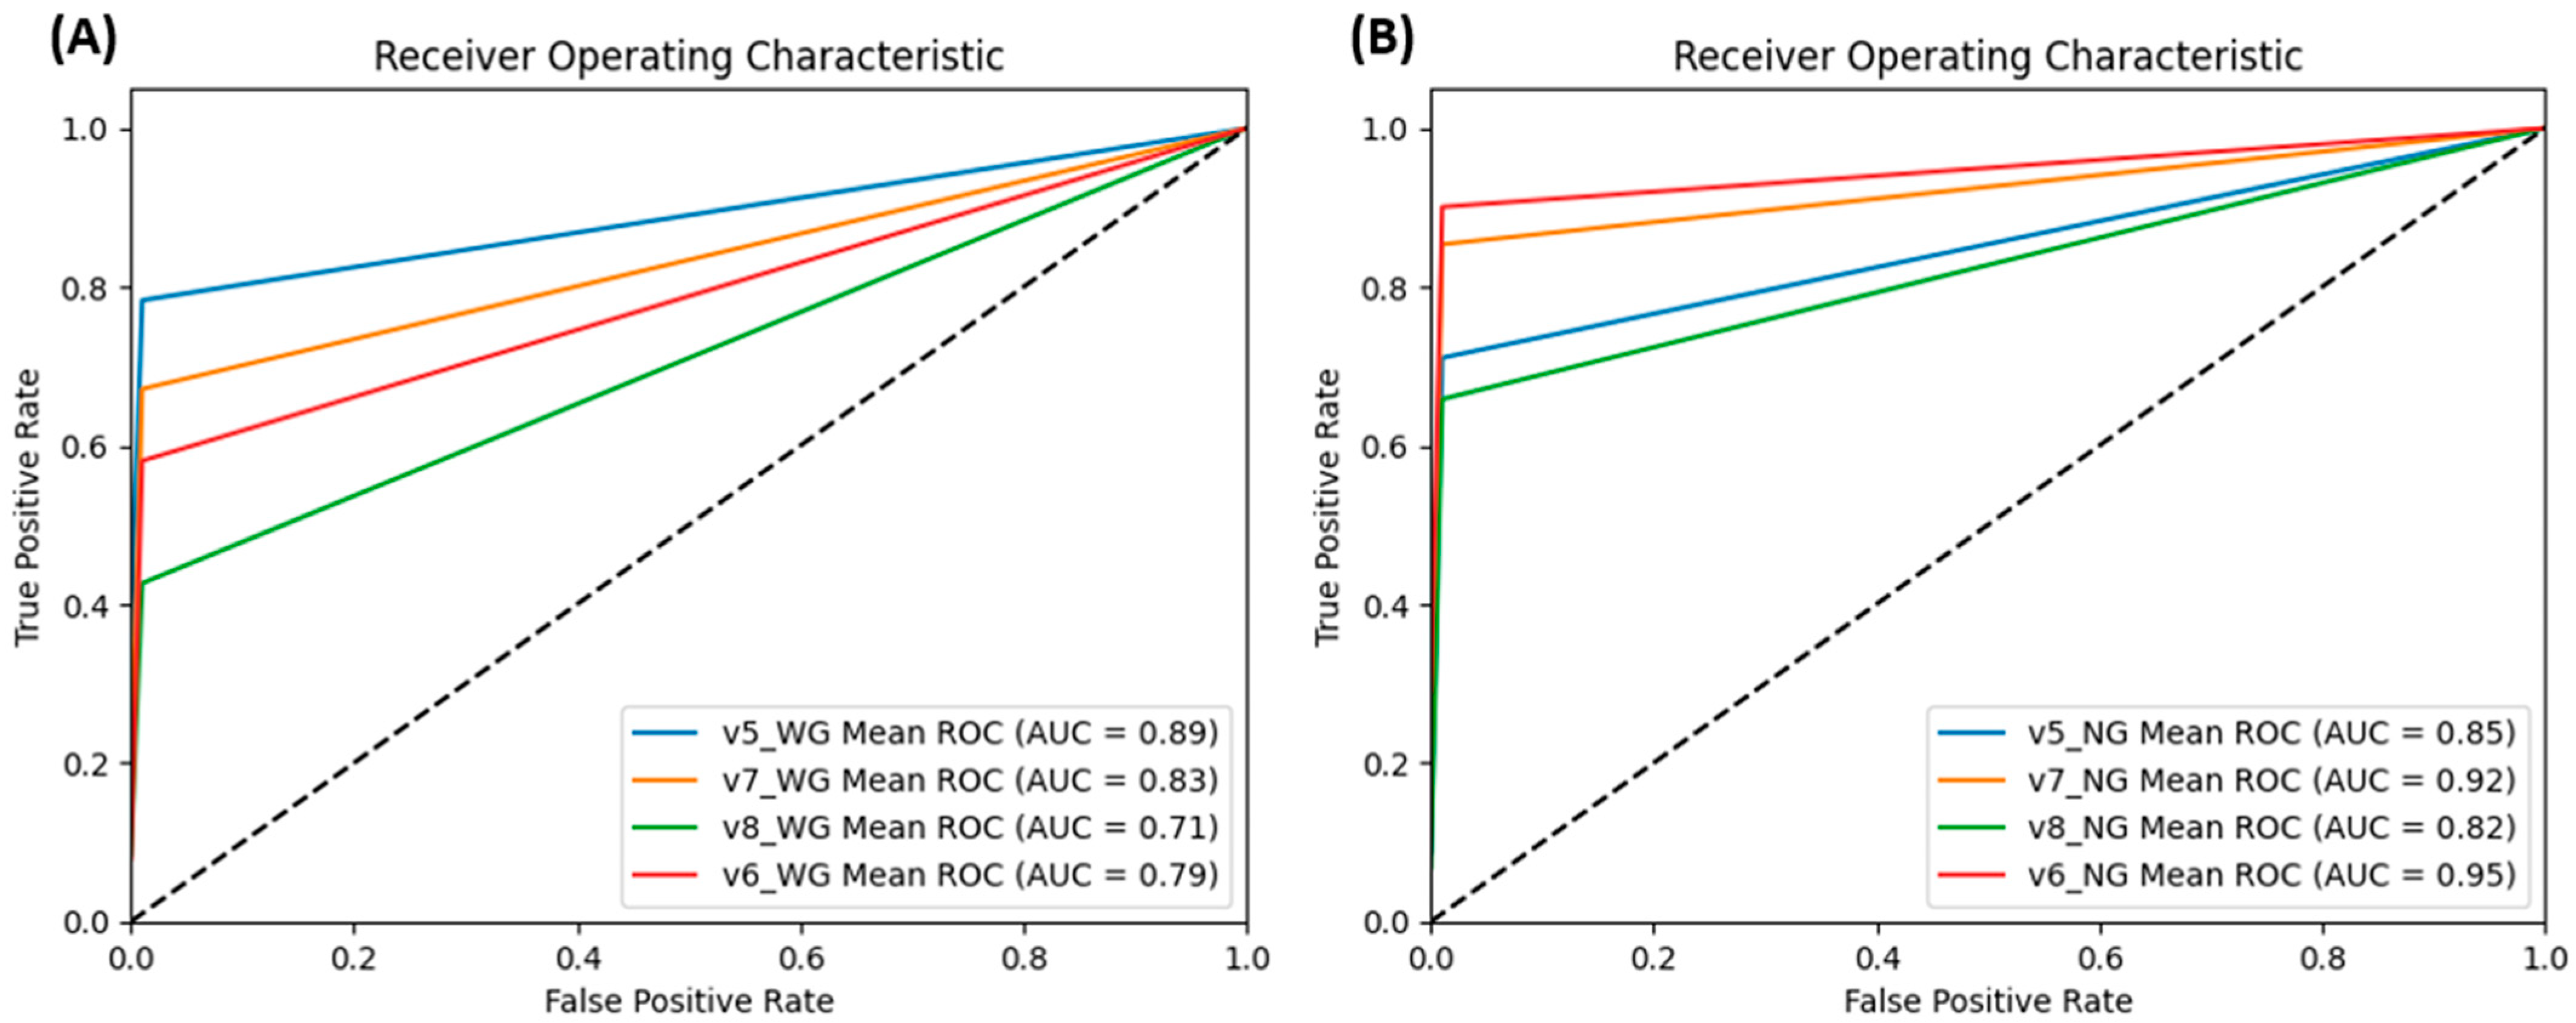
3.4. Cross-Model Evaluation on TeD
3.5. Optimization
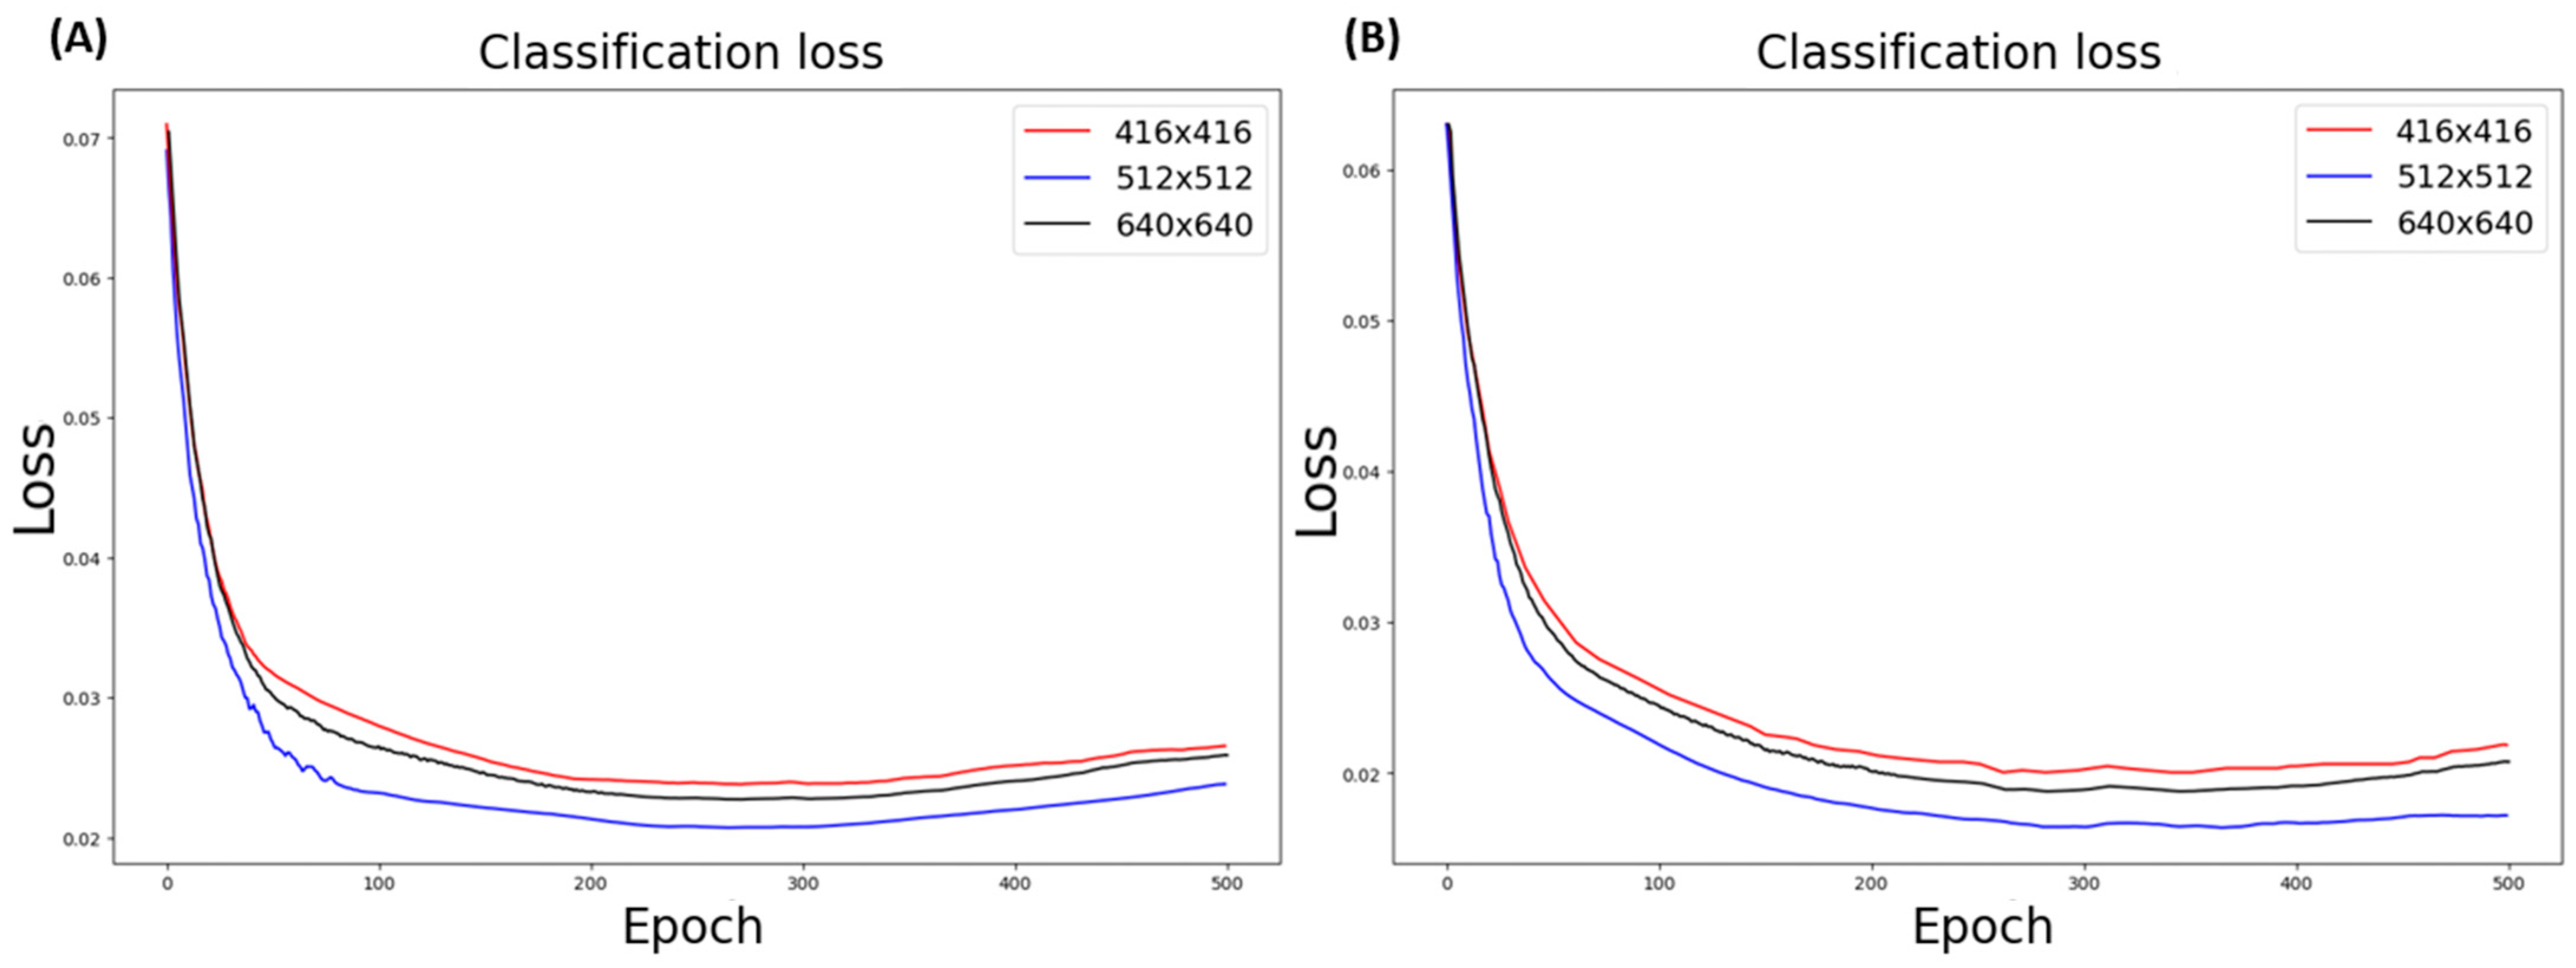
3.5.1. Data Resolution Selection
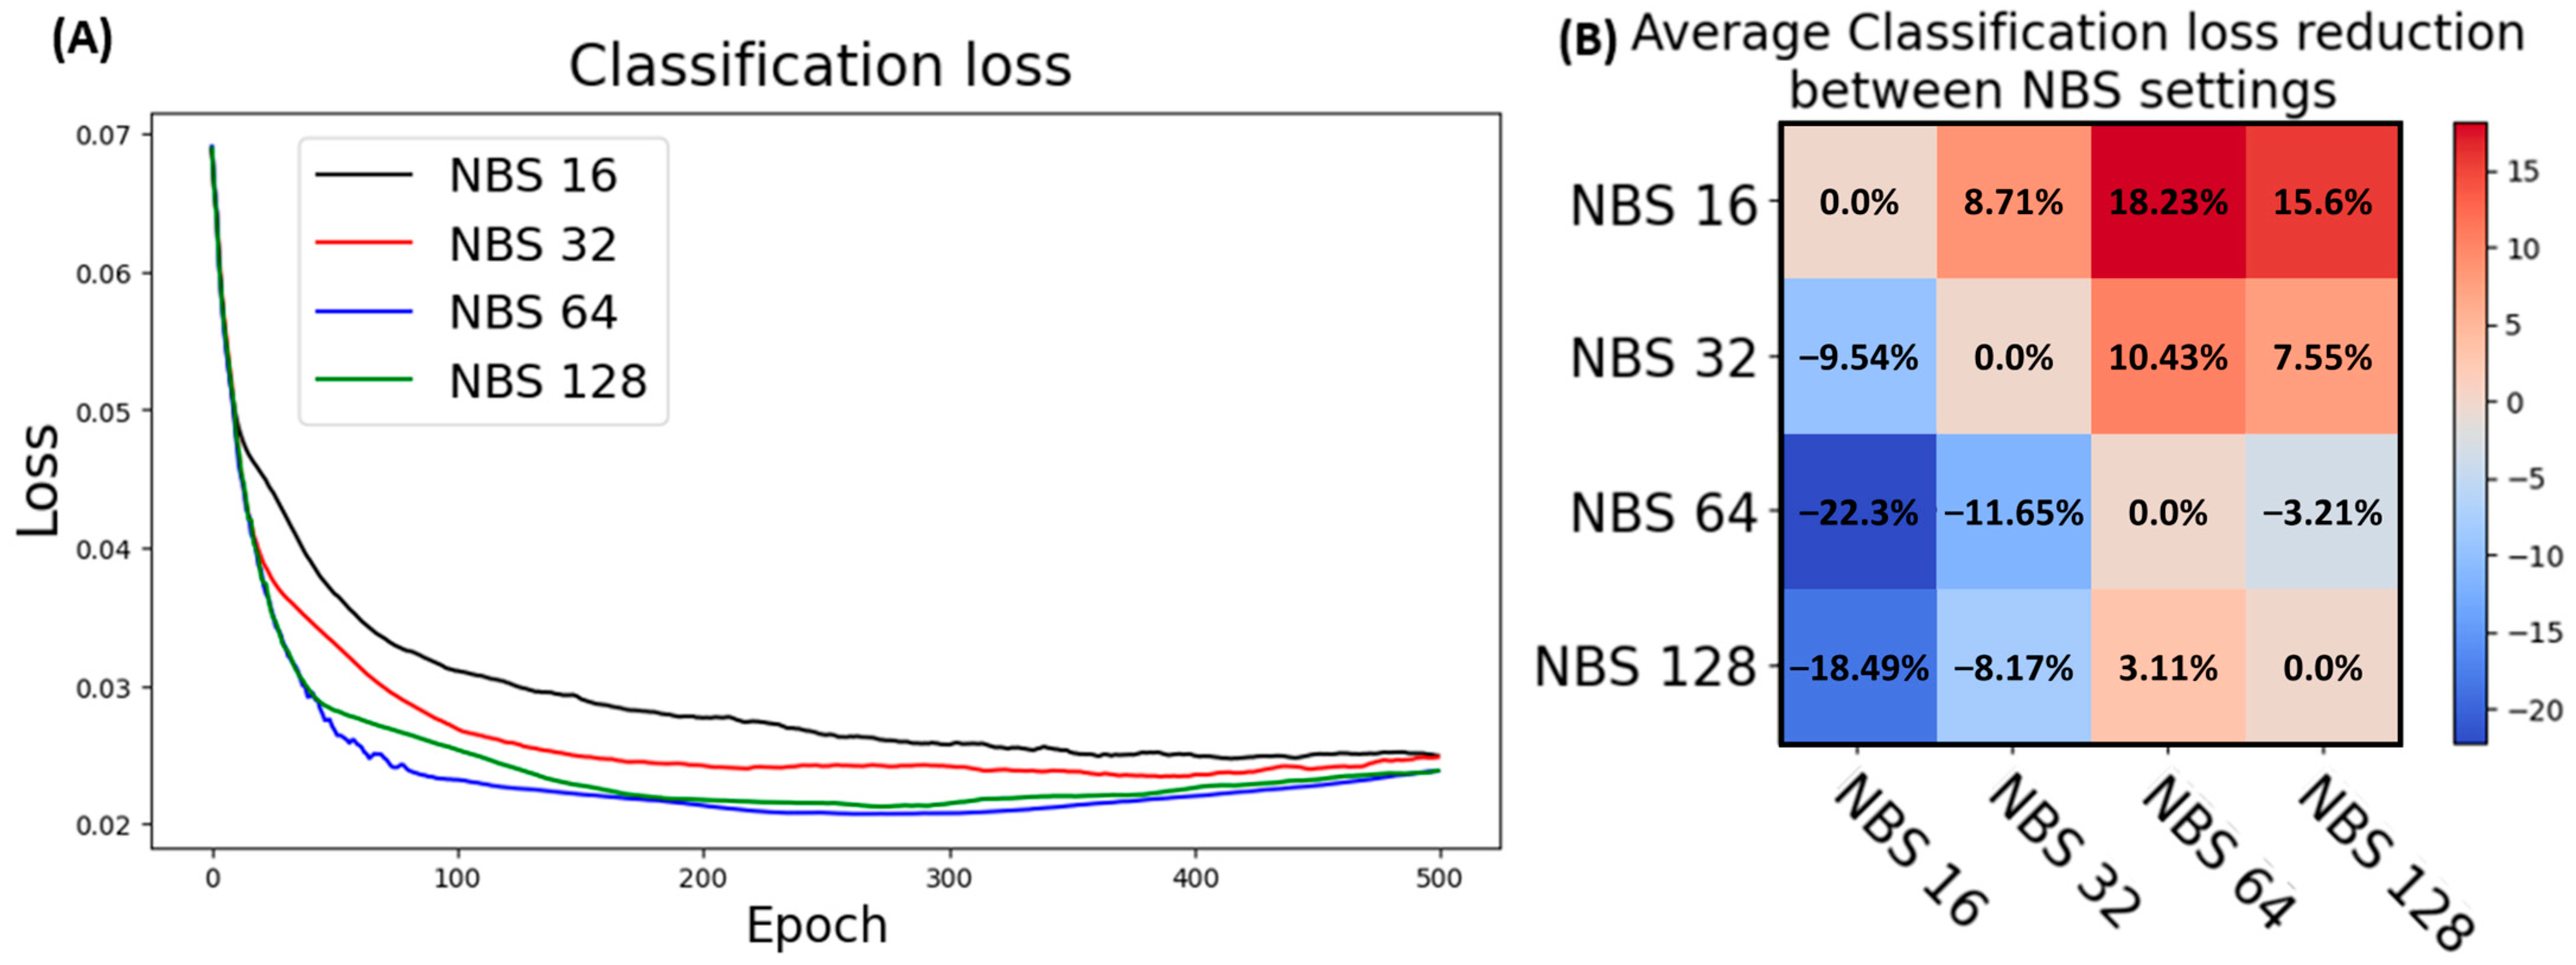
3.5.2. Batch Size Optimization
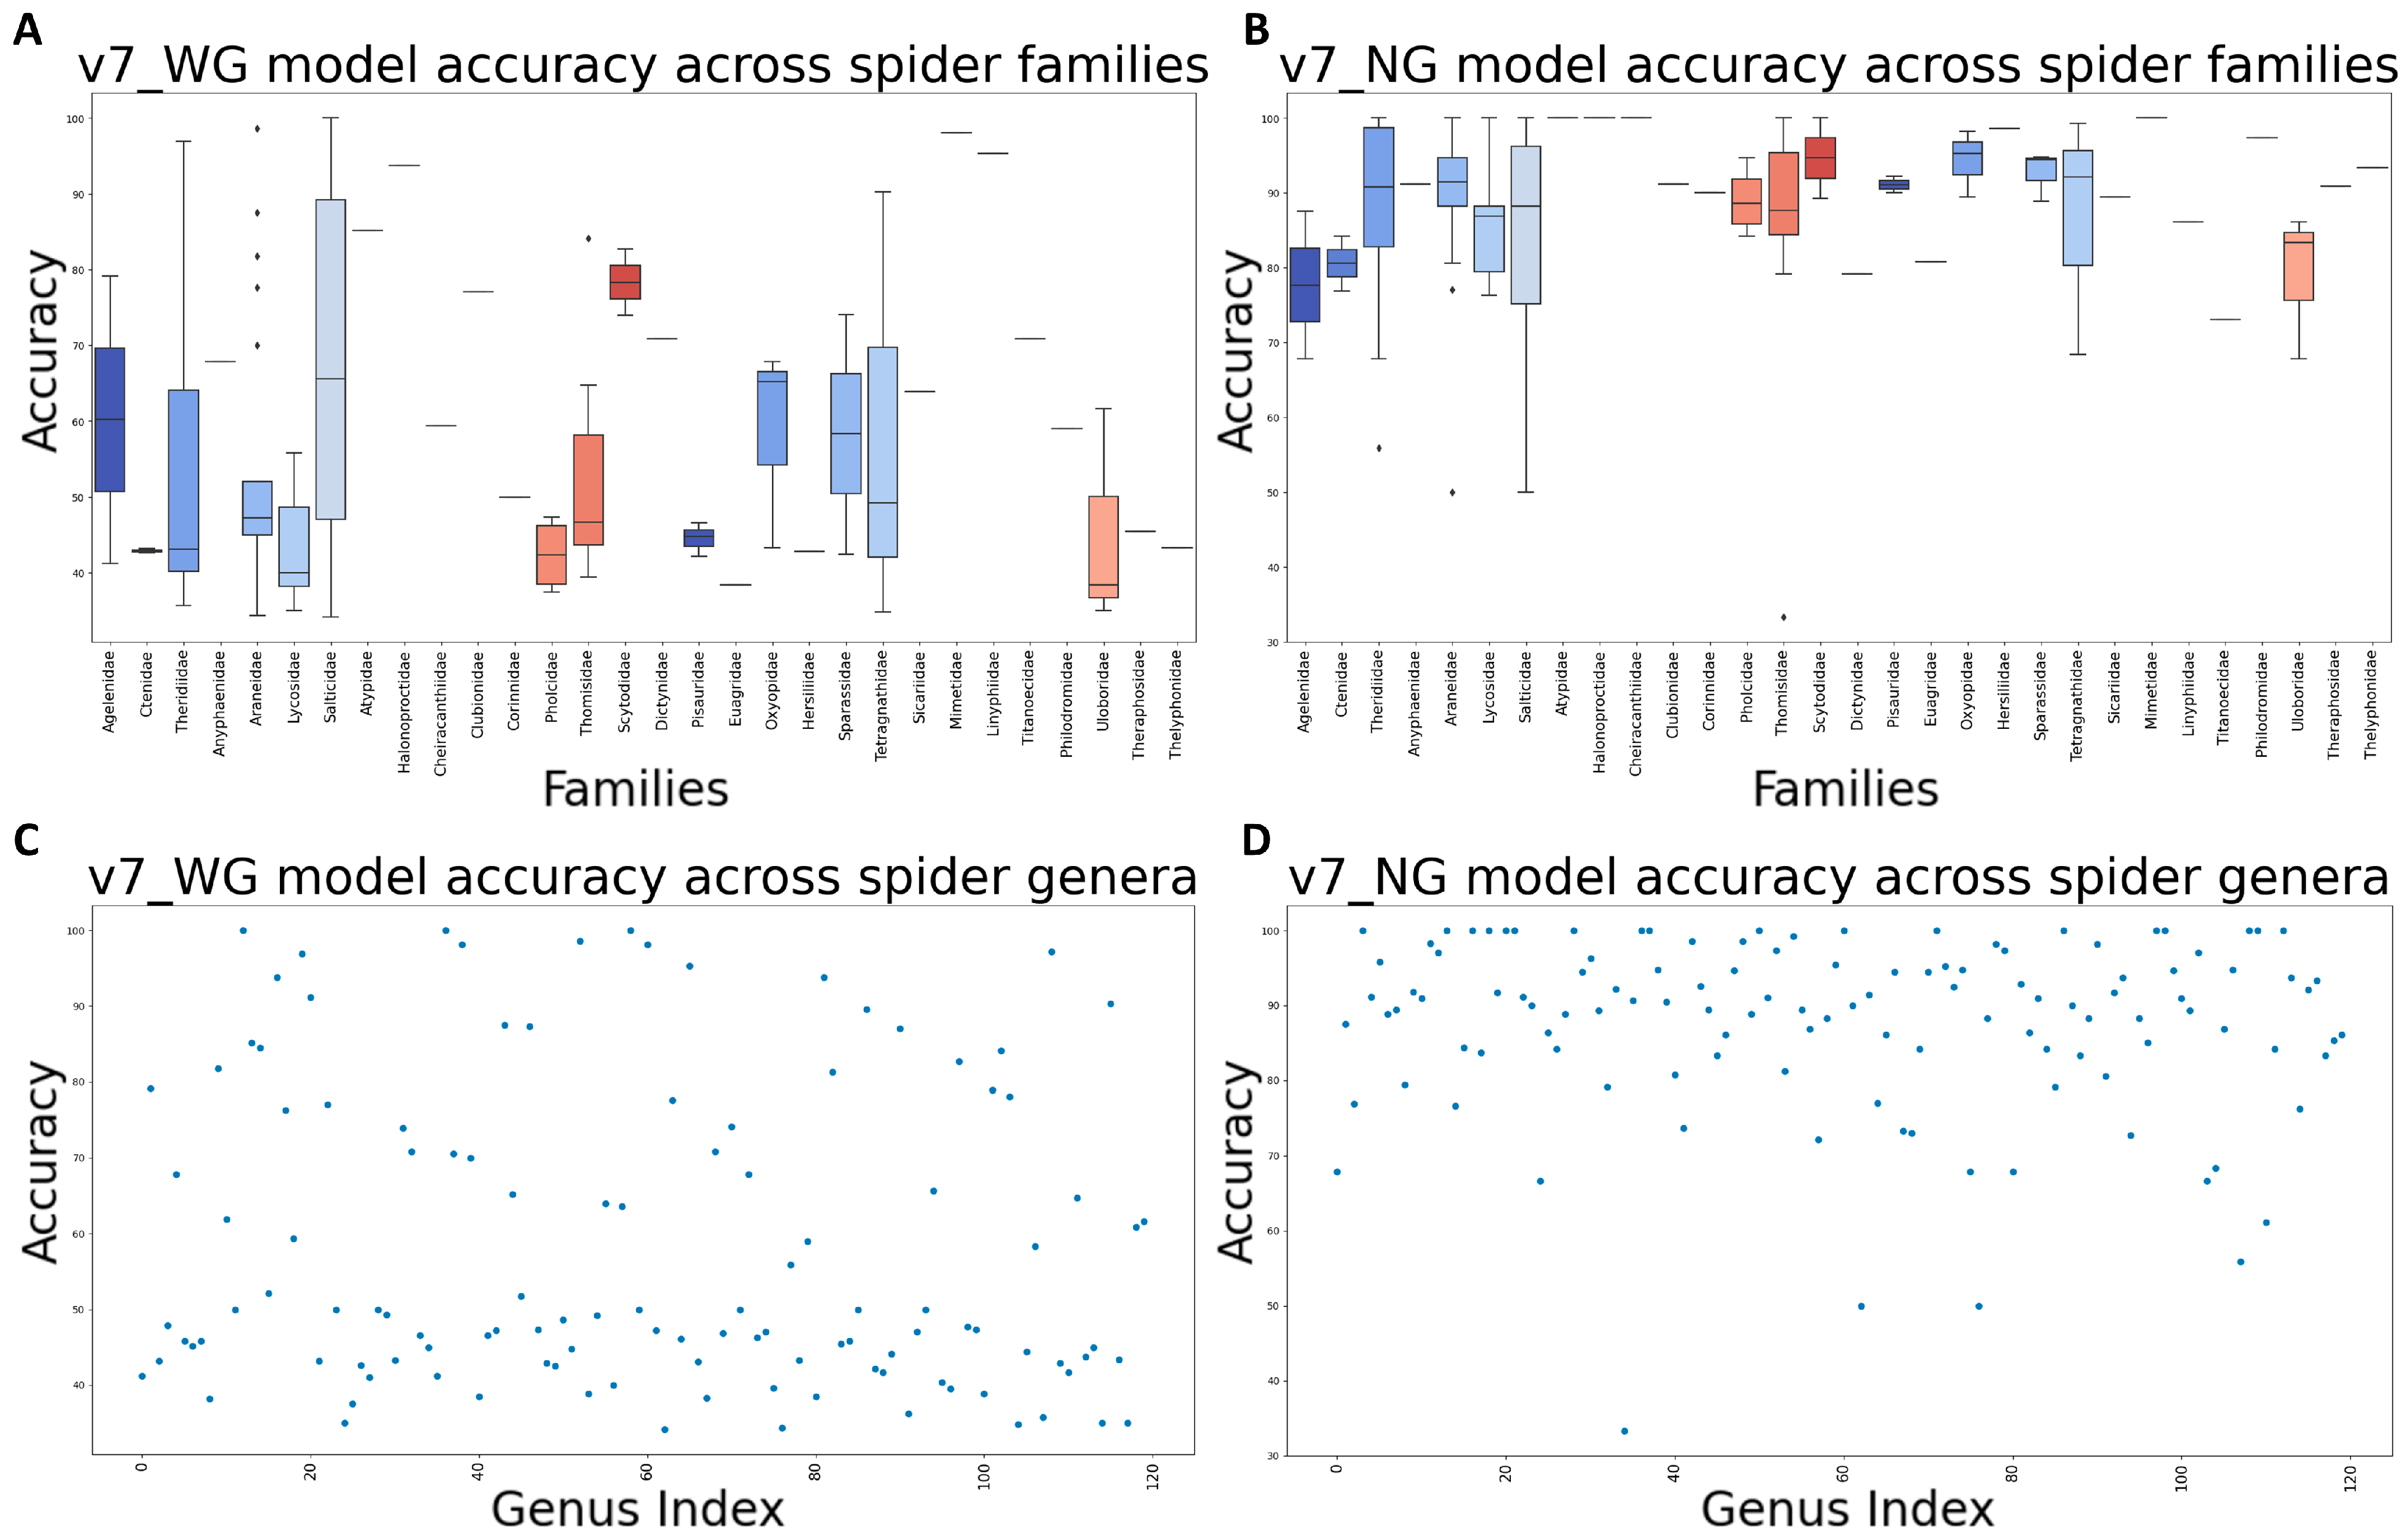
3.6. Assessment of Final Models through Internal Evaluation
3.7. Assessment of Final Models on Flexibility and Robustness
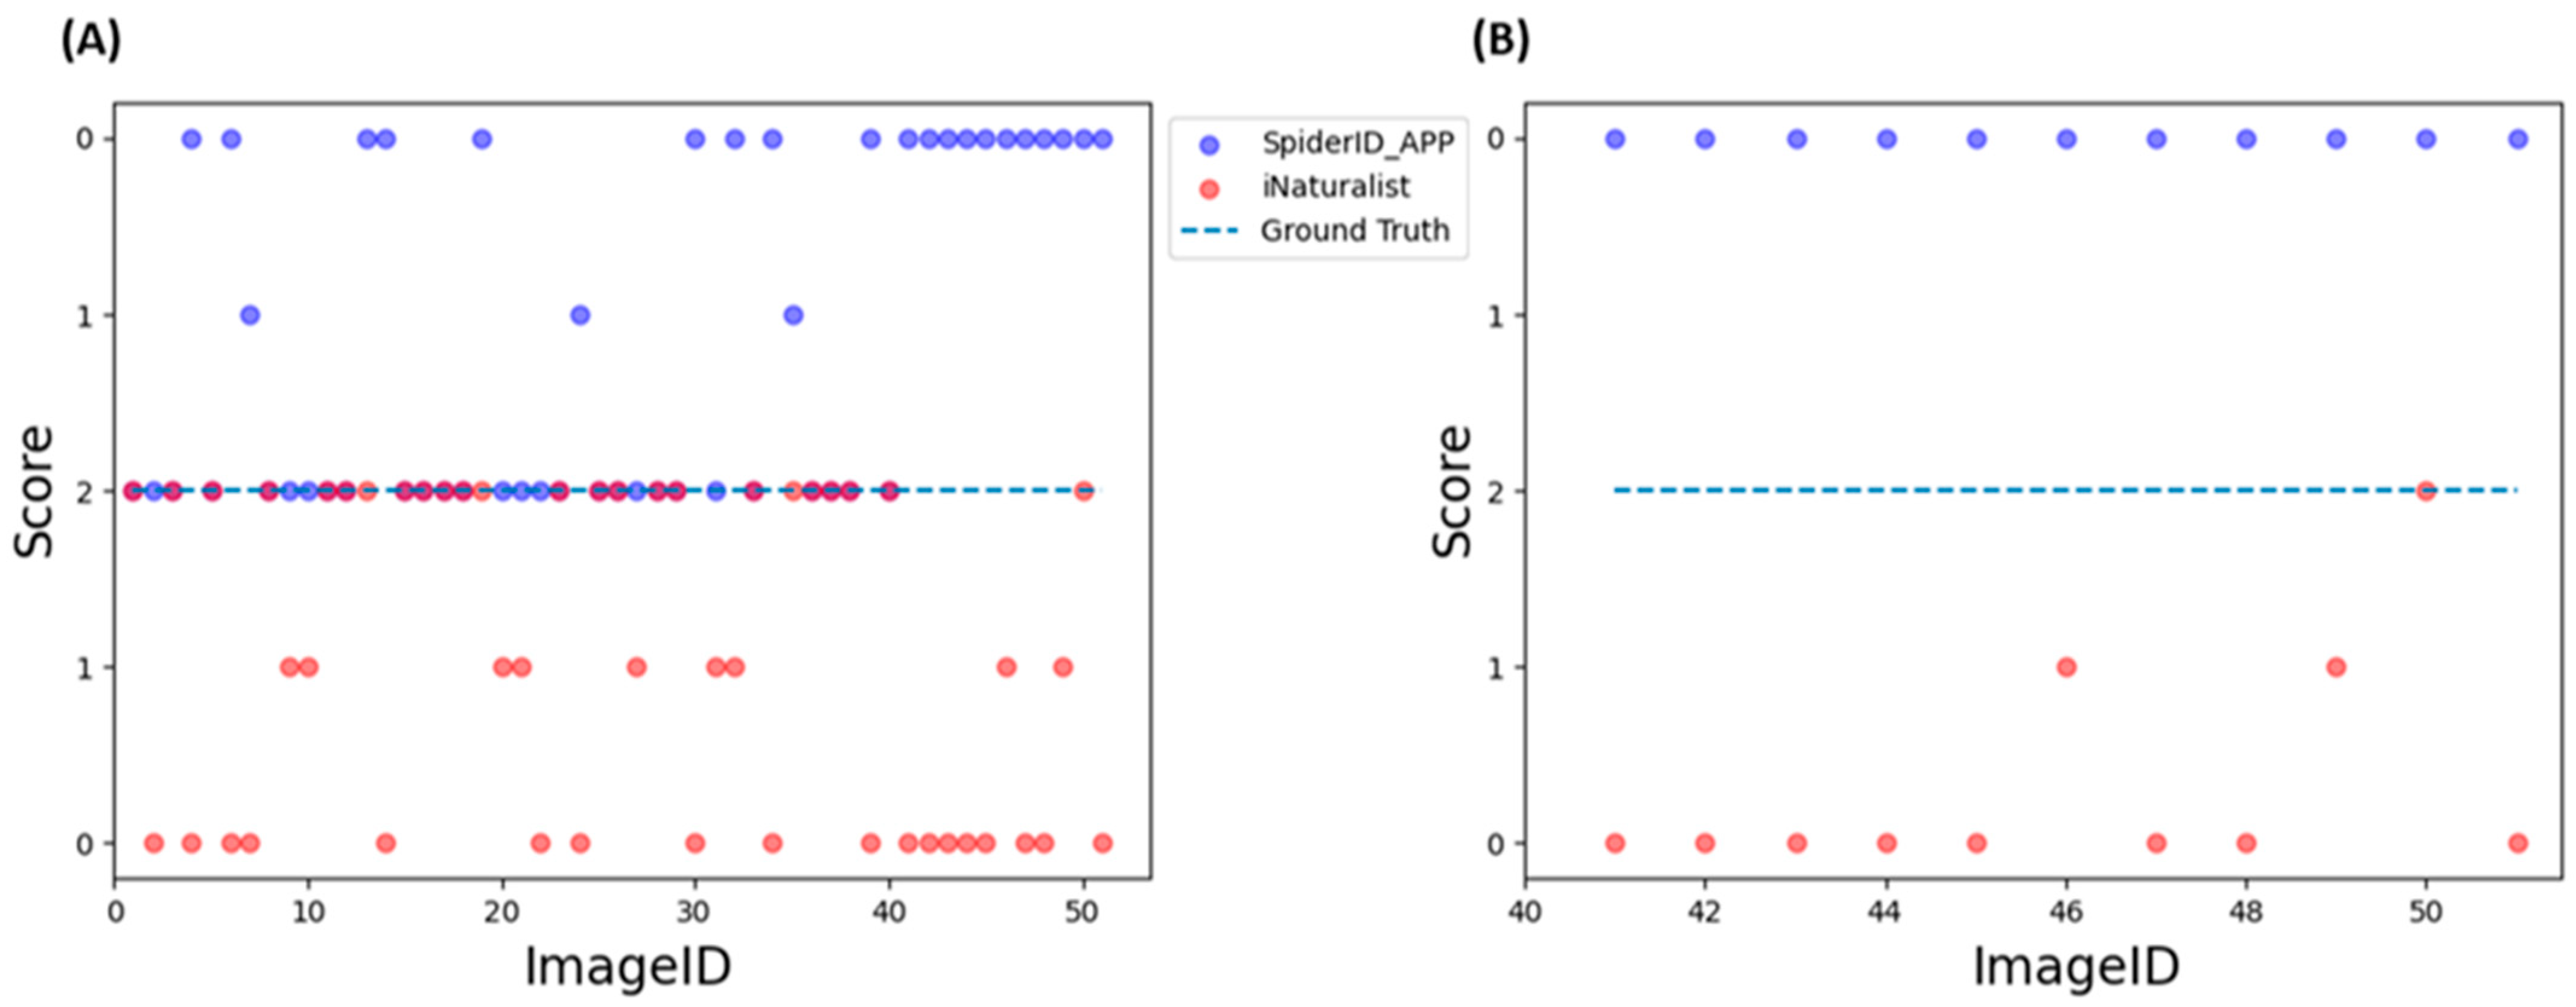
3.8. Assessment of Final Models through External Evaluation
3.9. Easy operation of SpiderID_APP for Spider Identification at the Genus Level
4. Discussion
5. Potential Limitations and Future Work
6. Conclusions
Supplementary Materials
Author Contributions
Funding
Institutional Review Board Statement
Informed Consent Statement
Data Availability Statement
Acknowledgments
Conflicts of Interest
References
- Coyle, F.A. Effects of clearcutting on the spider community of a southern Appalachian forest. J. Arachnol. 1981, 9, 285–298. [Google Scholar]
- Nyffeler, M.; Sunderland, K.D. Composition, abundance and pest control potential of spider communities in agroecosystems: A comparison of European and US studies. Agric. Ecosyst. Environ. 2003, 95, 579–612. [Google Scholar] [CrossRef]
- Natural History Museum Bern. World Spider Catalog. Version 22.0. 2021. Available online: https://wsc.nmbe.ch/resources/archive/catalog_22.0/index.html (accessed on 17 July 2022).
- Riechert, S.E. Thoughts on the ecological significance of spiders. BioScience 1974, 24, 352–356. [Google Scholar] [CrossRef]
- Wise, D.H. Spiders in Ecological Webs; Cambridge University Press: Cambridge, UK, 1995. [Google Scholar]
- McLean, C.J.; Garwood, R.J.; Brassey, C.A. Sexual dimorphism in the Arachnid orders. PeerJ 2018, 6, e5751. [Google Scholar] [CrossRef]
- Vollrath, F.; Parker, G.A. Sexual dimorphism and distorted sex ratios in spiders. Nature 1992, 360, 156–159. [Google Scholar] [CrossRef]
- Saturnino, R.; Bonaldo, A.B. Taxonomic review of the New World spider genus Elaver O. Pickard-Cambridge, 1898 (Araneae, Clubionidae). Zootaxa 2015, 4045, 1–119. [Google Scholar] [CrossRef] [PubMed]
- Miller, J.A. Review of erigonine spider genera in the Neotropics (Araneae: Linyphiidae, Erigoninae). Zool. J. Linn. Soc. 2007, 149, 1–263. [Google Scholar] [CrossRef]
- Do, M.; Harp, J.; Norris, K. A test of a pattern recognition system for identification of spiders. Bull. Entomol. Res. 1999, 89, 217–224. [Google Scholar] [CrossRef]
- Derraik, J.G.; Closs, G.P.; Dickinson, K.J.; Sirvid, P.; Barratt, B.I.; Patrick, B.H. Arthropod morphospecies versus taxonomic species: A case study with Araneae, Coleoptera, and Lepidoptera. Conserv. Biol. 2002, 16, 1015–1023. [Google Scholar] [CrossRef]
- Bonney, R.; Cooper, C.B.; Dickinson, J.; Kelling, S.; Phillips, T.; Rosenberg, K.V.; Shirk, J. Citizen science: A developing tool for expanding science knowledge and scientific literacy. BioScience 2009, 59, 977–984. [Google Scholar] [CrossRef]
- Pocock, M.J.O.; Roy, H.E.; Preston, C.D.; Roy, D.B. The Biological Records Centre: A pioneer of citizen science. Biol. J. Linn. Soc. 2015, 115, 475–493. [Google Scholar] [CrossRef]
- Di Febbraro, M.; Bosso, L.; Fasola, M.; Santicchia, F.; Aloise, G.; Lioy, S.; Tricarico, E.; Ruggieri, L.; Bovero, S.; Mori, E. Different facets of the same niche: Integrating citizen science and scientific survey data to predict biological invasion risk under multiple global change drivers. Glob. Chang. Biol. 2023, 29, 5509–5523. [Google Scholar] [CrossRef]
- Nanglu, K.; de Carle, D.; Cullen, T.M.; Anderson, E.B.; Arif, S.; Castañeda, R.A.; Chang, L.M.; Iwama, R.E.; Fellin, E.; Manglicmot, R.C. The nature of science: The fundamental role of natural history in ecology, evolution, conservation, and education. Ecol. Evol. 2023, 13, e10621. [Google Scholar] [CrossRef] [PubMed]
- Hart, A.G.; Nesbit, R.; Goodenough, A.E. Spatiotemporal variation in house spider phenology at a national scale using citizen science. Arachnology 2018, 17, 331–334. [Google Scholar] [CrossRef]
- Nugent, J. INaturalist. Sci. Scope 2018, 41, 12–13. [Google Scholar] [CrossRef]
- Van Horn, G.; Mac Aodha, O.; Song, Y.; Cui, Y.; Sun, C.; Shepard, A.; Adam, H.; Perona, P.; Belongie, S. The inaturalist species classification and detection dataset. In Proceedings of the IEEE Conference on Computer Vision and Pattern Recognition, Salt Lake City, UT, USA, 18–23 June 2018; pp. 8769–8778. [Google Scholar]
- Miller, J.A.; Griswold, C.E.; Scharff, N.; Řezáč, M.; Szűts, T.; Marhabaie, M. The velvet spiders: An atlas of the Eresidae (Arachnida, Araneae). ZooKeys 2012, 1–144. [Google Scholar] [CrossRef] [PubMed]
- Alvarez-Padilla, F.; Hormiga, G. Morphological and phylogenetic atlas of the orb-weaving spider family Tetragnathidae (Araneae: Araneoidea). Zool. J. Linn. Soc. 2011, 162, 713–879. [Google Scholar] [CrossRef]
- Harvey, P.R.; Nellist, D.R.; Telfer, M.G. Provisional Atlas of BRITISH Spiders (Arachnida, Araneae), Volume 1; Biological Records Centre, Centre for Ecology and Hydrology: Huntingdon, England, 2002. [Google Scholar]
- Menge, A. Preussische Spinnen; Schriften Der Naturforschenden Gesellschaft in Danzig: Frankfurt, Germany, 1873; Volume 6. [Google Scholar]
- Caci, G.; Biscaccianti, A.B.; Cistrone, L.; Bosso, L.; Garonna, A.P.; Russo, D. Spotting the right spot: Computer-aided individual identification of the threatened cerambycid beetle Rosalia alpina. J. Insect Conserv. 2013, 17, 787–795. [Google Scholar] [CrossRef]
- Willi, M.; Pitman, R.T.; Cardoso, A.W.; Locke, C.; Swanson, A.; Boyer, A.; Veldthuis, M.; Fortson, L. Identifying animal species in camera trap images using deep learning and citizen science. Methods Ecol. Evol. 2019, 10, 80–91. [Google Scholar] [CrossRef]
- Nanni, L.; Maguolo, G.; Pancino, F. Insect pest image detection and recognition based on bio-inspired methods. Ecol. Inform. 2020, 57, 101089. [Google Scholar] [CrossRef]
- Alves, A.N.; Souza, W.S.R.; Borges, D.L. Cotton pests classification in field-based images using deep residual networks. Comput. Electron. Agric. 2020, 174, 105488. [Google Scholar] [CrossRef]
- Chen, Q.; Ding, Y.; Liu, C.; Liu, J.; He, T. Research on spider sex recognition from images based on deep learning. IEEE Access 2021, 9, 120985–120995. [Google Scholar] [CrossRef]
- Sinnott, R.O.; Yang, D.; Ding, X.; Ye, Z. Poisonous spider recognition through deep learning. In Proceedings of the Australasian Computer Science Week Multiconference, Melbourne, VIC, Australia, 4–6 February 2020; pp. 1–7. [Google Scholar]
- Redmon, J.; Divvala, S.; Girshick, R.; Farhadi, A. You only look once: Unified, real-time object detection. In Proceedings of the IEEE Conference on Computer Vision and Pattern Recognition, Las Vegas, NV, USA, 27–30 June 2016; pp. 779–788. [Google Scholar]
- Du, Y.; Pan, N.; Xu, Z.; Deng, F.; Shen, Y.; Kang, H. Pavement distress detection and classification based on YOLO network. Int. J. Pavement Eng. 2021, 22, 1659–1672. [Google Scholar] [CrossRef]
- Radovic, M.; Adarkwa, O.; Wang, Q. Object recognition in aerial images using convolutional neural networks. J. Imaging 2017, 3, 21. [Google Scholar] [CrossRef]
- Sathvik, M.; Saranya, G.; Karpagaselvi, S. An Intelligent Convolutional Neural Network based Potholes Detection using Yolo-V7. In Proceedings of the 2022 International Conference on Automation, Computing and Renewable Systems (ICACRS), Pudukkottai, India, 13–15 December 2022; pp. 813–819. [Google Scholar]
- Priyankan, K.; Fernando, T. Mobile Application to Identify Fish Species Using YOLO and Convolutional Neural Networks. In Proceedings of the International Conference on Sustainable Expert Systems: ICSES 2020, Singapore, 31 March 2021; pp. 303–317. [Google Scholar]
- Divya, A.; Sungeetha, D.; Ramesh, S. Horticulture image based weed detection in feature extraction with dimensionality reduction using deep learning architecture. In Proceedings of the 2023 3rd International Conference on Artificial Intelligence and Signal Processing (AISP), Vijayawada, India, 18–20 March 2023; pp. 1–8. [Google Scholar]
- Liang, B.; Wu, S.; Xu, K.; Hao, J. Butterfly detection and classification based on integrated YOLO algorithm. In Proceedings of the Thirteenth International Conference on Genetic and Evolutionary Computing, Qingdao, China, 1–3 November 2019; pp. 500–512. [Google Scholar]
- Wu, W.; Liu, H.; Li, L.; Long, Y.; Wang, X.; Wang, Z.; Li, J.; Chang, Y. Application of local fully Convolutional Neural Network combined with YOLO v5 algorithm in small target detection of remote sensing image. PLoS ONE 2021, 16, e0259283. [Google Scholar] [CrossRef] [PubMed]
- Yung, N.D.T.; Wong, W.; Juwono, F.H.; Sim, Z.A. Safety helmet detection using deep learning: Implementation and comparative study using YOLOv5, YOLOv6, and YOLOv7. In Proceedings of the 2022 International Conference on Green Energy, Computing and Sustainable Technology (GECOST), Virtual, 26–28 October 2022; pp. 164–170. [Google Scholar]
- Cao, L.; Zheng, X.; Fang, L. The Semantic Segmentation of Standing Tree Images Based on the Yolo V7 Deep Learning Algorithm. Electronics 2023, 12, 929. [Google Scholar] [CrossRef]
- Nan, Y.; Zhang, H.; Zeng, Y.; Zheng, J.; Ge, Y. Faster and accurate green pepper detection using NSGA-II-based pruned YOLOv5l in the field environment. Comput. Electron. Agric. 2023, 205, 107563. [Google Scholar] [CrossRef]
- Alvarez-Padilla, F.; Galán-Sánchez, M.A.; Salgueiro-Sepúlveda, F.J. A protocol for online documentation of spider biodiversity inventories applied to a Mexican tropical wet forest (Araneae, Araneomorphae). Zootaxa 2020, 4722, 241–269. [Google Scholar] [CrossRef]
- Levi, H.W. Techniques for the study of spider genitalia. Psyche A J. Entomol. 1965, 72, 152–158. [Google Scholar] [CrossRef]
- Nelson, X.J. Polymorphism in an ant mimicking jumping spider. J. Arachnol. 2010, 38, 139–141. [Google Scholar] [CrossRef]
- Puzin, C.; Leroy, B.; Pétillon, J. Intra-and inter-specific variation in size and habitus of two sibling spider species (Araneae: Lycosidae): Taxonomic and biogeographic insights from sampling across Europe. Biol. J. Linn. Soc. 2014, 113, 85–96. [Google Scholar] [CrossRef]
- Michalko, R.; Košulič, O.; Hula, V.; Surovcová, K. Niche differentiation of two sibling wolf spider species, Pardosa lugubris and Pardosa alacris, along a canopy openness gradient. J. Arachnol. 2016, 44, 46–51. [Google Scholar] [CrossRef]
- Luebke, D. CUDA: Scalable parallel programming for high-performance scientific computing. In Proceedings of the 2008 5th IEEE International Symposium on Biomedical Imaging: From Nano to Macro, Paris, France, 14–17 May 2008; pp. 836–838. [Google Scholar]
- Imambi, S.; Prakash, K.B.; Kanagachidambaresan, G. PyTorch. Program. TensorFlow Solut. Edge Comput. Appl. 2021, 87–104. [Google Scholar] [CrossRef]
- Kanagachalam, S.; Tulkinbekov, K.; Kim, D.-H. Blosm: Blockchain-based service migration for connected cars in embedded edge environment. Electronics 2022, 11, 341. [Google Scholar] [CrossRef]
- Lin, C.-H.; Kan, C.-D.; Chen, W.-L.; Huang, P.-T. Application of two-dimensional fractional-order convolution and bounding box pixel analysis for rapid screening of pleural effusion. J. X-ray Sci. Technol. 2019, 27, 517–535. [Google Scholar] [CrossRef] [PubMed]
- Eberhard, W.G.; Huber, B.A. The Evolution of Primary Sexual Characters in Animals; Oxford University Press: New York, NY, USA, 2010; pp. 249–284. [Google Scholar]
- Cordellier, M.; Schneider, J.M.; Uhl, G.; Posnien, N. Sex differences in spiders: From phenotype to genomics. Dev. Genes Evol. 2020, 230, 155–172. [Google Scholar] [CrossRef]
- Willemink, M.J.; Koszek, W.A.; Hardell, C.; Wu, J.; Fleischmann, D.; Harvey, H.; Folio, L.R.; Summers, R.M.; Rubin, D.L.; Lungren, M.P. Preparing medical imaging data for machine learning. Radiology 2020, 295, 4–15. [Google Scholar] [CrossRef]
- Raschka, S. Model evaluation, model selection, and algorithm selection in machine learning. arXiv 2018, arXiv:1811.12808. [Google Scholar]
- Xia, Y.; Luo, W.; Zhang, P.; Liu, Y.; Bei, J. Detection of insulator defects based on improved YOLOv7 model. In Proceedings of the International Symposium on Artificial Intelligence and Robotics 2022, Shanghai, China, 21–23 October 2022; pp. 157–165. [Google Scholar]
- Deng, J.; Dong, W.; Socher, R.; Li, L.-J.; Li, K.; Fei-Fei, L. Imagenet: A large-scale hierarchical image database. In Proceedings of the 2009 IEEE Conference on Computer Vision and Pattern Recognition, Miami, FL, USA, 20–25 June 2009; pp. 248–255. [Google Scholar]
- Horak, K.; Sablatnig, R. Deep learning concepts and datasets for image recognition: Overview 2019. In Proceedings of the Eleventh international conference on digital image processing (ICDIP 2019), Guangzhou, China, 10–13 May 2019; pp. 484–491. [Google Scholar]
- Martinez, M.T. An Overview of Google’s Open Source Machine Intelligence Software TensorFlow. In Proceedings of the Technical Seminar, Las Cruces, NM, USA, November 2016. [Google Scholar]
- Zheng, J.; Wu, H.; Zhang, H.; Wang, Z.; Xu, W. Insulator-defect detection algorithm based on improved YOLOv7. Sensors 2022, 22, 8801. [Google Scholar] [CrossRef]
- Gevorgyan, Z. SIoU loss: More powerful learning for bounding box regression. arXiv 2022, arXiv:2205.12740. [Google Scholar]
- Chicco, D.; Jurman, G. The advantages of the Matthews correlation coefficient (MCC) over F1 score and accuracy in binary classification evaluation. BMC Genom. 2020, 21, 1–13. [Google Scholar] [CrossRef]
- Mane, S.; Srivastava, J.; Hwang, S.-Y.; Vayghan, J. Estimation of false negatives in classification. In Proceedings of the Fourth IEEE International Conference on Data Mining (ICDM’04), Brighton, UK, 1–4 November 2004; pp. 475–478. [Google Scholar]
- Jabed, M.R.; Shamsuzzaman, M. YOLObin: Non-decomposable garbage identification and classification based on YOLOv7. J. Comput. Commun. 2022, 10, 104–121. [Google Scholar] [CrossRef]
- Kramer, O.; Kramer, O. Scikit-learn. Mach. Learn. Evol. Strateg. 2016, 20, 45–53. [Google Scholar]
- Sun, M.; Song, Z.; Jiang, X.; Pan, J.; Pang, Y. Learning pooling for convolutional neural network. Neurocomputing 2017, 224, 96–104. [Google Scholar] [CrossRef]
- Zhou, D.-X. Theory of deep convolutional neural networks: Downsampling. Neural Netw. 2020, 124, 319–327. [Google Scholar] [CrossRef]
- Lundh, F. An Introduction to Tkinter. 1999. Available online: http://jgaltier.free.fr/Terminale_S/ISN/TclTk_Introduction_To_Tkinter.pdf (accessed on 3 December 2023).
- Asma, S.T. Monsters on the brain: An evolutionary epistemology of horror. Soc. Res. 2014, 81, 941–968. [Google Scholar] [CrossRef]
- McKinney, W. Data structures for statistical computing in python. In Proceedings of the 9th Python in Science Conference, Austin, TX, USA, 28 June–3 July 2010; pp. 51–56. [Google Scholar]
- Falk, T.; Mai, D.; Bensch, R.; Çiçek, Ö.; Abdulkadir, A.; Marrakchi, Y.; Böhm, A.; Deubner, J.; Jäckel, Z.; Seiwald, K. U-Net: Deep learning for cell counting, detection, and morphometry. Nat. Methods 2019, 16, 67–70. [Google Scholar] [CrossRef] [PubMed]
- Eulenberg, P.; Köhler, N.; Blasi, T.; Filby, A.; Carpenter, A.E.; Rees, P.; Theis, F.J.; Wolf, F.A. Reconstructing cell cycle and disease progression using deep learning. Nat. Commun. 2017, 8, 463. [Google Scholar] [CrossRef]
- Lippeveld, M.; Knill, C.; Ladlow, E.; Fuller, A.; Michaelis, L.J.; Saeys, Y.; Filby, A.; Peralta, D. Classification of human white blood cells using machine learning for stain-free imaging flow cytometry. Cytom. Part A 2020, 97, 308–319. [Google Scholar] [CrossRef]
- Shoaib, M.; Shah, B.; Ei-Sappagh, S.; Ali, A.; Ullah, A.; Alenezi, F.; Gechev, T.; Hussain, T.; Ali, F. An advanced deep learning models-based plant disease detection: A review of recent research. Front. Plant Sci. 2023, 14, 1158933. [Google Scholar] [CrossRef]
- Panigrahi, S.; Maski, P.; Thondiyath, A. Deep learning based real-time biodiversity analysis using aerial vehicles. In Proceedings of the International Conference on Robot Intelligence Technology and Applications, Daejeon, Republic of Korea, 16–17 December 2021; pp. 401–412. [Google Scholar]
- Bisogni, C.; Castiglione, A.; Hossain, S.; Narducci, F.; Umer, S. Impact of deep learning approaches on facial expression recognition in healthcare industries. IEEE Trans. Ind. Inform. 2022, 18, 5619–5627. [Google Scholar] [CrossRef]
- Wang, Y.; Wang, H.; Xin, Z. Efficient Detection Model of Steel Strip Surface Defects Based on YOLO-V7. IEEE Access 2022, 10, 133936–133944. [Google Scholar] [CrossRef]
- Simpson, G.G. Principles of Animal Taxonomy; Columbia University Press: Columbia, SC, USA, 1961. [Google Scholar]
- Radiuk, P.M. Impact of Training Set Batch Size on the Performance of Convolutional Neural Networks for Diverse Datasets. Inf. Technol. Manag. 2017, 20, 20–24. [Google Scholar] [CrossRef]
- Aldin, N.B.; Aldin, S.S.A.B. Accuracy comparison of different batch size for a supervised machine learning task with image classification. In Proceedings of the 2022 9th International Conference on Electrical and Electronics Engineering (ICEEE), Alanya, Turkey, 29–31 March 2022; pp. 316–319. [Google Scholar]
- Smistad, E.; Elster, A.C.; Lindseth, F. Real-time gradient vector flow on GPUs using OpenCL. J. Real-Time Image Process. 2015, 10, 67–74. [Google Scholar] [CrossRef]
- Keskar, N.S.; Mudigere, D.; Nocedal, J.; Smelyanskiy, M.; Tang, P.T.P. On large-batch training for deep learning: Generalization gap and sharp minima. arXiv 2016, arXiv:1609.04836. [Google Scholar]
- Smith, S.; Elsen, E.; De, S. On the generalization benefit of noise in stochastic gradient descent. In Proceedings of the International Conference on Machine Learning, Virtual Event, 13–18 July 2020; pp. 9058–9067. [Google Scholar]
- Le, T.D.; Imai, H.; Negishi, Y.; Kawachiya, K. Automatic gpu memory management for large neural models in tensorflow. In Proceedings of the 2019 ACM SIGPLAN International Symposium on Memory Management, Phoenix, AZ, USA, 23 June 2019; pp. 1–13. [Google Scholar]
- Lim, H.; Kim, T.H.; Kang, S. Prediction-based error correction for gpu reliability with low overhead. Electronics 2020, 9, 1849. [Google Scholar] [CrossRef]
- Kaur, H.; Pannu, H.S.; Malhi, A.K. A systematic review on imbalanced data challenges in machine learning: Applications and solutions. ACM Comput. Surv. (CSUR) 2019, 52, 1–36. [Google Scholar] [CrossRef]
- Japkowicz, N.; Stephen, S. The class imbalance problem: A systematic study. Intell. Data Anal. 2002, 6, 429–449. [Google Scholar] [CrossRef]
- Mohammed, R.; Rawashdeh, J.; Abdullah, M. Machine learning with oversampling and undersampling techniques: Overview study and experimental results. In Proceedings of the 2020 11th International Conference on Information and Communication Systems (ICICS), Irbid, Jordan, 7–9 April 2020; pp. 243–248. [Google Scholar]
- Vanthournout, B.; Busck, M.M.; Bechsgaard, J.; Hendrickx, F.; Schramm, A.; Bilde, T. Male spiders control offspring sex ratio through greater production of female-determining sperm. Proc. R. Soc. B Biol. Sci. 2018, 285, 20172887. [Google Scholar] [CrossRef]
- Touvron, H.; Sablayrolles, A.; Douze, M.; Cord, M.; Jégou, H. Grafit: Learning fine-grained image representations with coarse labels. In Proceedings of the IEEE/CVF International Conference on Computer Vision, Montreal, BC, Canada, 11–17 October 2021; pp. 874–884. [Google Scholar]


| Score | Identifier with Confidence Value | Identifier without Confidence Value |
|---|---|---|
| 2 points | Correct identification with confidence score > 0.75. | Correct identification to genus level |
| 1 point | Correct identification on both models with confidence score in the range [0.5 ÷ 7.5] | Correct identification to subfamily and family level |
| 0 points | Incorrect identification or correct identification but confidence score < 0.5 | Incorrect identification or can only give several non-confident suggestions |
| Model Name | Weight Size (Kilobytes) | GPU Requirement (Gigabytes) | Average Training Time per Epoch (Minutes) |
|---|---|---|---|
| YOLOv5_WG | 15,209 | 1.84 | 18.5 |
| YOLOv5_NG | 14,590 | 1.31 | 8.8 |
| YOLOv6_WG | 148,801 | 4.01 | 31.4 |
| YOLOv6_NG | 148,375 | 3.84 | 14.9 |
| YOLOv7_WG | 75,506 | 4.66 | 59.8 |
| YOLOv7_NG | 74,238 | 4.21 | 31.2 |
| YOLOv8_WG | 10,611 | 3.33 | 16.0 |
| YOLOv8_NG | 7125 | 2.52 | 5.2 |
| Base Model | Training Resolution | F1-Score | Precision | Recall | SISS Evaluation (%) |
|---|---|---|---|---|---|
| YOLOv7_WG | 416 × 416 | 0.681 | 0.695 | 0.668 | 79.82 |
| 512 × 512 | 0.694 | 0.714 | 0.675 | 81.60 | |
| 640 × 640 | 0.685 | 0.701 | 0.67 | 79.83 | |
| YOLOv7_NG | 416 × 416 | 0.834 | 0.847 | 0.822 | 83.93 |
| 512 × 512 | 0.877 | 0.889 | 0.866 | 88.95 | |
| 640 × 640 | 0.849 | 0.861 | 0.838 | 83.99 |
| Model | F1-Score | Precision | Recall | IT-GPU (ms) | IT-CPU (ms) | SISS Evaluation (%) |
|---|---|---|---|---|---|---|
| YOLOv8_NG | 0.750 | 0.830 | 0.685 | 7.37 | 53.87 | 34.10 |
| YOLOv8_WG | 0.503 | 0.609 | 0.429 | 8.13 | 47.83 | 31.98 |
| YOLOv7_NG | 0.885 | 0.903 | 0.867 | 16.93 | 224.07 | 89.08 |
| YOLOv7_WG | 0.702 | 0.709 | 0.695 | 16.9 | 218.37 | 80.99 |
| YOLOv6_NG | 0.913 | 0.952 | 0.895 | 30.57 | 74.47 | 89.77 |
| YOLOv6_WG | 0.601 | 0.650 | 0.607 | 32.43 | 84.7 | 68.72 |
| YOLOv5_NG | 0.754 | 0.797 | 0.716 | 9.13 | 66.7 | 76.24 |
| YOLOv5_WG | 0.821 | 0.846 | 0.798 | 6.87 | 74.43 | 85.16 |
| Model | TeD Resized Resolution | F1-Score | Precision | Recall | SISS (%) |
|---|---|---|---|---|---|
| YOLOv7_WG (Final) | 416 × 416 | 0.696 | 0.704 | 0.689 | 80.78 |
| 512 × 512 | 0.702 | 0.709 | 0.695 | 80.99 | |
| 640 × 640 | 0.699 | 0.704 | 0.694 | 80.80 | |
| YOLOv7_NG (Final) | 416 × 416 | 0.854 | 0.867 | 0.841 | 84.03 |
| 512 × 512 | 0.885 | 0.903 | 0.867 | 89.08 | |
| 640 × 640 | 0.857 | 0.875 | 0.840 | 84.00 |
| Model | Test Dataset | F1-Score | Precision | Recall | SISS (%) |
|---|---|---|---|---|---|
| YOLOv7_WG (Non-balanced) | TeD | 0.703 | 0.702 | 0.704 | 81.43 |
| TeD_Aug | 0.600 ± 0.0028 | 0.625 ± 0.0026 | 0.577 ± 0.0049 | 74.67 ± 0.273 | |
| YOLOv7_WG (Final) | TeD | 0.702 | 0.709 | 0.695 | 80.99 |
| TeD_Aug | 0.704 ± 0.0005 | 0.722 ± 0.0026 | 0.688 ± 0.0021 | 77.93 ± 0.148 | |
| YOLOv7_NG (Non-balanced) | TeD | 0.887 | 0.889 | 0.886 | 88.81 |
| TeD_Aug | 0.736 ± 0.0026 | 0.760 ± 0.0100 | 0.714 ± 0.0056 | 83.68 ± 0.192 | |
| YOLOv7_NG (Final) | TeD | 0.885 | 0.903 | 0.867 | 89.08 |
| TeD_Aug | 0.874 ± 0.0012 | 0.891 ± 0.0073 | 0.858 ± 0.0092 | 87.80 ± 0.093 |
Disclaimer/Publisher’s Note: The statements, opinions and data contained in all publications are solely those of the individual author(s) and contributor(s) and not of MDPI and/or the editor(s). MDPI and/or the editor(s) disclaim responsibility for any injury to people or property resulting from any ideas, methods, instructions or products referred to in the content. |
© 2023 by the authors. Licensee MDPI, Basel, Switzerland. This article is an open access article distributed under the terms and conditions of the Creative Commons Attribution (CC BY) license (https://creativecommons.org/licenses/by/4.0/).
Share and Cite
Luong, C.T.; Farhan, A.; Vasquez, R.D.; Roldan, M.J.M.; Lin, Y.-K.; Hsu, S.-Y.; Lin, M.-D.; Hsiao, C.-D.; Hung, C.-H. SpiderID_APP: A User-Friendly APP for Spider Identification in Taiwan Using YOLO-Based Deep Learning Models. Inventions 2023, 8, 153. https://doi.org/10.3390/inventions8060153
Luong CT, Farhan A, Vasquez RD, Roldan MJM, Lin Y-K, Hsu S-Y, Lin M-D, Hsiao C-D, Hung C-H. SpiderID_APP: A User-Friendly APP for Spider Identification in Taiwan Using YOLO-Based Deep Learning Models. Inventions. 2023; 8(6):153. https://doi.org/10.3390/inventions8060153
Chicago/Turabian StyleLuong, Cao Thang, Ali Farhan, Ross D. Vasquez, Marri Jmelou M. Roldan, Yih-Kai Lin, Shih-Yen Hsu, Ming-Der Lin, Chung-Der Hsiao, and Chih-Hsin Hung. 2023. "SpiderID_APP: A User-Friendly APP for Spider Identification in Taiwan Using YOLO-Based Deep Learning Models" Inventions 8, no. 6: 153. https://doi.org/10.3390/inventions8060153
APA StyleLuong, C. T., Farhan, A., Vasquez, R. D., Roldan, M. J. M., Lin, Y.-K., Hsu, S.-Y., Lin, M.-D., Hsiao, C.-D., & Hung, C.-H. (2023). SpiderID_APP: A User-Friendly APP for Spider Identification in Taiwan Using YOLO-Based Deep Learning Models. Inventions, 8(6), 153. https://doi.org/10.3390/inventions8060153