Abstract
This paper presents a parametric study of the multistorey hydro-powered pump, known as ‘Bunyip’, which has demonstrated significant potential in contributing to rural regions. The study is aimed at understanding the underlying physics of the system and ways to enhance its hydraulic performance. A transient three-dimensional model using the commercial Computational Fluid Dynamics (CFD) tool Ansys-Fluent is utilized to gain insights into its fundamental flow mechanics, operational efficiency, standard capacity, and relative delivery. The investigation involves an initial assessment of performance for three Bunyip devices based on manufacturing data. A parametric analysis is conducted for the dataset generated through meticulous application and numerical modelling. The CFD results are validated against experimental data. Three main design configurations are considered, and 58 sets of varied input parameters are examined. The best design configuration is evaluated against five cases of conventional hydro-power pump systems. The results indicate that a smaller diameter of the pressure chamber and a higher supply head lead to higher pressure, achieving a target head of 3 m with 15% efficiency and a flowrate of 11.82 L/min.
1. Introduction
The escalating climate crisis and the need for sustainable energy solutions have prompted a global push towards renewable energy adoption [1]. As fossil fuel prices continue to rise due to inflation and geopolitical conflicts, the finite nature of these resources poses challenges to their accessibility [2]. In response to these concerns, significant investments have been made in transitioning towards cleaner energy sources, reaching a staggering USD 1.3 trillion in 2022 [3].
Developing regions, often facing economic vulnerability, bear the brunt of the increasing pressure to afford and access reliable power sources. These regions heavily rely on stable access to power for sustaining growth, productivity, and overall well-being. Among the crucial resources required for development, access to water stands as an indispensable necessity [4]. Whether it is for safe drinking, personal hygiene, agriculture, livestock rearing, or other developmental needs, a stable water supply plays a pivotal role. Traditionally, fossil-fuel or electrically powered systems have been the primary mechanisms used for lifting and transporting water in these regions. However, the detrimental impact of fossil fuels, including rising prices and environmental concerns, is now driving the need to shift towards alternative renewable mechanisms that can capture and harness the natural energy systems present in the local environment.
The hydraulic ram pump (HRP) is a simple yet effective device that utilizes a paired check-valve mechanism to harness hydro-kinetic energy from a drive volume and convert a fraction of the incoming flow into an elevated head potential. By tapping into the ‘free’ gravitational energy present in natural rivers, springs, or flowing water bodies, the HRP offers a sustainable solution for micro-hydro-power needs [5]. Due to its potential and versatility, the HRP has been actively researched and recognized as a prominent hydro-powered system in current technology reviews [6]. Despite its success, much of the existing research on the HRP, like other pumping technologies, tends to focus on marginal improvements rather than exploring more significant enhancements. This raises questions regarding the feasibility and benefits of introducing additional hydraulic complexity to the system in pursuit of enhanced water head potential.
Over the past decade, research on internal flows has significantly advanced, enabling a more detailed and focused analysis of individual components within hydraulic pumping systems. This progress has led to the discovery of additional capabilities, offering opportunities to enhance the previously established analytical relationships [7]. To serve as a valuable resource to observe best practices and methodologies used in HRP systems, we have utilized the development of an advanced multi-storey hydraulic pumping system known as ‘Bunyip [8].’ Several studies have been conducted, providing valuable insights into the modelling procedures, validation processes, and overall success of hydraulic pumping systems but with limited application to Bunyip systems. Among these studies, two groups of researchers have made notable contributions:
In [9,10], a detailed study on the adopted CFD setup and validation for ramp pump is given. This includes an RNG k-ε Turbulence model suitable for high shear rate flow and separation, the PISO pressure–velocity coupling, and the coarse mixed mesh, designed within a 5–20 mm size range and 1 million cells. The wall treatment exploits four inflation layers for y+ between 17.78–442.79, utilising standard wall functions and a roughness of 0.15 mm. Nonetheless, the settings attained an average relative error of 1.9% for head loss and drag coefficients when corroborated with their physical equipment. Thus, despite the criticisms made, the model performed well in application and remains to be one of the most successful validations and hybrid studies published.
In [11,12], a detailed simulation of a ram pump is made, including the traditional spring waste valve mechanism, to conclude three optimal designs. The best numerically analysed design reduced the waste valve loss by 30%. The latter finding is less extensive than the previous two pieces of research but still nontrivial, using the realizable k-ε turbulence model and second-order spatial, kinetic, and turbulence dissipation. However, the latter finding provides little insight into the validation and description, particularly surrounding the mesh and the justification for the model’s accuracy.
Yet, the Bunyip system has only been recognised within the grey, non-scientific literature. The first detailed review of the HRP and Bunyip systems was presented in [6], reinforcing the wealth and depth of research available for conventional systems. Despite the lack of research, the commercial momentum indicates great promise for the system and its capacity to outperform the conventional system. Thus, the door opens for the current piece of research to conduct a comparative appraisal of performance based on manufacturer-provided data, develop an advanced numerical model to investigate the current operational capacity, and examine the internal flow features and characteristics before delivering the first report of its kind within the scientific research field to evaluate and appraise the potential threshold for the next steps of research within the field.
A critical gap in the literature is in addressing the motion definition in six degrees of freedom (6DOF). Such a set-up requires a time-based user-defined function (UDF) to establish the relative motion within the domain, which is favourable for computational speed and control [13]. In Ansys-Fluent [14], the excellent capacity of the 6DOF solver enables direct calculation of the motion observed. However, this is computationally expensive and notably difficult to validate. Therefore, it requires significant input to attain suitable validation [15]. This study is aimed at providing parametric optimisation to provide potential hydraulic system advancement. The simulation of a multi-story hydraulic pump (Bunyip) is conducted, accounting for the 3D and 6DOF effects. The latter underlying physics of this system have not been addressed elsewhere in the literature to the best of our knowledge. In what follows, the system is described in Section 2. The numerical set-ups and modelling are presented in Section 3. In Section 4, we present the results. The key findings are concluded in Section 5.
2. System Description
2.1. Conventional Hydraulic Ram Pump
The conventional hydraulic ram pump (HRP) system operates through a series of well-defined phases, each contributing to its efficient and continuous operation. Figure 1 illustrates the fundamental components and arrangement of the conventional HRP system, showcasing the three operational phases: ‘acceleration’, ‘delivery’, and ‘recoil’.
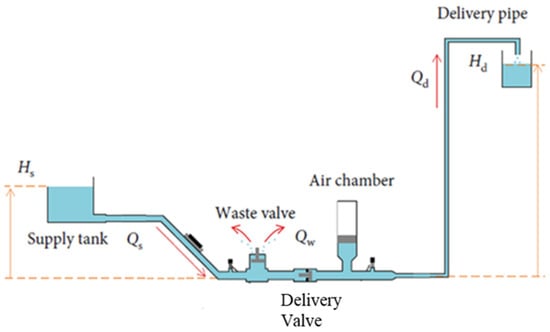
Figure 1.
Conventional hydraulic ramp pump and associated system diagram, inferred from [8,16] with permission.
The system includes the supply pipe, installed at a known height and measured relative to the delivery valve. Water from higher source flows through the supply pipe and undergoes ‘acceleration’ as it enters the drive pipe. During this phase, the potential energy of the water is marginally elevated, transforming it into hydro-kinetic energy. Subsequently, the water rapidly discharges through the waste valve. As the water continues to flow, it passes the waste valve at a critical velocity, resulting in a drag force that overcomes the spring mechanism, leading to the abrupt closure of the waste valve. This action traps the high dynamic pressure flow, generating a sharp peak in static pressure known as a water hammer. The water hammer phenomenon allows the internal pressure to overcome the elevated head, pre-loading the delivery valve. Consequently, a fraction of the initial flow is rapidly passed through to enter the delivery system. The subsequent drop in internal pressure following the peak re-opens the initial waste valve, enabling the flow to recommence its initial flow regime, known as the ‘recoil’. The drive flow begins to accelerate once again, initiating a perpetual cycle. The pair of check valves in the system play a crucial role in regulating the flow direction during the operational phases. These check valves ensure that water flows in the desired direction and prevent backflow, contributing to the pump’s efficiency.
Over time, auxiliary components have been developed to improve the conventional HRP system’s performance [17]. One such component is the air chamber, which dampens the sharp peaks in pressure and results in a more gradual delivery stroke, leading to a more consistent flow [7,18].
2.2. HRP Limitations
When discussing the perpetual operation and regulation of the system, it can be recognised that the start of the HRP cycle requires an external physical input to prime the system. This initially opens the waste valve to initiate the ‘acceleration’ phase. The supplied partially elevated flow enters the body and at the critical velocity closes the waste valve, inducing a peak in the static water hammer as the flow is abruptly brought to ‘rest’. In principle, under consistent flow conditions, the pump can be observed and acknowledged to operate independently, though in application, it could be that naturally occurring flow variation has impact on the timing of the pair of valves and result in stalled cycles. This is further escalated by the pump’s inability to self-start, as discussed. In remote regions, where these systems tend to thrive, it is both time-consuming to restart and potentially could go unrecognised for some time, compromising system supplies within the likes of storage vessels [7,19]. One of the greatest distinguishing features for the Bunyip system is its ‘automated’ ability to self-regulate dependent on the incident flow from the drive supply [8]. In no-flow conditions, the pump remains dormant. Once the supply returns with sufficient dynamic pressure, the tyre will begin to inflate and commence the cycle. The ability to manage the complexities of operation is critical for the productivity of the pumping system. Thus, although the output will vary subject to the water available to the system, the Bunyip would likely provide an enhanced degree of flexibility and consistency.
Due to the simple operational principle, manipulated by two isolated components, previous research is used to highlight the limitations of the arrangement and the risks associated with dependency on the sprung mechanisms. Harith et al. [11,12] and Li et al. [10] both identified the waste valve as the primary contributor to the improved performance of the HRP. It is acknowledged to dictate the associated critical velocities, cycle rate sustained, volume wasted during the acceleration phase, and capacity to overcome or deliver greater quantity to the elevated supply. The process of ‘tuning’ the valve, typically using a threaded travel mechanism, could be described as temperamental and, by nature, directly tailoring the operation to a singular case, whereby actual flow parameters will change. In the subsequent research of [11,12], multiple adapted arrangements are considered to realise height regulation with a more developed sprung mechanism to increase the associated model operational efficiency by up to 20%. The Bunyip system also utilises a pair of check valves; however, they operate in a significantly different manner. The pair operates across a larger cycle period and does not dictate the critical velocity and the volume of water wasted directly; it is instead managed by the simple tyre seal mechanism. The mechanism utilises a blend of components, including the body mass, internal spring tyre stiffness, and the dynamic water pressure, for example, for a more reliable operation [16].
The conventional HRP principle operates through a rapid and relatively forceful motion to generate a sufficient hammer pressure to breach the delivery valve. This could be researched and identified to account for multiple considerations. In [9], the full losses are considered, and they are attributed to abrupt changes in velocity, turbulent flow conditions, geometry, and internal pressure gradients. One can conclude that features should be designed to implement diffuser entry regions and a more efficient entry geometry. This was aimed at reducing the head loss coefficients and improving the velocity distribution, described as producing enhanced efficiencies of 50–70% for their designs.
2.3. System Design
The co-founders of the Bunyip system (Porta and Trew [8]) provided the requirement for higher-quality rubber seal materials. In the same vein as accessibility, the exerted hammer forces induced within the HRP throughout rapid operation place greater stress on the system and consumable parts, thus increasing its maintenance requirements and the likelihood of failure. The advanced model’s core components may last up to 50 years; conversely, the likely capacity of a design made in remote regions could be as little as 10 years using weaker materials and limited facilities [4]. The Bunyip’s low velocity requires a less complex features and manufacturing procedure and lighter-weight components, resulting in the maintenance of the consumable rod and piston seals lasting up to three years without significantly compromising their performance and with limited replacements [16].
This paper begins to investigate and explore an alternative design, known as the Bunyip, shown in Figure 2. The research was inspired by its developed commercial momentum yet extremely limited presence within academic research. The following study aims to investigate the operational characteristics and performance capacity of the adapted mechanism. This will utilise a combined methodology of secondary performance data and a dedicated numerical model constructed in Ansys-Fluent 2021 R2 [14]. The work facilitates a critical analysis of its internal physics and performance potential using the model’s constrained discretization capacity and appropriately simplified domain. The design will implement verified methods where possible to quantify and evaluate the domain to support discussion alongside manufacturer-provided data and the conventional HRP system.

Figure 2.
Alternative Bunyip system: (a) in-house sketching and (b) annotated photograph—inferred from [8] with permission from [16].
The introduced Bunyip pump was very much inspired by the HRP previously described, whereby the inventors (Brett Porta and Ralph Glockemann [16]) recognised that for their specific application, the conventional design failed to manage the fluctuating operating conditions. They realised that a chain of new systems and designs could be developed at a domestic level, incrementally surpassing and growing in capacity. Focused on enhancing the pump’s resilience in varied operation conditions and minimising the disruptive hammer noise and forces in the HRP for a local installation at their residence, several designs were produced, namely, the Oasis, Water Dragon and the Glockemann Pump [20,21]. The last of these was awarded a gold medal at the Geneva 2002 International Exhibition [16], setting a high standard for its successor in the form of the Bunyip, invented in 2006 by Bunyip Water Pumps, formally Porta’s Affordable Pumps [8]. The previously introduced Bunyip system operates using a vastly different principle and cycle, as depicted in Figure 3.

Figure 3.
Bunyip operational process diagram, inferred from [8] with permission from [16].
As can be seen in Figure 3, the system utilises a positive displacement piston arrangement with two separate upper and lower flow volume chambers to transfer and amplify the dynamic tyre pressure into the elevated head pressure. Then, a series of relative strokes are generated using a fixed length piston to deliver a secondary supply of water against the elevated head, which is understood through five operational phases (1–5), as follows [8]:
- (1)
- The incident drive supply inflates the tyre, increasing its static pressure and resulting in a smooth relative piston stroke. The stroke is resisted by the elevated pressures in the upper system, and internal tyre and spring stiffnesses, resulting in delivery through sufficient pressure to breach the delivery line and overcome the elevated head for a stroke of delivery.
- (2)
- As the upper body approaches TDC, the delivery stroke output reduces and transitions to close the delivery check valve as the tyre inflation approaches the limit of its travel.
- (3)
- At TDC, the piston travels beyond a series of discharge holes in the walls of the piston housing, resulting in the ‘unlock’ and discharge of the Piston. Meanwhile, the incident internal tyre pressure is sufficient to overcome the tyre seals, detaching and expelling the trapped internal pressure from the domain.
- (4)
- The reduced internal tyre pressure, internal stiffness of the tyre, and springs and mass of the upper portion result in the ‘dump’ phase collapse. The upper body and tyre fall, generating a relative suction stroke in the piston, priming the volume for the next cycle.
- (5)
- The piston is now full, the tyre and upper body are connected, and the drive pipe is beginning to inflate as the cycle restarts.
2.4. Performance Indicators
Upon reviewing several studies in the field, the primary indicator adopted for performance is the operational efficiency, calculated as the ratio of power through the delivered volume () relative to the total input quantity supplied (). The relationship is derived using the head () and flow rate () ratio [21,22]. Ultimately, this value quantifies the capacity of the pump to overcome the elevated head and provides an opportunity to compare the system model and data against alternative pumps. The operational efficiency () will change depending upon the supply and delivery head ratios, nominally in the range of 50–60%. For a typical HRP system under 30 m, this can be determined as [9]:
A secondary method identified uses the standard capacity (), a normalised method to standardise a flow rate capacity. This is calculated using the delivery flow rate () and inlet diameter for the pump squared () in . Several studies utilise this measure to compare their novel designs against established models in the market, represented in a normalised form, independent of the system size [10], as shown in Figure 4. This is known as the standard capacity () and used as an indicator of the pure delivery capacity [23]:
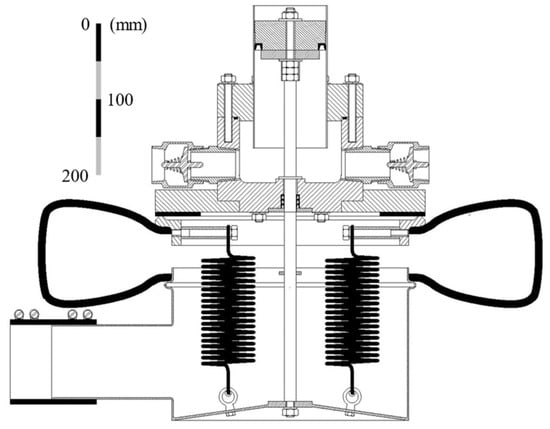
Figure 4.
Bunyip PA-13 technical drawing, scalable using 100 mm drive pipe, inferred from private communication with the manufacturer [16].
The final measure has been considered in reference to the total percentage of water delivered [11]. This is crucial for remote applications where water scarcity is a challenge. In previous research, it has been recognised that the volume of water wasted could outweigh the magnitude of other performance indicators for a given Thai application in Ban Ha, Samoeng District, Thailand [19]. This can be facilitated with the Bunyip pump using multiple inlets/outlets through a total flow rate term (. The delivery ratio is calculated as:
The identified performance criteria enabled manufacturer-published output data to be tabulated for comparison in Table 1. The table presents the relationship between the supply head and delivery head to assess the system’s effectiveness for the traditional-style Blake’s HRP [24], the recently adapted springless in-line HRP PaPa [25], and the Bunyip system. These are further illustrated in plots, as shown in Figure 5.

Table 1.
Operational efficiency for common HPP systems in 58 cases of varied supply and delivery values found using manufacturer-published data of Bunyip pumps [8], Blake’s Hydram [24], and PaPa Pumps [25].
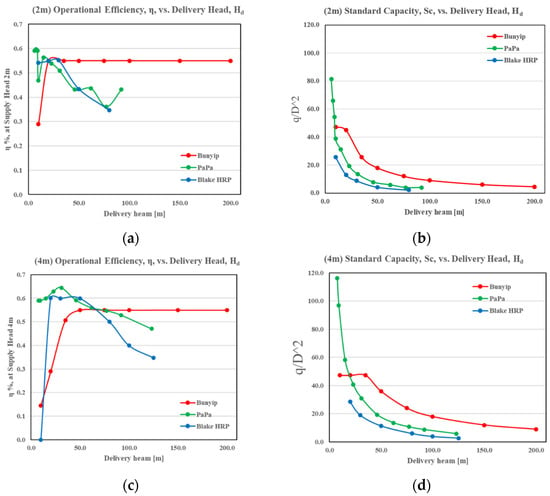
Figure 5.
Graphical performance evaluation at 60 L/min and 2–4 m supply heads for the 3 pump systems (a) efficiency at 2 m supply head, (b) at 2 m supply head, (c) efficiency at 4 m supply head, and (d) at 4 m supply head.
The Bunyip pump can operate at a reduced supply head, as shown in Table 1 (note: a consultation has been made with the associated Bunyip team for application at or less than 1 m for the two HRP designs to verify this). Additionally, the figures given in Table 1 for the HRP demonstrate that it has better effectiveness than the HRP in the lower region of Figure 5a,c at approximately a 15 m delivery head. The Bunyip pump in principle provides a significantly greater capacity to deliver to greater ranges for the equivalent supply, illustrated by the extended line lengths in Figure 5, attainable through its pressure-amplified positive displacement design. Clearly, this establishes the Bunyip pump as the only system that can operate to greater heads than 100 m, and it is even reported to operate up to 432 m in an adapted reinforced cylinder model currently under development.
It is noticeable that when the Bunyip pump receives a relatively high supply head for delivery to a low elevation, the efficiency drops considerably in Figure 5a,c, indicating high waste in the cycle at the delivery elevation. This is likely due to the mechanism’s extended positive displacement travel. In this region, the HRP will enable greater volumes to propagate per cycle, increasing its operational performance and standard capacity. The PaPa pump enables faster manipulation of the low-travel and springless valves to manage internal pressures more efficiently. At a low head ratio, the supply also has a greater ability to overcome a ‘lighter’ elevation head and deliver a greater portion of the flow provided [25]. As such, the Bunyip pump yields the greatest standard capacity, measured relative to the supply pipe diameter. Though the Bunyip supply is defined at Ø = 35 mm, this definition does not consider the drive pipe at a greater Ø (100 mm). Thus, it holds limited insight, and one can use an alternate pump volume to maximise its benefit.
3. Parameters
Numerical methods in recent years continue to drive innovation, routinely integrating advanced features and the identification of further applications that would benefit from the depth of analysis available. The research platform implemented utilises Ansys-Fluent [14], a market-leading suite of progressive modelling modules, to construct each stage of the model process with unique potential to utilise user-defined functions (UDF) to enhance the standard capacity and investigate an advanced multi-body physics 6DOF capacity. In what follows, the parametric set-ups are explained from the modelling perspectives, including the geometric design, meshing, transient set-up for motion, boundary set-ups, and pre-processing.
3.1. Geometry
To access the most accurate geometry possible, contact was made with the Bunyip pump’s inventor [8,16,20] to receive a scalable technical drawing of their best-selling PA-13 model. This has been used in conjunction with available Bunyip content, including the operational calculation tool and charts, to describe the typical stroke length () and piston bore, 90 mm and 98 mm, respectively [8]. The procedure followed when analysing the domain is made using a developed 3D CAD render based on a technical illustration and annotations provided in parallel, shown in Figure 6 and Figure 7.
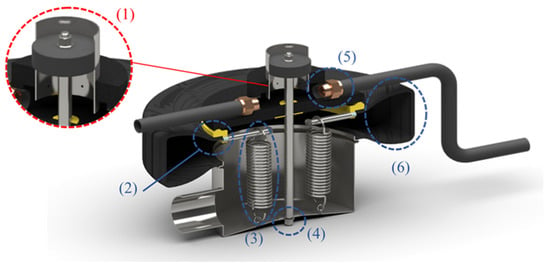
Figure 6.
Bunyip 3D internal system render used in this analysis. Annotations are discussed following this figure.
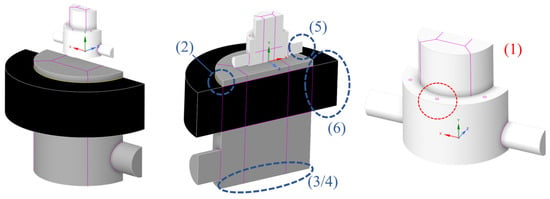
Figure 7.
Volume of interest model, annotated with discussed features.
The illustration introduces the decisions made to translate the real-world system into a functional modelling form, considering the reduction in complexity, cell count, and computational requirements. The domain shared in Figure 7 illustrates shared faces that connect adjacent zones, illustrated in pink, enabling separate volumes to facilitate the structured meshing strategy to be discussed.
- (1)
- Internal piston discharge holes: to prevent the requirement to place the feature upon a meshing interface and dynamic region, they could be relocated on the adjacent bore surface as indicated.
- (2)
- Tyre body seals are indicated in yellow. This component could be treated as a raised region to reduce the requirement to model the confined mechanism due to licence limitations. This will also provide limited compromise through a relatively representative entry region and discharge path for internal flow.
- (3/4)
- Internal spring/rod: These features were defeatured as they were assumed to have a limited influence on the outlet regions, with the flow primarily being driven by strong pressure gradients. Their induced losses were acknowledged but removed at this time.
- (5)
- Check-valve mechanisms: the operation of these mechanisms is less significant for the study and is modelled as idealised changes in the boundary inlet-to-outlet.
- (6)
- Tyre deformation: The multi-directional expansion, non-linear rubber material properties, and specific deformation pattern surrounding the tyre walls are complex to model. They are primarily act as a large piston. Thus, a vertical cylinder defined at an equivalent scaled size to deliver an equivalent stroke rate for the provided flow could be implemented.
3.2. Dynamic Meshing
The developed model is discretised using the integrated Ansys meshing module. This enables a suite of meshing tools to utilise the previously highlighted edges in fluid zones to assign meshing controls. Namely, the application of edge, face, and body sizing in conjunction with both structured sweep and couple compatibility regions of tetrahedral elements to maintain high mesh quality could facilitate the dynamics of the domain. For the study, a development mesh is utilised, opting for a nominal mesh size of 5 mm across the core areas and 10 mm in zones within dynamic regions, as shown in Figure 8. This is to compromise within the Ansys licence capacity and trade-off time step size across relatively extended transient simulations ~2–4 s at 0.005 s. The upper and lower regions of the system occupy separate volumes and utilise cylindrical structures comprising a square face surrounded by an anulus of sections. This can be recognised to maintain quality in central regions, particularly in the aspect ratio. A prospective mesh sensitivity test was conducted. To maintain layers’ successful operation and avoid negative cell volumes due to the implicit layering approach, the time steps have also been adjusted.
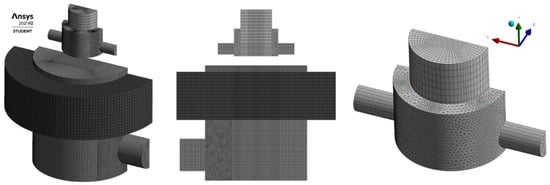
Figure 8.
Illustration of the development mesh employed within the study at 5 mm nominal and 10 mm dynamic.
A grid independence check was conducted, but within a limited range that is not at the expense of quality. The internal motion of the domain could be facilitated using dynamic meshing. Ansys, as a platform, provides three available methods, including smoothing, layering, and remeshing. Upon careful review, the layering method was considered to provide the best functionality for application. The method operates through the construction and destruction of individual layers of the domain using the user-defined relative height split and collapse factors defined at 0.4 and 0.2, respectively. This not only provides the advantage of only remeshing the direct group of cells influenced but more importantly ensures that the cell quality initially established is maintained. In the case that the other methods were used, it would be more difficult to maintain control, while the additional computation requirements are arguably only for multi-dimensional rotations and translations, which are not included within the model at this stage.
In Figure 9a,b, we illustrate the dynamic zones established to describe the operation in the upper chamber. In this case, the relative power and reset stroke of the piston could be defined by setting the piston as static, which is depicted in blue. The upper piston surface could be defined as static, and the foot could be set as a rigid body (RB) dynamic zone with established solution stabilization and meshing options set for the adjacent boundary, indicated in orange. This could be defined in parallel for the lower region on the lower ‘roof’ of the tyre. The orange and green regions could then be set in RB motion through the application of a designed UDF profile. This enables the internal tyre and piston region to extend and contract to represent the changes in the domain. This required the definition of over 60 dynamic zones, including interiors, boundaries, and volumes, as depicted in Figure 10.
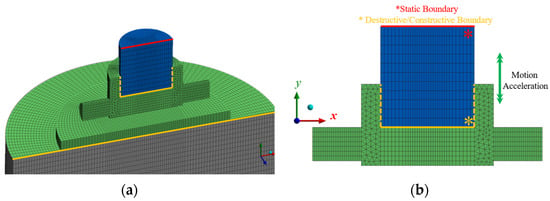
Figure 9.
Dynamic mesh zone setup, showing (a) isometric and (b) front cross-sectional views. Green regions depict rigid body motion, blue depicts active dynamic layering in the upper piston, and grey depicts the interface between the static tyre/base.
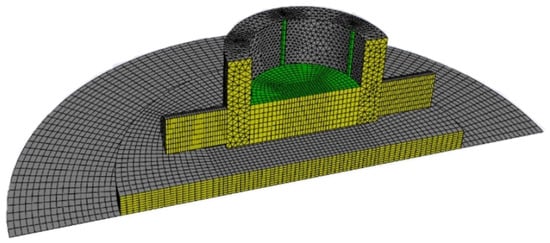
Figure 10.
Ansys Fluent dynamic zone mesh preview using default colours. Yellow regions indicate some parts of critical dynamic meshing, and green region indicate an example of the consequence influence of the dynamic region.
3.3. Motion Methodology
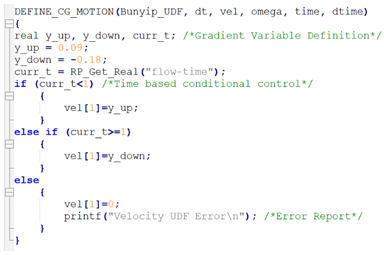
To integrate motion within the domain, the system has two potential options: UDF profiles to determine positions based on time or the powerful 6DOF multibody physics solver. Naturally, both methods provide advantages and disadvantages. The UDF’s functionality provides additional computational complexity and the ability for the user to develop bespoke features within the model to enhance its operation. For this application, the ‘DEFINE_CG_MOTION’ function could be implemented to initialise a dynamically set cell velocity across the thread (face ID) defined using the C code shared in Appendix A.
The UDF methods provide an opportunity to utilise the available manufacturer data and video footage to investigate and setup an associated time- and position-based profile. The simpler of the two methods can then be compiled into machine code for definition at each time step. One primary advantage of this method is the simplification of the internal physics to avoid making specific assumptions in calculations, using data based on real-world characteristics that could be known and measured in real-world applications. Although, by definition, a more simplified approach, this has the potential to improve validation and significantly reduce the calculation required. Its limitation, however, is its capacity to directly isolate operational parameters, such as the stiffness or components of pressure, to directly investigate their influence. These will now be limited to a defined cycle rate, which can be expected to act as a function of flow rate, supply, delivery, and drive pressure. Thus, the boundaries will also be required to be fixed at the determined pressure, and then inlets/outlets will be used to act on domain changes as opposed to the external pressure driving the system.
The second method uses a multi-body physics solver with the capacity to define the internal physics through the individual definition of the mass and stiffness properties of the system. For the Bunyip application, a free-body diagram is illustrated, as shown in Figure 11, to introduce the primary forces considered within an operation. For the given case in study, the internal pressure in the piston is calculated as an equivalent hydrostatic pressure ‘mass’ and defined through the 6DOF properties in addition to the Bunyip body mass of 5.6 kg. This will be directly applied during the power stroke and removed using a UDF during the reset phase [14]. In addition, other properties can be defined; for example, the internal spring stiffness can be implemented at 700 N/m across a constrained stroke length of 90 mm. At this time, we ignore the tyre stiffness due to its non-linear properties and multi-dimensional characteristics as well as additional losses due to friction. The solver enables internal equilibrium equations incident on the internal flow forces at the base volume of the tyre to be calculated, referenced centrally to the upper tyre surface. The result, similarly to the UDF, mapped across the domain relative to the surrounding green cell zones, as illustrated in Figure 9 before.
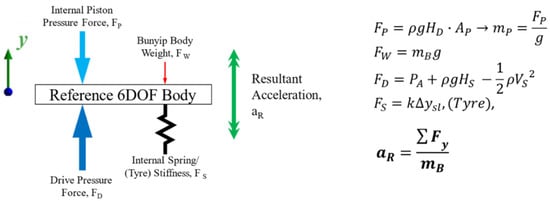
Figure 11.
Free-body diagram and determination of 6DOF solver’s properties.
A time-based velocity UDF has been adopted in this analysis. The 6DOF solver for the limited mesh is found to be unstable, accelerating rapidly, which is uncharacteristic of the pump. This can significantly influence the model’s validation. In retrospect, with its very limited presence within research applications, it is quite likely the gap previously discussed for motion was primarily developed within the simplified UDF profile definition.
3.4. Boundary Method and Automation
The domain can now be informed with the appropriate boundary conditions across several inlets and outlets for the operational cycle, as shown in Figure 12. This includes the application of both traditional pressure inlet/outlets and vent types to provide potential functionality to define losses across components such as check valves. The associated pressures could be calculated using the standard Bernoulli equation, assuming each source of water is static and at atmospheric pressure. Then, the hydrostatic head pressures can be calculated relative to the delivery valve, which is demonstrated for an example delivery pressure condition below.
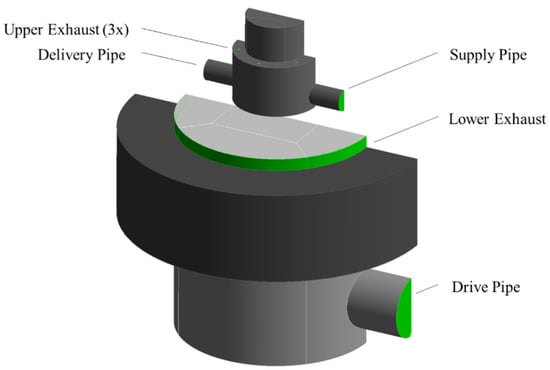
Figure 12.
Annotated Bunyip pump for boundary condition definition.
The pressures and outlets for a typical example case are presented in Table 2 at a supply head of 4 m, a delivery up to 35 m, and the defined inlet/outlet conditions to observe cycle-time-dependent flow rates. The ideal representation of the energy balance is Bernolli’s equation:

Table 2.
Pressure boundary condition types and example case: 4 m supply and 35 m delivery.
Due to the dynamic nature of the system and the incorporation of check valves and multiple exhausts, the domain is coupled to integrate the boundary conditions and synchronise the cycle in relation to the defined motion. Again, two options remain for its application.
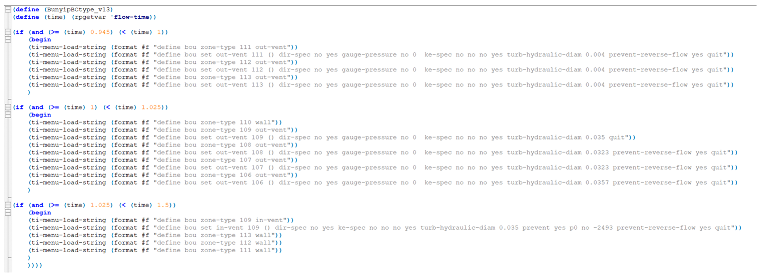
Scheme file methods enable the time-based sequencing of model inputs using the integrated Text User Interface (TUI) commands. These definitions make use of conditional sequencing to determine the current phase of the cycle and adjust the boundaries accordingly, as depicted in an example script provided in Appendix B. The file can be constructed and read to define a new command in the ‘.scm’ format, providing full access to edit and manipulate internal boundary types, values, and 6DOF properties. It could be recognised that their limitation appeared to be their dependency on ‘RP-variables’, such as standard global variables or constants, such as flowtime and ‘2’, for example. Consequently, the desire to utilise user-defined reports to inform decisions using mesh velocity and co-ordinates did not appear to be possible with this method. As the 6DOF solver previously discussed was unsuited to having a stable operation on a limited mesh domain, the scheme file application provides the desired flexibility for time-based UDF operation. Thus, it could be implemented directly within the model.
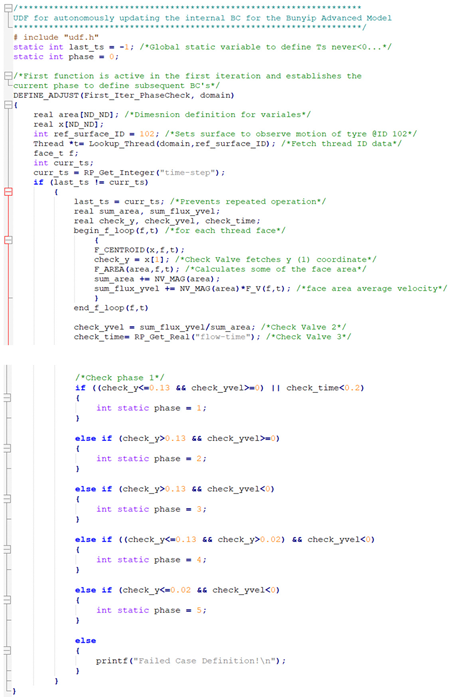
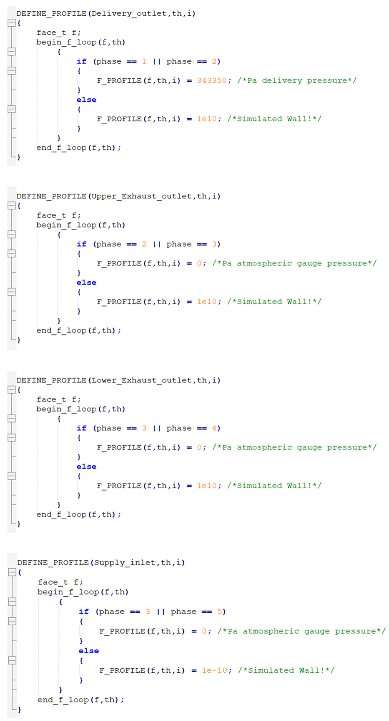
When investigating alternative methods for applications with time-independent solvers, such as the 6DOF solver, an alternative control script could be developed, again using the powerful UDF capacity. This could be facilitated utilising the DEFINE_ADJUST and DEFINE_PROFILE functions to directly access the solver to quantify the co-ordinates and velocity of the hooked tyre boundary. Each quantity could be calculated using a surface average for each face in the domain (grid) thread and used again in place with a sequence of conditional statements to define the pump phase and associated pressures at each boundary described in Appendix C.
3.5. Pre-Processing and Modelling
The pumping system is inherently turbulent, exhibiting flow mixing and chaotic motion due to sharp changes in pressure gradients and flow direction throughout its geometry. For this reason, the study will utilise an appropriate turbulence model. The transient 3D incompressible Navier–Stokes equations are used for the developed model to measure the continuity of various forms within the model, e.g., the conservation of momentum and turbulent kinetic energy and dissipation. There is no best fit for selecting the appropriate model, and this could be best informed through a review of the active researchers in the field (e.g., [15]), who have adopted the use of k-ε models, which have improved computational speed and mesh sensitivity relative to the default k-ω model. In the previously discussed literature, the realizable model could be recognised to provide strong validation in similar work [10,12]. The basic equations used in the computation stated are summarised below, but given in more detail in [15] and the ANSYS User Guide [14]:
The turbulent kinetic energy:
The turbulent dissipation rate:
where , , , , and . The default values for the model constants are set in Ansys-Fluent as: , , , and .
The model developed is constrained by the extended nature of a relatively long physical simulation time and short time steps of 0.005 s. To resolve the near-wall treatment, the model implements standard wall functions. As the model does not include any associated heat transfer or other models, for an initial development method, the default option could be considered sufficient, which is advised for a broad range of applications. The Ansys guidance indicates that it can be utilised when the first node cannot be placed within the viscous sub-layer developed [14].
The coupling scheme used for the pressure-based transient calculations, with the Pressure-Implicit with Splitting of Operators (PISO) algorithm, is typically advised for fully turbulent flow and described to maintain stability with larger time steps. The latter is relevant when simulating over an extended period of physical time associated with a complete cycle (see Ansys guide, Section 26.3.1 of [14]). The discretization method is set as Green–Gauss-node-based, calculating the scalar values and gradients using the arithmetic average of the element values surrounding each node. Additionally, it avoids the default least squares method which is observed to require additional calculation when implemented in parallel with PISO (See Ansys guide, Section 18.3.3 of [14]). To ensure a sufficiently small error, the convergence criterion was set to for continuity equation.
4. Results
To investigate the model developed, a series of cases could be identified through an applied video analysis of physical testing (PT) models and installed Bunyip systems. The key operational parameter inputs are listed in Table 3. The delivery flow rate is set within 5 to 6 L/s to investigate varied head ratios’ influence on the performance of the Bunyip system and to support its model validation. The associated sources are provided in Appendix D. The following figures illustrate the operational principle through total pressure and velocity graphics to be discussed in tandem with focused post-processed depictions to aid the analysis.

Table 3.
Tabulation of physical testing (PT) cases, inferred from [8].
Firstly, to illustrate the ‘free’ hydro-power cycle in principle, the propagation of the total internal pressure within the domain could be plotted globally to indicate the associated values relative to the total cycle. This additionally provides an opportunity to review the initial flow mechanics alongside a series of vector and magnitude illustrations, again using graphics to aid an internal investigation of the Bunyip mechanism. Figure 13 describes the process from motion initiation to upper piston compression and delivery. In Figure 13d,e, the discharge features release the upper piston to a reduced pressure for the motion to reset.


Figure 13.
Illustration of Bunyip cycle’s internal total pressure distribution. (a) At 0.1 s: delivery stroke start; (b) 1.0 s: mid-delivery stroke; (c) 1.875 s: piston approaches BDC; (d) 1.925 s: upper piston discharge ‘Un-lock’; (e) 2.025 s: piston prime initiates using supply; (f) 2.4 s: operational cycle complete.
The above operational process visualisation can also be enhanced through the application of the definition of internal planes to enable enhanced visuals of the relative quantities and better illustrate the internal flow, set apart using local and global pressures and velocity scenes. In this case, the rotation and mixing induced by the abrupt changes in the inlet geometry in Figure 14a,b are better described. The plots illustrate the complex dynamic nature of the chamber and the turbulent incident flow.
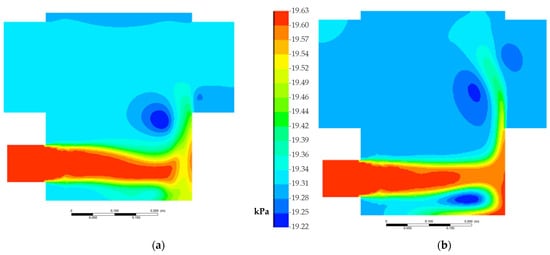
Figure 14.
Tyre inflation flow intake total pressure (kPa), showing (a) initial recirculation at 1 s and (b) acceleration to the lower discharge region at 1.925 s.
In addition to the total pressure, the flow velocity could also be used to illustrate the advancement and properties of flow within the volume and construct an improved picture of where energy may be lost and routes for improvement. This could be closely evaluated for the operation of the lower tyre in Figure 15. It can be recognised that the inlet flow generates a catalogue of chained rotational regions that build from their entry in the base right up to the filling of the tyre and upper discharge domain. The figures illustrate the extended path taken by the flow, which is generally associated with greater losses. In this case, the drive flow is forced directly to the far side wall. This results in the rapid deceleration and re-direction of the flow and momentum to rotate away from the wall, either rolling under the delivery flow or around and over the drive flow, mixing layers and inducing the rotational effects observed, particularly in Figure 15e,f.
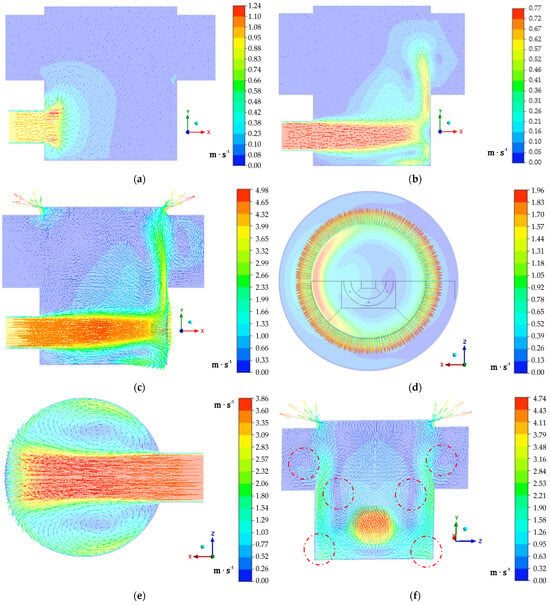
Figure 15.
Bunyip lower system velocity contours (in ) at different instants, identified with vectors to show the internal mixing and energy loss/unfavourable flow characteristics during the ‘dump’ phases. The graphs indicate: (a) drive entry: immediately inducing rotation as flow enters the domain at 0.1 s; (b) flow and recirculation region encouraged to the far side as the tyre inflates through aggressive entry at 1.5 s; (c) flow taking an extended path to discharge relief, preventing a faster ‘dump’ phase at 2.35 s; (d) drive pipe forces flow to the far side of the system, leading to non-uniformity across the tyre discharge seals; (e) velocity of drive flow around the perimeter and rolling above/below the base section; and (f) 3D effects of the abrupt drive velocity and highlighted recirculation in the red dashed circles.
Similarly to the lower system, the upper piston can also be analysed using the velocity vector and contour plot. In this case, the flow of the piston is very predictable due to the dominant changes in static pressure in the drive flow. The upper piston compression and exhaust phase were also investigated and are presented below in the delivery pattern illustrations in Figure 16.
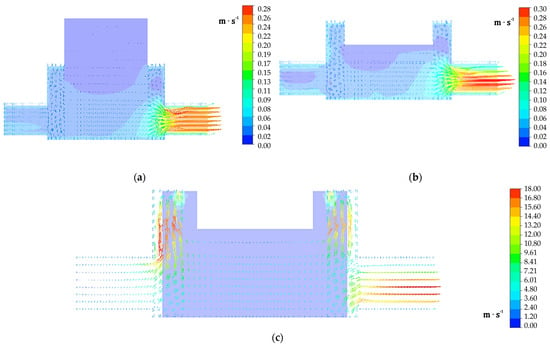
Figure 16.
Velocity contours in the upper piston stroke and discharge regions, illustrating the transient motion vectors at different time instants for (a) delivery stroke at 0.1 s; (b) water delivery as piston approaches BDC of the power stroke at 1.875 s; and (c) waterflow accelerates from the domain to the three exhaust points at 1.91 s.
4.1. Operational Observations
The previously conducted analysis provided valuable insights into the flow mechanics of the system in demonstrating the complete operational cycle and enhanced detail on the dump and discharge of the upper piston. In principle, the ‘free’ hydro-kinetic energy principle utilised could be successfully demonstrated across the four cases, and the model could be validated against real-world operational data with moderate corroboration. The study can now use the numerical model and physical data to appreciate and discuss where the system excels and where it may need further development.
The created model could utilise the power of numerical tools to individually measure and monitor quantities throughout the domain. This would enable the associated flow rates at each boundary to be measured under the action of the initialized motion relative to the pump cycle period in practice. Of which, the model provided reasonable agreement with the advertised capacity using the modelling method comprehensively discussed. The efficiency maintains, as anticipated, a respectable value across the three cases, operating within the regions previously shown in the supply head values in Table 1. The initial appraisal indicated that the pumps do provide significant potential but can be somewhat limited by their mechanisms within certain flows. It is important to recognise that in this case, the primary driver for the Bunyip pump would be the significant jump in elevation capacity relative to the HRP. Thus, as expected to be the case in the inspected regions, the HRP is potentially more efficient in the overall hydro-kinetic energy transfer at a moderate supply and delivery head. Though discussed at length, performance should also consider self-regulation amongst other factors as opposed to purely capacity.
As previously hypothesised, to manipulate the pressure amplifier and act on the large tyre system, the Bunyip pump would be expected to hold a greater portion of water. It yields a reduced relative delivery in contrast to a conventional HRP, delivering an extremely small 2% of the available water. For water-rich regions, this may still be deemed appropriate through the ability to unlock head potential in excess of, reportedly, 400 m in a recently developed steel piston chamber device for application in the Philippines [20]. The latter results are far better than the maximum excess described for the Blake HRP of 100 m and even the significantly improved design against conventional centrifugal fossil-fuel based pumps, but it is unable to match the potential delivery power of a piston mechanism. Although this naturally opens many doors for operation, the high portion of waste may impede the application of the Bunyip pump in some regions. Thus, an advised area of research would be to better utilise the supplied water, as discussed before briefly.
4.2. Data Validation
To verify the results, a series of four initial cases is used to assess the model’s suitability, along with a data analysis with a simple calculation using Bernoulli’s equation (Equations (4) and (5)). In parallel, four cases of Bunyip’s results are inspected for the model validation, as presented in Table 4. The content focuses on the installations delivered, sharing an insight into operational parameters and achieved outputs, paired with the fundamental values to validate the modelling approach. The set of parameters is studied for a PA-13 Bunyip, operational with a 98 mm piston without water ballast devices. The device remains in the conventional position (no submerged tyre valves or out-of-water installations), sharing the same input flowrate to investigate the head ratio’s influence on the associated performance metrics without impacting the flowrate. Each case could be modelled as per the video parameters and the bespoke UDF files developed for the time-based cycle to facilitate the motion relative to the observed cycle period and establish boundary pressures to enable the compilation of a complete summary, as given in Table 4.

Table 4.
Summary of the tested operational cases for validation of data.
In Table 4, several values are contrasted between the physical testing (PT) data inferred from [8] and the numerical modelling (NM) data. This enables the fundamental components to be corroborated, in addition to the enhanced break down of components in the NM case, to appraise the model’s suitability for applications. The cases investigated operated within the bounds of a 5–6 L/s drive supply with a varied supply between 1.2 and 2.2 m. The system-maintained operation within an appropriate magnitude and demonstrated fluctuations both above and below the physical value, additionally feeding into the operational efficiency. Upon installation, certain parameters will be fixed; however, the model additionally enables the individual case stroke length to be tailored to the application, and each case is assumed to have a standard Ø = 98 mm design. Naturally, in practice, the spacers on the central rod can be used to adapt the system’s stroke length for its application. This could be assumed at 90 mm from the scaled geometry; thus, the PT devices are expected to induce a degree of variation. Thus, a good indication of a suitable validation is the bi-directional variance for similar cases, as in cases 2 and 3. This indicates that the model values attained still provide a reasonable indicator for the anticipated output capacity. Although, it could be noted that there is potential for both under and overestimates. Due to the enhanced lifting capacity, even a small variance in the output can quickly develop into a notable variance in the efficiency, as emphasised further within the Bunyip pump. The variance in both the output and efficiency remains consistently above or below each PT result and should be considered when extracting data. The model is suitable for an initial analysis, and in future, further investigation into cases in which each system parameter is observed should be considered.
4.3. Parametric Analysis
The previously discussed series of real-world systems provide the opportunity to observe the influence of supply and delivery performance. The data collected and calculated using the numerical model are used to produce a three-dimensional surface plot (see Figure 17). This visual representation uses the analysed cases to begin building an indication of how the supply and delivery heads in combination may influence the daily output and proportional operational performance of the pump. Importantly, note that the lower delivery head regions, we assign an average capacity of 8600 L/day to illustrate the surface floor average. In many of the cases away from our inspected data points, it is recommended to adopt a smaller Bunyip PA-8. Generally, such unique cases and data are not available in low-end performance systems either. At the given supply rate, the trend within the current dataset indicates that, as expected, with an increased supply head, the Bunyip pump can access improved daily output. Meanwhile, the ability to connect the two variables again indicates that for the typical 2 m average tested, the greatest accessible performance capacity would be at a ~32 m delivery.
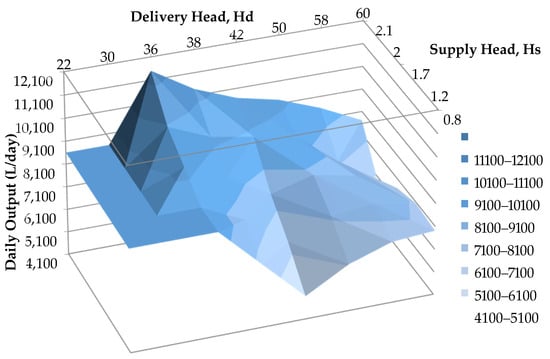
Figure 17.
Parametric data graph showing the delivery head, Hd (m), and supply head, Hs (m), versus the predicted Bunyip daily output capacity (/day).
It was also recognised that the elevated lifting capacity attained through the positive displacement pump can in fact impede performance at low delivery heads. In this region, the ‘lighter’ pressure on the conventional HRP delivery valve enables the rapid delivery of water in increased volumes. Conversely, the distance required for the piston mechanism and two stroke process spears to reach a terminal speed is extended, whereby the linear delivery cannot benefit from a similar operation. It should also be recognised that the cases available for the analysis did not operate at a head greater than 60 m. Thus, expanding the study to include additional data would enable Figure 17 to become a more powerful tool for parametric assessment. This could be achieved using the implementation of the current CFD data or further advanced simulation tools to strategically identify a clear performance ‘surface’ to inform installation and identify the optimal range for operation at varied supply rates available to end users.
5. Conclusions
The results highlight several key findings and potential areas for further research related to the Bunyip micro hydro-power system. The research began with a comprehensive literature review, which provided valuable insights into conventional hydro-ram pump (HRP) systems, their limitations, and micro hydro-power performance indicators. The project aimed to explore the potential of the Bunyip system as an innovative technology in the hydro-powered pumping field.
The research involved creating a detailed and advanced dynamic model, which required new modelling and programming skills to evolve the underlying physics of the flow. The use of software user-defined functions (UDFs) facilitated a good degree of verification for the initial analysis and provided a clear pathway for future research and model development. We conducted a further attempt to validate the data, but we could not reach a full validation. However, the data were comparable.
The study acknowledges that the Bunyip system cannot completely replace the HRP, as the latter remains more operationally efficient under a moderate supply and moderate delivery conditions. However, the Bunyip’s enhanced delivery head capacity and operation under a reduced supply head make it a valuable alternative in the field, which is dominated by traditional HRPs. It is highlighted in this study that further research is needed to fully validate a 6DOF (six degrees of freedom) model capable of isolating each variable within the Bunyip system. The system shows promise in lifting water to significantly greater elevations, surpassing typical HRPs and fossil-fuel centrifugal systems. However, this increased capacity comes at the cost of reduced relative delivery, making it less suitable for water-scarce regions. The results indicate that a smaller diameter of the pressure chamber and a higher supply head lead to a higher pressure, achieving a target head of 3 m with a 15% efficiency and a flowrate of 11.82 L/min.
To better capture and utilize the lower portion of the exhaust flow during the dump phase, submerging this region can help dissipate the discharge energy more efficiently. Also, trapped energy in the wasted water could be captured by using a combined large diaphragm valve. This could chain the energy from the initial Bunyip pump cycle into another renewable system for delivering elevated pressure to a secondary location. The conclusion emphasizes that the Bunyip system has the potential to elevate micro hydro-powered systems and calls for further focused research to optimize its design and improve its water delivery capacity.
Author Contributions
Conceptualization, M.A.Q.; methodology, S.D.B. and M.A.Q.; software, S.D.B.; validation, S.D.B.; formal analysis, S.D.B.; resources, S.D.B. and M.A.Q.; data curation, M.A.Q. and S.D.B.; writing—original draft preparation, S.D.B. and M.A.Q.; writing—review and editing, M.A.Q.; visualization, M.A.Q.; supervision, M.A.Q.; project administration, M.A.Q. All authors have read and agreed to the published version of the manuscript.
Funding
This research received no external funding.
Data Availability Statement
Data are contained within the article.
Conflicts of Interest
The authors declare no conflict of interest.
Nomenclature
| Notation | Description |
| ] | |
| Constant for turbulent energy dissipation rate, 1.2 | |
| Constant for turbulent kinetic energy, 1.0 | |
| Constants in realizable k- ε turbulence model | |
| ] | |
| ] | |
| Operational efficiency [%] | |
| ] | |
| ] | |
| Height relative to delivery valve [] | |
| Tensor indices | |
| Time [] | |
| ] | |
| , V | |
| Pressure [Pa] | |
| Q | ] |
| ] | |
| Relative delivery | |
| Force [] | |
| ] | |
| Bunyip stroke length [] | |
| ] |
Appendix A. User Defined Function for Linear Rise-Fall Velocity Profile Definition
Appendix B. Boundary Manipulation Scheme Functions
Appendix C. Bunyip Automation Script Monitoring Tyre Boundary ID to Set Inlet/Outlet Profiles
Appendix D. Bunyip PA-13 Operational Case Information
The set of parameters is studied for a Bunyip pump operational with a 98 mm piston without water ballast devices or drive supply connections to the supply piston [26]. The device remains in the conventional position (no submerged tyre valves or out-of-water installations).
Case 1—Bunyip PA13 Pump at Misty Mountain Biggs road Nth QLD, Australia. Available at <Bunyip PA13 Pump at Misty Mountain Biggs road Nth QLD, Australia.—YouTube: https://www.youtube.com/watch?v=pFPmeESb0Ao&t=18s> [accessed on 14 April 2022].
Case 2/Case 3—Bunyip Pump(s) on Thiaki Creek, available at <Second Bunyip Pump on Thiaki Creek—YouTube: https://www.youtube.com/watch?v=MDb8Exrg-F0> [accessed on 14 April 2022].
Case 4—Tableland Bunyip, available at <Another Tableland happy Bunyip—YouTube: https://www.youtube.com/watch?v=a0FQfoPJMWk> [accessed on 14 April 2022].
References
- United Nations. What Is Renewable Energy? Available online: https://www.un.org/en/climatechange/what-is-renewable-energy (accessed on 2 July 2023).
- IEA. The Global Energy Crisis Pushed Fossil Fuel Consumption Subsidies to an All-Time High in 2022. Available online: https://www.iea.org/commentaries/the-global-energy-crisis-pushed-fossil-fuel-consumption-subsidies-to-an-all-time-high-in-2022 (accessed on 2 July 2023).
- IRENA; CPI. Global Landscape of Renewable Energy Finance 2023; IRENA. ISBN: 978-92-9260-523-0. Available online: https://www.irena.org/ (accessed on 25 June 2023).
- Karekezi, S.; Kimani, J.; Wambille, A.; Balla, P.; Magessa, F.; Kithyoma, W.; Ochieng, X. The Potential Contribution of Non-Electrical Renewable Energy Technologies (RETs) to Poverty Reduction in East Africa; AFREPREN/FWD: Nairobi, Kenya, 2005. [Google Scholar]
- Roberts, A.; Thomas, B.; Sewell, P.; Hoare, E. Generating Renewable Power from Water Hammer Pressure Surges. Renew. Energy 2019, 134, 1392–1399. [Google Scholar] [CrossRef]
- Intriago Zambrano, J.C.; Michavila, J.; Arenas Pinilla, E.; Diehl, J.C.; Ertsen, M.W. Water Lifting Water: A Comprehensive Spatiotemporal Review on the Hydro-Powered Water Pumping Technologies. Water 2019, 11, 1677. [Google Scholar] [CrossRef]
- Young, B.W. Design of Hydraulic Ram Pump Systems. Proc. Inst. Mech.Eng. Part A J. Power Energy 1995, 209, 313–322. [Google Scholar] [CrossRef]
- Porta’s Engineering Home|Bunyip Water Pumps. Available online: https://www.bunyipwaterpumps.com/ (accessed on 16 July 2023).
- Guo, X.; Li, J.; Yang, K.; Fu, H.; Wang, T.; Guo, Y.; Xia, Q.; Huang, W. Optimal Design and Performance Analysis of Hydraulic Ram Pump System. Proc. Inst. Mech.Eng. Part A J. Power Energy 2018, 232, 841–855. [Google Scholar] [CrossRef]
- Li, J.; Yang, K.; Guo, X.; Huang, W.; Wang, T.; Guo, Y.; Fu, H. Structural Design and Parameter Optimization on a Waste Valve for Hydraulic Ram Pumps. Proc. Inst. Mech. Eng. Part A J. Power Energy 2021, 235, 747–765. [Google Scholar] [CrossRef]
- Harith, M.N.; Bakar, R.A.; Ramasamy, D.; Quanjin, M. A Significant Effect on Flow Analysis & Simulation Study of Improve Design Hydraulic Pump. IOP Conf. Ser. Mater. Sci. Eng. 2017, 257, 012076. [Google Scholar] [CrossRef]
- Harith, M.N.; Bakar, R.A.; Ramasamy, D.; Kardigama, K.; Quanjin, M. A Study of Waste and Delivery Valve Design Modification to the Pump Performance. IOP Conf. Ser. Mater. Sci. Eng. 2018, 342, 012090. [Google Scholar] [CrossRef]
- Rybdylova, O.; Al Qubeissi, M.; Braun, M.; Crua, C.; Manin, J.; Pickett, L.M.; de Sercey, G.; Sazhina, E.M.; Sazhin, S.S.; Heikal, M. A Model for Droplet Heating and Its Implementation into ANSYS Fluent. Int. Commun. Heat Mass Transf. 2016, 76, 265–270. [Google Scholar] [CrossRef]
- Ansys®; R2; ANSYS, Inc.: Canonsburg, PA, USA, 2022.
- Tu, J.; Yeoh, G.H.; Liu, C. Computational Fluid Dynamics—A Practical Approach; Butterworth-Heinemann: Oxford, UK, 2008. [Google Scholar]
- Porta, B.; (Porta’s Engineering, Silkwood, Australia); Glockemann, R.; (Porta’s Engineering, Wyndhan, Australia); Beard, S.; (Coventry University, Coventry, UK). Bunyip vs. RAM Comparison. Personal communication, 1 February 2021.
- Maratos, D.F. Technical Feasibility of Wavepower for Seawater Desalination Using the Hydro-Ram (Hydram). Desalination 2003, 153, 287–293. [Google Scholar] [CrossRef]
- Yussupov, Z.; Yakovlev, A.; Sarkynov, Y.; Zulpykharov, B.; Nietalieva, A. Results of the Study of the Hydraulic Ram Technology of Water Lifting from Watercourses. Int. J. Eng. Sci. 2022, 177, 103713. [Google Scholar] [CrossRef]
- Inthachot, M.; Saehaeng, S.; Max, J.F.J.; Müller, J.; Spreer, W. Hydraulic Ram Pumps for Irrigation in Northern Thailand. Agric. Agric. Sci. Procedia 2015, 5, 107–114. [Google Scholar] [CrossRef]
- Glockemann, R.; (Porta’s Engineering, Wyndhan, Australia); Beard, S.; (Coventry University, Coventry, UK). Opportunities to Improve the Bunyip System 2022. Personal communication, 10 February 2022.
- Asvapoositkul, W.; Nimitpaitoon, T.; Rattanasuwan, S.; Manakitsirisuthi, P. The Use of Hydraulic Ram Pump for Increasing Pump Head-technical Feasibility. Eng. Rep. 2021, 3, e12314. [Google Scholar] [CrossRef]
- Asvapoositkul, W.; Juruta, J.; Tabtimhin, N.; Limpongsa, Y. Determination of Hydraulic Ram Pump Performance: Experimental Results. Adv. Civ. Eng. 2019, 2019, 970218. [Google Scholar] [CrossRef]
- Fatahi-Alkouhi, R.; Lashkar-Ara, B. Experimental Evaluation of Effective Parameters on Characteristic Curves of Hydraulic Ram-Pumps. Sci. Iran. 2017, 26, 283–294. [Google Scholar] [CrossRef]
- Blake’s Hydram. The Blake Hydram Water Pump-Self Powered-No Fuel-None Polluting. Available online: https://blakeshydram.co.uk/ (accessed on 16 July 2023).
- Papa Pump Papa Multi-Pump Systems 2017, White paper. Available online: https://waterpoweredtechnologies.com/case-studies/ (accessed on 2 July 2023).
- Beard, S.D.; Al Qubeissi, M.; Khanal, B. Computational Analysis of Hydro-Powered Bunyip Pump. In Energy and Sustainable Futures: Proceedings of the 3rd ICESF, 2022; Nixon, J.D., Al-Habaibeh, A., Vukovic, V., Asthana, A., Eds.; Springer Proceedings in Energy; Springer Nature Switzerland: Cham, Switzerland, 2023; pp. 61–71. ISBN 978-3-031-30959-5. [Google Scholar]
Disclaimer/Publisher’s Note: The statements, opinions and data contained in all publications are solely those of the individual author(s) and contributor(s) and not of MDPI and/or the editor(s). MDPI and/or the editor(s) disclaim responsibility for any injury to people or property resulting from any ideas, methods, instructions or products referred to in the content. |
© 2023 by the authors. Licensee MDPI, Basel, Switzerland. This article is an open access article distributed under the terms and conditions of the Creative Commons Attribution (CC BY) license (https://creativecommons.org/licenses/by/4.0/).