Article

The Effects of Anodization Conditions on TiO2 Nanotubes Features Obtained Using Aqueous Electrolytes with Xanthan Gum

by
Robinson Aguirre Ocampo
and
Félix Echeverría Echeverría
*
Centro de Investigación, Innovación y Desarrollo de Materiales CIDEMAT, Facultad de Ingeniería, Universidad de Antioquia UdeA, Calle 70 No. 52-21, Medellín 050010, Colombia
*
Author to whom correspondence should be addressed.
Inventions 2023, 8(5), 109; https://doi.org/10.3390/inventions8050109
Submission received: 17 July 2023 / Revised: 22 August 2023 / Accepted: 24 August 2023 / Published: 29 August 2023

Abstract

:
Titanium surfaces were anodized to create nanotube structures utilizing an aqueous electrolyte made of xanthan gum (XG) and sodium fluoride. The purpose of employing this type of anodizing solution was to investigate the impact of XG addition on the morphology and organization of nanotubes. As far as we know, this is the first time that TiO2 nanotubes, made using aqueous electrolytes with XG as an additive, have been reported. The organization of the nanotubes was measured using the regularity ratio (RR) from the fast Fourier transformation (FFT) pictures. Contrary to the nanotubes formed in aqueous solutions without XG, the addition of XG to the aqueous electrolyte improved the nanotube organization, with no effect on packability. Based on the findings of this experimental work, organized and homogeneous nanotubular structures might be produced utilizing an inexpensive and non-toxic aqueous electrolyte.

1. Introduction

Because of its outstanding qualities, including low density, biocompatibility, and corrosion resistance, titanium (Ti) is a multipurpose material employed in various applications [1,2,3]. Additionally, Ti has the ability to spontaneously produce a coating of TiO2. Due to its semi-conductive, chemical stability, and zero-toxicity qualities, titanium dioxide has been researched by numerous scientists [4,5,6,7]. However, the layer of titanium dioxide could be artificially obtained with determined morphologic characteristics by an electrochemical technique such as anodization [8]. Among the morphologies that could be obtained by anodization, the nanotubular structure is one of the types that has drawn significant attention from academics, since it exhibits unique geometric qualities that make it worthwhile for application such as solar cells, photocatalytic devices, and biomedical devices, among others [9,10,11]. Although there are various techniques to fabricate titanium dioxide nanotubes, anodization has grown to be one of the most often used due to its simplicity and ease of use. Aqueous solutions containing hydrofluoric acid were the first electrolytes used to create nanotubes, and these electrolytes produced short and non-homogeneous TiO2 nanotubes; however, organic electrolytes permitted the obtention of highly ordered nanotubes with lengths further than 200 µm [2,7,8,12,13]. The features of nanotubes made in organic media have led to a noticeable increase in the amount of research being carried out on them. However, it is vital to consider that, in comparison to aqueous electrolytes, these electrolytes are more costly and less eco-friendly. In addition, in recent years various publications [14,15,16,17,18,19,20,21,22] have reported certain problems related to the coating regularity and packing of TiO2 nanotubes made in organic solutions, for example, delamination, cracks, different spaces among nanotubes, and coral-like structures.
As a result, there is a research opportunity to improve the homogeneity and organization of nanotubes generated in aqueous electrolytes considering the high packability of TiO2 nanotubes generated in aqueous electrolytes. Thus, xanthan gum (XG) was employed as an additive to raise the homogeneity and organization of TiO2 nanotubes generated in aqueous electrolytes. XG is a low-cost, innocuous, and biodegradable reactive. XG has been thoroughly researched for its range of uses, including biomedical, tissue engineering, cosmetics, food and food packaging, and pharmaceuticals [23,24]. As far as we know, there are no scientific reports using aqueous electrolytes containing XG to produce TiO2 nanotubes. Moreover, a comprehensive analysis of how the anodization parameters affect the properties of the TiO2 nanotubes generated using aqueous electrolytes with XG has not been reported in the scientific literature yet. To improve the homogeneity and organization of nanotubes formed in aqueous electrolytes, we investigated experimental anodization parameters, including fluoride concentration, anodizing time, pH, and XG concentration. To accomplish this, we used energy-dispersive X-ray (EDX), scanning electron microscopy (SEM), and Raman spectroscopy to analyze the anodic coatings. Additionally, we examined the nanotube organization using the fast Fourier transformation (FFT) pictures obtained from the SEM images.

2. Materials and Methods

One-centimeter square sections of commercially pure Ti grade 2 (ASTM F-67), with a thickness of 1 mm, were mechanically polished with silicium carbide paper up until grade 2500 before being washed in acetone using an ultrasonic cleaner for 20 min. The samples were submerged in an aqueous electrolyte that contained NaF and XG, and the pH value of the electrolyte was established using H3PO4. All the experiments were conducted at ambient temperature. Using a DC power source (Kepco BHK 500-0.4 MG), the anodic coatings were produced at a constant potential of 20 V, and the current data were logged during the entire anodizing process time. Two electrodes were employed in the anodization process: a platinum mesh served as the cathode, and a titanium sample worked as the anode. After the anodization procedure, the samples were cleaned with distilled water and then air dried. A JEOL JSM 6940 LV scanning electron microscope with an energy-dispersive X-ray (EDX) detector was used to evaluate the morphology and composition of the anodic coatings; the transversal view images were obtained by scraping the surface sample and tilting the sample holder (roughly 30°) until the required image was acquired. Three SEM pictures for each condition were used to calculate the internal diameter and thickness of the nanotubes; ten measurements were taken in each image. The WSxM 5.0 [25] program was used for the FFT analysis, and Image J, which is freely available, was used for other metrics such as coating thickness and internal diameter. A Micro-Raman Jovin Yvon Horiba, Model Labram High Resolution was the equipment used for micro-Raman spectroscopy.

3. Results and Discussion

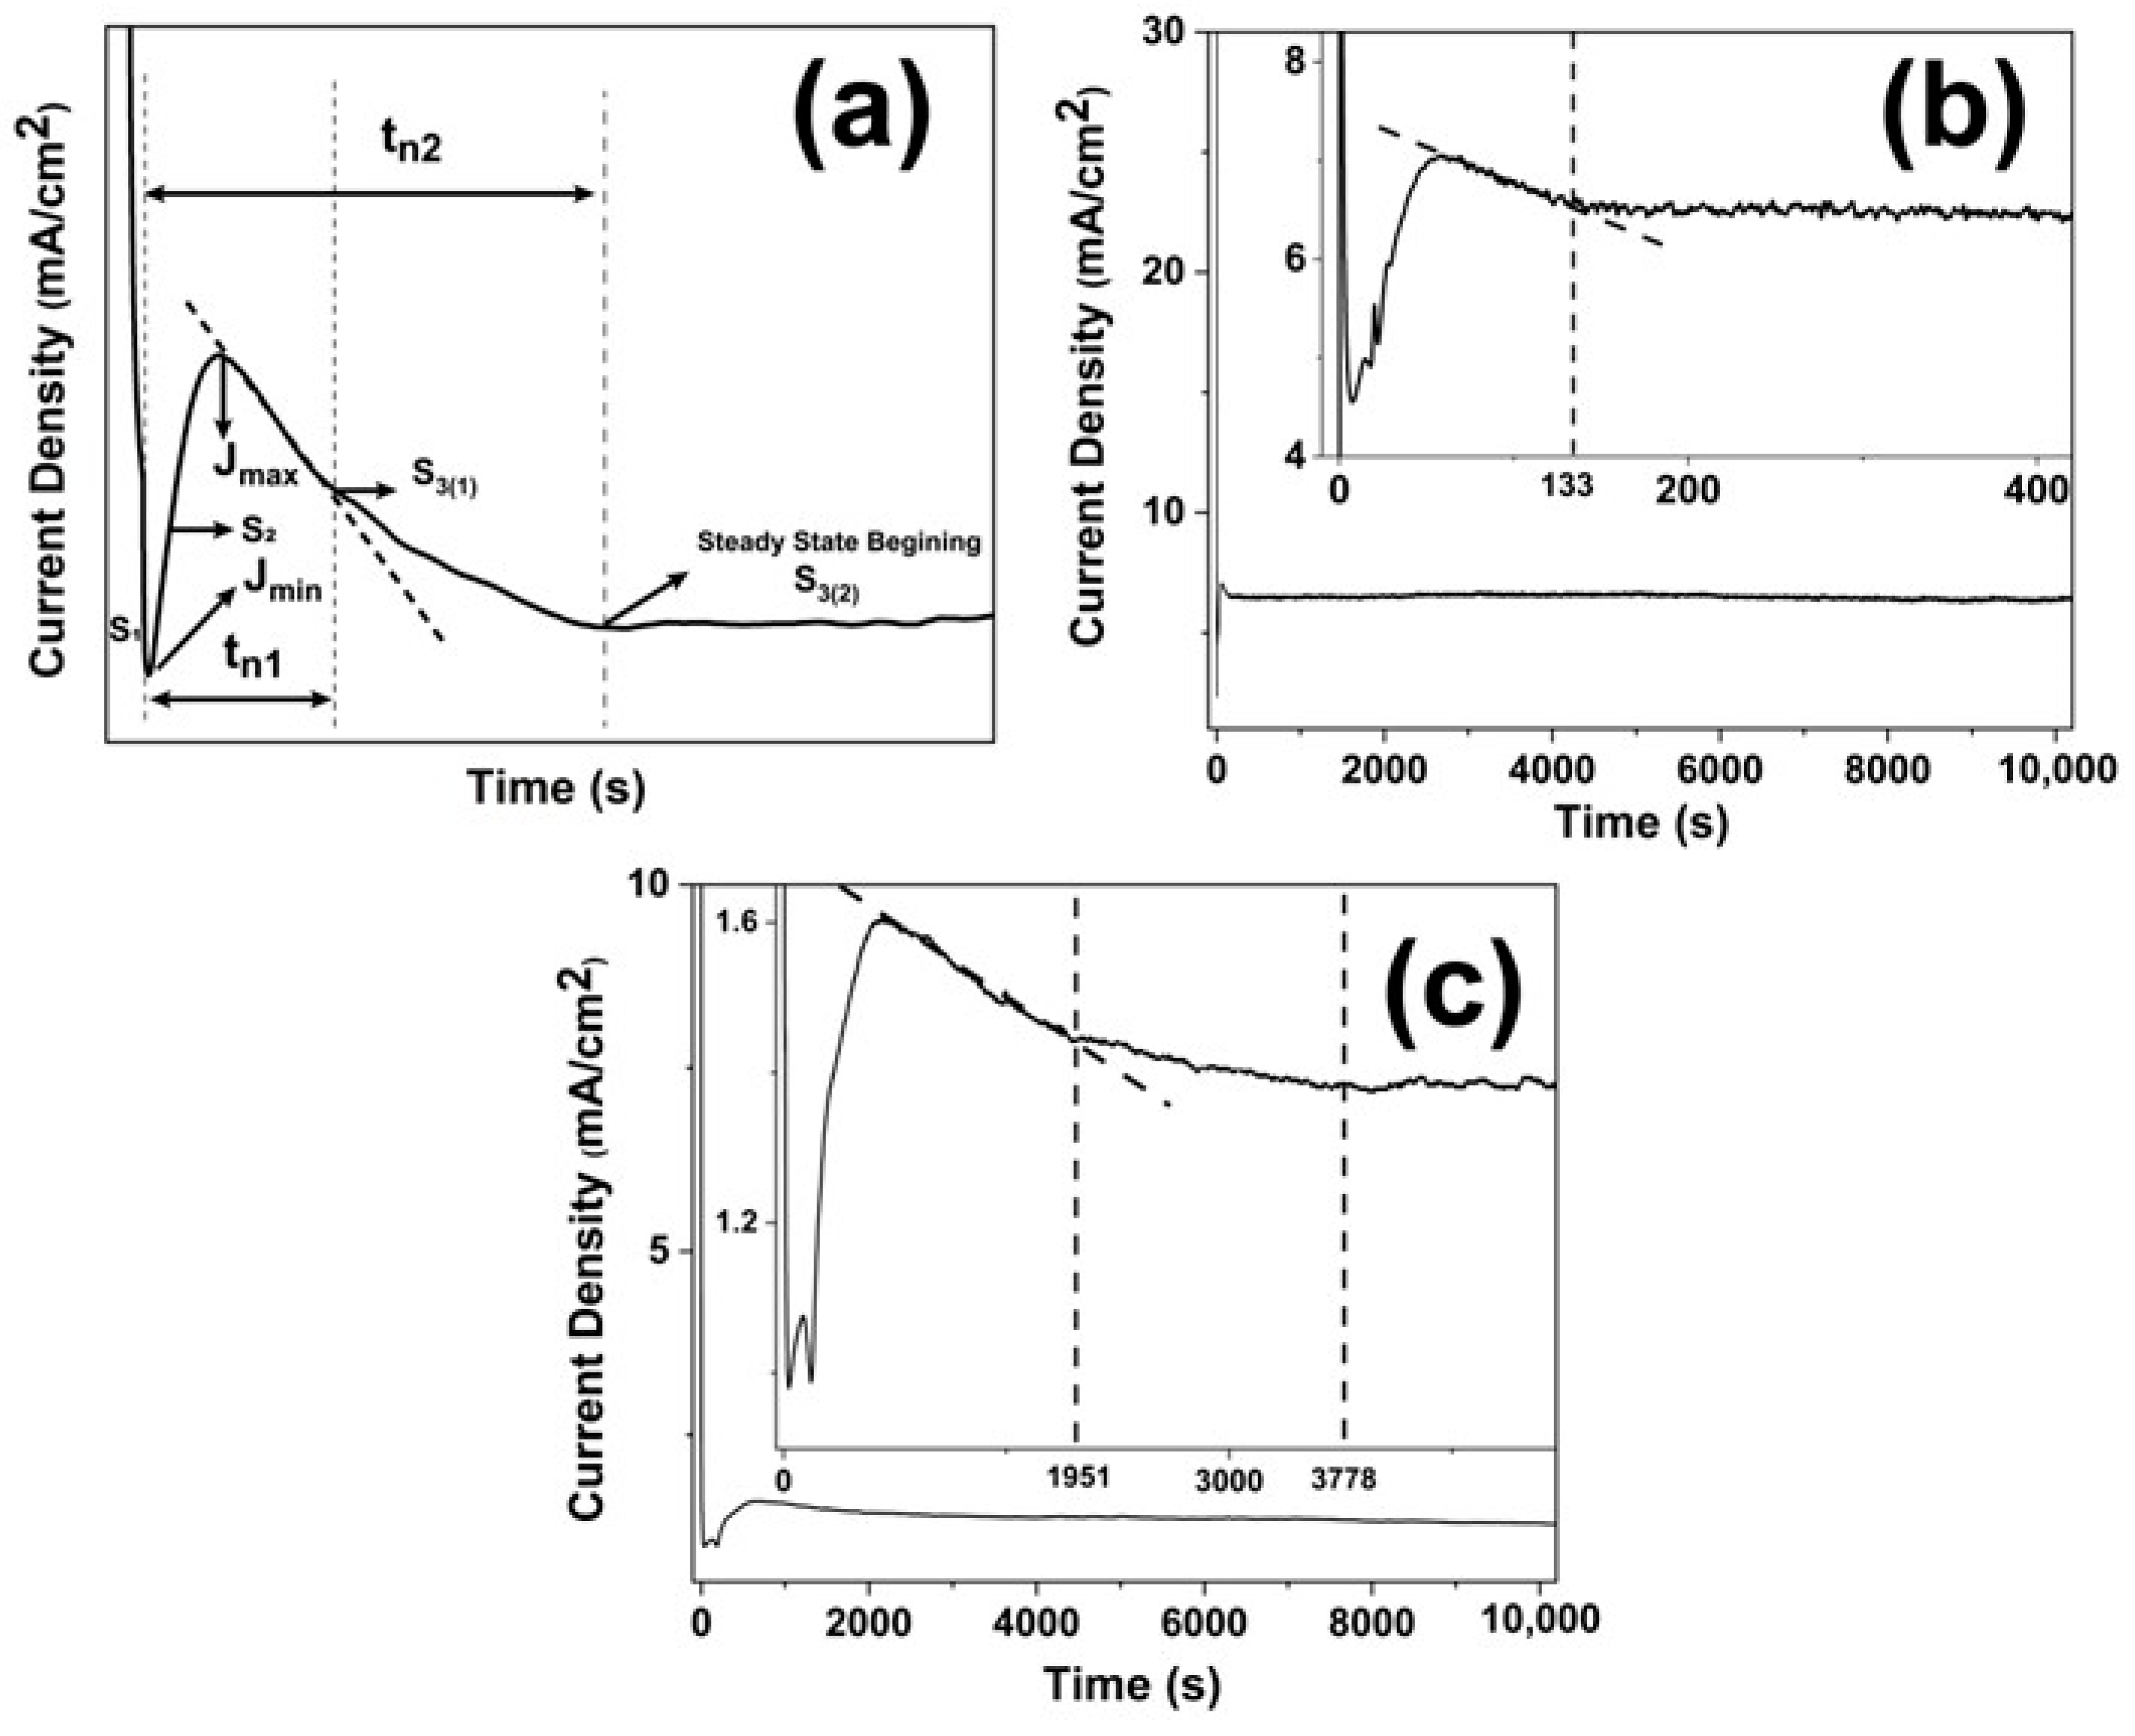
3.1. Current Density vs. Time Transients and Nanotube Organization

A typical anodization curve for TiO2 nanotube production is shown in Figure 1a; according to the field-assisted dissolution theory, the process begins with an abrupt surge in current density, followed by a fast fall in current density due to the creation of a barrier layer. Afterwards, a shift happens in the slant of the curve, indicating the onset of pore nucleation (S1). The barrier layer kept increasing up to the current density achieved a minimum value (Jmin). The oxide thickness attained at this time restricts the transport of oxygen ions across the barrier layer, which shifts the oxidation/dissolution balance towards the dissolution side and causes pore formation to increase (S2); this procedure continues until the highest possible pore density is reached (Jmax). Next, the nanopores rearrange and start to compete with one another to become nanotubes.
As the process of creating nanotubes progresses, the slope of the curve changes, signaling the start of a new stage (S3(1)). During this stage, the nanotubes begin to grow as the process progresses. The nucleation time was established by Apolinaro et al. [26] as follows: tn1 = t3(1) − t1, where t3(1) and t1 were the timeframes to attain S3(1) and S1, respectively. On the other hand, according to the oxygen bubble model [27,28], the barrier layer is formed in the first part of the process; thus, the current density decreases until Jmin. In the second stage of the process, nanotube embryos are created due to the oxygen bubbles acting as a mold; this process starts at S1 and ends when the steady state begins (S3(2)). In stage 3, the nanotubes grow as the process advances due to oxygen bubbles erupting from the nanotubes’ bottoms, and the electrolyte eventually goes to the bottom of the nanotube.
Nucleation time according to the oxygen bubble model could be defined as follows: tn2 = t3(2) − t1, where t3(2) and t1 were the lapses of time to achieve S3(2) and S1, respectively. According to Apolinaro et al. [26], the nanotubes’ degree of ordering and uniformity is strongly correlated with the nucleation time; as a result, the greater the nucleation time, the better the order of the nanotubes. The current density vs. time transients for aqueous electrolytes with and without XG, respectively, while keeping the other anodization parameters constant, are shown in Figure 1b,c. Both curves display previously reported nanotube production stages and have the characteristic shape seen in Figure 1a. However, specific variances may be seen, particularly in the time needed at each stage. From Figure 1b, for the curve of the aqueous electrolyte without XG, it can be seen that t3(1) = t3(2) = 133 s, which means that there is no difference in the S3 points for oxygen bubbles and field-assisted dissolution theories, and thus, tn1 = tn2 = 130 s. From Figure 1b, for the curve for the aqueous electrolyte with XG, it can be seen that tn1 = 1935 s and tn2 = 3362 s. Comparing the nucleation time for the aqueous electrolyte with and without XG, the higher nucleation times of the electrolytes with XG in contrast to those without XG are evident. Figure 2 shows SEM pictures of TiO2 nanotubes obtained using aqueous electrolytes without and with XG and their respective FFT images. It is evident from comparing the nanotubes made with XG (Figure 2e–i) and those made without XG (Figure 2a–d) that the organization and circularity of the nanotubes made with the XG-containing electrolyte were higher than those made with the XG-free aqueous electrolyte. The increase in viscosity brought on by the addition of XG was the primary cause of the rise in the nucleation time and, thus, of the higher homogeneity and organization of nanotubes generated in aqueous electrolytes containing XG. Viscous organic solvents are often the electrolytes utilized to produce highly organized nanotubes (for instance, glycerol, dimethyl sulfoxide, and ethylene glycol). However, numerous authors [14,15,16,17,18,20,21,29,30,31] have raised concerns about the packaging and coating homogeneity (for example, coral-like structures, cracks, and no similar spaces between nanotubes). Contrarily, the organization in aqueous electrolytes is poor (polygonal shape rather than circular shape and non-uniform nanotube sizes [4,32,33,34,35] (see Figure 2c,d)) as a result of their lower viscosity (greater ion movement), but in general, they had a higher packability (see Figure 2a). It is essential to highlight the higher packability shown in the TiO2 nanotubes made in aqueous electrolytes with XG (see Figure 2e,f).
The nanotube ordering could be measured, however, both qualitatively and quantitatively. FFT images from SEM images could be used to measure the ordering qualitatively. Figure 2j,k display FFT images from SEM pictures of TiO2 nanotubes generated in aqueous electrolytes without XG and with XG, respectively. In our previous work [4], based on the paper by Stępniowski [36], we analyzed the form of the FFT images. Therefore, in nanotube structures with lesser organization, the FFT form can take on many geometrical shapes; for example, in Figure 2j, a blurred ellipse was created; however, other polygonal forms, or a blurred image without a defined shape, might also be produced. However, a nanotube structure with a higher organization had an FFT picture with a circular form (see Figure 2k). From the FFT images, it is clear that the organization of nanotubes produced in aqueous electrolytes with XG was higher than those made in aqueous electrolytes without XG. Circularity in FFT images has been used as an indication of nanostructure organization by several authors [4,9,36,37,38,39,40,41]. FFT pictures could be used for quantitatively measuring the TiO2 nanotubes’ ordering. Due to this, the averaged regularity ratio (RR) approach, which is based on FFT measurements, was employed. Its equation is:
RR = (In1/2)/(W1/2S3/2)
where n is the amount of nanotubes examined, I is the radial average’s intensity, W1/2 is the radial average’s width at half its height, and S is the area. The RR value of the TiO2 nanotubes generated in aqueous electrolytes without XG was about zero, due to the intensity in the graph being close to zero (inset Figure 2j); this means that those nanotubes did not show any organization. On the other hand, the TiO2 nanotubes generated in aqueous electrolytes with XG had a RR value of 0.69, indicating that the nanotubes were organized. The RR values are congruent with the shape of the FFT images and the SEM pictures.

3.2. The Effect of the Anodization Time

SEM pictures of nanotube coatings produced with various anodization periods are shown in Figure 3; the other experimental parameters (pH = 3, 0.5 wt.% XG, and 0.5 wt.% NaF) remained the same. After 1.5 h of anodization, structured nanotubes were visible on the surface, showing separate walls, typical of this type of structure; nevertheless, some of the nanotubes had particles on the tip. As viscous electrolytes present an slower etching rate, such particles stay on the surface; the origin could be related to a compact, thin titanium dioxide coating that was produced early in the process of creating nanotubes and was only partially dissolved [21,42]. These particles could be linked to a short anodization time, which was not enough to dissolve them [42]. The TiO2 nanotubes generated by 3 h of anodizing process did not show particles on the nanotube tips; thus, this anodization time allowed time to dissolve them. Longer anodization times (7 h) also produced TiO2 nanotubes covered by particles; however, those could be generated by the nanotube corrosion in the electrolyte due to the prolonged anodization time [43]. Regarding the nanotube organization measured by RR, the best result was obtained in the nanotubes produced in 3 h. For the nanotubes formed in 1.5 h, the time was not enough to create very organized nanotubes; on the other hand, prolonged anodization times were not beneficial to the homogeneity and organization of the nanotubes. Concerning the internal diameter of TiO2 nanotubes, for the three anodizing times evaluated, the values were about 100 nm. However, a direct relationship between the anodization time and the length of TiO2 nanotubes was evident for the samples obtained at 1.5 and 3 h, and this behavior is congruent with previous reports [7,21]. On the other hand, there were no differences between the nanotube lengths of the samples obtained at 3 and 7 h. This result could be due to the effect of the corrosion process mentioned above [43,44].

3.3. The Effect of NaF Concentration

Fluoride sources typically range from 0.20 to 1 weight percentage in the electrolyte used to create TiO2 nanotubes by anodization [7]. According to the scientific literature [7,13], lower fluoride concentrations promote the barrier layer development rather than nanotube structures. Conversely, higher fluoride concentrations encourage a high dissolution rate of the oxide layer; thus, the nanotube structures cannot be formed. Although it is important to note that an excess of fluoride impacts the shape of the nanotubes and their ability to adhere to the substrate, a specific amount of fluoride is required to create nanotubes. Therefore, it is critical to determine the lowest concentration that permits the creation of nanotubes without compromising their characteristics.
Figure 4 reveals the impact of NaF concentration on the structure of nanotubes while the other experimental parameters (pH = 3, 0.5 wt.% XG, and 3 h) remained the same. From Figure 4, it can be seen that the anodic coating produced at 0.25 wt.% has a layer covering the nanotubes (see SEM image at 10,000×). This layer is related to the lower fluoride concentration, which is not sufficient to dissolve this unwanted top layer. When increasing the fluoride concentration to 0.5 wt.%, this layer disappears, and the nanotubes look clean; namely, there are no particles or partially dissolved oxide layers over the nanotubes. The nanotubes produced using a fluoride concentration of 0.75 wt.% had small particles on top; those particles could be caused by the higher dissolution rate of the electrolyte [2,45]. For a concentration of 1 wt.%, the anodic coating was not formed. For the three fluoride concentrations examined, the values for the interior diameter of TiO2 nanotubes were approximately 100 nm. The nanotube length decreases with the increase in fluoride concentration; however, the nanotubes produced at 0.75 wt.% were very short in contrast to the other fluoride concentrations. This behavior could be explained by the over-etch of the TiO2 nanotubes. Wang et al. [45] obtained nanotubes using electrolytes composed of ethylene glycol, water, and different concentrations of NH4F. They found that at higher concentrations of NH4F, the nanotubes were disorganized and shorter compared to the lower concentrations of NH4F. The findings of Wang et al. agree with our results. According to our data, the fluoride concentration that allows producing clean nanotubes was 0.5 wt.%.

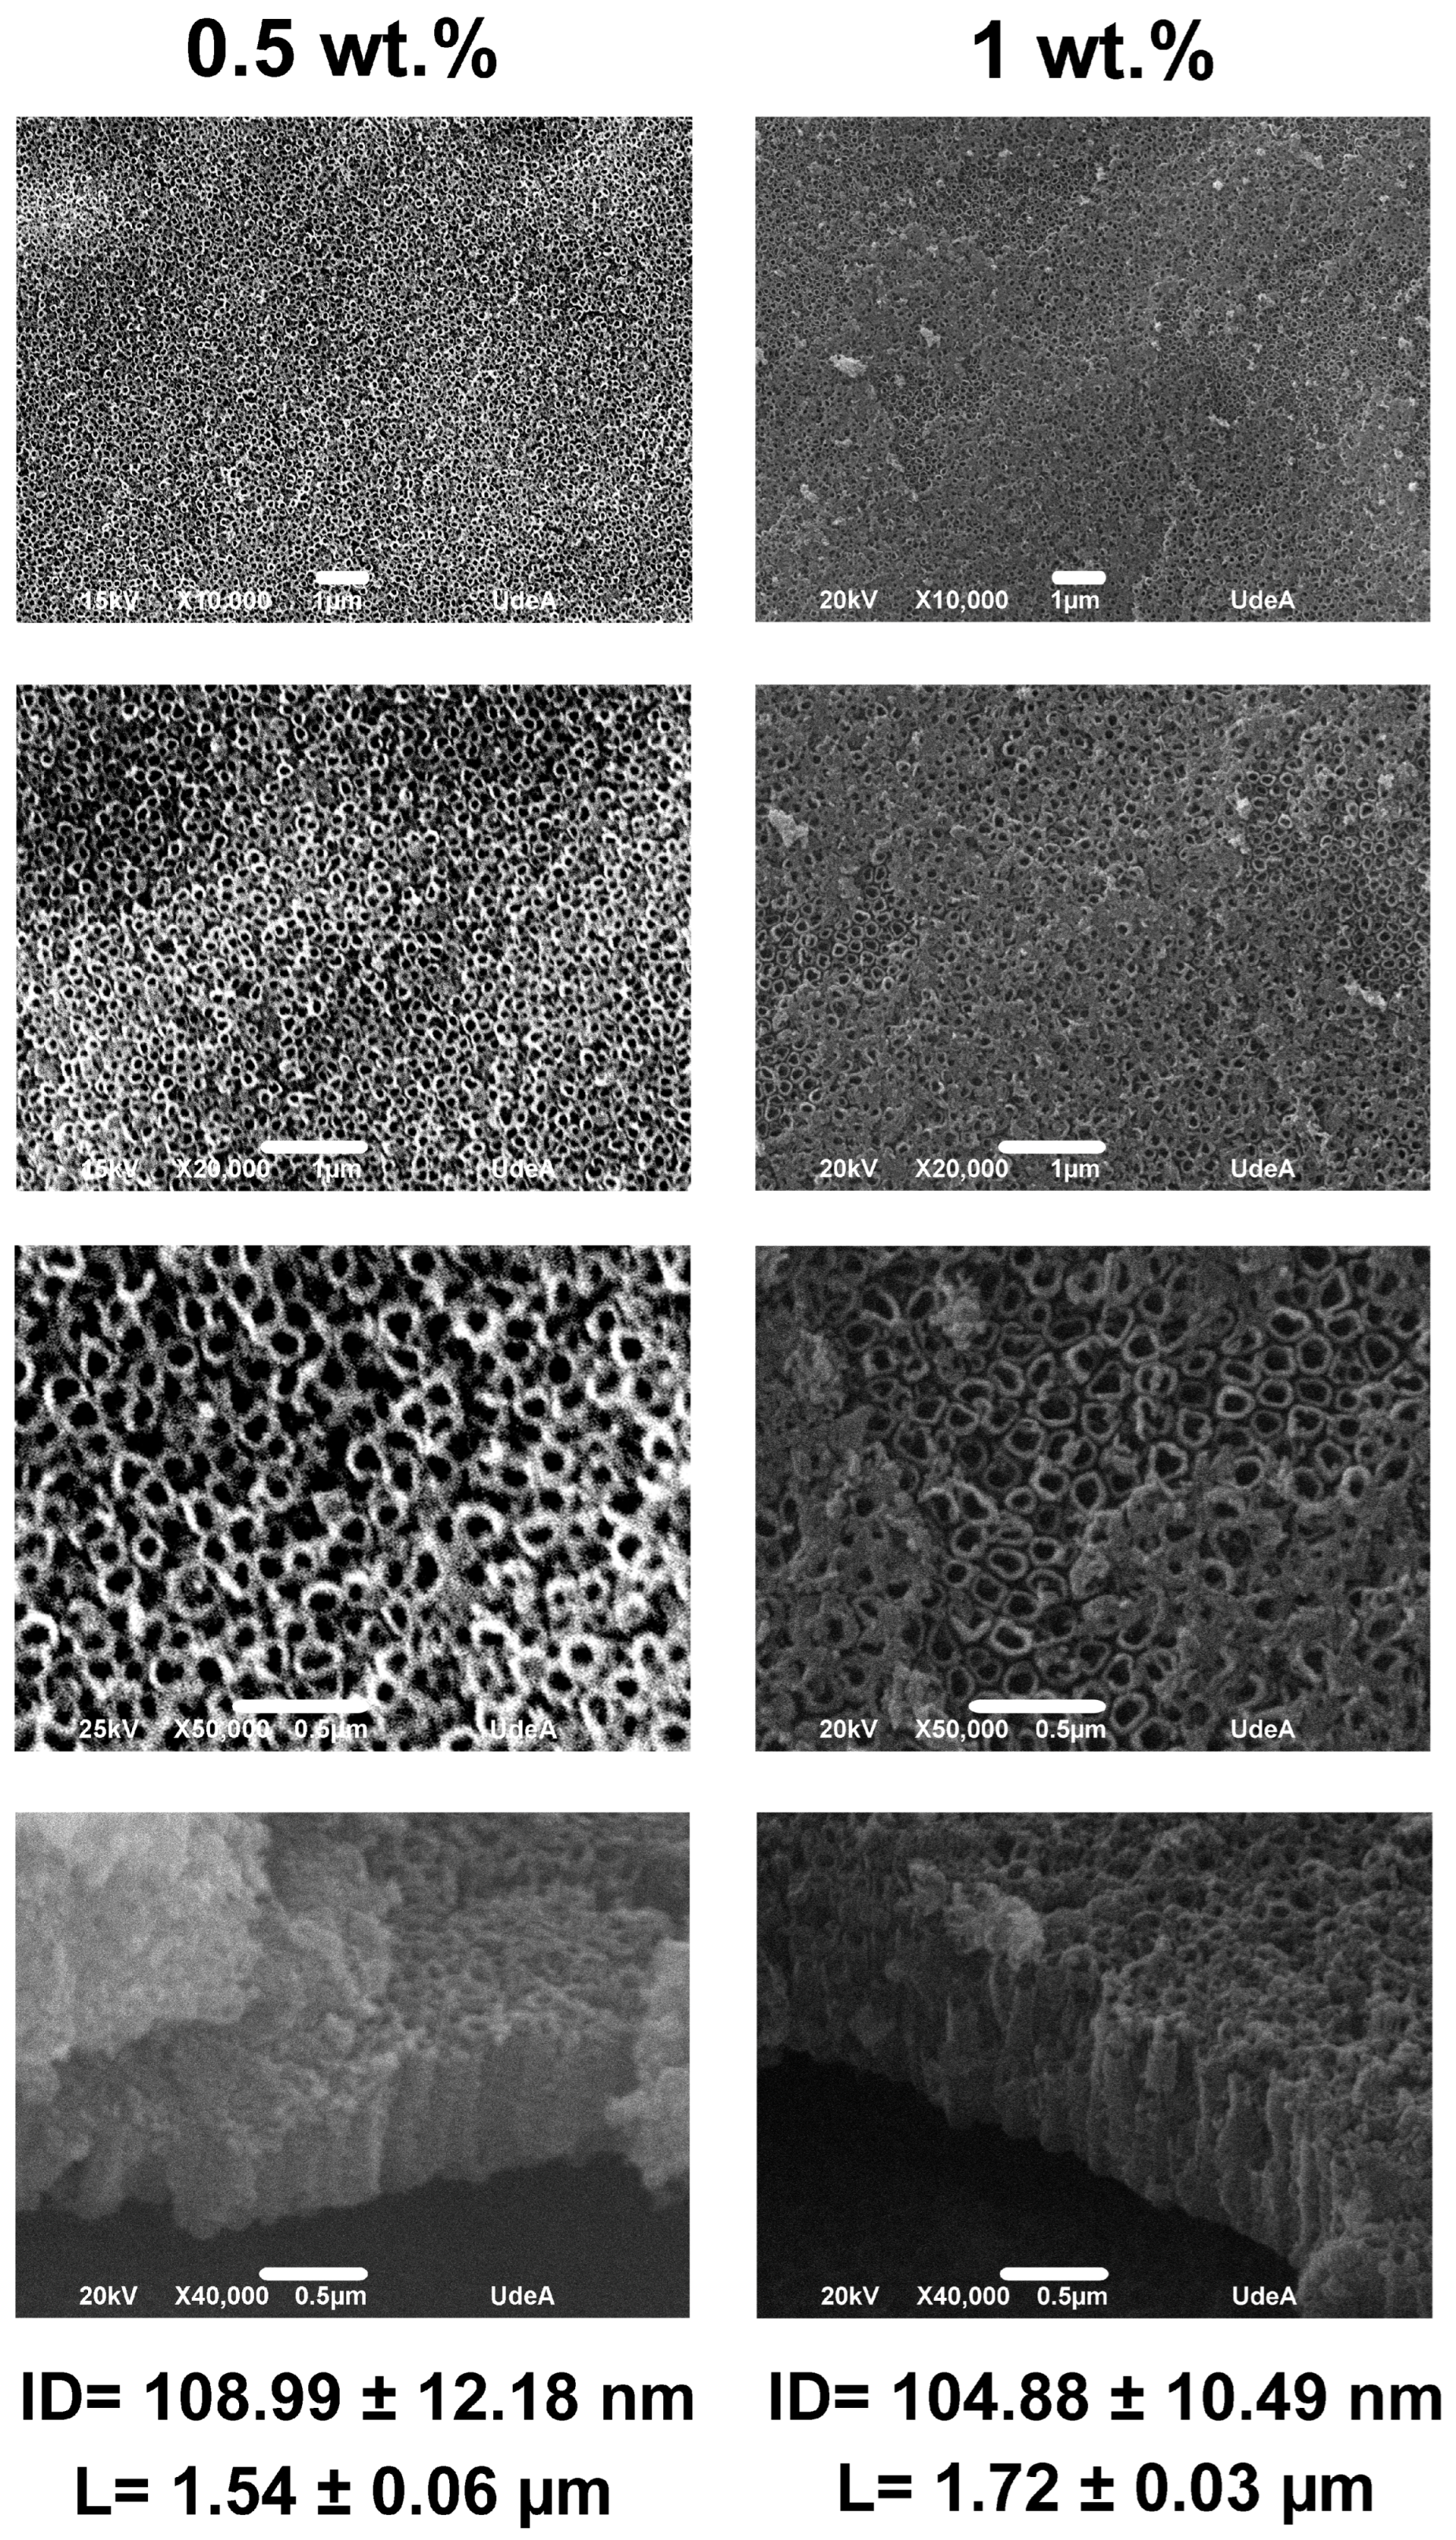
3.4. The Effect of XG Concentration

The SEM pictures of nanotube coatings produced using different XG concentrations while keeping the same values for the other experimental parameters (pH = 3, 0.5 wt% NaF, and 3 h) are shown in Figure 5. From Figure 5, it can be seen that the nanotubes made using 1 wt.% of XG (see 10,000× SEM picture) had a dense layer covering the nanotubes, contrarily to the nanotubes produced at 0.5 wt.% of XG which were clean. Moreover, the nanotubes produced utilizing 1 wt.% of XG had a lower circularity than those made at 0.5 wt.% (see 50,000× SEM picture). Regarding the nanotube length, there is a slight increase in length due to the increase in XG concentration. With the rise in XG concentration, the electrolyte viscosity rises [46]. The viscosity has a direct effect on the nanotube’s morphologic characteristics. A higher viscosity causes the diffusion rate to slow down, which makes the ions move more slowly, especially the fluoride ions, allowing for a higher thickness [4,47,48]. According to our results, the XG concentration that induces the production of more organized and clean nanotubes was 0.5 wt.%.

3.5. Electrolyte pH Effect

SEM micrographs demonstrating the impact of electrolyte pH on the structure of nanotubes, while keeping the other experimental settings constant (0.5 wt.% XG, 0.5 wt.% NaF, and 3 h), are shown in Figure 6. These results showed that at pH 4, only a small number of nanotubes are observable, and from the cross-section image it can be seen that the nanotubes are not well defined. One explanation is that a lower availability of H+ ions changes the rate at which oxide dissolves, which is necessary for producing nanotubes [4,5,49,50]. At pH values from 3.5 to 1.8, nanotube structures were formed; however, according to the RR values, the highest level of organization was obtained at pH 3. The nanotubes obtained at pH values of 3.5 and 3.0 were clean; on the other hand, in the nanotubes produced at pH values of 2.5 and 1.8, a slight number of particles on the top of nanotubes were visible. Regarding the values of the internal diameter, there are no significant differences related to the variation in the electrolyte pH. On the other hand, the nanotube length increased with the decrease in electrolyte pH value. This behavior is not in agreement with reports in the scientific literature [49,50,51,52], where the length of the nanotubes decreased with the reduction in electrolyte pH. This behavior could be related to the use of XG; some authors [46,53,54,55] reported on the stability of XG in acidic media; and in fact, XG at lower pH values form a double helix configuration mediated by hydrogen bonds that sustain self-aggregation of XG chains.

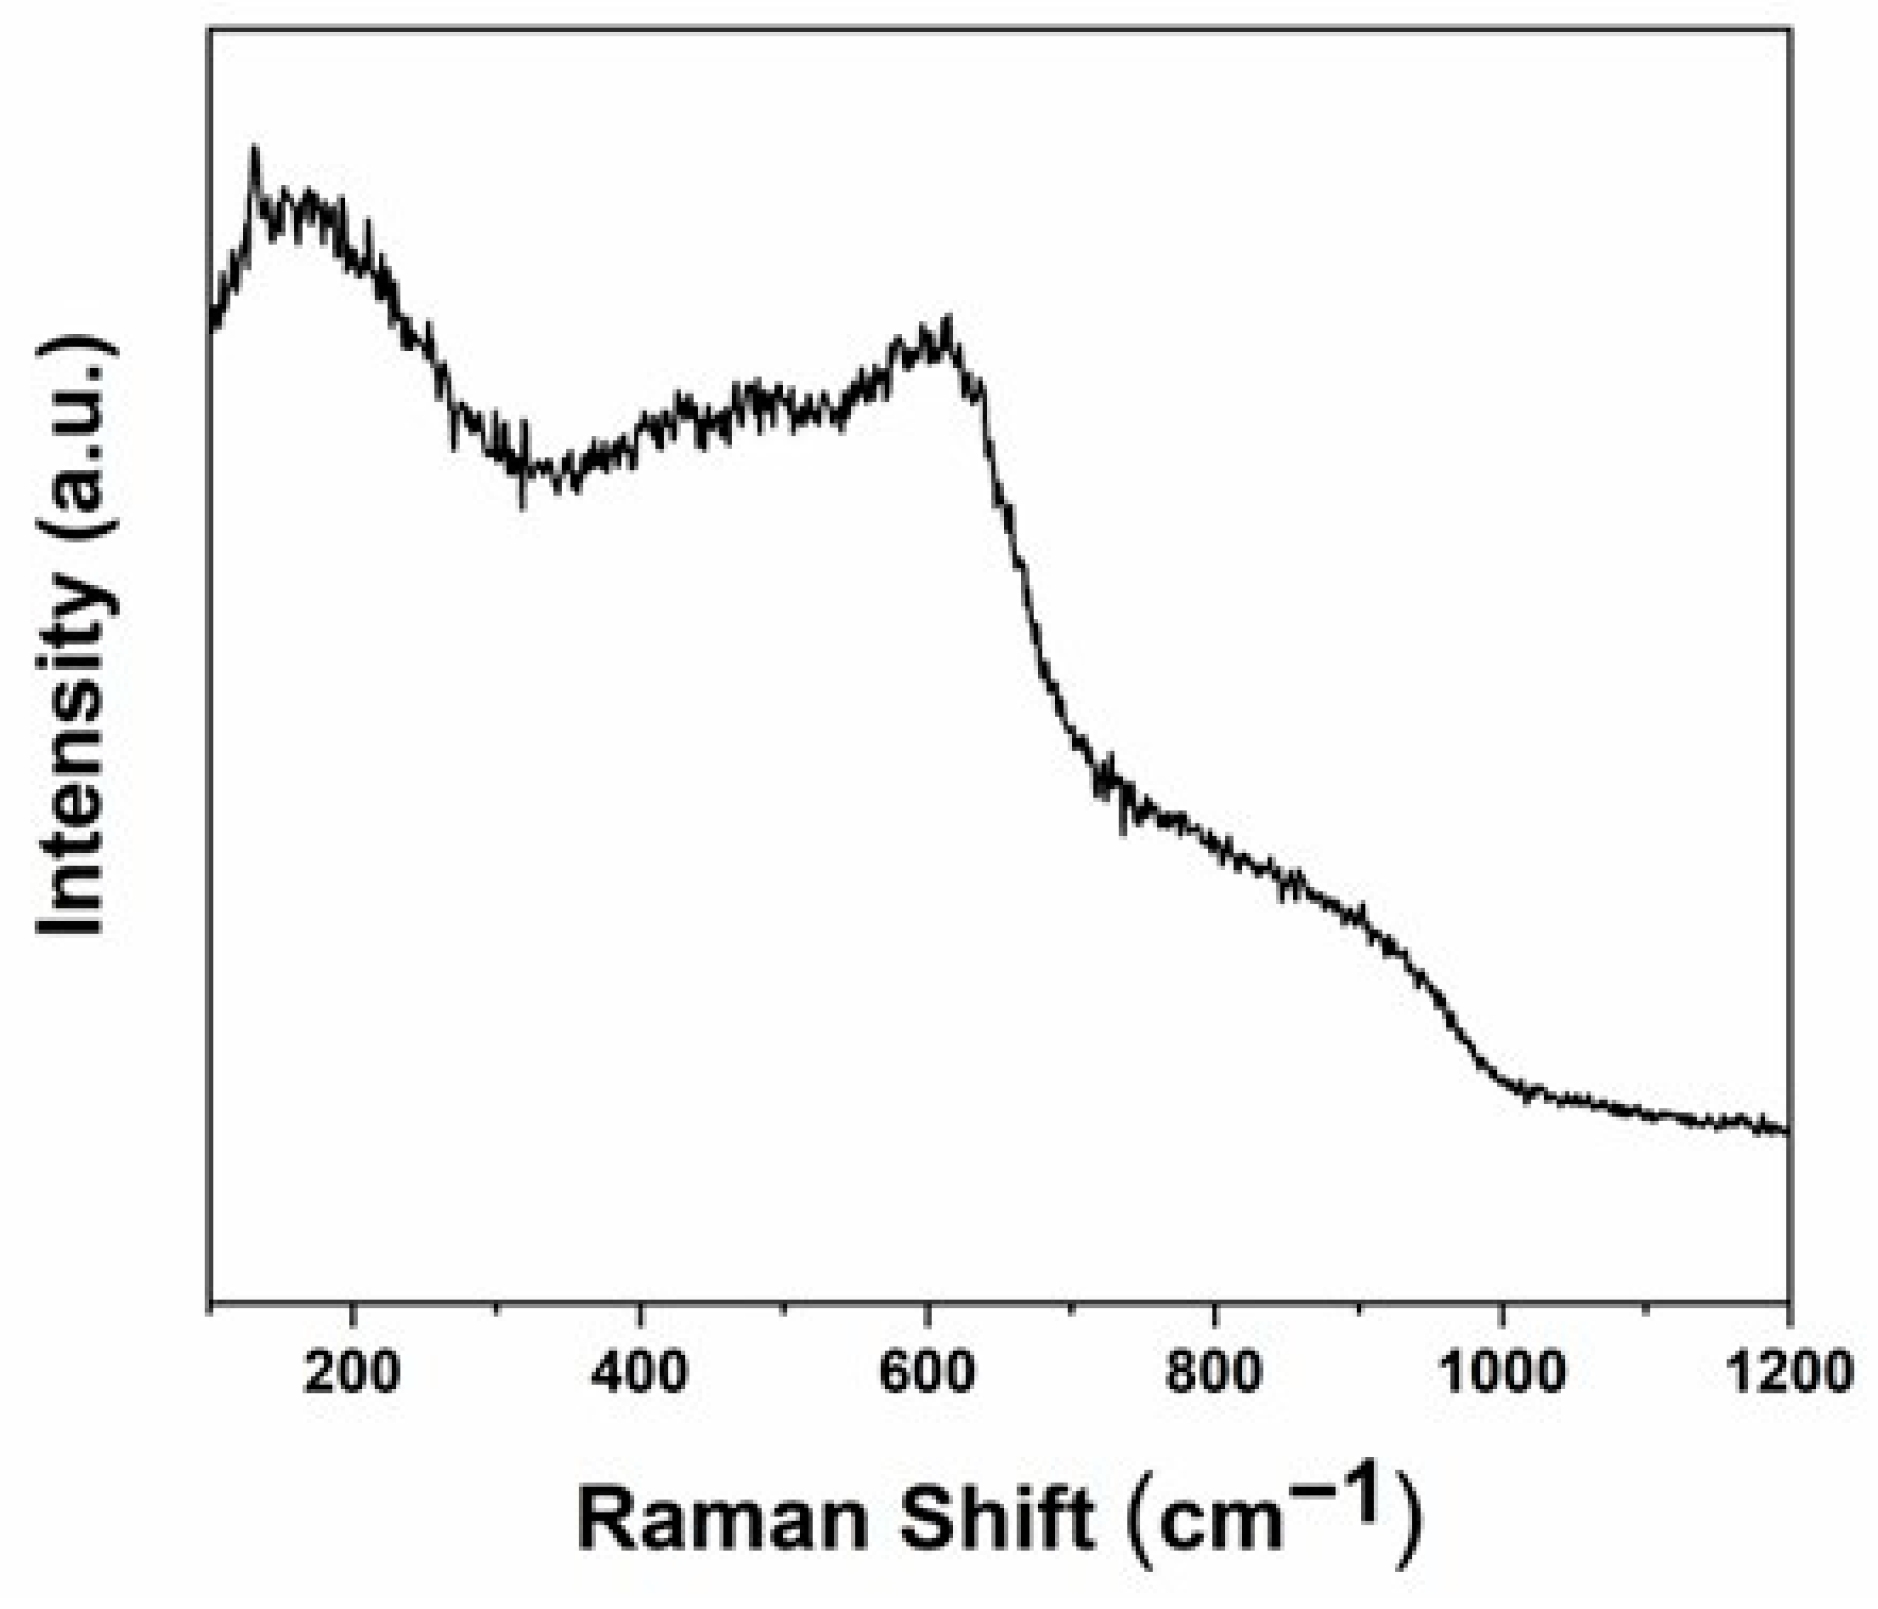
3.6. Raman Characterization

The Raman spectra for the TiO2 nanotubes produced using an electrolyte containing XG are shown in Figure 7; similar spectra may be seen in all samples. The Raman spectra show broad peaks at roughly 150, 450, and 600 cm−1; earlier investigations [22,32,33,56] have reported this spectrum’s form related to amorphous TiO2 nanotubes. From Figure 7, it can be concluded that employing XG does not result in the production of crystalline TiO2 nanotubes.

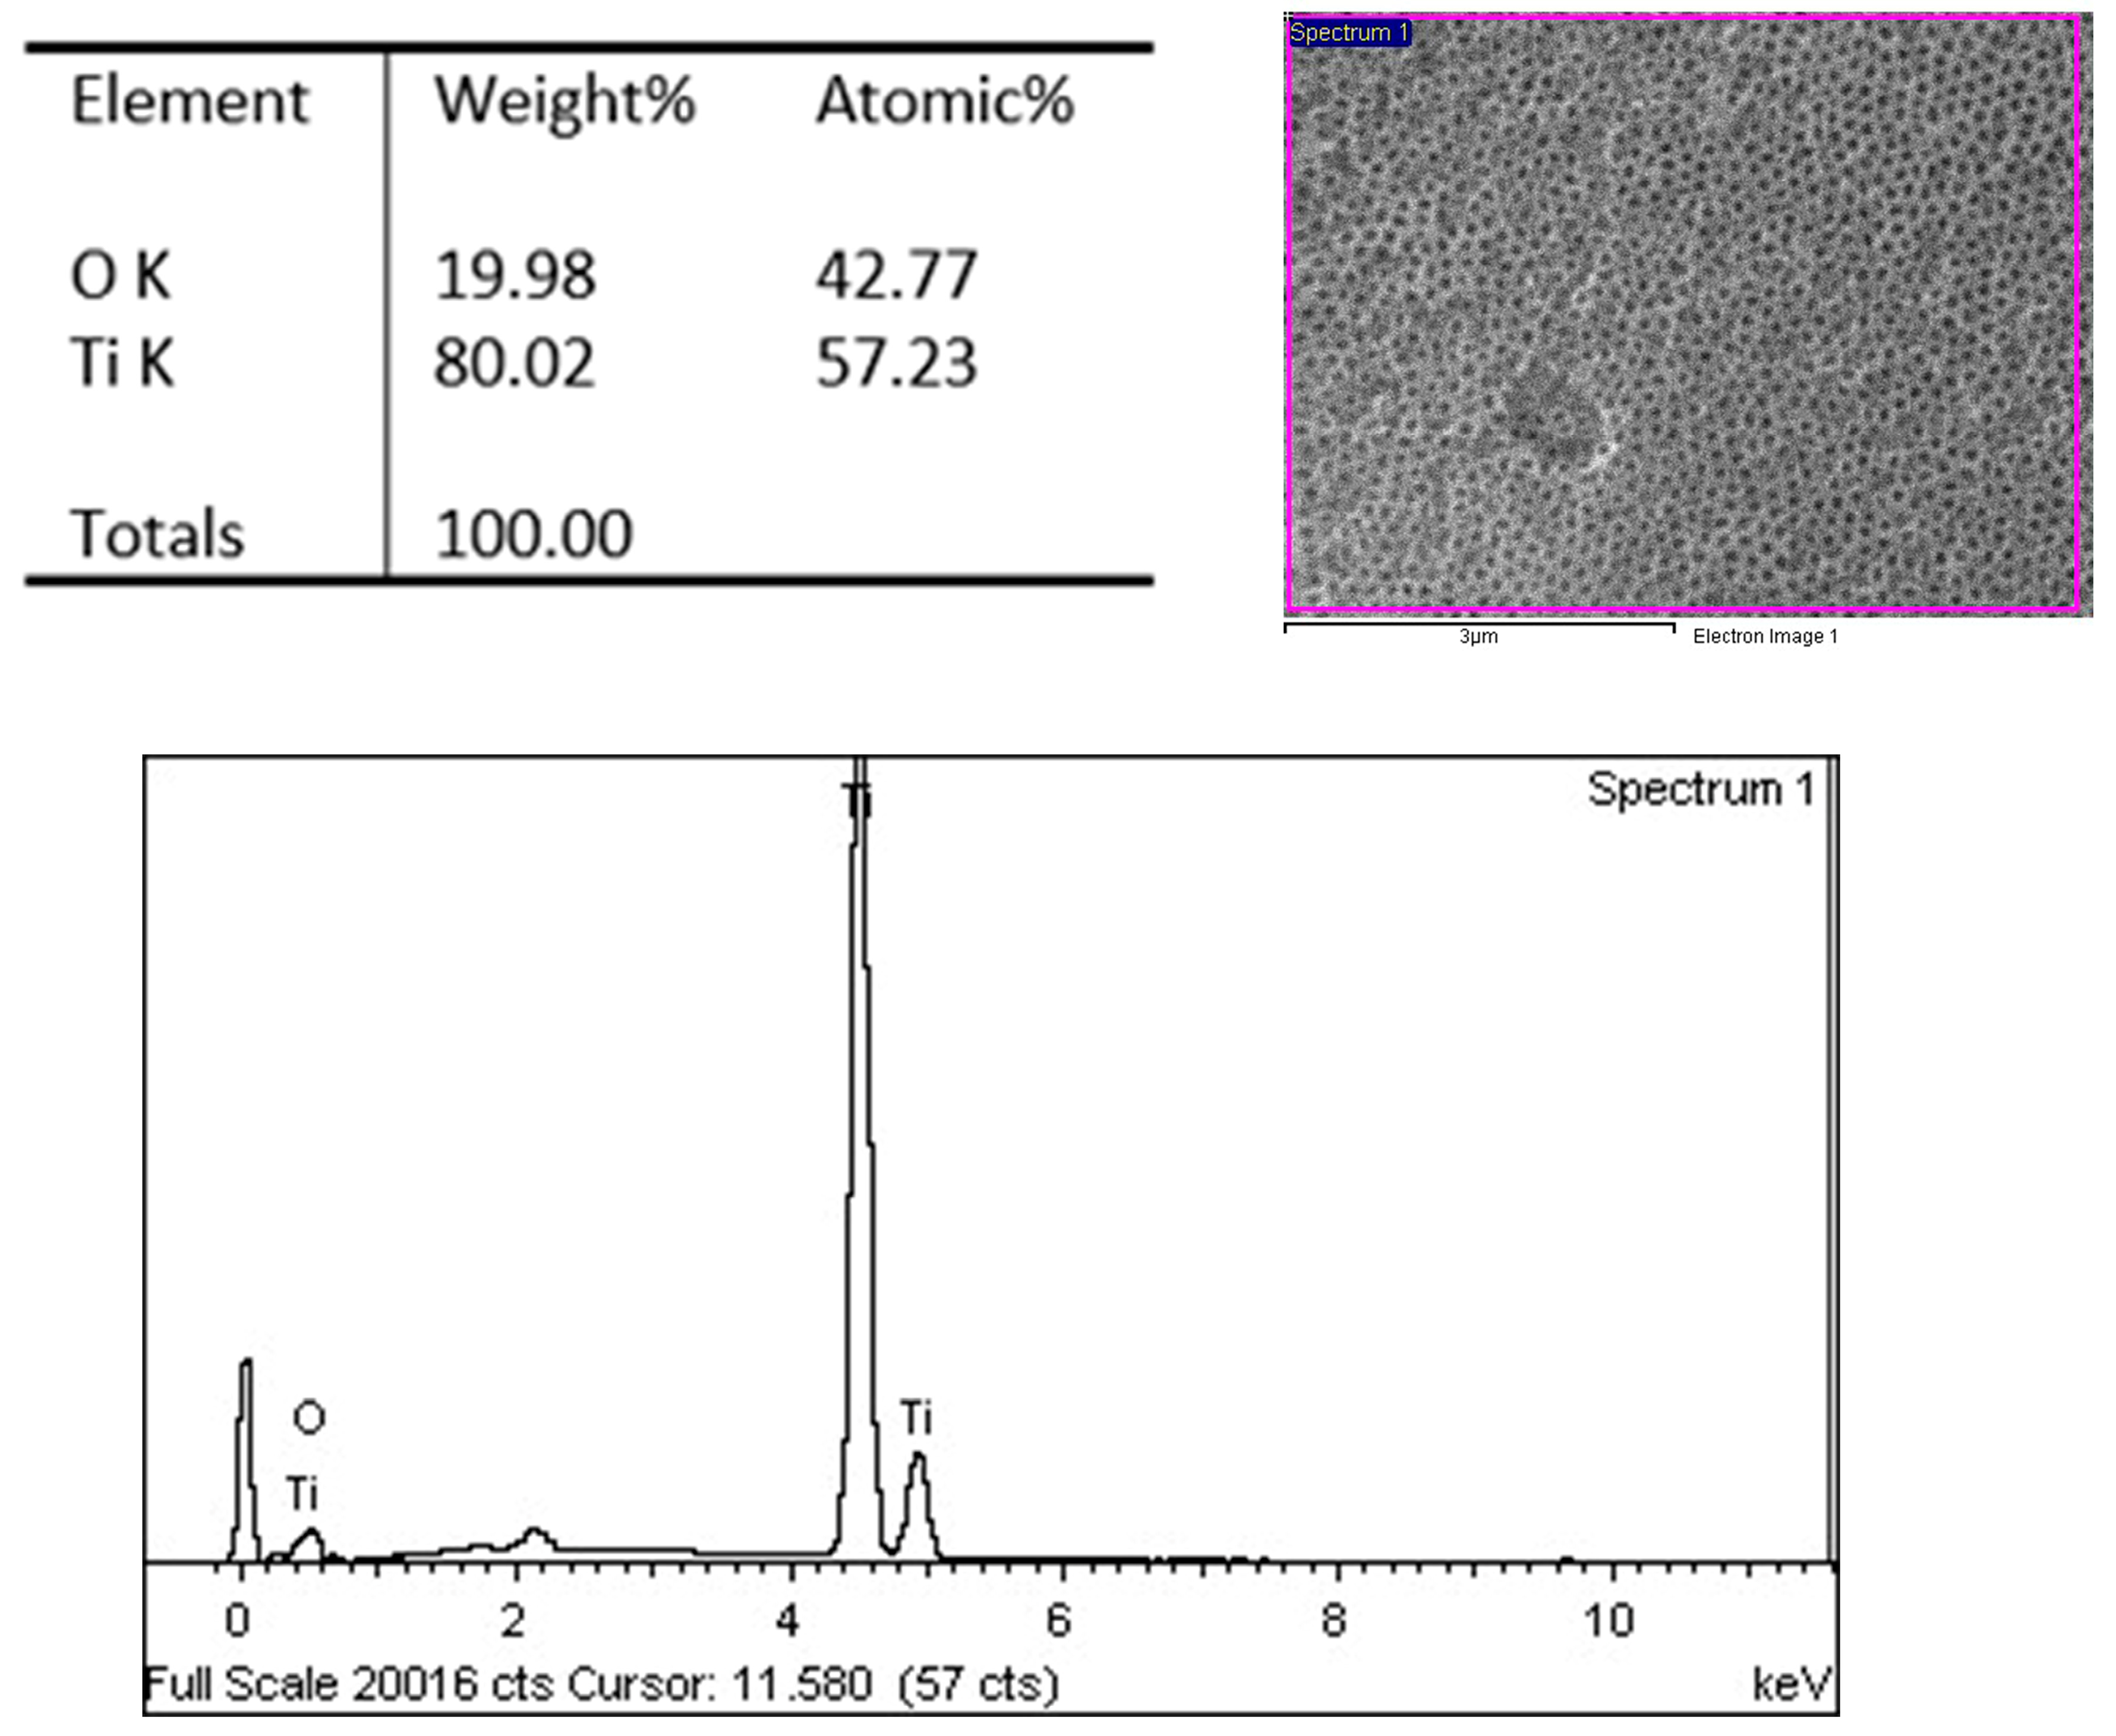
3.7. EDX Characterization

The chemical composition of the nanotubular layers was ascertained using energy-dispersive X-ray spectroscopy (EDX). Figure 8 shows the EDX spectra taken from the sample obtained using the electrolyte composed of 0.5 wt.% XG, 0.5 wt.% NaF, a pH of 3, and an anodizing time of 3 h. From Figure 8, it can be seen that the nanotubular layer was composed of titanium and oxygen; fluoride and carbon were undetected. From Figure 8, it can be concluded that employing XG does not result in composition changes in TiO2 nanotubes. In previous studies [57,58], the authors reported the presence of carbon residues in the nanotube layers produced with electrolytes such as ethylene glycol and glycerol.

4. Conclusions

On the quest for producing ordered TiO2 nanotubes, we have looked into the role of XG as an addition in aqueous electrolytes. According to the present findings, the following could be concluded:
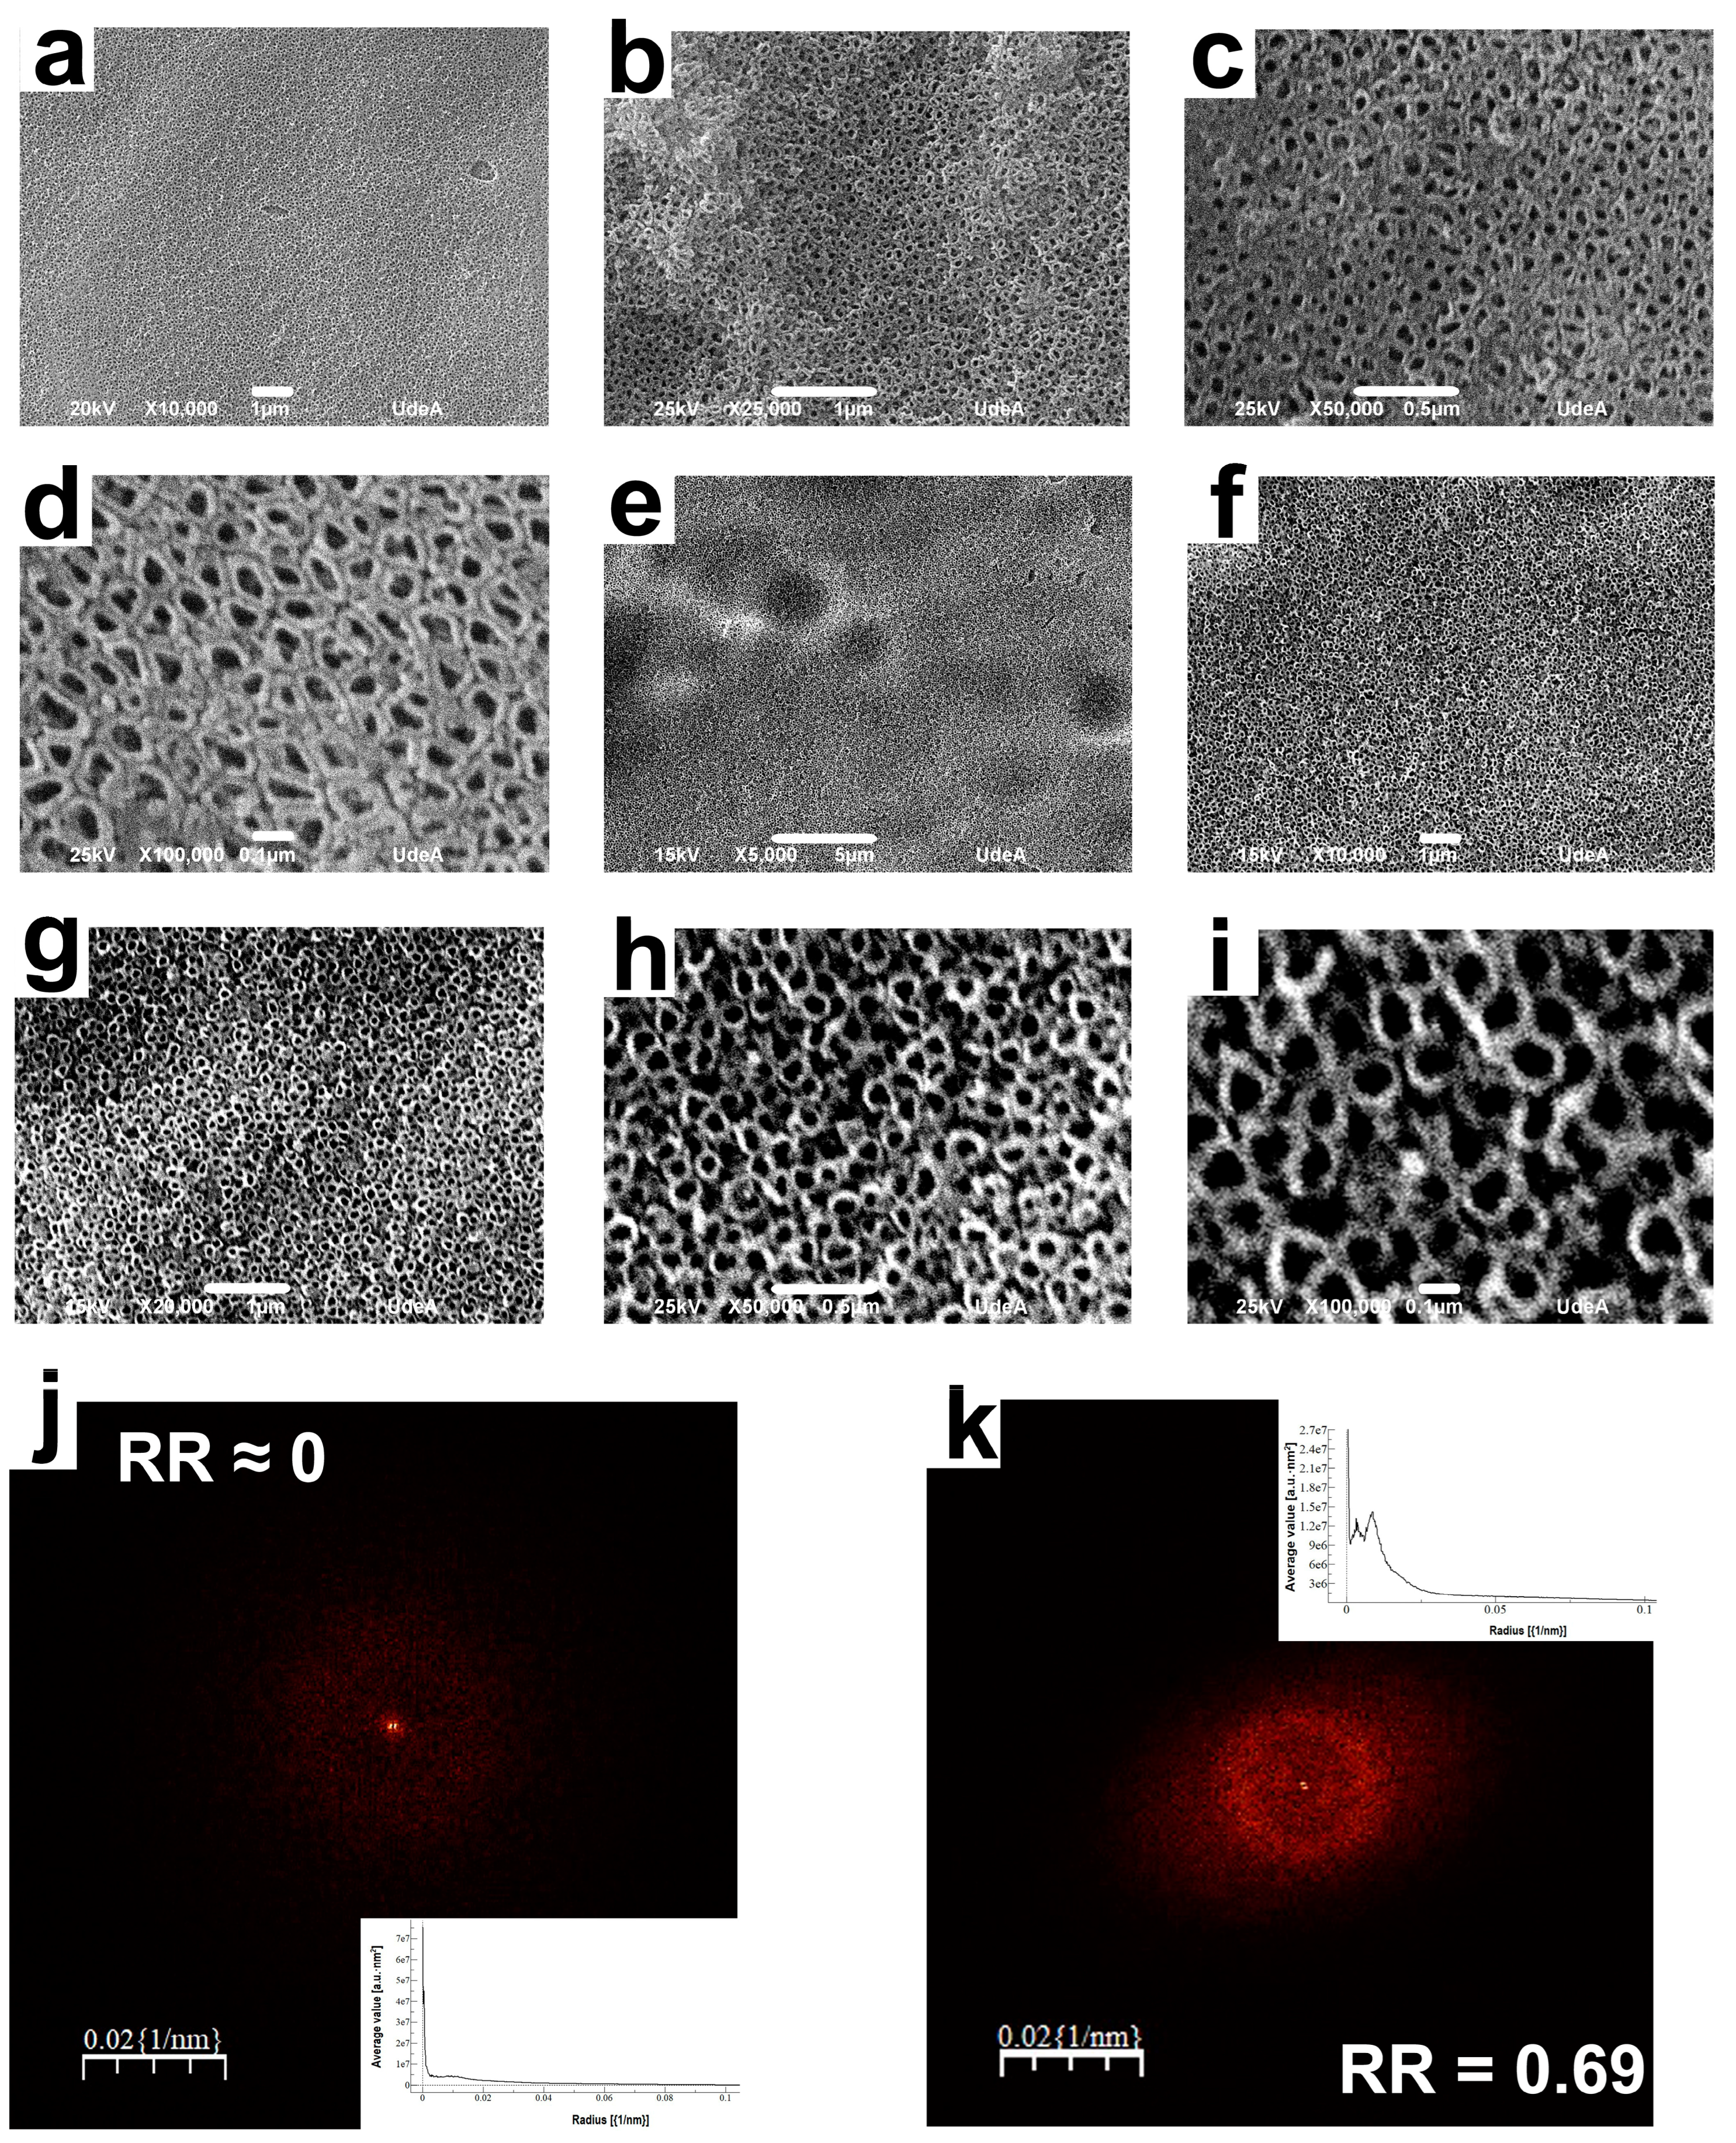
  • Compared with the nanotubes formed in an aqueous electrolyte without XG, using XG in the aqueous electrolyte increased the nanotube organization; the value of the RR parameter of nanotubes obtained with and without adding XG to the anodizing electrolyte was 0.69 and 0.0, respectively. In addition, the inclusion of XG did not affect the packability of the coating.
  • Anodization parameters like fluoride concentration, anodizing time, pH, and XG concentration did not affect the internal diameter values, but produced changes in the length of the nanotubes; the values obtained for the internal diameter in the various conditions evaluated were around 100 nm, whereas the nanotube lengths varied from about 0.80 to 2.28 µm.
  • Based on the outcomes of this experimental study, organized nanotubular structures could be obtained using an aqueous electrolyte which is low-cost, environmentally friendly, and non-toxic. According to the present results, the more suitable conditions are 0.5 wt.% XG, 0.5 wt.% NaF, a pH of 3, and an anodizing time of 3 h.

Author Contributions

Conceptualization, R.A.O.; Funding acquisition, F.E.E.; Investigation, R.A.O.; Project administration, F.E.E.; Writing—original draft, R.A.O.; Writing—review and editing, F.E.E. All authors have read and agreed to the published version of the manuscript.

Funding

The authors are pleased to acknowledge the financial assistance of the “Departamento Administrativo de Ciencia, Tecnología e Innovación–COLCIENCIAS (currently Minciencias)” through the “Fondo Francisco José de Caldas” with the contract 124-2017 and “Estrategia de Sostenibilidad de la Universidad de Antioquia”. R.A.O. was supported by a COLCIENCIAS (currently Minciencias) Ph.D. grant.

Data Availability Statement

Not applicable.

Conflicts of Interest

The authors declare no conflict of interest.

References

  1. Echeverry-Rendón, M.; Galvis, O.; Aguirre, R.; Robledo, S.; Castaño, J.G.; Echeverría, F. Modification of Titanium Alloys Surface Properties by Plasma Electrolytic Oxidation (PEO) and Influence on Biological Response. J. Mater. Sci. Mater. Med. 2017, 28, 169. [Google Scholar] [CrossRef]
  2. Kim, W.T.; Choi, W.Y. Anodic Growth Behavior of TiO2 Nanotube Arrays with Process Parameter Control. J. Nanomater. 2019, 2019, 8293427. [Google Scholar] [CrossRef]
  3. Aguirre, R.; Nicolás, O.; Ochoa, B.; Tamayo, J.A.; Botero, C. Formation of Highly Ordered TiO2 Nanotubes on Ti6Al4V Alloys Manufactured by Electron Beam Powder Bed Fusion (E-PBF). Int. J. Adv. Manuf. Technol. 2023, 128, 257–266. [Google Scholar] [CrossRef]
  4. Aguirre Ocampo, R.; Echeverría Echeverría, F. Effect of the Anodization Parameters on TiO2 Nanotubes Characteristics Produced in Aqueous Electrolytes with CMC. Appl. Surf. Sci. 2019, 469, 994–1006. [Google Scholar] [CrossRef]
  5. Ocampo, R.A.; Echeverría, F.E. Antibacterial and Biological Behavior of TiO2 Nanotubes Produced by Anodizing Technique. Crit. Rev. Biomed. Eng. 2021, 49, 51–65. [Google Scholar] [CrossRef]
  6. Aguirre Ocampo, R.; Echeverry-Rendón, M.; Robledo, S.; Echeverría Echeverría, F. Effect of TiO2 Nanotubes Size, Heat Treatment, and UV Irradiation on Osteoblast Behavior. Mater. Chem. Phys. 2022, 275, 125137. [Google Scholar] [CrossRef]
  7. Puga, M.L.; Venturini, J.; ten Caten, C.S.; Bergmann, C.P. Influencing Parameters in the Electrochemical Anodization of TiO2 Nanotubes: Systematic Review and Meta-Analysis. Ceram. Int. 2022, 48, 19513–19526. [Google Scholar] [CrossRef]
  8. Cao, W.; Chen, K.; Xue, D. Highly Ordered TiO2 Nanotube Arrays with Engineered Electrochemical Energy Storage Performances. Materials 2021, 14, 510. [Google Scholar] [CrossRef]
  9. Zhang, W.; Liu, Y.; Guo, F.; Liu, J.; Yang, F. Kinetic Analysis of the Anodic Growth of TiO2 Nanotubes: Effects of Voltage and Temperature. J. Mater. Chem. C 2019, 7, 14098–14108. [Google Scholar] [CrossRef]
  10. Aguirre Ocampo, R.; Echeverría Echeverría, F. TiO2 Nanotubes Produced on Curved Titanium Surfaces Using Aqueous Electrolytes with Carboxymethyl Cellulose. Phys. E Low-Dimens. Syst. Nanostruct. 2021, 125, 114391. [Google Scholar] [CrossRef]
  11. Ocampo, R.A.; Echeverry-Rendón, M.; DeAlba-Montero, I.; Robledo, S.; Ruiz, F.; Echeverría Echeverría, F. Effect of Surface Characteristics on the Antibacterial Properties of TiO2 Nanotubes Produced in Aqueous Electrolytes with Carboxymethyl Cellulose. J. Biomed. Mater. Res. Part A 2021, 109, 104–121. [Google Scholar] [CrossRef]
  12. Asgari, V.; Noormohammadi, M.; Ramazani, A.; Kashi, M.A. A Facile Method to Form Highly-Ordered TiO2 nanotubes at a Stable Growth Rate of 1000 Nm Min-1under 60 v Using an Organic Electrolyte for Improved Photovoltaic Properties. J. Phys. D Appl. Phys. 2017, 50, 375501. [Google Scholar] [CrossRef]
  13. Nie, X.; Yin, S.; Duan, W.; Zhao, Z.; Li, L.; Zhang, Z. Recent Progress in Anodic Oxidation of TiO2 Nanotubes and Enhanced Photocatalytic Performance: A Short Review. Nano 2021, 16, 2130002. [Google Scholar] [CrossRef]
  14. Ghani, T.; Mujahid, M.; Mehmood, M.; Zhang, G. Fabrication of Self-Branched TiO2 Nanotubes by Anodization Method, Ordering and Crystallinity. J. Porous Mater. 2019, 26, 193–203. [Google Scholar] [CrossRef]
  15. Fraoucene, H.; Hatem, D.; Vacandio, F.; Pasquinelli, M. TiO2 Nanotubes with Nanograss Structure: The Effect of the Anodizing Voltage on the Formation Mechanism and Structure Properties. J. Electron. Mater. 2019, 48, 2046–2054. [Google Scholar] [CrossRef]
  16. Hu, N.; Wu, Y.; Xie, L.; Mohd, S.; Gao, N.; Starink, M.J.; Tong, L.; Chu, P.K.; Wang, H. Enhanced Interfacial Adhesion and Osseointegration of Anodic TiO2 Nanotube Arrays on Ultra-Fine-Grained Titanium and Underlying Mechanisms. Acta Biomater. 2020, 106, 360–375. [Google Scholar] [CrossRef] [PubMed]
  17. Dev, P.R.; David, T.M.; Samuel Justin, S.J.; Wilson, P.; Palaniappan, A. A Plausible Impact on the Role of Pulses in Anodized TiO2 Nanotube Arrays Enhancing Ti3+ Defects. J. Nanoparticle Res. 2020, 22, 56. [Google Scholar] [CrossRef]
  18. Dong, Y.; Wu, N.; Ji, X.; Laaksonen, A.; Lu, X.; Zhang, S. Excellent Trace Detection of Proteins on TiO2 Nanotube Substrates through Novel Topography Optimization. J. Phys. Chem. C 2020, 124, 27790–27800. [Google Scholar] [CrossRef]
  19. Alijani, M.; Sopha, H.; Ng, S.; Macak, J.M. High Aspect Ratio TiO2 Nanotube Layers Obtained in a Very Short Anodization Time. Electrochim. Acta 2021, 376, 138080. [Google Scholar] [CrossRef]
  20. Luan, N.H.; Chang, C. Investigation of the Aging Effect of Electrolyte on the Morphology and Photocatalytic Properties of TiO2 NTs Synthesized Using the Anodization Route. J. Mater. Sci. 2021, 56, 19106–19118. [Google Scholar] [CrossRef]
  21. Ribeiro, B.; Offoiach, R.; Rossetti, S.; Salatin, E.; Lekka, M.; Fedrizzi, L. On Growth and Morphology of TiO2 Nanotubes on CP-Ti by Anodic Oxidation in Ethylene Glycol Electrolyte: Influence of Electrolyte Aging and Anodization Parameters. Materials 2022, 15, 3338. [Google Scholar] [CrossRef]
  22. Ocampo, R.A.; Echeverría, F.E. TiO2 Nanotubes Produced on Thin Titanium Wires Using Aqueous Electrolytes. Mater. Manuf. Process. 2022, 1–7. [Google Scholar] [CrossRef]
  23. Mohiuddin, I.; Mohmad, S.; Ahmad, S.; Masoodi, F.A. Advances in Xanthan Gum Production, Modifications and Its Applications. Biocatal. Agric. Biotechnol. 2022, 42, 102328. [Google Scholar] [CrossRef]
  24. Dzionek, A.; Wojcieszyńska, D.; Guzik, U. Use of Xanthan Gum for Whole Cell Immobilization and Its Impact in Bioremediation—A Review. Bioresour. Technol. 2022, 351, 126918. [Google Scholar] [CrossRef] [PubMed]
  25. Horcas, I.; Fernández, R.; Gómez-Rodríguez, J.M.; Colchero, J.; Gómez-Herrero, J.; Baro, A.M. WSXM: A Software for Scanning Probe Microscopy and a Tool for Nanotechnology. Rev. Sci. Instrum. 2007, 78, 013705. [Google Scholar] [CrossRef] [PubMed]
  26. Apolinário, A.; Sousa, C.T.; Ventura, J.; Costa, J.D.; Leitão, D.C.; Moreira, J.M.; Sousa, J.B.; Andrade, L.; Mendes, A.M.; Araújo, J.P. The Role of the Ti Surface Roughness in the Self-Ordering of TiO2 Nanotubes: A Detailed Study of the Growth Mechanism. J. Mater. Chem. A 2014, 2, 9067. [Google Scholar] [CrossRef]
  27. Gong, T.; Li, C.; Li, X.; Yue, H.; Zhu, X.; Zhao, Z.; Lv, R.; Zhu, J. Evidence of Oxygen Bubbles Forming Nanotube Embryos in Porous Anodic Oxides. Nanoscale Adv. 2021, 3, 4659–4668. [Google Scholar] [CrossRef]
  28. Ni, Y.; Zhang, J.; Gong, T.; Sun, M.; Zhao, Z.; Li, X.; Yu, H.; Zhu, X. Quantitative Analysis of the Volume Expansion of Nanotubes during Constant Voltage Anodization. Surf. Interfaces 2021, 26, 101419. [Google Scholar] [CrossRef]
  29. Xing-Ping, F. Controllable Preparation of TiO2 Nanotubes and Their Photocatalytic Performance. Mater. Res. Express 2022, 9, 065005. [Google Scholar] [CrossRef]
  30. Regonini, D.; Clemens, F.J. Anodized TiO2 Nanotubes: Effect of Anodizing Time on Film Length, Morphology and Photoelectrochemical Properties. Mater. Lett. 2015, 142, 97–101. [Google Scholar] [CrossRef]
  31. Ye, Y.; Liu, Y.; Guo, T. Effect of H2O Content in Electrolyte on Synthesis and Field Emission Property of Anodized TiO2 Nanotubes. Surf. Coat. Technol. 2014, 245, 28–33. [Google Scholar] [CrossRef]
  32. Aguirre, O.R.; Echeverría, E.F. Effects of Fluoride Source on the Characteristics of Titanium Dioxide Nanotubes. Appl. Surf. Sci. 2018, 445, 308–319. [Google Scholar] [CrossRef]
  33. Aguirre, R.; Echeverry-Rendón, M.; Quintero, D.; Castaño, J.G.; Harmsen, M.C.; Robledo, S.; Echeverría, E.F. Formation of Nanotubular TiO2 Structures with Varied Surface Characteristics for Biomaterial Applications. J. Biomed. Mater. Res. Part A 2018, 106, 1341–1354. [Google Scholar] [CrossRef] [PubMed]
  34. Kobayashi, M.; Abdulmajeed, A.A.; Moon, J.; Shahramian, K.; Punkkinen, R.; Shimada, J.; Vallittu, P.K.; Lassila, L.V. The Effect of Ultraviolet Treatment on TiO2 Nanotubes: A Study of Surface Characteristics, Bacterial Adhesion, and Gingival Fibroblast Response. Metals 2022, 12, 80. [Google Scholar] [CrossRef]
  35. Kim, M.; Shin, N.; Lee, J.; Lee, K.; Kim, Y.T.; Choi, J. Photoelectrochemical Water Oxidation in Anodic TiO2 Nanotubes Array: Importance of Mass Transfer. Electrochem. Commun. 2021, 132, 107133. [Google Scholar] [CrossRef]
  36. Stȩpniowski, W.J.; Michalska-Domańska, M.; Norek, M.; Czujko, T. Fast Fourier Transform Based Arrangement Analysis of Poorly Organized Alumina Nanopores Formed via Self-Organized Anodization in Chromic Acid. Mater. Lett. 2014, 117, 69–73. [Google Scholar] [CrossRef]
  37. Farsinezhad, S.; Dalrymple, A.N.; Shankar, K. Toward Single-Step Anodic Fabrication of Monodisperse TiO2 Nanotube Arrays on Non-Native Substrates. Phys. Status Solidi Appl. Mater. Sci. 2014, 211, 1113–1121. [Google Scholar] [CrossRef]
  38. Zaraska, L.; St??pniowski, W.J.; Ciepiela, E.; Sulka, G.D. The Effect of Anodizing Temperature on Structural Features and Hexagonal Arrangement of Nanopores in Alumina Synthesized by Two-Step Anodizing in Oxalic Acid. Thin Solid Film. 2013, 534, 155–161. [Google Scholar] [CrossRef]
  39. Michalska-Domańska, M.; Stępniowski, W.J.; Jaroszewicz, L.R. Characterization of Nanopores Arrangement of Anodic Alumina Layers Synthesized on Low-(AA1050) and High-Purity Aluminum by Two-Step Anodizing in Sulfuric Acid with Addition of Ethylene Glycol at Low Temperature. J. Porous Mater. 2016, 24, 779–786. [Google Scholar] [CrossRef]
  40. Jarosz, M.; Kapusta-Kołodziej, J.; Jaskuła, M.; Sulka, G.D. Effect of Different Polishing Methods on Anodic Titanium Dioxide Formation. J. Nanomater. 2015, 2015, 295126. [Google Scholar] [CrossRef]
  41. Kim, J.; Kim, B.; Oh, C.; Ryu, J.; Kim, H.; Park, E.; No, K.; Hong, S. Effects of NH4F and Distilled Water on Structure of Pores in TiO2 Nanotube Arrays. Sci. Rep. 2018, 8, 12487. [Google Scholar] [CrossRef]
  42. Tang, Y.; Tao, J.; Dong, Z.; Oh, J.T.; Chen, Z. The Formation of Micrometer-Long TiO2 Nanotube Arrays by Anodization of Titanium Film on Conducting Glass Substrate. Adv. Nat. Sci. Nanosci. Nanotechnol. 2011, 2, 045002. [Google Scholar] [CrossRef]
  43. Khudhair, D.; Bhatti, A.; Li, Y.; Hamedani, H.A.; Garmestani, H.; Hodgson, P.; Nahavandi, S. Anodization Parameters Influencing the Morphology and Electrical Properties of TiO2 Nanotubes for Living Cell Interfacing and Investigations. Mater. Sci. Eng. C 2016, 59, 1125–1142. [Google Scholar] [CrossRef] [PubMed]
  44. Li, T.; Gulati, K.; Wang, N.; Zhang, Z.; Ivanovski, S. Understanding and Augmenting the Stability of Therapeutic Nanotubes on Anodized Titanium Implants. Mater. Sci. Eng. C 2018, 88, 182–195. [Google Scholar] [CrossRef] [PubMed]
  45. Wang, X.; Li, Y.; Song, H.; Huang, Y.; Su, R.; Besenbacher, F. Fluoride Concentration Controlled TiO2 Nanotubes: The Interplay of Microstructure and Photocatalytic Performance. RSC Adv. 2016, 6, 18333–18339. [Google Scholar] [CrossRef]
  46. Raji, H.A.; Moayed, R.Z.; Nozari, M.A. The Viscosity of Xanthan Gum Grout with Different PH and Ionic Strength. Int. J. Geotech. Geol. Eng. 2021, 15, 38–43. [Google Scholar]
  47. Sturgeon, M.R.; Lai, P.; Hu, M.Z. A Comparative Study of Anodized Titania Nanotube Architectures in Aqueous and Nonaqueous Solutions. J. Mater. Res. 2011, 26, 2612–2623. [Google Scholar] [CrossRef]
  48. Regonini, D.; Satka, a.; Jaroenworaluck, a.; Allsopp, D.W.E.; Bowen, C.R.; Stevens, R. Factors Influencing Surface Morphology of Anodized TiO2 Nanotubes. Electrochim. Acta 2012, 74, 244–253. [Google Scholar] [CrossRef]
  49. Sreekantan, S.; Lockman, Z.; Hazan, R.; Tasbihi, M.; Tong, L.K.; Mohamed, A.R. Influence of Electrolyte PH on TiO2 Nanotube Formation by Ti Anodization. J. Alloys Compd. 2009, 485, 478–483. [Google Scholar] [CrossRef]
  50. Lai, C.W.; Sreekantan, S. Photoelectrochemical Properties of TiO2 Nanotube Arrays: Effect of Electrolyte PH and Annealing Temperature. J. Exp. Nanosci. 2012, 9, 230–239. [Google Scholar] [CrossRef]
  51. Indira, K.; Mudali, U.K.; Nishimura, T.; Rajendran, N. A Review on TiO2 Nanotubes: Influence of Anodization Parameters, Formation Mechanism, Properties, Corrosion Behavior, and Biomedical Applications. J. Bio- Tribo-Corros. 2015, 1, 28. [Google Scholar] [CrossRef]
  52. Paulose, M.; Varghese, O.K.; Mor, G.K.; Grimes, C.A.; Ong, K.G. Unprecedented Ultra-High Hydrogen Gas Sensitivity in Undoped Titania Nanotubes. Nanotechnology 2006, 17, 398–402. [Google Scholar] [CrossRef]
  53. Brunchi, C.E.; Bercea, M.; Morariu, S.; Dascalu, M. Some Properties of Xanthan Gum in Aqueous Solutions: Effect of Temperature and PH. J. Polym. Res. 2016, 23, 123. [Google Scholar] [CrossRef]
  54. Nsengiyumva, E.M.; Alexandridis, P. Xanthan Gum in Aqueous Solutions: Fundamentals and Applications. Int. J. Biol. Macromol. 2022, 216, 583–604. [Google Scholar] [CrossRef] [PubMed]
  55. Bejenariu, A.; Popa, M.; Picton, L.; Le Cerf, D. Effect of Concentration, PH and Temperature on Xanthan Conformation: A Preliminary Study before Crosslinking. Rev. Roum. Chim. 2010, 55, 147–152. [Google Scholar]
  56. Hardcastle, F. Raman Spectroscopy of Titania (TiO2) Nanotubular Water-Splitting Catalysts. J. Ark. Acad. Sci. 2011, 65, 43–48. [Google Scholar] [CrossRef]
  57. Albu, S.P.; Taccardi, N.; Paramasivam, I.; Hebert, K.R.; Schmuki, P. Oxide Growth Efficiencies and Self-Organization of TiO2 Nanotubes. J. Electrochem. Soc. 2012, 159, 697–703. [Google Scholar] [CrossRef]
  58. Necula, M.G.; Mazare, A.; Ion, R.N.; Ozkan, S.; Park, J.; Schmuki, P.; Cimpean, A. Lateral Spacing of TiO2 Nanotubes Modulates Osteoblast Behavior. Materials 2019, 12, 2956. [Google Scholar] [CrossRef]
Figure 1. Current density responses while titanium is being anodized: (a) standard form, (b) using an aqueous electrolyte without XG, and (c) using an aqueous electrolyte with XG.
Inventions 08 00109 g001
Figure 2. SEM pictures of coatings obtained in (ad) an electrolyte without XG and (ei) an aqueous electrolyte with XG. FFT images from nanotubes obtained in an aqueous electrolyte without XG (j) and an aqueous electrolyte with XG (k).
Inventions 08 00109 g002
Figure 3. SEM pictures displaying the influence of anodization time on the organization and length of TiO2 nanotubes produced using aqueous electrolytes with XG. ID = internal diameter, L = length.
Inventions 08 00109 g003
Figure 4. SEM micrographs demonstrating the impact of NaF concentration on the structure of nanotubes. ID = internal diameter, L = length.
Inventions 08 00109 g004
Figure 5. SEM micrographs demonstrating the impact of XG concentration on the structure of nanotubes. ID = internal diameter, L = length.
Inventions 08 00109 g005
Figure 6. SEM micrographs demonstrating the impact of electrolyte pH on the structure of nanotubes. ID = internal diameter, L = length.
Inventions 08 00109 g006
Figure 7. Raman spectra of nanotubular coatings obtained using XG.
Inventions 08 00109 g007
Figure 8. EDX characterization of nanotubular coatings obtained using XG.
Inventions 08 00109 g008
Disclaimer/Publisher’s Note: The statements, opinions and data contained in all publications are solely those of the individual author(s) and contributor(s) and not of MDPI and/or the editor(s). MDPI and/or the editor(s) disclaim responsibility for any injury to people or property resulting from any ideas, methods, instructions or products referred to in the content.

