
Development of a Human Motion Analysis System Based on Sensorized Insoles and Machine Learning Algorithms for Gait Evaluation

 , , , , and
Abstract
1. Introduction
2. Materials and Methods
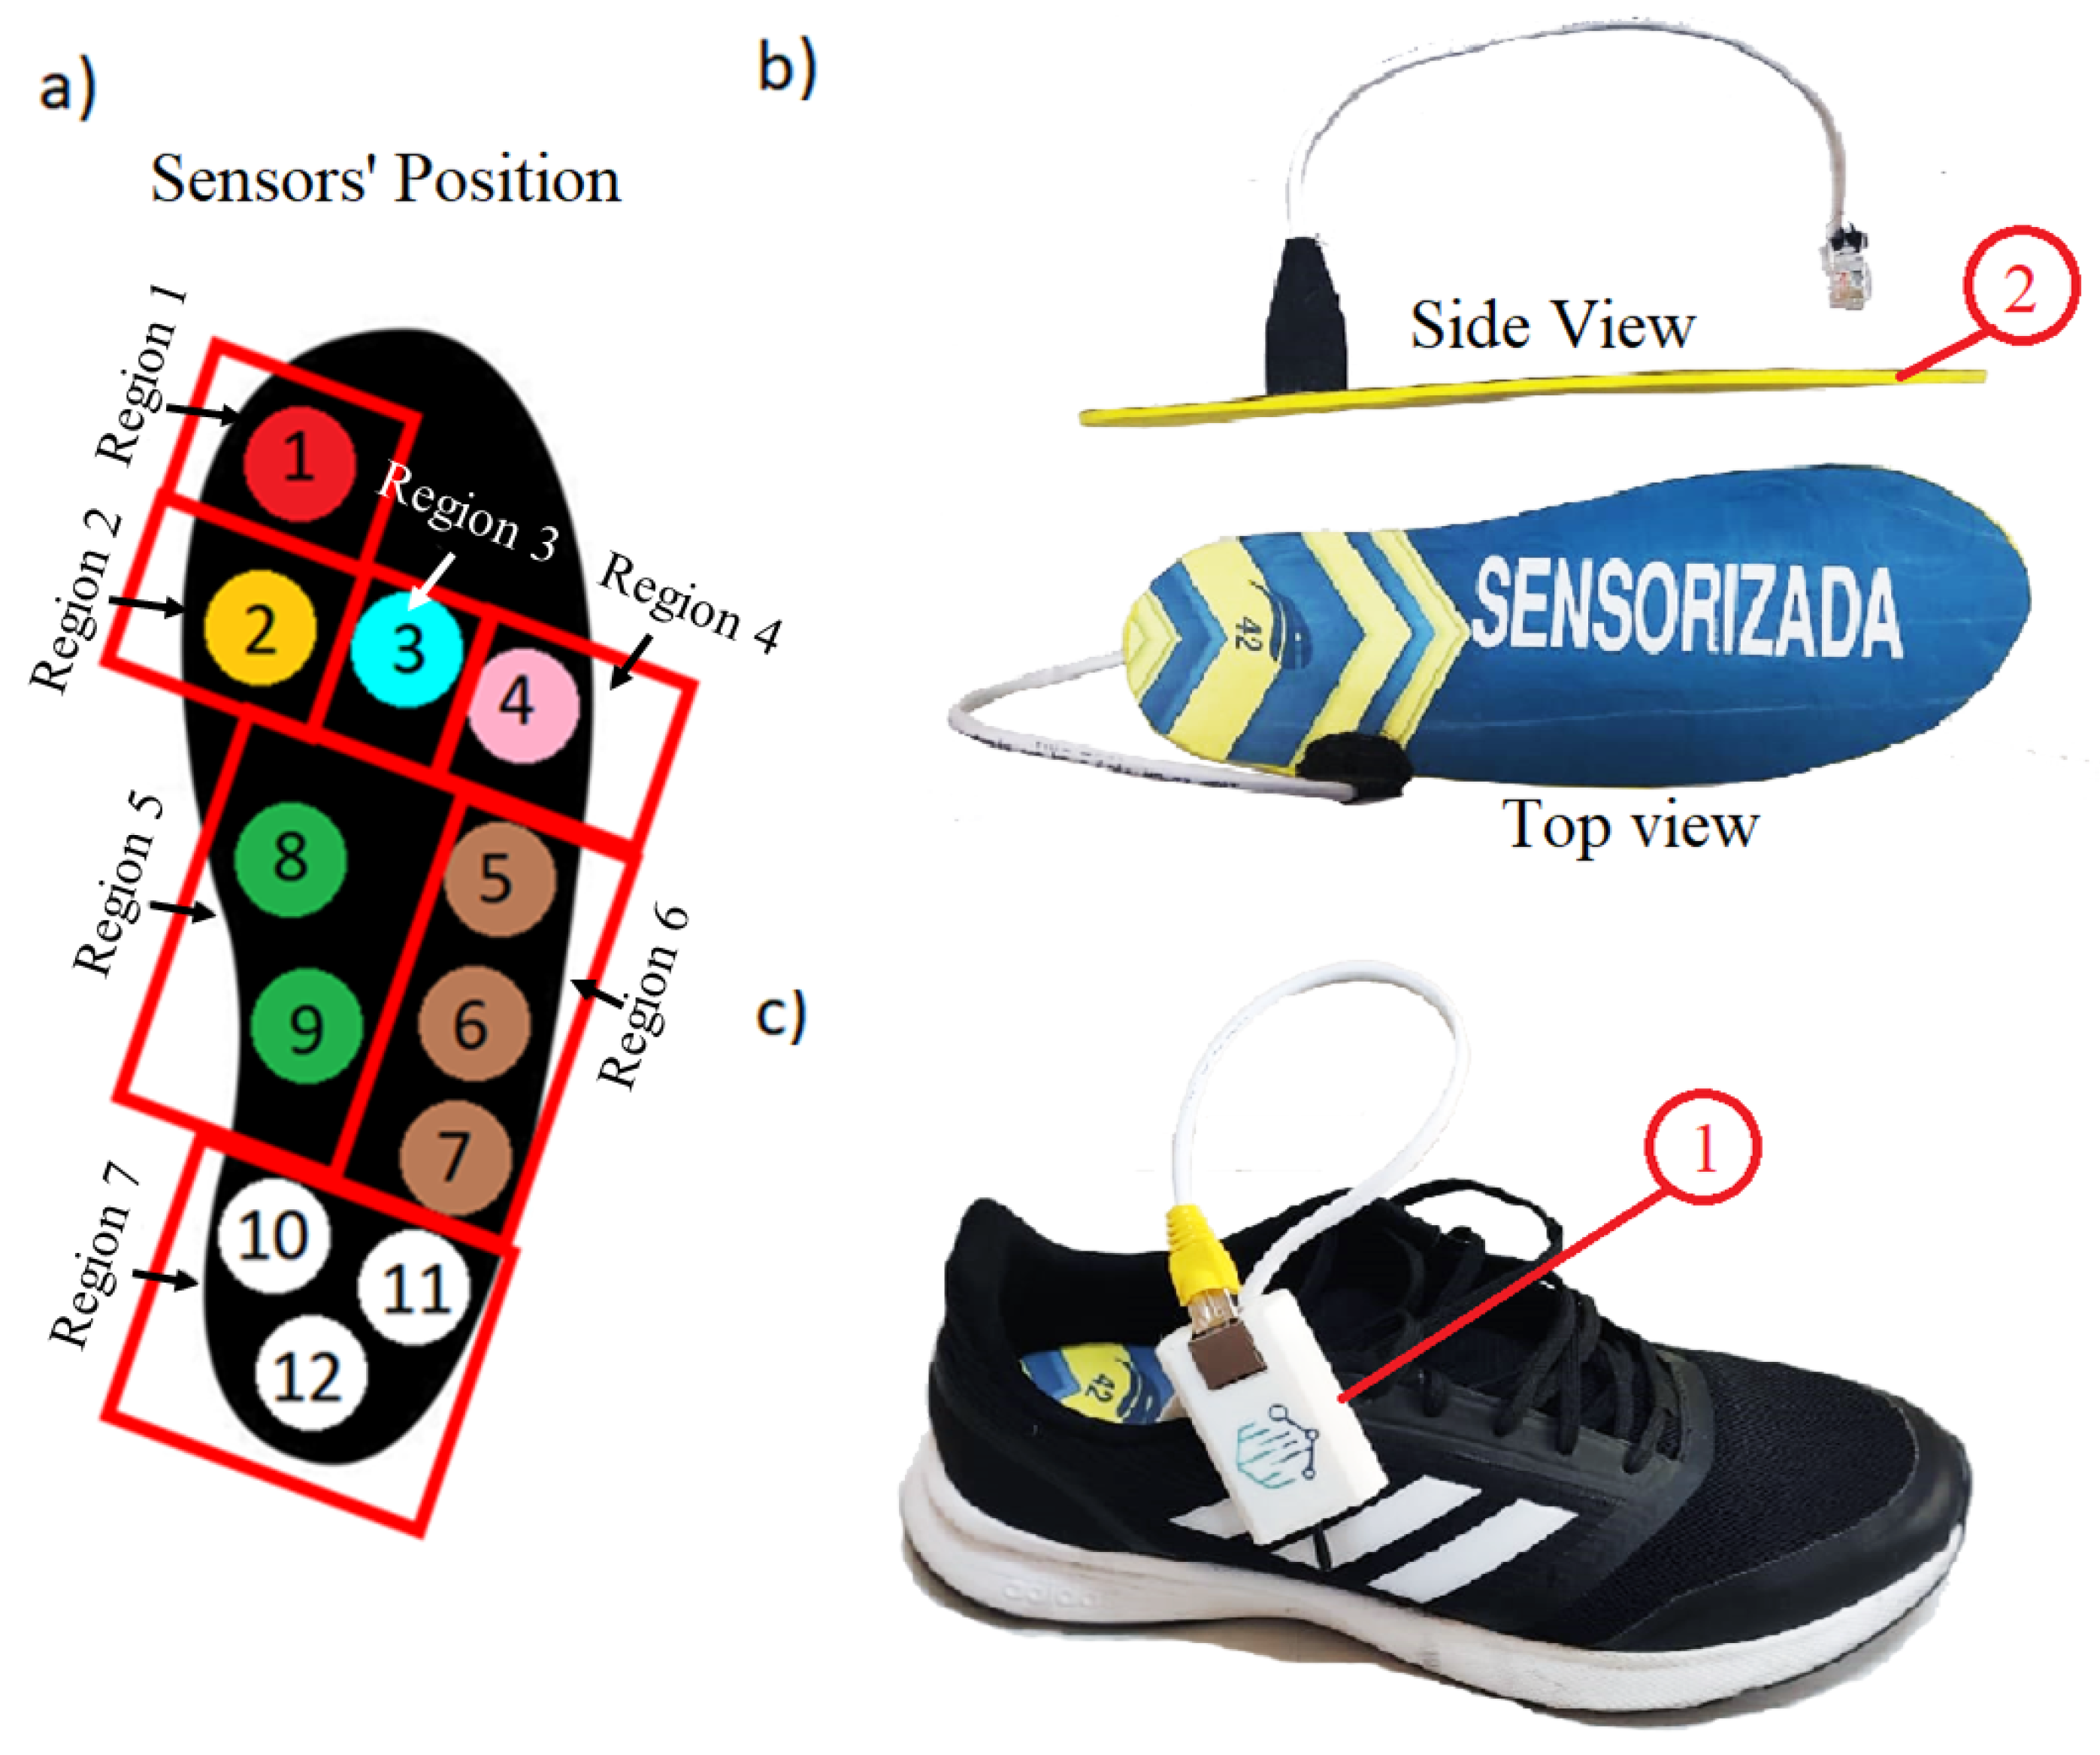
2.1. Insole Construction
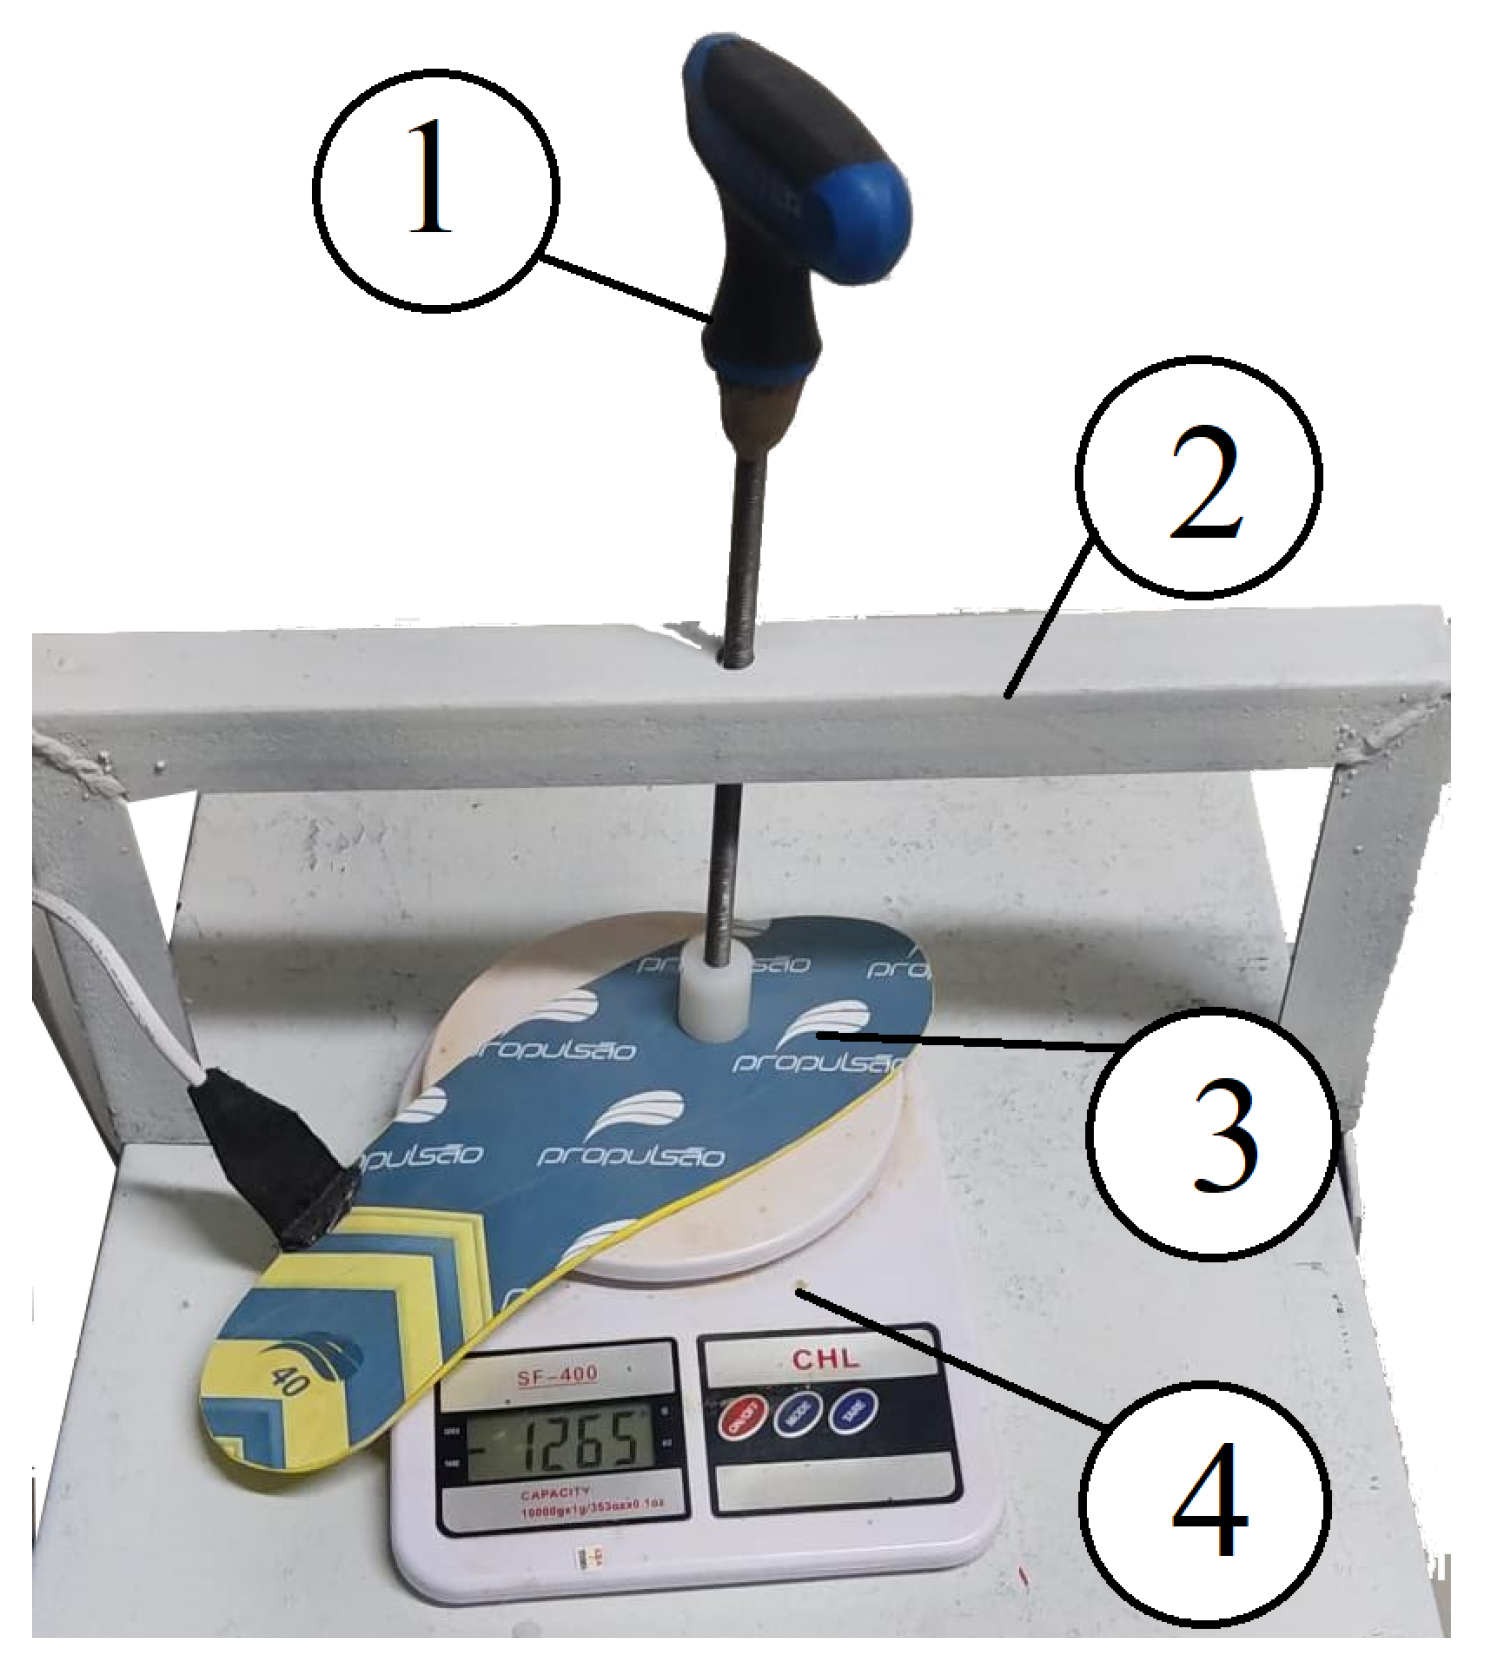
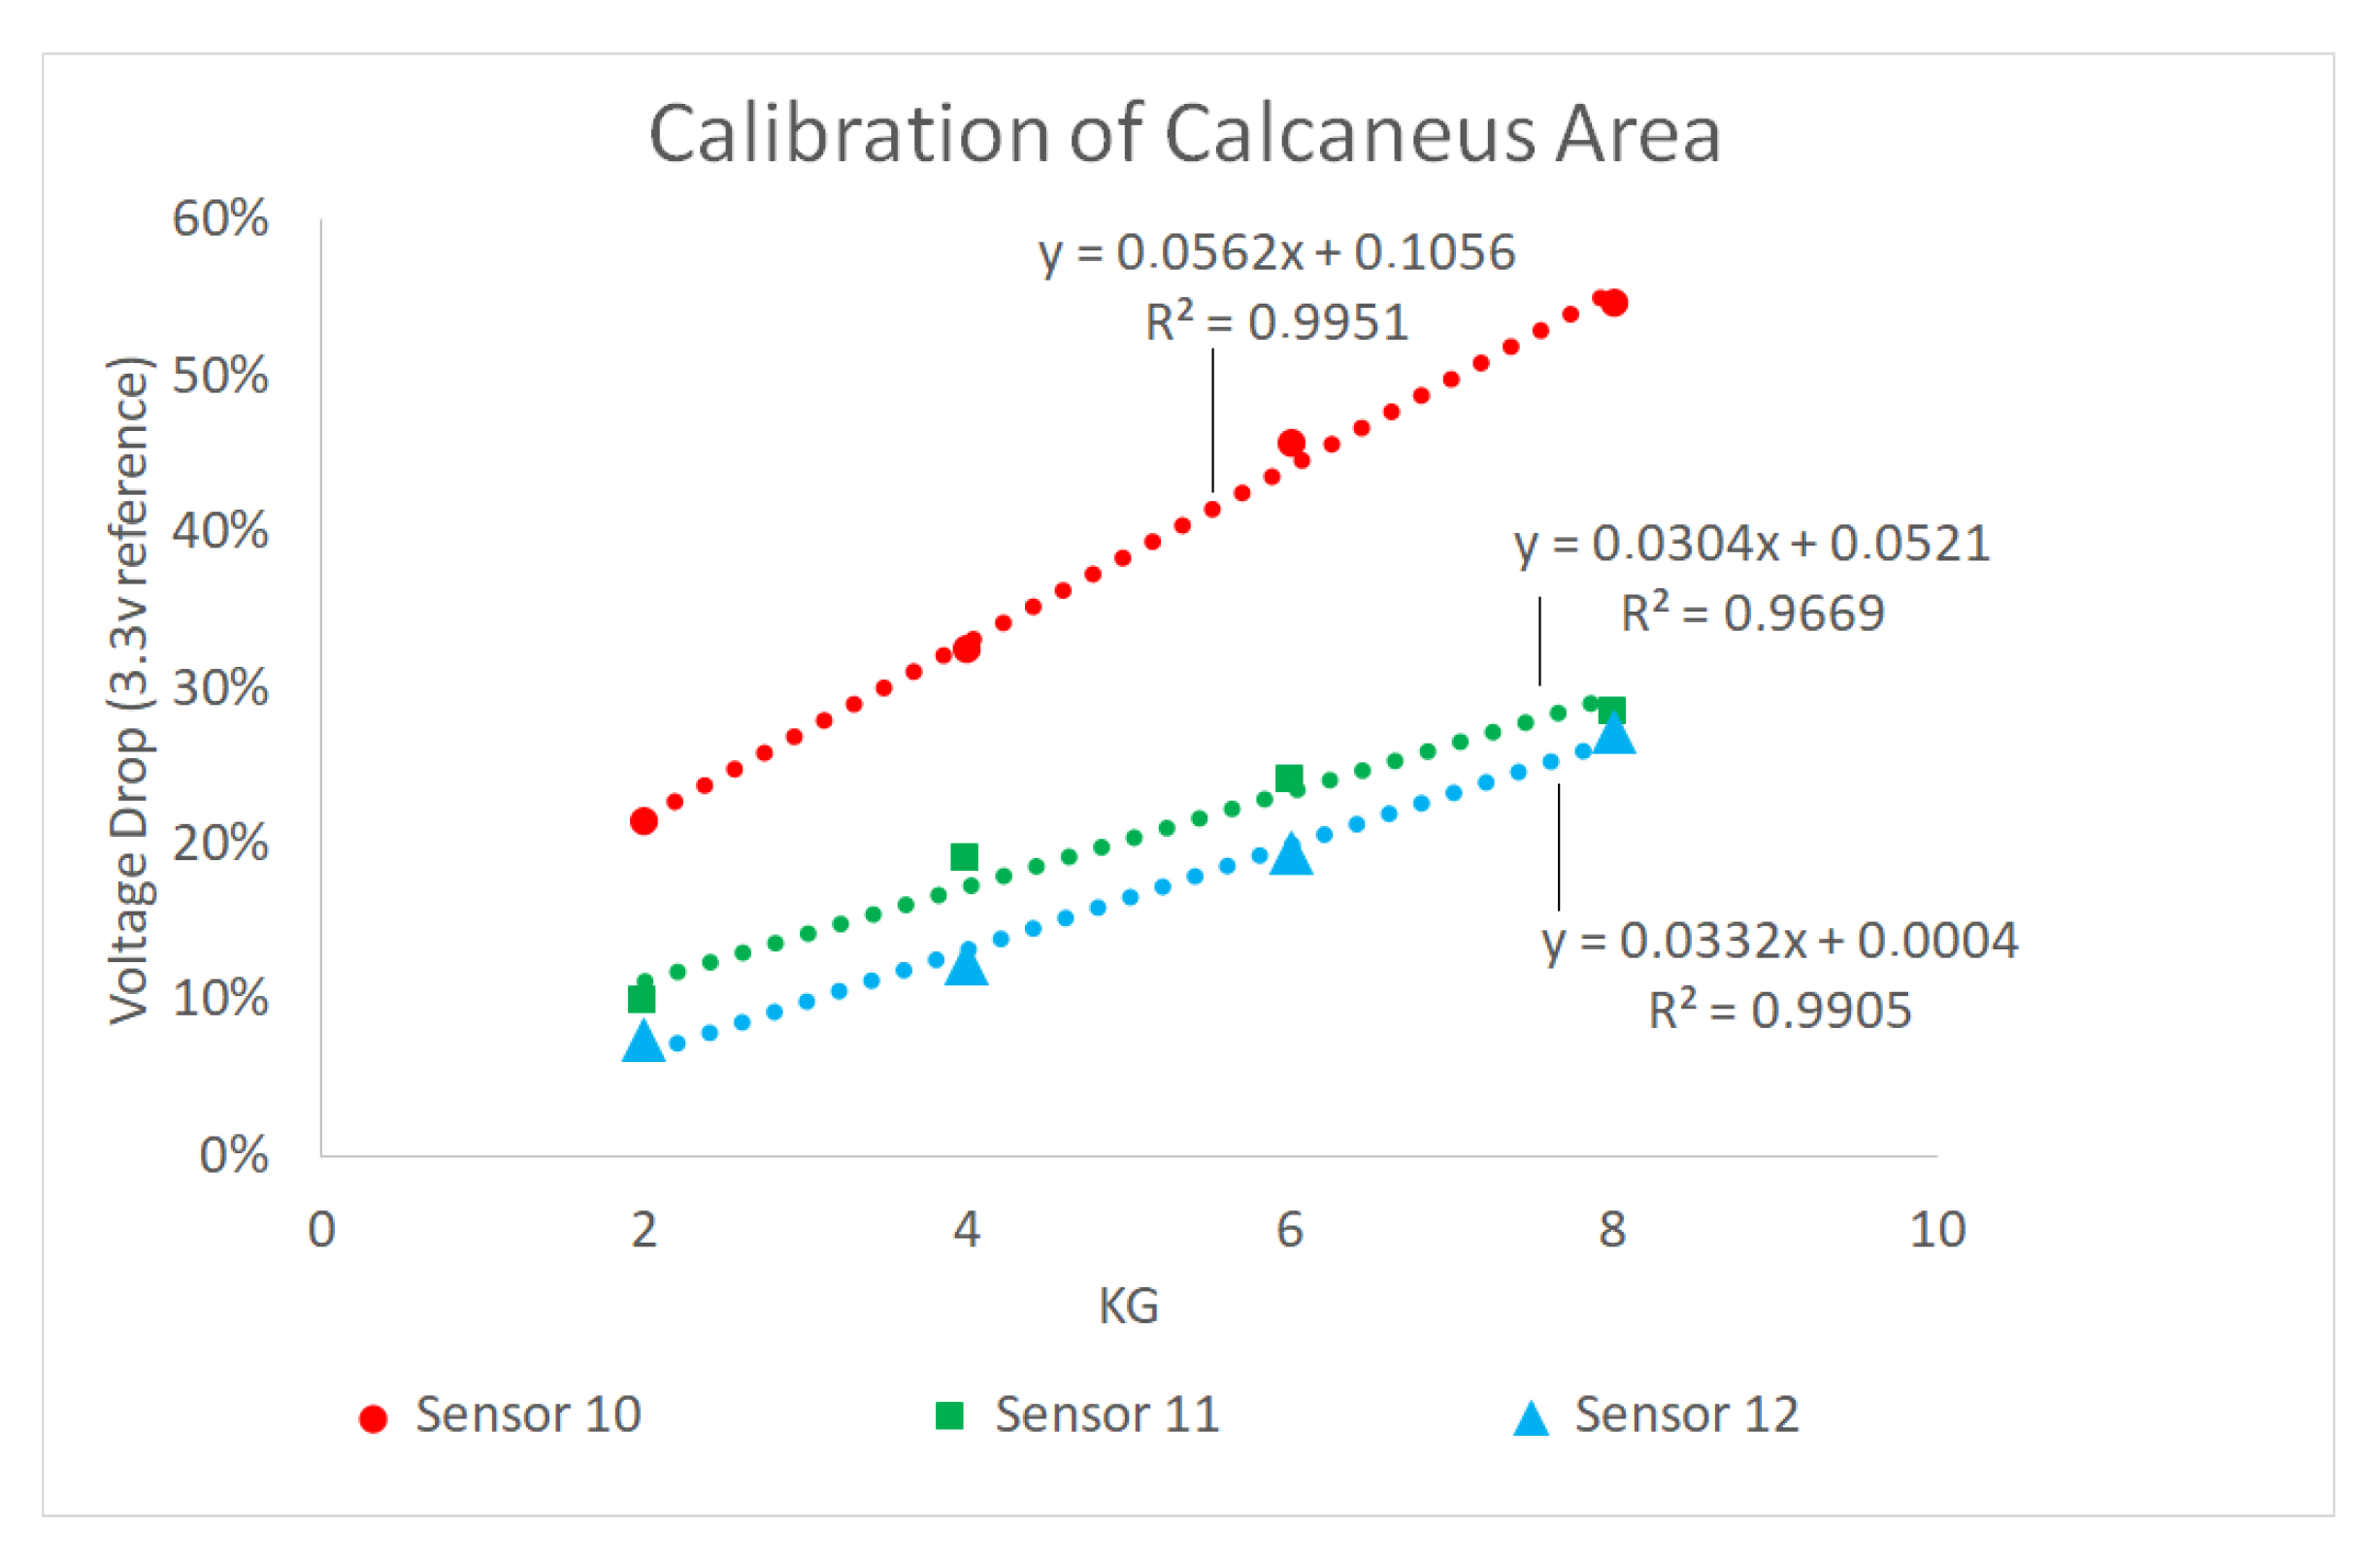
2.2. Insole Calibration
2.3. Ethical Approval
2.4. Sample Size Calculation
2.5. Participants
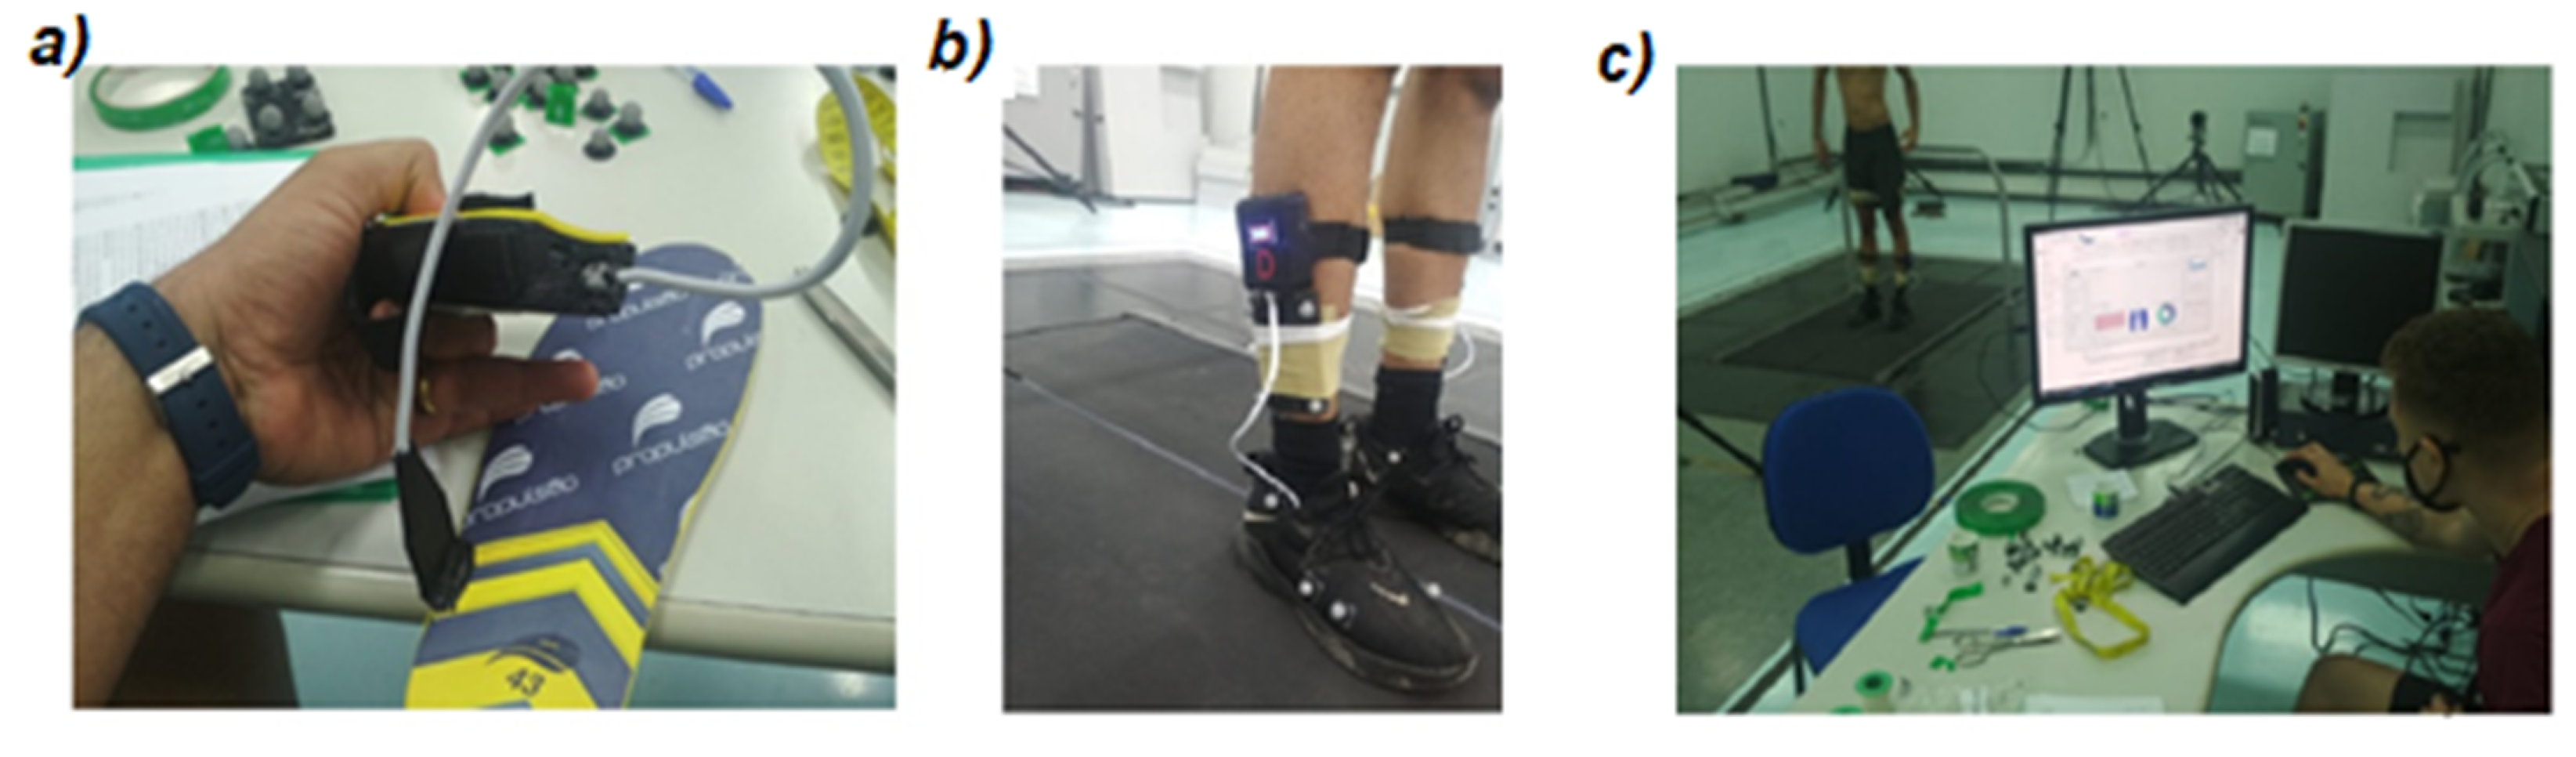
2.6. Testing and Validation Process
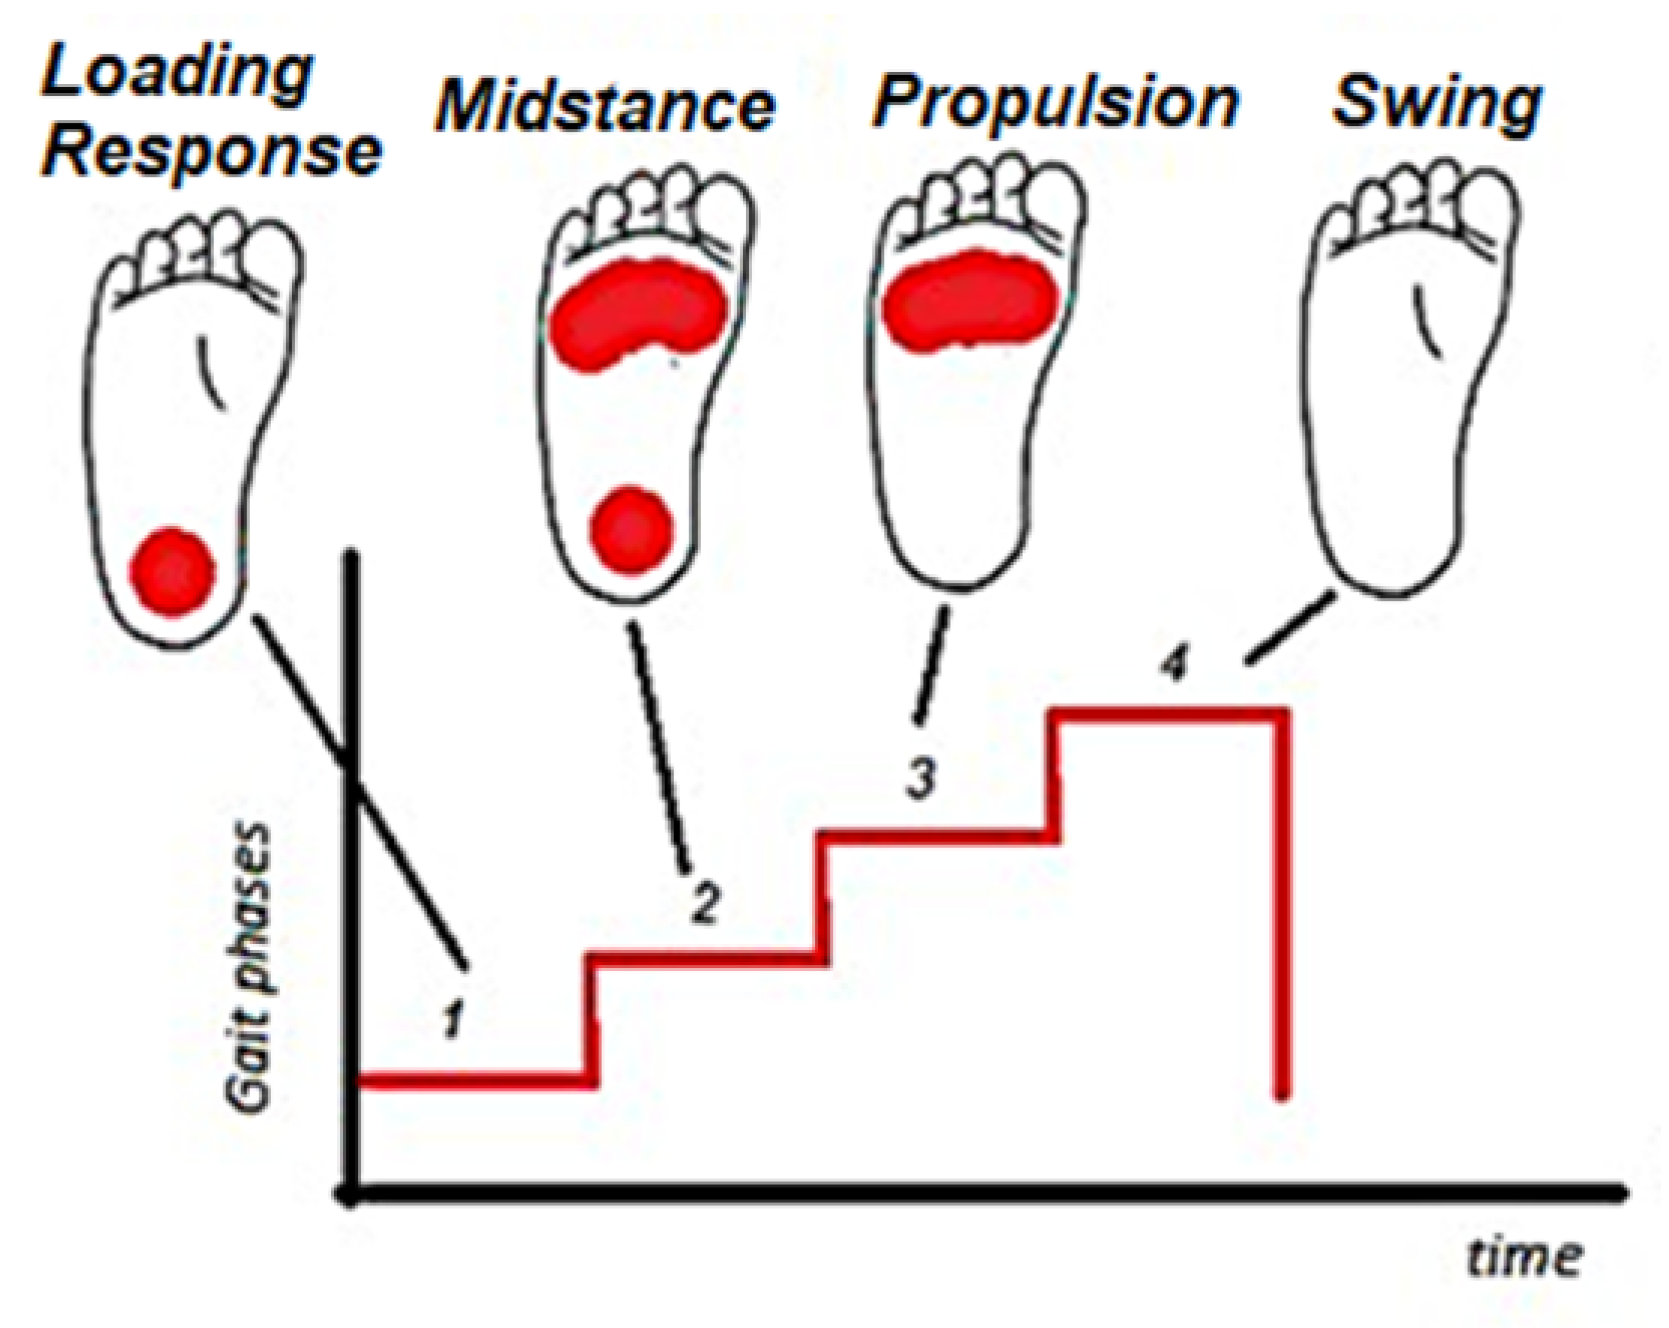
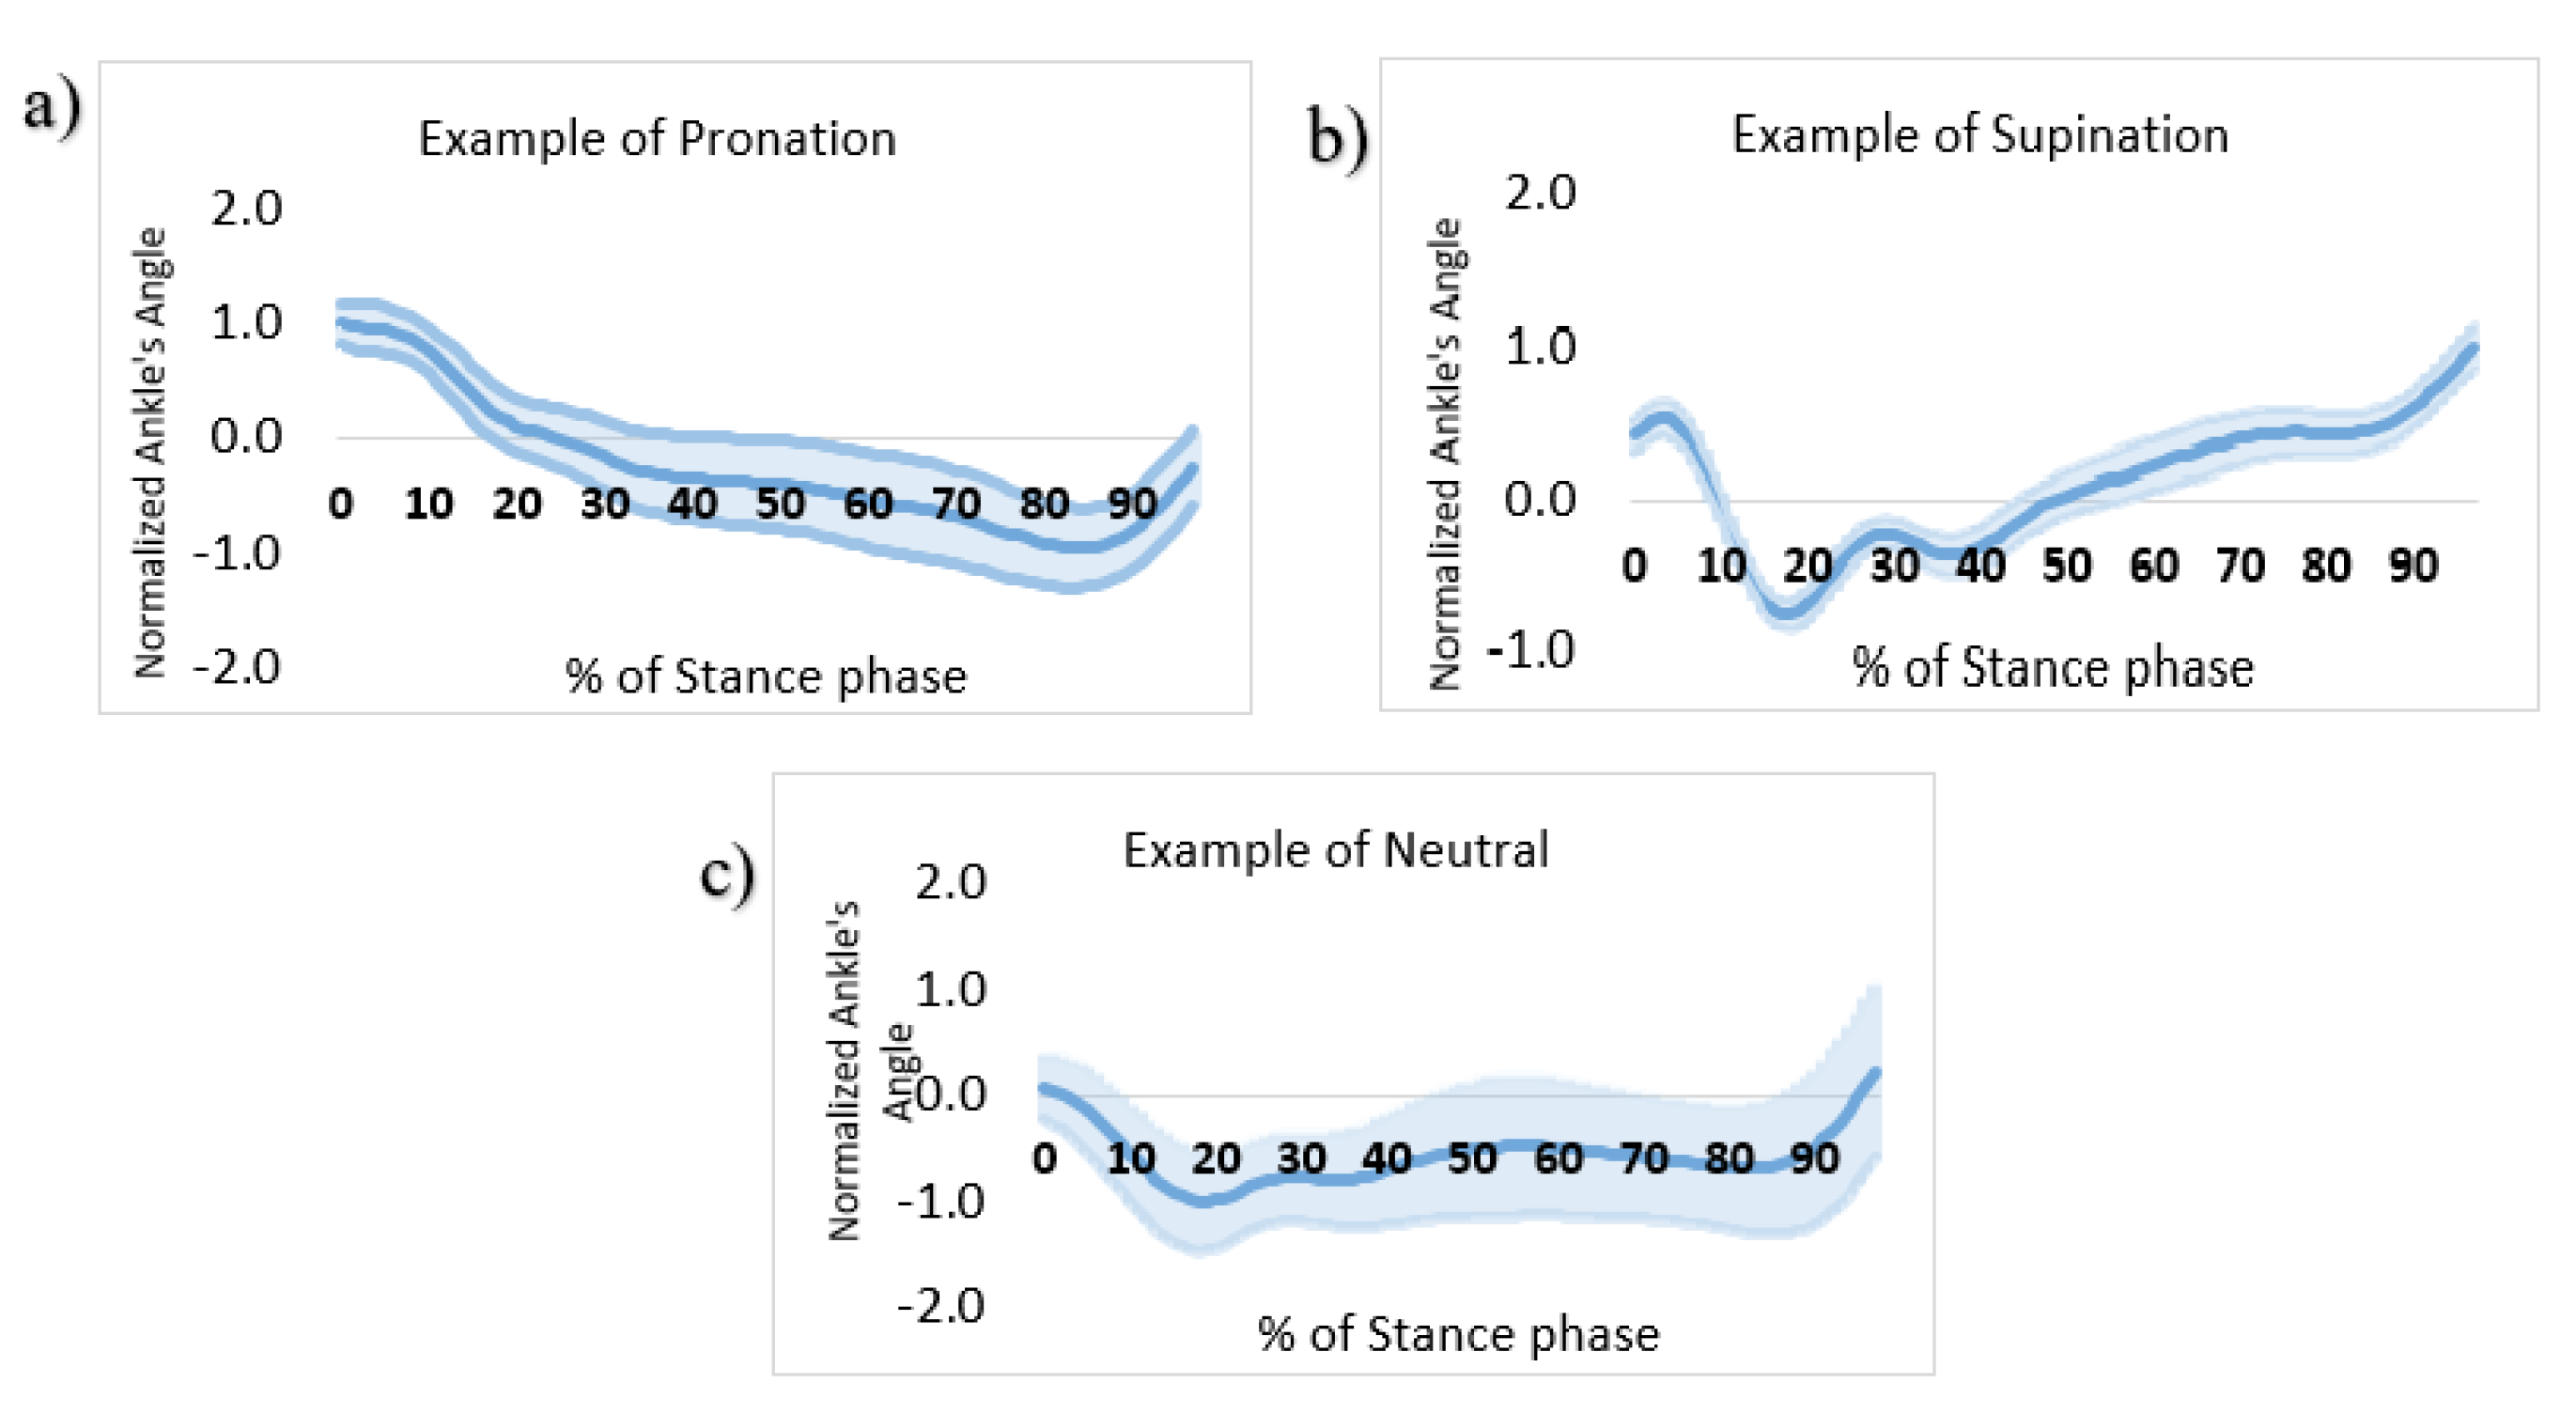
2.7. Pronation/Supination Classification
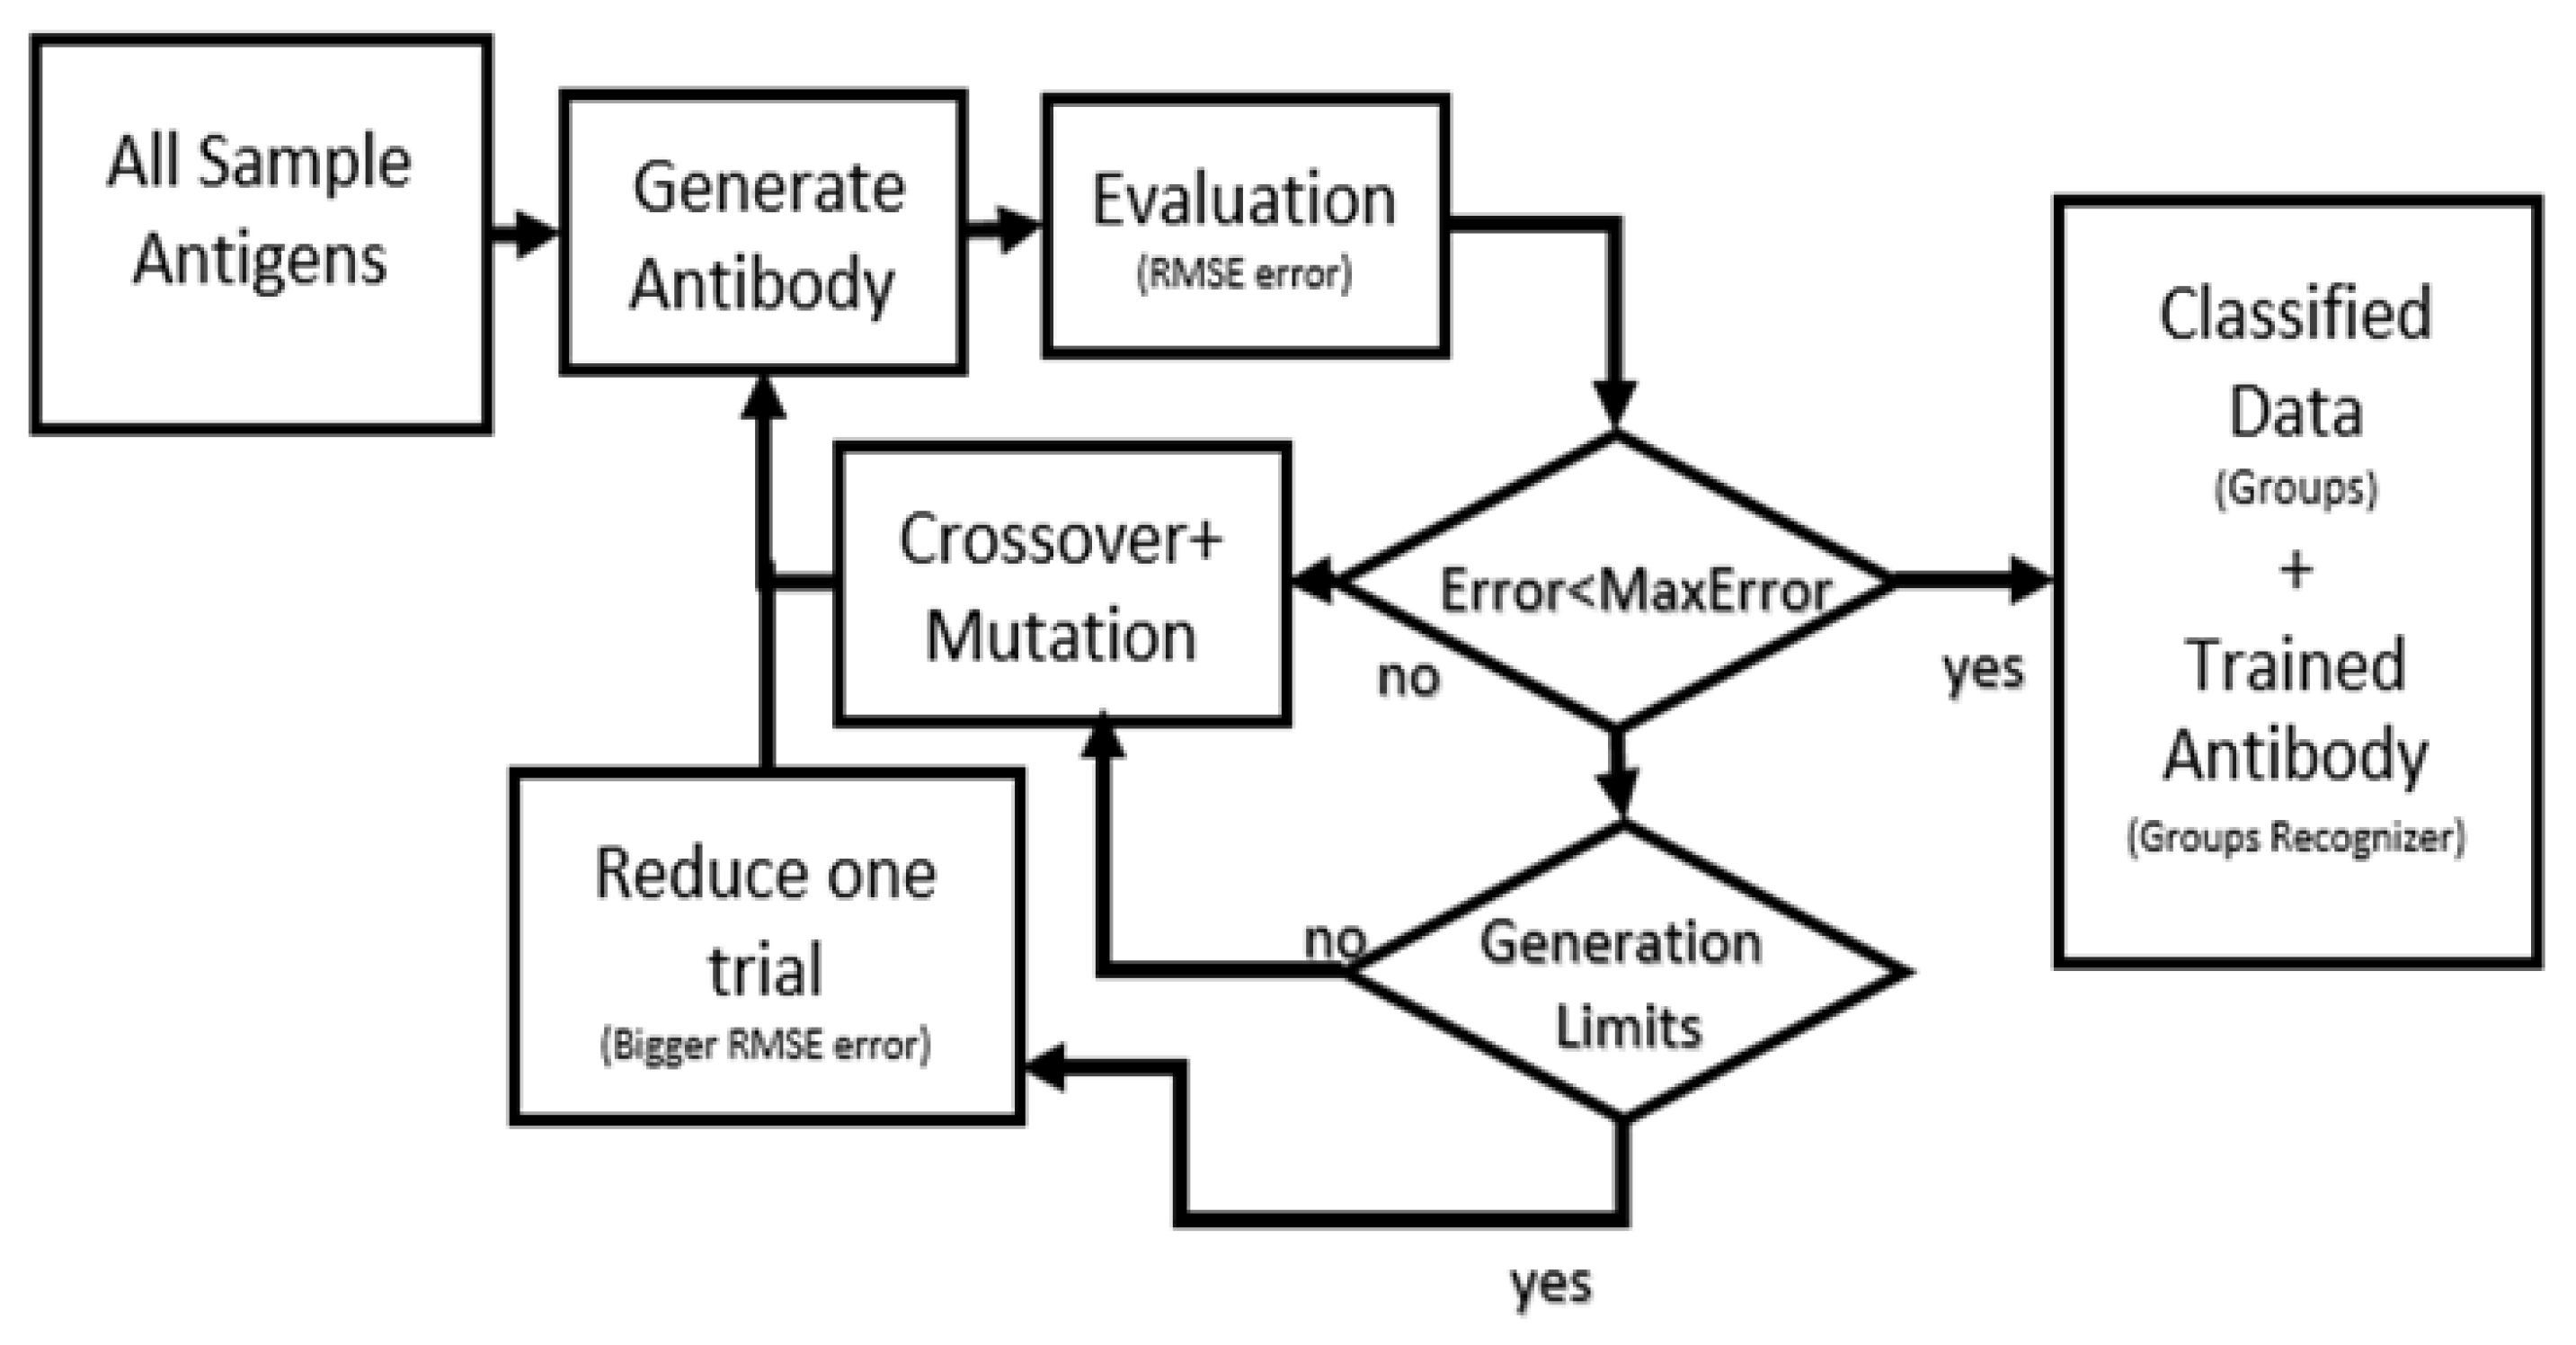
2.8. Immunological Algorithm (IA)
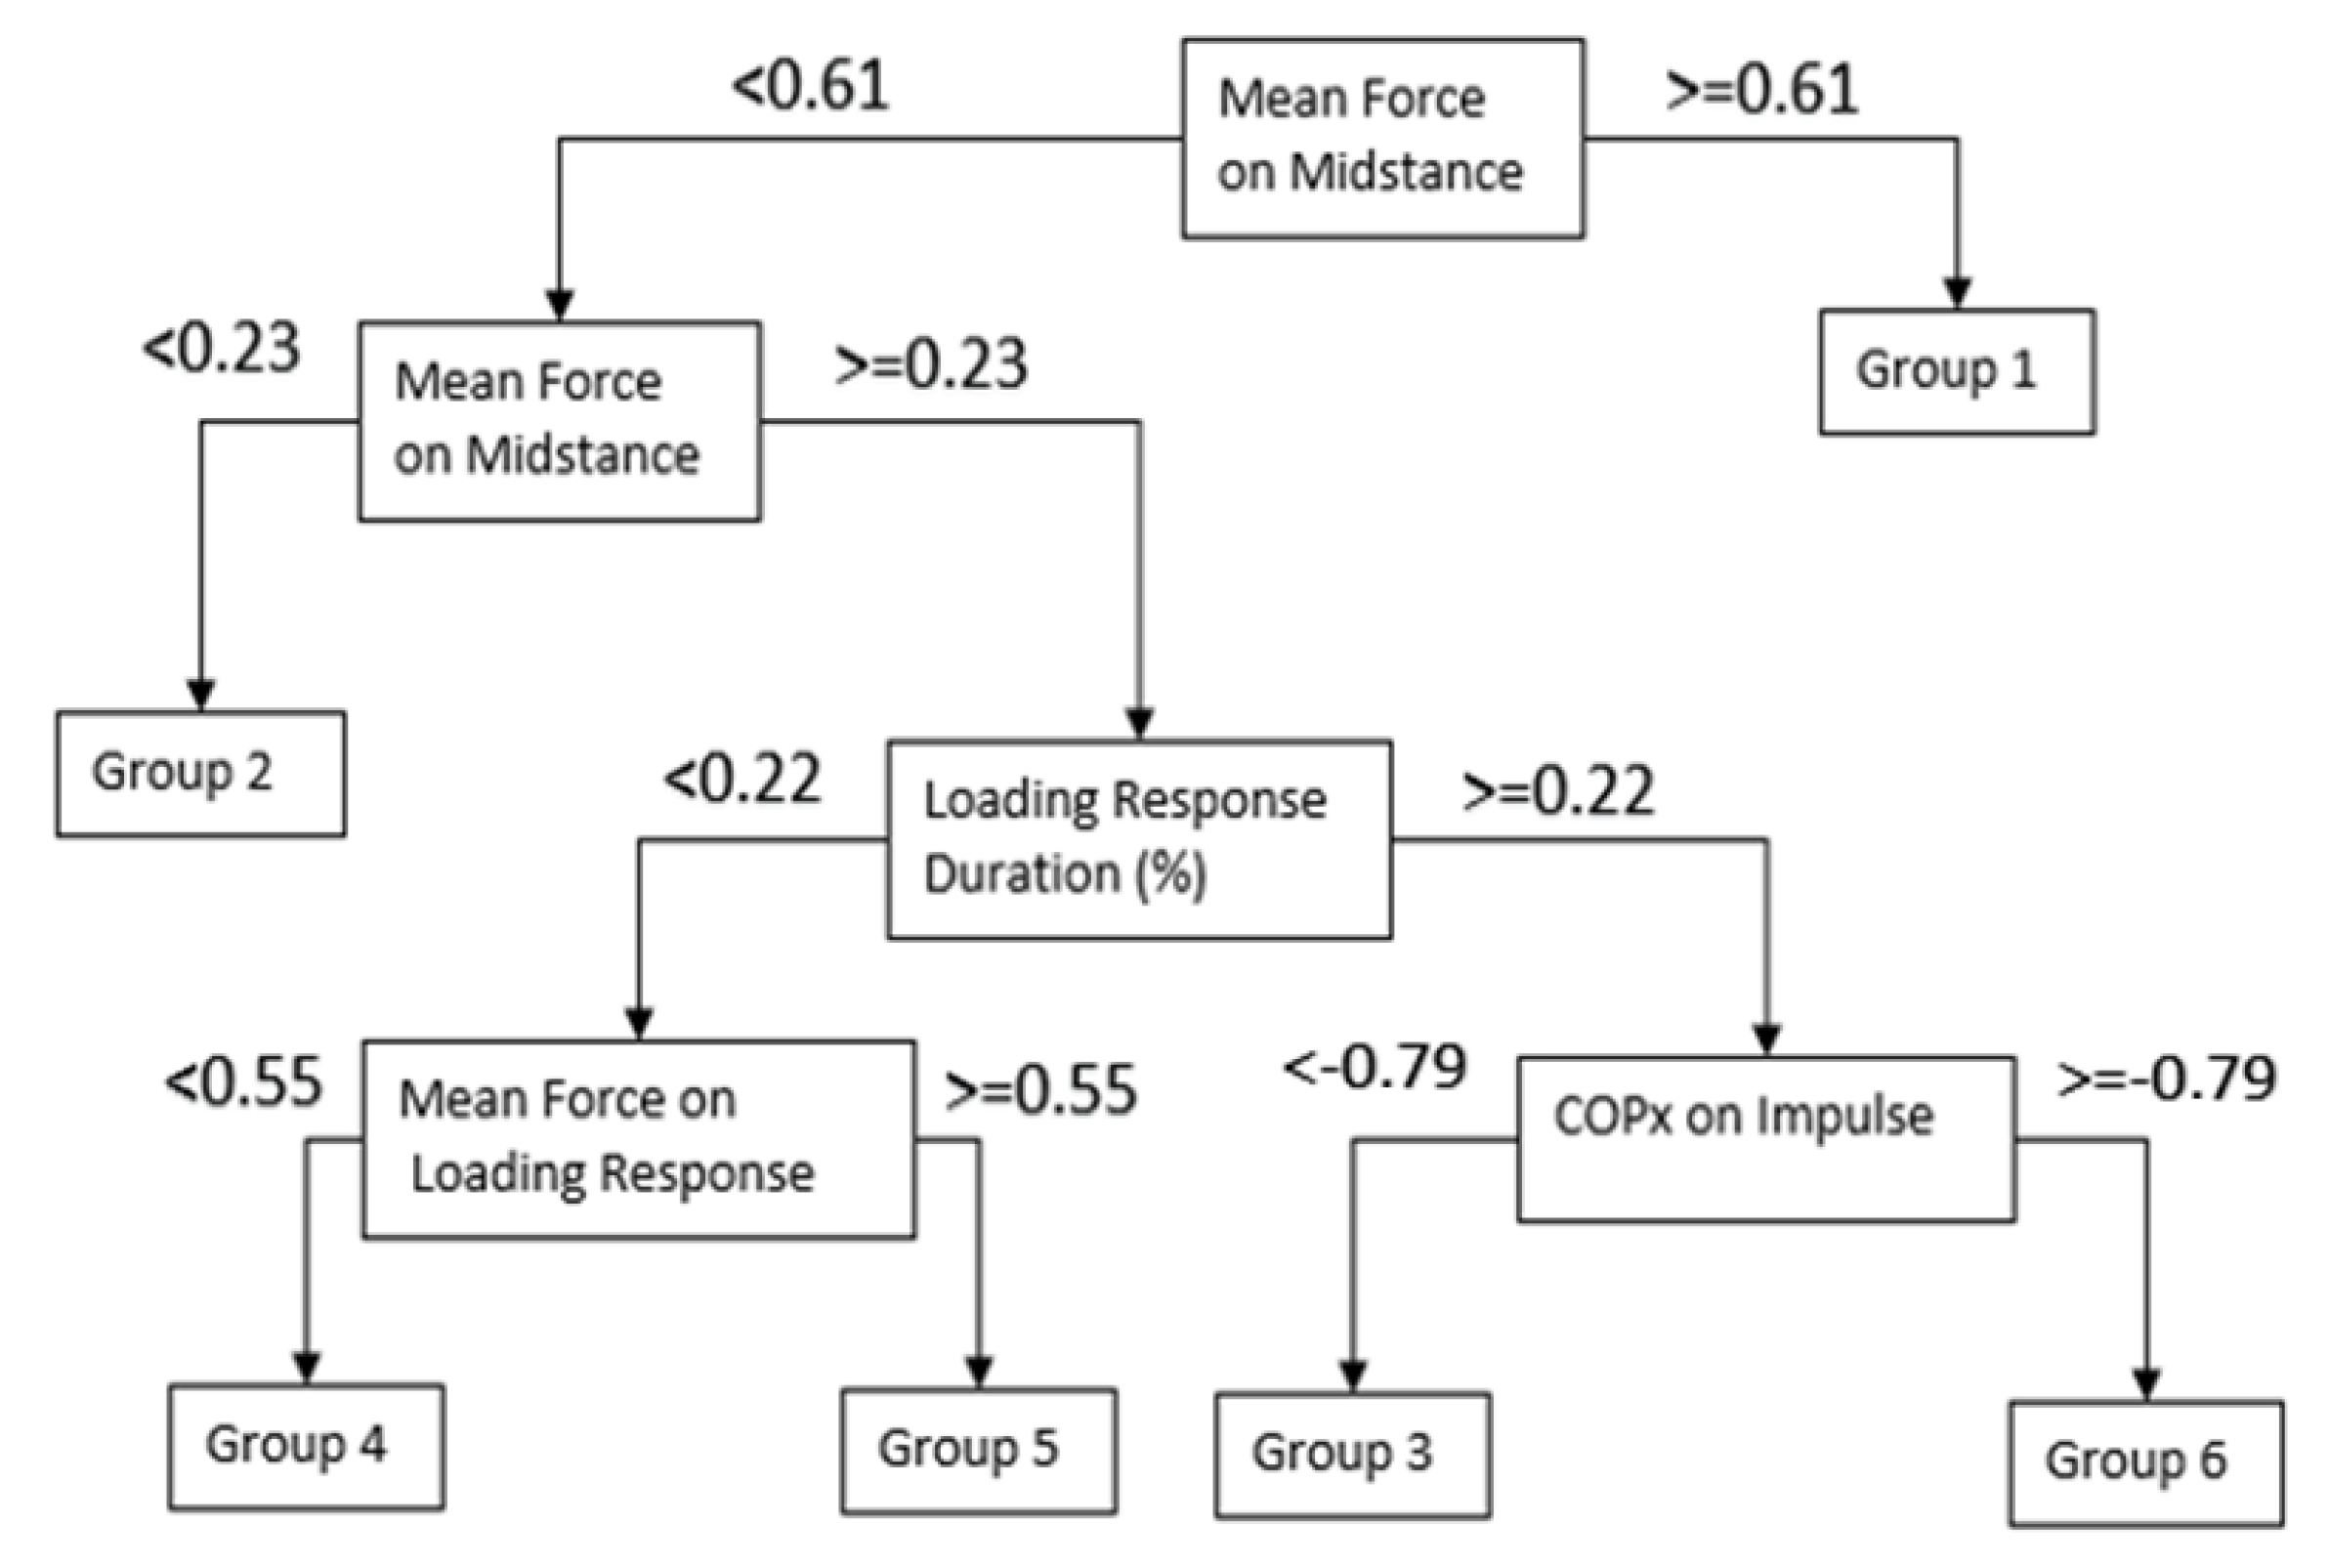
2.9. Classification and Regression Trees (CART)
3. Results
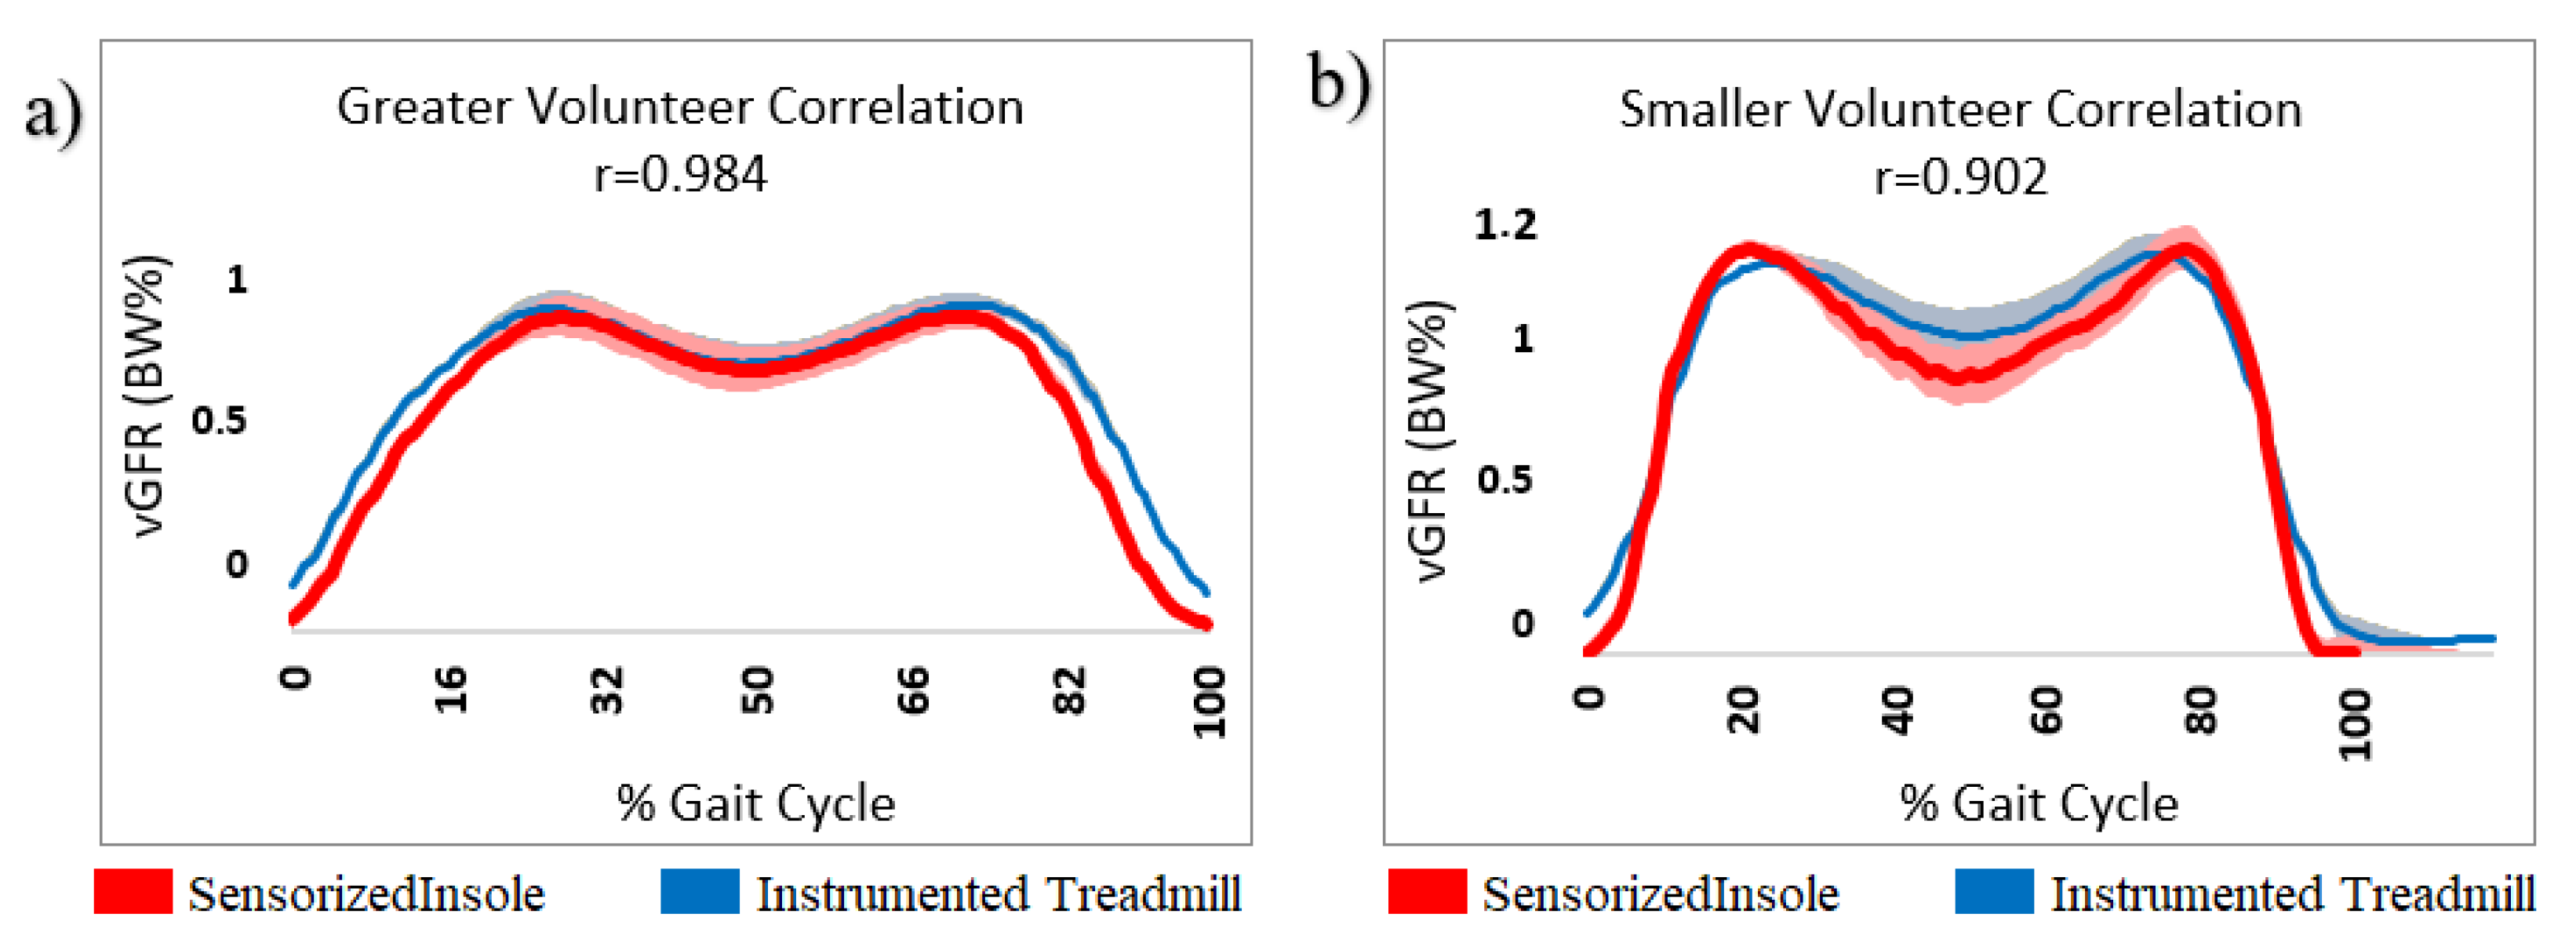
3.1. Insole Verification
3.2. Kinematics Evaluation
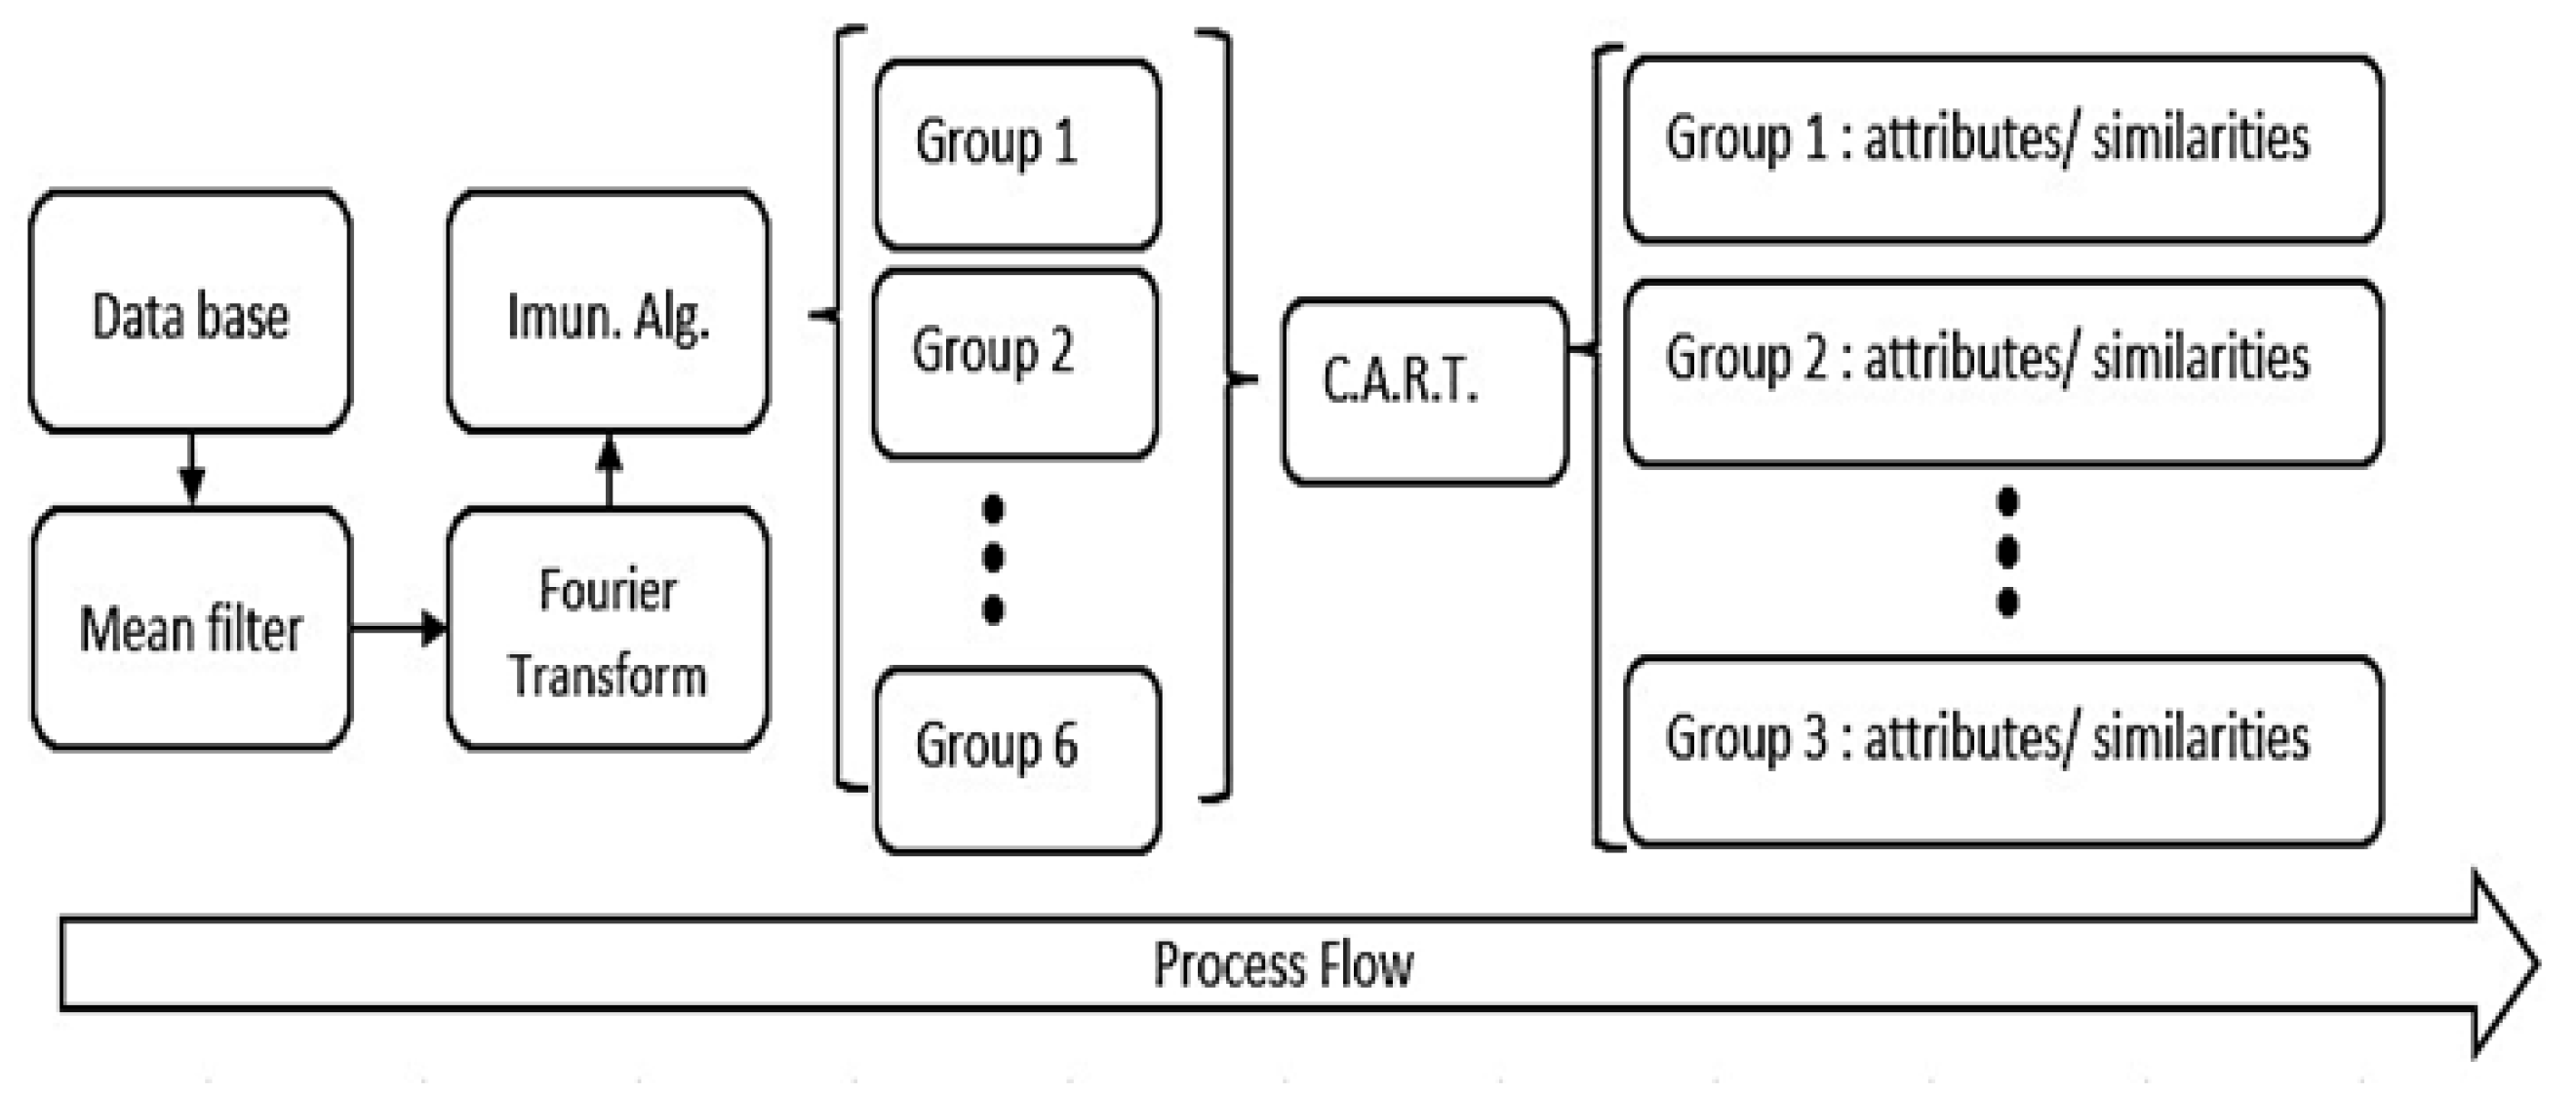
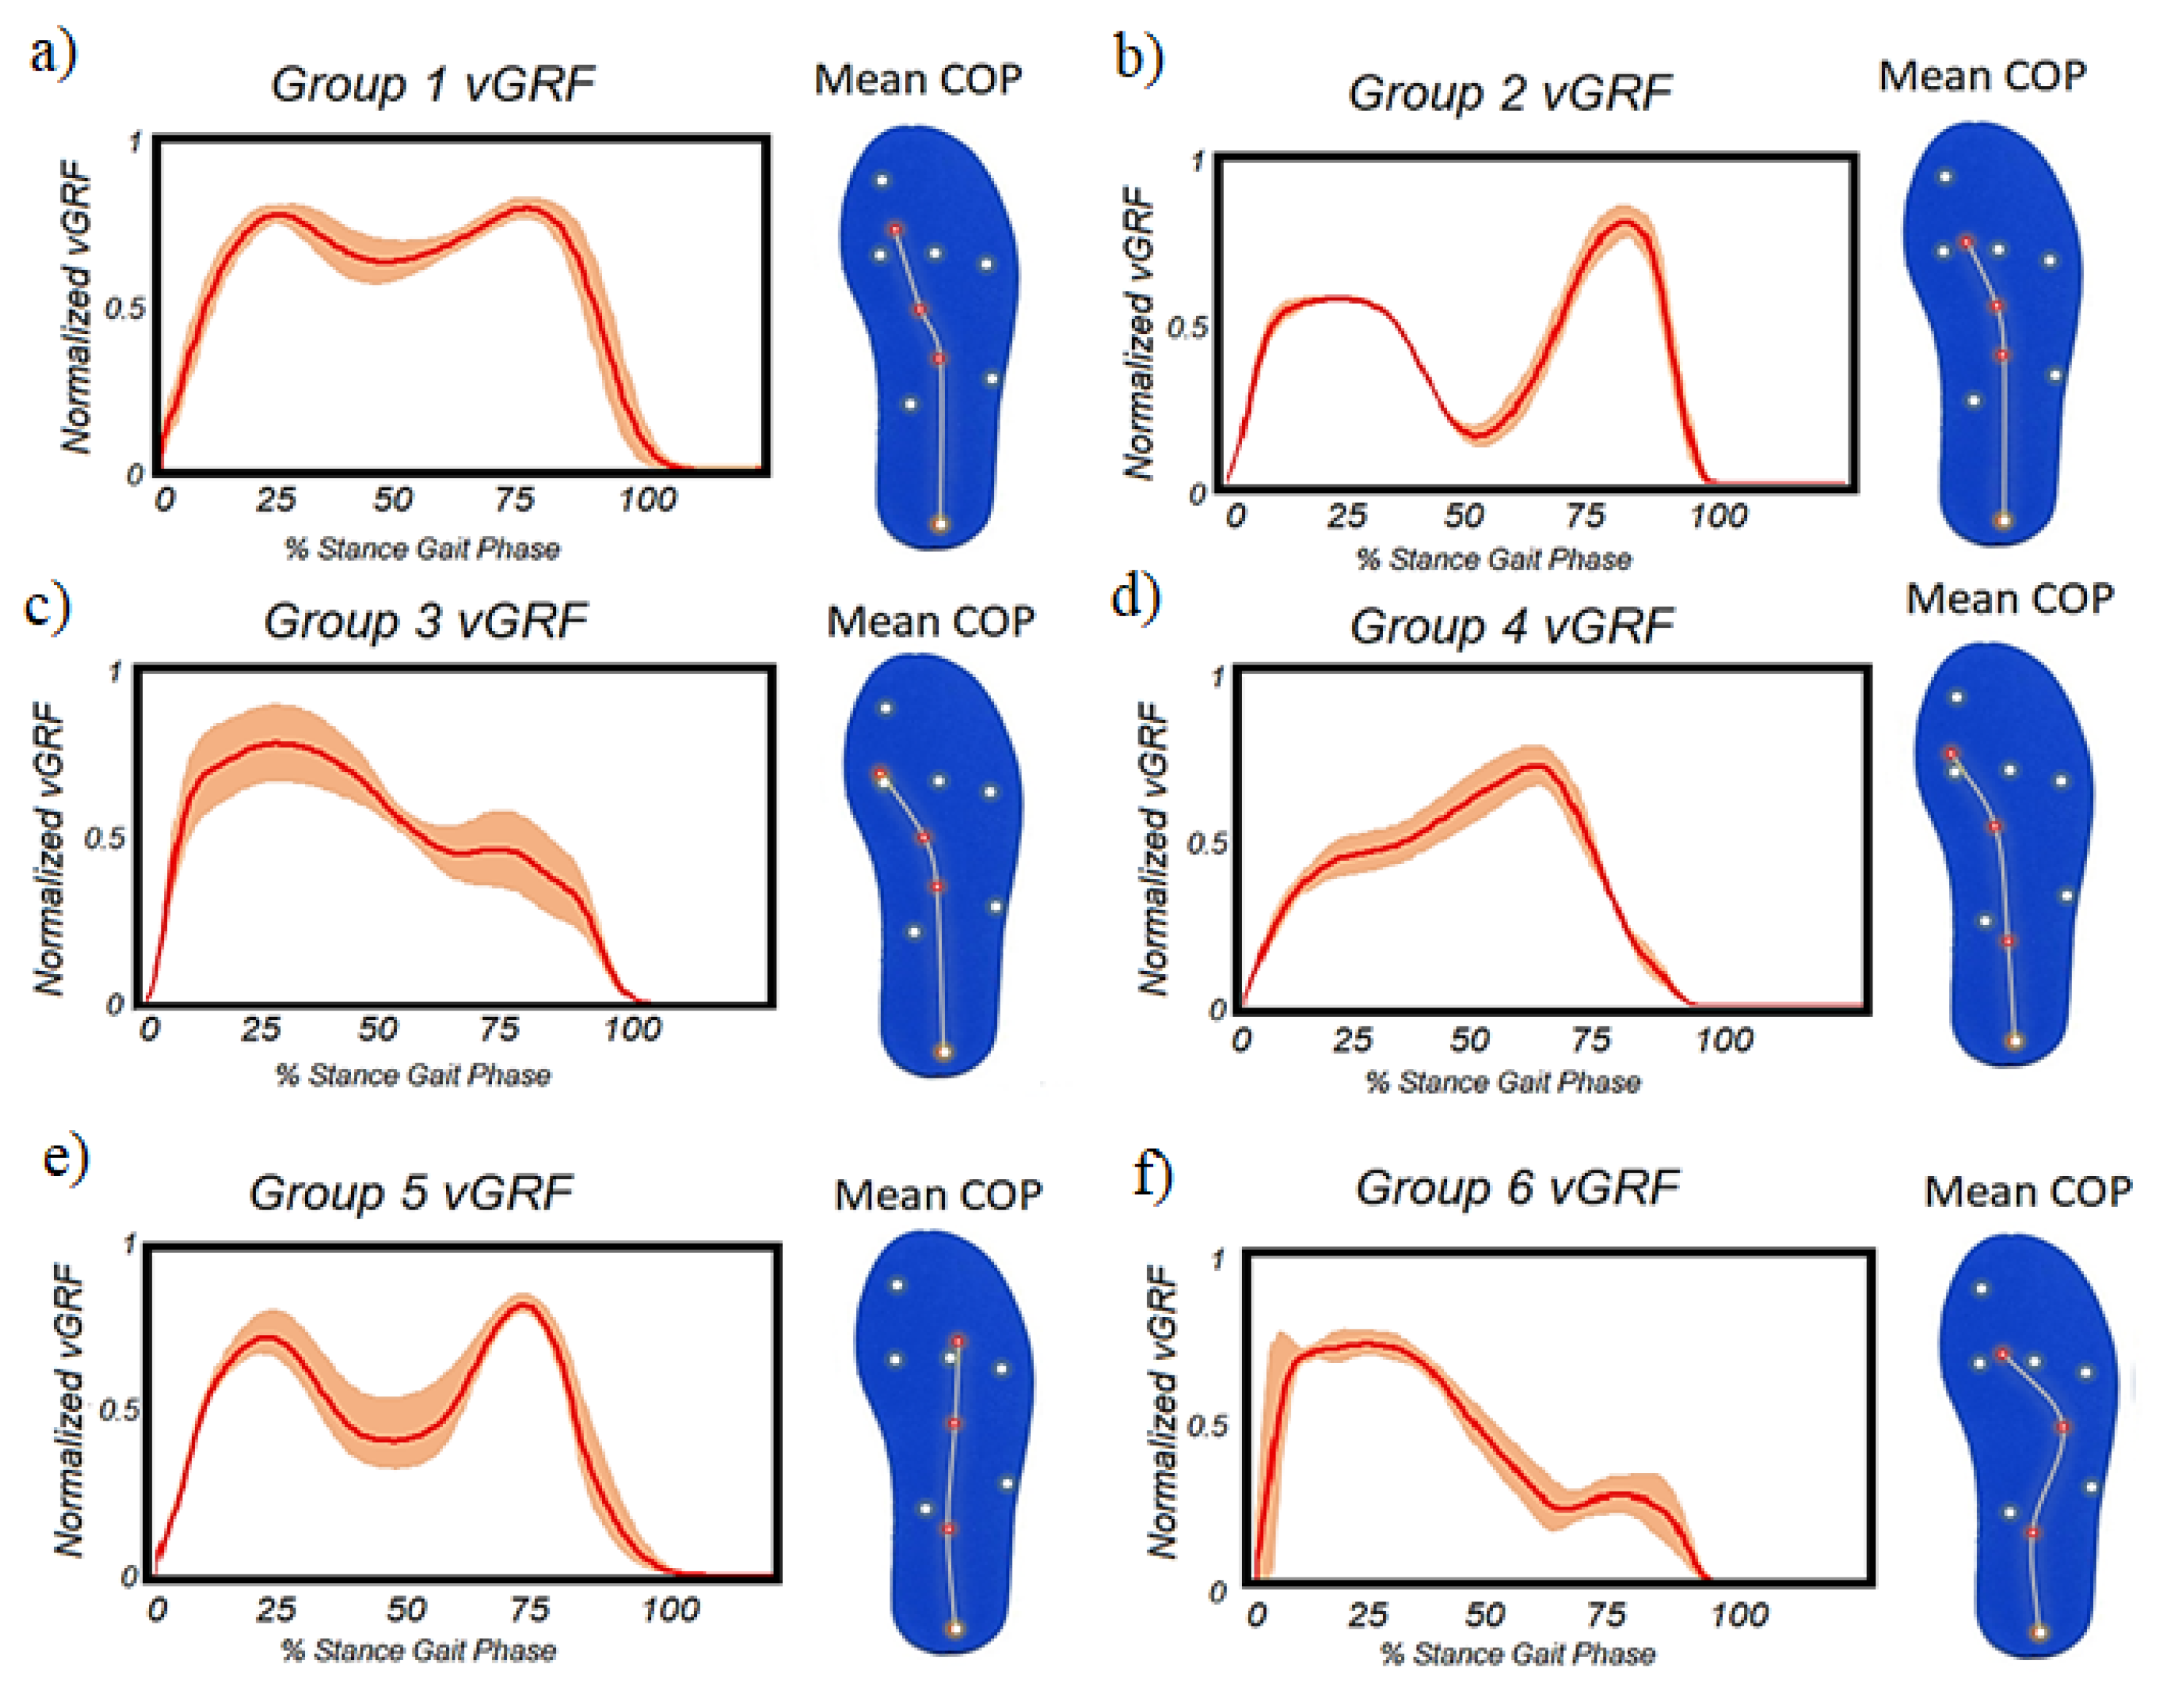
3.3. Data Processing
4. Discussion
5. Conclusions
Author Contributions
Funding
Institutional Review Board Statement
Informed Consent Statement
Data Availability Statement
Acknowledgments
Conflicts of Interest
Appendix A


| Localized Verification | |||
|---|---|---|---|
| RMSE | p-Value | ||
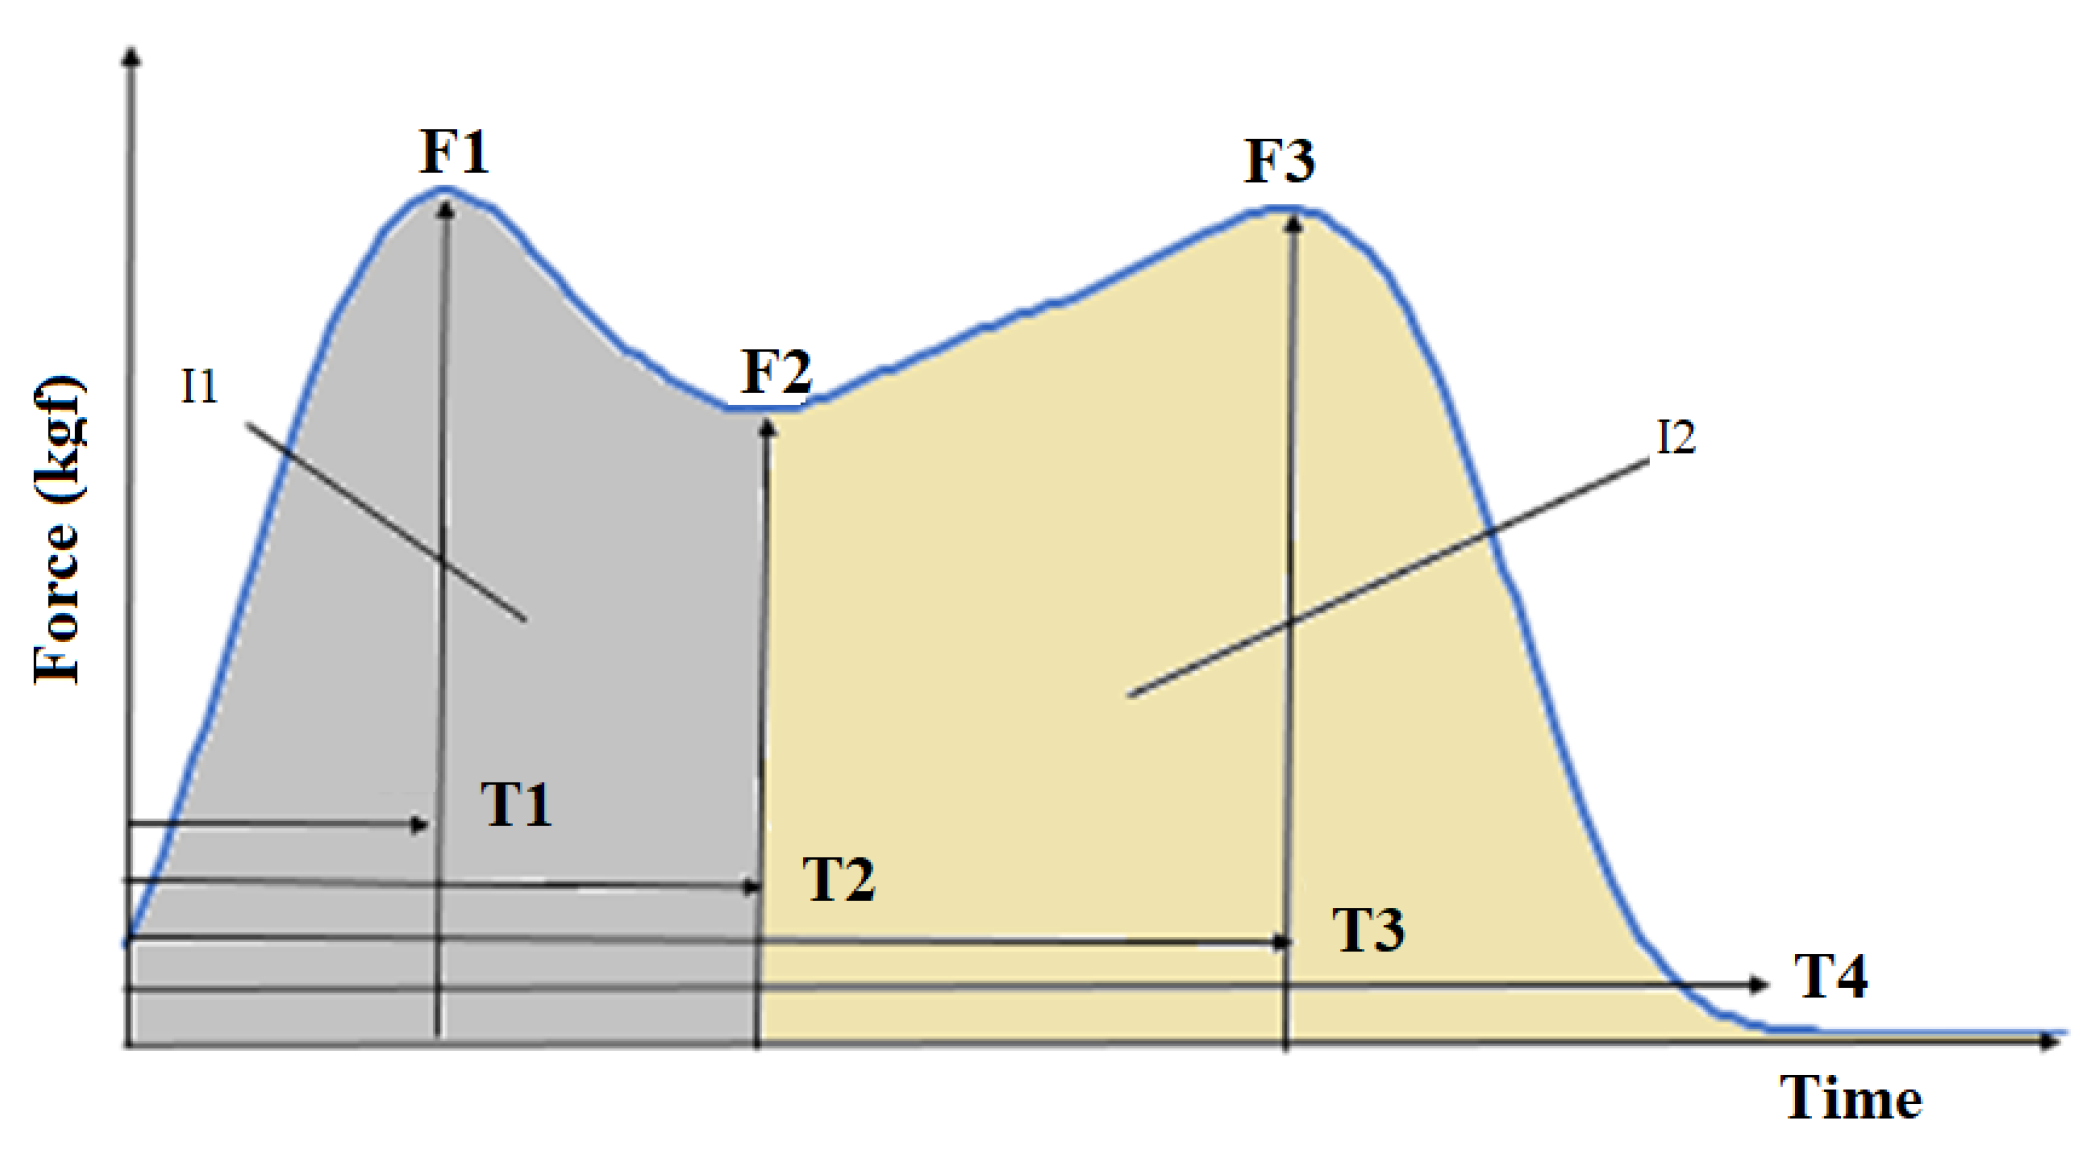
| Peak force of loading response (F1) | 2.34 | 0.0165 | |
| Low force of midstance (F2) | 6.08 | 0.0760 | |
| Peak force of push-off (F3) | 5.38 | 0.095 | |
| COPx (load response) | 0.057 | 0.0432 | |
| COPx (midstance) | 0.118 | 0.0821 | |
| COPx (push-off) | 0.214 | 0.3123 | |
| Curve Correlation | |||
| Pearson | RMSE | CMC | |
| COP X | 0.82 | 0.21 | 0.93 |
| GRF | 0.94 | 0.29 | 0.88 |
| RSME | p-Value | |
|---|---|---|
| Time of Loading Response (T1) | 0.01 | 0.04 |
| Time of Midstance (T3-T1) | 0.02 | 0.08 |
| Time of Push-off (T4-T3) | 0.01 | 0.31 |
Appendix B

Appendix C


References
- Chockalingam, N.; Healy, A.; Needham, R. Interpreting Ground Reaction Forces in Gait. In Handbook of Human Motion; Springer: Berlin/Heidelberg, Germany, 2016; pp. 1–5. [Google Scholar]
- Bagesteiro, L.B.; Gould, D.; Ewins, D.J. Esteira instrumentada para medição da força de reação vertical do solo para análise de membros com próteses. Res. Biomed. Eng. 2011, 27, 3–11. [Google Scholar]
- Vimieiro, C.; Andrada, E.; Witte, H.; Pinotti, M. A computational model for dynamic analysis of the human gait. Comput. Methods Biomech. Biomed. Eng. 2015, 18, 799–804. [Google Scholar] [CrossRef] [PubMed]
- Middleton, L.; Buss, A.A.; Bazin, A.; Nixon, M.S. A floor sensor system for gait recognition. In Proceedings of the Fourth IEEE Workshop on Automatic Identification Advanced Technologies (AutoID’05), Buffalo, NY, USA, 17–18 October 2005; pp. 171–176. [Google Scholar]
- Ivanov, K.; Mei, Z.; Lubich, L.; Guo, N.; Xile, D.; Zhao, Z.; Omisore, O.M.; Ho, D.; Wang, L. Design of a sensor insole for gait analysis. In Proceedings of the International Conference on Intelligent Robotics and Applications, Shenyang, China, 8–11 August 2019; Springer: Berlin/Heidelberg, Germany, 2019; pp. 433–444. [Google Scholar]
- Malvade, P.S.; Joshi, A.K.; Madhe, S.P. In-sole Shoe Foot Pressure Monitoring for Gait Analysis. In Proceedings of the 2017 International Conference on Computing, Communication, Control and Automation (ICCUBEA), Pune, India, 17–18 August 2017; pp. 1–4. [Google Scholar]
- Martini, E.; Fiumalbi, T.; Dell’Agnello, F.; Ivanić, Z.; Munih, M.; Vitiello, N.; Crea, S. Pressure-sensitive insoles for real-time gait-related applications. Sensors 2020, 20, 1448. [Google Scholar] [CrossRef] [PubMed]
- Asmussen, M.J.; Kaltenbach, C.; Hashlamoun, K.; Shen, H.; Federico, S.; Nigg, B.M. Force measurements during running on different instrumented treadmills. J. Biomech. 2019, 84, 263–268. [Google Scholar] [CrossRef] [PubMed]
- Jung, Y.; Jung, M.; Lee, K.; Koo, S. Ground reaction force estimation using an insole-type pressure mat and joint kinematics during walking. J. Biomech. 2014, 47, 2693–2699. [Google Scholar] [CrossRef] [PubMed]
- Fong, D.T.P.; Chan, Y.Y.; Hong, Y.; Yung, P.S.H.; Fung, K.Y.; Chan, K.M. Estimating the complete ground reaction forces with pressure insoles in walking. J. Biomech. 2008, 41, 2597–2601. [Google Scholar] [CrossRef]
- Eguchi, R.; Yorozu, A.; Fukumoto, T.; Takahashi, M. Ground reaction force estimation using insole plantar pressure measurement system from single-leg standing. In Proceedings of the 2016 IEEE International Conference on Multisensor Fusion and Integration for Intelligent Systems (MFI), Baden, Germany, 19–21 September 2016; pp. 109–113. [Google Scholar]
- Peebles, A.T.; Ford, K.R.; Taylor, J.B.; Hart, J.M.; Sands, L.P.; Queen, R.M. Using force sensing insoles to predict kinetic knee symmetry during a stop jump. J. Biomech. 2019, 95, 109293. [Google Scholar] [CrossRef] [PubMed]
- Hamacher, D.; Bertram, D.; Fölsch, C.; Schega, L. Evaluation of a visual feedback system in gait retraining: A pilot study. Gait Posture 2012, 36, 182–186. [Google Scholar] [CrossRef] [PubMed]
- Tahir, A.M.; Chowdhury, M.E.; Khandakar, A.; Al-Hamouz, S.; Abdalla, M.; Awadallah, S.; Reaz, M.B.I.; Al-Emadi, N. A systematic approach to the design and characterization of a smart insole for detecting vertical ground reaction force (vGRF) in gait analysis. Sensors 2020, 20, 957. [Google Scholar] [CrossRef] [PubMed]
- Wang, L.; Jones, D.; Chapman, G.J.; Siddle, H.J.; Russell, D.A.; Alazmani, A.; Culmer, P. A review of wearable sensor systems to monitor plantar loading in the assessment of diabetic foot ulcers. IEEE Trans. Biomed. Eng. 2019, 67, 1989–2004. [Google Scholar] [CrossRef]
- T&T Medilogic Medizintechnik GmbH, Medilogic WLAN Insole, Schonefeld, Germany. Available online: https://medilogic.com/en/medilogic-wlan-insole/ (accessed on 23 June 2022).
- Hsu, W.C.; Sugiarto, T.; Chen, J.W.; Lin, Y.J. The design and application of simplified insole-based prototypes with plantar pressure measurement for fast screening of flat-foot. Sensors 2018, 18, 3617. [Google Scholar] [CrossRef] [PubMed]
- Tiwari, A.; Joshi, D. Template-based insoles for the center of pressure estimation in different foot sizes. IEEE Sens. Lett. 2020, 4, 1–4. [Google Scholar] [CrossRef]
- Guo, R.; Cheng, X.; Hou, Z.C.; Ma, J.Z.; Zheng, W.Q.; Wu, X.M.; Jiang, D.; Pan, Y.; Ren, T.L. A Shoe-Integrated Sensor System for Long-Term Center of Pressure Evaluation. IEEE Sens. J. 2021, 21, 27037–27044. [Google Scholar] [CrossRef]
- Fuchs, P.X.; Hsieh, C.H.; Chen, W.H.; Tang, Y.S.; Fiolo, N.J.; Shiang, T.Y. Sensor number in simplified insole layouts and the validity of ground reaction forces during locomotion. Sport. Biomech. 2022, 1–14. [Google Scholar] [CrossRef] [PubMed]
- Zhu, A.; Li, Y.; Wu, Y.; Wu, M.; Zhang, X. Locomotion mode recognition based on foot posture and ground reaction force. In Proceedings of the 2018 15th International Conference on Ubiquitous Robots (UR), Honolulu, HI, USA, 26–30 June 2018; pp. 125–129. [Google Scholar]
- Sigurdson, H.; Chan, J.H. Machine Learning Applications to Sports Injury: A Review. In Proceedings of the 9th International Conference on Sport Sciences Research and Technology Support (icSPORTS 2021), Valletta, Malta, 28–29 October 2021; pp. 157–168. [Google Scholar]
- Makihara, Y.; Nixon, M.S.; Yagi, Y. Gait recognition: Databases, representations, and applications. Comput. Vis. Ref. Guide 2020. [Google Scholar] [CrossRef]
- Bouchrika, I.; Nixon, M.S. Exploratory factor analysis of gait recognition. In Proceedings of the 2008 8th IEEE International Conference on Automatic Face &Gesture Recognition, Amsterdam The Netherlands, 17–19 September 2008; pp. 1–6. [Google Scholar]
- Telarolli, D.J.A.; Grossi, D.B.; Cervi, A.C.C.; Santiago, P.R.P.; Lemos, T.W.; Resende, R.A. Comparison of Foot Kinematics and Foot Plantar Area and Pressure Among Five Different Closed Kinematic Tasks. J. Am. Podiatr. Med. Assoc. 2020, 110. [Google Scholar] [CrossRef]
- Novak, D.; Reberšek, P.; De Rossi, S.M.M.; Donati, M.; Podobnik, J.; Beravs, T.; Lenzi, T.; Vitiello, N.; Carrozza, M.C.; Munih, M. Automated detection of gait initiation and termination using wearable sensors. Med. Eng. Phys. 2013, 35, 1713–1720. [Google Scholar] [CrossRef]
- Slijepcevic, D.; Horst, F.; Lapuschkin, S.; Horsak, B.; Raberger, A.M.; Kranzl, A.; Samek, W.; Breiteneder, C.; Schöllhorn, W.I.; Zeppelzauer, M. Explaining machine learning models for clinical gait analysis. ACM Trans. Comput. Healthc. (HEALTH) 2021, 3, 1–27. [Google Scholar] [CrossRef]
- Fonseca, S.T.; Souza, T.R.; Verhagen, E.; Van Emmerik, R.; Bittencourt, N.F.; Mendonça, L.D.; Andrade, A.G.; Resende, R.A.; Ocarino, J.M. Sports injury forecasting and complexity: A synergetic approach. Sport. Med. 2020, 50, 1757–1770. [Google Scholar] [CrossRef]
- Potluri, S.; Chandran, A.B.; Diedrich, C.; Schega, L. Machine learning based human gait segmentation with wearable sensor platform. In Proceedings of the 2019 41st Annual International Conference of the IEEE Engineering in Medicine and Biology Society (EMBC), Berlin, Germany, 23–27 July 2019; pp. 588–594. [Google Scholar]
- Palacio-Niño, J.O.; Berzal, F. Evaluation metrics for unsupervised learning algorithms. arXiv 2019, arXiv:1905.05667. [Google Scholar]
- Decker, L.M.; Cignetti, F.; Stergiou, N. Complexity and human gait. Rev. Andal. Med. Deporte 2010, 3, 2–12. [Google Scholar]
- Khera, P.; Kumar, N. Role of machine learning in gait analysis: A review. J. Med. Eng. Technol. 2020, 44, 441–467. [Google Scholar] [CrossRef] [PubMed]
- Sunarya, U.; Sun Hariyani, Y.; Cho, T.; Roh, J.; Hyeong, J.; Sohn, I.; Kim, S.; Park, C. Feature analysis of smart shoe sensors for classification of gait patterns. Sensors 2020, 20, 6253. [Google Scholar] [CrossRef]
- Jasiewicz, B.; Klimiec, E.; Młotek, M.; Guzdek, P.; Duda, S.; Adamczyk, J.; Potaczek, T.; Piekarski, J.; Kołaszczyński, G. Quantitative analysis of foot plantar pressure during walking. Med. Sci. Monit. Int. Med. J. Exp. Clin. Res. 2019, 25, 4916. [Google Scholar] [CrossRef]
- Dai, Y.; Xie, Y.; Chen, J.; Kang, S.; Xu, L.; Gao, S. A lamination-based piezoelectric insole gait analysis system for massive production for Internet-of-health things. Int. J. Distrib. Sens. Netw. 2020, 16, 1550147720905431. [Google Scholar] [CrossRef]
- Klimiec, E.; Jasiewicz, B.; Piekarski, J.; Zaraska, K.; Guzdek, P.; Kołaszczyński, G. Measuring of foot plantar pressure—possible applications in quantitative analysis of human body mobility. Meas. Sci. Technol. 2017, 28, 054008. [Google Scholar] [CrossRef]
- Saidani, S.; Haddad, R.; Mezghani, N.; Bouallegue, R. A survey on smart shoe insole systems. In Proceedings of the 2018 International Conference on Smart Communications and Networking (SmartNets), Yasmine Hammamet, Tunisia, 16–17 November 2018; pp. 1–6. [Google Scholar]
- Pasic, R.; Kuzmanov, I.; Atanasovski, K. ESP-NOW communication protocol with ESP32. J. Univers. Excell. 2021, 6, 53–60. [Google Scholar] [CrossRef]
- Dyer, P.S.; Bamberg, S.J.M. Instrumented insole vs. force plate: A comparison of center of plantar pressure. In Proceedings of the 2011 Annual International Conference of the IEEE Engineering in Medicine and Biology Society, Boston, MA, USA, 30 August–3 September 2011; pp. 6805–6809. [Google Scholar]
- Dzedzickis, A.; Sutinys, E.; Bucinskas, V.; Samukaite-Bubniene, U.; Jakstys, B.; Ramanavicius, A.; Morkvenaite-Vilkonciene, I. Polyethylene-carbon composite (Velostat®) based tactile sensor. Polymers 2020, 12, 2905. [Google Scholar] [CrossRef]
- Athavale, O.N.; Paskaranandavadivel, N.; Angeli, T.R.; Avci, R.; Cheng, L.K. Design of pressure sensor arrays to assess electrode contact pressure during in vivo recordings in the gut. In Proceedings of the 2020 42nd Annual International Conference of the IEEE Engineering in Medicine & Biology Society (EMBC), Montreal, QC, Canada, 20–24 July 2020; pp. 4204–4207. [Google Scholar]
- Lowe, B.; Kong, Y.; Han, J. Development and application of a hand force measurement system. In Proceedings of the Proceedings of the XVIth Triennial Congress of the International Ergonomics Association, Maastricht, The Netherlands, 10–14 July 2006. [Google Scholar]
- Ahmed, T.; Rahman, N.A.; Alam, M.K. Validation and reliability of a prototype orthodontic bracket debonding device equipped with force-sensitive resistor (FSR): A novel method of measuring orthodontic bracket debonding force in vivo. Prog. Orthod. 2019, 20, 26. [Google Scholar] [CrossRef]
- Hopkins, M.; Vaidyanathan, R.; Mcgregor, A.H. Examination of the performance characteristics of velostat as an in-socket pressure sensor. IEEE Sens. J. 2020, 20, 6992–7000. [Google Scholar] [CrossRef]
- Wilson, D.C.; Niosi, C.A.; Zhu, Q.A.; Oxland, T.R.; Wilson, D.R. Accuracy and repeatability of a new method for measuring facet loads in the lumbar spine. J. Biomech. 2006, 39, 348–353. [Google Scholar] [CrossRef] [PubMed]
- Tekscan, Inc. Pressure Mapping, Force Measurement & Tactile Sensors, MA, USA. Available online: https://www.tekscan.com/sites/default/files/FLX-QS-Calibration-RevG.pdf (accessed on 7 September 2022).
- Kang, H. Sample size determination and power analysis using the G* Power software. J. Educ. Eval. Health Prof. 2021, 18. [Google Scholar] [CrossRef] [PubMed]
- Ngueleu, A.M.; Blanchette, A.K.; Bouyer, L.; Maltais, D.; McFadyen, B.J.; Moffet, H.; Batcho, C.S. Design and accuracy of an instrumented insole using pressure sensors for step count. Sensors 2019, 19, 984. [Google Scholar] [CrossRef] [PubMed]
- Gopalakrishna, G.; Mustafa, R.A.; Davenport, C.; Scholten, R.J.; Hyde, C.; Brozek, J.; Schünemann, H.J.; Bossuyt, P.M.; Leeflang, M.M.; Langendam, M.W. Applying Grading of Recommendations Assessment, Development and Evaluation (GRADE) to diagnostic tests was challenging but doable. J. Clin. Epidemiol. 2014, 67, 760–768. [Google Scholar] [CrossRef] [PubMed]
- Bertec Corporation, Instrumented Treadmills, Columbus, OH, USA. Available online: https://www.bertec.com/products/instrumented-treadmills (accessed on 7 September 2022).
- Ferrari, A.; Cutti, A.G.; Cappello, A. A new formulation of the coefficient of multiple correlation to assess the similarity of waveforms measured synchronously by different motion analysis protocols. Gait Posture 2010, 31, 540–542. [Google Scholar] [CrossRef] [PubMed]
- Crea, S.; Donati, M.; De Rossi, S.M.M.; Oddo, C.M.; Vitiello, N. A wireless flexible sensorized insole for gait analysis. Sensors 2014, 14, 1073–1093. [Google Scholar] [CrossRef]
- Kanitthika, K.; Chan, K.S. Pressure sensor positions on insole used for walking analysis. In Proceedings of the The 18th IEEE International Symposium on Consumer Electronics (ISCE 2014), Jeju, Korea, 22–25 June 2014; pp. 1–2. [Google Scholar]
- Fournier, K.A.; Amano, S.; Radonovich, K.J.; Bleser, T.M.; Hass, C.J. Decreased dynamical complexity during quiet stance in children with autism spectrum disorders. Gait Posture 2014, 39, 420–423. [Google Scholar] [CrossRef]
- Al-Amri, M.; Nicholas, K.; Button, K.; Sparkes, V.; Sheeran, L.; Davies, J.L. Inertial measurement units for clinical movement analysis: Reliability and concurrent validity. Sensors 2018, 18, 719. [Google Scholar] [CrossRef]
- Mukaka, M.M. A guide to appropriate use of correlation coefficient in medical research. Malawi Med. J. 2012, 24, 69–71. [Google Scholar] [PubMed]
- Prasanth, H.; Caban, M.; Keller, U.; Courtine, G.; Ijspeert, A.; Vallery, H.; Von Zitzewitz, J. Wearable sensor-based real-time gait detection: A systematic review. Sensors 2021, 21, 2727. [Google Scholar] [CrossRef]
- Mowbray, S.D.; Nixon, M.S. Automatic gait recognition via fourier descriptors of deformable objects. In Proceedings of the International Conference on Audio-and Video-Based Biometric Person Authentication, Guildford, UK, 9–11 June 2003; Springer: Berlin/Heidelberg, Germany, 2003; pp. 566–573. [Google Scholar]
- Wurdeman, S.R.; Huisinga, J.M.; Filipi, M.; Stergiou, N. Multiple sclerosis affects the frequency content in the vertical ground reaction forces during walking. Clin. Biomech. 2011, 26, 207–212. [Google Scholar] [CrossRef] [PubMed]
- Bark, C.; Chaccour, K.; Darazi, R.; El Hassani, A.H.; Andres, E. Design and development of a force-sensing shoe for gait analysis and monitoring. In Proceedings of the 2017 Fourth International Conference on Advances in Biomedical Engineering (ICABME), Beirut, Lebanon, 19–21 October 2017; pp. 1–4. [Google Scholar]
- Cotta, C.; Hemert, J. Evolutionary Computation in Combinatorial Optimization (7 Conf.); Springer: Berlin/Heidelberg, Germany, 2007. [Google Scholar]
- Zgolli, F.; Henni, K.; Haddad, R.; Mitiche, A.; Ouakrim, Y.; Hagemeister, N.; Vendittoli, P.A.; Fuentes, A.; Mezghani, N. Kinematic data clustering for healthy knee gait characterization. In Proceedings of the 2018 IEEE Life Sciences Conference (LSC), Montreal, QC, Canada, 28–30 October 2018; pp. 239–242. [Google Scholar]
- Brownlee, J. Clonal Selection Theory & Clonalg—The Clonal Selection Classification Algorithm (CSCA); Swinburne University of Technology: Melbourne, Australia, 2005; Volume 38. [Google Scholar]
- Farahpour, N.; Jafarnezhad, A.; Damavandi, M.; Bakhtiari, A.; Allard, P. Gait ground reaction force characteristics of low back pain patients with pronated foot and able-bodied individuals with and without foot pronation. J. Biomech. 2016, 49, 1705–1710. [Google Scholar] [CrossRef] [PubMed]
- Resende, R.A.; Pinheiro, L.S.; Ocarino, J.M. Effects of foot pronation on the lower limb sagittal plane biomechanics during gait. Gait Posture 2019, 68, 130–135. [Google Scholar] [CrossRef] [PubMed]
- Collins, J.; Whittle, M. Impulsive forces during walking and their clinical implications. Clin. Biomech. 1989, 4, 179–187. [Google Scholar] [CrossRef]
- Valentina, A.; Gabriella, B.; Marco, K. Segmentation and Classification of Gait Cycles. IEEE Trans. Neural Syst. Rehabil. Eng. 2014, 22, 946–952. [Google Scholar]
- De Rossi, S.M.; Crea, S.; Donati, M.; Reberšek, P.; Novak, D.; Vitiello, N.; Lenzi, T.; Podobnik, J.; Munih, M.; Carrozza, M.C. Gait segmentation using bipedal foot pressure patterns. In Proceedings of the 2012 4th IEEE RAS & EMBS International Conference on Biomedical Robotics and Biomechatronics (BioRob), Rome, Italy, 24–27 June 2012; pp. 361–366. [Google Scholar]
- DeCann, B.; Ross, A.; Culp, M. On clustering human gait patterns. In Proceedings of the 2014 22nd International Conference on Pattern Recognition, Stockholm, Sweden, 24–28 August 2014; pp. 1794–1799. [Google Scholar]
- Cutler, A.; Cutler, D.R.; Stevens, J.R. Random forests. In Ensemble Machine Learning; Springer: Berlin/Heidelberg, Germany, 2012; pp. 157–175. [Google Scholar]
- Perry, J.; Araújo, A.G.N.; de Freitas, C.D.; Schoneberger, B. Análise de Marcha; Marcha: Sistemas de Análise de Marcha—Volume 3; Manole: Barueri, Brazil, 2005; pp. 58–61. [Google Scholar]
- Tajima, T.; Tateuchi, H.; Koyama, Y.; Ikezoe, T.; Ichihashi, N. Gait strategies to reduce the dynamic joint load in the lower limbs during a loading response in young healthy adults. Hum. Mov. Sci. 2018, 58, 260–267. [Google Scholar] [CrossRef]
- Chiu, M.C.; Wu, H.C.; Chang, L.Y.; Wu, M.H. Center of pressure progression characteristics under the plantar region for elderly adults. Gait Posture 2013, 37, 408–412. [Google Scholar] [CrossRef]
- Elhafez, S.M.; Ashour, A.A.; Elhafez, N.M.; Elhafez, G.M.; Abdelmohsen, A.M. Percentage contribution of lower limb moments to vertical ground reaction force in normal gait. J. Chiropr. Med. 2019, 18, 90–96. [Google Scholar] [CrossRef]


| Insoles | Number of Sensors | Freq. (Hz) | Thickness (mm) | Sensor Area (cm) |
|---|---|---|---|---|
| Proposed Insole | 12 | 375 | 2.00 | 8.05 |
| F-Scan [14] | 960 | 750/100 (Wi-fi) | 1.50 | - |
| Dynafoot [15] | 58 | 100 | - | - |
| Medica Flexinfit [39] | 214 | 25–50 | 0.30 | 2.27 |
| Medilogic [16] | 240 | 50–100 | 1.60 | - |
| R. Eguchi [11] | 14 | 80 | - | - |
| Wei-Chun Hsu [17] | 5 | 100 | 0.45 | 1.27 |
| Ivanov [5] | 9 | 25–50 | 0.80 | 0.71 |
| A. Tiwari and D. Joshi [18] | 16 | 88 | 2.50 | - |
| Guo et al. [19] | 8 | 100 | - | 2.62 |
Publisher’s Note: MDPI stays neutral with regard to jurisdictional claims in published maps and institutional affiliations. |
© 2022 by the authors. Licensee MDPI, Basel, Switzerland. This article is an open access article distributed under the terms and conditions of the Creative Commons Attribution (CC BY) license (https://creativecommons.org/licenses/by/4.0/).
Share and Cite
Nascimento, D.H.A.; Magalhães, F.A.; Sabino, G.S.; Resende, R.A.; Duarte, M.L.M.; Vimieiro, C.B.S. Development of a Human Motion Analysis System Based on Sensorized Insoles and Machine Learning Algorithms for Gait Evaluation. Inventions 2022, 7, 98. https://doi.org/10.3390/inventions7040098
Nascimento DHA, Magalhães FA, Sabino GS, Resende RA, Duarte MLM, Vimieiro CBS. Development of a Human Motion Analysis System Based on Sensorized Insoles and Machine Learning Algorithms for Gait Evaluation. Inventions. 2022; 7(4):98. https://doi.org/10.3390/inventions7040098
Chicago/Turabian StyleNascimento, Diego Henrique Antunes, Fabrício Anicio Magalhães, George Schayer Sabino, Renan Alves Resende, Maria Lúcia Machado Duarte, and Claysson Bruno Santos Vimieiro. 2022. "Development of a Human Motion Analysis System Based on Sensorized Insoles and Machine Learning Algorithms for Gait Evaluation" Inventions 7, no. 4: 98. https://doi.org/10.3390/inventions7040098
APA StyleNascimento, D. H. A., Magalhães, F. A., Sabino, G. S., Resende, R. A., Duarte, M. L. M., & Vimieiro, C. B. S. (2022). Development of a Human Motion Analysis System Based on Sensorized Insoles and Machine Learning Algorithms for Gait Evaluation. Inventions, 7(4), 98. https://doi.org/10.3390/inventions7040098